Embed Size (px)
Citation preview
NATIONAL STRATEGY STUDY
FOR IMPLEMENTATION OF
THE CDM IN COLOMBIA
FINAL REPORT
(ENGLISH VERSION)
SANTAFÉ DE BOGOTÁ, AUGUST 2000
PROGRAM OF NATIONAL CDM/JI STRATEGY STUDIESNSS PROGRAM
Acknowledgements
The authors of this study would like to acknowledge the financial and technicalassistance of the World Bank, as well as the Swiss Government and member ofSteering Committee.
Peter Kalas World Bank – NSS Program Walter Vergara World Bank Martin Enderlin Swiss Goverment Anne Arquit Swiss Goverment Elsa Lozano F Colombian Association of Reforesters - ACOFORE Rodrigo Cid Colombian Association of Reforesters - ACOFORE Daniel Vergara Colombian Association of Petroleum Producers– ACP Angela Gómez National Association of Colombian Industries – ANDI Carlos Herrera National Association of Colombian Industries – ANDI María Emilia Correa Sustainable Development National Cauncil– CECODES Ricardo León Márquez National Center of Clean Production Juan Pablo Bonilla FUNDESARROLLO Alexandra Hernández Colombian Insitute of Cement Producers – ICPC Oscar Suarez Colombian Institute of Metheorology, Hidrology and
Envierontal Studies - IDEAM María Teresa Palacios Ministry of Agriculture Nelson Lozano Ministry of Agriculture Eduardo Salas Ministry of Economic Development Felipe Ramos Ministry of Economic Development Hernando Trujillo Ministry of Justice Mauricio Amaya Ministry of Justice Javier Camargo Ministry of the Environment Felipe García Administration Unit of National Natural Park System -
UAESPNN Gilberto Jaimes Planing Unit of Mining and Energy - UPME Marcela Bonilla Ministry of the Environment
iii
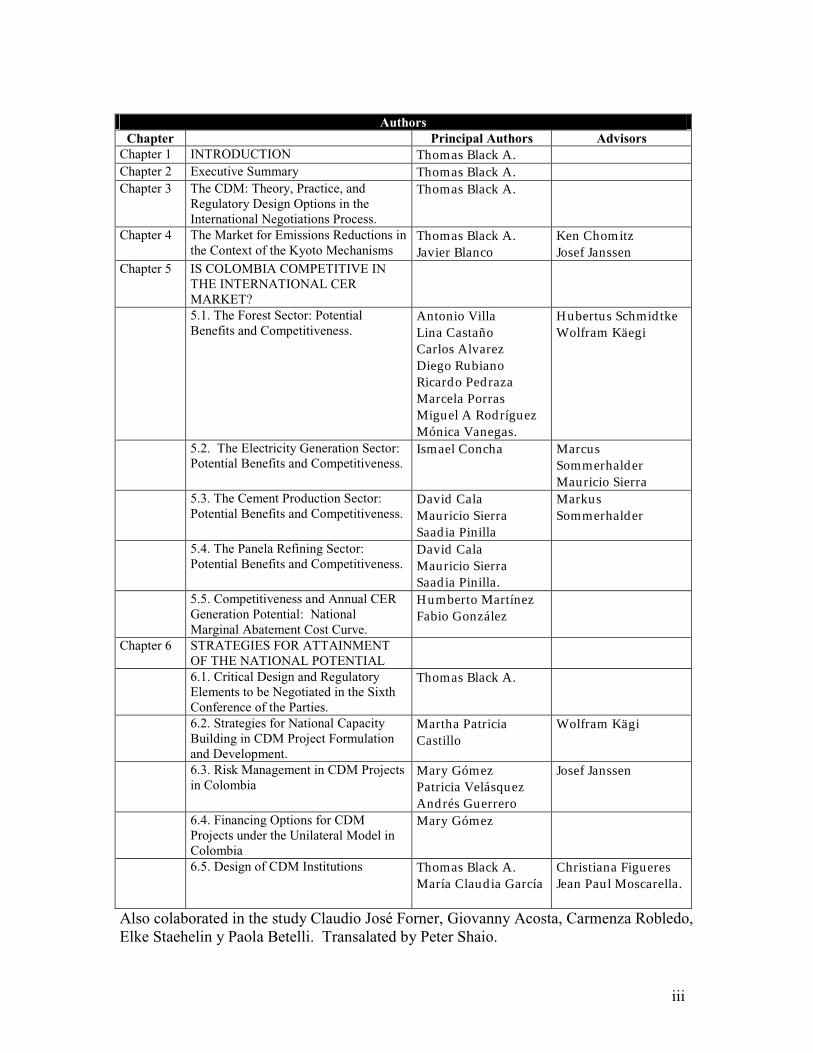
AuthorsChapter Principal Authors AdvisorsChapter 1 INTRODUCTION Thomas Black A.Chapter 2 Executive Summary Thomas Black A.Chapter 3 The CDM: Theory, Practice, and
Regulatory Design Options in theInternational Negotiations Process.
Thomas Black A.
Chapter 4 The Market for Emissions Reductions inthe Context of the Kyoto Mechanisms
Thomas Black A.Javier Blanco
Ken ChomitzJosef Janssen
Chapter 5 IS COLOMBIA COMPETITIVE INTHE INTERNATIONAL CERMARKET?5.1. The Forest Sector: PotentialBenefits and Competitiveness.
Antonio VillaLina CastañoCarlos AlvarezDiego RubianoRicardo PedrazaMarcela PorrasMiguel A RodríguezMónica Vanegas.
Hubertus SchmidtkeWolfram Käegi
5.2. The Electricity Generation Sector:Potential Benefits and Competitiveness.
Ismael Concha MarcusSommerhalderMauricio Sierra
5.3. The Cement Production Sector:Potential Benefits and Competitiveness.
David CalaMauricio SierraSaadia Pinilla
MarkusSommerhalder
5.4. The Panela Refining Sector:Potential Benefits and Competitiveness.
David CalaMauricio SierraSaadia Pinilla.
5.5. Competitiveness and Annual CERGeneration Potential: NationalMarginal Abatement Cost Curve.
Humberto MartínezFabio González
Chapter 6 STRATEGIES FOR ATTAINMENTOF THE NATIONAL POTENTIAL6.1. Critical Design and RegulatoryElements to be Negotiated in the SixthConference of the Parties.
Thomas Black A.
6.2. Strategies for National CapacityBuilding in CDM Project Formulationand Development.
Martha PatriciaCastillo
Wolfram Kägi
6.3. Risk Management in CDM Projectsin Colombia
Mary GómezPatricia VelásquezAndrés Guerrero
Josef Janssen
6.4. Financing Options for CDMProjects under the Unilateral Model inColombia
Mary Gómez
6.5. Design of CDM Institutions Thomas Black A.María Claudia García
Christiana FigueresJean Paul Moscarella.
Also colaborated in the study Claudio José Forner, Giovanny Acosta, Carmenza Robledo,Elke Staehelin y Paola Betelli. Transalated by Peter Shaio.
iv
Contents
1. INTRODUCTION ...............................................................................................................................1
1. EXECUTIVE SUMMARY .................................................................................................................4
1.1. INTRODUCTION ................................................................................................................................41.2. DEVELOPMENT OF THE CER MARKET .............................................................................................41.3. NATIONAL COMPETITIVENESS AND POTENTIAL BENEFITS ...............................................................51.4. STRATEGIC POLICIES TO DEVELOP COLOMBIA’S CDM POTENTIAL...............................................121.5. NEXT STEPS: IMPLEMENTING THE NSS ..........................................................................................18
2. THE CLEAN DEVELOPMENT MECHANISM: THEORY, PRACTICE ANDREGULATORY DESIGN OPTIONS IN THE INTERNATIONAL NEGOTIATION PROCESS ....20
2.1. THEORETICAL CONTEXT OF THE KYOTOMECHANISMS .................................................................202.1.1. Introduction: The Problem of the Cost of Compliance with Environmental Regulation. ..........202.1.2. Tradable Emissions Rights: Theoretical Fundaments ...............................................................212.1.3. Implementing the System ...........................................................................................................222.1.4. The Constant Evolution of the Price of Emissions Rights..........................................................23
2.2. EMPIRICAL EXPERIENCE IN THE USE OFMARKETS FOR TRADABLE EMISSIONS RIGHTS .................252.2.1. Initial Experiments.....................................................................................................................252.2.2. Program for Negotiable Rights for the Control of Acid Rain ....................................................262.2.3. The Program of Jointly Implemented Activities.........................................................................27
2.3. EVOLUTION OF THE CDM OPERATIONSMODEL IN CLIMATE CHANGE NEGOTIATIONS .................292.3.1. Evolution of the Kyoto Mechanisms in the Climate Change Negotiations ................................292.3.2. The CDM will have to Compete Effectively with other Annex B Compliance Options..............302.3.3. Conclusions................................................................................................................................34
3. THE MARKET FOR EMISSIONS REDUCTIONS IN THE CONTEXT OF THE KYOTOMECHANISMS...........................................................................................................................................36
3.1. METHODOLOGY .............................................................................................................................363.2. RESULTS ........................................................................................................................................373.2.1. Principal Market Characteristics ..............................................................................................373.2.2. Review of Hypotheses and Their Market Impact .......................................................................433.2.3. Expected Behavior of the Variables with Greatest Effect on the Market...................................443.2.4. Price Scenarios..........................................................................................................................463.2.5. Present Behavior of the Market .................................................................................................47
3.3. CONCLUSIONS ................................................................................................................................48
4. IS COLOMBIA COMPETITIVE IN THE INTERNATIONAL CER MARKET? ....................50
4.1. THE FOREST SECTOR: POTENTIAL BENEFITS AND COMPETITIVENESS ............................................504.1.1. Methodological Bases................................................................................................................504.1.2. Results........................................................................................................................................554.1.3. Viability of CDM Forest Projects ..............................................................................................614.1.4. The Competitiveness of Agriculture and Forestry in the Potential CER Market......................624.1.5. “Green Coal”: A Comparative Advantage for Colombia .........................................................64
4.2. THE ELECTRICITY GENERATION SECTOR: POTENTIAL BENEFITS AND COMPETITIVENESS .............664.2.1. The Generation Strategies .........................................................................................................664.2.2. GHG Mitigation Alternatives in the Thermo-Electrical Sector .................................................684.2.3. Analysis of the Proposed Reduction Alternatives ......................................................................724.2.4. Conclusiones y Recomendaciones .............................................................................................75
4.3. THE CEMENT PRODUCTION SECTOR: POTENTIAL BENEFITS AND COMPETITIVENESS.....................764.3.1. Introduction ...............................................................................................................................764.3.2. Characteristics of the Cement Industry in Colombia.................................................................76
v
4.3.3. GHG Emissions Associated with Combustion in the Colombian Cement Industry ..................784.3.4. Projection of Cement in Colombia until 2010 ...........................................................................794.3.5. Technology and Installed Capacity in the Cement Sector in Colombia.....................................804.3.6. Base Line of GHG Emissions in the Cement Sector ..................................................................804.3.7. GHG Mitigation Options in the Three Plants Analyzed ............................................................844.3.8. Analysis of Proposed Reduction Alternatives ............................................................................924.3.9. Conclusions and Recommendations ..........................................................................................93
4.4. THE PANELA REFINING SECTOR: POTENTIAL BENEFITS AND COMPETITIVENESS...........................954.4.1. Promoters’ Group for Connecting the Sector with CDM ..........................................................964.4.2. Present Situation of Brown Sugar Production in Colombia ....................................................1004.4.3. Expected Development and Evolution of the Brown Sugar Sector until 2010 .........................1034.4.4. Technology and Installed Capacity in the Brown Sugar Sector ..............................................1044.4.5. GHG Mitigation Options .........................................................................................................1074.4.6. Analysis of the Proposed Reduction Alternatives ....................................................................1144.4.7. Conclusions and Recommendations ........................................................................................117
4.5. COMPETITIVENESS AND ANNUAL CER GENERATION POTENTIAL: NATIONALMARGINAL COSTCURVE.....................................................................................................................................................1194.5.1. Methodology ............................................................................................................................1194.5.2. Results......................................................................................................................................1204.5.3. CER Export as a Way of Compensating the Effect of Reducing on Fossil Fuel Exports.........123
4.6. COMPETITIVENESS AND ANNUAL CER GENERATION POTENTIAL: NATIONALMARGINAL COSTCURVE.....................................................................................................................................................1254.6.1. Methodology ............................................................................................................................1254.6.2. Results......................................................................................................................................1264.6.3. CER Export as a Way of Compensating the Effect of Reducing on Fossil Fuel Exports.........129
5. STRATEGIES FOR ATTAINMENT OF THE NATIONAL POTENTIAL .............................131
5.1. CRITICALDESIGN AND REGULATORY ELEMENTS TO BE NEGOTIATED IN THE SIXTH CONFERENCEOF THE PARTIES.......................................................................................................................................1315.1.1. Ensuring CDM Implementation from January 2000 ...............................................................1325.1.2. Minimizing International Transaction costs, Risks and Barriers ............................................1325.1.3. Managing Base Lines and Additionality..................................................................................1335.1.4. Equal Treatment for the Three Flexibility Mechanisms ..........................................................1345.1.5. The Inclusion of Sinks ..............................................................................................................1345.1.6. The Unilateral Model for Project Formulation Must be Approved to Maximize Participation ofColombian Projects and Those from Other High-Risk Countries .....................................................1355.1.7. Free Trading of CERs in Financial Exchanges and Secondary Markets Should not beRestricted ...........................................................................................................................................1365.1.8. Limits Stemming from Supplementarity Should be Voluntary for Each Annex B Country ......1375.1.9. The Sustainable Development Criterion must be a National Criterion ...................................1375.1.10. Promoting Financial Support for the Creation of a National Capacity ................................138
5.2. STRATEGIES FOR NATIONAL CAPACITY BUILDING IN THE CDM PROJECT FORMULATION ANDDEVELOPMENT........................................................................................................................................1385.2.1. Introduction .............................................................................................................................1385.2.2. Methodology ............................................................................................................................1395.2.3. Strategy for Developing the National Capacity for CDM Project Formulation......................1405.2.4. Requirements for Training and Support to Maximize the Potential Benefits of CDM inColombia ...........................................................................................................................................1415.2.5. Conclusions..............................................................................................................................146
5.3. RISKMANAGEMENT IN CDM PROJECTS IN COLOMBIA................................................................1475.3.1. General and Specific Objectives..............................................................................................1475.3.2. Methodology ............................................................................................................................1485.3.3. Description and Methodology for Drafting the Country Risk Profile......................................1495.3.4. Description and Methodology for Identifying the Project Risk at the Sectoral Level..............1505.3.5. Identification of Mitigation and Coverage Mechanisms..........................................................1515.3.6. Principal Conclusions and Recommendations ........................................................................152
vi
5.4. FINANCINGOPTIONS FOR CDM PROJECTS UNDER OF THE UNILATERALMODEL IN COLOMBIA ..1585.4.1. General Considerations...........................................................................................................1585.4.2. Financial Sources ....................................................................................................................1605.4.3. Conclusions..............................................................................................................................164
5.5. DESIGN OF CDM INSTITUTIONS ...................................................................................................1645.5.1. Rent Seeking.............................................................................................................................1665.5.2. Transaction costs .....................................................................................................................1675.5.3. Institutional Proposal for Managing CDM in Colombia.........................................................171
5.6. CONCLUSIONS AND RECOMMENDATIONS.....................................................................................174
6. NEXT STEPS: ACTION PLAN TO IMPLEMENT CDM IN COLOMBIA.............................177
6.1. OBJECTIVE ...................................................................................................................................1776.2. STRUCTURE OF THE PROGRAM AND COMPONENTS ......................................................................1776.3. GENERAL COSTS ..........................................................................................................................1806.4. COMPONENT 1: STRENGTHENINGNEGOTIATING CAPACITY ........................................................1816.5. COMPONENT 2: STRENGTHENINGNATIONAL CAPACITY FOR DEVELOPING CDM PROJECTS.......1856.6. COMPONENT 3: SUPPORT FOR FINANCING ANDMARKETING THE CDM PROJECTS PORTFOLIO ...1886.7. COMPONENT 4: SUPPORT FOR DEVELOPING AVENTURE CAPITAL FUND FOR FINANCING CDMPROJECTS ................................................................................................................................................1916.8. COMPONENT 5: CREATION AND CONSOLIDATION OF INSTITUTIONAL CAPACITY TOMANAGE CDMIN COLOMBIA ..........................................................................................................................................1936.9. CONSOLIDATING INSTITUTIONAL CAPACITY FORMANAGING CDM IN COLOMBIA .....................195
7. NEXT STEPS: ACTION PLAN TO IMPLEMENT CDM IN COLOMBIA.............................198
7.1. OBJECTIVE ...................................................................................................................................1987.2. STRUCTURE OF THE PROGRAM AND COMPONENTS ......................................................................1987.3. GENERAL COSTS ..........................................................................................................................2017.4. COMPONENT 1: STRENGTHENINGNEGOTIATING CAPACITY ........................................................2027.5. COMPONENT 2: STRENGTHENINGNATIONAL CAPACITY FOR DEVELOPING CDM PROJECTS.......2067.6. COMPONENT 3: SUPPORT FOR FINANCING ANDMARKETING THE CDM PROJECTS PORTFOLIO ...2097.7. COMPONENT 4: SUPPORT FOR DEVELOPING AVENTURE CAPITAL FUND FOR FINANCING CDMPROJECTS ................................................................................................................................................2127.8. COMPONENT 5: CREATION AND CONSOLIDATION OF INSTITUTIONAL CAPACITY TOMANAGE CDMIN COLOMBIA ..........................................................................................................................................2147.9. CONSOLIDATING INSTITUTIONAL CAPACITY FORMANAGING CDM IN COLOMBIA .....................216
8. EXECUTIVE SUMMARIES OF THE PROJECT PORTFOLIO..............................................219
8.1. CONSERVATION OF NATURAL FORESTS UNDER THREAT IN THETINIGUA PARK AND LAMACARENA219
8.2. CONSERVATION AND RESTORATION OF FORESTS IN THEMID ATRATO, IN THE COLOMBIAN PACIFIC220
8.3. MANAGEMENT OF FORESTS, FOREST SYSTEMS, AGRO-FORESTS AND TREE-DRIVEN ENERGY FORECONOMIC, SOCIAL AND ENVIRONMENTALOPTIMIZATION OF LAND USE IN CALAMAR, COLOMBIANAMAZON .................................................................................................................................................2238.4. CONSERVATION, RESTORATION ANDMANAGEMENT OF THE BIOLOGICAL CORRIDOR ‘PURACENATIONAL PARK’ AND ‘CUEVA DE LOS GUACHAROS’NATIONAL PARK, IN SOUTHERN HUILA DEPARTMENT
2248.5. CONTRIBUTION TOMITIGATING CLIMATE CHANGE THROUGH FOREST DEVELOPMENT IN THEREGION OF THE PARAMO DE GUERRERO, BY THE CAR ............................................................................2258.6. ESTABLISHING, RESTORING AND CONSERVING RAINFOREST AND ANDEAN FORESTS TO CAPTUREGG ON THEMESETA DE BUCARAMANGA, CDMB JURISDICTION ..............................................................2278.7. CONVERSION OF LAND USED FOR ON-THE-RANGE CATTLE AND ITINERANT AGRICULTURE TOFORESTS, AGRICULTURE AND FOREST, AND FOREST AND PASTURE SYSTEMS FOR RURAL PRODUCTIONAND POWER GENERATION IN PUERTO CARREÑO, COLOMBIAN ORINOCO...............................................2298.8. RECOVERY AND INTEGRATEDMANAGEMENT OF ECOSYSTEMS TO CONSERVE BIODIVERSITY ANDIMPLEMENT THE CLEAN DEVELOPMENTMECHANISM IN URABA............................................................230

vii
8.9. CONSERVATION AND EXPANSION OF FOREST COVERING TO REGULATEWATER RESOURCES ANDMANAGE GG EMISSIONS AS A SUSTAINABLE DEVELOPMENT OPTION IN QUINDIO DEPARTMENT..........2328.10. ECONOMIC AND SOCIALDEVELOPMENT OF RURAL COMMUNITIES IN COLOMBIA’S CARIBBEANPLAIN BASED ON.....................................................................................................................................2328.10. THE SUSTAINABLEMANAGEMENT OF NATURAL FORESTS AND FOREST PLANTATIONS ...........2338.11. WIND ENERGY DEVELOPMENT IN UPPER GUAJIRA ..................................................................234
2. BIBLIOGRAPHY............................................................................................................................237
viii
Table Index
Market Survey of International CDM Experts.................................................................... 4Impacts on fossil fuels exports and potential revenues from CDM.................................. 11Criteria for Capacity Building by Sector .......................................................................... 14Permits for greenhouse Gases Emissions ......................................................................... 37Emissions Projection for 2012.......................................................................................... 38Maximum Demand Potential ............................................................................................ 38Autarkic Costs (Marginal Reductions Cost)* ................................................................... 40Emissions Reductions Market........................................................................................... 40Grouping of the levels of variables that affect the market’s Operation............................ 46Typical Matrix Used to Estimate Trends to 25 Years in Land Use for the Base Line and
the With-Project Situation both in Project Area and Area of Influence ................... 52Projects of the Preliminary Portfolio ................................................................................ 55Land Use and Social Products of Three Agricultural and Livestock Activities in
Colombia................................................................................................................... 57The Dimension of Erosion in Colombia ........................................................................... 57Technology Transfer in the Colombian Portfolio’s Forest Projects. ................................ 61Summary of Benefits and Weaknesses of the Alternatives .............................................. 85Values of the Fuel and Electrical Power Data .................................................................. 86Percentage of Clinker and Type of Addition .................................................................... 86Type of Addition and Energy Decrease Percentage ......................................................... 87Alternatives Analyzed in a GDP Growth Scenario of 4.2%............................................. 92Functions of the Promotion and Control Group ............................................................... 97Types of Fuels Used in Concentrating the Juices ........................................................... 105Values of Fuel and Electricity......................................................................................... 110Summary, Improved Stove as a Reduction Scenario...................................................... 115Alternative Reduction: Steam System ............................................................................ 115Comparative Analysis of Reduction Alternatives........................................................... 116Impacts on Fossil Fuels Exports and Potential Income from CDM ............................... 124Impacts on Fossil Fuels Exports and Potential Income from CDM ............................... 130Seminars and Workshops................................................................................................ 140Bases for a National Training Program .......................................................................... 142Risk Management and Mitigation Scenarios .................................................................. 153Principal Lines of credit for CDM Projects .................................................................... 160Information on Venture Capital Funds in Latin America............................................... 162Potential Risks, Barriers and Transaction costs in the Kyoto Mechanisms.................... 169Objectives, Activities and Results Expected from Component 1 ................................... 184Objectives, Activities and Results of Component 2 ....................................................... 186Objectives, Activities and Results of Component 3 (US Dollars).................................. 189Objectives, Activities and Estimated Costs of Component 4 (US Dollars).................... 192Objectives, Activities and Estimated Costs and Results of Component 5 (US Dollars) 194Objectives, Activities, Expected Results (US Dollar) .................................................... 196Objectives, Activities and Results Expected from Component 1 ................................... 205Objectives, Activities and Results of Component 2 ....................................................... 207Objectives, Activities and Results of Component 3 (US Dollars).................................. 210
ix
Objectives, Activities and Estimated Costs of Component 4 (US Dollars).................... 213Objectives, Activities and Estimated Costs and Results of Component 5 (US Dollars) 215Objectives, Activities, Expected Results (US Dollar) .................................................... 217
Graph Index
Graph 1. Marginal Costs of CO2 Capture in 10 Large Forestry Projects........................... 7Graph 2. Marginal Costs of CO2 Abatement in the National Energy Generation Grid ..... 8Graph 3. Estimation of Annual Aggregated GHG Mitigation Potential........................... 10Graph 4. Gross Potential of Annual CER Exports from Colombia (excluding oil). ........ 10Graph 5. Impact of Transaction Costs and Rent Seeking on Net Income to CDM Projects
................................................................................................................................... 18Graph 6. Market Structure, the Price of Rights and the Costs for Five Reductions Options
in a Company ............................................................................................................ 23Graph 7. Increment in the Price of Rights Resulting from a Significant Rise in Demand
under Inelastic Supply............................................................................................... 24Graph 8. Price Reduction Resulting from Low Demand and High Supply of Rights in the
Market ....................................................................................................................... 24Graph 9. Demand for Carbon Credits ............................................................................... 41Graph 10. Supply of CERs in the International Market.................................................... 42Graph 11. Entrance into Force of the Kyoto Protocol (Year and Probability). ................ 45Graph 12. Expectations Regarding Forest Projects .......................................................... 45Graph 13. Average Income from Different Rural Activities ............................................ 59Graph 14. Marginal Cost Curve for Reduction in the Forest Sector per Project .............. 63Graph 15. Base Line CO2 Emissions and Generation Cost per Option ........................... 67Graph 16. Comparison of Emissions and Generating Cost. Case 11................................ 70Graph 17. Marginal Costs Curve: Thermo-electrical Sector. ........................................... 73Graph 18. Relation between Installed Capacity and Grey Cement Production in Colombia
................................................................................................................................... 76Graph 19. Historical Grey Cement Consumption in Colombia........................................ 77Graph 20. Percentage of Fuel Required per Kg. of Clinker. Wet and Dry Processes ..... 78Graph 21. Fuel Types Used in the Cement Industry......................................................... 78Graph 22. GHG Emissions Associated with the Production Process in the Cement
Industry ..................................................................................................................... 79Graph 23. Cement Production in Colombia up to 2010.................................................... 79Graph 24. Technological Evolution in the Colombian Cement Sector ............................ 80Graph 25. Global CO2 Emissions by the Colombian Cement Industry ........................... 80Graph 26. Base Line (Scenarios 1, 2, 3 and 4) for Plant 1................................................ 83Graph 27. Base Line for Plant 2........................................................................................ 83Graph 28. Graph 23. Base Line for Plant 3...................................................................... 84Graph 29. CO2 Reductions with the Use of Additions: A Comparison of Different
Demand Growth Scenarios ....................................................................................... 87Graph 30. Base Line and Reduction Alternative by the Use of Addititives (GDP growth
at 4.2%) ..................................................................................................................... 88
x
Graph 31. Reconversion from Wet System to Semi-dry System, Supposing a DemandGrowth of 4.2%......................................................................................................... 89
Graph 32. Reconversion from Wet to Dry Process with Expected 4.2% Demand Growth................................................................................................................................... 90
Graph 33. Plant 3. Reconversion of Dry Process to Dry Process with Pre-calcinator andComparison of Different Demand Growth Scenarios (GDP Growing at 0%, 2%,4.2% and 5%)............................................................................................................ 91
Graph 34. Change in Fuel from Coal to Natural Gas in Plant 1. ...................................... 92Graph 35. Marginal Cost Curve for Reduction in the Cement Sector 4.2% Growth
Scenario..................................................................................................................... 93Graph 36. Historical Production of Brown Sugar in Colombia (1990–1998) ................ 101Graph 37. Energy Evaluation of the Panela Stove ......................................................... 101Graph 38. Historical Consumption of Firewood as a Fuel in the Production of Brown
Sugar in Colombia .................................................................................................. 102Graph 39. CO2 Emitted by Burning Firewood in Brown Sugar Production in Colombia
(1990 – 1998).......................................................................................................... 103Graph 40. Estimated Production of Brown Sugar in Colombia in the Next 10 Years ... 104Graph 41. Base line-CO2 Emissions in the Next 10 Years for Cundinamarca, Antioquia,
Nariño and Boyaca-Santander ................................................................................ 107Graph 42. Base Line for a Traditional Sugar Mill and the Reduction Alternative......... 112Graph 43. Marginal Cost Curves for the Reduction Alternatives in the 50% Scenario,
Substituting New for Traditional Stoves, in each of the Five Departments. .......... 115Graph 44. Cost Curve for Reducing GHGs Emissions – Colombian Case – Until 2010121Graph 45. Potential for Generating Foreign Exchange with Certificates for Emissions
Reduction (CERs) ................................................................................................... 122Graph 46. Cost Curve for Reducing GHGs Emissions – Colombian Case – Until 2010127Graph 47. Potential for Generating Foreign Exchange with Certificates for Emissions
Reduction (CERs) ................................................................................................... 128Graph 48. With and Without Project Scenarios in the Forest Sector.............................. 145Graph 49. With and Without-Project Scenario in the Industrial and Energy Sectors..... 145Graph 50. Effects of Transaction costs and Rent-Seeking Behavior on Net Income from
CDM ....................................................................................................................... 165
Figure Index
Figure 1. Dispatch System ................................................................................................ 69Figure 2. Delimitation of the Frontiers for Implementing the Reduction Alternatives .... 84Figure 3. Basic Diagram of the Dry Process of Production of Cement............................ 89Figure 4. Distribution of Basic Equipment in the Brown Sugar Production Process ..... 104Figure 5. Traditional Combustion Stove Used in Brown Sugar Production................... 105Figure 6. Parallel Flow Stove.......................................................................................... 105Figure 7. Delimitation of Emission Frontiers in Brown Sugar Production .................... 108Figure 8. Panela Production Optimization Alternative.................................................. 109Figure 9. Grille in Pig Iron.............................................................................................. 109Figure 10. Recipients Used in Panela Production .......................................................... 110Figure 11. Production Process for Brown Sugar with Steam System............................. 114
xi
Figure 12. Risk Components for a CDM Program in Colombia .................................... 148Figure 13. Project Risk Components by Stages.............................................................. 150Figure 14. Operation of Securitization............................................................................ 163Figure 15. Setup of the GHG Mitigation Foundation in Colombia ................................ 171Figure 16. Timetable by Components............................................................................. 180Figure 17. Timetable by Components............................................................................. 201
1
1. IntroductionAs a response to global warming, the Climate Change Convention and the Kyoto Protocolestablished the bases of a market for emissions reductions of Greenhouse Gases (GG). Theycreated the Clean Development Mechanism (CDM) to reduce the cost of compliance with thegoals for emissions reductions assumed by Annex B countries (industrialized countries) andpromote sustainable development in developing countries. Because the effect of a reduction ofGG on the climate is the same whether it is effected in Bogota or London, CDM permits large-scale emitters in Annex B to invest a part of their compliance resources in cost-effectiveprojects in developing countries. Experts and multilateral entities committed to this topicestimate that CDM has the potential top generate investment in developing countries of 7.5Bannually, if the Parties ratify the Protocol.
Given the potential represented by CDM for developing countries, this document has threeobjectives: First, to evaluate Colombia’s potential in the new market regarding potentialbenefits and competitiveness. Second, to identify restrictions that could limit the developmentof this potential and, third, to develop strategic lines to overcome these restrictions andmaximize CDM’s potential benefits for the country.
The study has been organized to operate as a training document for sectors and institutionsinterested in developing CDM’s potential. These include, among others, industry executives,communities, domestic and international investors, environmental experts and legislators. Afterreading the study, the interested professional should understand the market dynamics forCertificates for Emissions reduction (CERs), the basics of developing a project for reducing orcapturing emissions and the requisite institutional framework to make this new exportopportunity operate with efficiency and effectiveness. The document contains clear indicationson the country’s sectors and types of projects having the potential to compete in internationalmarkets and clarity regarding the management of the associated risks, and pointers on lining upfinancial resources.
Colombia is endowed with great potential in the CDM market. In optimal conditions ofinformation, risks, and with perfect institutions in the domestic and international spheres, theColombian economy could reduce competitively up to 22.9M t of CO2 yearly, generatingforeign exchange comparable to that produced by bananas and flowers. Internationalinvestment could transfer modern technology for cleaner production and the critical know howto increase productivity and quality in the sectors involved.
In optimal conditions, the collateral benefits could be as important as the direct ones, both inagro-forestry and in energy. If net income accruing to the producer of a CER is high enough,the CO2 capture in forest, mixed agriculture and forest and forest and pasture programs couldincrease producers’ incomes to levels competitive with the present model of on-the-range cattleoperations, unsustainable exploitation of natural forests and drug crops. The sale of CERs forthe capture of CO2 through natural regeneration and reforestation in river basins—nowdeforested—could co-finance the restoration of water sources and conserve them in the longrun, equally controlling critical processes of erosion. This would have a positive impact on
2
preserving biodiversity and the Andean and Tropical ecosystems, at present dramaticallythreatened, offering us the possibility of protecting and studying the genetic resources that willbe so important for the Planet’s future.
Society could also receive collateral benefits from converting industry and energy production tocleaner technology, to reduce CO2. Reconverting industrial boilers and generators will reduceparticulate emissions, sulfur dioxide, and nitrogen oxides, at present the causes of severpollution, smog and public health problems in Colombian cities. Similar effects might beexpected from reconverting transportation to natural gas or “green diesel”, with added benefitsstemming from less congestion and noise.
Even so, there are factors—international and domestic—severely restricting the country’scapacity to achieve it potential in the Clean Development Mechanism’s market. Like otherdeveloping countries, Colombia is subject to a variety of factors limiting the execution of agreat part of its CDM potential. Only to the extent that developing countries can dealeffectively with these restrictions, will they be able to begin exporting significant values ofCERs and enjoy the collateral benefits.
On the international scene, several factors will affect Colombia’s model and level ofparticipation. Negotiations at the next Conference of the Parties (COP) of the CCC willestablish CDM design and modus operandi, and certain proposals on the table might severelyaffect developing countries’ potential, especially Colombia’s. For example:• Countries like Germany and China have manifested their position about excluding sinksfrom CDM
• The EU proposes imposing “supplementarity”, a severe limit to the use of CDM comparedto other compliance options.
• India and China insist on a rigid bilateral investment model, where Colombia would besubject to Annex B countries choosing it as a foreign investment. This imposes high costson projects for searching, negotiation, contracts and administration. Given the perceivedrisk of investing in Colombia, this bilateral model would place the country at a cleardisadvantage.
These international proposals could be devastating for CDM in Colombia. Besides, it ispossible that large international bureaucracies will be created, with high transactions andapproval costs for projects and other appropriations of the value of CDM transactions byinternational institutions that the COP is about to create. These factors could significantlyreduce net income to the country’s project formulators, reducing the economic incentivenotably, and the number and profitability of CDM projects in the country, and finally potentialincome for the country’s rural and industrial producers. These design distortions and rent-seeking impulses must be restrained during international negotiations, to maximize thecountry’s potential benefits.
The decision on where to invest emissions reduction resources is a matter for Annex B emittersto decide on an individual basis. Besides CDM, they will have several options: to reduce intheir own plants, comply through domestic options, purchase emissions rights from Annex B
3
countries through Emissions Rights Trading (ERT) or invest in Joint Implementation (JI)projects in Annex B.
On the domestic scene, several factors exist which could restrict CDM development and theenjoyment of potential benefits, including:
Risks: The risks of investing in Colombia are perceived to be high: because it is a marketdependant on mid and long-term foreign investment, international perception on the risk ofworking and investing in Colombia places the country at a clear disadvantage compared todozens of countries like Costa Rica, Chile and Brazil, that compete for the same resources.
Information: Scarcity of information on the CDM program, the market and the rules forformulating projects: most communities, companies and farmers that could benefit from CDMare not knowledgeable about its mode of operation. The formulators cannot design projects ornegotiate with investors without knowing the market dynamics, especially the expected saleprices of CERs in the future.
Financing: Lack of funds for feasibility studies, project formulation and the execution ofprojects proper.
Institutional factors: Similar programs in some foreign countries have shown that officialorganisms have imposed high transaction, approval and contracting costs. These costs dodiminish even more the net revenue to the CDM rural or industrial investor; they also imposeadditional conditions to potential foreign investors. On the other hand, Colombia will not beallowed to benefit from the CDM if the National Congress does not approve the ratification ofthe protocol. Moreover, Colombia needs the implementation and operation of a CDM office forapproval and fomentation of CDM projects, which can work efficiently, transparently andactively in the process.
4
1. Executive Summary
1.1.Introduction
1.2.Development of the CER MarketChapter IV reviews the current state of the market for Certificates of Emission Reduction,reflecting the uncertainties, the structure of demand and supply, and expectations regarding itsfuture development. The negotiation of efficient regulations for operation of the Kyotomechanisms could consolidate a robust market for emission reduction credits. The studyevaluated various models that have been used to simulate market potential, with particularinterest in their price projection methodology.
The major sources of potential demand for emission rights are the United States, WesternEurope and Japan. Effective demand will depend on each Annex B country’s ability to regulateinternal measures to control GHG emissions and each country’s inclusion of the CDM as acompliance alternative. Major sources of potential supply are China, India and the SovietUnion. Potentially, these nations could supply up to 80% of market demand; however, effectivesupply will probably be much less due to CDM’s complexity, transactions costs, informationproblems and institutional constraints in those countries.
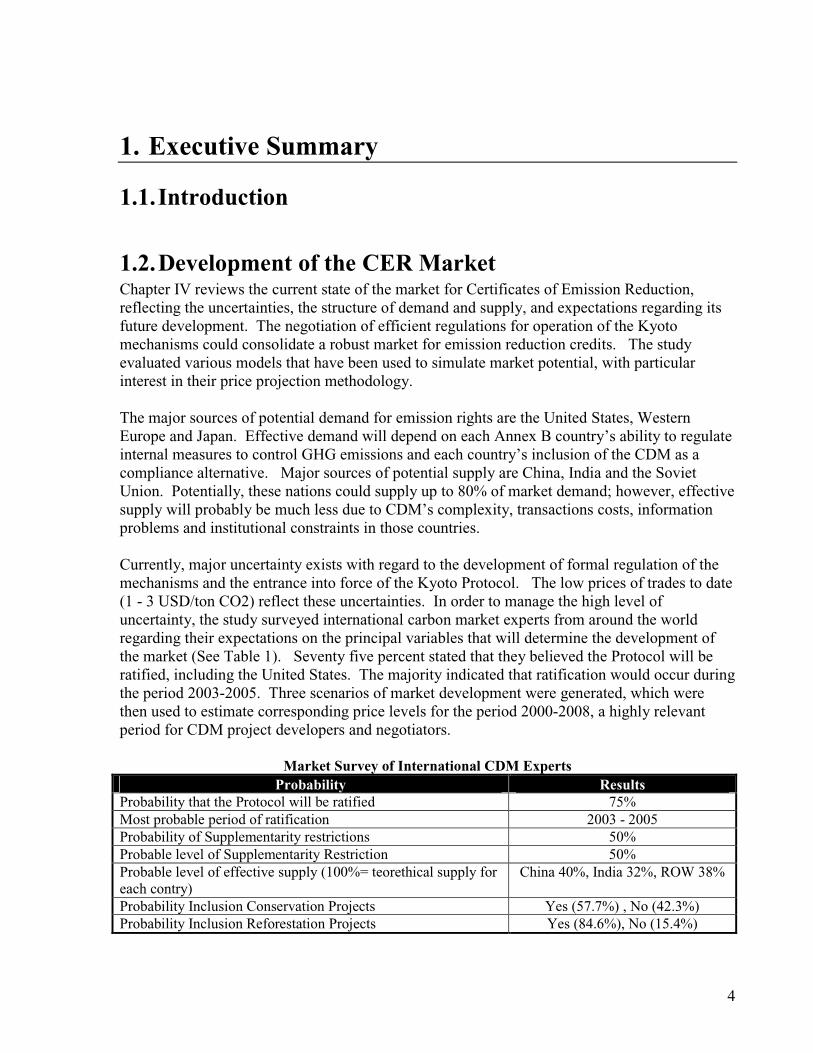
Currently, major uncertainty exists with regard to the development of formal regulation of themechanisms and the entrance into force of the Kyoto Protocol. The low prices of trades to date(1 - 3 USD/ton CO2) reflect these uncertainties. In order to manage the high level ofuncertainty, the study surveyed international carbon market experts from around the worldregarding their expectations on the principal variables that will determine the development ofthe market (See Table 1). Seventy five percent stated that they believed the Protocol will beratified, including the United States. The majority indicated that ratification would occur duringthe period 2003-2005. Three scenarios of market development were generated, which werethen used to estimate corresponding price levels for the period 2000-2008, a highly relevantperiod for CDM project developers and negotiators.
Market Survey of International CDM ExpertsProbability Results
Probability that the Protocol will be ratified 75%Most probable period of ratification 2003 - 2005Probability of Supplementarity restrictions 50%Probable level of Supplementarity Restriction 50%Probable level of effective supply (100%= teorethical supply foreach contry)
China 40%, India 32%, ROW 38%
Probability Inclusion Conservation Projects Yes (57.7%) , No (42.3%)Probability Inclusion Reforestation Projects Yes (84.6%), No (15.4%)
5
The modeling results generate an upper bound of CER price of $19 USD/Ton CO2, $9.8/TonCO2 for the most probable scenario and $3/Ton CO2 for the weak market scenario. This rangeof prices was used throughout the study to evaluate the competitiveness of Colombia’s economyin the generation of Certificates of Emission Reduction.
The analysis indicates that the market could develop even without ratification of the KyotoProtocol, given recent developments. Major multinational energy firms such as BritishPetroleum and Shell Oil have implemented internal emissions reductions programs. In Japan,Tokyo Electric Power Company has begun investing in overseas forestry projects to offset itsemissions from burning of coal. In London, Aurthur Andersen has formed a new fund to investin emissions trading. In Australia, the Sydney Carbon Exchange was recently established tosupport market development, which includes forestry projects. The World Bank PrototypeCarbon Fund will invest US$150 million in CDM projects in Asia, Eastern Europe, LatinAmerica and Africa.
Similarly, several industrialized nations are preparing implementation of domestic regulatoryprograms to reduce greenhouse gas emissions. The European Union aims to implement aregional emissions trading program by 2005. England, Australia, France, Denmark,Switzerland and Norway have either imposed or are preparing to impose pollution charges ordomestic emissions trading programs to control CO2 emissions. The US government ispreparing a national program of renewable energy with similar objectives.
1.3.National Competitiveness and Potential BenefitsChapter V estimates potential benefits from Colombia’s participation in the CDM and evaluatesthe competitiveness of the economy with respect to the emerging new market. Four sectors areevaluated: cement production, electricity generation, panela (raw sugar) processing and forestry.In addition, 28 promising project types throughout the economy are evaluated.
The analysis evaluates the abatement options in each sector, estimating the cost per ton CO2reduced and potential tonnage reductions for each option1. Marginal abatement cost curveswere produced for each sector and aggregated with promising project types to produce an initialmarginal abatement cost curve for the national economy. Finally, the cost curves werejuxtaposed onto the relevant range of CER market prices developed in the market study toestimate the level of competitiveness by project type, economic sector and for the economy ingeneral.
The Forestry Sector.To undertake the analysis of the forestry sector, the study developed 10 CDM projects indiffering conditions and regions of the country encompassing 632 thousand hectares. Fieldmeasurements indicate an excellent capacity for CO2 sequestration at competitive costs. Highlevels of social and environmental benefits were identified in the course of project development,including an increase in the average income per hectare that could provide viable alternatives to
1 Although many analyses use Carbon, we use CO2 because it is the unit required by UNFCCC for reporting. Topromote clarity, our abatement cost graphics include both Carbon and CO2 axes.

6
the current unsustainable activities of illicit crop production, extensive cattle ranching anddestructive exploitation of the natural forest. The study concludes that a functioning CERmarket with prices at or above $9.80 per ton reduced could make a significant contribution tothe peace process through greater employment, incomes and related benefits. However, thiswould require a massive capacity building program to cover major rural areas and target groups.
Projects must be carefully formulated with local social and economic groups in order to developprojects that control leakage, ensure additionality, provide permanent CO2 storage, andgenerate high levels of social and environmental benefits. The formulation methodologies andtheir results satisfactorily address many of the uncertainties related to sinks in the CDMcurrently being debated at the international level. The chapter identifies each of the elementscurrently under debate and provides empirical responses to each from the 10 projectsformulated in Colombia.
The focus on maximization of social and environmental benefits in project formulation wouldsupport improved livelihoods of rural workers and a more environmentally sustainable model ofproduction. Results indicate that positive leakage may be more probable than negative leakage,given the enthusiastic embrace of the CDM opportunity by the groups associated with projectdesign and development. Of great importance, the increase in the average wages supported bythe projects exceeds the stated salary needs of rural workers. The project-specific cash flowanalyses indicate that wages begin to increase gradually over time and attain levels four to fivetimes greater than current minimum wages, due to the multifunctional nature of the projects, theadded income from CO2 capture, and the sustainable uses of the local natural resources base.
The multiple-use focus of the projects offers a better probability of sustainable and productiveuse of the land than projects that only focus on one element of the CDM (conservation orreforestation alone), because of the ability to optimize among the elements of cost, income, andcollateral benefits for the social groups involved.
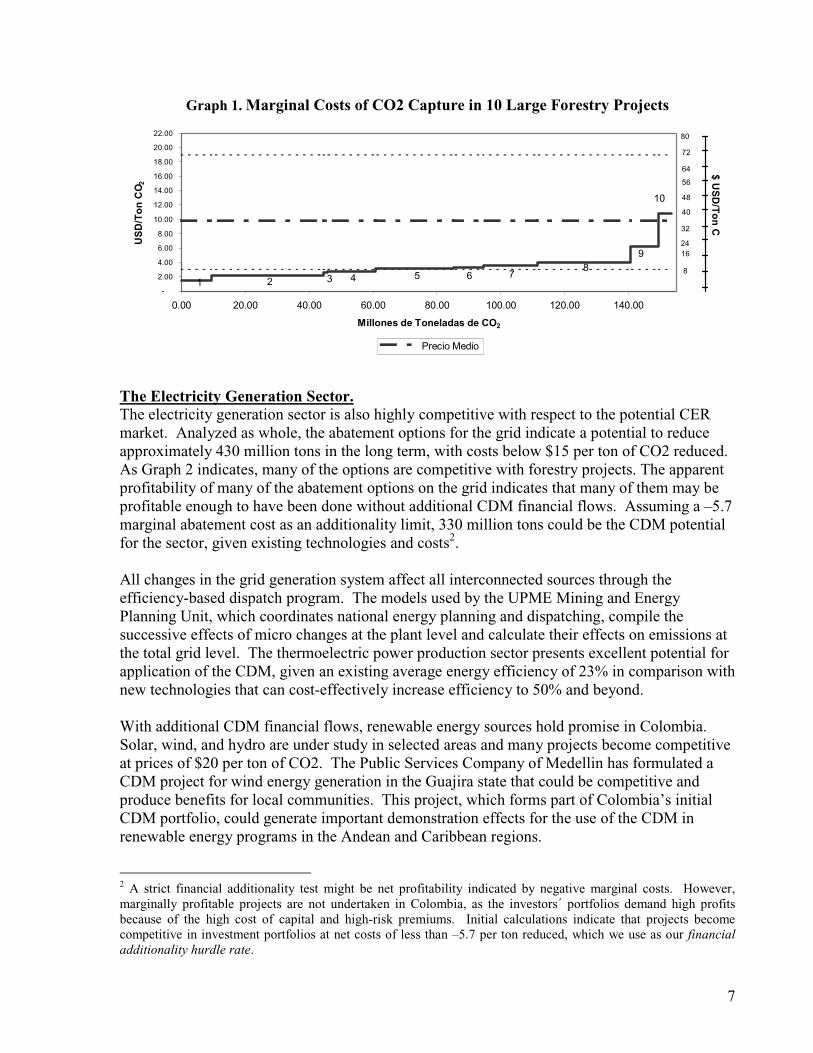
The economic analysis of the forestry projects (Graph 1) demonstrates that the generation ofCERs to offer Green Coal is an economically efficient option for Colombia’s exporters of low-sulfur coal. 90% of the projects generate CERs at a low cost per ton. Geographically,Colombia is closer to North American energy markets than other major competitors that couldoffer green coal, allowing lower transport costs. Because local coal producers already managelocal project risks, operate effectively in existing institutional frameworks and have access tofinance sources, they could efficiently diversify into tropical forestry production to generate theCERs for bundling with their coal exports. Colombia’s exporters could ameliorate the impactof the Kyoto Protocol on their exports in this fashion while contributing important social andenvironmental benefits to rural communities in their regions.
7
Graph 1. Marginal Costs of CO2 Capture in 10 Large Forestry Projects
-
2.00
4.00
6.00
8.00
10.00
12.00
14.00
16.00
18.00
20.00
22.00
0.00 20.00 40.00 60.00 80.00 100.00 120.00 140.00
Millones de Toneladas de CO2
USD/TonCO2
Precio Medio
1 2 3 4 5 6 78
9
10
$USD/TonC32
40
48
56
64
72
16
8
24
80
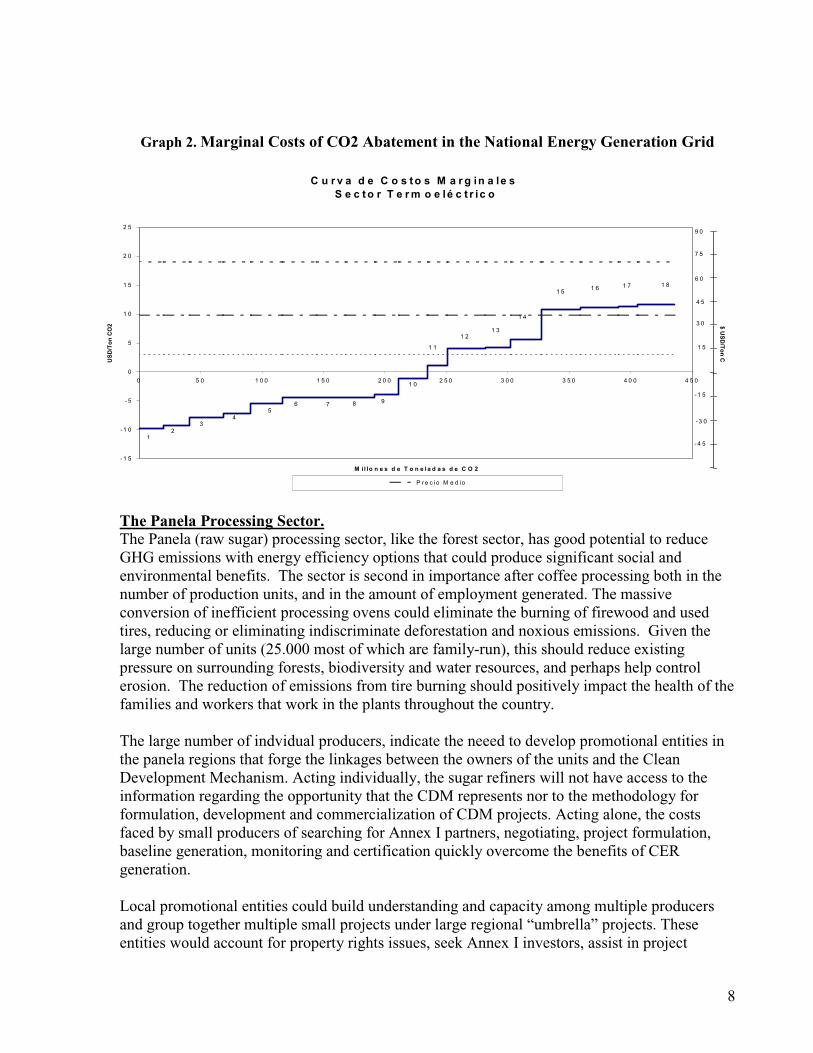
The Electricity Generation Sector.The electricity generation sector is also highly competitive with respect to the potential CERmarket. Analyzed as whole, the abatement options for the grid indicate a potential to reduceapproximately 430 million tons in the long term, with costs below $15 per ton of CO2 reduced.As Graph 2 indicates, many of the options are competitive with forestry projects. The apparentprofitability of many of the abatement options on the grid indicates that many of them may beprofitable enough to have been done without additional CDM financial flows. Assuming a –5.7marginal abatement cost as an additionality limit, 330 million tons could be the CDM potentialfor the sector, given existing technologies and costs2.
All changes in the grid generation system affect all interconnected sources through theefficiency-based dispatch program. The models used by the UPME Mining and EnergyPlanning Unit, which coordinates national energy planning and dispatching, compile thesuccessive effects of micro changes at the plant level and calculate their effects on emissions atthe total grid level. The thermoelectric power production sector presents excellent potential forapplication of the CDM, given an existing average energy efficiency of 23% in comparison withnew technologies that can cost-effectively increase efficiency to 50% and beyond.
With additional CDM financial flows, renewable energy sources hold promise in Colombia.Solar, wind, and hydro are under study in selected areas and many projects become competitiveat prices of $20 per ton of CO2. The Public Services Company of Medellin has formulated aCDM project for wind energy generation in the Guajira state that could be competitive andproduce benefits for local communities. This project, which forms part of Colombia’s initialCDM portfolio, could generate important demonstration effects for the use of the CDM inrenewable energy programs in the Andean and Caribbean regions.
2 A strict financial additionality test might be net profitability indicated by negative marginal costs. However,marginally profitable projects are not undertaken in Colombia, as the investors´ portfolios demand high profitsbecause of the high cost of capital and high-risk premiums. Initial calculations indicate that projects becomecompetitive in investment portfolios at net costs of less than –5.7 per ton reduced, which we use as our financialadditionality hurdle rate.
8
Graph 2. Marginal Costs of CO2 Abatement in the National Energy Generation Grid
The Panela Processing Sector.The Panela (raw sugar) processing sector, like the forest sector, has good potential to reduceGHG emissions with energy efficiency options that could produce significant social andenvironmental benefits. The sector is second in importance after coffee processing both in thenumber of production units, and in the amount of employment generated. The massiveconversion of inefficient processing ovens could eliminate the burning of firewood and usedtires, reducing or eliminating indiscriminate deforestation and noxious emissions. Given thelarge number of units (25.000 most of which are family-run), this should reduce existingpressure on surrounding forests, biodiversity and water resources, and perhaps help controlerosion. The reduction of emissions from tire burning should positively impact the health of thefamilies and workers that work in the plants throughout the country.
The large number of indvidual producers, indicate the neeed to develop promotional entities inthe panela regions that forge the linkages between the owners of the units and the CleanDevelopment Mechanism. Acting individually, the sugar refiners will not have access to theinformation regarding the opportunity that the CDM represents nor to the methodology forformulation, development and commercialization of CDM projects. Acting alone, the costsfaced by small producers of searching for Annex I partners, negotiating, project formulation,baseline generation, monitoring and certification quickly overcome the benefits of CERgeneration.
Local promotional entities could build understanding and capacity among multiple producersand group together multiple small projects under large regional “umbrella” projects. Theseentities would account for property rights issues, seek Annex I investors, assist in project
C u r v a d e C o s to s M a rg in a le sS e c to r T e rm o e lé c t r ic o
- 1 5
- 1 0
- 5
0
5
1 0
1 5
2 0
2 5
0 5 0 1 0 0 1 5 0 2 0 0 2 5 0 3 0 0 3 5 0 4 0 0 4 5 0
M il lo n e s d e T o n e l a d a s d e C O 2
USD/TonCO2
P re c io M e d io
12
34
56 7 8 9
1 0
1 1
1 21 3
1 4
1 51 6
1 5
3 0
4 5
6 0
7 5
9 0
-1 5
-3 0
- 4 5
$USD/TonC
1 7 1 8
9
formulation, carry out an accounting of projects undertaken successfully, and transfer the CERsappropriately among producers and investors. Helping to assure quality and additionality of thelarge umbrella projects, these entities would also manage complex national and internationalapproval processes, search for Annex B investors, and coordinate the execution and monitoringof the projects. This organizational model was developed in detail working with the PanelaProducers Association, and could be adapted to other sectors such as forestry and transport,which present similar conditions and transactions costs.
The Cement Production Sector.Case studies in three large plants were used to analyze options in the Cement sector. Incomparison with the other 3 sectors analyzed, abatement costs are relatively high relative to theestimated CER price range. Changing from local coal to natural gas is not a feasible option inmost cases because of the very low cost of the coal and long distance to gas pipelines. In oneplant, changing from coal to natural gas implied increasing the energy budget eight-fold, whichrepresented a 45% increase in operating costs. Assuming the high CER price scenario ofUS$19, three alternatives appear viable via the CDM: preheating the dry process, changing theproduction system from wet to dry, and the use of additives in combustion. The results indicatethat the most cost-effective alternative is the first. The use of additives could be competitive butrequires more research and development.
Although the additional options have costs per ton reduced, higher than the estimated pricerange, the CDM could finance a significant share of conversion costs. Seen in this light, theCDM represents financing option for improvement of productivity and competitiveness in thesector. For example, the study evaluated the potential for conversion from wet to dry process ina plant with installed capacity to produce 1’500.000 tons of cement annually. This investmentcould reduce upwards of 5.6 million tons of GHG during the life of the project at a cost of $135million dollars. The sale of CERs at 9.80, our median price estimate, would generate 54.6million dollars for the investment. If the technological conversion is interesting for additionalreasons, the CER flow could leverage the investment.
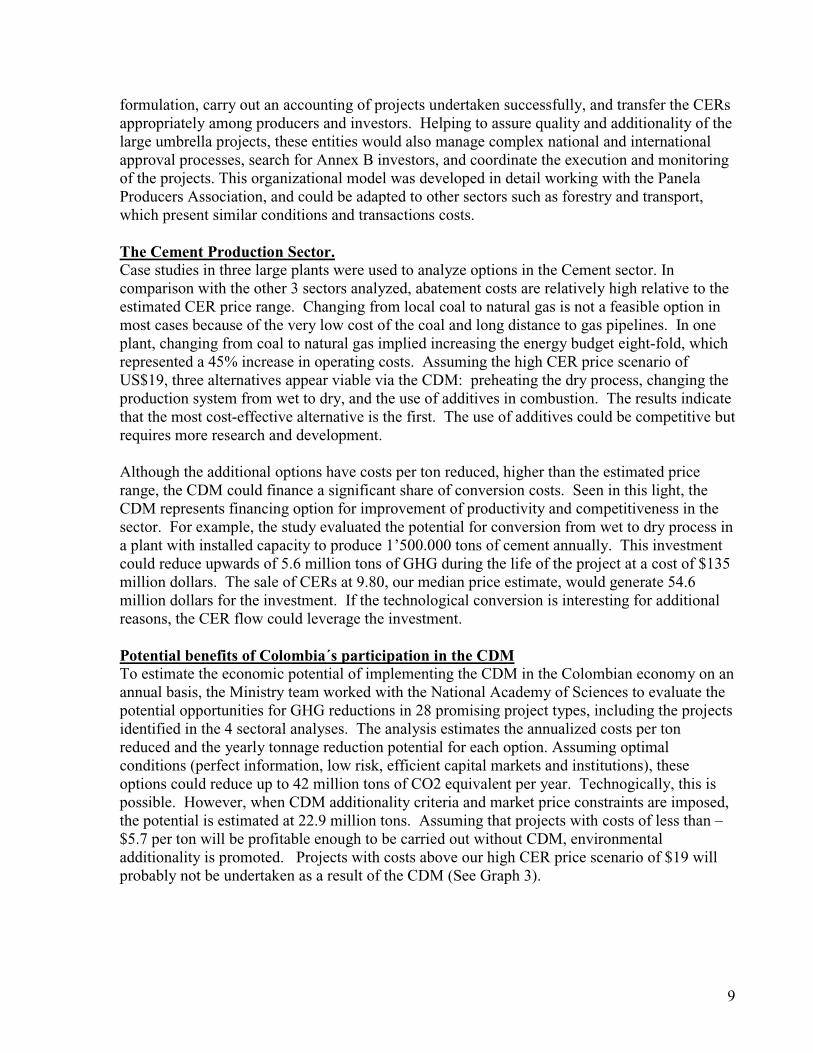
Potential benefits of Colombia´s participation in the CDMTo estimate the economic potential of implementing the CDM in the Colombian economy on anannual basis, the Ministry team worked with the National Academy of Sciences to evaluate thepotential opportunities for GHG reductions in 28 promising project types, including the projectsidentified in the 4 sectoral analyses. The analysis estimates the annualized costs per tonreduced and the yearly tonnage reduction potential for each option. Assuming optimalconditions (perfect information, low risk, efficient capital markets and institutions), theseoptions could reduce up to 42 million tons of CO2 equivalent per year. Technogically, this ispossible. However, when CDM additionality criteria and market price constraints are imposed,the potential is estimated at 22.9 million tons. Assuming that projects with costs of less than –$5.7 per ton will be profitable enough to be carried out without CDM, environmentaladditionality is promoted. Projects with costs above our high CER price scenario of $19 willprobably not be undertaken as a result of the CDM (See Graph 3).
10
Graph 3. Estimation of Annual Aggregated GHGMitigation Potential.
CO 2 Abatement Cost Curve: 2010
-200.
-100.
0.
100.
200.
300.
400.
500.
600.
0. 5. 10. 15. 20. 25. 30. 35. 40. 45.
Million tonnes CO 2 Reduction
Cost(S/Tonne)
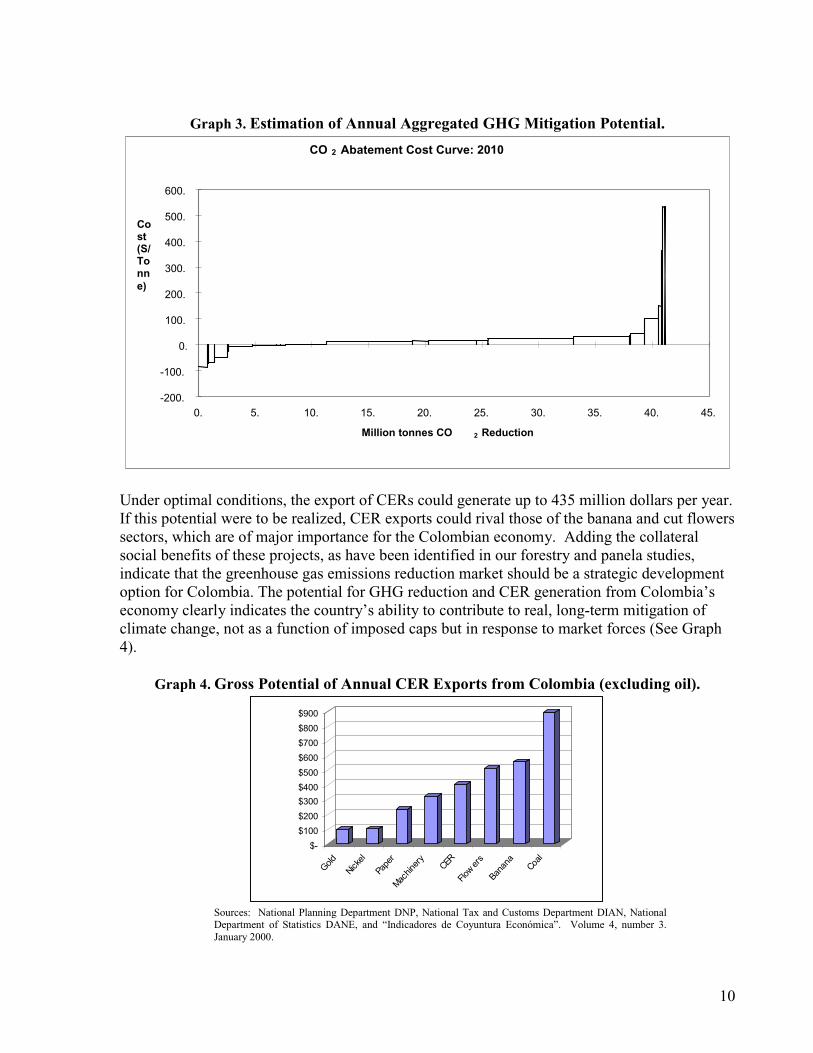
Under optimal conditions, the export of CERs could generate up to 435 million dollars per year.If this potential were to be realized, CER exports could rival those of the banana and cut flowerssectors, which are of major importance for the Colombian economy. Adding the collateralsocial benefits of these projects, as have been identified in our forestry and panela studies,indicate that the greenhouse gas emissions reduction market should be a strategic developmentoption for Colombia. The potential for GHG reduction and CER generation from Colombia’seconomy clearly indicates the country’s ability to contribute to real, long-term mitigation ofclimate change, not as a function of imposed caps but in response to market forces (See Graph4).
Graph 4. Gross Potential of Annual CER Exports from Colombia (excluding oil).
$-
$100
$200
$300
$400
$500
$600
$700
$800
$900
Gold
Nickel
Paper
Machinery
CER
Flowers
Banana Coal
Sources: National Planning Department DNP, National Tax and Customs Department DIAN, NationalDepartment of Statistics DANE, and “Indicadores de Coyuntura Económica”. Volume 4, number 3.January 2000.
11
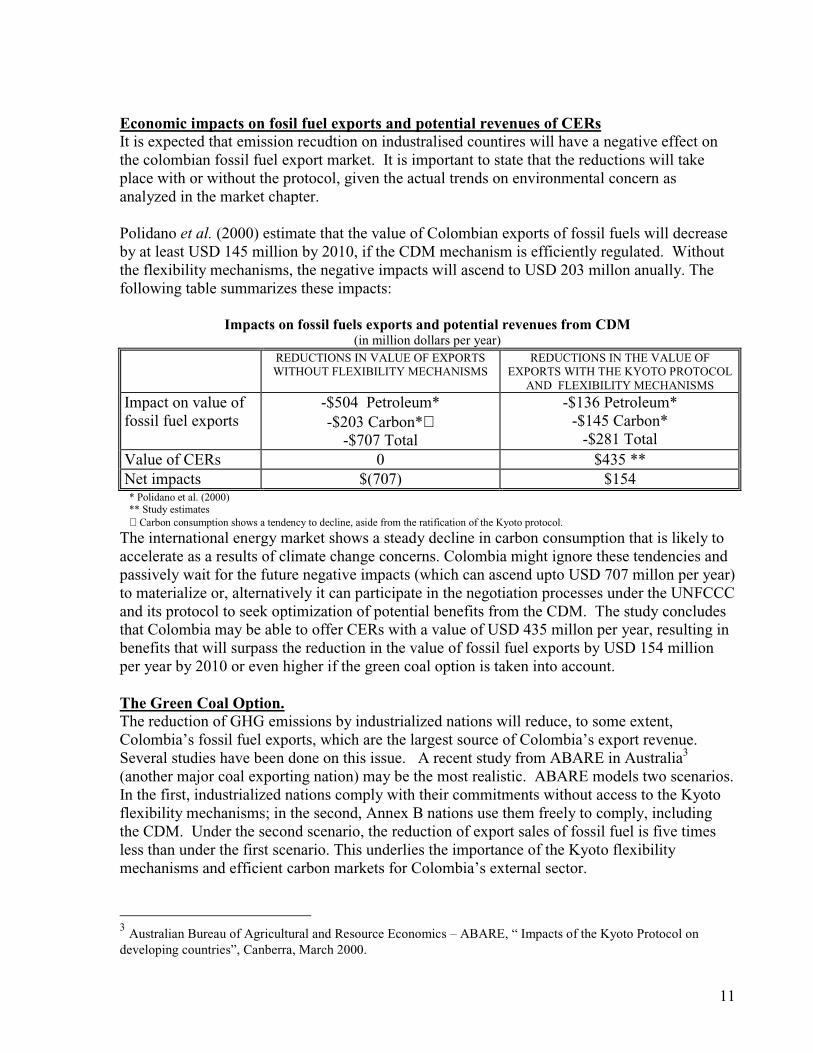
Economic impacts on fosil fuel exports and potential revenues of CERsIt is expected that emission recudtion on industralised countires will have a negative effect onthe colombian fossil fuel export market. It is important to state that the reductions will takeplace with or without the protocol, given the actual trends on environmental concern asanalyzed in the market chapter.
Polidano et al. (2000) estimate that the value of Colombian exports of fossil fuels will decreaseby at least USD 145 million by 2010, if the CDM mechanism is efficiently regulated. Withoutthe flexibility mechanisms, the negative impacts will ascend to USD 203 millon anually. Thefollowing table summarizes these impacts:
Impacts on fossil fuels exports and potential revenues from CDM(in million dollars per year)
REDUCTIONS IN VALUE OF EXPORTSWITHOUT FLEXIBILITY MECHANISMS
REDUCTIONS IN THE VALUE OFEXPORTS WITH THE KYOTO PROTOCOLAND FLEXIBILITY MECHANISMS
Impact on value offossil fuel exports
-$504 Petroleum*-$203 Carbon*∇-$707 Total
-$136 Petroleum*-$145 Carbon*-$281 Total
Value of CERs 0 $435 **Net impacts $(707) $154* Polidano et al. (2000)** Study estimates∇ Carbon consumption shows a tendency to decline, aside from the ratification of the Kyoto protocol.The international energy market shows a steady decline in carbon consumption that is likely toaccelerate as a results of climate change concerns. Colombia might ignore these tendencies andpassively wait for the future negative impacts (which can ascend upto USD 707 millon per year)to materialize or, alternatively it can participate in the negotiation processes under the UNFCCCand its protocol to seek optimization of potential benefits from the CDM. The study concludesthat Colombia may be able to offer CERs with a value of USD 435 millon per year, resulting inbenefits that will surpass the reduction in the value of fossil fuel exports by USD 154 millionper year by 2010 or even higher if the green coal option is taken into account.
The Green Coal Option.The reduction of GHG emissions by industrialized nations will reduce, to some extent,Colombia’s fossil fuel exports, which are the largest source of Colombia’s export revenue.Several studies have been done on this issue. A recent study from ABARE in Australia3
(another major coal exporting nation) may be the most realistic. ABARE models two scenarios.In the first, industrialized nations comply with their commitments without access to the Kyotoflexibility mechanisms; in the second, Annex B nations use them freely to comply, includingthe CDM. Under the second scenario, the reduction of export sales of fossil fuel is five timesless than under the first scenario. This underlies the importance of the Kyoto flexibilitymechanisms and efficient carbon markets for Colombia’s external sector.
3 Australian Bureau of Agricultural and Resource Economics – ABARE, “ Impacts of the Kyoto Protocol ondeveloping countries”, Canberra, March 2000.
12
In an international environment that is moving toward “decarbonization” with or without theKyoto Protocol, Colombia can maintain its export competitiveness by bundling CERs generatedfrom our competitive forest projects with coal and oil to export Greenhouse Gas CompensatedCoal, or “Green Coal”. In interviews with individual coal exporters, many expressed theirbelief that Colombia could become the major provider of Green Coal for the United States andCanada, based on three factors: low CER generation costs, low transportation costs based onColombia’s geographic proximity, and the high BTU rating and low sulfur content ofColombian coal.
These simulations represent Colombia’s potential for GHG mitigation and CER export underoptimal conditions. However, conditions for CDM market development are far from perfect inColombia. In practice under the status quo, only a small fraction of this potential will berealized without efficient and effective policies to promote the CDM and relax existingconstraints.
Technology transfer needsAn important outcome from the analysis of the different projects and sectors was to identify thelack of technology and know how. In this respect, the success and viability of the differentMDL projects will surely depend on providing a solution for these lacks at the regional andlocal levels. Furthermore, capacity building was also an important component which has to beaddressed in order to promote the transition to the scenario brought by the project.
In the forestry sector, the main findings were related to sustainable use of forests andmainentace of planted areas. The cement sector was found that the lack with respect totechnology was due to economic factors. As the sector represents industries from a well-defined portion of the economy, their situation with respect to know-how is said to becustomary. The results revealed by the Panela producing sector showed that there is a need forthe individual producers to gather into greater groups, which can canalize all informatiuonneeded for the formulation of MDL projects.
As a general requirement, the know-how of CDM project formulation should be a primary stepfor implementing the strategy.To strenghen their opportunities in the CDM market, there is aneed for implementing a technology transfer and capacity building programmes, focused onlatest and cleaner technologies and on CDM project formulation (mainly baseline andaditionality).
1.4.Strategic Policies to Develop Colombia’s CDM PotentialChapter VI develops alternatives to remove the international and national constraints that canlimit the development of the CDM potential identified in this study. In the international arena,inefficient regulations may distort the operation of the CDM, severely limiting its potential toallocate resources towards cost-effective emissions reduction projects in developing countries.At the national level, factors such as information constraints, high risk to foreign investors, lackof finance for prefeasibility studies, inefficient institutions and high transaction costs could limitthe development of Colombia’s potential. To the degree that these and related issues areadequately addressed by sound policy and programs, the CDM could produce real benefits forColombia’s sustainable development.
13
Design of the CDM.As discussed in the introduction, a number of issues/barriers could severely constrain the CDM.Key issues could be negotiated and regulated in ways that favor market efficiency andmaximize investments in the developing world, or they could do the opposite. Many of thesewill be negotiated and rules written at the sixth Conference of the Parties in November 2000.The study identifies key areas where regulations should be oriented towards economicefficiency and environmental effectiveness so that the model can usefully address the objectivesof the Kyoto Protocol while maximizing the potential benefits in Colombia and otherdeveloping nations. The study also proposes the key elements of a negotiation position beforethe COP.
Regulations should promote the inclusion of the widest range of projects that can effectivelymitigate greenhouse gas concentrations. Assuming strict additionality rules and effectivemonitoring, Annex I emitters should be free to invest their compliance dollars in the most costeffective options they find anywhere on the planet and be encouraged to begin emissionsreductions as soon as possible. GHG concentrations will be lowered at the greatest speed byincluding both emissions reductions and sequester projects. In order to promote sustainabledevelopment, the CDM should channel investment flows towards all sectors: energy, transport,industry and forests. Colombia, like most developing nations, has strong interests in theemployment, income and environmental benefits that may be derived from new major forestryprojects in the rural sector.
Negotiation position before the COPIn order to promote the objectives of the Kyoto Protocol and maximize the potential benefits ofthe CDM for Colombia, the national negotiating position for COP6 is based on the followingprinciples, resulting from the study, where they are described in detail:
§ Ensure CDM eligibility for all projects formulated after January 1st, 2000. Ensure thatqualifying CDM projects are creditable from January 1 of 2000 onward. This will enable awindow of opportunity for participating countries to inmediately formulate and developeligible projects and therefore inmediately ensure benefits from these investments.
§ Minimize international transaction costs, risks and barriers. Minimize all internationaltransaction costs and potential barriers to the use of the CDM, including search, negotiation,legal, approval, monitoring and certification costs, both at the international and domesticlevels.
§ Define baselines and ensure additionality of CDM projects. Support methods foremissions baseline formulation which ensure additionality of all CDM projects whilelowering formulation costs.
§ Promote equal treatment among the 3 Kyoto flexibility mechanisms, including the useof equivalent rules for all mechanisms and the adoption of equivalent administrative andadaptation charges.
§ Promote the inclusion of carbon sinks in the CDM. The study demonstrates that carbonsink projects in Colombia are cost effective, have the potential for substantial sequestrationof Carbon, hence contributing to the objective of the UNFCCC and could providesignificant co-benefits.
14
§ Include the unilateral model of project formulation in order to reduce the risk barrier thatwould be imposed by the bilateral model.
§ Tradability and fungibility of CERs should not be constrained. Annex B nations shouldbe free to seek and invest in the most cost effective emissions mitigation projects throughoutthe world, in order to meet the objectives of Article 12. This will enable the efficient use ofthe unilateral model and prevent the slowing down of the market.
§ Supplementarity limits to the use of the CDM should be voluntary and reflect eachAnnex B nation’s internal policy. The market analysis demonstrates that supplementaritylimits reduce the international market for CERs and therefore may constraint the flow offunds for sustainable development in non Annex B nations.
§ Sustainable development criteria for approval of CDM projects must be defined byeach developing nation. Each country has different priorities and conditions forsustainable development and these should not be defined externally.
Information ConstraintsOn the domestic front, information constraints will be the principal obstacle to overcome inorder to be able to approach the national potential. The great majority of individuals and firmsin the sectors with the economic and technological potential to benefit from CDM investmentflows have no knowledge of what the CDM is or how it functions. Given its access toinformation on the development of the framework of this regulatory-driven market, oneimportant role of the state is to transfer regulatory information to the sectors with potential andbuild their capacity to participate effectively in the market. Project developers, such as smallindustrial managers, farming communities, energy producers and transport coalitions, all requireconstant flows of high quality information and useful capacity building in order to make thebest decisions on the CDM for their particular conditions.
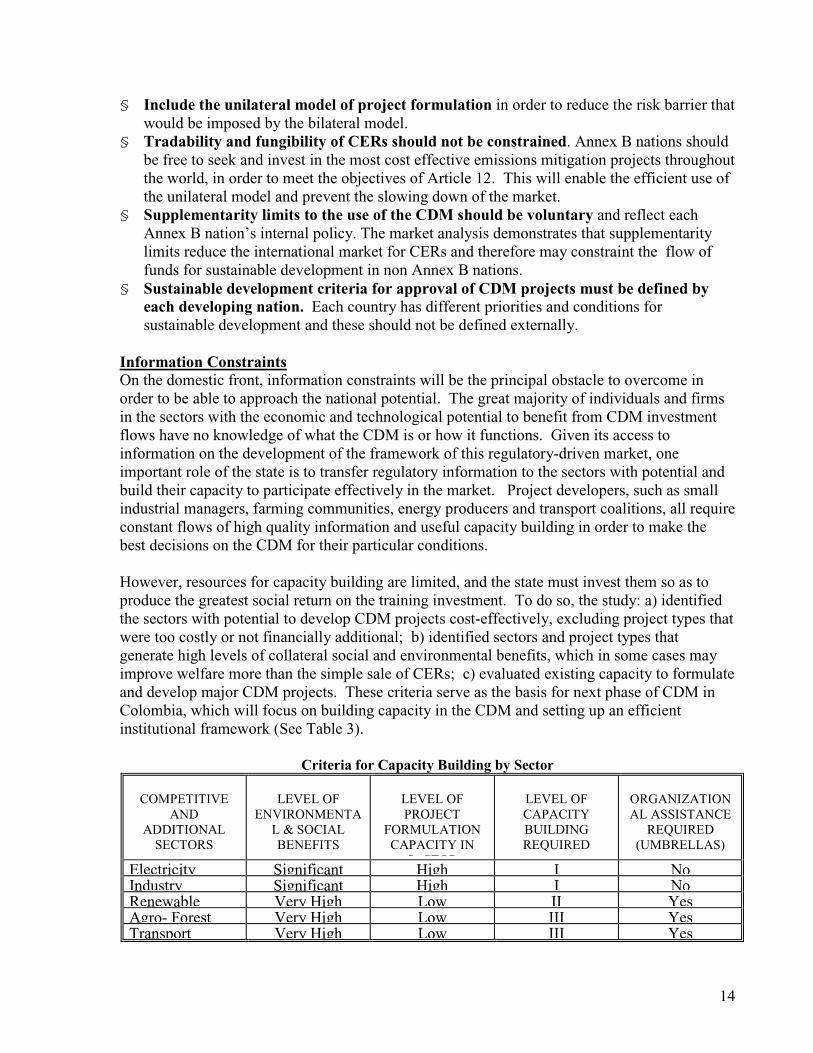
However, resources for capacity building are limited, and the state must invest them so as toproduce the greatest social return on the training investment. To do so, the study: a) identifiedthe sectors with potential to develop CDM projects cost-effectively, excluding project types thatwere too costly or not financially additional; b) identified sectors and project types thatgenerate high levels of collateral social and environmental benefits, which in some cases mayimprove welfare more than the simple sale of CERs; c) evaluated existing capacity to formulateand develop major CDM projects. These criteria serve as the basis for next phase of CDM inColombia, which will focus on building capacity in the CDM and setting up an efficientinstitutional framework (See Table 3).
Criteria for Capacity Building by Sector
COMPETITIVEAND
ADDITIONALSECTORS
LEVEL OFENVIRONMENTAL & SOCIALBENEFITS
LEVEL OFPROJECT
FORMULATIONCAPACITY INS CTOR
LEVEL OFCAPACITYBUILDINGREQUIRED
ORGANIZATIONAL ASSISTANCEREQUIRED
(UMBRELLAS)
Electricity Significant High I NoIndustry Significant High I NoRenewable Very High Low II YesAgro- Forest Very High Low III YesTransport Very High Low III Yes
15
In order to assure high quality, strict additionality, methodological consistency andminimization of transactions costs, the study developed step-by-step CDM project formulationmanuals for the forestry and energy sectors. These are also being published as independentdocuments. These guides were produced using the results of the study and the experiencegained in the formulation of the project portfolio. They will be revised annually to reflect theevolution of the regulatory framework.
Capacity building and manuals must be complemented by organizational assistance in sectorswhere transactions costs and information scarcity limit the execution of the thousands small anddispersed projects. Acting individually, property rights owners in the transport, forest and smallenergy sectors probably will not be able to benefit from the CDM, as they have little knowledgeabout what CDM or how to design a project. Worse, the costs of the CDM project cycle willovercome the potential price benefits of participating in the CDM. For a bus owner, a smallfarmer or a small community, the costs of searching for an Annex I partner, negotiating aninvestment and formulating a baseline are very costly relative to the sale of a few CERs yearly.The national capacity building program must promote organizational models that enablemultiple small projects to be summed, offered and managed as single, large umbrella projects.4
The Panela case study proposes an organizational model based on an existing cooperative runby the Panela Producers Association, but other models may be developed with NGO orcommunity groups. These models are especially critical in sectors where the collateral socialand environmental benefits are high, such as the forest sector. If Colombia seeks to maximizethe benefits from CDM, focused capacity building and organizations models are paramount.
Risk ManagementUnder the bilateral CDM formulation model, Annex B entities hold the initiative to select theirdeveloping nation partners. High-risk countries must compete with dozens of low risk countriesfor CDM investments. Given the high perceived risk of investing in Colombia, cost-effectiverisk management options must be developed. If not, risk could be the principal barrier to CDMinvestment in Colombia.
Colombia is not at a disadvantage with regard to the technological and economic risk whencompared to competitors such as Mexico, Brazil, Bolivia and Costa Rica. Clearly, Colombia isat a disadvantage in the area of personal security from civil disorders. Given the ability fordomestic investors to understand and manage these local risks, the unilateral formulation modelbecomes quite important if Colombia is to obtain its CDM potential. Domestic investors havedeveloped operational models that allow them to function under the existing risk panorama.They can manage the risk better, formulate projects fulfilling all CDM rules, invest in andexecute the projects, monitor and certify the emissions reductions, and receive the CERs.Assuming tradability of CERs on primary and secondary markets, they could sell the CERs tothe highest Annex B bidder, who in turn incurs no risk at all in purchasing them. If the sameAnnex B investors are limited to bilateral CDM formulation and have to carry out long-terminvestments in the developing country, Colombia will probably be bypassed by the CDMbecause of the high perceived risk to foreign investors.
4 The chapter on institutions presents a thorough discussion of the numerous transactions costs that projects willhave to cover throughout the entire CDM project cycle.
16
Project risk can be substantially reduced by appropriate project design, which localizes theproject in lower risk areas and incorporates measures to reduce risks. Forestry producers havelong known that projects designed to incorporate high employment in local communities,training in modern technique, and significant technology transfer, suffer little risk from violentsocial movements.
Our survey of the literature indicates that some investors will be willing to take on greater risk ifthe collateral social and environmental benefits of the program are high enough. For example,Southwest Central Power Company, presenting at a CDM seminar in Bogota, indicated that thelevel of biodiversity preservation benefits are a major consideration in selecting investmentprojects, and that increased risk may be tolerated if the biodiversity benefits are high enough.Given that the increase in social welfare may often come from the collateral benefits, theColombian government should consider financing a risk management fund to cover theinvestment risk in these projects, in order to promote investment in them. Given that theperceived risk is not generated by the project but by national social and economic conditions,the resources for the risk fund should come from the national budget and should not extractvalue from the CDM transactions.
Finally, risk can be reduced by promoting a highly diversified project portfolio, in terms ofsectors, geographic areas, types of investors and types of project developers working locally.
Financial ConstraintsA third important factor that will limit the development of Colombia’s CDM potential is thelack of financing for prefeasibility studies and for execution of projects under the unilateralmodel. With the economy in prolonged recession, investment capital is extremely scarce.National financial markets require high real interest rates and are unfamiliar with the CleanDevelopment Mechanism. As with risk, this could favor the additionality of some projects thatwould otherwise may have been carried out in other countries with more developed capitalmarkets. Many potential projects may not be evaluated in terms of feasibility because of lack offinance. Many projects, which appear financially additional on paper, will not be executedbecause of lack of investment capital.
Some credit options exist if projects fit into sectoral investment profiles supported by thegovernment development plans. Large industrial export-oriented projects may seek financingby the national export bank (Bancoldex) or the Institute for Industrial Promotion (IFI). Energyprojects could seek finance in the National Energy Fund (FEN).
The international risk capital markets may provide some alternatives in the medium term. TheMinistry of Environment is seeking international equity investors to establish a fund to developenvironmentally friendly, small to medium sized industrial projects. International equity fundssuch as the Terra Capital Fund may eventually become alternatives, but in a highly selectivemanner. This will not represent a financing option for the bulk of Colombia’s projects.
Two non-reimbursable sources of capital could be the Initiative for the Americas and Plante.The former, based on an environmental swap from the United States, could become an
17
important source for CDM projects, but is currently being reformulated. Plante, oriented tosocial, rural and environmental projects that could offer viable alternatives to illicit cropproduction, may become a significant source of capital for land use change and forestry projectsunder the CDM.
The scarcity of local capital represents a major bottleneck for CDM project development andcould severely constrain Colombia’s ability to obtain its economic and technological potential.If multilateral financing sources such as the World Bank and the InterAmerican DevelopmentBank develop additional credit lines for CDM projects, this constraint could be significantlyreduced.
National Institutions: transactions costs, rent seeking and institutional efficiency.The final chapter presents the proposed design of a national CDM Office. The office wouldhave two functions: First, evaluation of projects presented for approval. Second, capacitybuilding and promotion of the CDM model in Colombia’s sectors with demonstrated potential.Given its risk profile and capital constraints, Colombia’s CDM program must produce very highquality, fully additional projects if it expects to compete in this emerging market.
The chapter carefully evaluates the role of national institutions in the operation of project basedemissions offsets programs and the CDM. Based on a careful evaluation of historicalexperience with similar project-based programs, the study concludes that every effort must bemade to minimize transactions costs imposed by national institutions, particularly registrationand approval costs. Related problems that stifled trading in the San Francisco Bay TradingProgram, South Coast Air Quality Management District, and the Fox River Trading Programwere taken into account in the design and operation of the Office.
The chapter identifies and analyses all of the potential transactions costs, extractions of valueand barriers in the CDM project cycle, both at an international and national level. Thiscompilation of dozens of items demonstrates that the CDM is at a clear disadvantage withrespect to AIJ and IET, which could lead to a loss of competitiveness with respect to thoseinstruments, channeling resources away from the desired north-south flow and towards a north-north flow that does little for sustainable development while increasing the Annex B cost ofcompliance.
A careful analysis of rent seeking and property rights is presented with implications for theCDM. Rent-seeking is common in developing nations, and the CDM is particularly susceptiblegiven the relative instability of environmental institutions. Powerful lobbies or political interestgroups could easily siphon off revenue streams from CDM transactions for laudable, butunrelated programs. In order to minimize the negative effects of political and institutional rent-seeking, a key recommendation is that property rights of CERs should be clearly assigned to theproject investors and operators that create the positive externality (GHG reduction) and thevalue associated (CERs) in CDM projects. This will give property rights holders legalfoundations to defend their interests in national legal and political systems.
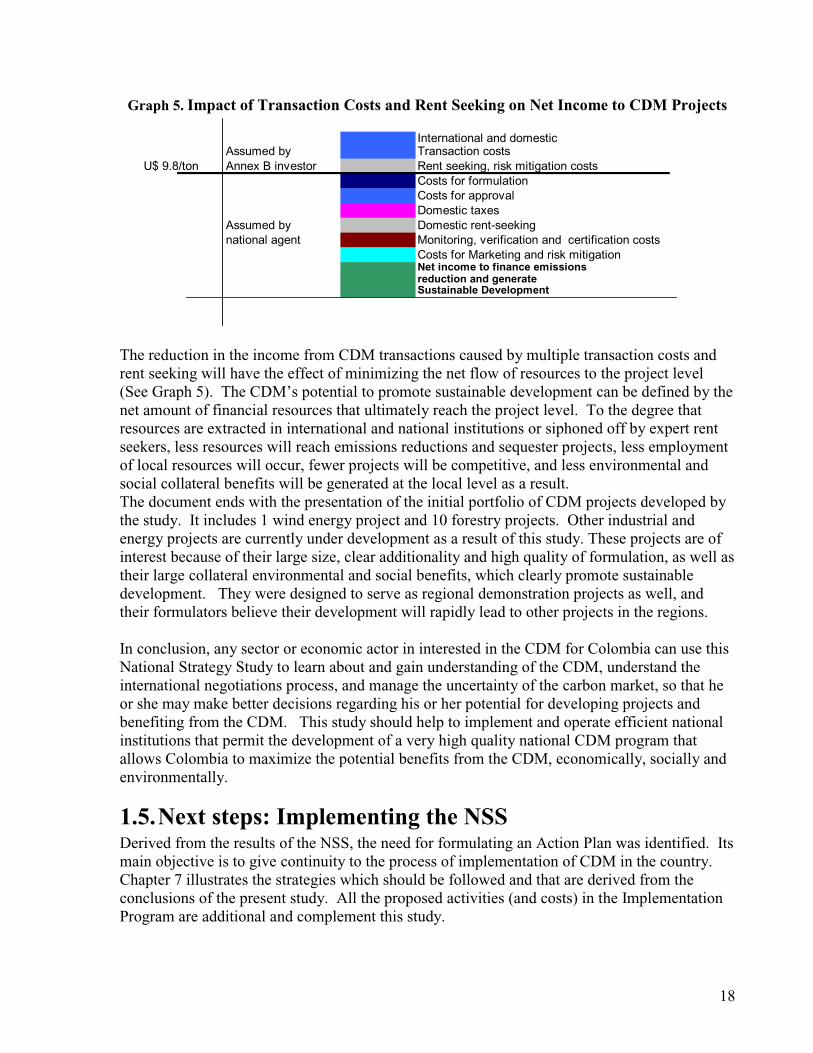
18
Graph 5. Impact of Transaction Costs and Rent Seeking on Net Income to CDM Projects
International and domesticAssumed by Transaction costs
U$ 9.8/ton Annex B investor Rent seeking, risk mitigation costsCosts for formulationCosts for approvalDomestic taxes
Assumed by Domestic rent-seekingnational agent Monitoring, verification and certification costs
Costs for Marketing and risk mitigationNet income to finance emissionsreduction and generateSustainable Development
The reduction in the income from CDM transactions caused by multiple transaction costs andrent seeking will have the effect of minimizing the net flow of resources to the project level(See Graph 5). The CDM’s potential to promote sustainable development can be defined by thenet amount of financial resources that ultimately reach the project level. To the degree thatresources are extracted in international and national institutions or siphoned off by expert rentseekers, less resources will reach emissions reductions and sequester projects, less employmentof local resources will occur, fewer projects will be competitive, and less environmental andsocial collateral benefits will be generated at the local level as a result.The document ends with the presentation of the initial portfolio of CDM projects developed bythe study. It includes 1 wind energy project and 10 forestry projects. Other industrial andenergy projects are currently under development as a result of this study. These projects are ofinterest because of their large size, clear additionality and high quality of formulation, as well astheir large collateral environmental and social benefits, which clearly promote sustainabledevelopment. They were designed to serve as regional demonstration projects as well, andtheir formulators believe their development will rapidly lead to other projects in the regions.
In conclusion, any sector or economic actor in interested in the CDM for Colombia can use thisNational Strategy Study to learn about and gain understanding of the CDM, understand theinternational negotiations process, and manage the uncertainty of the carbon market, so that heor she may make better decisions regarding his or her potential for developing projects andbenefiting from the CDM. This study should help to implement and operate efficient nationalinstitutions that permit the development of a very high quality national CDM program thatallows Colombia to maximize the potential benefits from the CDM, economically, socially andenvironmentally.
1.5.Next steps: Implementing the NSSDerived from the results of the NSS, the need for formulating an Action Plan was identified. Itsmain objective is to give continuity to the process of implementation of CDM in the country.Chapter 7 illustrates the strategies which should be followed and that are derived from theconclusions of the present study. All the proposed activities (and costs) in the ImplementationProgram are additional and complement this study.
19
The main objective of the Action Plan is to implement the strategy for the implementation ofCDM in Colombia, maximizing the benefits and opportunities for the country. The Plan wasdesigned for three years and it is divided into five components. Each component is intended toovercome the barriers and difficulties which were identified and that may restrict the potentialof CDM in the country. The components are: i) Strengthening of the negotiate capacity; ii)strengthening of the national capacity for CDM project development; iii) Support of the CDMproject portfolio with respect to financing, marketing and promotion; iv) Set up and commenceof a risk capital fund; and v) set up and consolidation of the institutional capacity for managingCDM.
The total cost of the Plan is 12 million dollars including the initial capital for the Risk CapitalFund. The total budget without the fund would be 2 million dollars for three years.
20
2.The Clean Development Mechanism: Theory,Practice and Regulatory Design Options in theInternational Negotiation Process
2.1. Theoretical Context of the Kyoto Mechanisms
2.1.1. Introduction: The Problem of the Cost of Compliance withEnvironmental Regulation.
The economic cost of complying with environmental regulation has been the principal reasonfor the resistance of the regulated agents to cleaning contaminants from the environment. Fromwhen the industrialized countries began to impose command and control5 style regulatorysystems during the seventies, regulated agents have resisted because of the high costs they havehad to assume. To the extent that environmental institutions have increased control on differentproductive sectors, the costs of compliance have risen notable on the margin and in total. In theeighties and nineties many countries saw the cost of environmental compliance rise to over 3%of GDP, reducing traditional indexes for productivity, profits and economic growth. Thereaction of regulated agents in all countries of the world has been strong and constant againstthe high cost of traditional regulation.
The development of the Climate Change Convention reflects this process. Ratification of theConvention by the parties in 1994 and the initial proposal for goals, were based on commandand control concepts: each country had a specific goal for reduction and had to reduceemissions “at home” with significant impacts on its economy.
Responding to the alarm of their regulated sectors, Annex 1 countries began to seek alternativesto reduce this cost significantly, a process which resulted in (a) postponing the complianceperiod from 2000 to 2008-2012, and (b) the adoption of the Flexibility Mechanisms of theKyoto Protocol. The flexibility mechanisms are three variants of a “market” regulatory systemcalled Tradable emissions Rights, which make it possible to reduce the cost of environmentalregulation.
How do these “market” instruments work? This chapter presents, in a simple form, thetheoretical framework that provides a basis for these market regulation systems. The secondsection reviews experiences in the use of this type of system, including those which have failed,and those considered successful in environmental and economic terms. The third section
5 Control systems where a central entity imposes equal permissible emissions limits or equal technological controlsolutions on all sources without considering their compliance costs. Each source must reduce emissions in anisolated and independent manner . The rigidity and the broad internal cost variations for decontaminating createdhigh compliance costs, which caused competitive imbalances among sources. Many companies with high internalcosts refused to comply and decided to resist control politically and legally, and many regulatory institutions hadeither the technical capacity or the policing capacity to force generalized compliance.
21
analyzes the Clean Development Mechanism based on the theory and relevant experiences,presents its mode of operation, and indicates the elements of international negotiation whichcould affect its economic efficiency and environmental effectiveness, evaluating theimplications for Colombia.
2.1.2. Tradable Emissions Rights: Theoretical FundamentsFrom Alfred Pigou in 1932, many economists have studied economic options more efficientthan the command and control model. They have proposed that the development of systemsmore consistent with the market-based economic models, which operate in most countries,could introduce greater flexibility and notably reduce the cost of compliance with theenvironmental goals of different societies.
In 1954 Kneese and Bower6 demonstrated that emissions sources generally vary in theirproduction conditions and in consequence in their emissions reduction costs. When significantcost reduction variations exist, the imposition of equal reductions among sources createsimbalances in their respective costs of compliance. Worse still, the total cost of compliance forthe regulated universe becomes too high. In their fieldwork these authors evaluated theirhypothesis of equalizing marginal costs among sources and demonstrated that the total cost ofcompliance could be minimized for the regulated universe if reduction quotas among sourcescould be reallocated until incremental costs per reduced ton were equal. Once this condition ismet7, total cost for the regulated universe analyzed was less than half than that for the traditionalsystem having equal reductions for each source.
However, environmental authorities were unable to identify and impose the allocation ofreductions, which would produce the total minimum cost, because this required knowledge ofthe reduction options and incremental costs of all the sources in the regulated universe, which isprivate information. Besides, production conditions are dynamic, with constant changes intechnology, input and products and thus, incremental reduction costs change constantly.
In 1968 Canadian Professor J. H. Dales published a proposal for a new regulation model. Heproposed that this cost-minimizing allocation could be done through the creation of an openmarket for emissions rights. In his article “Pollution, Property and Prices” he proposedestablishing a specific total of emissions rights that society was willing to accept for ageographical region.8 The rights could be allocated among sources through an auction, or eachemitter could receive a quota of rights based on a percentage of his historical emissions.Emitters could sell and purchase emissions rights in the market, depending on the requirementsand costs of their internal reduction plans. The necessary conditions for an effective marketwere:• The impacts of the contaminant to be controlled must have global and not local effects, likeCO2, whose effect depends on its accumulation and concentration in the atmosphere ingeneral, thus permitting reallocation among sources without creating local risks.
6 Kneese and Bower, “Managing Water Quality”, Ch. 6; see also L. Ruff, “The Economic Common Sense ofPollution”, in The Public Interest, XIX.7 they validated their empirical results mathematically with a la Grange Function, today widely respected ineconomics.8 J, H. Dales, “Pollution, Property and Prices”. University of Toronto Press, Toronto: 1968
22
• A great many companies on the market must be included to maintain sufficient competitionand prevent the monopolization of the system.
• A significant variation must exist among the emissions reduction costs of the emissionssources of the regulated universe.
• There must exist efficient institutions which:• promote the dissemination of information on supply, demand and the price of rights onthe market,
• permit fluid transactions without imposing high transaction costs, and• ensure the compliance of the companies in the program.
Several empirical studies have demonstrated the advantages of this system, in particular,Spofford’s study (1984)9 demonstrated that total cost for the regulated universe can be as muchas 22 times lower when quotas can be allocated efficiently.
2.1.3. Implementing the SystemCompanies that develop reduction options, which are cheaper than the market price for rights,could decontaminate more than their allocated quota, sell their surplus rights and generateprofits through the sale of this “environmental service”. The profits are generated through thedifference between the internal reduction cost and the sale price of the right in the market. Tomake this profit, each company must develop a plan of options for reducing (or capturing)emissions:
• Identifying the emissions sources in its own productive system;• Identifying the emissions reduction options available to it.10
• For each reduction option possible in the company, estimating the annualized cost perreduced ton;11
• Ordering the options from smallest to biggest in a decontamination plan12 represented in amarginal cost curve for decontaminating;
• Implementing those options whose cost per reduced ton is smaller than the price of a right toemit one ton;
• After certifying the real reductions in the year, selling the extra reduction certificates notneeded for the company’s own compliance;
• Adding the profit thus obtained to the company’s profit.
9 T. Tietenberg, Environmental and natural Resource Economics. HarperCollins College Publishers, FourthEdition, Chapter 15, p. 363.
10 Options vary according to source and contaminant; they can include training, improved equipment maintenance,changes in inputs, a change in fuels, cleaner technology and equipment, end-of-pipe filters, among others.
11 This formula is presented and applied in Chapter 5, on the competitiveness of Colombian sectors.12 Based on the annualized cost per ton of contaminant reduced per reduction option.
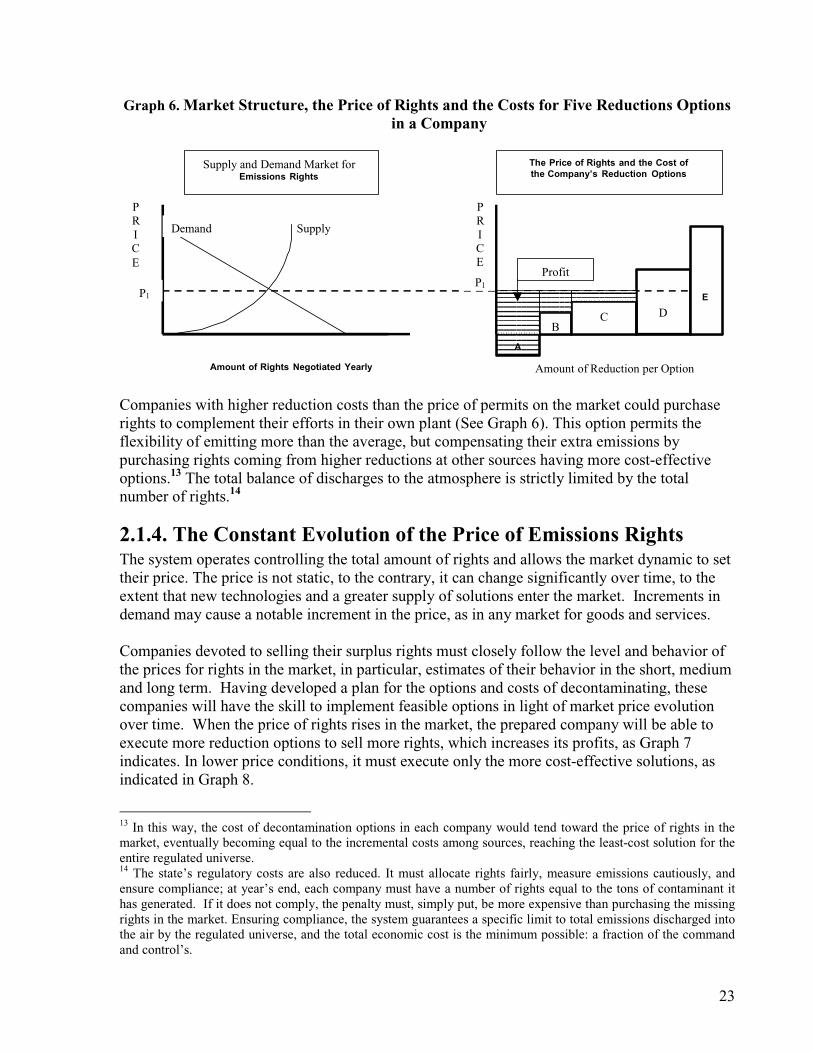
23
Graph 6. Market Structure, the Price of Rights and the Costs for Five Reductions Optionsin a Company
PRICE
Supply and Demand Market forEmissions Rights
The Price of Rights and the Cost ofthe Company’s Reduction Options
PRICE
Amount of Rights Negotiated Yearly Amount of Reduction per Option
P1P1
A
Demand Supply
BC D
E
Profit
Companies with higher reduction costs than the price of permits on the market could purchaserights to complement their efforts in their own plant (See Graph 6). This option permits theflexibility of emitting more than the average, but compensating their extra emissions bypurchasing rights coming from higher reductions at other sources having more cost-effectiveoptions.13 The total balance of discharges to the atmosphere is strictly limited by the totalnumber of rights.14
2.1.4. The Constant Evolution of the Price of Emissions RightsThe system operates controlling the total amount of rights and allows the market dynamic to settheir price. The price is not static, to the contrary, it can change significantly over time, to theextent that new technologies and a greater supply of solutions enter the market. Increments indemand may cause a notable increment in the price, as in any market for goods and services.
Companies devoted to selling their surplus rights must closely follow the level and behavior ofthe prices for rights in the market, in particular, estimates of their behavior in the short, mediumand long term. Having developed a plan for the options and costs of decontaminating, thesecompanies will have the skill to implement feasible options in light of market price evolutionover time. When the price of rights rises in the market, the prepared company will be able toexecute more reduction options to sell more rights, which increases its profits, as Graph 7indicates. In lower price conditions, it must execute only the more cost-effective solutions, asindicated in Graph 8.
13 In this way, the cost of decontamination options in each company would tend toward the price of rights in themarket, eventually becoming equal to the incremental costs among sources, reaching the least-cost solution for theentire regulated universe.14 The state’s regulatory costs are also reduced. It must allocate rights fairly, measure emissions cautiously, andensure compliance; at year’s end, each company must have a number of rights equal to the tons of contaminant ithas generated. If it does not comply, the penalty must, simply put, be more expensive than purchasing the missingrights in the market. Ensuring compliance, the system guarantees a specific limit to total emissions discharged intothe air by the regulated universe, and the total economic cost is the minimum possible: a fraction of the commandand control’s.
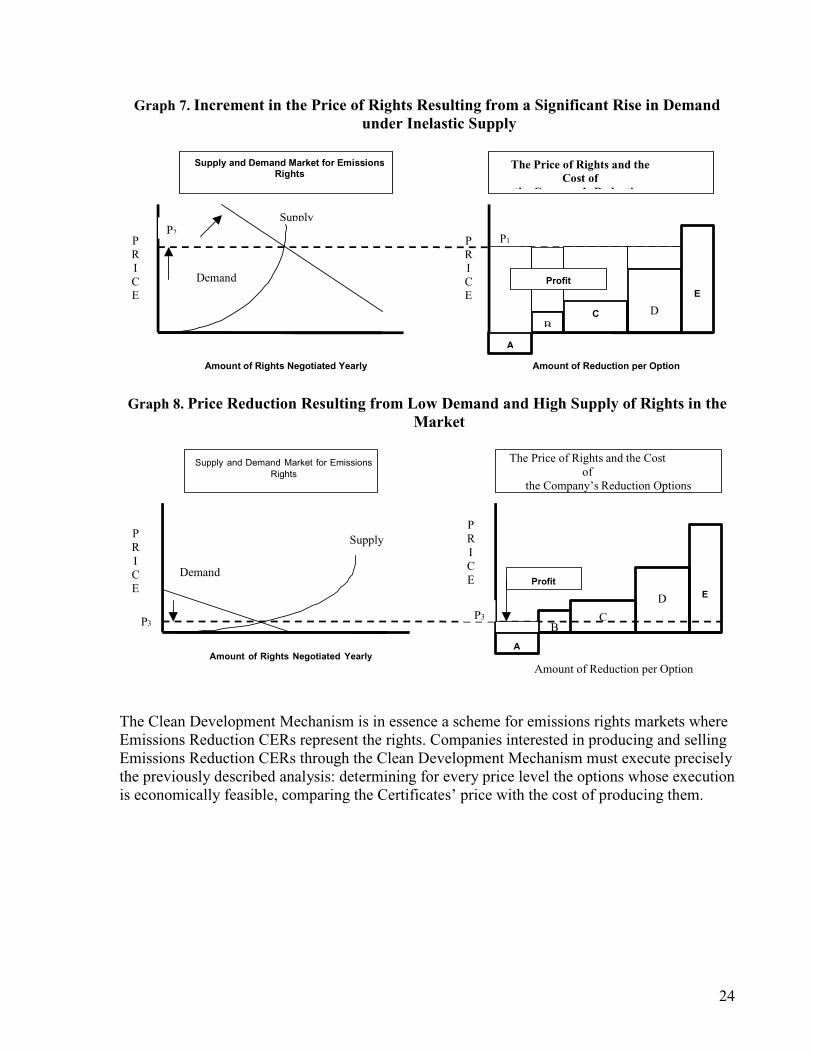
24
Graph 7. Increment in the Price of Rights Resulting from a Significant Rise in Demandunder Inelastic Supply
PRICE
Demand
Supply and Demand Market for EmissionsRights
The Price of Rights and theCost of
th C ’ R d ti
PRICE
Amount of Rights Negotiated Yearly Amount of Reduction per Option
P2P1
A
Supply
BC D
ProfitE
Graph 8. Price Reduction Resulting from Low Demand and High Supply of Rights in theMarket
ED
BCP3
Supply and Demand Market for EmissionsRights
The Price of Rights and the Costof
the Company’s Reduction Options
PRICE
PRICE
Amount of Rights Negotiated YearlyAmount of Reduction per Option
P3
A
Demand
Supply
Profit
The Clean Development Mechanism is in essence a scheme for emissions rights markets whereEmissions Reduction CERs represent the rights. Companies interested in producing and sellingEmissions Reduction CERs through the Clean Development Mechanism must execute preciselythe previously described analysis: determining for every price level the options whose executionis economically feasible, comparing the Certificates’ price with the cost of producing them.
25
2.2. Empirical Experience in the Use of Markets forTradable emissions Rights
Experimentation with this new regulatory model began in the seventies in high-pollution areaswhere the cost of control was even then generating resistance. In Los Angeles15, SanFrancisco16, and Wisconsin17, the model did not produce satisfactory results. In 1990, theprogram to control Acid Rain was launched in the United States, which used the modelsuccessfully to reduce SO2 emissions in the thermo-electrical industry, correcting the problemsthat had limited previous programs. The program of Jointly Implemented Activities marks thefirst attempt to use the model in developing countries and to control greenhouse gases. Theanalysis of the three experiences offers guidelines for the design and operation of an effectiveClean Development Mechanism program.
2.2.1. Initial ExperimentsBecause of the system’s novelty, environmental authorities in Los Angeles and San Franciscodecided to impose numerous requirements on each exchange program. Each project forreducing emissions and transferring rights had to be registered, technically evaluated by theauthority, debated with the community, its impacts on the air basin modeled, then legalized andapproved, before proceeding with investment in decontamination and the exchange of rights.Many groups, which had no confidence in the market, could intervene in the evaluation process,and frequently they insisted on further research on the potential effects of the exchange ofemissions, or they challenged the exchanges in court19. The newfangled context generatedstrong tensions on regulators, who were learning on the job and applying new rules wheneverthey considered it necessary.
Instead of the fluid, agile and flexible market Dales had visualized, the initial mode thatdeveloped was based on the approval of individual projects (project-based trading). In a climateof regulatory uncertainty, a number of transaction costs accumulated over each project, to thepoint that these costs cancelled out the economies of the exchanges. Once the potential forearning profits from the exchanges was eliminated, potential suppliers and purchasers lostinterest, and these programs failed.
Today, transaction costs are identified as a principal factor of distortion in all kinds of markets.Some economists consider that transaction costs can reduce their competitiveness of the CleanDevelopment Mechanism compared to the remaining alternatives industrialized countries have
15 Cason, Timothy; Gagadharan, Lata, “An Assessment of Southern California’s Grand Experiment in EmissionsCredit Trading”, Southern California Studies Center, University of Southern California: 1966. See also The SouthCoast Air Quality Management District Annual Reports.16 San Francisco Bay Area Trading Program.17 Bill O’Neil, “Transferable Discharge Permits and Economic Efficiency: The Fox River.” Journal ofEnvironmental Economics and management, X: 1983.19 United States General Accounting Office (USGAO), “A Market Approach to Air Pollution Control CouldReduce Compliance Costs Without Jeopardizing Clean Air Goals”: 1982.
26
to comply with their Kyoto Protocol goals.21 These analyses are presented with greater detail inChapter 7 on the role, responsibilities and efficiency of national institutions.
2.2.2. Program for Negotiable Rights for the Control of Acid RainIn 1990 the United States adopted a national program for tradable emissions rights to controlsulfur dioxide emissions from 2,200 thermo-electrical plants throughout the country.22 Theprogram’s goal is to encourage a decontamination process which would reduce total SO2emissions by 50% in the most cost-effective manner possible. Taking into account the problemswith previous negotiable rights programs, a clear and simple program was established. Thebasic requirements of an efficient emissions market were met23:• The problems of the contaminant to be controlled, SO2, are derived from its accumulationand concentration in the atmosphere in general, which makes it possible to reallocate amongsources without creating local risks.
• The program includes 2,200 companies in the market in the entire country, which createssufficient market competition and prevents the monopolization of the market.
• There exists a significant variation in emissions reduction costs among the sources ofemission: these costs varied between $20 and $1,800 per ton.
• The regulator, the Environmental Protection Agency (EPA) created efficient and clearinstitutions and regulations, providing ample certainty to the companies with regard to theprogram..
• The EPA made the private markets on Wall Street and in major cities in the countryresponsible for disseminating information on supply, demand and the prices for negotiablerights in the market.
• No prior approval is required for reduction projects or exchanges. Every company mustmeasure its emissions continually and report exchanges to the EPA.
• The EPA concentrated on ensuring that at year’s end, each company would have a right forevery ton of SO2 emitted and total emissions would be below the global ceiling foremissions. The Agency keeps a register of exchanges.
An additional characteristic was introduced to the program: the possibility of saving rights forfuture use or sale. This characteristic introduced greater certainty and reduced the companies’risks in their decontamination processes. If the price in the market was not the desirable one atthe time it was generated, saved rights could be sold in any future year when prices were higher,or used at any time for compliance by the same company.
The Acid Rain program has garnered broad environmental benefits from the negotiable rightssystem. The regulated universe has reduced down to the goals faster and at much lower costthan expected. MIT23 analyses conclude that the program has led emitters to reduce their
21 The most comprehensive analysis of this topic is found in Dudek and Weiner, JOINT IMPLEMENTATION,TRANSACTION COSTS AND CLIMATE CHANGE. OECD. Paris: 1996.22 With the exceptions of Alaska and Hawaii23 General Accounting Office of the US Congress, “Allowance Trading Offers and Opportunity to ReduceEmissions at Less Cost”. Washington: 1994.23 Massachusetts Institute of Technology Energy Laboratory, “Sulphur Dioxide Emissions Trading Under Title IVof the 1990 CAAA: Evaluation of Compliance Costs and Allowance Market Performance”, Cambridge: 1997.
27
emissions up to 35% over the total goal. Official field evaluations estimate that total annual costhas dropped from $10B, expected under command and control to $2,5B with the negotiablerights system.26 Besides, the broad development of cost-effective technologies has beendocumented, in response to market demand. The price of rights in the market has droppedslowly from $275 to $100 in the 8 years of operation. The price of the preferred option undercommand and control, liquid flue gas scrubbers27, has dropped 60% because of having tocompete with a broad range of options and the purchase of rights in the decontaminationmarket. Of equal importance, to date not a single non-compliance with the rules by theregulated universe has been recorded, nor have any lawsuits been initiated.
2.2.3. The Program of Jointly Implemented ActivitiesThe concept of Jointly Implemented Activities (JIA), begun as Joint Implementation (JI) wasconceived to describe a broad range of activities on the part of actors in two countries to reduceGreenhouse Gases (GHG). Given the lower cost of reducing GHG in developing countries, theprogram seeks co-financing from companies in industrialized countries in emissions reductionprojects in developing countries. A goal of the program, which exists in pilot form, was to learnon the job. Through demonstration projects, it seeks greater knowledge and more efficientmethods for implementing GHG reduction programs. Developing countries could benefit fromthe increase in foreign investment, the transference of modern and clean technology, incrementsin productivity and the reduction in collateral contamination resulting from the projects.
During the nineties, 164 projects were registered throughout the world, 114 were approved andonly 20 projects different from carbon sinks were executed by January 2000. Some reasons forthe weak results are:• It was forbidden to generate tradable emissions results for the reductions obtained by theprojects. Investment would have been large in many cases, but the Annex 1 investor wouldnot have been able to obtain rights for prompt compliance with his future reductioncommitments.
• The program is managed bilaterally, project by project. Since it requires two partners fromdifferent countries to develop projects, it suffers from all kinds of associated transactioncosts: the search for partners, legal costs, negotiation, travel, communications, insurance,and the approval of two countries.
• For many Annex 1 emitters, used to investing in their own countries, risk appears as aproblem. In fact, the major emitters of Annex 1 are thermo-electrical plants, one of the mostconservative sectors regarding risk. Certainly, in JIA all the risks of traditional foreigninvestment appear: country risk, financial risk, exchange risk, institutional risk, the risk ofthe project’s failing, and in some cases, security risk.
• Regulatory uncertainty.30 The rules of investment and qualification of projects have beenmanaged within a broad regulatory framework, both at the program level and at the level ofregulations in the participant countries. While this permits some flexibility, certaininvestors prefer clear rules before investing to avoid the possibility of investing in a projecttoday which may be disqualified tomorrow because of an unexpected regulation.
26 GAO, “Allowance Trading Offers an Opportunity to Reduce Emissions at Less Cost”, Washington: 1994.27 End-of-pipe removal plants.30 Ibid.
28
Because they are unable to receive emissions rights as an outcome of their investment in JIAprojects, Annex 1 investors have generally not been willing to invest large sums in a contexthaving high transaction costs, risks and regulatory uncertainty. It must be noted that these sameconditions apply for the Clean Development Mechanism, with the difference that the investorwill be able to obtain emissions rights (Certificates of Emissions Reduction (CERs) generatedby his investment).
On the other hand, the JIA program produced experiences that were useful for the developmentprocess of the Kyoto Mechanisms. Some important projects having strong environmental andsocial benefits were executed and have served as demonstrations for interested countries andactors.31 The inclusion of sinks in the projects has made it possible to gain experience anddevelop valuable techniques for measuring, monitoring, management and communityparticipation, opening the way for including sinks in the CDM.
Of equal importance, Costa Rica developed a unilateral model for project formulation in itsCTO program, that represents an important alternative for reducing bilateral transaction costsand risk for the foreign investor. The unilateral project formulation model allows a developingcountry to formulate a project for reducing or capturing emissions based on established rules,obtain funding on its own, execute the project, measure reductions and emissions, to have thereductions certified under the Climate Change Convention and obtain all the tradable emissionsrights the project may produce. Thus the system’s operator is free to export the rights via theinternational emissions market and receive the value of the rights. This model frees developingcountries from depending on and waiting for the initiative of an Annex 1 actor before being ableto participate in the emissions reduction market.
To sum up, these experiences offer useful lessons for the design and operation of the CDM.First, the economic incentive associated with the mechanism must be maintained to promoteinvestment in projects that reduce emissions. Profits for the exchange must be maintained. Ifthe economic incentive for the exchange is prohibited or extracted, as occurs with JIA, therewill be little motivation for foreign investment in projects in developing countries. Second, theState must limit its intervention in the program to what is strictly necessary to minimizetransaction costs. Transaction costs can accumulate and become greater than the benefits of theexchange and eliminate the transaction’s economic incentive. Third, States must establish andmaintain clear regulations from the beginning and look for stability over time. Regulatoryuncertainty might put off foreign investors and encourage them to seek out investments incountries with more stable and clearer regulations. Fourth, risk management: Many Annex 1industrial and energy sectors are not used to investing long term in developing countries, andwill probably look for countries with the lowest possible risk.
31 For example, the Noel Kempf project in Bolivia protects 500 thousand hectares of forest and preciousecosystems which would have been clear-cut, preventing the emission of millions of tons of CO2.
29
2.3. Evolution of the CDM Operations Model in ClimateChange Negotiations
The operations model for the CDM will be determined through negotiations by the Parties tothe Climate Change Convention (CCC), with the design and regulatory process starting inNovember 2000.32 This section presents an analysis of the evolution of CDM in the negotiationsof COP, its fundamental characteristics, and a critical route for the steps a CDM project takes inpractice. An analysis is presented of its disadvantages and advantages compared to theremaining compliance options Annex B emitters will have. Both the COP negotiators and theauthorities developing national implementation policies must work to minimize thesedisadvantages if they wish to obtain the expected benefits from the CDM.
2.3.1. Evolution of the Kyoto Mechanisms in the Climate ChangeNegotiations
In the third Conference of the Parties (COP3) in Kyoto, Japan, the Annex B countries weresuccessful in introducing negotiable rights systems, the so-called Flexibility Mechanisms, forthe purpose of reducing their costs for complying with the goals for reducing Greenhouse Gases(GHG). As the chapter on the GHG market demonstrates, the costs of complying with the goalswithout the mechanisms are high. For the USA, for example, the incremental cost will reach$76 for the last ton of CO2 reduced. Japan faces domestic costs of $239.33
COP4 produced the Buenos Aires Action Plan, where the Parties committed to establishing theCDM regulations, at the latest at COP6 in 2000. COP5 in Bonn supported this initiative andworked to prepare the bases for research and agreement to comply with it. As a result ofnegotiations, if the KP were to be ratified by the Parties, CDM projects established as ofJanuary 2000 will be able to qualify for the program.34 This possibility has led many investorsto begin to prepare CDM projects with the goal of generating CERs that Annex B countries willeventually be able to use to reduce their compliance costs during the 2008-2012 period.
However, uncertainties do overshadow the process. The benefits of the CDM will only becomea reality if the Parties to the CCC ratify the KP. Those sectors and countries that perceive thatthe KP will affect their economic wellbeing have been strongly opposed during the negotiationsand in the legislatures of strategic countries. Colombian sectors interested in developingprojects will not be able to do so until the Colombian Congress ratifies the KP.
In the event, the potential benefits of the Kyoto Mechanisms, especially the CDM for Colombia,are so abundant that it would be a mistake to not prepare adequately for its implementation. Asthe chapter on markets demonstrates, if the KP is approved, the first qualified projects willenjoy a relatively high price for CERs. Countries arriving late will have a lower price.
32 The Parties are the sovereign countries signing the CCC.33 1998 US dollars.34 Article 12.10 of the KP provides: “Emissions Reductions Certificates obtained during the period includedbetween the year 2000 and the beginning of the first compliance period (2008-2012) can be used for complianceduring the first compliance period.
30
2.3.2. The CDM will have to Compete Effectively with other AnnexB Compliance Options
Each Annex B country will have an annual stock of rights, denominated the allocated quantity,equal to its national emissions goal. Each country will allocate its rights to its sources ofemissions, which will have the final responsibility of generating the decontamination of theatmosphere. Each individual source must develop an analysis of reduction options and itscompliance plan, where it will select the most cost-effective solutions. Its options include:• Waiting until the last moment to minimize the risk of early action, and allow newtechnological options to be developed and prices to fall.
• Reducing emissions in-house, optimizing its productive resources.• Purchasing emissions rights in domestic markets.35
• Purchasing emissions rights in the international emissions market established under Article17 of the KP, denominated Emissions Rights Trading.
• Purchasing rights proceeding from reductions programs in the Joint ImplementationProgram established under Article 6 of the KP.
• Purchasing emissions rights proceeding from projects in developing countries through theCDM. Within the CDM, there will be a choice among thousands of projects in dozens ofcountries in the developing world.
Every Annex B source will take the set of options which are most cost-effective for its owncase, with an initial preference for projects “at home” to avoid the transaction costs, risks andregulatory uncertainty associated with external options. Every source will execute the mostcost-effective solutions in-house, passing to options outside its company when the incrementalin-house cost rises above the price of external options adjusted for the transaction costs, risk andregulatory uncertainty of each Flexibility Mechanism.
The three Flexibility Mechanisms have different characteristics and operational modes that willaffect their economic attractiveness as compliance options.
2.3.2.1. Emissions Rights TradingArticle 17 established the option of CERs for emissions rights transactions only between AnnexB countries.36 This system is similar to Dales’ classical theoretical model and to the NegotiableRights System for reducing Acid Rain presented in the preceding section. It will probably be afluid, simple and efficient market for the exchange of rights between suppliers and demandersof rights.
Under this mechanism, reduction projects no not require approval or ex ante participation byanother agent. Each source will report its emissions yearly, and companies that have emittedless than their present quota of rights will be able to sell their surplus rights in the marketwithout the intervention or approval of environmental authorities. The level of risk and
35 Australia is devising a national program for an internal negotiable rights market. The USA will do the same ifratification of the KP proceeds. Several European countries are studying the option.36 Developing countries will not be able to participate in International Emissions Rights Trading unless they adoptnational reductions goals and be formally included by the COP in Annex B.
31
regulatory uncertainty are considered to be relatively low. For participants, this complianceoption is attractive for its simplicity, low transaction costs and minimal risk.
2.3.2.2. Joint Implementation (JI)Article 6 establishes Joint Implementation, which will be managed among Annex B countrieson a project by project basis. All projects must be approved by the two countries involved andmust demonstrate that the reductions are additional to those that would have occurred in theproject’s absence. These conditions for approval, and additionality, increase the transactioncosts associated with this option, which indicates that this option will be little used: the samereductions in the same projects can be generated with lower transaction costs and regulatoryintervention under Article 17’s Emissions Rights Trading.
2.3.2.3. The Clean Development MechanismArticle 12 establishes the CDM with two objectives:• to help the Parties not included in Annex B to achieve sustainable development andcontribute to the ultimate aim of the convention (to manage to stabilize GHG concentrationsat a level where any dangerous anthropogenic interference in the climate system isprevented);
• to help the Parties included in Annex B to comply with their quantified and formalizedcommitments regarding the limitation and reduction of emissions.
The Annex B entities will be able to obtain CERs proceeding from emissions reductionsprojects in developing countries. The CERs will be added to their allocated quantities to beused in complying with their GHG reduction commitments.
Operation of the ModelPrivate or public companies interested in developing a project qualifying under CDM forgenerating CERs must apply the following criteria and actions. The chapter on projectdevelopment offers complete explanations of each element in greater detail.
1. Estimate the cost per reduced ton as the relation between the net present value of the cashflows attributable to the project and the total of reduced tons.
2. Seek an Annex B investor willing to fund the project to obtain CERs.3. Negotiate and contract the basic elements of the investment contract, including capitalsupplied, technology and the investor’s know how, on one hand, and the distribution of theproject’s benefits, including CERs, on the other.
4. Quantify the Base Line: the trajectory of the company’s emissions in the absence of theCDM project during the same life cycle.
5. Prove additionality for the CDM project: estimate the GHG reductions caused by the projectand prove that these reductions would not have occurred in its absence.37
37 The environmental integrality of the Kyoto Protocol depends on the generation of real reductions. The purchaseof a CER permits an Annex B emitter to add it to their allocated quantity of rights, and thus not have to reduce aton at home. If the CER was generated based on a reduction which would have occurred anyway in the developingcountry, there would be no reduction in Annex B nor any reduction in the developing country, with the result thatGHG concentrations in the atmosphere would not evolve in the manner agreed to in the Conference of the Parties.
32
6. Verify the Base Line and Additionality with Operational Entities. These are entities that areindependent and authorized by COP to audit projects.
7. Demonstrate that reducing emissions with the project will not cause the transference ofGHG-generating activities to other places or companies in the country.
8. Evaluate the trajectory of yearly CER generation during the project’s life cycle.9. Evaluate CER price projections during the project’s life cycle and determine the best periodfor project execution.
10. Determine the contribution to national sustainable development.11. Execute the process of national registration and approval of the project.12. Execute the process of national registration and approval of the Annex B country fromwhere the partner comes.
13. Execute the process for the approval of the project by the CDM’s Executive Body.14. Measure emissions yearly and quantify reductions per Base Line.15. Have the annual emissions reductions validated by the Operational Entities before theCDM’s Board of Directors.
16. Based on the preceding actions, each year the Executive Board must issue the CRE to theproject’s owners.
Disadvantages of the CDM compared to the remaining Compliance Options.The CDM’s operational model presented in Article 12 is more similar to the USA’s initialexperiments and the JIA program than to the efficient market model visualized by Dr. Dales.38
If the requirements and transactions processes were too costly in local programs, at theinternational level they would be even costlier. While the negotiators might minimize themodel’s inefficiencies when drafting the COP6 regulations, in practice the model impliesnumerous transaction costs, risks and uncertainties that could cancel out the CDM’scompetitiveness compared to other reductions options available to Annex B sources.
International transaction costs. The CDM envisages a bilateral development of projects, withan Annex B partner and one from a developing country. This implies costs for the internationalsearch of partners, negotiation, travel, legal management, communications and the jointadministration of the project. Projects will have to follow international registration andapproval processes, assuming the costs this implies. It is possible that third parties mayintervene in the approval process, which could notably increase approval time and cost. Thecosts of quantifying the without project emissions base line and demonstrating the additionalityof each project’s reductions will be significant. The Operational Entities that must verifyadditionality, measurement and reductions will ask a just price for their services. Rigorousmeasurement of emissions and independent certification of reductions must be doneperiodically, and measurement can be costly. Further, the Executive Board will charge apercentage of every CDM transaction to fund the administrative costs of the program39 and toconstitute a fund to help countries vulnerable to the adverse effects of climate change.Transactions in ETR and JI are not subject to this charge.
National transaction costs. Each developing country will develop institutions, procedures andrequirements for the approval and operation of CDM projects. Every national transaction cost
38 See section 3.1 on the Theoretical Framework39 Including the Executive Board and the bureaucracy developed to manage the CDM.
33
will be added to the international transaction costs. Part of the international transaction costswill be transferred to the Annex B investor, increasing the cost of the CERs he receives. Thenational actor will assume the other part, reducing the flow of net income from the transaction.The distribution of the transaction costs will depend on the negotiating power of the twopartners. The reduction of income for the national company will diminish investment capacity,employment and the remaining benefits associated with the project.
Complexity in the preparation of projects. The criteria, rules and methodology required fordesign, execution and approval under the CDM are complex, in particular the formulation ofbase lines and additionality. Potential suppliers of projects in developing countries do not knowthese methodologies. For the CDM to be efficient, extensive and effective, training programsare required for sectors with the potential to develop projects. The chapter on a DevelopmentStrategy for a National Capacity for CDM Projects Formulation in the present paper is devotedto this function.
Risks. Foreign investment in CDM projects in developing countries incurs in a number of risksthat, added to the transaction costs, might stand as a disincentive to persons demanding CER.In Colombia, investors assume a “country risk” and financial, exchange, institutional, projectand personal security risks. This becomes more important if one considers that the strongestAnnex B bidders for CERs will come from the thermo-electrical sector, one of the mostconservative with regard to risk. Chapter 6.4 of this paper evaluates the problem of risks andexamines alternatives for managing it.
Regulatory uncertainty. Medium and long-term investment capital seeks certainty. Forexample, the experience of lengthy, costly and unstable paperwork associated withenvironmental licenses in Annex B countries could work as a disincentive for Annex Binvestors. Such investors will look for clearer and more stable regulatory contexts.
Possible exclusion of sinks. Numerous groups have opposed the inclusion of forest projects inthe CDM. At COP4 and COP5, Greenpeace International, The Climate Action Network andcertain European countries argued that Article 12, establishing the CDM, makes no specificreference to sinks, and have devised arguments against the environmental efficacy of sinksprojects. The Inter-Governmental Climate Change Panel40 is evaluating these arguments andthe initial conclusions presented at COP5 are favorable to the inclusion of sinks.
In addition, certain COP countries promote major restrictions to the use of CDM, which mayseverely affect its use. These proposals, which include restricting its use for supplementarityand the prohibition from exchanging CERs in stock exchanges or secondary markets, areexamined in the following section. Table 1, Chapter 7 summarizes and compares the threeKyoto mechanisms with relation to potential disadvantages. Clearly, the CDM is at adisadvantage compared to ERT and JI.
Potential advantages of the CDM compared to other options.
40 The IGCCP is the CCC’s scientific research group.
34
The CDM will be able to offer some advantages compared to other compliance options if it isfeasible to minimize the disadvantages enumerated in the preceding section in negotiations onthe regulations.
First, the economic incentive is clearly established, in contrast to the JIA program of thenineties. If the Annex B countries impose domestic control programs41 that generate significantdemand and prices for reductions rights, the CDM’s economic incentive will be clear andsufficient, enabling a great array of economic actors to promote an ample offer of cost-effectivesolutions, based on low reduction and capture costs, innovation and the natural comparativeadvantages of the developing world.42 This represents an advantage because supply and theprice for rights under ETR and JI are restricted by high decontamination costs, typical ofindustrialized countries. The options for GHG reduction and capture in developing countriesare less costly. Certain studies estimate that the price for rights under ETR without includingthe supply of CERs, will be about $52 in the international market. When the supply of CERs isincluded the price will drop to a level of about $9.5.
Second, the CDM will be the first of the three mechanisms to become operational. Projectsapproved under CDM will be able to generate CERs from January 2000. The remainingmechanisms will only become operational from 2008. Annex B companies could begin toaccumulate cost-effective CERs for their future compliance. Companies offering CERs willhave an eight-year window of opportunity to produce CERs before the ETR and JI programsbecome operational.
Third, there is a vacuum in measurement in the ETR program. Millions of sources will be ableto participate in this program, including hard-to-measure small sources, like small industry andtransportation. If there is no real measurement of registered emissions and reductions, therewill be great potential for fraud. Suppliers will have the incentive to exaggerate theirreductions to sell more rights. Without effective measurement, great quantities of rights couldbe generated which represent no real reductions. This will violate the environmentaleffectiveness of the Kyoto Protocol and will reduce prices in the market. Besides, it introducesa new risk for the buyer of these rights: the possible consequences, sanctions and losses if therights turn out to represent fictitious reductions. It must be noted that success in the negotiablerights system to control Acid Rain in the USA was based on effective measurement.
In contrast, the COP imposed an obligatory measurement, and independent validation of suchmeasurement in all CDM programs. Reductions will be certified, and the buyer of a CER willnot incur in this risk.
2.3.3. ConclusionsCDM programs will have to compete with other compliance options for Annex B financial andtechnological resources. Annex B investors will take into account the disadvantages and costs
41 The internal regulations for Annex B countries could proceed from ratification of the KP, the imposition ofindependent regulatory programs, or from incentives for early action. Chapter 4 on markets provides furtherinformation on these possibilities.42 Chapter 4 on markets includes complete information on supply in developing countries.
35
of CDM when developing their compliance plans. High transaction costs, administrativecharges, the complexity of projects, risk of all kinds and regulatory uncertainty in unknowncountries are important differences between CDM and the other compliance options. Thepossible exclusion of sinks projects is a matter for concern for all of Latin America. While theCDM offers certain interesting advantages, this analysis indicates that the balance is leaningagainst it. Because of this, both the COP negotiators and authorities that are developing nationalimplementation strategies must work to minimize these disadvantages if they wish to obtain thebenefits expected from CDM. Section 6.4 develops specific alternatives to improve theefficiency and efficacy of the CDM model in the coming Conference of the Parties.
36
3.The Market for Emissions Reductions in theContext of the Kyoto Mechanisms
The potential benefits of the Flexibility Mechanisms of the Kyoto Protocol depend in greatmeasure on the development of an efficient carbon credits market.43 Savings in compliancecosts in the goals of Annex B countries, the smaller impact of fossil fuel prices and thetransference of resources for sustainable development through the Clean DevelopmentMechanism, will only become real if a market with broad participation is developed, includingboth Annex B and non-Annex B countries.
Uncertainty in the price and the market for CERs in great measure limits the development ofprojects. Project formulators and negotiators in developing countries need good estimates ofthe market’s future development and the price of carbon credits, both for effective planning oftheir projects and for being able to negotiate equitably with their Annex B partners. Besides, ifColombia wishes to maximize the potential benefits of making full use of the CleanDevelopment Mechanism, it must design an effective strategy which considers marketcharacteristics like: who the main parties on the demand side, who are the main suppliers andwhat is the best moment to enter the market.
The main objective of this chapter is to offer project and government policy formulators relatedto climate change, the necessary information on the emerging market for CERs, for decision-making in the environment of planning for CDM projects and developing national policiesleading to maximizing the benefits of CDM.
3.1. MethodologyMarket analysis begins with a critical review of existing research on international trade in CERsfor greenhouse gases, where the commitments and goals of the Kyoto Protocol were explicitlyincluded. This review contributes a general panorama of the variables that determine supply,demand and estimates of the price of carbon certificates under hypotheses of market efficiency.However, the present circumstances of uncertainty in the regulation of the Kyoto Protocol makethe estimates and thus the estimates irrelevant for decision-making now.
Because of this, we proceeded to design and apply a survey, which would make it possible todetermine the level of uncertainty of the most important variables affecting the development ofthe market and price estimates. Equally, a market simulation model was built, based on themarginal cost curves of Ellerman, Jacoby and Descaux’s study (1998), to incorporate thesurvey’s results and adjust the price estimates.
43 In this chapter, carbon credits will include: emissions reductions certificates (CER) coming from the Clean Development Mechanism, theEmissions Reductions Units (ERU) coming from Joint Implementation Projects and the Fractions of an Attributed Quantity (FAQ) coming fromEmissions Trading between Annex B countries.
37
The three resulting price scenarios were used to compare the competitiveness of the reductionsand capture options of Chapter 5, and they are expected to serve as indicators for projectformulation.
Last, we present a brief description of the present market situation, including the early action ofAnnex B countries, JIA projects and the first transactions.
3.2. Results
3.2.1. Principal Market CharacteristicsThe international market for GHG CERs is composed, on the demand side, by companies withhigh emissions reductions costs in Annex B countries, and on the supply side by companieswith low emissions reductions costs, both in Annex B and non-Annex B countries. Among theprincipal variables that determine demand are: the emissions reductions potential of Annex Bcountries relative to its autonomous trend (base line) and marginal costs for reduction.
3.2.1.1. The Maximum Potential of DemandThe total quantity demanded of CERs is not infinite; it is limited by the effort in emissionsreduction that Annex B countries will have to make to meet their commitments. This amountdetermines an upper limit for demand because the use of the emissions reductions market is notthe only compliance alternative a country has, it can also reduce at the source, decreaseproduction or close down emitting companies.
The reduction effort is the result of the difference between the projection of emissions of thesecountries (base line) and their emissions permits acquired in the Kyoto Protocol. Whereasemissions permits are known (See Table 4), the reductions effort is uncertain becauseprojections of future emissions are hypothetical.
Permits for greenhouse Gases Emissions(Data in Thousands of Tons of CO2 Equivalence)
1990 EMISSIONS COMMITMENTSPROTOCOL
ASSIGNEDPERMITS
USA 5.984 93% 5.565Japan 1.213 94% 1.140European Community 3.329 92% 3.062Other OECD 1.193 95% 1.187Eastern Europe 1.348 104% 1.254Ex – Soviet Union 4.087 98% 4.077TOTAL 17.154 16.285
UNFFC 1999. Total emissions excluding changes in land use and sequestration.
GHG emissions projections, and thus the base line, depend in great measure on the supply anddemand for goods and services whose production involves the production of greenhouse gases.Thus, variables like population growth, the growth of the economy, the structure of the energy
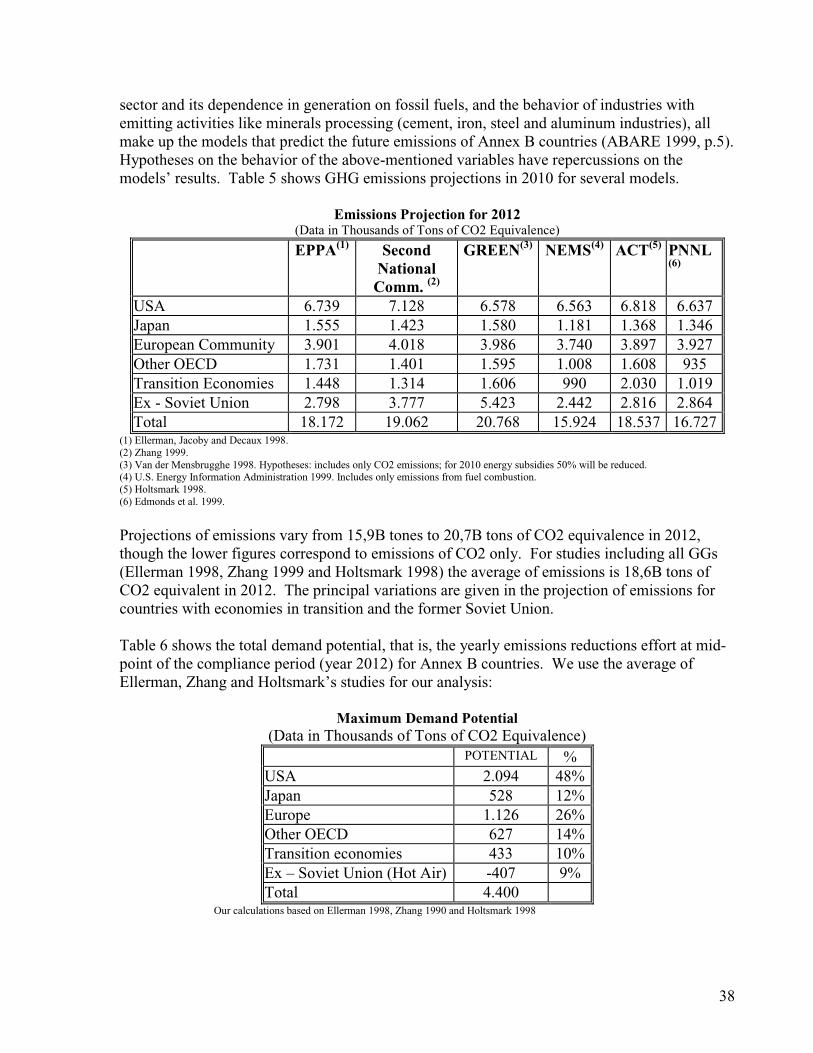
38
sector and its dependence in generation on fossil fuels, and the behavior of industries withemitting activities like minerals processing (cement, iron, steel and aluminum industries), allmake up the models that predict the future emissions of Annex B countries (ABARE 1999, p.5).Hypotheses on the behavior of the above-mentioned variables have repercussions on themodels’ results. Table 5 shows GHG emissions projections in 2010 for several models.
Emissions Projection for 2012(Data in Thousands of Tons of CO2 Equivalence)
EPPA(1) SecondNationalComm. (2)
GREEN(3) NEMS(4) ACT(5) PNNL(6)
USA 6.739 7.128 6.578 6.563 6.818 6.637Japan 1.555 1.423 1.580 1.181 1.368 1.346European Community 3.901 4.018 3.986 3.740 3.897 3.927Other OECD 1.731 1.401 1.595 1.008 1.608 935Transition Economies 1.448 1.314 1.606 990 2.030 1.019Ex - Soviet Union 2.798 3.777 5.423 2.442 2.816 2.864Total 18.172 19.062 20.768 15.924 18.537 16.727
(1) Ellerman, Jacoby and Decaux 1998.(2) Zhang 1999.(3) Van der Mensbrugghe 1998. Hypotheses: includes only CO2 emissions; for 2010 energy subsidies 50% will be reduced.(4) U.S. Energy Information Administration 1999. Includes only emissions from fuel combustion.(5) Holtsmark 1998.(6) Edmonds et al. 1999.
Projections of emissions vary from 15,9B tones to 20,7B tons of CO2 equivalence in 2012,though the lower figures correspond to emissions of CO2 only. For studies including all GGs(Ellerman 1998, Zhang 1999 and Holtsmark 1998) the average of emissions is 18,6B tons ofCO2 equivalent in 2012. The principal variations are given in the projection of emissions forcountries with economies in transition and the former Soviet Union.
Table 6 shows the total demand potential, that is, the yearly emissions reductions effort at mid-point of the compliance period (year 2012) for Annex B countries. We use the average ofEllerman, Zhang and Holtsmark’s studies for our analysis:
Maximum Demand Potential(Data in Thousands of Tons of CO2 Equivalence)
POTENTIAL %USA 2.094 48%Japan 528 12%Europe 1.126 26%Other OECD 627 14%Transition economies 433 10%Ex – Soviet Union (Hot Air) -407 9%Total 4.400
Our calculations based on Ellerman 1998, Zhang 1990 and Holtsmark 1998
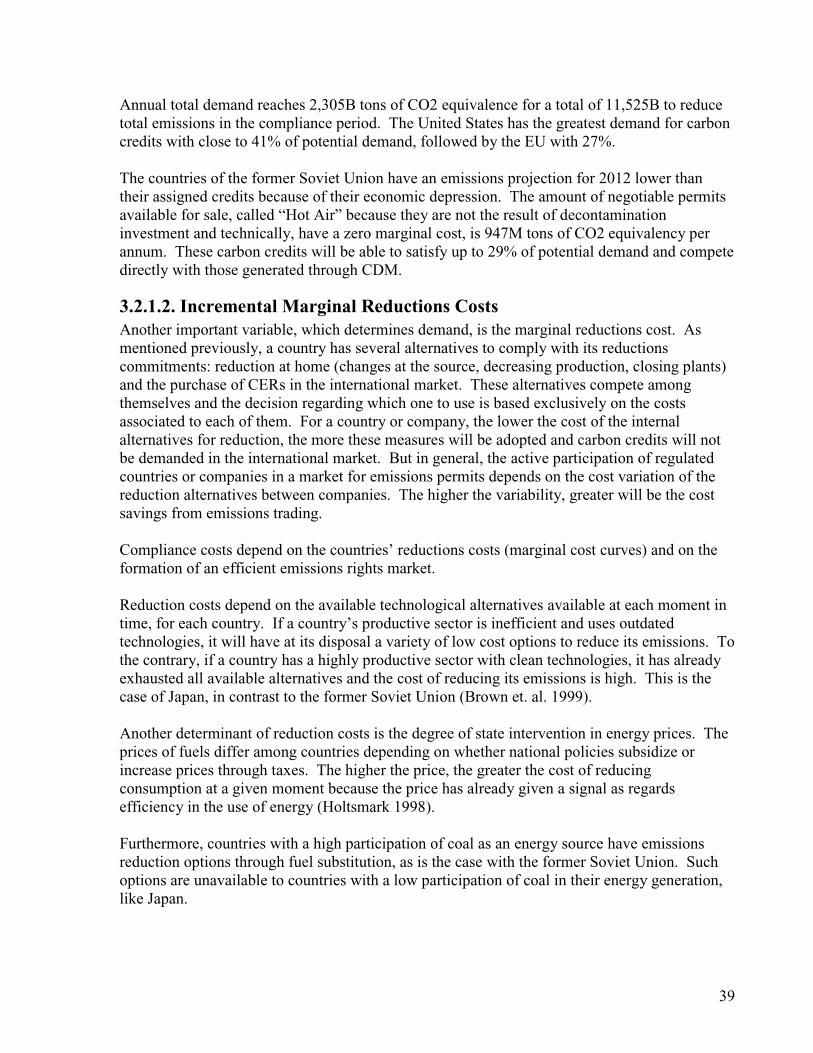
39
Annual total demand reaches 2,305B tons of CO2 equivalence for a total of 11,525B to reducetotal emissions in the compliance period. The United States has the greatest demand for carboncredits with close to 41% of potential demand, followed by the EU with 27%.
The countries of the former Soviet Union have an emissions projection for 2012 lower thantheir assigned credits because of their economic depression. The amount of negotiable permitsavailable for sale, called “Hot Air” because they are not the result of decontaminationinvestment and technically, have a zero marginal cost, is 947M tons of CO2 equivalency perannum. These carbon credits will be able to satisfy up to 29% of potential demand and competedirectly with those generated through CDM.
3.2.1.2. Incremental Marginal Reductions CostsAnother important variable, which determines demand, is the marginal reductions cost. Asmentioned previously, a country has several alternatives to comply with its reductionscommitments: reduction at home (changes at the source, decreasing production, closing plants)and the purchase of CERs in the international market. These alternatives compete amongthemselves and the decision regarding which one to use is based exclusively on the costsassociated to each of them. For a country or company, the lower the cost of the internalalternatives for reduction, the more these measures will be adopted and carbon credits will notbe demanded in the international market. But in general, the active participation of regulatedcountries or companies in a market for emissions permits depends on the cost variation of thereduction alternatives between companies. The higher the variability, greater will be the costsavings from emissions trading.
Compliance costs depend on the countries’ reductions costs (marginal cost curves) and on theformation of an efficient emissions rights market.
Reduction costs depend on the available technological alternatives available at each moment intime, for each country. If a country’s productive sector is inefficient and uses outdatedtechnologies, it will have at its disposal a variety of low cost options to reduce its emissions. Tothe contrary, if a country has a highly productive sector with clean technologies, it has alreadyexhausted all available alternatives and the cost of reducing its emissions is high. This is thecase of Japan, in contrast to the former Soviet Union (Brown et. al. 1999).
Another determinant of reduction costs is the degree of state intervention in energy prices. Theprices of fuels differ among countries depending on whether national policies subsidize orincrease prices through taxes. The higher the price, the greater the cost of reducingconsumption at a given moment because the price has already given a signal as regardsefficiency in the use of energy (Holtsmark 1998).
Furthermore, countries with a high participation of coal as an energy source have emissionsreduction options through fuel substitution, as is the case with the former Soviet Union. Suchoptions are unavailable to countries with a low participation of coal in their energy generation,like Japan.
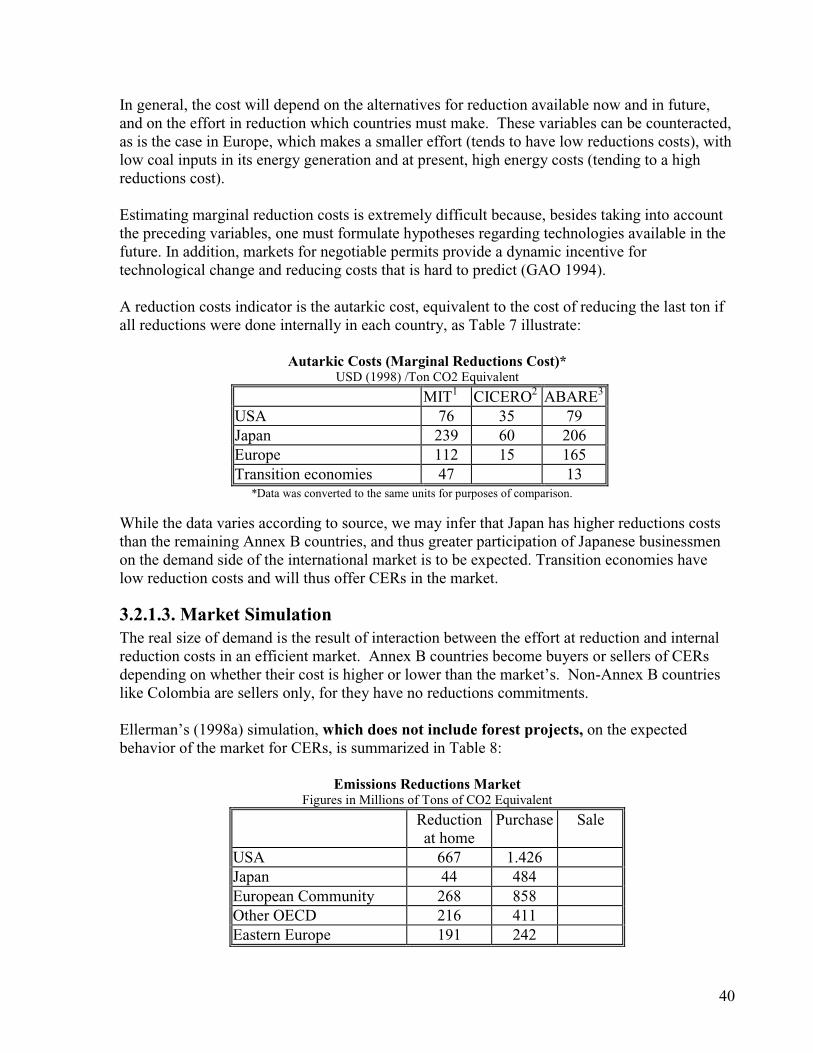
40
In general, the cost will depend on the alternatives for reduction available now and in future,and on the effort in reduction which countries must make. These variables can be counteracted,as is the case in Europe, which makes a smaller effort (tends to have low reductions costs), withlow coal inputs in its energy generation and at present, high energy costs (tending to a highreductions cost).
Estimating marginal reduction costs is extremely difficult because, besides taking into accountthe preceding variables, one must formulate hypotheses regarding technologies available in thefuture. In addition, markets for negotiable permits provide a dynamic incentive fortechnological change and reducing costs that is hard to predict (GAO 1994).
A reduction costs indicator is the autarkic cost, equivalent to the cost of reducing the last ton ifall reductions were done internally in each country, as Table 7 illustrate:
Autarkic Costs (Marginal Reductions Cost)*USD (1998) /Ton CO2 Equivalent
MIT1 CICERO2 ABARE3
USA 76 35 79Japan 239 60 206Europe 112 15 165Transition economies 47 13*Data was converted to the same units for purposes of comparison.
While the data varies according to source, we may infer that Japan has higher reductions coststhan the remaining Annex B countries, and thus greater participation of Japanese businessmenon the demand side of the international market is to be expected. Transition economies havelow reduction costs and will thus offer CERs in the market.
3.2.1.3. Market SimulationThe real size of demand is the result of interaction between the effort at reduction and internalreduction costs in an efficient market. Annex B countries become buyers or sellers of CERsdepending on whether their cost is higher or lower than the market’s. Non-Annex B countrieslike Colombia are sellers only, for they have no reductions commitments.
Ellerman’s (1998a) simulation, which does not include forest projects, on the expectedbehavior of the market for CERs, is summarized in Table 8:
Emissions Reductions MarketFigures in Millions of Tons of CO2 Equivalent
Reductionat home
Purchase Sale
USA 667 1.426Japan 44 484European Community 268 858Other OECD 216 411Eastern Europe 191 242
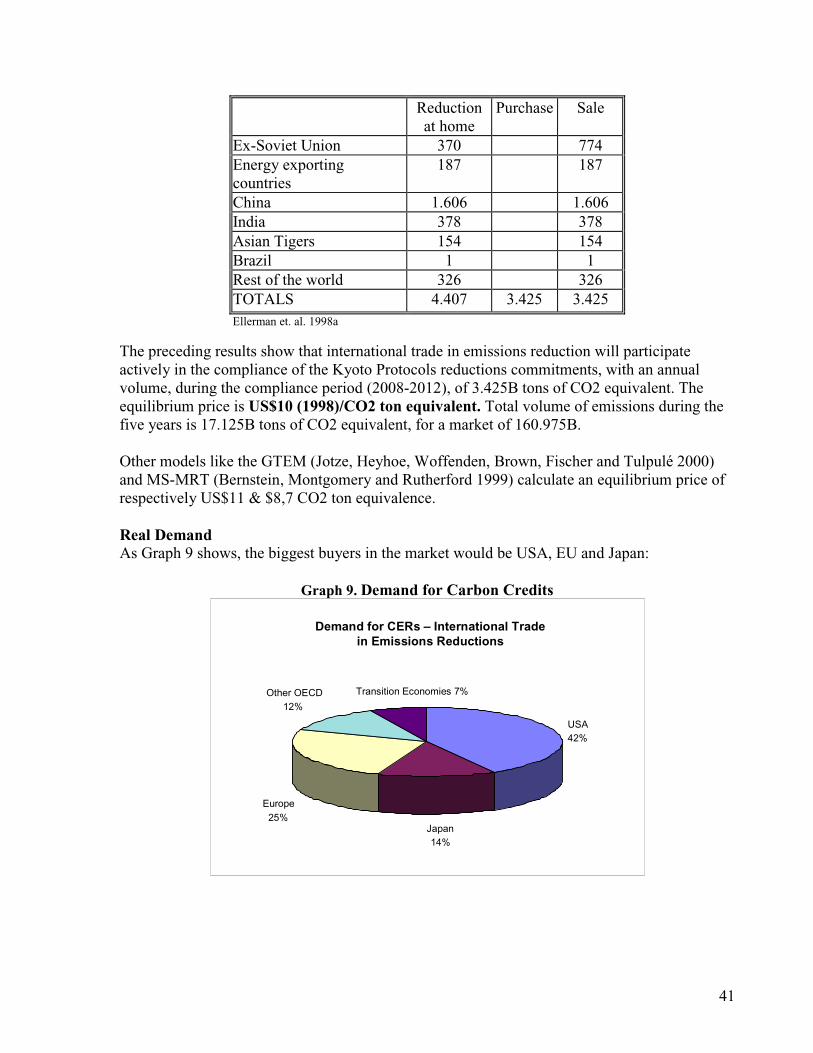
41
Reductionat home
Purchase Sale
Ex-Soviet Union 370 774Energy exportingcountries
187 187
China 1.606 1.606India 378 378Asian Tigers 154 154Brazil 1 1Rest of the world 326 326TOTALS 4.407 3.425 3.425Ellerman et. al. 1998a
The preceding results show that international trade in emissions reduction will participateactively in the compliance of the Kyoto Protocols reductions commitments, with an annualvolume, during the compliance period (2008-2012), of 3.425B tons of CO2 equivalent. Theequilibrium price is US$10 (1998)/CO2 ton equivalent. Total volume of emissions during thefive years is 17.125B tons of CO2 equivalent, for a market of 160.975B.
Other models like the GTEM (Jotze, Heyhoe, Woffenden, Brown, Fischer and Tulpulé 2000)and MS-MRT (Bernstein, Montgomery and Rutherford 1999) calculate an equilibrium price ofrespectively US$11 & $8,7 CO2 ton equivalence.
Real DemandAs Graph 9 shows, the biggest buyers in the market would be USA, EU and Japan:
Graph 9. Demand for Carbon Credits
USA42%
Japan14%
Europe25%
Other OECD12%
Transition Economies 7%
Demand for CERs – International Tradein Emissions Reductions
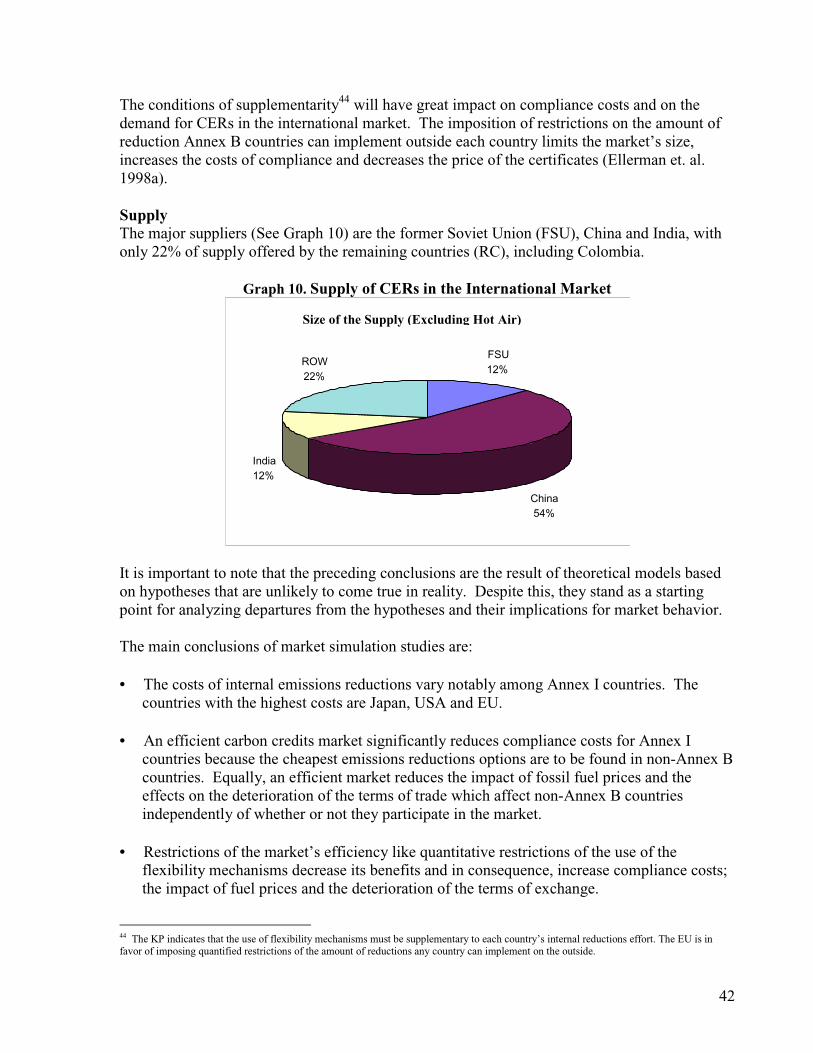
42
The conditions of supplementarity44 will have great impact on compliance costs and on thedemand for CERs in the international market. The imposition of restrictions on the amount ofreduction Annex B countries can implement outside each country limits the market’s size,increases the costs of compliance and decreases the price of the certificates (Ellerman et. al.1998a).
SupplyThe major suppliers (See Graph 10) are the former Soviet Union (FSU), China and India, withonly 22% of supply offered by the remaining countries (RC), including Colombia.
Graph 10. Supply of CERs in the International Market
Size of the Supply (Excluding Hot Air)
FSU12%
China54%
India12%
ROW22%
It is important to note that the preceding conclusions are the result of theoretical models basedon hypotheses that are unlikely to come true in reality. Despite this, they stand as a startingpoint for analyzing departures from the hypotheses and their implications for market behavior.
The main conclusions of market simulation studies are:
• The costs of internal emissions reductions vary notably among Annex I countries. Thecountries with the highest costs are Japan, USA and EU.
• An efficient carbon credits market significantly reduces compliance costs for Annex Icountries because the cheapest emissions reductions options are to be found in non-Annex Bcountries. Equally, an efficient market reduces the impact of fossil fuel prices and theeffects on the deterioration of the terms of trade which affect non-Annex B countriesindependently of whether or not they participate in the market.
• Restrictions of the market’s efficiency like quantitative restrictions of the use of theflexibility mechanisms decrease its benefits and in consequence, increase compliance costs;the impact of fuel prices and the deterioration of the terms of exchange.
44 The KP indicates that the use of flexibility mechanisms must be supplementary to each country’s internal reductions effort. The EU is infavor of imposing quantified restrictions of the amount of reductions any country can implement on the outside.
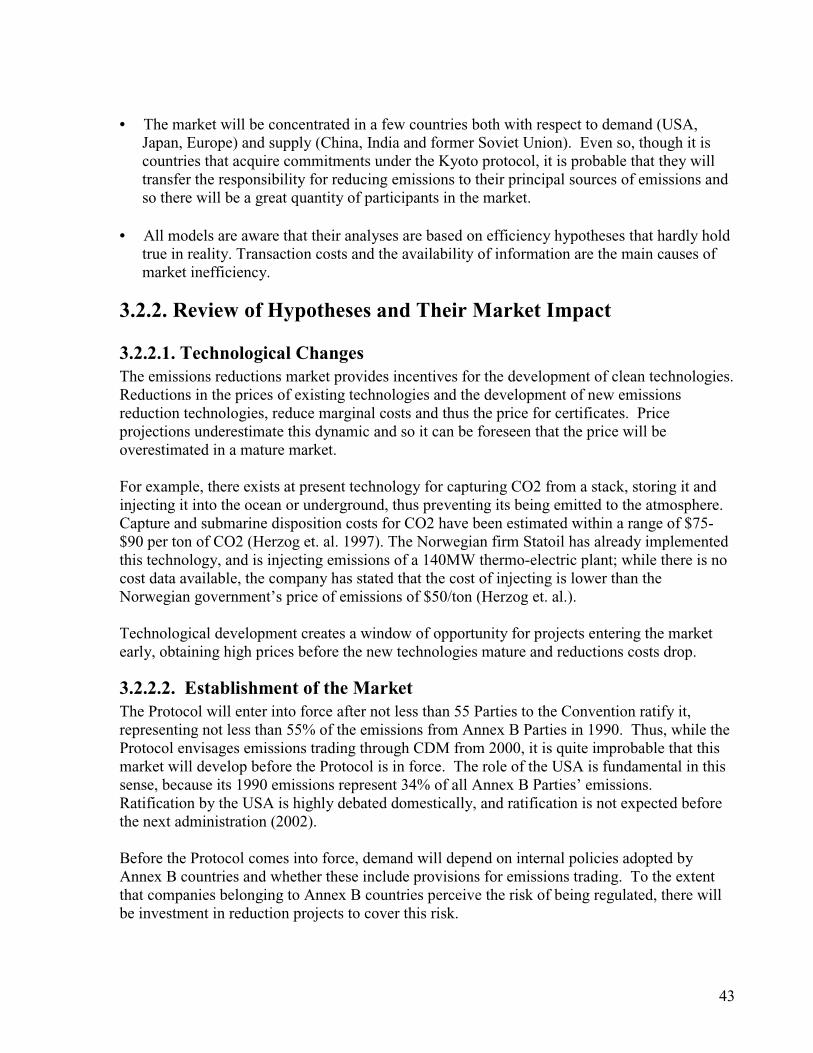
43
• The market will be concentrated in a few countries both with respect to demand (USA,Japan, Europe) and supply (China, India and former Soviet Union). Even so, though it iscountries that acquire commitments under the Kyoto protocol, it is probable that they willtransfer the responsibility for reducing emissions to their principal sources of emissions andso there will be a great quantity of participants in the market.
• All models are aware that their analyses are based on efficiency hypotheses that hardly holdtrue in reality. Transaction costs and the availability of information are the main causes ofmarket inefficiency.
3.2.2. Review of Hypotheses and Their Market Impact
3.2.2.1. Technological ChangesThe emissions reductions market provides incentives for the development of clean technologies.Reductions in the prices of existing technologies and the development of new emissionsreduction technologies, reduce marginal costs and thus the price for certificates. Priceprojections underestimate this dynamic and so it can be foreseen that the price will beoverestimated in a mature market.
For example, there exists at present technology for capturing CO2 from a stack, storing it andinjecting it into the ocean or underground, thus preventing its being emitted to the atmosphere.Capture and submarine disposition costs for CO2 have been estimated within a range of $75-$90 per ton of CO2 (Herzog et. al. 1997). The Norwegian firm Statoil has already implementedthis technology, and is injecting emissions of a 140MW thermo-electric plant; while there is nocost data available, the company has stated that the cost of injecting is lower than theNorwegian government’s price of emissions of $50/ton (Herzog et. al.).
Technological development creates a window of opportunity for projects entering the marketearly, obtaining high prices before the new technologies mature and reductions costs drop.
3.2.2.2. Establishment of the MarketThe Protocol will enter into force after not less than 55 Parties to the Convention ratify it,representing not less than 55% of the emissions from Annex B Parties in 1990. Thus, while theProtocol envisages emissions trading through CDM from 2000, it is quite improbable that thismarket will develop before the Protocol is in force. The role of the USA is fundamental in thissense, because its 1990 emissions represent 34% of all Annex B Parties’ emissions.Ratification by the USA is highly debated domestically, and ratification is not expected beforethe next administration (2002).
Before the Protocol comes into force, demand will depend on internal policies adopted byAnnex B countries and whether these include provisions for emissions trading. To the extentthat companies belonging to Annex B countries perceive the risk of being regulated, there willbe investment in reduction projects to cover this risk.
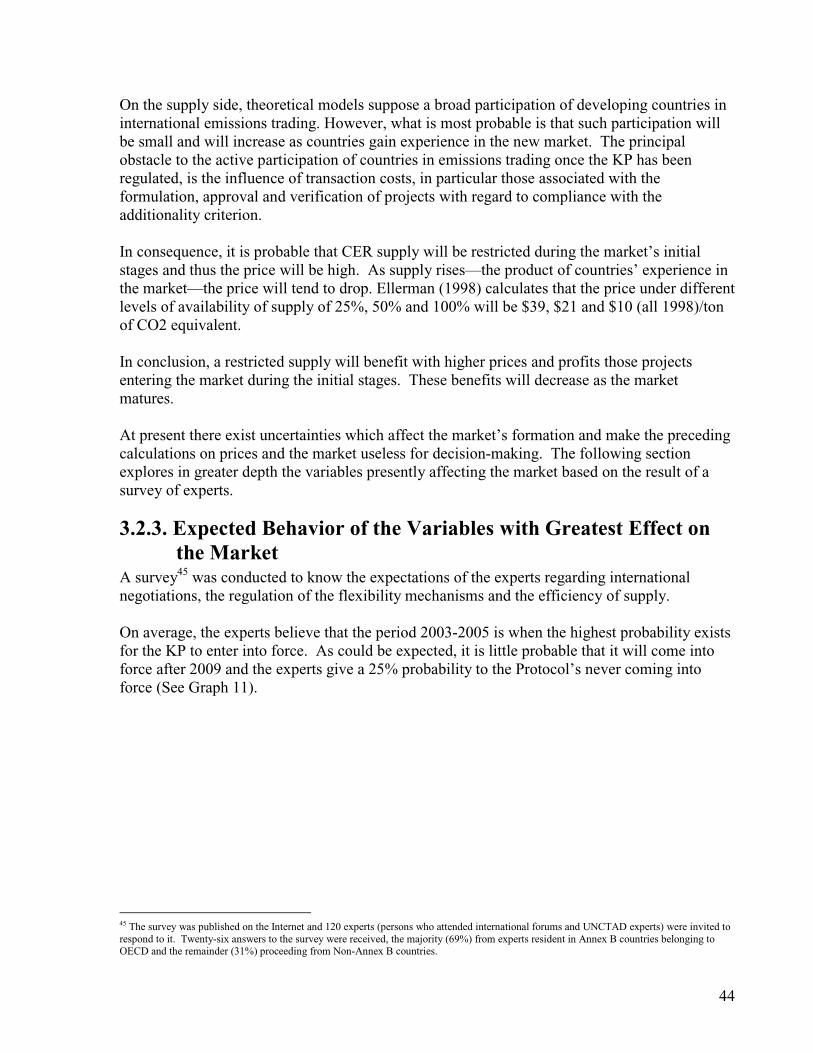
44
On the supply side, theoretical models suppose a broad participation of developing countries ininternational emissions trading. However, what is most probable is that such participation willbe small and will increase as countries gain experience in the new market. The principalobstacle to the active participation of countries in emissions trading once the KP has beenregulated, is the influence of transaction costs, in particular those associated with theformulation, approval and verification of projects with regard to compliance with theadditionality criterion.
In consequence, it is probable that CER supply will be restricted during the market’s initialstages and thus the price will be high. As supply rises—the product of countries’ experience inthe market—the price will tend to drop. Ellerman (1998) calculates that the price under differentlevels of availability of supply of 25%, 50% and 100% will be $39, $21 and $10 (all 1998)/tonof CO2 equivalent.
In conclusion, a restricted supply will benefit with higher prices and profits those projectsentering the market during the initial stages. These benefits will decrease as the marketmatures.
At present there exist uncertainties which affect the market’s formation and make the precedingcalculations on prices and the market useless for decision-making. The following sectionexplores in greater depth the variables presently affecting the market based on the result of asurvey of experts.
3.2.3. Expected Behavior of the Variables with Greatest Effect onthe Market
A survey45 was conducted to know the expectations of the experts regarding internationalnegotiations, the regulation of the flexibility mechanisms and the efficiency of supply.
On average, the experts believe that the period 2003-2005 is when the highest probability existsfor the KP to enter into force. As could be expected, it is little probable that it will come intoforce after 2009 and the experts give a 25% probability to the Protocol’s never coming intoforce (See Graph 11).
45 The survey was published on the Internet and 120 experts (persons who attended international forums and UNCTAD experts) were invited torespond to it. Twenty-six answers to the survey were received, the majority (69%) from experts resident in Annex B countries belonging toOECD and the remainder (31%) proceeding from Non-Annex B countries.
45
Graph 11. Entrance into Force of the Kyoto Protocol (Year and Probability).
Never2009 - Later2006 - 20082003 - 20052000-2002
Probability
50
40
30
20
10
0
Ratification on the part of the USA is more uncertain than the Protocol’s coming into force: theexperts give on average a 57% probability for the USA’s ratifying it. The most probable yearfor such ratification is 2004. Equally, it is expected that CDM will be regulated andimplemented by 2002.
The inclusion of forest projects in CDM is of particular interest for Colombia because thissector is among those having greatest potential. The experts consider that forest projects ingeneral have a good chance of being included in CDM. Reforestation and afforestation projectshave a greater probability than conservation projects. On the other hand, it is expected thatcredits proceeding from forest projects will not be equal to those proceeding from emissionsreduction projects, but that they will be discounted in some way (see Graph 12).
Graph 12. Expectations Regarding Forest ProjectsConservation Projects included inCDM
42,3%
57,7%
No
Yes
Reforestation Projects Included in CDM
15,4%
84,6%
No
Yes
In the survey, the experts were asked about certain aspects that guarantee the efficiency of theflexibility mechanisms like the free transferal of certificates to third parties and the inclusion of
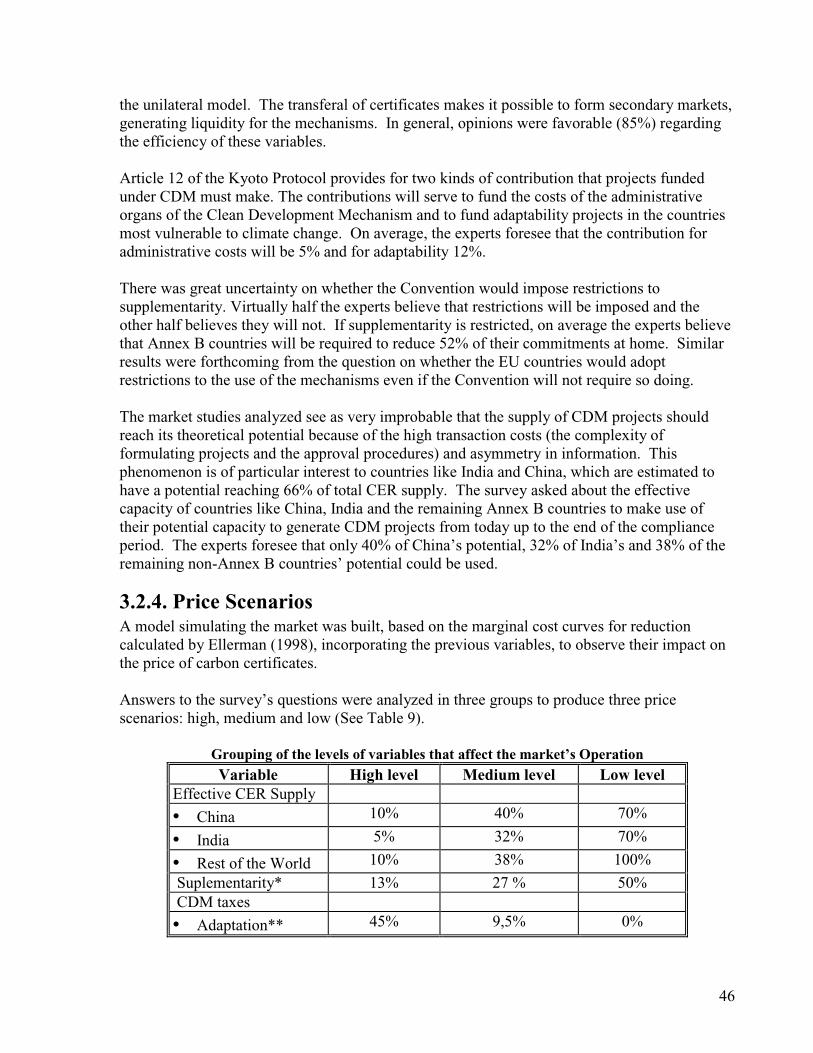
46
the unilateral model. The transferal of certificates makes it possible to form secondary markets,generating liquidity for the mechanisms. In general, opinions were favorable (85%) regardingthe efficiency of these variables.
Article 12 of the Kyoto Protocol provides for two kinds of contribution that projects fundedunder CDM must make. The contributions will serve to fund the costs of the administrativeorgans of the Clean Development Mechanism and to fund adaptability projects in the countriesmost vulnerable to climate change. On average, the experts foresee that the contribution foradministrative costs will be 5% and for adaptability 12%.
There was great uncertainty on whether the Convention would impose restrictions tosupplementarity. Virtually half the experts believe that restrictions will be imposed and theother half believes they will not. If supplementarity is restricted, on average the experts believethat Annex B countries will be required to reduce 52% of their commitments at home. Similarresults were forthcoming from the question on whether the EU countries would adoptrestrictions to the use of the mechanisms even if the Convention will not require so doing.
The market studies analyzed see as very improbable that the supply of CDM projects shouldreach its theoretical potential because of the high transaction costs (the complexity offormulating projects and the approval procedures) and asymmetry in information. Thisphenomenon is of particular interest to countries like India and China, which are estimated tohave a potential reaching 66% of total CER supply. The survey asked about the effectivecapacity of countries like China, India and the remaining Annex B countries to make use oftheir potential capacity to generate CDM projects from today up to the end of the complianceperiod. The experts foresee that only 40% of China’s potential, 32% of India’s and 38% of theremaining non-Annex B countries’ potential could be used.
3.2.4. Price ScenariosA model simulating the market was built, based on the marginal cost curves for reductioncalculated by Ellerman (1998), incorporating the previous variables, to observe their impact onthe price of carbon certificates.
Answers to the survey’s questions were analyzed in three groups to produce three pricescenarios: high, medium and low (See Table 9).
Grouping of the levels of variables that affect the market’s Operation
Variable High level Medium level Low levelEffective CER Supply
• China 10% 40% 70%
• India 5% 32% 70%
• Rest of the World 10% 38% 100%
Suplementarity* 13% 27 % 50%CDM taxes
• Adaptation** 45% 9,5% 0%
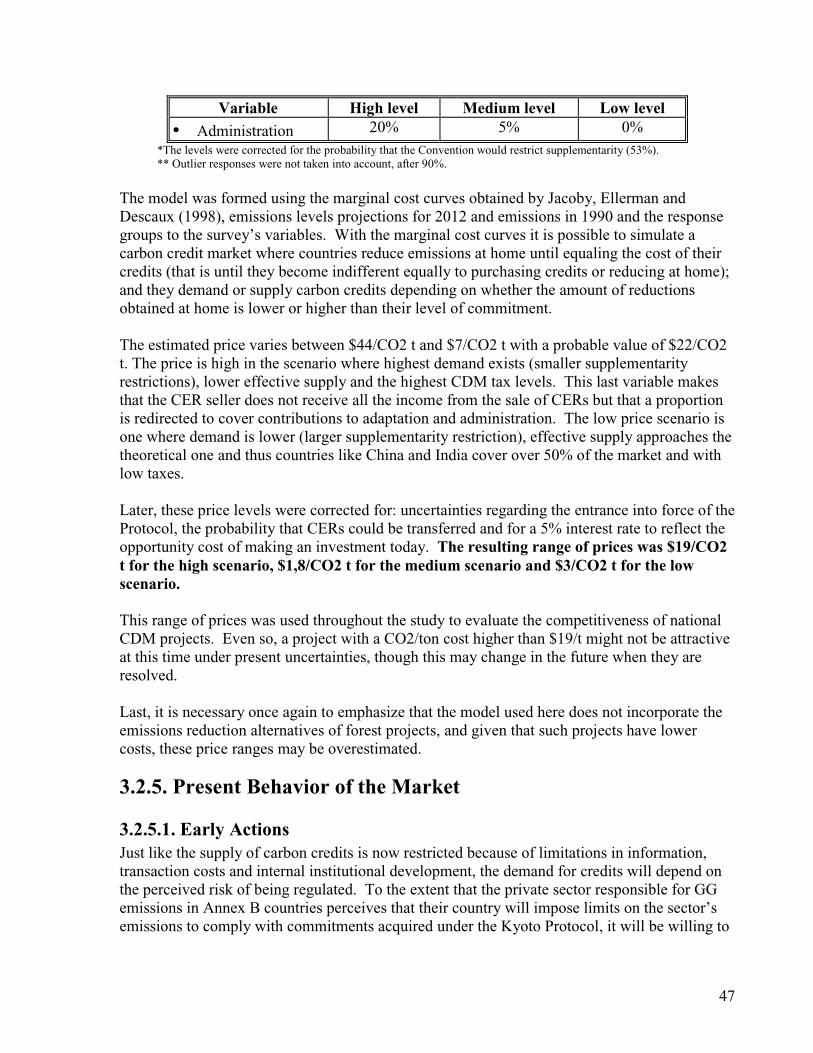
47
Variable High level Medium level Low level
• Administration 20% 5% 0%*The levels were corrected for the probability that the Convention would restrict supplementarity (53%).** Outlier responses were not taken into account, after 90%.
The model was formed using the marginal cost curves obtained by Jacoby, Ellerman andDescaux (1998), emissions levels projections for 2012 and emissions in 1990 and the responsegroups to the survey’s variables. With the marginal cost curves it is possible to simulate acarbon credit market where countries reduce emissions at home until equaling the cost of theircredits (that is until they become indifferent equally to purchasing credits or reducing at home);and they demand or supply carbon credits depending on whether the amount of reductionsobtained at home is lower or higher than their level of commitment.
The estimated price varies between $44/CO2 t and $7/CO2 t with a probable value of $22/CO2t. The price is high in the scenario where highest demand exists (smaller supplementarityrestrictions), lower effective supply and the highest CDM tax levels. This last variable makesthat the CER seller does not receive all the income from the sale of CERs but that a proportionis redirected to cover contributions to adaptation and administration. The low price scenario isone where demand is lower (larger supplementarity restriction), effective supply approaches thetheoretical one and thus countries like China and India cover over 50% of the market and withlow taxes.
Later, these price levels were corrected for: uncertainties regarding the entrance into force of theProtocol, the probability that CERs could be transferred and for a 5% interest rate to reflect theopportunity cost of making an investment today. The resulting range of prices was $19/CO2t for the high scenario, $1,8/CO2 t for the medium scenario and $3/CO2 t for the lowscenario.
This range of prices was used throughout the study to evaluate the competitiveness of nationalCDM projects. Even so, a project with a CO2/ton cost higher than $19/t might not be attractiveat this time under present uncertainties, though this may change in the future when they areresolved.
Last, it is necessary once again to emphasize that the model used here does not incorporate theemissions reduction alternatives of forest projects, and given that such projects have lowercosts, these price ranges may be overestimated.
3.2.5. Present Behavior of the Market
3.2.5.1. Early ActionsJust like the supply of carbon credits is now restricted because of limitations in information,transaction costs and internal institutional development, the demand for credits will depend onthe perceived risk of being regulated. To the extent that the private sector responsible for GGemissions in Annex B countries perceives that their country will impose limits on the sector’semissions to comply with commitments acquired under the Kyoto Protocol, it will be willing to
48
pay a premium to reduce risk; that is, companies will be willing to invest in JI or CDM projectsto meet their commitments.
Although the compliance period begins in 2008, countries will have to begin to take measuresinternally before this date because emissions reductions take time and capital if base line trendsare to be changed. To the extent that these countries advance in establishing these internalpolicies and that these include the use of flexibility mechanisms, the demand for carbon creditswill rise. In consequence, demand will proceed principally from those countries that areimplementing internal measures to assure their compliance with the Kyoto Protocol. At present,certain Annex b countries have advanced in the implementation of internal policies (earlyaction) to comply with KP commitments. Among the most common policies are taxing GGemissions (Italy, Norway, France), negotiable emissions permits (Denmark, Australia, EU),voluntary emissions reduction agreements and industrial standards. Certain of these policiesinclude the possible inclusion of the KP flexibility mechanisms.
3.2.5.2. Initial TransactionsTo date 114 projects have been approved46 under the pilot phase of the Jointly ImplementedActivities, from when the program began in April 1995. Most of the projects, 88%, areemissions reduction, while the remaining 12% are forest projects to capture or preventemissions.
Given the objective of this phase of the Jointly Implemented Activities, to explore instrumentsthat might help the Parties comply with the Convention’s emissions reduction goals efficiently,and that emissions reductions in such projects will not be of use in complying with theircommitments, the incentive to invest in these projects is not essentially economic but probablypolitical or for to improve their image. In consequence, the price or amount of the investmentin JIA projects is not related to the internal cost of reducing the investors’ emissions and is thusnot a good referent for future CDM projects.
On the other hand, despite present uncertainties regarding regulation and the entrance into forceof the Kyoto Protocol, projects whose principal interest lies in the credits they generate are atpresent being formulated and sold. Most transactions are done as futures and options. Atpresent there are brokers, business associations and funds interested in the carbon creditsmarket.
The brokers estimate that in 1990 there was about 40 transactions in emissions reductions, withaverage sizes of 50.000 to 100.000 tons of CO2 equivalence per year. Prices vary according tothe type of transaction (futures, purchase options, direct purchase) but on average pricesfluctuate between $1 and $3 per ton of CO2 equivalence. We foresee that this price range willhold until the KP regulatory and ratification uncertainties clear up.
3.3. ConclusionsThe study of the emerging carbon credits market’s behavior is important for Colombia becauseit offers information necessary for planning, executing and negotiating potential CDM projects,
46 This does not signify that they have all been executed.
49
and offers inputs for the design of state policies for training formulators, marketing projects,managing risks and participating in the negotiation process for regulating the flexibilitymechanisms. The present chapter’s main conclusions are:
• Proper regulation of the KP’s flexibility mechanisms can create an international carboncredits market. At present there are several models that simulate this market projecting aprice for carbon credits of (1998) $10/CO2 t.
• On the demand side, the main players will be the USA, Europe and Japan. Effectivedemand will depend on the capacity to create a clearly regulated environment for GGemissions reductions in each Annex B country, with regulations to include the use of theflexibility mechanisms.
• Main suppliers will be China, India and the Former Soviet Union. These countries couldaccount for 80% of the market; however, it can be foreseen that this potential will not bereached in the market’s early years of operation, and thus a window of opportunity exists,with better prices, for countries entering in the early stages. Equally, new technologies likeCO2 injection into the ocean and hydrogen-driven cars will reduce compliance costs and theprice for carbon credits, and thus argue in favor of a strategy to make the best use of themarket during its early stages (2002-2008).
• There still exist major uncertainties associated with the regulation and entrance into force ofthe KP, and the prices that are extant now ($1 to $3/CO2 ton) reflect these uncertainties.Expert opinion on this topic expects that the regulation of the flexibility mechanisms and theoperation of CDM will occur in 2002, and for the Protocol to come into force in 2003.When the uncertainties disappear, we might expect prices ranging from $7 to $44/CO2 t.
• The principal variables that will affect Colombia’s potential use of the Clean Developmentmechanism are: restrictions in supplementarity, non-inclusion of forest projects, restrictionson the transference of carbon credits to third parties and high adaptability and administrationtaxes in CDM. Restrictions on the market’s efficiency decrease its benefits, including thetransference of resources to clean development in developing countries, and increase theProtocol’s impact on fossil fuel prices. While the experts’ opinions foresee that themechanisms will be regulated efficiently, there remains great uncertainty regarding thesupplementarity variables and the inclusion of forest conservation projects.
50
4. Is Colombia Competitive in the International CERMarket?
4.1. The Forest sector: Potential Benefits andCompetitiveness
The basic objectives and expected results to determine the forest sector’s potential forcompetitiveness were:
• To formulate 10 projects for the initial set-up of a Colombian CDM forest portfolio• To identify the principal collateral benefits and needs for technology transfer associatedwith forest projects
• To extrapolate the results obtained from different studies on similar projects, to estimate thecountry’s CDM potential
• To estimate the carbon contents in the biomass in three project areas of the portfolio, usingsampling in the field.
The additional results of the study were: a) The development of discussion points regarding theadvisability of including forest projects in CDM, a contribution to the ongoing domestic andinternational discussion on this matter. This analysis was conducted using the knowledgegained from the experience of formulating the portfolio’s initial 10 projects; b) The preparationof specific MS Excel spreadsheets for the analysis of financial and environmental additionality;c) Support for the preparation of specific guidelines for formulating CDM forest projects; d)The preparation of a field protocol specifically for the National Strategy Study and theexecution of six additional field evaluations in as many project areas of the forest portfolio; ande) the organization of three data sets devised for forest project formulation, and using secondaryinformation.
In respect of the field exercises, it was noted that four of the evaluation results are contained inthe report while the remaining five will be added to the projects once the lab and technicalanalyses are ready.
4.1.1. Methodological BasesBecause the process of project identification and formulation is dynamic and requires continualfeedback among the formulation’s components before the final design is concluded, themethodology followed for constituting the final projects portfolio included a series ofmethodological components, which were not necessarily followed in the order in which theyappear below.
As a result of the Ministry of the Environment’s invitation to the participants in the TutorialProgram for the Formulation of CDM Projects, whose objective was to identify a portfolio of
51
suitable projects as regarded applicability and capacity to represent, a preliminary bank of ideasand profiles for CDM projects was generated. Using the criteria of coverage, capacity torepresent, and feasibility of formulation/execution, the ten proposals with the highest option ofbeing taken to the formulation level were selected. Once this initial portfolio was in place, asimilar methodological structure in all projects was followed, considering that any CDM projecthad to be the result of at least those components described below.
4.1.1.1. Identification of Direct Areas and Areas of InfluenceThrough continual interaction with the original local proponents of the selected projects, thenext step was to identify and measure the direct areas where the projects would beimplemented. The identification of lots was also accompanied with information on the size andlocation of the project areas.
Regarding the area of indirect influence, this was established after the base line analysis and theidentification of the social, environmental and economic contexts in regions where the projectcould have positive or negative impacts.
4.1.1.2. Base LineResearch on the base line proceeded with a view to establishing the social, environmental andeconomic contexts both of the project zone and its area of influence. As mentioned in thepreceding section, the base line helps to delimit the project’s area of influence, because itsdetermination includes an analysis of the different social, environmental and economicvariables that could possibly be impacted by the project’s activities. For all variables, there is adescription and a description and an analysis of its historical and present state.
The basic objective of the base line is to establish the carbon balance for the project area and itsarea of influence in the non-project scenario. To this end, the present carbon balance in the areawas identified using the matrixes of the carbon contained in a number of stocks (forestplantations, agricultural land, etc.) With regard to the projection of emissions, reductions and/orcarbon sequestration in the project, the threats and historical trends in the change of land use inareas covered with natural forests, the need for rehabilitation of the vegetable cover throughnatural vegetation regeneration, and the requirements of the local population involved inactivities with the potential to affect carbon emissions, were all evaluated.
The sources of information for establishing carbon quantities were for the most part secondary(that is, from an extensive review of the literature on carbon contents in biomass, primaryproductivity, soil absorption, etc.), but in equal or similar conditions to those of the projects.The information obtained from secondary sources for the present analysis, was placed inmatrixes showing changes in land use both for the project area and the areas of influence.These matrixes contain, in hectares, information on the present use of land and future use,foreseeable in light of threats to natural forests and historical trends in changes in land useTable 10).
Tabla 1.Tabla 2.Tabla 3.
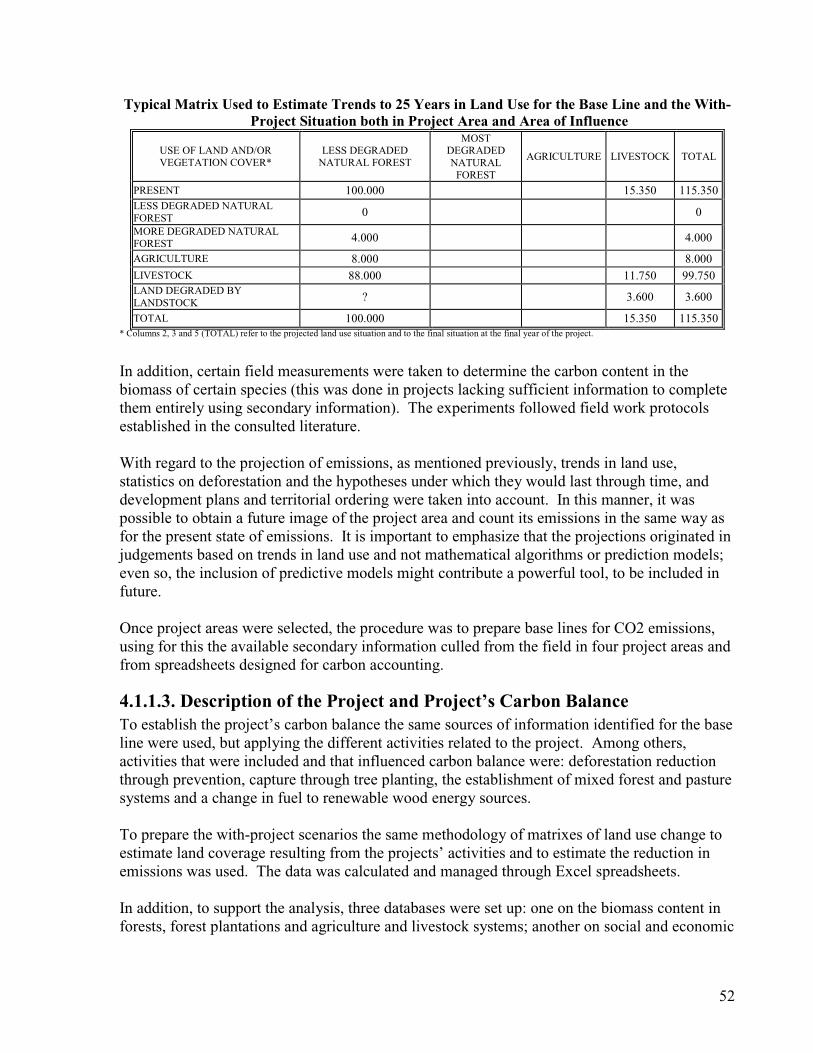
52
Typical Matrix Used to Estimate Trends to 25 Years in Land Use for the Base Line and the With-Project Situation both in Project Area and Area of Influence
USE OF LAND AND/ORVEGETATION COVER*
LESS DEGRADEDNATURAL FOREST
MOSTDEGRADEDNATURALFOREST
AGRICULTURE LIVESTOCK TOTAL
PRESENT 100.000 15.350 115.350LESS DEGRADED NATURALFOREST 0 0
MORE DEGRADED NATURALFOREST 4.000 4.000
AGRICULTURE 8.000 8.000LIVESTOCK 88.000 11.750 99.750LAND DEGRADED BYLANDSTOCK ? 3.600 3.600
TOTAL 100.000 15.350 115.350* Columns 2, 3 and 5 (TOTAL) refer to the projected land use situation and to the final situation at the final year of the project.
In addition, certain field measurements were taken to determine the carbon content in thebiomass of certain species (this was done in projects lacking sufficient information to completethem entirely using secondary information). The experiments followed field work protocolsestablished in the consulted literature.
With regard to the projection of emissions, as mentioned previously, trends in land use,statistics on deforestation and the hypotheses under which they would last through time, anddevelopment plans and territorial ordering were taken into account. In this manner, it waspossible to obtain a future image of the project area and count its emissions in the same way asfor the present state of emissions. It is important to emphasize that the projections originated injudgements based on trends in land use and not mathematical algorithms or prediction models;even so, the inclusion of predictive models might contribute a powerful tool, to be included infuture.
Once project areas were selected, the procedure was to prepare base lines for CO2 emissions,using for this the available secondary information culled from the field in four project areas andfrom spreadsheets designed for carbon accounting.
4.1.1.3. Description of the Project and Project’s Carbon BalanceTo establish the project’s carbon balance the same sources of information identified for the baseline were used, but applying the different activities related to the project. Among others,activities that were included and that influenced carbon balance were: deforestation reductionthrough prevention, capture through tree planting, the establishment of mixed forest and pasturesystems and a change in fuel to renewable wood energy sources.
To prepare the with-project scenarios the same methodology of matrixes of land use change toestimate land coverage resulting from the projects’ activities and to estimate the reduction inemissions was used. The data was calculated and managed through Excel spreadsheets.
In addition, to support the analysis, three databases were set up: one on the biomass content inforests, forest plantations and agriculture and livestock systems; another on social and economic
53
aspects at the municipal and departmental (state) levels and the third with information onchanges in land use for departments in different zones of the country.
4.1.1.4. AdditionalityThe additionality of the projects was evaluated from two points of view. From theenvironmental standpoint, it was verified that the present and future characteristics of land usewere different from those of the project. For this purpose, CO2 emissions in the with andwithout-project scenarios were compared, obtaining as proof that emissions in the with-projectscenarios were additional (that is, greater than those of the projected base line).
The proof of financial additionality served to support the hypothesis that the base line scenariowould remain if the benefits obtained from the sale of CERs were not present. Themethodology consisted of comparing the financial indicator Net Present Value (NPV) for thetwo scenarios, obtaining as a result a positive proof of additionality if the indicator for the baseline scenario were greater than the indicator for the project without the CER benefits.
Both forest conservation areas and areas for managing the forest’s natural regeneration andreforestation areas were selected in such a way as to make them additional to the effortsenvisaged in the National Plan for Forest Development and the Green Plan or other efforts andtrends in Colombia’s forest sector.
4.1.1.5. Leakage AnalysisThe design of the forest projects of the Colombian portfolio stemmed from several fundamentalpremises, from which the projects’ actions or activities derived, with the following objectives:a) To prevent risks, leakage or negative impacts; b) On the contrary, to insert positive benefitsor positive leakage in economic, environmental and social terms. Taken as a whole, the positiveimpacts are understood as collateral benefits for the case of the portfolio.
In this way, the study worked toward having the projects exhibit the least possibilities in termsof risk and negative leakage, something that has not only achieved but in fact surpassed,because the expectation is that there will be a good level of positive leakage, that is, ofspontaneous forest replications by rural producers in the projects’ areas of influence, causingCO2 capture that would not have occurred in the absence of the CDM projects introduced intothe areas of influence.
The estimate of risks and leakage was managed at two levels. The first was the risk analysisexecuted for investors, considering CDM projects in Colombia, presented in the chapter on riskin the present study. The second was when formulating the projects, which were conceived anddesigned around the satisfaction of the local population’s needs, appropriate technology transferand the basic features of CDM.
The identification of leakage was done through the use of an analytical matrix that included thepresent and potential state of land use. In this way, leakage was estimated comparing uses andimpacts on the zone of influence in the base line and in its future state. Those activities thatcould be displaced or promoted by the project’s presence were identified. Once these activities
54
were identified (land use change, production, etc.), possible carbon leakage (positive andnegative) was counted and a net value was calculated for it.
4.1.1.6. Collateral BenefitsDuring the formulation exercise, the local researchers and formulators identified and evaluatedthe collateral benefits of each project and the technology transfer requirements of each of them,and of the entire set of projects. To do a quantitative or qualitative characterization of collateralbenefits, they were ordered in light of the projects’ fundamental activities and the resultsexpected from such activities.
4.1.1.7. Net Carbon Balance of the ProjectThe project’s net balance was calculated taking into account reductions, emissions, capture,base line leakage and the with-project scenario. The values obtained from each activity andcomponent became inputs to spreadsheets to obtain the quantity of carbon that could potentiallybe transformed into CERs. The following equation established the project’s net carbon balance;it must be taken into account that for each specific project, it proved necessary to adapt certainof its components.
CER=TCA+TCR-L-BLCB
Where:
CER are certificates for emissions reduction generated by the projectTCA is total carbon absorbed by the project during its life cycleTCR is total carbon reduced by the project during its life cycleL is net leakage (positive and negative) generated by the project during its life cycleBLCB is the net carbon balance at present and projected for the base line
Estimating the Colombian forest CDM potential in the medium term was managed in a similarmanner to the preparation of a macro-project, with regard to the selection of areas economicallyand socially appropriate for hosting CDM projects in the medium term, and estimating theexpected CO2 balance. The competitiveness of the sector in the CDM market was analyzedbased on cost and income estimates of all the projects’ activities, financial analysis derived fromthe CDM context, and the cost per captured or reduced ton in the 10 projects. These analysesused data proceeding from secondary references, real primary information obtained in the field,and forest projects under way in the country.
4.1.1.8. Other ComponentsComplementary to those activities strictly related to carbon analysis and accounting in theprojects, an estimated cost/benefit analysis for with and without-project scenarios was done foreach of them. This analysis made it possible on one hand to test financial additionality and onthe other to calculate the cost per absorbed or reduced ton of CO2, and its consequences for theproject’s competitiveness.
Last, a program for verification, certification and monitoring, with specific methodologies foreach project was designed.
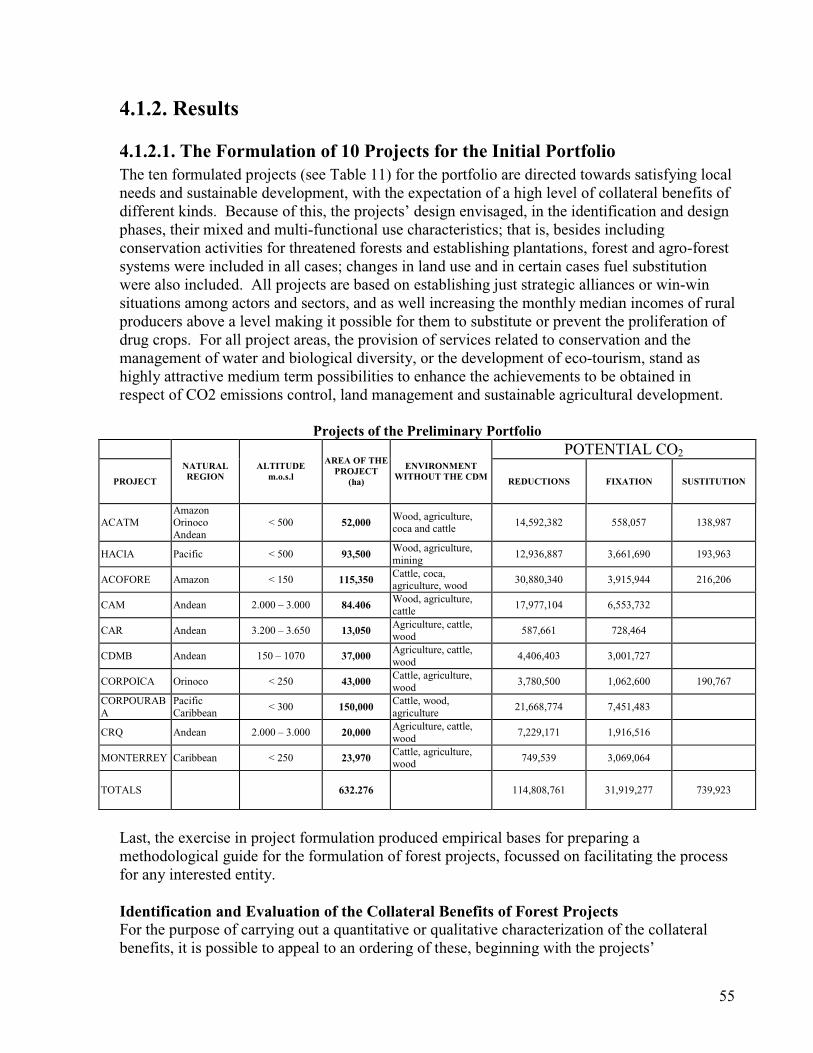
55
4.1.2. Results
4.1.2.1. The Formulation of 10 Projects for the Initial PortfolioThe ten formulated projects (see Table 11) for the portfolio are directed towards satisfying localneeds and sustainable development, with the expectation of a high level of collateral benefits ofdifferent kinds. Because of this, the projects’ design envisaged, in the identification and designphases, their mixed and multi-functional use characteristics; that is, besides includingconservation activities for threatened forests and establishing plantations, forest and agro-forestsystems were included in all cases; changes in land use and in certain cases fuel substitutionwere also included. All projects are based on establishing just strategic alliances or win-winsituations among actors and sectors, and as well increasing the monthly median incomes of ruralproducers above a level making it possible for them to substitute or prevent the proliferation ofdrug crops. For all project areas, the provision of services related to conservation and themanagement of water and biological diversity, or the development of eco-tourism, stand ashighly attractive medium term possibilities to enhance the achievements to be obtained inrespect of CO2 emissions control, land management and sustainable agricultural development.
Projects of the Preliminary PortfolioPOTENTIAL CO2
PROJECT
NATURALREGION
ALTITUDEm.o.s.l
AREA OF THEPROJECT
(ha)
ENVIRONMENTWITHOUT THE CDM REDUCTIONS FIXATION SUSTITUTION
ACATMAmazonOrinocoAndean
< 500 52,000Wood, agriculture,coca and cattle
14,592,382 558,057 138,987
HACIA Pacific < 500 93,500Wood, agriculture,mining
12,936,887 3,661,690 193,963
ACOFORE Amazon < 150 115,350Cattle, coca,agriculture, wood
30,880,340 3,915,944 216,206
CAM Andean 2.000 – 3.000 84.406Wood, agriculture,cattle
17,977,104 6,553,732
CAR Andean 3.200 – 3.650 13,050Agriculture, cattle,wood
587,661 728,464
CDMB Andean 150 – 1070 37,000Agriculture, cattle,wood
4,406,403 3,001,727
CORPOICA Orinoco < 250 43,000Cattle, agriculture,wood
3,780,500 1,062,600 190,767
CORPOURABA
PacificCaribbean
< 300 150,000Cattle, wood,agriculture
21,668,774 7,451,483
CRQ Andean 2.000 – 3.000 20,000Agriculture, cattle,wood
7,229,171 1,916,516
MONTERREY Caribbean < 250 23,970Cattle, agriculture,wood
749,539 3,069,064
TOTALS 632.276 114,808,761 31,919,277 739,923
Last, the exercise in project formulation produced empirical bases for preparing amethodological guide for the formulation of forest projects, focussed on facilitating the processfor any interested entity.
Identification and Evaluation of the Collateral Benefits of Forest ProjectsFor the purpose of carrying out a quantitative or qualitative characterization of the collateralbenefits, it is possible to appeal to an ordering of these, beginning with the projects’
56
fundamental activities and the results expected from these activities. The design of theColombian portfolio’s forest projects started from several premises, from which stemmedproject actions or activities to prevent leakage or negative impacts and to the contrary, promotepositive impacts or leakage at the local level. The set of positive impacts and their respectiveactions can be interpreted as collateral benefits in each project, also related to the region’ssustainable development.
The eight premises taken as bases for the projects’ design to prevent leakage or negativeimpacts were as follows:
First: The solution of the rural producer’s economic problems is necessary before he canparticipate in solving other social and environmental problems.
That is, the starting point is to obtain an improvement in the monthly median income of ruralproducers and induce the slow accumulation of capital in their hands. This capital will berepresented in the real valuation of land and natural resources like forest cover, soil, water andbiodiversity.
Second: Colombian forest CDM projects must be mixed to be able to increase real rural laborexpenditure, deal with interrelated problems and be able to achieve a balance between costsper ton of CO2 fixed or reduced and the creation of real situations of sustainable development.
In addition to the economic benefits resulting from carbon reduction or absorption, which bythemselves could not offer sufficient incentive to promote the projects, it is important toconsider that other economic activities included in the projects could increase the income theprojects generate. In addition, high costs could make the projects lose their competitiveness,creating a disincentive for their implementation.
Through the combination of two or more options for fixation/reduction, it is possible to obtainprices which are competitive and attractive through time, and that produce significant increasesin local income and meet various of the challenges of sustainable development. Because of this,all the projects in the portfolio combine reforestation with the conservation of threatened forestsand some of them also envisage emissions reduction through changing or improving the use ofenergy resources.
Third: The reconversion of on-the-range cattle operations or those on hillsides or itinerantones is necessary, urgent and no longer deferrable, instead, the trend must favor systems thatare more profitable, generate more employment and are in harmony with the management ofthe environment and natural resources.
Such reconversion implies the adoption and establishment of forest, agro-forest and mixedforest and pasture systems on forest lands that were deforested historically for theimplementation of agricultural and livestock systems. The argument behind this premise is thaton-the-range cattle production systems, or those on hillsides or the itinerant ones, and mostespecially, cattle on the range, are in great measure responsible not only for GHG emissionsproblems, but also for the monopolization of land, rural impoverishment, the migration and
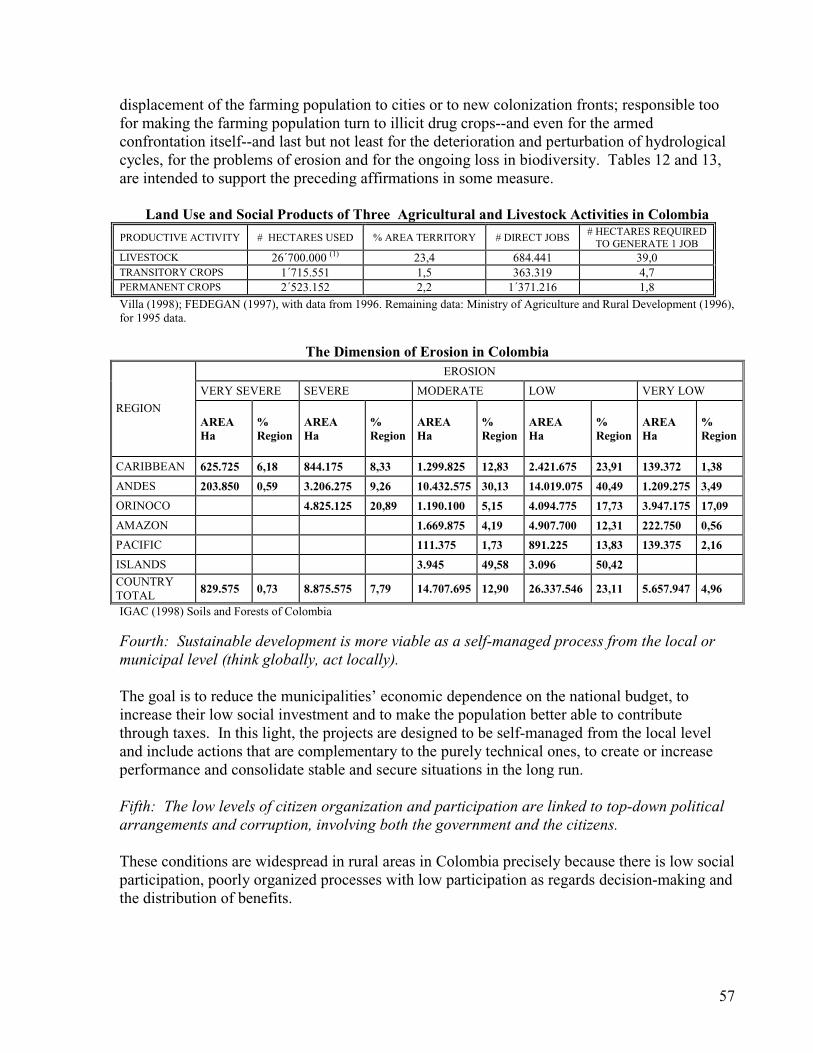
57
displacement of the farming population to cities or to new colonization fronts; responsible toofor making the farming population turn to illicit drug crops--and even for the armedconfrontation itself--and last but not least for the deterioration and perturbation of hydrologicalcycles, for the problems of erosion and for the ongoing loss in biodiversity. Tables 12 and 13,are intended to support the preceding affirmations in some measure.
Land Use and Social Products of Three Agricultural and Livestock Activities in Colombia
PRODUCTIVE ACTIVITY # HECTARES USED % AREA TERRITORY # DIRECT JOBS# HECTARES REQUIREDTO GENERATE 1 JOB
LIVESTOCK 26´700.000 (1) 23,4 684.441 39,0TRANSITORY CROPS 1´715.551 1,5 363.319 4,7PERMANENT CROPS 2´523.152 2,2 1´371.216 1,8
Villa (1998); FEDEGAN (1997), with data from 1996. Remaining data: Ministry of Agriculture and Rural Development (1996),for 1995 data.
The Dimension of Erosion in ColombiaEROSION
VERY SEVERE SEVERE MODERATE LOW VERY LOW
REGIONAREAHa
%Region
AREAHa
%Region
AREAHa
%Region
AREAHa
%Region
AREAHa
%Region
CARIBBEAN 625.725 6,18 844.175 8,33 1.299.825 12,83 2.421.675 23,91 139.372 1,38
ANDES 203.850 0,59 3.206.275 9,26 10.432.575 30,13 14.019.075 40,49 1.209.275 3,49
ORINOCO 4.825.125 20,89 1.190.100 5,15 4.094.775 17,73 3.947.175 17,09
AMAZON 1.669.875 4,19 4.907.700 12,31 222.750 0,56
PACIFIC 111.375 1,73 891.225 13,83 139.375 2,16
ISLANDS 3.945 49,58 3.096 50,42COUNTRYTOTAL 829.575 0,73 8.875.575 7,79 14.707.695 12,90 26.337.546 23,11 5.657.947 4,96
IGAC (1998) Soils and Forests of Colombia
Fourth: Sustainable development is more viable as a self-managed process from the local ormunicipal level (think globally, act locally).
The goal is to reduce the municipalities’ economic dependence on the national budget, toincrease their low social investment and to make the population better able to contributethrough taxes. In this light, the projects are designed to be self-managed from the local leveland include actions that are complementary to the purely technical ones, to create or increaseperformance and consolidate stable and secure situations in the long run.
Fifth: The low levels of citizen organization and participation are linked to top-down politicalarrangements and corruption, involving both the government and the citizens.
These conditions are widespread in rural areas in Colombia precisely because there is low socialparticipation, poorly organized processes with low participation as regards decision-making andthe distribution of benefits.
58
To counter all this, in the projects, administration and management will be democratic, andtransparent in handling information.
Sixth: The traditional management of fossil fuel energy is not competitive in distant ruralareas. Producing energy from biomass transforms raw materials, adds value, generatesemployment and inserts competitive agricultural and animal products into new markets--alladditional to the carbon reductions.
In remote areas, a key energy item is transporting raw materials or transformed products. Atpresent, the commerce of agricultural and animal products in the project areas is made up ofperishables, heavy products or those with a high water content with high transportation costcomponents, as opposed to the case with light manufactured durables with marginal or lowtransportation cost components. But it is only possible to produce these latter products in ruralareas (excluded from the electrical grid) using forest biomass-generated power, achieving CDMcomplementarity, and investing resources in locally produced fuels that do not need to be“imported” from other outlying areas. Besides, to grow forests on agricultural land to generatebiomass-based power offers rural producers a ready market and higher average income; usingforage-type species that fix nitrogen and grow rapidly will improve the land.
Seventh: The transfer of simple, proven and available technologies that can be made availablein project areas is indispensable to ensure their self-sufficiency, opening the way to sustainabledevelopment.
Training and horizontal technology transfers with rural producers are necessary if the projects’experiences are to be replicated. To the extent that training increases, extant productive, socialand political systems undergo a transition toward more profitable, efficient and effectivesituations.
Eighth: CDM forest projects are complements to the national peace process and also representa viable route in drug crop substitution.
In Colombia a peace process is under way which will have very positive results in the very shortrun. The potential of CDM projects in Colombia is very high, but an environment ofcoexistence and security to not discourage investment is required, leading also to active CDMparticipation for forest projects. The CDM supports peace because when rural income rises,social instability and violence drop.
The arguments of the first, second and eighth premises make it likely that the farmingpopulation, in the event that its substantive benefits increase--as a result of internalizing thebenefits of greenhouse gases reductions and of appropriate land and resource use in anenvironment of peaceful coexistence--will feel encouraged to voluntarily desist from growingillicit crops (see Graph 13).
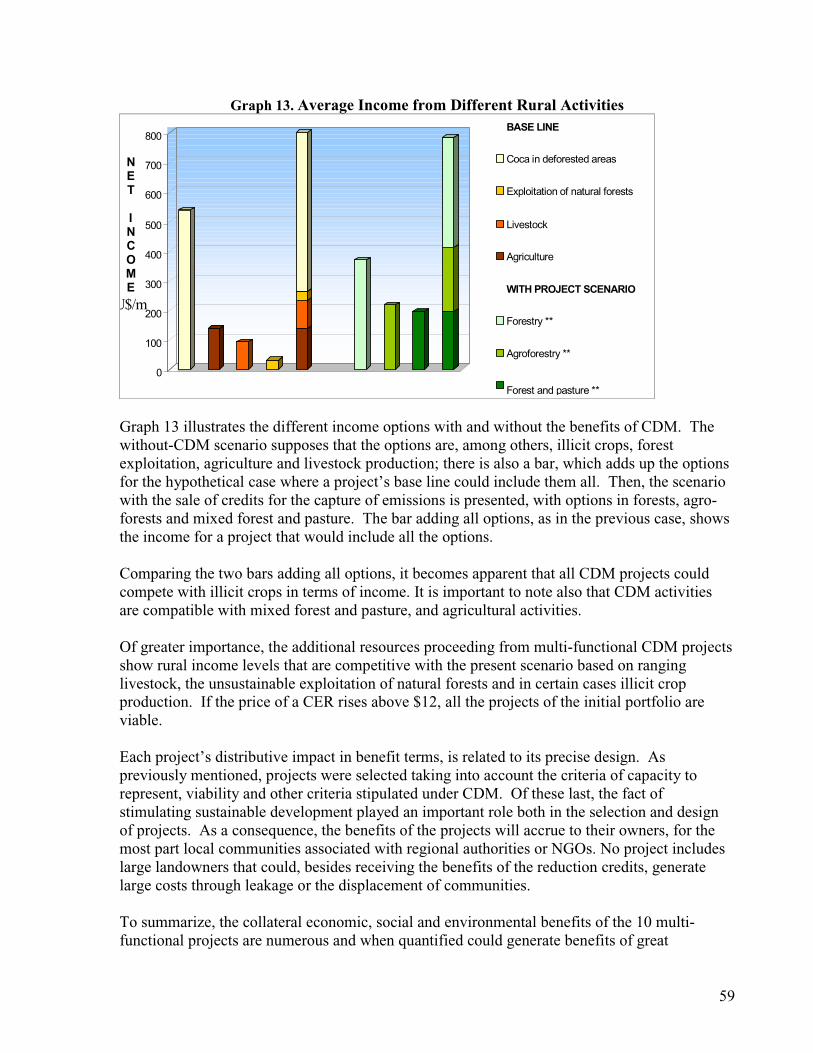
59
Graph 13. Average Income from Different Rural Activities
0
100
200
300
400
500
600
700
800
NET
INCOME
U$/m
BASE LINE
Coca in deforested areas
Exploitation of natural forests
Livestock
Agriculture
WITH PROJECT SCENARIO
Forestry **
Agroforestry **
Forest and pasture **
Graph 13 illustrates the different income options with and without the benefits of CDM. Thewithout-CDM scenario supposes that the options are, among others, illicit crops, forestexploitation, agriculture and livestock production; there is also a bar, which adds up the optionsfor the hypothetical case where a project’s base line could include them all. Then, the scenariowith the sale of credits for the capture of emissions is presented, with options in forests, agro-forests and mixed forest and pasture. The bar adding all options, as in the previous case, showsthe income for a project that would include all the options.
Comparing the two bars adding all options, it becomes apparent that all CDM projects couldcompete with illicit crops in terms of income. It is important to note also that CDM activitiesare compatible with mixed forest and pasture, and agricultural activities.
Of greater importance, the additional resources proceeding from multi-functional CDM projectsshow rural income levels that are competitive with the present scenario based on ranginglivestock, the unsustainable exploitation of natural forests and in certain cases illicit cropproduction. If the price of a CER rises above $12, all the projects of the initial portfolio areviable.
Each project’s distributive impact in benefit terms, is related to its precise design. Aspreviously mentioned, projects were selected taking into account the criteria of capacity torepresent, viability and other criteria stipulated under CDM. Of these last, the fact ofstimulating sustainable development played an important role both in the selection and designof projects. As a consequence, the benefits of the projects will accrue to their owners, for themost part local communities associated with regional authorities or NGOs. No project includeslarge landowners that could, besides receiving the benefits of the reduction credits, generatelarge costs through leakage or the displacement of communities.
To summarize, the collateral economic, social and environmental benefits of the 10 multi-functional projects are numerous and when quantified could generate benefits of great
60
importance for producers, regions, the country and the international community. These benefitsinclude:
• Sustainable management of genetic, biotic and ecosystem resources.• Prospecting for and incorporating valuable genetic resources to agricultural and animalproducts.
• Controlling soil erosion.• Increasing water supplies and making them sustainable.• Permanent availability of drinking water.• Decreasing pressures on natural resources.• Decreasing ranging livestock operations and itinerant agriculture.• Decreasing migration and displacement in the farming population.• Countering poverty by improving median monthly rural income and capital formation.• Increasing social investment in municipalities.• Decreasing the armed confrontation and violence in rural areas.• Providing continuous power, with better quality and lower tariffs.• Strengthening the local trade balance.• Creating new productive units/diversifying rural production.• Opening new markets and positioning agricultural and animal products on local andinternational markets.
• Developing social organization and citizen participation.
Analysis of the technology transfer requirement for the projects of the CDM forestportfolio
The main activities that are contemplated by the forestry project portfolio can be grouped asfollows:
• Activities related with the sustainable management of forests and of the natural regenerationof the vegetation (including the management of biodiversity, water, soils and emissions)
• Activities related with the establishment of plantations and the management of associatednatural resources (as in the previous case) and including organic or ecological agriculturaland livestock activities.
• Production, harvesting, transportation, storage and conversion of biological fuels (lumberand oils) for electrical generation; exploitation of other wood and non-wood products
• Marketing and quality control of products and services, especially wood• Managing waste from electrical generation (ashes, water and steam)• Monitoring and certification for emissions and for sustainable products• Territorial ordering and zoning of productive units• Manufacture and use of efficient wood stoves.
For nearly all the activities involved in the development of the projects, the appropriate localcapacity for transferring technology exists. Even so, the production and use of biological fuels,the transformation of certain products, certification and marketing all require external supportand cooperation.
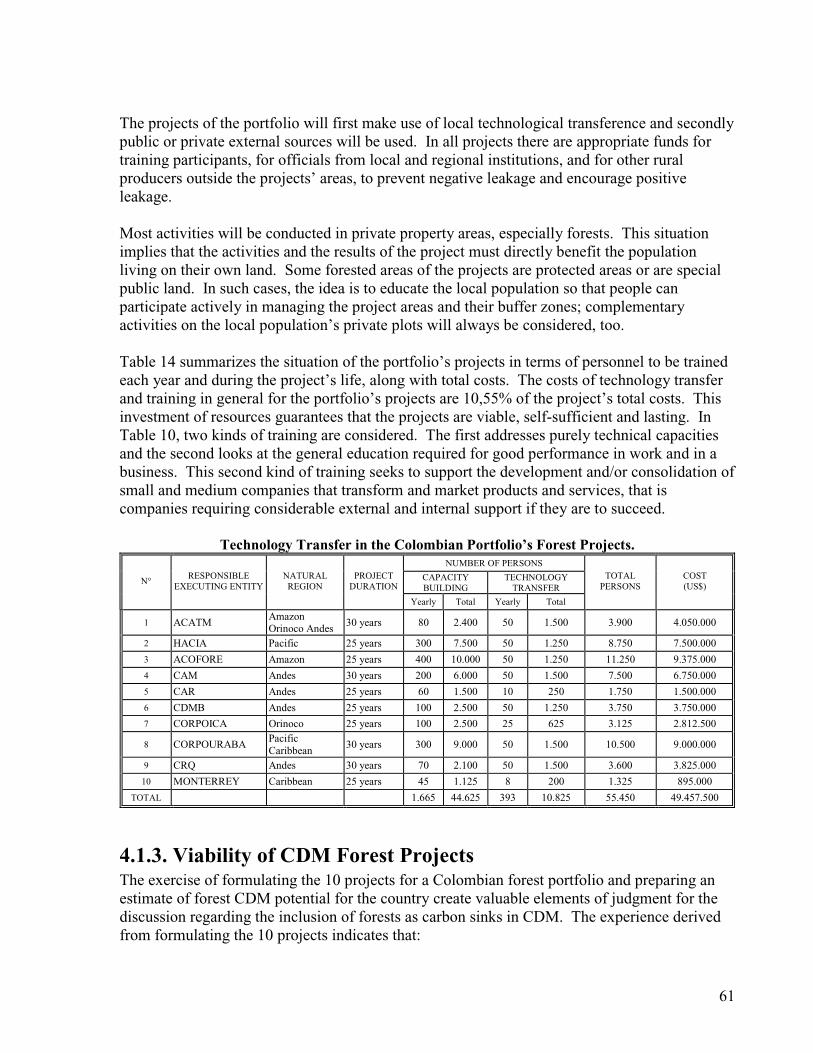
61
The projects of the portfolio will first make use of local technological transference and secondlypublic or private external sources will be used. In all projects there are appropriate funds fortraining participants, for officials from local and regional institutions, and for other ruralproducers outside the projects’ areas, to prevent negative leakage and encourage positiveleakage.
Most activities will be conducted in private property areas, especially forests. This situationimplies that the activities and the results of the project must directly benefit the populationliving on their own land. Some forested areas of the projects are protected areas or are specialpublic land. In such cases, the idea is to educate the local population so that people canparticipate actively in managing the project areas and their buffer zones; complementaryactivities on the local population’s private plots will always be considered, too.
Table 14 summarizes the situation of the portfolio’s projects in terms of personnel to be trainedeach year and during the project’s life, along with total costs. The costs of technology transferand training in general for the portfolio’s projects are 10,55% of the project’s total costs. Thisinvestment of resources guarantees that the projects are viable, self-sufficient and lasting. InTable 10, two kinds of training are considered. The first addresses purely technical capacitiesand the second looks at the general education required for good performance in work and in abusiness. This second kind of training seeks to support the development and/or consolidation ofsmall and medium companies that transform and market products and services, that iscompanies requiring considerable external and internal support if they are to succeed.
Technology Transfer in the Colombian Portfolio’s Forest Projects.NUMBER OF PERSONS
CAPACITYBUILDING
TECHNOLOGYTRANSFER
N°RESPONSIBLE
EXECUTING ENTITYNATURALREGION
PROJECTDURATION
Yearly Total Yearly Total
TOTALPERSONS
COST(US$)
1 ACATMAmazonOrinoco Andes
30 years 80 2.400 50 1.500 3.900 4.050.000
2 HACIA Pacific 25 years 300 7.500 50 1.250 8.750 7.500.000
3 ACOFORE Amazon 25 years 400 10.000 50 1.250 11.250 9.375.000
4 CAM Andes 30 years 200 6.000 50 1.500 7.500 6.750.000
5 CAR Andes 25 years 60 1.500 10 250 1.750 1.500.000
6 CDMB Andes 25 years 100 2.500 50 1.250 3.750 3.750.000
7 CORPOICA Orinoco 25 years 100 2.500 25 625 3.125 2.812.500
8 CORPOURABAPacificCaribbean
30 years 300 9.000 50 1.500 10.500 9.000.000
9 CRQ Andes 30 years 70 2.100 50 1.500 3.600 3.825.000
10 MONTERREY Caribbean 25 years 45 1.125 8 200 1.325 895.000
TOTAL 1.665 44.625 393 10.825 55.450 49.457.500
4.1.3. Viability of CDM Forest ProjectsThe exercise of formulating the 10 projects for a Colombian forest portfolio and preparing anestimate of forest CDM potential for the country create valuable elements of judgment for thediscussion regarding the inclusion of forests as carbon sinks in CDM. The experience derivedfrom formulating the 10 projects indicates that:
62
(a) It is possible to manage the most delicate technical aspects of base line preparation,additionality, leakage and follow-up and monitoring of the projects’ general performance;
(b) Positive leakage is more probable than negative leakage. The expectation of positiveleakage has 2 causes: first, the rural producers’ manifest and enthusiastic reception ofprojects that include forest activities and some appropriate technology transfer. Second,because the estimates of the projects’ impacts on median monthly income are higher thanthe rural producers’ expectations. In the general terms, rural producers have struggled toobtain income equal to 2 minimum wages, i.e. $125. With the projects, income graduallybegins to rise in a sustainable and stable manner up to 4 or 5 minimum wages, thanks to themulti-functional use of land for products and services, conservation and the sustainable useof all local natural resources.
(c) Mixed projects offer a greater guarantee of proper management than simple conservation orreforestation projects because of the balance between cost, income and collateral benefits.
(d) The inclusion of activities related to technological change in power generation, using fossilfuels based on biomass grown on areas previously degraded by-on-the-range livestockproduction, itinerant or hillside production, is economically viable with CDM resources;
(e) The inclusion in CDM of conservation projects for forests under threat permits not only top-down adaptation measures but also mutual reinforcement and durability for forests andplantations, positive leakage to the projects’ areas of influence and the estimate of the mostappropriate conservation/plantation ratios. In the case of the portfolio, the case is that anapproximate ratio of 4:1 between conservation and plantation makes it possible to lower theprojects’ costs with no detriment to development or the final CO2 balance;
(f) The expected collateral benefits point to solid and durable sustainable developmentbalanced with the provision of the service and the costs of reducing, fixing or substitutingemissions.
As previously noted, the portfolio’s projects and potential CDM benefits were considered underthe premise that in Colombia there is a peace process under way which will generate positiveand lasting results before too long, creating the appropriate social, political and economicenvironment for the execution of forest CDM projects throughout the country. In this sense, itmust be noted that risk analysis must take into account the additionality and permanence ofcarbon sinks.
4.1.4. The Competitiveness of Agriculture and Forestry in thePotential CER Market
The competitiveness of mixed agriculture and forestry in CDM projects is derived from therelation of the per ton cost of capturing and reducing 1 ton, to the international CER price. Ourmarket analysis shows an expected price range for a CER between $3 and $19. Themethodology used in the analysis of the sample of 10 forest projects, in different regions andconditions of the country, showed the cost per reduced ton in each project:
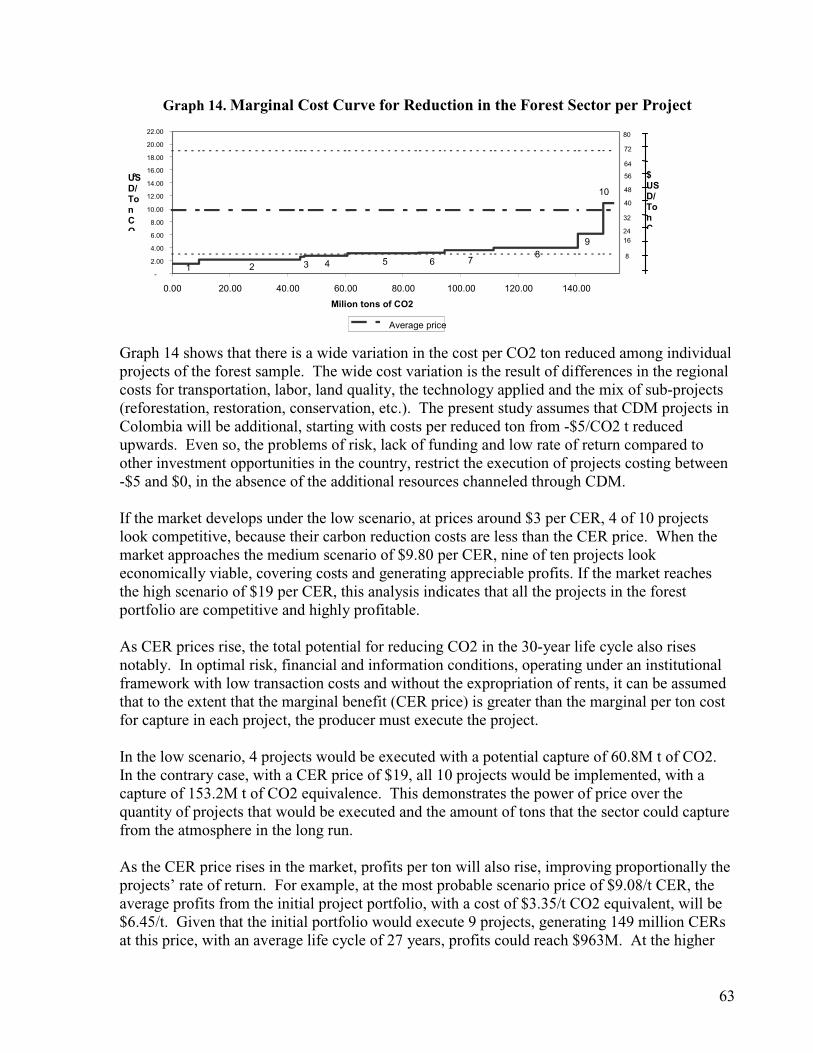
63
Graph 14. Marginal Cost Curve for Reduction in the Forest Sector per Project
-
2.00
4.00
6.00
8.00
10.00
12.00
14.00
16.00
18.00
20.00
22.00
0.00 20.00 40.00 60.00 80.00 100.00 120.00 140.00
Milion tons of CO2
USD/TonCO
2
Average price
1 2 3 4 5 6 78
9
10
$USD/TonC
32
40
48
56
64
72
16
8
24
80
Graph 14 shows that there is a wide variation in the cost per CO2 ton reduced among individualprojects of the forest sample. The wide cost variation is the result of differences in the regionalcosts for transportation, labor, land quality, the technology applied and the mix of sub-projects(reforestation, restoration, conservation, etc.). The present study assumes that CDM projects inColombia will be additional, starting with costs per reduced ton from -$5/CO2 t reducedupwards. Even so, the problems of risk, lack of funding and low rate of return compared toother investment opportunities in the country, restrict the execution of projects costing between-$5 and $0, in the absence of the additional resources channeled through CDM.
If the market develops under the low scenario, at prices around $3 per CER, 4 of 10 projectslook competitive, because their carbon reduction costs are less than the CER price. When themarket approaches the medium scenario of $9.80 per CER, nine of ten projects lookeconomically viable, covering costs and generating appreciable profits. If the market reachesthe high scenario of $19 per CER, this analysis indicates that all the projects in the forestportfolio are competitive and highly profitable.
As CER prices rise, the total potential for reducing CO2 in the 30-year life cycle also risesnotably. In optimal risk, financial and information conditions, operating under an institutionalframework with low transaction costs and without the expropriation of rents, it can be assumedthat to the extent that the marginal benefit (CER price) is greater than the marginal per ton costfor capture in each project, the producer must execute the project.
In the low scenario, 4 projects would be executed with a potential capture of 60.8M t of CO2.In the contrary case, with a CER price of $19, all 10 projects would be implemented, with acapture of 153.2M t of CO2 equivalence. This demonstrates the power of price over thequantity of projects that would be executed and the amount of tons that the sector could capturefrom the atmosphere in the long run.
As the CER price rises in the market, profits per ton will also rise, improving proportionally theprojects’ rate of return. For example, at the most probable scenario price of $9.08/t CER, theaverage profits from the initial project portfolio, with a cost of $3.35/t CO2 equivalent, will be$6.45/t. Given that the initial portfolio would execute 9 projects, generating 149 million CERsat this price, with an average life cycle of 27 years, profits could reach $963M. At the higher
64
scenario price of $19/CER, profits per ton rise to $15.65/t CO2 captured and the number ofcaptured tons to 153 million, for a total profit of $2.398M.47 Even discounted with the highdiscount rates required to operate in Colombia, if a robust CDM market develops, CDMpromises to change the market for forest investment in the country.
Even so, it is fundamentally important to note that risk conditions, finance, information andinstitutions are not optimal in Colombia. All the previous parameters change considerablywhen present conditions are taken into account. Chapters 6 and 7 of the present study analyzethese restrictions and propose alternatives for improving them.
4.1.5. “Green Coal”: A Comparative Advantage for Colombia
As the previous section indicates, the high competitiveness of the agricultural and forestrysector is derived from two elements: natural advantages and a process of rigorous formulationthat optimizes the advantages and opportunities of individual cases. Besides high rainfall andsunlight, Colombia also has much fertile land that is at present used in a sub-optimal manner.Seen from the CDM perspective, there is much room for forest projects in the country, beforethe costs of their competing with other uses rises.
This makes it possible to affirm that a green coal export market could be one of the mostcompetitive in the market. Analyzing purchasing preferences for mineral coal on the part ofNorth American thermo-electrical companies, four characteristics can be noted in the coal theyare willing to purchase: 1) high energy efficiency; 2) low sulfur content, to minimize theirsulfur dioxide emissions and comply with domestic regulations; 3) reliability in fulfilling theirorders in the long term; and 4) competitive CIF price48.
As the chapter on markets indicates, several industrialized countries are beginning to developinternal policies to control their CO2 emissions. In the short run, the companies will have toreduce their CO2 emissions or compensate them with Trading Rights or CERs obtained fromdeveloping countries. As this study indicates, the lowest cost compliance option is the last one.
For mineral coal exporters in Colombia, here is the opportunity to increase market share fortheir coal in the US market: they can sell a grade of coal which complies with the preferredcharacteristics, adding CERs produced through their new forest plantations in Colombia,required to compensate for part of the greenhouse gas emissions (the regulatory reduction willnot be for the total of emissions: it will cover only a percentage).
Economic analysis of the prototype forest portfolio shows that the generation of CERs byoffering “green coal” is an efficient option for mineral coal exporters. Of the projects, 90%generate low-cost CERs. Colombia is closer to the US market than its competitors, thus it haslower transportation costs. Colombian producers are more adept at managing risk, haveestablished financial arrangements and operate effectively within the Colombian institutional
47 These calculations are based on the want of the projects discounted at 7%. This is the real average interest ratein Colombia during the 90s.48 Interview with Edison Electric Institute, the US electrical producers’ association.
65
framework. Though coal companies must still effect detailed economic and financial analyses,the present study holds that Colombia could be in an advantageous position for placing mineralcoal on the US market along with the CERs required to compensate for the associatedemissions.
If coal exporters take this path, the environmental and social benefits for the country will besubstantial, and the good will these companies could generate could be significant both in thecountry and internationally. All the collateral benefits identified in the preceding section wouldapply to large areas of Colombia, including the most important one: the contribution to ruralwelfare, with its implications for the domestic peace process.
66
4.2. The Electricity Generation Sector: Potential Benefitsand Competitiveness
In the development of the present analysis for determining the economic potential of GHGemissions reduction in the Colombian thermo-electrical sector, we identified and evaluatedthose projects which, because of their cost and technology development and transfercharacteristics, are considered the most suitable for CDM development.
The Ministry of Mines and Energy’s Planning Unit (UPME) document on the expansion planfor generation/transmission for the period 1998-2010 was the main source of information forstructuring this chapter. The following aspects were also taken into account: environmentalfactors for locating electric generation and transmission projects, operations costs,environmental performance, in particular GHG gas emissions resulting from the expansionstrategies analyzed. The base line calculations for the thermo-electrical sector was based onpower demand projections for Colombia and the expansion plan, to which we applied theemissions factors of the IPCC for each GHG.
4.2.1. The Generation StrategiesTo calculate the emissions base line without CDM we used the combination of the CP-1 andLP-5 strategies of the Expansion Plan for generation and transmission 1998-2010, published byUPME this year. Given that UPME’s planning is purely indicative, the strategies are equallyprobable.
Given the drop in demand during 1998 and 199949, se chose the short run alternative implying asmaller capacity coming on line until 2003 from projects under construction or about to bedefined, according to the UPME’s promoters’ records.
In the short run, 332MW will enter the gas-powered system, 168MW the coal-powered systemand 1108MW hydraulic, from EMCALI and P.B. 4 in 1999, Termo Centro 3 and Urra in 2000,Porce 2 in 2001 andMiel 1 in 2003. With these projects, the national generation system willhave in 2003 an installed capacity of 13,654MW.
The base line is the most intensive in coal in the long run. This is so for the following reasons:
It offers the highest fuel diversity for long run generation. While UPME’s planning isindicative, the State has not lost all its influence on the electrical sector. The National EnergyPlan establishes as policy the diversification of energy technology in all of the links of thechain.
49 This exercise was accomplished with demand projections from mid-1999. Due to the country’s present economicdownturn, demand fell sharply in the first semester. Even so, in the long run the projections are expected to bevalid, as also the results of the plan and of the present exercise.
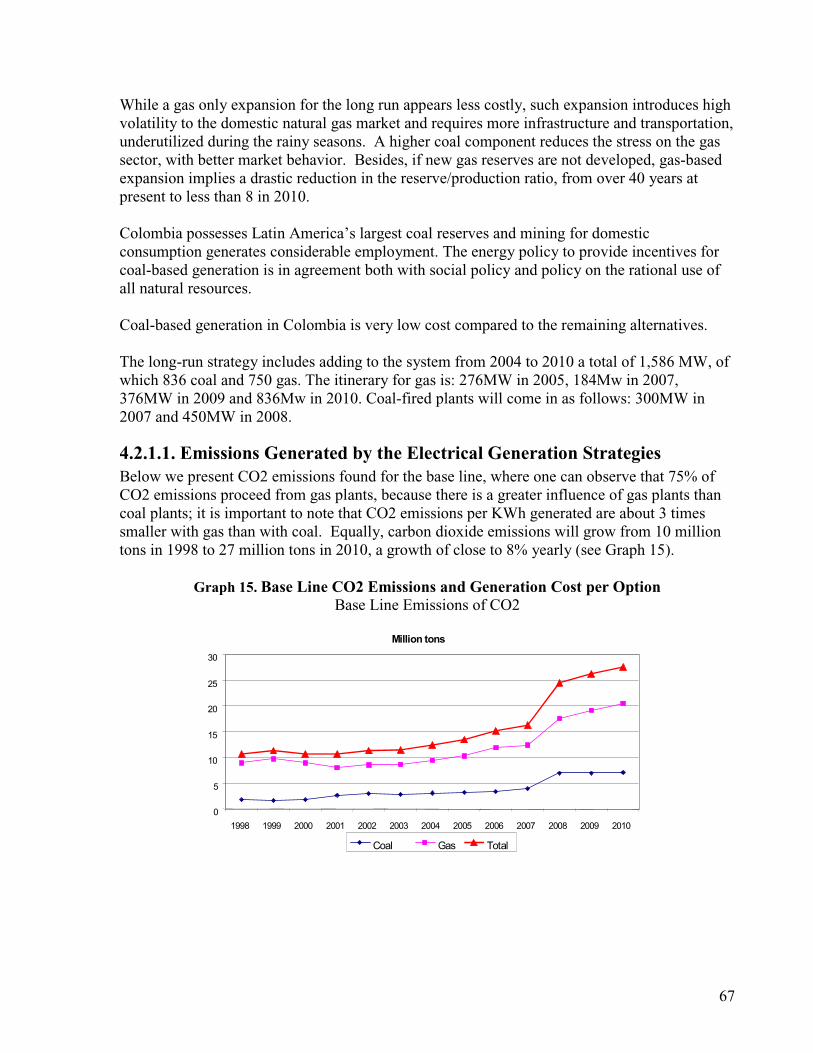
67
While a gas only expansion for the long run appears less costly, such expansion introduces highvolatility to the domestic natural gas market and requires more infrastructure and transportation,underutilized during the rainy seasons. A higher coal component reduces the stress on the gassector, with better market behavior. Besides, if new gas reserves are not developed, gas-basedexpansion implies a drastic reduction in the reserve/production ratio, from over 40 years atpresent to less than 8 in 2010.
Colombia possesses Latin America’s largest coal reserves and mining for domesticconsumption generates considerable employment. The energy policy to provide incentives forcoal-based generation is in agreement both with social policy and policy on the rational use ofall natural resources.
Coal-based generation in Colombia is very low cost compared to the remaining alternatives.
The long-run strategy includes adding to the system from 2004 to 2010 a total of 1,586 MW, ofwhich 836 coal and 750 gas. The itinerary for gas is: 276MW in 2005, 184Mw in 2007,376MW in 2009 and 836Mw in 2010. Coal-fired plants will come in as follows: 300MW in2007 and 450MW in 2008.
4.2.1.1. Emissions Generated by the Electrical Generation StrategiesBelow we present CO2 emissions found for the base line, where one can observe that 75% ofCO2 emissions proceed from gas plants, because there is a greater influence of gas plants thancoal plants; it is important to note that CO2 emissions per KWh generated are about 3 timessmaller with gas than with coal. Equally, carbon dioxide emissions will grow from 10 milliontons in 1998 to 27 million tons in 2010, a growth of close to 8% yearly (see Graph 15).
Graph 15. Base Line CO2 Emissions and Generation Cost per OptionBase Line Emissions of CO2
0
5
10
15
20
25
30
1998 1999 2000 2001 2002 2003 2004 2005 2006 2007 2008 2009 2010
Million tons
Coal Gas Total
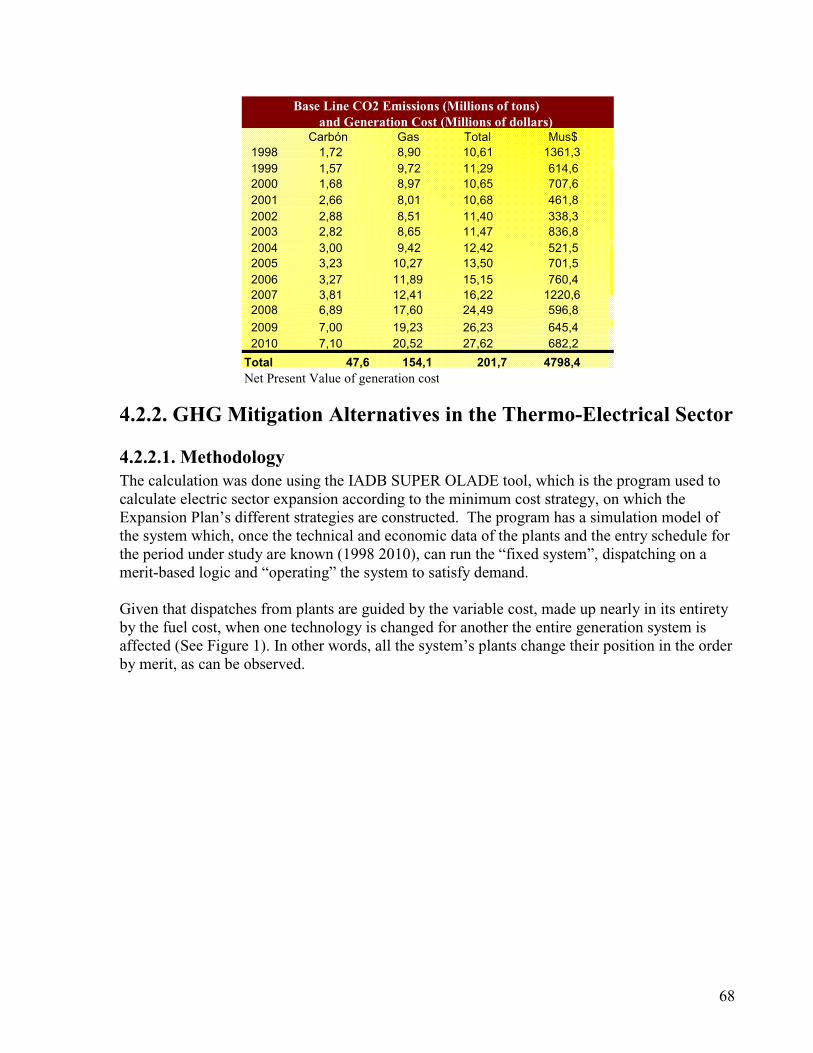
68
Base Line CO2 Emissions (Millions of tons)and Generation Cost (Millions of dollars)
Carbón Gas Total Mus$1998 1,72 8,90 10,61 1361,31999 1,57 9,72 11,29 614,62000 1,68 8,97 10,65 707,62001 2,66 8,01 10,68 461,82002 2,88 8,51 11,40 338,32003 2,82 8,65 11,47 836,82004 3,00 9,42 12,42 521,52005 3,23 10,27 13,50 701,52006 3,27 11,89 15,15 760,42007 3,81 12,41 16,22 1220,62008 6,89 17,60 24,49 596,82009 7,00 19,23 26,23 645,42010 7,10 20,52 27,62 682,2
Total 47,6 154,1 201,7 4798,4Net Present Value of generation cost
4.2.2. GHGMitigation Alternatives in the Thermo-Electrical Sector
4.2.2.1. MethodologyThe calculation was done using the IADB SUPER OLADE tool, which is the program used tocalculate electric sector expansion according to the minimum cost strategy, on which theExpansion Plan’s different strategies are constructed. The program has a simulation model ofthe system which, once the technical and economic data of the plants and the entry schedule forthe period under study are known (1998 2010), can run the “fixed system”, dispatching on amerit-based logic and “operating” the system to satisfy demand.
Given that dispatches from plants are guided by the variable cost, made up nearly in its entiretyby the fuel cost, when one technology is changed for another the entire generation system isaffected (See Figure 1). In other words, all the system’s plants change their position in the orderby merit, as can be observed.
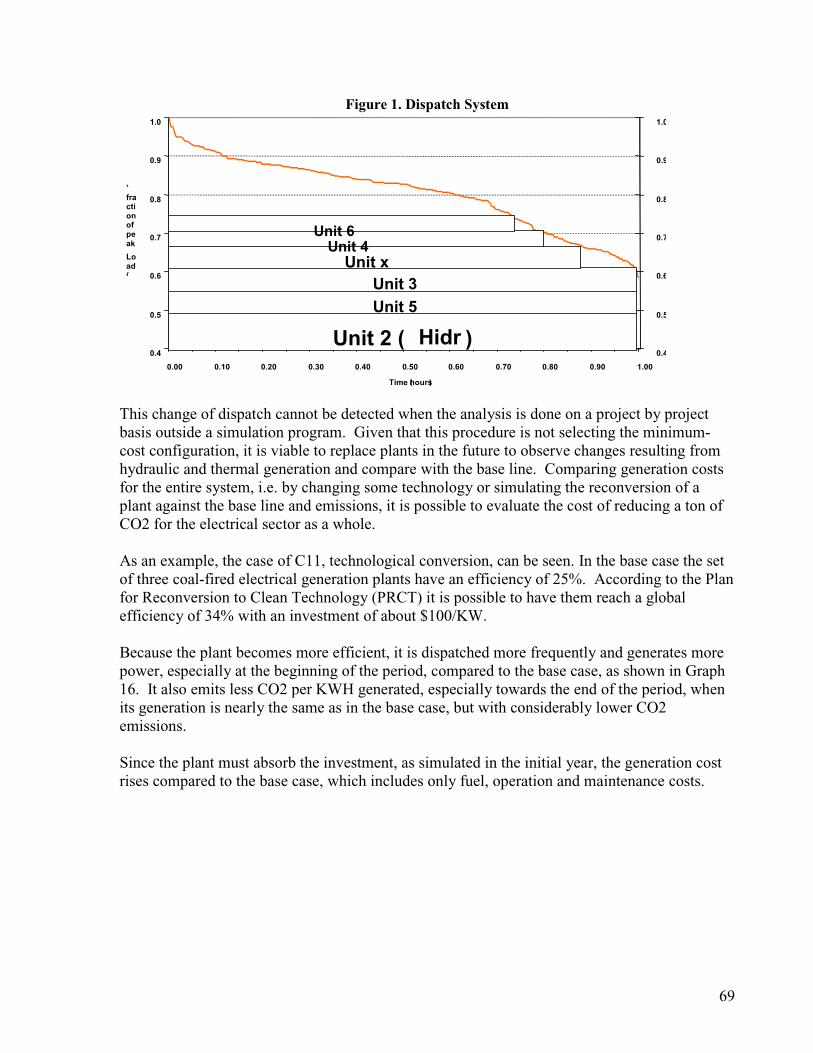
69
Figure 1. Dispatch System
0.4
0.5
0.6
0.7
0.8
0.9
1.0
0.00 0.10 0.20 0.30 0.40 0.50 0.60 0.70 0.80 0.90 1.00
Time (hours)
Load(
fractionofpeak
)
0.4
0.5
0.6
0.7
0.8
0.9
1.0
Unit 2 ( Hidr )
Unit 5Unit 3
Unit xUnit 4
Unit 6
This change of dispatch cannot be detected when the analysis is done on a project by projectbasis outside a simulation program. Given that this procedure is not selecting the minimum-cost configuration, it is viable to replace plants in the future to observe changes resulting fromhydraulic and thermal generation and compare with the base line. Comparing generation costsfor the entire system, i.e. by changing some technology or simulating the reconversion of aplant against the base line and emissions, it is possible to evaluate the cost of reducing a ton ofCO2 for the electrical sector as a whole.
As an example, the case of C11, technological conversion, can be seen. In the base case the setof three coal-fired electrical generation plants have an efficiency of 25%. According to the Planfor Reconversion to Clean Technology (PRCT) it is possible to have them reach a globalefficiency of 34% with an investment of about $100/KW.
Because the plant becomes more efficient, it is dispatched more frequently and generates morepower, especially at the beginning of the period, compared to the base case, as shown in Graph16. It also emits less CO2 per KWH generated, especially towards the end of the period, whenits generation is nearly the same as in the base case, but with considerably lower CO2emissions.
Since the plant must absorb the investment, as simulated in the initial year, the generation costrises compared to the base case, which includes only fuel, operation and maintenance costs.
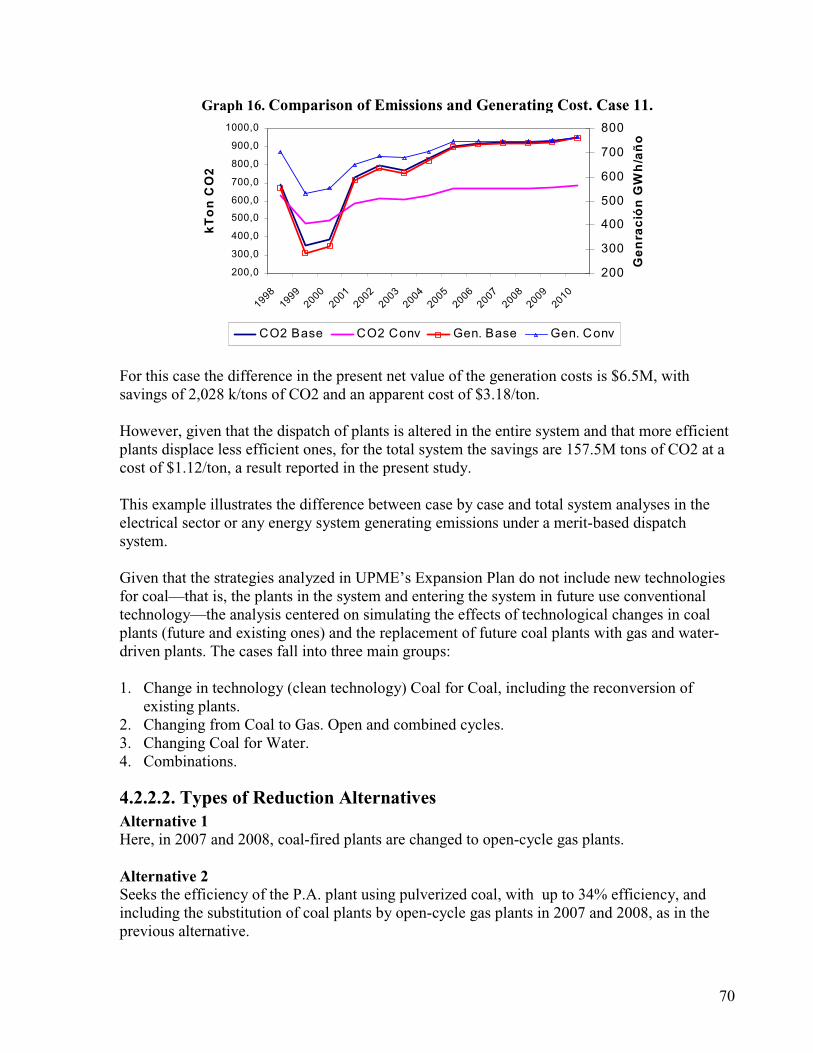
70
Graph 16. Comparison of Emissions and Generating Cost. Case 11.
200,0
300,0
400,0
500,0
600,0
700,0
800,0
900,0
1000,0
1998
1999
2000
2001
2002
2003
2004
2005
2006
2007
2008
2009
2010
kTonCO2
200
300
400
500
600
700
800
GenraciónGWh/año
CO2 Base CO2 Conv Gen. Base Gen. Conv
For this case the difference in the present net value of the generation costs is $6.5M, withsavings of 2,028 k/tons of CO2 and an apparent cost of $3.18/ton.
However, given that the dispatch of plants is altered in the entire system and that more efficientplants displace less efficient ones, for the total system the savings are 157.5M tons of CO2 at acost of $1.12/ton, a result reported in the present study.
This example illustrates the difference between case by case and total system analyses in theelectrical sector or any energy system generating emissions under a merit-based dispatchsystem.
Given that the strategies analyzed in UPME’s Expansion Plan do not include new technologiesfor coal—that is, the plants in the system and entering the system in future use conventionaltechnology—the analysis centered on simulating the effects of technological changes in coalplants (future and existing ones) and the replacement of future coal plants with gas and water-driven plants. The cases fall into three main groups:
1. Change in technology (clean technology) Coal for Coal, including the reconversion ofexisting plants.
2. Changing from Coal to Gas. Open and combined cycles.3. Changing Coal for Water.4. Combinations.
4.2.2.2. Types of Reduction AlternativesAlternative 1Here, in 2007 and 2008, coal-fired plants are changed to open-cycle gas plants.
Alternative 2Seeks the efficiency of the P.A. plant using pulverized coal, with up to 34% efficiency, andincluding the substitution of coal plants by open-cycle gas plants in 2007 and 2008, as in theprevious alternative.
71
Alternative 3Seeks the efficiency of the P.B. generating plant with pulverized coal, with about 34%efficiency, and coal plants substituted by open-cycle gas plants in 2007 and 2008, as inAlternative 1.
Alternative 4A single plant, P.B. 3, is improved, through reconversion to open-cycle technology.
Alternative 5Coal-fired plants are converted to combined-cycle plants in 2007 and 2008, with 46%efficiency, using gas as the main fuel.
Alternative 6Alternatives 3 and 5 are applied together: coal plants are changed to combined-cycle gas plants,with about 50% (Alternative 5 reached 46% efficiency) in 2007 and 2008, and improving P.B.efficiency to around 34%.
Alternative 7All coal plants are changed for combined-cycle gas plants in 2007 and 2008, with about 50%efficiency.
Alternative 8Alternatives 7 and 11 are applied together:• All coal plants are changed for combined-cycle gas plants in 2007 and 2008, with 50%efficiency
• The efficiency of P.A. is improved to 34% with pulverized coal.
Alternative 9Here P.B. changes to pulverized coal and the increase in efficiency from 17% to 34% isevaluated.
Alternative 10Another important technology to evaluate is the fluidized bed,• P.B. 2 is changed into a combined-cycle plant with 50%;• Also studied is the conversion of P.C. and P.D.I50 to a fluidized bed, with 36% efficiency.
Alternative 11Considers the following: P.A. is now a coal plant with 17% efficiency, but it can reach asignificantly higher 34% with pulverized coal.
Alternative 12Here P.B. 2, a thermo-electric, becomes a hydroelectric.
50 P.D. 1 is being created and has not yet been named.
72
Alternative 13The combination of several of the preceding:• In 2007, converting P.C. to a fluidized bed, with 37% efficiency.• In 2008, converting P.D. II51 to fluidized bed technology, with 37% efficiency.• In 2008, converting P.D. I to fluidized bed technology, with 37% efficiency.• Converting P.A. to pulverized coal technology, with 34% efficiency.• Converting P.B. to pulverized coal technology, with 34% efficiency.
Alternative 14Four plants are converted to fluidized bed coal technology, with 37% efficiency, as follows:• P.A. in 2007• P.C. I in 2007• P.D. I in 2008• P.D. II in 2008
Alternative 15Two possibilities are brought together:• Reconversion of P.B. to pulverized coal, with up to 34% efficiency.• Changing coal-fired plants for hydro-electrical plants in 2007 and 2008.
Alternative 16Reconversion to fluidized bed technology, with 37% efficiency, in the following plants:• P.C. in 2007• P.D I in 2008• P.D.II in 2008• P.B.
Alternative 17All coal-fired plants change to hydroelectric plants in 2007 and 2008.
Alternative 18Similar to 15, but reconverting P.A. instead of P.B., thus:• Pulverized coal in P.A., with increased efficiency of 34%.• Coal-fired plants are changed for hydroelectric plants in 2007 and 2008.
4.2.3. Analysis of the Proposed Reduction AlternativesAs expected, the analysis showed cost-effective projects and others that proved to be too costly.Graph 17 shows the alternatives ranked from least to most cost per ton of CO2 reduced.
51 P.D. 2 is being created and has not yet been named.
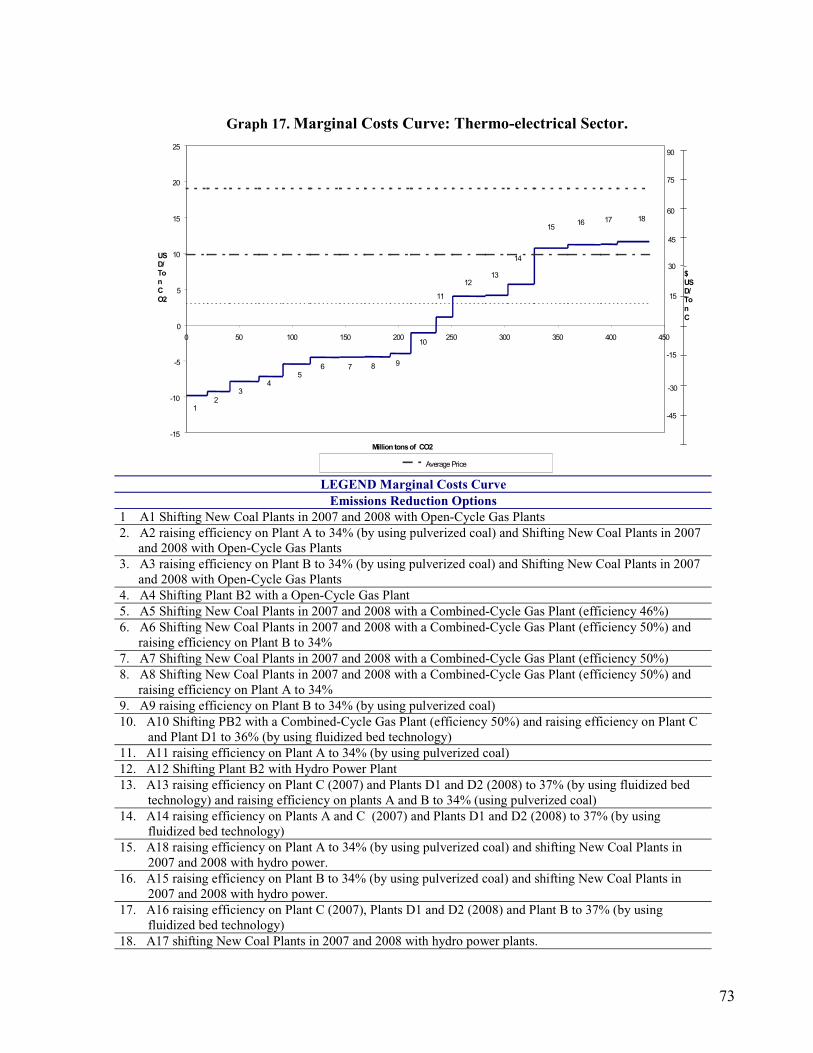
73
Graph 17. Marginal Costs Curve: Thermo-electrical Sector.
-15
-10
-5
0
5
10
15
20
25
0 50 100 150 200 250 300 350 400 450
Million tonsof CO2
USD/TonCO2
AveragePrice
12
34
56 7 8 9
10
11
1213
14
1516
15
30
45
60
75
90
-15
-30
-45
$USD/TonC
17 18
LEGEND Marginal Costs CurveEmissions Reduction Options
1 A1 Shifting New Coal Plants in 2007 and 2008 with Open-Cycle Gas Plants2. A2 raising efficiency on Plant A to 34% (by using pulverized coal) and Shifting New Coal Plants in 2007and 2008 with Open-Cycle Gas Plants
3. A3 raising efficiency on Plant B to 34% (by using pulverized coal) and Shifting New Coal Plants in 2007and 2008 with Open-Cycle Gas Plants
4. A4 Shifting Plant B2 with a Open-Cycle Gas Plant5. A5 Shifting New Coal Plants in 2007 and 2008 with a Combined-Cycle Gas Plant (efficiency 46%)6. A6 Shifting New Coal Plants in 2007 and 2008 with a Combined-Cycle Gas Plant (efficiency 50%) andraising efficiency on Plant B to 34%
7. A7 Shifting New Coal Plants in 2007 and 2008 with a Combined-Cycle Gas Plant (efficiency 50%)8. A8 Shifting New Coal Plants in 2007 and 2008 with a Combined-Cycle Gas Plant (efficiency 50%) andraising efficiency on Plant A to 34%
9. A9 raising efficiency on Plant B to 34% (by using pulverized coal)10. A10 Shifting PB2 with a Combined-Cycle Gas Plant (efficiency 50%) and raising efficiency on Plant C
and Plant D1 to 36% (by using fluidized bed technology)11. A11 raising efficiency on Plant A to 34% (by using pulverized coal)12. A12 Shifting Plant B2 with Hydro Power Plant13. A13 raising efficiency on Plant C (2007) and Plants D1 and D2 (2008) to 37% (by using fluidized bed
technology) and raising efficiency on plants A and B to 34% (using pulverized coal)14. A14 raising efficiency on Plants A and C (2007) and Plants D1 and D2 (2008) to 37% (by using
fluidized bed technology)15. A18 raising efficiency on Plant A to 34% (by using pulverized coal) and shifting New Coal Plants in
2007 and 2008 with hydro power.16. A15 raising efficiency on Plant B to 34% (by using pulverized coal) and shifting New Coal Plants in
2007 and 2008 with hydro power.17. A16 raising efficiency on Plant C (2007), Plants D1 and D2 (2008) and Plant B to 37% (by using
fluidized bed technology)18. A17 shifting New Coal Plants in 2007 and 2008 with hydro power plants.
74
In general, investment associated with a gas thermo-electrical plant is lower than for a coal-firedone; the same is true when comparing a coal-fired plant and a hydroelectric; basically becauseof this, the alternatives that propose changing coal for gas are cost-effective. But the contrary istrue when coal is replaced by water, though there, very important CO2 reductions are obtained.
The results obtained when technological conversions (coal for coal) are effected in existingplants, both in the P.A.S. group as well as in the P.B.S offer significant opportunities todecrease CO2 emissions with low investment. Alternatives 9 and 11 show this, though work onP.A. plants is more costly with smaller savings in emissions and even so, with a per ton costlower than $5.
Technological reconversion is directly related to efficiency, thus open cycle technology has anefficiency of up to 35%, combined cycle technology has an efficiency of up to 50% andfluidized bed technology, close to 37%.
Efficiency in Colombian plants to 1998 (not including the most recent projects of the nationalplan for the mass development of gas), are on average 26%, with coal at 26% and gas at 21%;the alternatives analyzed above seek to increase efficiency at these plants using the mentionedtechnologies, with Alternatives 15, 16 and 17 being the most expensive, at $15/t of CO2reduced.
The alternatives that generate the highest saving in emissions are not necessarily those requiringthe highest investment, as is the case with Alternatives 3, 6 and 5.
Renewable EnergyIn addition to the preceding alternatives, in the tutorial for projects, the wind energy project inthe interconnected electrical system was analyzed. The project "Wind Energy Use in the UpperGuajira" includes feasibility, design, construction, and operation of a windmill park for 25 MW(first phase) near Puerto Bolivar on Wayuu Indian territory in La Guajira Department onColombia’s northeastern coast. The project would be connected to the National TransmissionSystem (NTS) to partially meet the country's energy demand and contribute to reduce GHGemissions through the displacement of thermal generation.
According to research and analysis on GHG emissions reduction at the Colombian Academy ofSciences, where the base scenario was conceived based on the Expansion Plan for Generation-Transmission developed by UPME, the Mining Ministry’s planning unit, the project wouldreduce emissions of about 0.7kg. of CO2 for every KWh generated by the project. The newelectrical plant modifies dispatches and energy generation on the network, displacing the moreinefficient plants of the original dispatch (base line). As Graph 10 (Dispatch System)illustrates, the last plants dispatched on the system are the thermal plants, which will bedisplaced by the new windmill farm. The emissions reduction factor of 0.7kg. of CO2 for everyKWh corresponds to average of emissions on the network in the dispatch margin, that is theaverage of emissions of the thermal plant. We estimate that the wind project will generate80,431MWh and thus will produce a reduction of approximately 56,000 t of CO2 a year. In
75
addition, we expect significant collateral benefits for the Indian population of the projects' areasof influence.Alternative energy projects like the above-mentioned one must be included in the programs foridentifying CDM projects and encouraged using instruments like market reserves52, cleanproduction agreements in the sector and technology transfer programs, among others.
4.2.4. Conclusiones y RecomendacionesThe Colombian thermo-electrical sector has strong potential to save emissions and equally forCDM projects application, having an average energy efficiency in thermoelectrical plants ofabout 23%, while new technologies for this type of generation have up to 50% efficiency.
The generation system operates as a netwrok, so changes in one plant affect the entire system,and because of this alternatives were studied through a simulation model capable of compilingevents at the micro level at certain plants, and the implications for the system at large (takinghistorical behavior, climate, etc. into account).
The alternatives we analyzed, which are non-exclusive, show CO2 savings of about 84M t CO2reduced at costs lower than %15.
The present study identifies alternatives and compares them, classifying different options percost and CO2 reduction, identifying potential projects for CDM treatment. Even so, it is iffundamental importance to analyze the selected alternatives individually.
52 For example, if 1% of the country’s installed generation capacity (152MW) is reserved for renewable energysources, the net reduction of emissions for 2010 would be equivalent to 342,314 CO2 Tons per year.
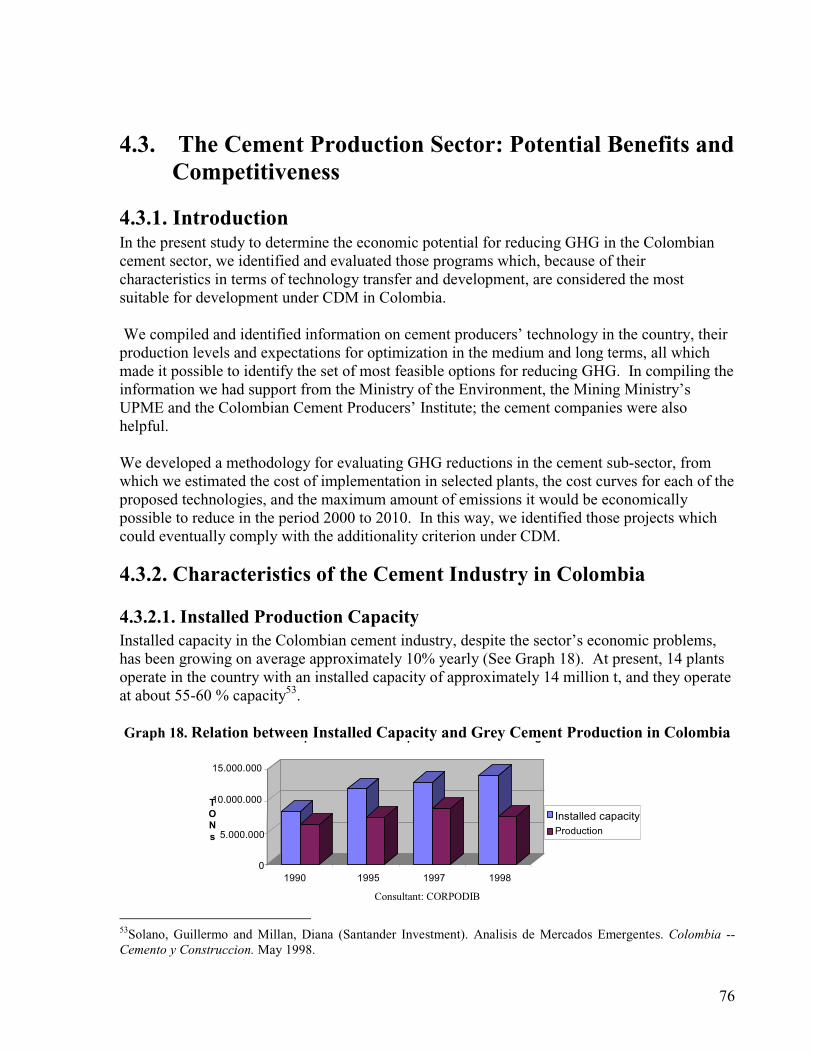
76
4.3. The Cement Production Sector: Potential Benefits andCompetitiveness
4.3.1. IntroductionIn the present study to determine the economic potential for reducing GHG in the Colombiancement sector, we identified and evaluated those programs which, because of theircharacteristics in terms of technology transfer and development, are considered the mostsuitable for development under CDM in Colombia.
We compiled and identified information on cement producers’ technology in the country, theirproduction levels and expectations for optimization in the medium and long terms, all whichmade it possible to identify the set of most feasible options for reducing GHG. In compiling theinformation we had support from the Ministry of the Environment, the Mining Ministry’sUPME and the Colombian Cement Producers’ Institute; the cement companies were alsohelpful.
We developed a methodology for evaluating GHG reductions in the cement sub-sector, fromwhich we estimated the cost of implementation in selected plants, the cost curves for each of theproposed technologies, and the maximum amount of emissions it would be economicallypossible to reduce in the period 2000 to 2010. In this way, we identified those projects whichcould eventually comply with the additionality criterion under CDM.
4.3.2. Characteristics of the Cement Industry in Colombia
4.3.2.1. Installed Production CapacityInstalled capacity in the Colombian cement industry, despite the sector’s economic problems,has been growing on average approximately 10% yearly (See Graph 18). At present, 14 plantsoperate in the country with an installed capacity of approximately 14 million t, and they operateat about 55-60 % capacity53.
Graph 18. Relation between Installed Capacity and Grey Cement Production in Colombia
0
5.000.000
10.000.000
15.000.000
TONs
1990 1995 1997 1998
p p g
Installed capacityProduction
Consultant: CORPODIB
53Solano, Guillermo and Millan, Diana (Santander Investment). Analisis de Mercados Emergentes. Colombia --Cemento y Construccion.May 1998.
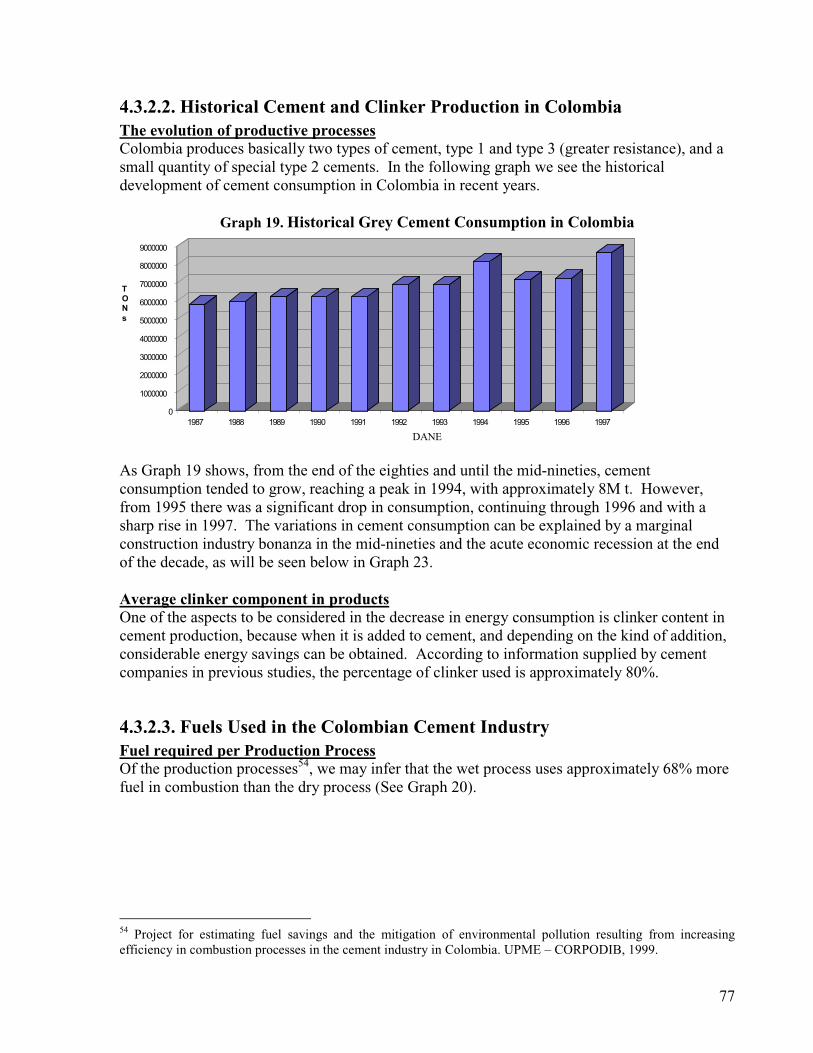
77
4.3.2.2. Historical Cement and Clinker Production in ColombiaThe evolution of productive processesColombia produces basically two types of cement, type 1 and type 3 (greater resistance), and asmall quantity of special type 2 cements. In the following graph we see the historicaldevelopment of cement consumption in Colombia in recent years.
Graph 19. Historical Grey Cement Consumption in Colombia
0
1000000
2000000
3000000
4000000
5000000
6000000
7000000
8000000
9000000
TONs
1987 1988 1989 1990 1991 1992 1993 1994 1995 1996 1997
DANE
As Graph 19 shows, from the end of the eighties and until the mid-nineties, cementconsumption tended to grow, reaching a peak in 1994, with approximately 8M t. However,from 1995 there was a significant drop in consumption, continuing through 1996 and with asharp rise in 1997. The variations in cement consumption can be explained by a marginalconstruction industry bonanza in the mid-nineties and the acute economic recession at the endof the decade, as will be seen below in Graph 23.
Average clinker component in productsOne of the aspects to be considered in the decrease in energy consumption is clinker content incement production, because when it is added to cement, and depending on the kind of addition,considerable energy savings can be obtained. According to information supplied by cementcompanies in previous studies, the percentage of clinker used is approximately 80%.
4.3.2.3. Fuels Used in the Colombian Cement IndustryFuel required per Production ProcessOf the production processes54, we may infer that the wet process uses approximately 68% morefuel in combustion than the dry process (See Graph 20).
54 Project for estimating fuel savings and the mitigation of environmental pollution resulting from increasingefficiency in combustion processes in the cement industry in Colombia. UPME – CORPODIB, 1999.
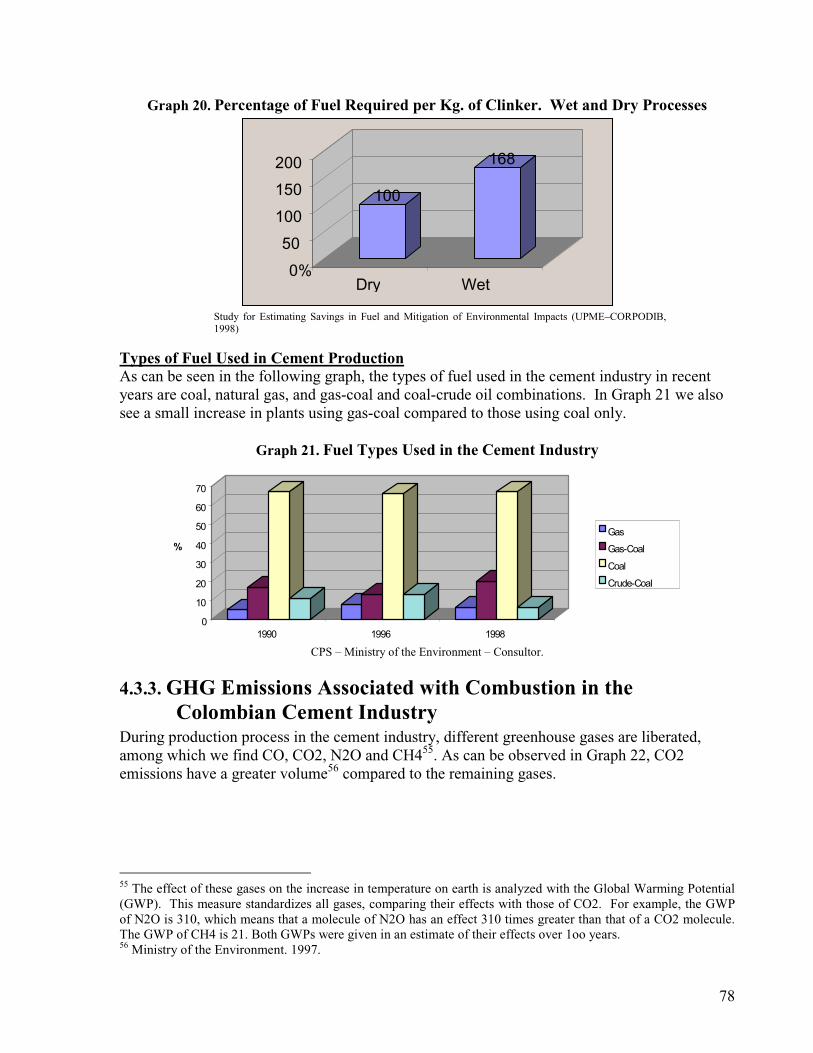
78
Graph 20. Percentage of Fuel Required per Kg. of Clinker. Wet and Dry Processes
100
168
0%
50
100
150
200
Dry Wet
Study for Estimating Savings in Fuel and Mitigation of Environmental Impacts (UPME–CORPODIB,1998)
Types of Fuel Used in Cement ProductionAs can be seen in the following graph, the types of fuel used in the cement industry in recentyears are coal, natural gas, and gas-coal and coal-crude oil combinations. In Graph 21 we alsosee a small increase in plants using gas-coal compared to those using coal only.
Graph 21. Fuel Types Used in the Cement Industry
0
10
20
30
40
50
60
70
%
1990 1996 1998
Gas
Gas-Coal
Coal
Crude-Coal
CPS – Ministry of the Environment – Consultor.
4.3.3. GHG Emissions Associated with Combustion in theColombian Cement Industry
During production process in the cement industry, different greenhouse gases are liberated,among which we find CO, CO2, N2O and CH455. As can be observed in Graph 22, CO2emissions have a greater volume56 compared to the remaining gases.
55 The effect of these gases on the increase in temperature on earth is analyzed with the Global Warming Potential(GWP). This measure standardizes all gases, comparing their effects with those of CO2. For example, the GWPof N2O is 310, which means that a molecule of N2O has an effect 310 times greater than that of a CO2 molecule.The GWP of CH4 is 21. Both GWPs were given in an estimate of their effects over 1oo years.56 Ministry of the Environment. 1997.
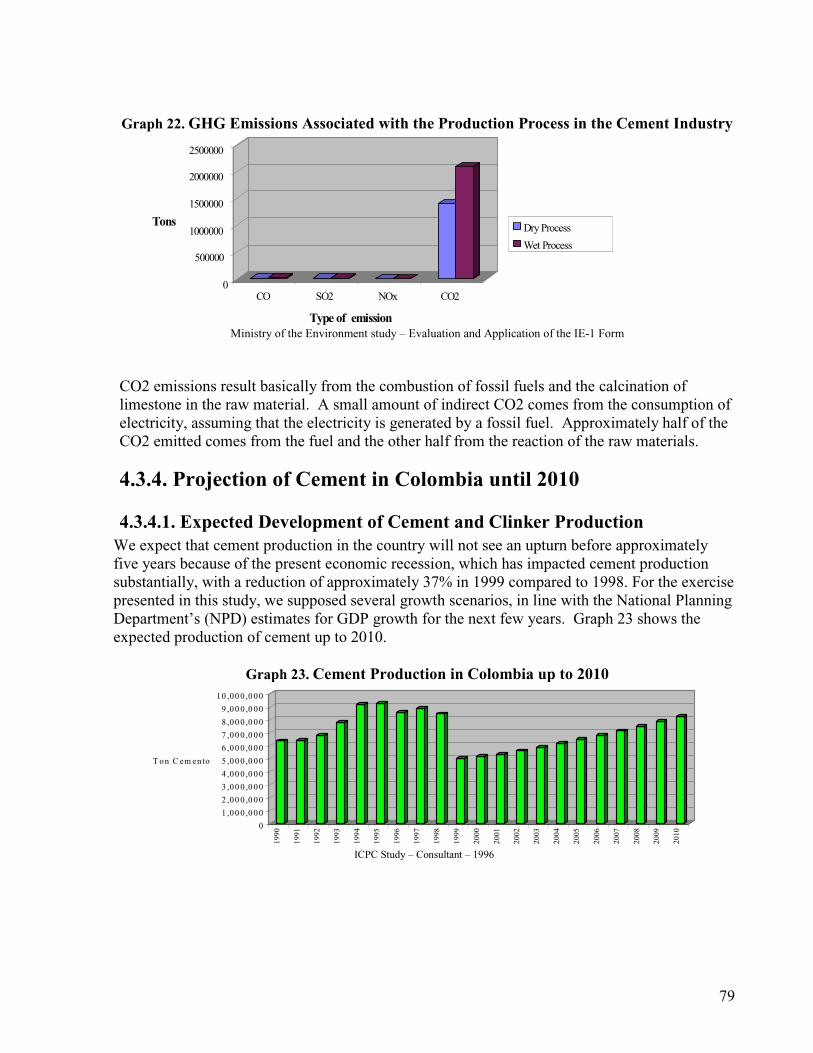
79
Graph 22. GHG Emissions Associated with the Production Process in the Cement Industry
Ministry of the Environment study – Evaluation and Application of the IE-1 Form
CO2 emissions result basically from the combustion of fossil fuels and the calcination oflimestone in the raw material. A small amount of indirect CO2 comes from the consumption ofelectricity, assuming that the electricity is generated by a fossil fuel. Approximately half of theCO2 emitted comes from the fuel and the other half from the reaction of the raw materials.
4.3.4. Projection of Cement in Colombia until 2010
4.3.4.1. Expected Development of Cement and Clinker ProductionWe expect that cement production in the country will not see an upturn before approximatelyfive years because of the present economic recession, which has impacted cement productionsubstantially, with a reduction of approximately 37% in 1999 compared to 1998. For the exercisepresented in this study, we supposed several growth scenarios, in line with the National PlanningDepartment’s (NPD) estimates for GDP growth for the next few years. Graph 23 shows theexpected production of cement up to 2010.
Graph 23. Cement Production in Colombia up to 2010
0
1 ,000 ,000
2 ,000 ,000
3 ,000 ,000
4 ,000 ,000
5 ,000 ,000
6 ,000 ,000
7 ,000 ,000
8 ,000 ,000
9 ,000 ,000
10 ,000 ,000
Ton Cem ento
1990
1991
1992
1993
1994
1995
1996
1997
1998
1999
2000
2001
2002
2003
2004
2005
2006
2007
2008
2009
2010
ICPC Study – Consultant – 1996
0
500000
1000000
1500000
2000000
2500000
Tons
CO SO2 NOx CO2
Type of emission
DryProcess
Wet Process
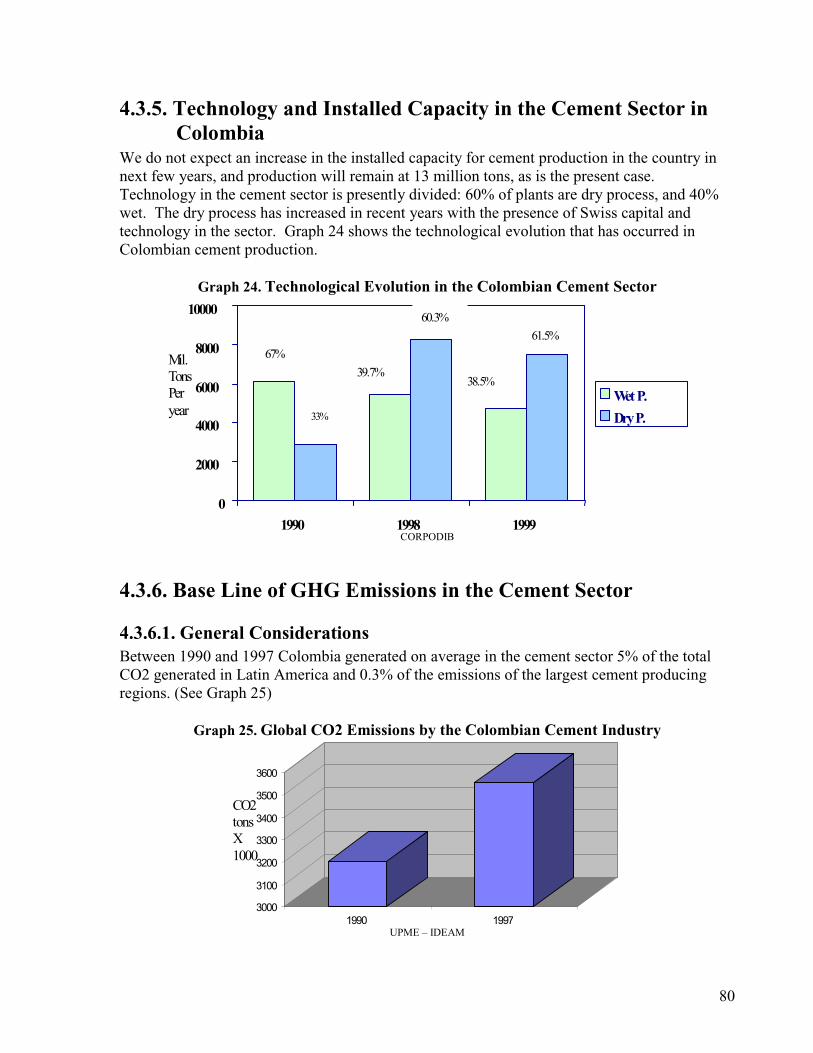
80
4.3.5. Technology and Installed Capacity in the Cement Sector inColombia
We do not expect an increase in the installed capacity for cement production in the country innext few years, and production will remain at 13 million tons, as is the present case.Technology in the cement sector is presently divided: 60% of plants are dry process, and 40%wet. The dry process has increased in recent years with the presence of Swiss capital andtechnology in the sector. Graph 24 shows the technological evolution that has occurred inColombian cement production.
Graph 24. Technological Evolution in the Colombian Cement Sector
0
2000
4000
6000
8000
10000
1990 1998 1999
WetP.
DryP.
67%
33%
60.3%
39.7%
61.5%
38.5%
Mil.TonsPeryear
CORPODIB
4.3.6. Base Line of GHG Emissions in the Cement Sector
4.3.6.1. General ConsiderationsBetween 1990 and 1997 Colombia generated on average in the cement sector 5% of the totalCO2 generated in Latin America and 0.3% of the emissions of the largest cement producingregions. (See Graph 25)
Graph 25. Global CO2 Emissions by the Colombian Cement Industry
3000
3100
3200
3300
3400
3500
3600
1990 1997
CO2tonsX1000
UPME – IDEAM
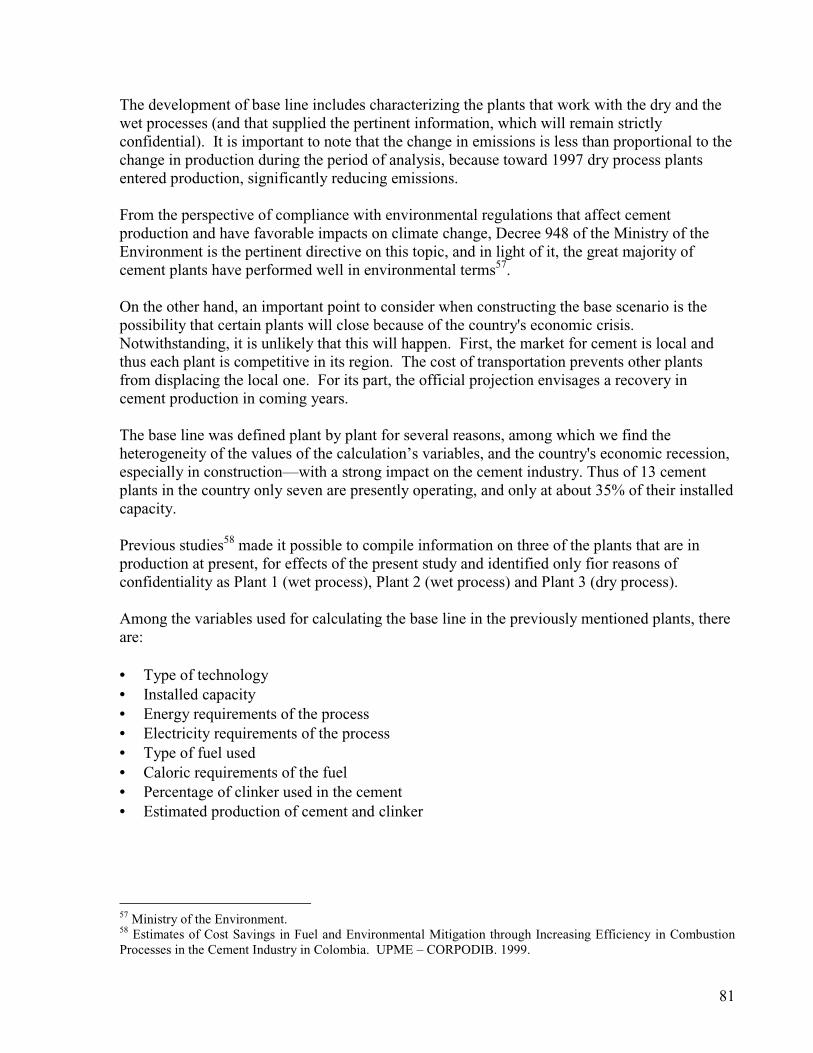
81
The development of base line includes characterizing the plants that work with the dry and thewet processes (and that supplied the pertinent information, which will remain strictlyconfidential). It is important to note that the change in emissions is less than proportional to thechange in production during the period of analysis, because toward 1997 dry process plantsentered production, significantly reducing emissions.
From the perspective of compliance with environmental regulations that affect cementproduction and have favorable impacts on climate change, Decree 948 of the Ministry of theEnvironment is the pertinent directive on this topic, and in light of it, the great majority ofcement plants have performed well in environmental terms57.
On the other hand, an important point to consider when constructing the base scenario is thepossibility that certain plants will close because of the country's economic crisis.Notwithstanding, it is unlikely that this will happen. First, the market for cement is local andthus each plant is competitive in its region. The cost of transportation prevents other plantsfrom displacing the local one. For its part, the official projection envisages a recovery incement production in coming years.
The base line was defined plant by plant for several reasons, among which we find theheterogeneity of the values of the calculation’s variables, and the country's economic recession,especially in construction—with a strong impact on the cement industry. Thus of 13 cementplants in the country only seven are presently operating, and only at about 35% of their installedcapacity.
Previous studies58 made it possible to compile information on three of the plants that are inproduction at present, for effects of the present study and identified only fior reasons ofconfidentiality as Plant 1 (wet process), Plant 2 (wet process) and Plant 3 (dry process).
Among the variables used for calculating the base line in the previously mentioned plants, thereare:
• Type of technology• Installed capacity• Energy requirements of the process• Electricity requirements of the process• Type of fuel used• Caloric requirements of the fuel• Percentage of clinker used in the cement• Estimated production of cement and clinker
57 Ministry of the Environment.58 Estimates of Cost Savings in Fuel and Environmental Mitigation through Increasing Efficiency in CombustionProcesses in the Cement Industry in Colombia. UPME – CORPODIB. 1999.
82
As complementary information, through a survey of the cement sector, we compiledinformation on the alternatives and projects for modernizing and improving the industry’scombustion processes and the remaining processes.
4.3.6.2. Growth Scenarios AnalyzedThe base line was analyzed under 4 possible growth scenarios for the domestic economy:
Scenario 1. GDP growth of up to 5% in the following 10 yearsScenario 2. GDP growth of up to 4.2 % in the following 10 yearsScenario 3. GDP growth of up to 2% in the following 10 yearsScenario 4. No GDP growth in the following 10 years
4.3.6.3. MethodologyThe following is the methodology used in calculating the base line for the previously describedplants.
For developing the calculations the following considerations are fundamental:
• Fuel consumption of the process (kilos of coal/kilos of clinker)• The percentage of coal present in the fuel• The fraction of oxidized coal, depending on the type of fuel59
• Determining the estimated projection of cement production until 2010, based on theproposed scenarios, with which it is possible to determine clinker production and equallyCO2 emissions from the decarbonation reaction
• Determining of the coal consumed in combustion and emissions produced by thecombustion process
• Finally, total carbon dioxide (CO2) emissions are determined.
4.3.6.4. Base Lines for the Plants UsedGraphs 26, 27 and 28 show the base lines for Plants 1, 2 and 3 under GDP growth scenarios 1,2, 3 and 4.
59 (P. 1.8 Table 1-4 Volume 2. Green Gas Inventory Workbook).
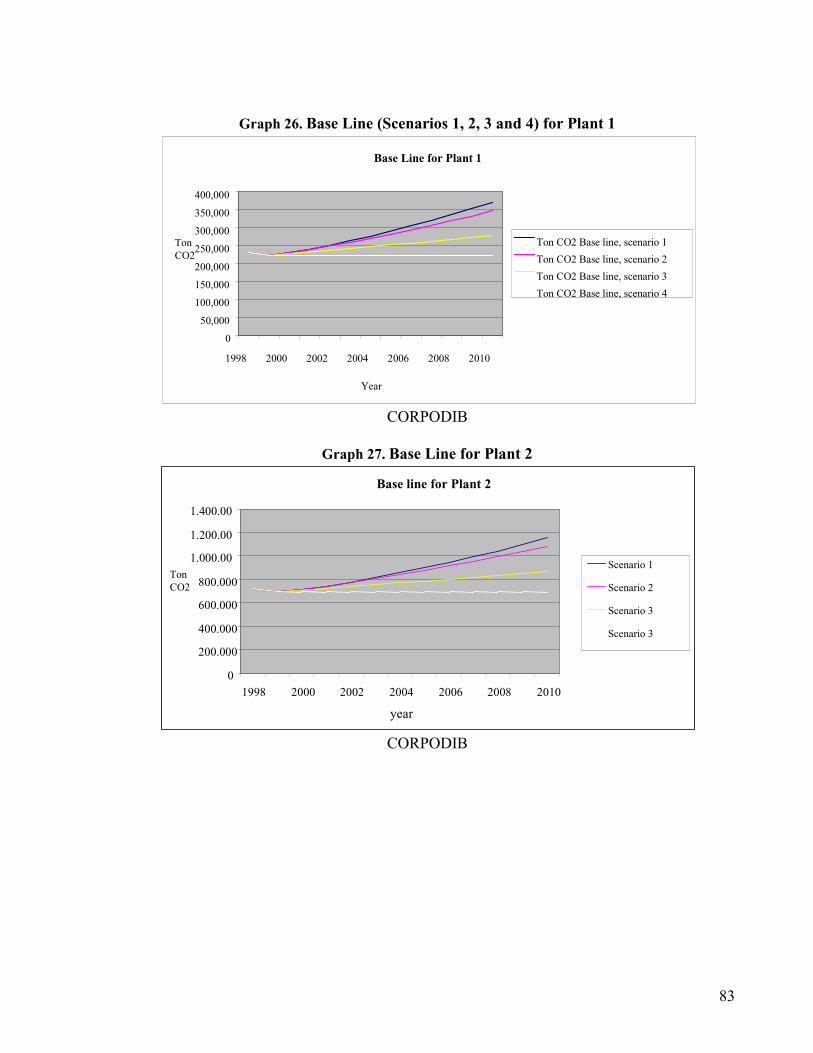
83
Graph 26. Base Line (Scenarios 1, 2, 3 and 4) for Plant 1
Base Line for Plant 1
0
50,000
100,000
150,000
200,000
250,000
300,000
350,000
400,000
1998 2000 2002 2004 2006 2008 2010
Year
TonCO2
Ton CO2 Base line, scenario 1
Ton CO2 Base line, scenario 2
Ton CO2 Base line, scenario 3
Ton CO2 Base line, scenario 4
CORPODIB
Graph 27. Base Line for Plant 2
Base line for Plant 2
0
200.000
400.000
600.000
800.000
1.000.00
1.200.00
1.400.00
1998 2000 2002 2004 2006 2008 2010
year
TonCO2
Scenario 1
Scenario 2
Scenario 3
Scenario 3
CORPODIB
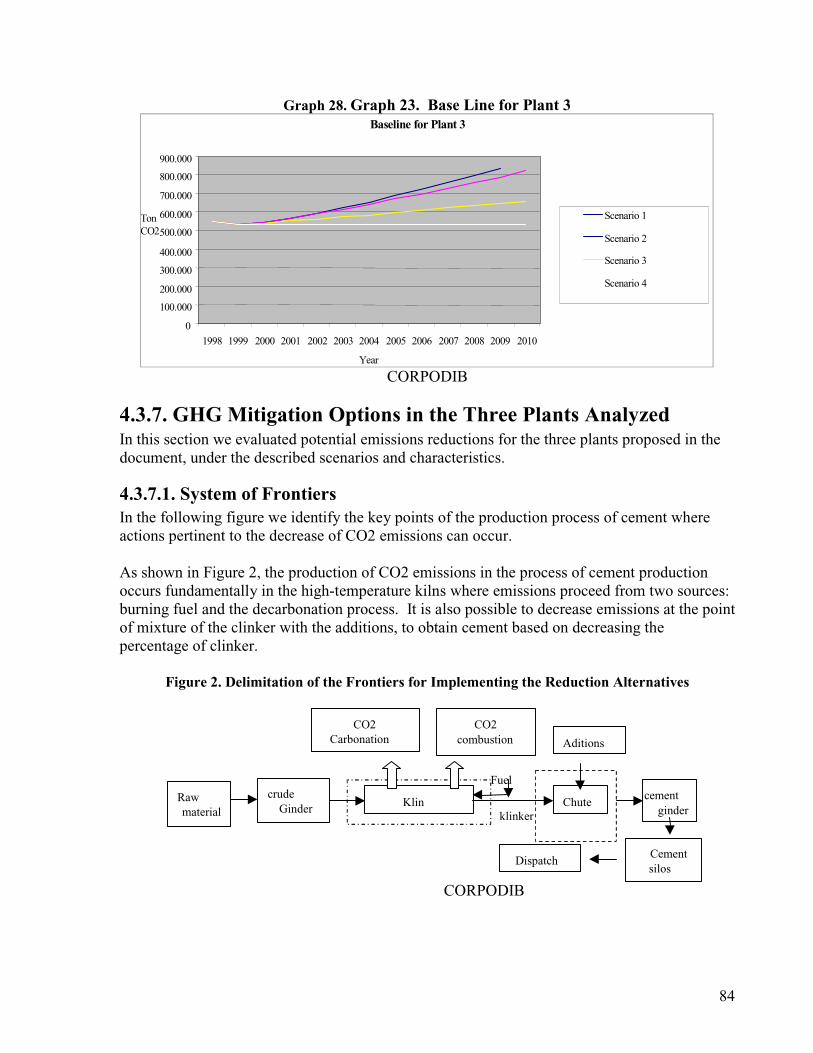
84
Graph 28. Graph 23. Base Line for Plant 3Baseline for Plant 3
0
100.000
200.000
300.000
400.000
500.000
600.000
700.000
800.000
900.000
1998 1999 2000 2001 2002 2003 2004 2005 2006 2007 2008 2009 2010
Year
TonCO2
Scenario 1
Scenario 2
Scenario 3
Scenario 4
CORPODIB
4.3.7. GHGMitigation Options in the Three Plants AnalyzedIn this section we evaluated potential emissions reductions for the three plants proposed in thedocument, under the described scenarios and characteristics.
4.3.7.1. System of FrontiersIn the following figure we identify the key points of the production process of cement whereactions pertinent to the decrease of CO2 emissions can occur.
As shown in Figure 2, the production of CO2 emissions in the process of cement productionoccurs fundamentally in the high-temperature kilns where emissions proceed from two sources:burning fuel and the decarbonation process. It is also possible to decrease emissions at the pointof mixture of the clinker with the additions, to obtain cement based on decreasing thepercentage of clinker.
Figure 2. Delimitation of the Frontiers for Implementing the Reduction Alternatives
Rawmaterial
crudeGinder Klin Chute
cementginder
CO2Carbonation
CO2combustion
Cementsilos
Aditions
Dispatch
Fuel
klinker
CORPODIB
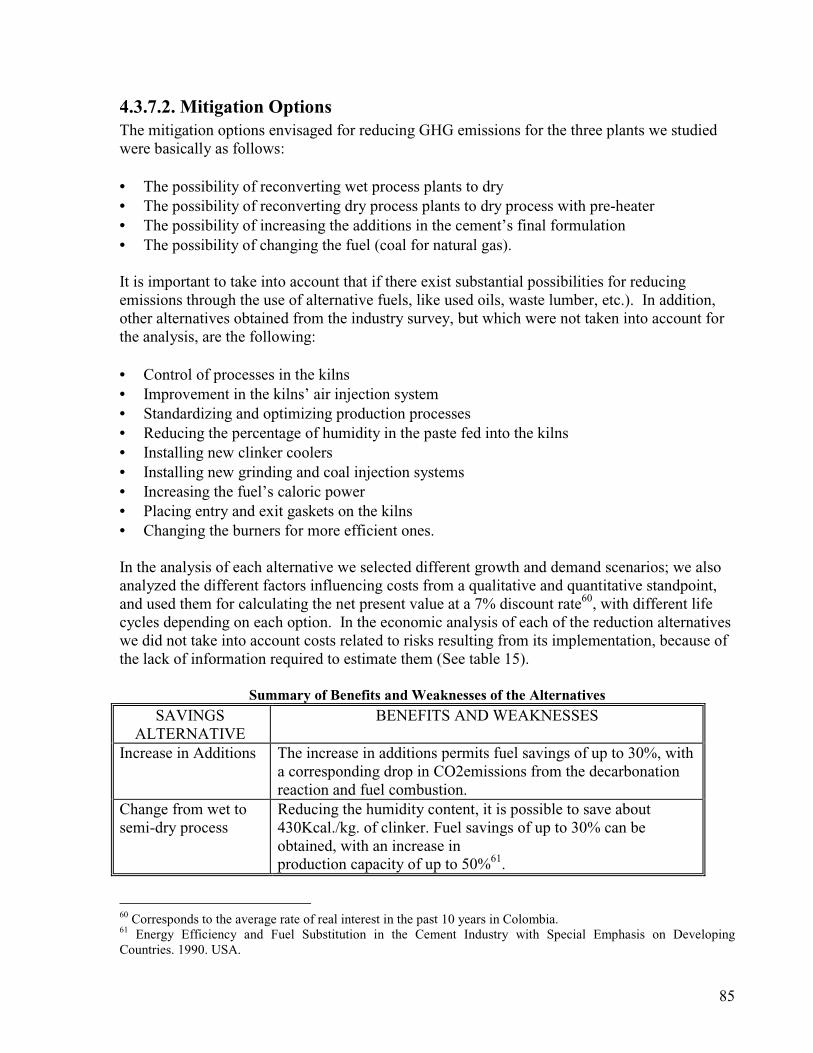
85
4.3.7.2. Mitigation OptionsThe mitigation options envisaged for reducing GHG emissions for the three plants we studiedwere basically as follows:
• The possibility of reconverting wet process plants to dry• The possibility of reconverting dry process plants to dry process with pre-heater• The possibility of increasing the additions in the cement’s final formulation• The possibility of changing the fuel (coal for natural gas).
It is important to take into account that if there exist substantial possibilities for reducingemissions through the use of alternative fuels, like used oils, waste lumber, etc.). In addition,other alternatives obtained from the industry survey, but which were not taken into account forthe analysis, are the following:
• Control of processes in the kilns• Improvement in the kilns’ air injection system• Standardizing and optimizing production processes• Reducing the percentage of humidity in the paste fed into the kilns• Installing new clinker coolers• Installing new grinding and coal injection systems• Increasing the fuel’s caloric power• Placing entry and exit gaskets on the kilns• Changing the burners for more efficient ones.
In the analysis of each alternative we selected different growth and demand scenarios; we alsoanalyzed the different factors influencing costs from a qualitative and quantitative standpoint,and used them for calculating the net present value at a 7% discount rate60, with different lifecycles depending on each option. In the economic analysis of each of the reduction alternativeswe did not take into account costs related to risks resulting from its implementation, because ofthe lack of information required to estimate them (See table 15).
Summary of Benefits and Weaknesses of the AlternativesSAVINGS
ALTERNATIVEBENEFITS AND WEAKNESSES
Increase in Additions The increase in additions permits fuel savings of up to 30%, witha corresponding drop in CO2emissions from the decarbonationreaction and fuel combustion.
Change from wet tosemi-dry process
Reducing the humidity content, it is possible to save about430Kcal./kg. of clinker. Fuel savings of up to 30% can beobtained, with an increase inproduction capacity of up to 50%61.
60 Corresponds to the average rate of real interest in the past 10 years in Colombia.61 Energy Efficiency and Fuel Substitution in the Cement Industry with Special Emphasis on DevelopingCountries. 1990. USA.
86
SAVINGSALTERNATIVE
BENEFITS AND WEAKNESSES
Change from wetprocess to dry
Fuel savings of up to 45% can be obtained, and an increase inproduction capacity between 30% and 80%.
Implementing thepre-calcinator in thedry process
An increase in capacity and a decrease in fuel consumption.
CORPODIB
Table 16 summarized the domestic average for fuel and electrical power, used in valuing thecosts of implementing the reduction alternatives.
Values of the Fuel and Electrical Power DataITEM UNIT VALUE
Fuel (coal) $/t coal 12Electrical power $/KWh 0.05
CORPODIB
The use of additions in cement productionOne of the options to be considered in making energy consumption drop is the clinker contentin cement production, because to the extent that one increases the addition to the cement, anddepending on the type of addition, considerable energy and fuel savings can be obtained, aswell as a decrease in the emission of polluting gases.
According to research done by UPME and CORPODIB62 in cement companies the percentageof clinker used is approximately 80%. The minimum percentage reported was 70% and themaximum 90%. Table 17 compiles the information related to additions presented by anumber of the country's cement companies.
Percentage of Clinker and Type of AdditionTYPE OF PROCESS % OF CLINKER TYPE OF ADDITION
Wet 72 – 94 Loose ash, limestone
Dry 70 – 86 Slag, Limestone, Pozzolana
Cement Industry Forms – CORPODIB
In Table 18 we can observe the percentages of thermal and electrical energy reduction in theproduction of pure cement for different types of additions to cement in the manufacturingprocess
62 Estimation of Fuel Saving and Environmental Mitigation Through Increasing Efficiency in CombustionProcesses in the Cement Industry in Colombia. UPME – CORPODIB. June 1999.
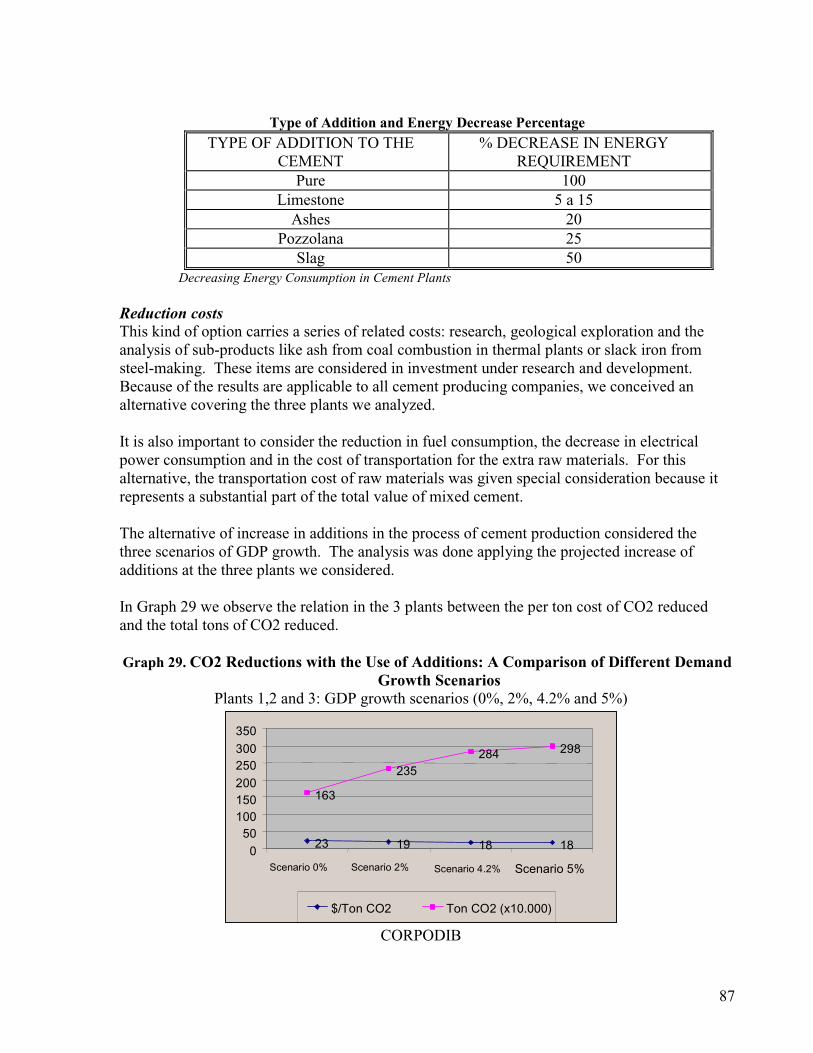
87
Type of Addition and Energy Decrease PercentageTYPE OF ADDITION TO THE
CEMENT% DECREASE IN ENERGY
REQUIREMENTPure 100
Limestone 5 a 15Ashes 20
Pozzolana 25Slag 50
Decreasing Energy Consumption in Cement Plants
Reduction costsThis kind of option carries a series of related costs: research, geological exploration and theanalysis of sub-products like ash from coal combustion in thermal plants or slack iron fromsteel-making. These items are considered in investment under research and development.Because of the results are applicable to all cement producing companies, we conceived analternative covering the three plants we analyzed.
It is also important to consider the reduction in fuel consumption, the decrease in electricalpower consumption and in the cost of transportation for the extra raw materials. For thisalternative, the transportation cost of raw materials was given special consideration because itrepresents a substantial part of the total value of mixed cement.
The alternative of increase in additions in the process of cement production considered thethree scenarios of GDP growth. The analysis was done applying the projected increase ofadditions at the three plants we considered.
In Graph 29 we observe the relation in the 3 plants between the per ton cost of CO2 reducedand the total tons of CO2 reduced.
Graph 29. CO2 Reductions with the Use of Additions: A Comparison of Different DemandGrowth Scenarios
Plants 1,2 and 3: GDP growth scenarios (0%, 2%, 4.2% and 5%)
23 19 18 18
163
235284 298
050100150200250300350
Scenario 0% Scenario 2% Scenario 4.2% Scenario 5%
$/Ton CO2 Ton CO2 (x10.000)
CORPODIB
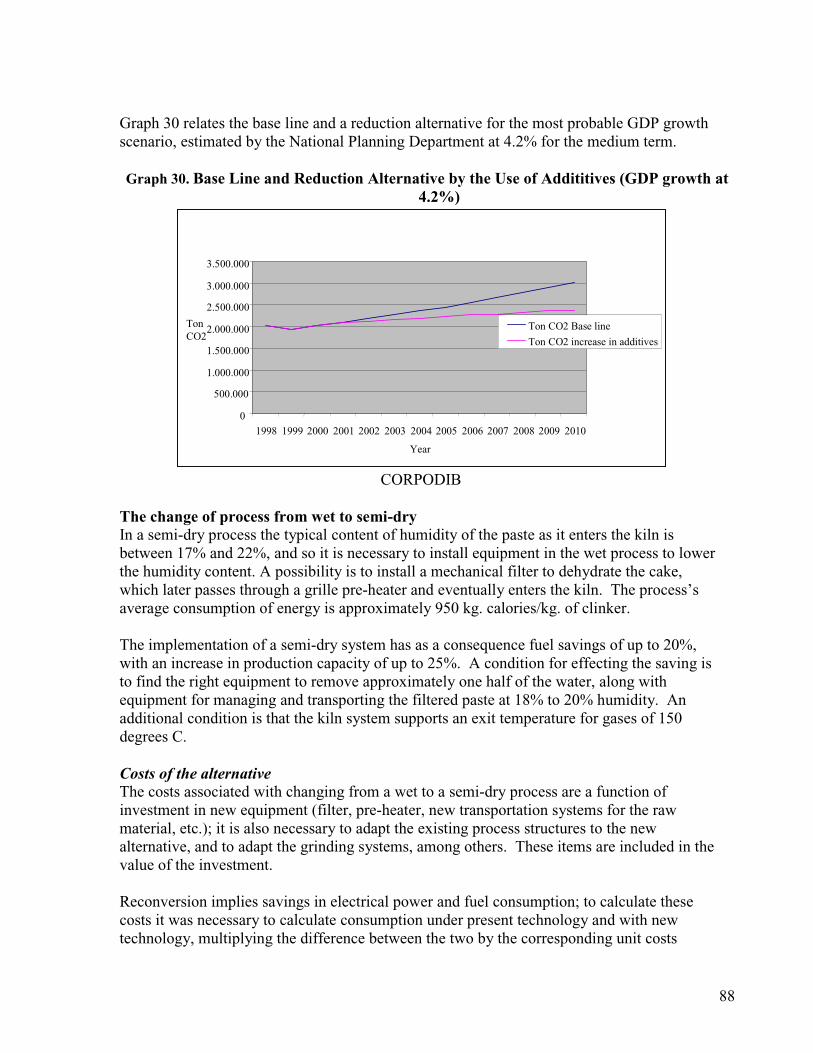
88
Graph 30 relates the base line and a reduction alternative for the most probable GDP growthscenario, estimated by the National Planning Department at 4.2% for the medium term.
Graph 30. Base Line and Reduction Alternative by the Use of Addititives (GDP growth at4.2%)
0
500.000
1.000.000
1.500.000
2.000.000
2.500.000
3.000.000
3.500.000
1998 1999 2000 2001 2002 2003 2004 2005 2006 2007 2008 2009 2010
Year
TonCO2
Ton CO2 Base line
Ton CO2 increase in additives
CORPODIB
The change of process from wet to semi-dryIn a semi-dry process the typical content of humidity of the paste as it enters the kiln isbetween 17% and 22%, and so it is necessary to install equipment in the wet process to lowerthe humidity content. A possibility is to install a mechanical filter to dehydrate the cake,which later passes through a grille pre-heater and eventually enters the kiln. The process’saverage consumption of energy is approximately 950 kg. calories/kg. of clinker.
The implementation of a semi-dry system has as a consequence fuel savings of up to 20%,with an increase in production capacity of up to 25%. A condition for effecting the saving isto find the right equipment to remove approximately one half of the water, along withequipment for managing and transporting the filtered paste at 18% to 20% humidity. Anadditional condition is that the kiln system supports an exit temperature for gases of 150degrees C.
Costs of the alternativeThe costs associated with changing from a wet to a semi-dry process are a function ofinvestment in new equipment (filter, pre-heater, new transportation systems for the rawmaterial, etc.); it is also necessary to adapt the existing process structures to the newalternative, and to adapt the grinding systems, among others. These items are included in thevalue of the investment.
Reconversion implies savings in electrical power and fuel consumption; to calculate thesecosts it was necessary to calculate consumption under present technology and with newtechnology, multiplying the difference between the two by the corresponding unit costs
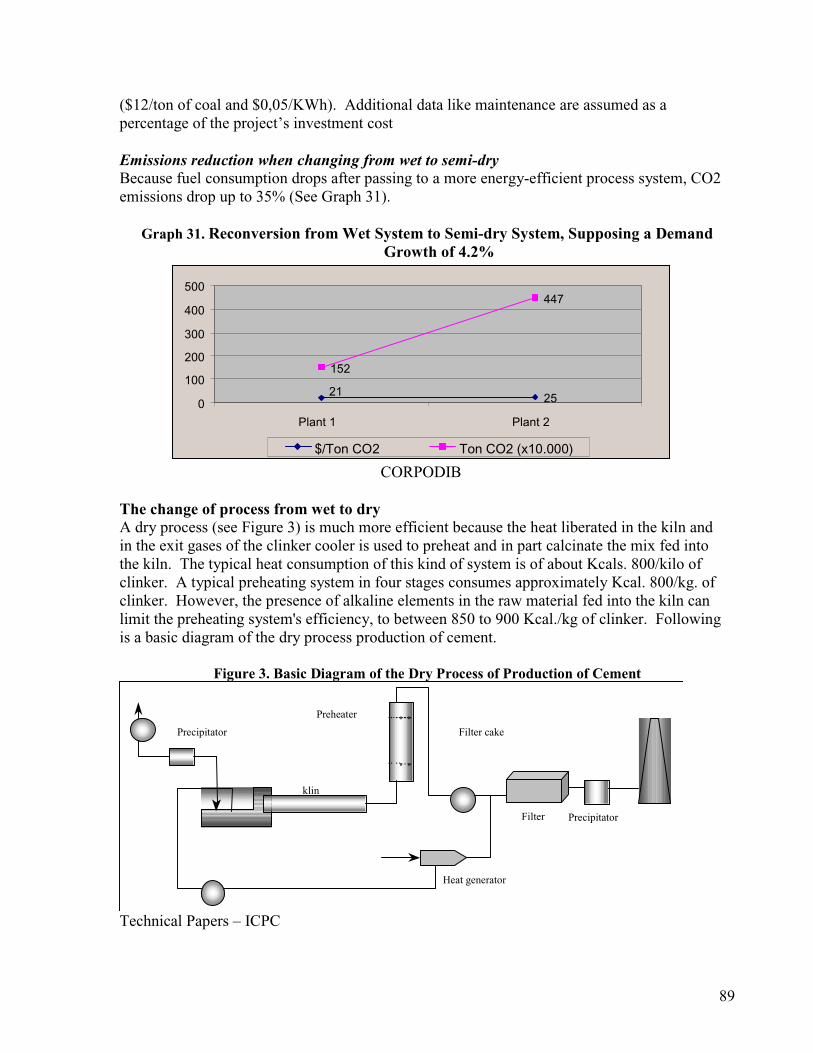
89
($12/ton of coal and $0,05/KWh). Additional data like maintenance are assumed as apercentage of the project’s investment cost
Emissions reduction when changing from wet to semi-dryBecause fuel consumption drops after passing to a more energy-efficient process system, CO2emissions drop up to 35% (See Graph 31).
Graph 31. Reconversion fromWet System to Semi-dry System, Supposing a DemandGrowth of 4.2%
25
152
447
210
100
200
300
400
500
Plant 1 Plant 2
$/Ton CO2 Ton CO2 (x10.000)
CORPODIB
The change of process from wet to dryA dry process (see Figure 3) is much more efficient because the heat liberated in the kiln andin the exit gases of the clinker cooler is used to preheat and in part calcinate the mix fed intothe kiln. The typical heat consumption of this kind of system is of about Kcals. 800/kilo ofclinker. A typical preheating system in four stages consumes approximately Kcal. 800/kg. ofclinker. However, the presence of alkaline elements in the raw material fed into the kiln canlimit the preheating system's efficiency, to between 850 to 900 Kcal./kg of clinker. Followingis a basic diagram of the dry process production of cement.
Figure 3. Basic Diagram of the Dry Process of Production of Cement
Precipitator
Preheater
klin
Heat generator
Filter
Filter cake
Precipitator
Technical Papers – ICPC
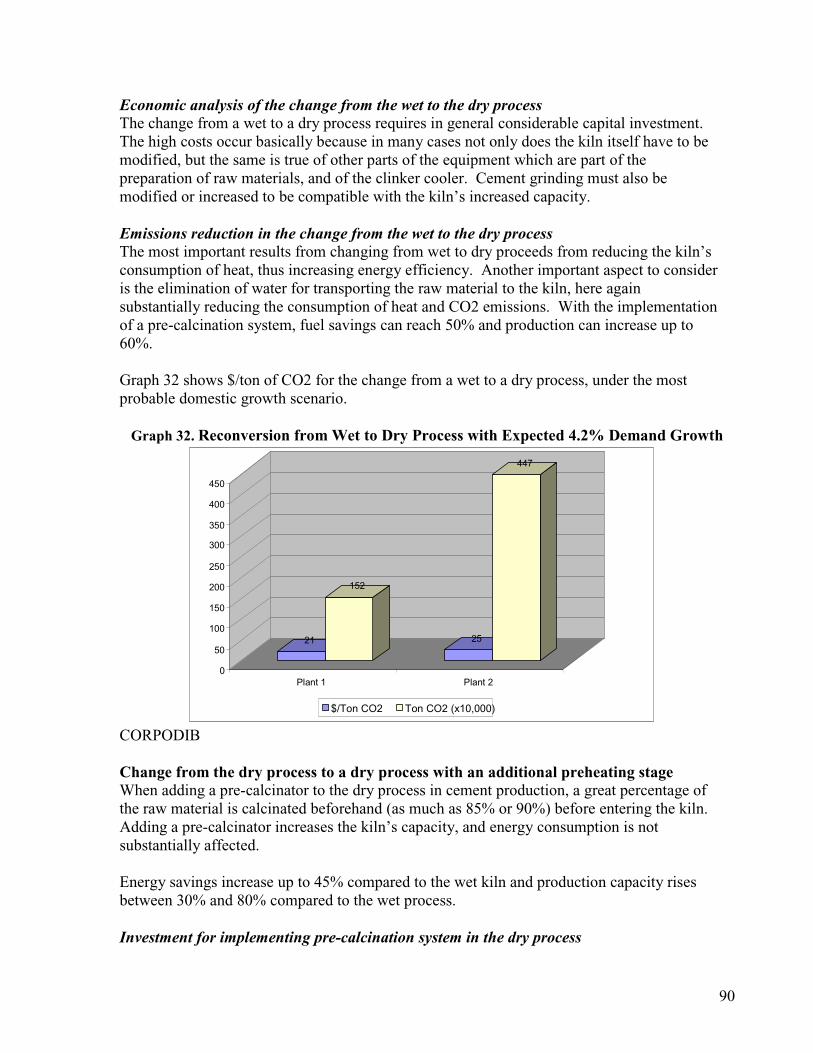
90
Economic analysis of the change from the wet to the dry processThe change from a wet to a dry process requires in general considerable capital investment.The high costs occur basically because in many cases not only does the kiln itself have to bemodified, but the same is true of other parts of the equipment which are part of thepreparation of raw materials, and of the clinker cooler. Cement grinding must also bemodified or increased to be compatible with the kiln’s increased capacity.
Emissions reduction in the change from the wet to the dry processThe most important results from changing from wet to dry proceeds from reducing the kiln’sconsumption of heat, thus increasing energy efficiency. Another important aspect to consideris the elimination of water for transporting the raw material to the kiln, here againsubstantially reducing the consumption of heat and CO2 emissions. With the implementationof a pre-calcination system, fuel savings can reach 50% and production can increase up to60%.
Graph 32 shows $/ton of CO2 for the change from a wet to a dry process, under the mostprobable domestic growth scenario.
Graph 32. Reconversion fromWet to Dry Process with Expected 4.2% Demand Growth
21
152
25
447
0
50
100
150
200
250
300
350
400
450
Plant 1 Plant 2
$/Ton CO2 Ton CO2 (x10,000)
CORPODIB
Change from the dry process to a dry process with an additional preheating stageWhen adding a pre-calcinator to the dry process in cement production, a great percentage ofthe raw material is calcinated beforehand (as much as 85% or 90%) before entering the kiln.Adding a pre-calcinator increases the kiln’s capacity, and energy consumption is notsubstantially affected.
Energy savings increase up to 45% compared to the wet kiln and production capacity risesbetween 30% and 80% compared to the wet process.
Investment for implementing pre-calcination system in the dry process
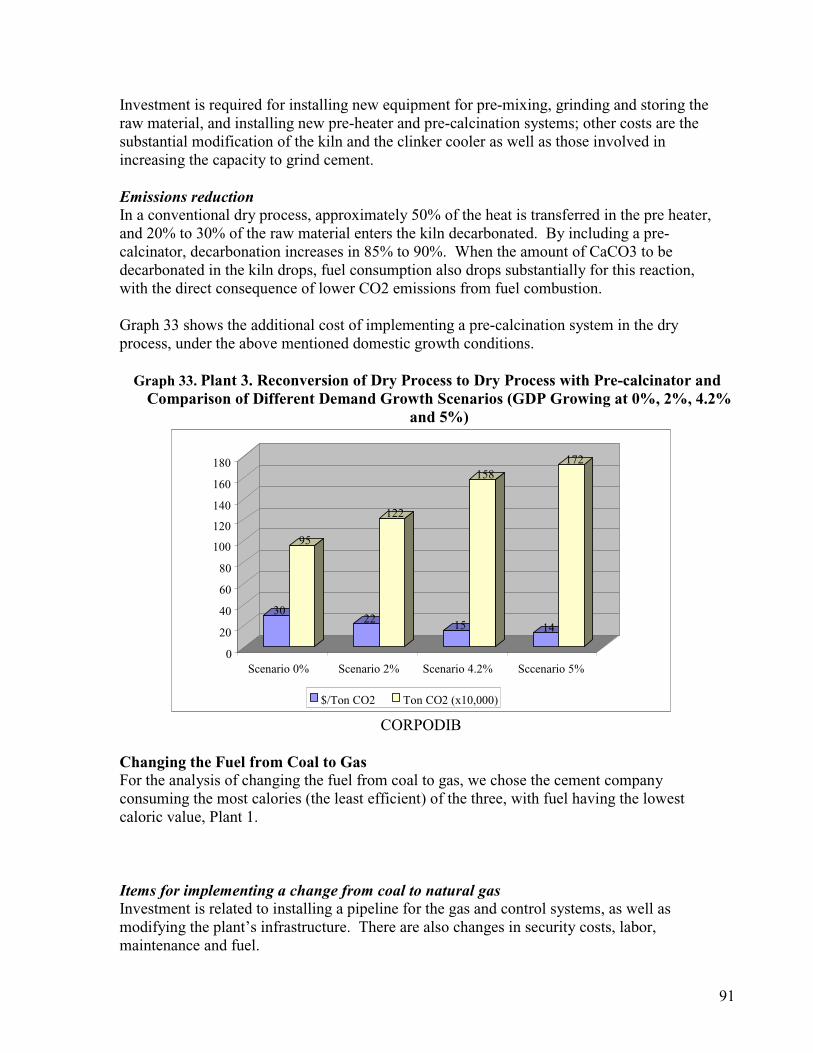
91
Investment is required for installing new equipment for pre-mixing, grinding and storing theraw material, and installing new pre-heater and pre-calcination systems; other costs are thesubstantial modification of the kiln and the clinker cooler as well as those involved inincreasing the capacity to grind cement.
Emissions reductionIn a conventional dry process, approximately 50% of the heat is transferred in the pre heater,and 20% to 30% of the raw material enters the kiln decarbonated. By including a pre-calcinator, decarbonation increases in 85% to 90%. When the amount of CaCO3 to bedecarbonated in the kiln drops, fuel consumption also drops substantially for this reaction,with the direct consequence of lower CO2 emissions from fuel combustion.
Graph 33 shows the additional cost of implementing a pre-calcination system in the dryprocess, under the above mentioned domestic growth conditions.
Graph 33. Plant 3. Reconversion of Dry Process to Dry Process with Pre-calcinator andComparison of Different Demand Growth Scenarios (GDP Growing at 0%, 2%, 4.2%
and 5%)
30
95
22
122
15
158
14
172
0
20
40
60
80
100
120
140
160
180
Scenario 0% Scenario 2% Scenario 4.2% Sccenario 5%
$/Ton CO2 Ton CO2 (x10,000)
CORPODIB
Changing the Fuel from Coal to GasFor the analysis of changing the fuel from coal to gas, we chose the cement companyconsuming the most calories (the least efficient) of the three, with fuel having the lowestcaloric value, Plant 1.
Items for implementing a change from coal to natural gasInvestment is related to installing a pipeline for the gas and control systems, as well asmodifying the plant’s infrastructure. There are also changes in security costs, labor,maintenance and fuel.
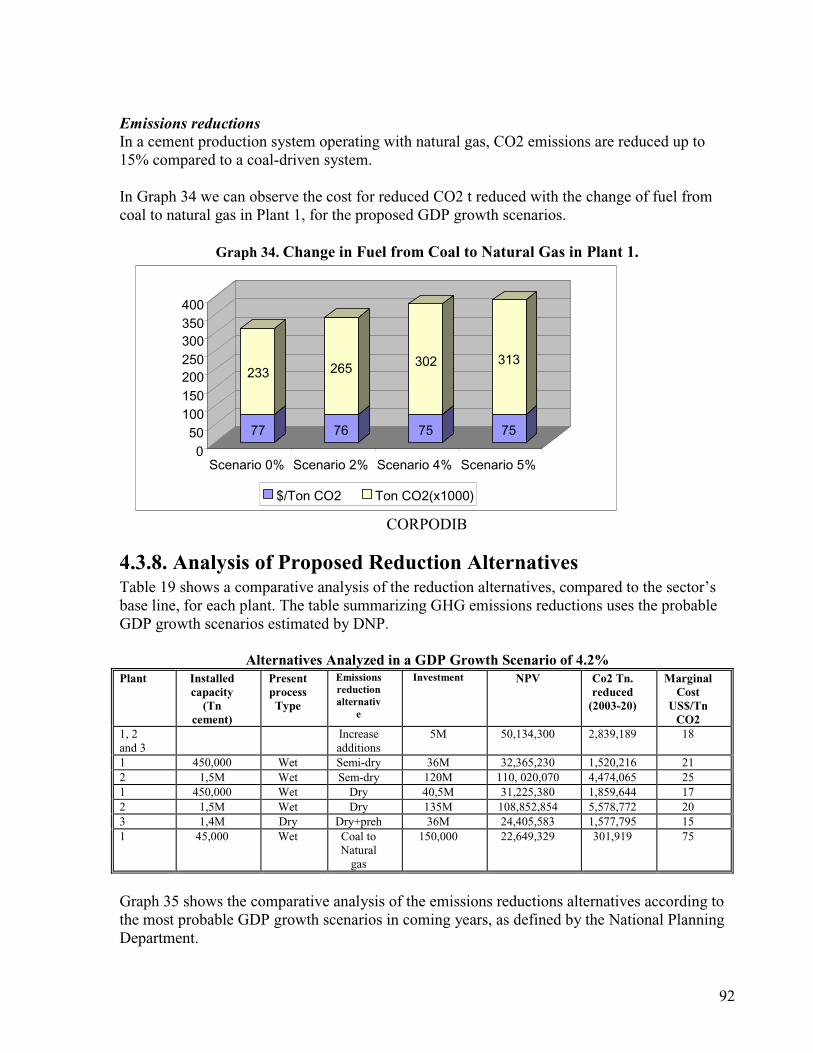
92
Emissions reductionsIn a cement production system operating with natural gas, CO2 emissions are reduced up to15% compared to a coal-driven system.
In Graph 34 we can observe the cost for reduced CO2 t reduced with the change of fuel fromcoal to natural gas in Plant 1, for the proposed GDP growth scenarios.
Graph 34. Change in Fuel from Coal to Natural Gas in Plant 1.
77
233
76
265
75
302
75
313
050100150200250300350400
Scenario 0% Scenario 2% Scenario 4% Scenario 5%
$/Ton CO2 Ton CO2(x1000)
CORPODIB
4.3.8. Analysis of Proposed Reduction AlternativesTable 19 shows a comparative analysis of the reduction alternatives, compared to the sector’sbase line, for each plant. The table summarizing GHG emissions reductions uses the probableGDP growth scenarios estimated by DNP.
Alternatives Analyzed in a GDP Growth Scenario of 4.2%Plant Installed
capacity(Tn
cement)
PresentprocessType
Emissionsreductionalternativ
e
Investment NPV Co2 Tn.reduced(2003-20)
MarginalCost
US$/TnCO2
1, 2and 3
Increaseadditions
5M 50,134,300 2,839,189 18
1 450,000 Wet Semi-dry 36M 32,365,230 1,520,216 212 1,5M Wet Sem-dry 120M 110, 020,070 4,474,065 251 450,000 Wet Dry 40,5M 31,225,380 1,859,644 172 1,5M Wet Dry 135M 108,852,854 5,578,772 203 1,4M Dry Dry+preh 36M 24,405,583 1,577,795 151 45,000 Wet Coal to
Naturalgas
150,000 22,649,329 301,919 75
Graph 35 shows the comparative analysis of the emissions reductions alternatives according tothe most probable GDP growth scenarios in coming years, as defined by the National PlanningDepartment.
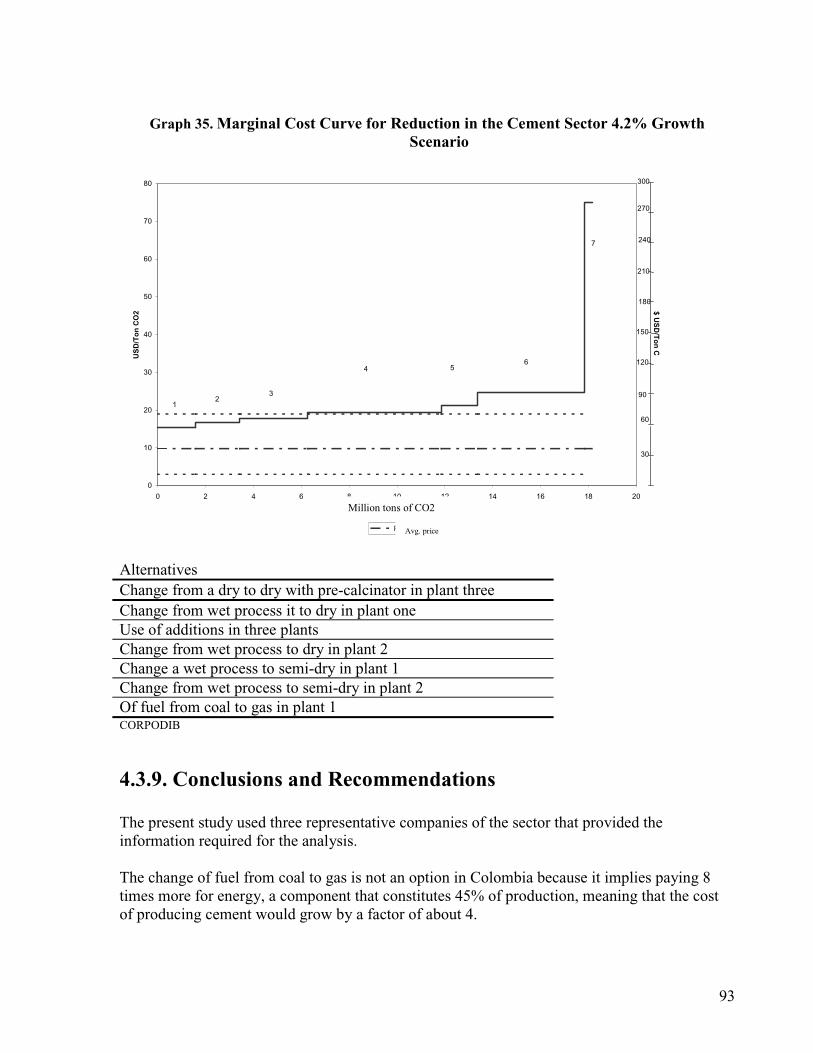
93
Graph 35. Marginal Cost Curve for Reduction in the Cement Sector 4.2% GrowthScenario
0
10
20
30
40
50
60
70
80
0 2 4 6 8 10 12 14 16 18 20
Millones de Toneladas de CO2
USD/TonCO2
Precio Medio
12
3
4 56
7
$USD/TonC
30
60
90
120
150
180
210
240
270
300
AlternativesChange from a dry to dry with pre-calcinator in plant threeChange from wet process it to dry in plant oneUse of additions in three plantsChange from wet process to dry in plant 2Change a wet process to semi-dry in plant 1Change from wet process to semi-dry in plant 2Of fuel from coal to gas in plant 1CORPODIB
4.3.9. Conclusions and Recommendations
The present study used three representative companies of the sector that provided theinformation required for the analysis.
The change of fuel from coal to gas is not an option in Colombia because it implies paying 8times more for energy, a component that constitutes 45% of production, meaning that the costof producing cement would grow by a factor of about 4.
Million tons of CO2
Avg. price
94
The results we found show that the most cost-effective alternative to reduce carbon dioxideemissions lies in the change from dry to dry with pre-heater for plant 3. The third most cost-effective alternative, the use of additions, requires investment in research and development,and the results could be implemented in all of the country's cement companies. With thisalternative, many more tons of carbon dioxide could be reduced with the same investment.
In an analysis of the reduction alternatives under a limit scenario of $19/t CO2, the viablealternatives under the Clean Development Mechanism would be: dry process with pre heaterfor Plant 3 at a cost of $15/t CO2, followed by the change from wet to dry in Plant 1 at a costof $17/t CO2 and are the use of additions at a value of $18/t CO2, applicable to the threeplants we evaluated.
Next in order, the reduction alternatives: Changing from wet to dry in Plant 2 ($20/t CO2),change from wet to semi-dry in Plant 1 ($21/t CO2), change from wet to semi-dry in Plant 2($25/t CO2) and finally the alternative of changing fuel from coal to gas in Plant 1 ($75/t CO2).
Regarding additional institutional support for the formulation and subsequent marketingand/or joint funding of cement projects under CDM, the cement sector has the ColombianInstitute of Cement Producers – ICPC - that would be willing to support attractive initiativesfor CDM projects.
95
4.4. The Panela Refining Sector: Potential Benefits andCompetitiveness
The social and economic importance of the production of brown sugar (panela) in Colombia isunquestioned, for it is one of the principal agricultural activities of the domestic economy andaccounts for an appreciable part of agricultural GDP. In addition, the production of brownsugar is second in importance after coffee, both because of the number of productive units andbecause of the employment it generates (REDAR – Colombia, 1990).
Thus, determining the economic potential of GHG emissions reductions in the brown sugarsector is an important exercise for Colombian agriculture, identifying and evaluating thoseprojects that transfer and develop technology and are thus the most adequate for developingunder CDM
Given the large number of brown sugar producing units (approximately 25,000), most of whichare family businesses, the case was selected to demonstrate the need for creating Promoters’Groups in brown sugar producing regions, to encourage the owners of sugar mills to work underCDM. On an individual basis, these sugar producers would have no access to information onthe opportunity CDM offers or on the methodology for developing and presenting projects. Foran individual, the costs of searching for Annex B partners and negotiating, formulating,executing, monitoring and certifying—all necessary activities for a project--would beimpossible to overcome. The Promoters’ Groups could provide training for the producers andbring together many small projects under a single large regional CDM project. With large high-quality projects, they could obtain approval domestically, seek out Annex 1 partners andcoordinate the execution of projects. This model could be useful for other sectors that havesimilar conditions.
The low efficiency of combustion in traditional systems leads to the consumption of fuels, inaddition to bagasse, like wood, to the detriment of the environment. The indiscriminate fellingof timber for combustion in inefficient kilns creates constant pressures on forests, biodiversity,and streams, and also erodes the soil. This damage has not yet been documented.
To develop this study, we compiled relevant information on the present situation of the brownsugar sector in Colombia, identifying items like the level of production, the type technologypresently in use and the emissions levels, among others. To compile this information, supportwas provided by the Ministry of Agriculture, Federacion Nacional de Paneleros, CorporacionColombiana de Investigacion Agropecuaria and by a number of producers’ associations in thecountry.
We visited several brown sugar-producing companies in the country and analyzed theirproduction on site and examined the type of technology they use. Based on the information wecompiled and field trips, we estimated the cost of implementing reductions in the conventionalproduction system, the cost curves for each alternative and the level of emissions reduction and
96
its potential value of between 2000 and 2010. Finally, we formulated a project that can bejointly funded and/or marketed under the CDM.
Because brown sugar production is widely dispersed throughout Colombia (present in nearly allDepartments), we selected four areas (Departments of Cundinamarca, Nariño, Antioquia andBoyaca-Santander) with high levels of production and where the implications of technology aresignificant; there we studied the different GHG reduction alternatives. These were analyzedunder the most probable GDP growth scenario of 4.2%, according to the National PlanningDepartment’s estimates.
4.4.1. Promoters’ Group for Connecting the Sector with CDMWith regard to job creation, it is believed that sugar cane cultivation and brown sugarprocessing are the productive activities using the most labor per harvested and transformedhectare. At present about 25 million workdays for 350,000 persons, that is 12% of theeconomically active rural population, are the labor input for brown sugar production; aftercoffee, this is the largest sector in terms of employment.
Given the large number of brown sugar producing units (approximately 25,000), most of whichare family businesses, the case was selected to demonstrate the need for creating Promoters’Groups in brown sugar producing regions, to encourage the owners of sugar mills to work underCDM.
On an individual basis, these sugar producers would have no access to information on theopportunity CDM offers or on the methodology for developing and presenting projects. For anindividual, the costs of searching for Annex B partners and negotiating, formulating, executing,monitoring and certifying—all necessary activities for a project--would be impossible toovercome. (The chapter on institutions in the present study clearly presents the numeroustransaction costs associated with the CDM project cycle.) The Promoters’ Groups couldprovide training for the producers and bring together many small projects under a single largeregional CDM project. With large high-quality projects, they could obtain approvaldomestically, seek out Annex 1 partners and coordinate the execution of projects. This will bethe only way to reduce the information and transaction costs associated with CDMimplementation in this sector.
The Promoters’ Groups must be organized and directed by the brown sugar sector itself, in themost efficient and representative way possible. The Ministry of the Environment’s office forapproving and promoting projects must support the organization, and include it in the nationalplan for CDM training. A flat and flexible organization is proposed, growing only in responseto the needs of the reconversion program under CDM. We envisage an eminently technicalorganization operating in two phases, defined as follows:
Phase 1. During the first year of the Promoters’ Group will operate with a minimum ofpersonnel involved in training, start-ups, planning, coordinating and managing the initial phaseof the CDM project. During this initial phase financial sources are identified (under CDM),potential Annex B investors are lined up, agreements among landowners are concluded,distribution channels for efficient technology are created and suppliers are identified. This first
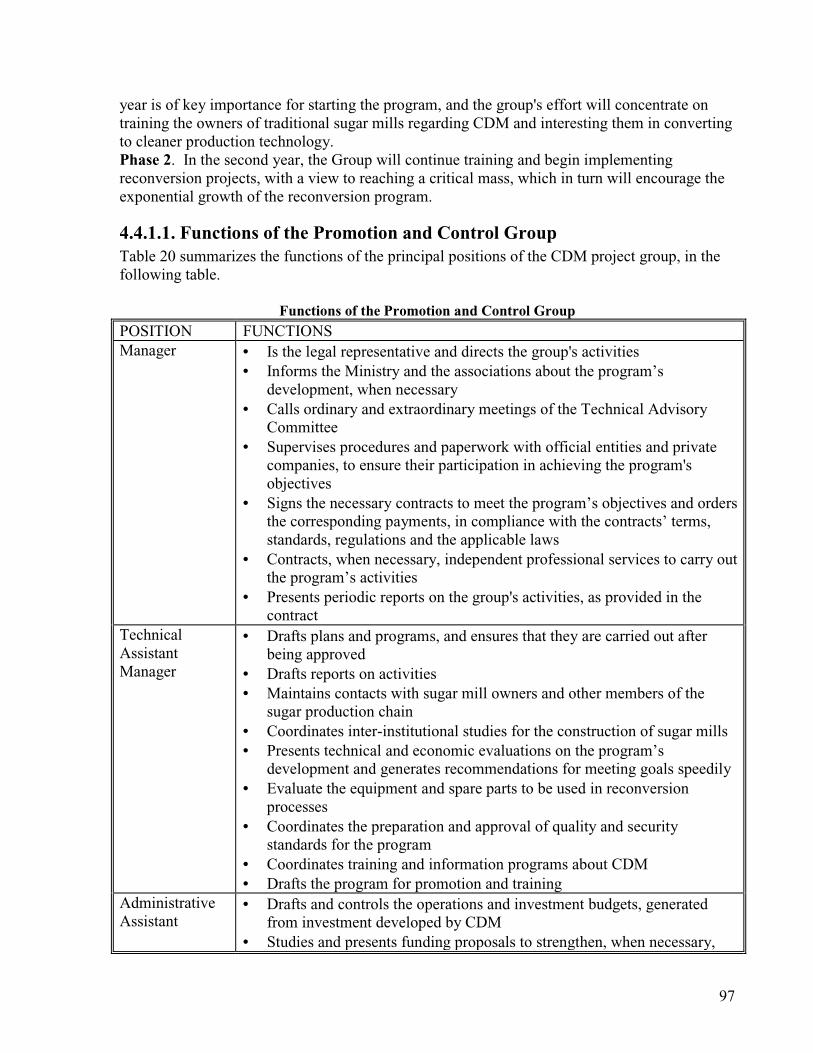
97
year is of key importance for starting the program, and the group's effort will concentrate ontraining the owners of traditional sugar mills regarding CDM and interesting them in convertingto cleaner production technology.Phase 2. In the second year, the Group will continue training and begin implementingreconversion projects, with a view to reaching a critical mass, which in turn will encourage theexponential growth of the reconversion program.
4.4.1.1. Functions of the Promotion and Control GroupTable 20 summarizes the functions of the principal positions of the CDM project group, in thefollowing table.
Functions of the Promotion and Control GroupPOSITION FUNCTIONSManager • Is the legal representative and directs the group's activities
• Informs the Ministry and the associations about the program’sdevelopment, when necessary
• Calls ordinary and extraordinary meetings of the Technical AdvisoryCommittee
• Supervises procedures and paperwork with official entities and privatecompanies, to ensure their participation in achieving the program'sobjectives
• Signs the necessary contracts to meet the program’s objectives and ordersthe corresponding payments, in compliance with the contracts’ terms,standards, regulations and the applicable laws
• Contracts, when necessary, independent professional services to carry outthe program’s activities
• Presents periodic reports on the group's activities, as provided in thecontract
TechnicalAssistantManager
• Drafts plans and programs, and ensures that they are carried out afterbeing approved
• Drafts reports on activities• Maintains contacts with sugar mill owners and other members of thesugar production chain
• Coordinates inter-institutional studies for the construction of sugar mills• Presents technical and economic evaluations on the program’sdevelopment and generates recommendations for meeting goals speedily
• Evaluate the equipment and spare parts to be used in reconversionprocesses
• Coordinates the preparation and approval of quality and securitystandards for the program
• Coordinates training and information programs about CDM• Drafts the program for promotion and training
AdministrativeAssistant
• Drafts and controls the operations and investment budgets, generatedfrom investment developed by CDM
• Studies and presents funding proposals to strengthen, when necessary,
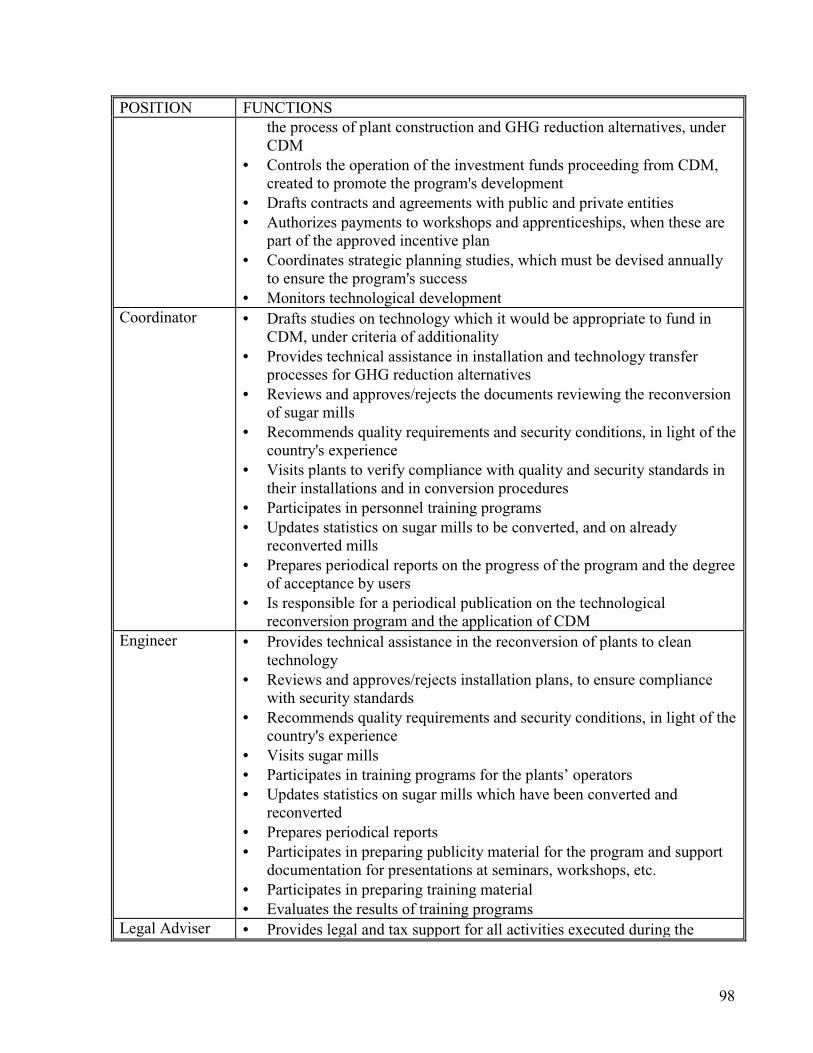
98
POSITION FUNCTIONSthe process of plant construction and GHG reduction alternatives, underCDM
• Controls the operation of the investment funds proceeding from CDM,created to promote the program's development
• Drafts contracts and agreements with public and private entities• Authorizes payments to workshops and apprenticeships, when these arepart of the approved incentive plan
• Coordinates strategic planning studies, which must be devised annuallyto ensure the program's success
• Monitors technological developmentCoordinator • Drafts studies on technology which it would be appropriate to fund in
CDM, under criteria of additionality• Provides technical assistance in installation and technology transferprocesses for GHG reduction alternatives
• Reviews and approves/rejects the documents reviewing the reconversionof sugar mills
• Recommends quality requirements and security conditions, in light of thecountry's experience
• Visits plants to verify compliance with quality and security standards intheir installations and in conversion procedures
• Participates in personnel training programs• Updates statistics on sugar mills to be converted, and on alreadyreconverted mills
• Prepares periodical reports on the progress of the program and the degreeof acceptance by users
• Is responsible for a periodical publication on the technologicalreconversion program and the application of CDM
Engineer • Provides technical assistance in the reconversion of plants to cleantechnology
• Reviews and approves/rejects installation plans, to ensure compliancewith security standards
• Recommends quality requirements and security conditions, in light of thecountry's experience
• Visits sugar mills• Participates in training programs for the plants’ operators• Updates statistics on sugar mills which have been converted andreconverted
• Prepares periodical reports• Participates in preparing publicity material for the program and supportdocumentation for presentations at seminars, workshops, etc.
• Participates in preparing training material• Evaluates the results of training programs
Legal Adviser • Provides legal and tax support for all activities executed during the
99
POSITION FUNCTIONSimplementation of the reconversion program of the Colombian brownsugar sector, including the application of CDM
CORPODIB
4.4.1.2. Budgets of the Promotion and Control GroupThe budget includes the yearly operating costs of the Promoters’ Group for the technologicalreconversion of the brown sugar sector; we note that the funds for training, promotion andcontrol of the Clean Development Mechanism are required to achieve the program's objectives.The group is expected to operate during 10 years, after which the program will have beenimplemented for the most part, and further improvement, and also research and development,will be assumed by the sector’s associations.
4.4.1.3. Training and Promotion for Technological Conversion n the BrownSugar Sector
In the success of a program of this magnitude, much depends on our capacity for promoting orselling the program, principally to the owners or operators of sugar mills. The general criteriathat must guide the promotion of the training programs are as follows:• To generate the right expectations about CDM, its probability of being ratified, the CERprice and the opportunities all this offers
• To direct publicity plans, during the first two years, to the owners of sugar mills who belongto one of the existing producers' associations
• To use the media--radio, press and billboards--to communicate messages with theappropriate cultural context
• To portray the converted sugar mills in advertising• To work on promotion with the existing brown sugar producers associations in a direct andsynergistic manner
• To hold conferences explaining the program’s operation, its justification, benefits andparticipants
• To direct these conferences to persons at all levels of the program• To design, with the assistance of specialists, a promotional program in line with theprogram's objectives; to devise budgets and programs, and create indicators to measure theeffectiveness of the promotional plan
• To sign contracts with the media--advertising companies, radio and the press--in accordancewith the needs of the promotional plan
• To prepare a program of visits to sugar mills• To hold joint and individual meetings with the owners of sugar mills• To hold seminars and workshops on the conversion program and CDM investment,including users, distributors and suppliers
• To publish leaflets, technical papers, press releases and radio interviews.
Training programsIn the conversion program, training will have to comply with two goals, of key importance fordeveloping the program: first, to help to achieve compliance with quality and security standards
100
in using the new technology, and second to promote the general program for applying CDMprojects, emphasizing the fundamental criterion of additionality. Regarding design, theprogram’s coverage must include the different kinds of personnel involved in it, such as:owners, operators and personnel working in conversions and maintenance, etc.Among the topics to be considered in the training program for formulating projects capable ofassuring funding under CDM, we consider among others:• Calculation of the base line, and the concept of additionality• Procedure for calculating the reductions from the proposed alternatives• Financial analysis of the reductions project• Project’s life cycle• Calculating the cost per reduced ton in the reduction project• Analysis of mitigation risks and alternatives in the present and future of the project• Analysis of the environmental and social benefits associated with the implementation of theCDM project.
4.4.2. Present Situation of Brown Sugar Production in Colombia
4.4.2.1. Characteristics of Brown Sugar ProductionIn Colombia in 1994, 225,000 hectares of sugar cane were grown for the production of panela(panela), of which 189,972 hectares were harvested; in terms of land surface, this is the 6th cropin Colombia63. In 1994, the production of panela was 1,053,000 hectares, with an average yieldof 5.5 t/per harvested hectare. Even so, this average does not represent large existingdifferences owed to the heterogeneity of the social, economic and technological contexts ofproduction.
Panela is a product of fundamental importance in the traditional diet in Colombia. The countryis the first producer of brown sugar in the American Hemisphere and the second in the worldafter India (see graph below). In per capita terms, Colombia is first, with an averageconsumption of 25.5 kg. of brown sugar per year per person.
In Colombia, the land used to produce cane for brown sugar is about 225,999 ha. There areabout 70,000 productive agricultural unit growing sugar to make panelas and approximately20,000 sugar mills where panela and molasses are processed.
The production of brown sugar is thus a mainstay of the Colombian agricultural economy, witha significant participation in agricultural GDP, among other reasons. In 1994, the production ofpanela was worth $300B pesos and contributed 5.5% to agricultural GDP, it is the country’s 7thagricultural product (See Graph 36).
63 Ministry of Agriculture. 1995.
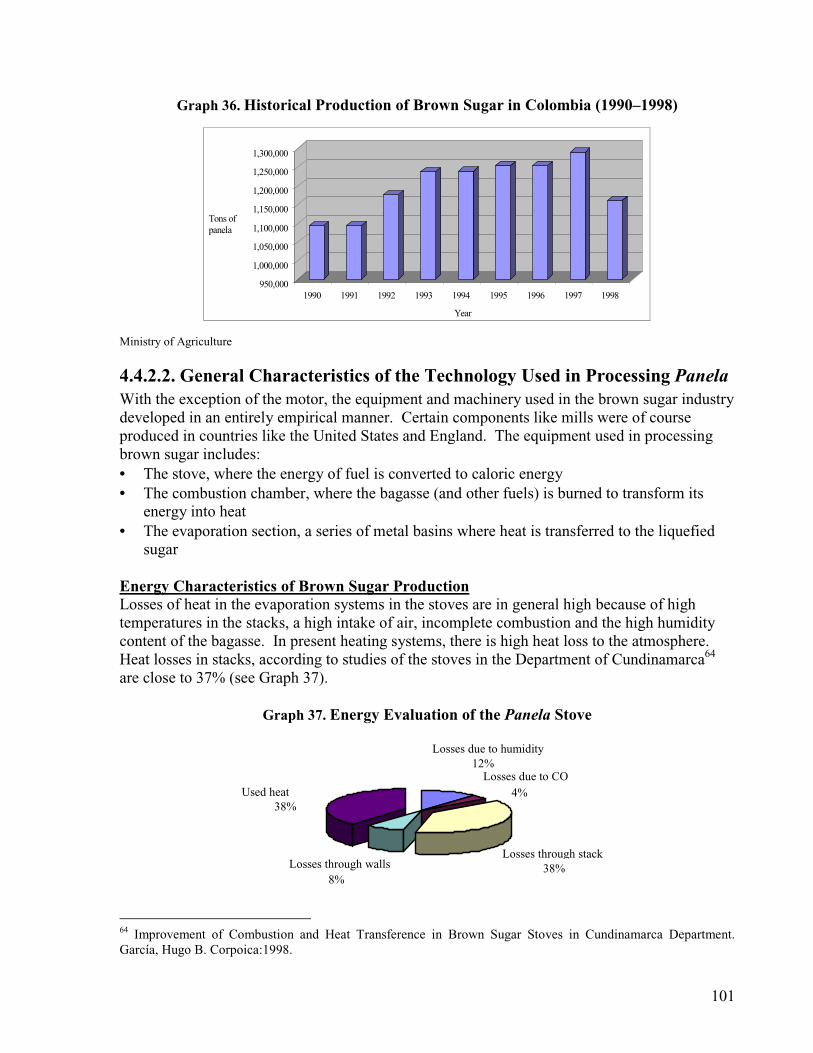
101
Graph 36. Historical Production of Brown Sugar in Colombia (1990–1998)
950,000
1,000,000
1,050,000
1,100,000
1,150,000
1,200,000
1,250,000
1,300,000
Tons ofpanela
1990 1991 1992 1993 1994 1995 1996 1997 1998
Year
( )
Ministry of Agriculture
4.4.2.2. General Characteristics of the Technology Used in Processing PanelaWith the exception of the motor, the equipment and machinery used in the brown sugar industrydeveloped in an entirely empirical manner. Certain components like mills were of courseproduced in countries like the United States and England. The equipment used in processingbrown sugar includes:• The stove, where the energy of fuel is converted to caloric energy• The combustion chamber, where the bagasse (and other fuels) is burned to transform itsenergy into heat
• The evaporation section, a series of metal basins where heat is transferred to the liquefiedsugar
Energy Characteristics of Brown Sugar ProductionLosses of heat in the evaporation systems in the stoves are in general high because of hightemperatures in the stacks, a high intake of air, incomplete combustion and the high humiditycontent of the bagasse. In present heating systems, there is high heat loss to the atmosphere.Heat losses in stacks, according to studies of the stoves in the Department of Cundinamarca64
are close to 37% (see Graph 37).
Graph 37. Energy Evaluation of the Panela Stove
Losses due to CO4%
Losses through stack38%Losses through walls
8%
Used heat38%
Losses due to humidity12%
64 Improvement of Combustion and Heat Transference in Brown Sugar Stoves in Cundinamarca Department.García, Hugo B. Corpoica:1998.
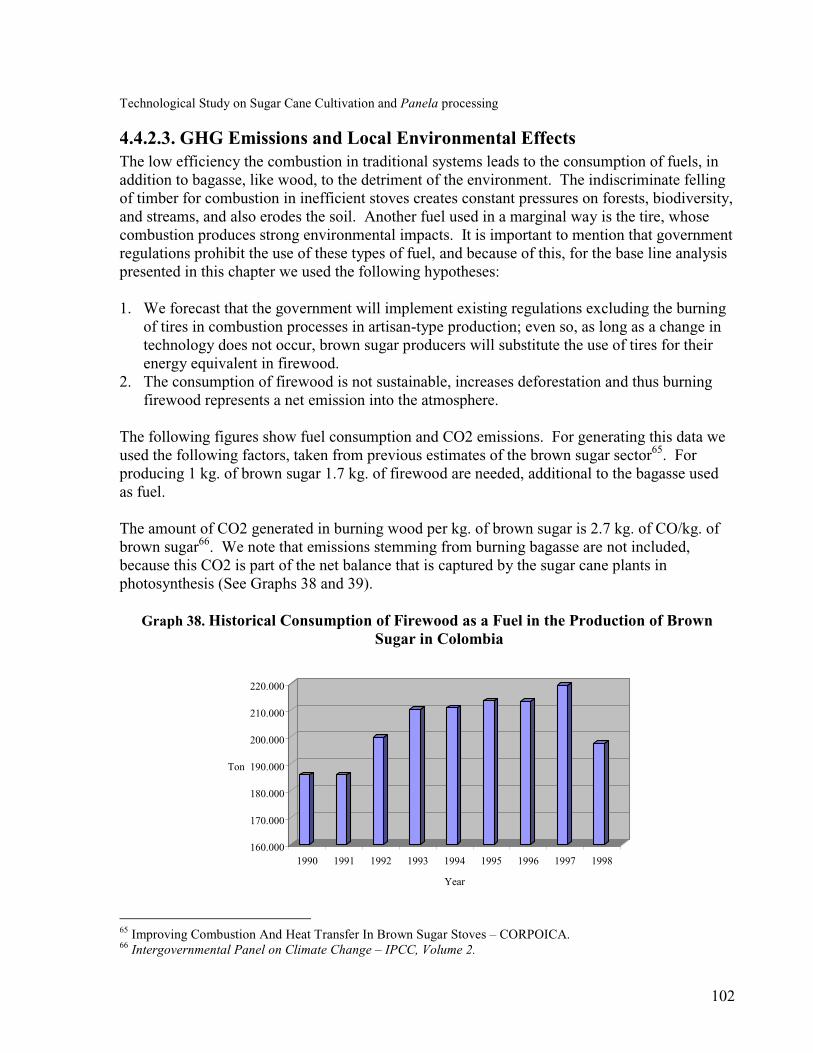
102
Technological Study on Sugar Cane Cultivation and Panela processing
4.4.2.3. GHG Emissions and Local Environmental EffectsThe low efficiency the combustion in traditional systems leads to the consumption of fuels, inaddition to bagasse, like wood, to the detriment of the environment. The indiscriminate fellingof timber for combustion in inefficient stoves creates constant pressures on forests, biodiversity,and streams, and also erodes the soil. Another fuel used in a marginal way is the tire, whosecombustion produces strong environmental impacts. It is important to mention that governmentregulations prohibit the use of these types of fuel, and because of this, for the base line analysispresented in this chapter we used the following hypotheses:
1. We forecast that the government will implement existing regulations excluding the burningof tires in combustion processes in artisan-type production; even so, as long as a change intechnology does not occur, brown sugar producers will substitute the use of tires for theirenergy equivalent in firewood.
2. The consumption of firewood is not sustainable, increases deforestation and thus burningfirewood represents a net emission into the atmosphere.
The following figures show fuel consumption and CO2 emissions. For generating this data weused the following factors, taken from previous estimates of the brown sugar sector65. Forproducing 1 kg. of brown sugar 1.7 kg. of firewood are needed, additional to the bagasse usedas fuel.
The amount of CO2 generated in burning wood per kg. of brown sugar is 2.7 kg. of CO/kg. ofbrown sugar66. We note that emissions stemming from burning bagasse are not included,because this CO2 is part of the net balance that is captured by the sugar cane plants inphotosynthesis (See Graphs 38 and 39).
Graph 38. Historical Consumption of Firewood as a Fuel in the Production of BrownSugar in Colombia
160.000
170.000
180.000
190.000
200.000
210.000
220.000
Ton
1990 1991 1992 1993 1994 1995 1996 1997 1998
Year
65 Improving Combustion And Heat Transfer In Brown Sugar Stoves – CORPOICA.66 Intergovernmental Panel on Climate Change – IPCC, Volume 2.
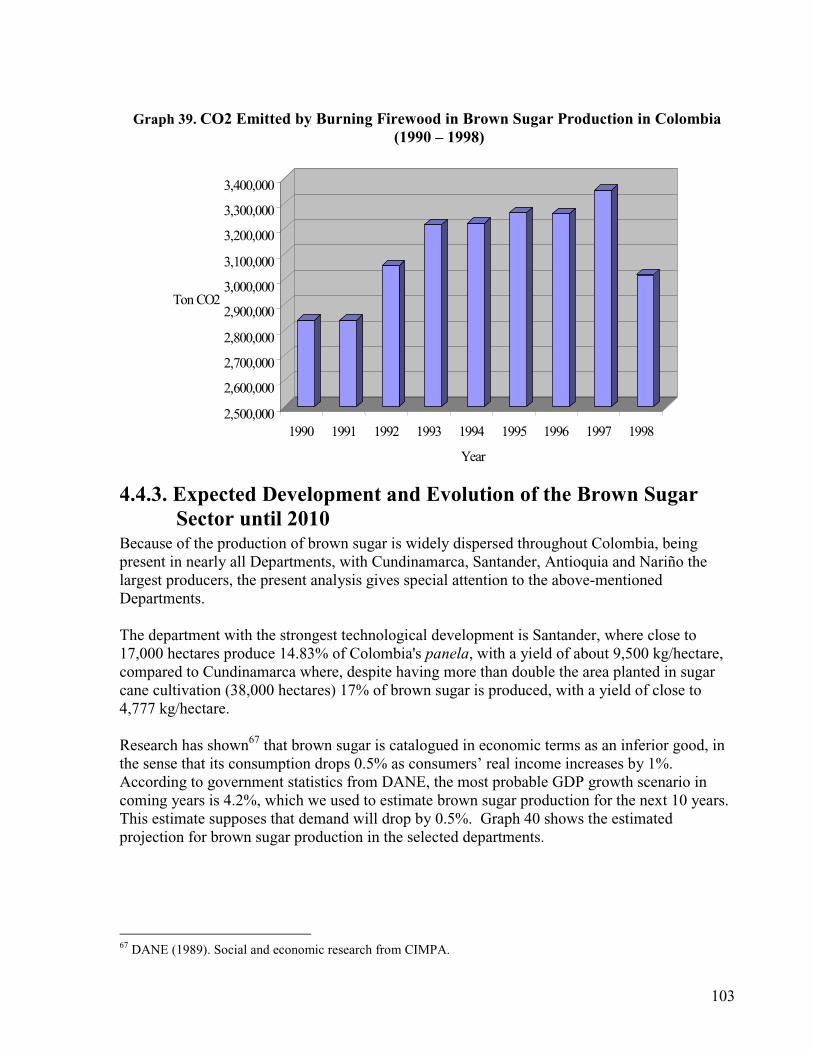
103
Graph 39. CO2 Emitted by Burning Firewood in Brown Sugar Production in Colombia(1990 – 1998)
2,500,000
2,600,000
2,700,000
2,800,000
2,900,000
3,000,000
3,100,000
3,200,000
3,300,000
3,400,000
TonCO2
1990 1991 1992 1993 1994 1995 1996 1997 1998
Year
4.4.3. Expected Development and Evolution of the Brown SugarSector until 2010
Because of the production of brown sugar is widely dispersed throughout Colombia, beingpresent in nearly all Departments, with Cundinamarca, Santander, Antioquia and Nariño thelargest producers, the present analysis gives special attention to the above-mentionedDepartments.
The department with the strongest technological development is Santander, where close to17,000 hectares produce 14.83% of Colombia's panela, with a yield of about 9,500 kg/hectare,compared to Cundinamarca where, despite having more than double the area planted in sugarcane cultivation (38,000 hectares) 17% of brown sugar is produced, with a yield of close to4,777 kg/hectare.
Research has shown67 that brown sugar is catalogued in economic terms as an inferior good, inthe sense that its consumption drops 0.5% as consumers’ real income increases by 1%.According to government statistics from DANE, the most probable GDP growth scenario incoming years is 4.2%, which we used to estimate brown sugar production for the next 10 years.This estimate supposes that demand will drop by 0.5%. Graph 40 shows the estimatedprojection for brown sugar production in the selected departments.
67 DANE (1989). Social and economic research from CIMPA.
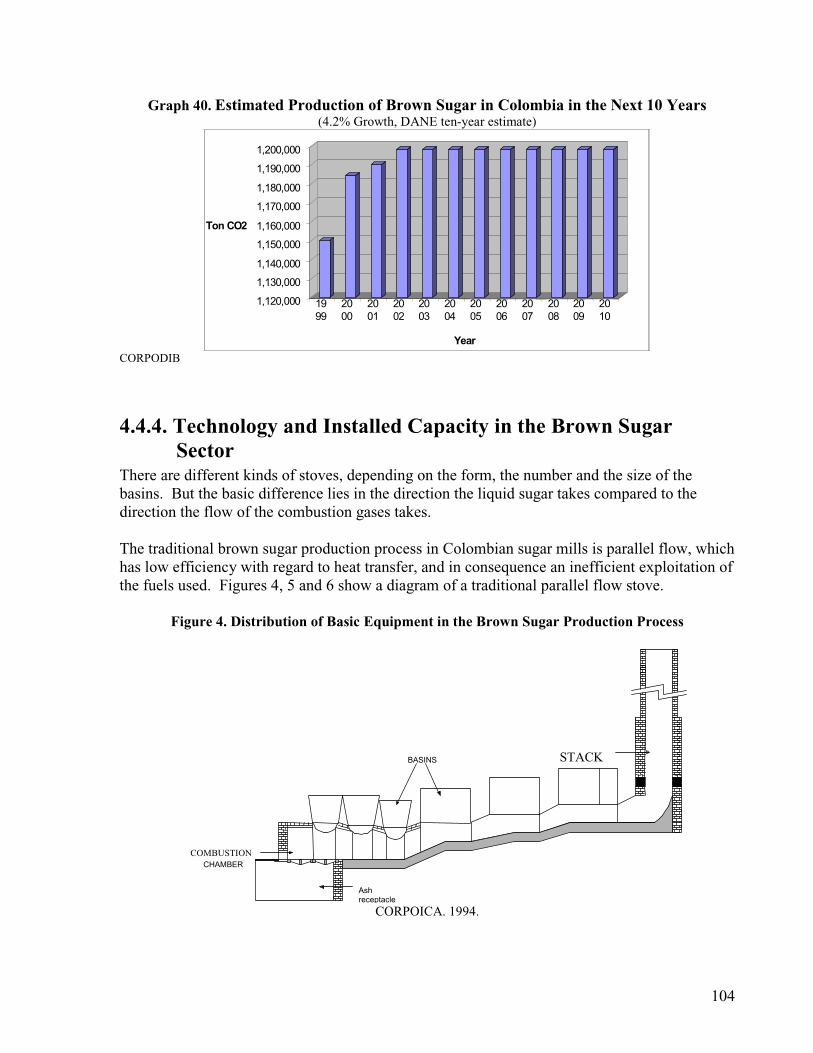
104
Graph 40. Estimated Production of Brown Sugar in Colombia in the Next 10 Years(4.2% Growth, DANE ten-year estimate)
1,120,000
1,130,000
1,140,000
1,150,000
1,160,000
1,170,000
1,180,000
1,190,000
1,200,000
Ton CO2
1999
2000
2001
2002
2003
2004
2005
2006
2007
2008
2009
2010
Year
CORPODIB
4.4.4. Technology and Installed Capacity in the Brown SugarSector
There are different kinds of stoves, depending on the form, the number and the size of thebasins. But the basic difference lies in the direction the liquid sugar takes compared to thedirection the flow of the combustion gases takes.
The traditional brown sugar production process in Colombian sugar mills is parallel flow, whichhas low efficiency with regard to heat transfer, and in consequence an inefficient exploitation ofthe fuels used. Figures 4, 5 and 6 show a diagram of a traditional parallel flow stove.
Figure 4. Distribution of Basic Equipment in the Brown Sugar Production Process
STACKBASINS
COMBUSTIONCHAMBER
Ashreceptacle
CORPOICA. 1994.
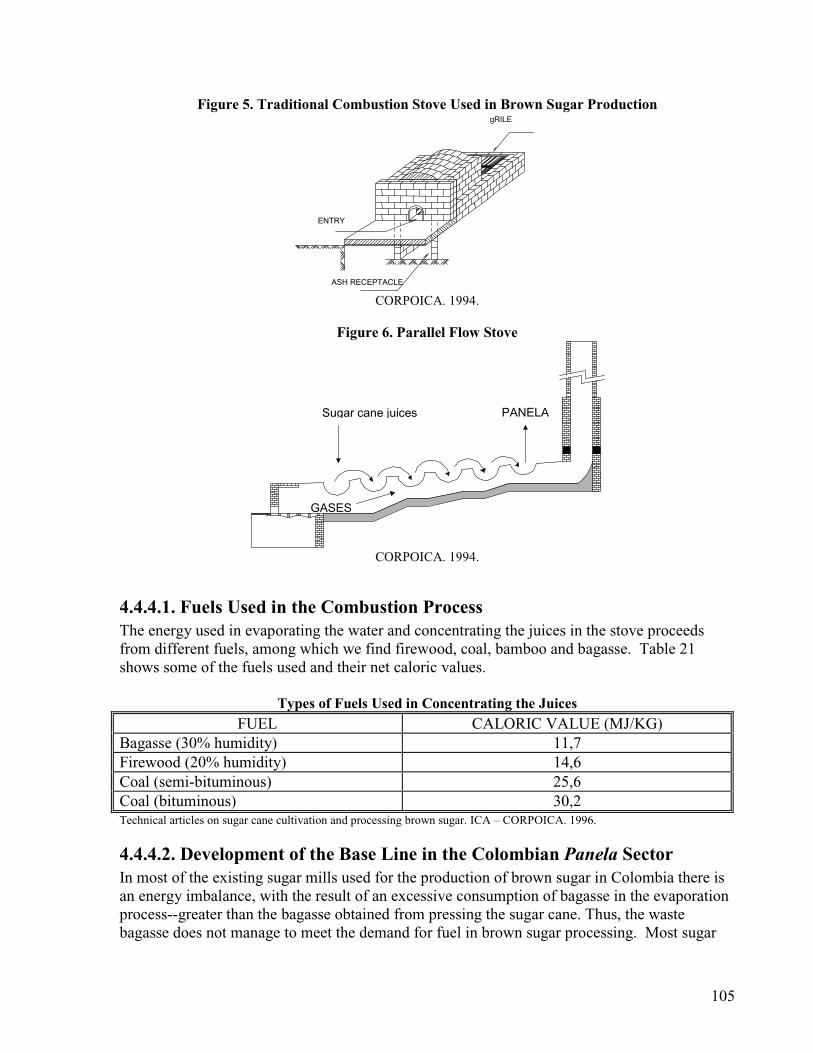
105
Figure 5. Traditional Combustion Stove Used in Brown Sugar Production
ASH RECEPTACLE
ENTRY
gRILE
CORPOICA. 1994.
Figure 6. Parallel Flow Stove
Sugar cane juices PANELA
GASES
CORPOICA. 1994.
4.4.4.1. Fuels Used in the Combustion ProcessThe energy used in evaporating the water and concentrating the juices in the stove proceedsfrom different fuels, among which we find firewood, coal, bamboo and bagasse. Table 21shows some of the fuels used and their net caloric values.
Types of Fuels Used in Concentrating the JuicesFUEL CALORIC VALUE (MJ/KG)
Bagasse (30% humidity) 11,7Firewood (20% humidity) 14,6Coal (semi-bituminous) 25,6Coal (bituminous) 30,2Technical articles on sugar cane cultivation and processing brown sugar. ICA – CORPOICA. 1996.
4.4.4.2. Development of the Base Line in the Colombian Panela SectorIn most of the existing sugar mills used for the production of brown sugar in Colombia there isan energy imbalance, with the result of an excessive consumption of bagasse in the evaporationprocess--greater than the bagasse obtained from pressing the sugar cane. Thus, the wastebagasse does not manage to meet the demand for fuel in brown sugar processing. Most sugar
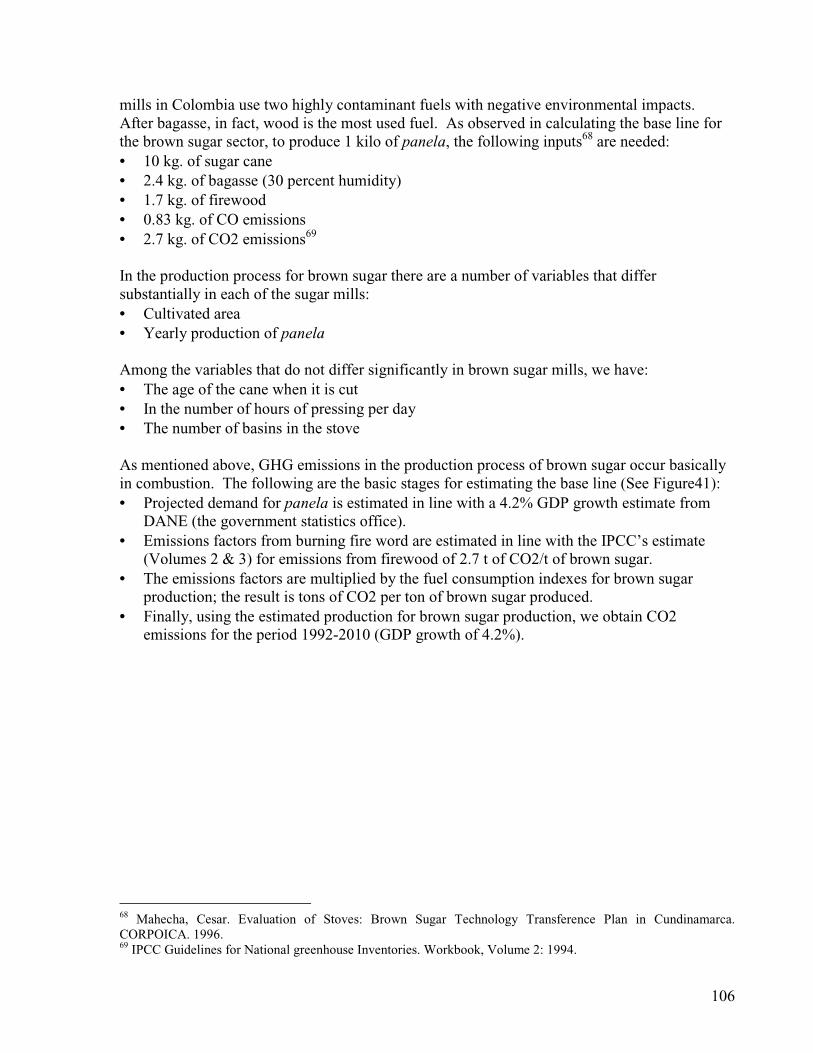
106
mills in Colombia use two highly contaminant fuels with negative environmental impacts.After bagasse, in fact, wood is the most used fuel. As observed in calculating the base line forthe brown sugar sector, to produce 1 kilo of panela, the following inputs68 are needed:• 10 kg. of sugar cane• 2.4 kg. of bagasse (30 percent humidity)• 1.7 kg. of firewood• 0.83 kg. of CO emissions• 2.7 kg. of CO2 emissions69
In the production process for brown sugar there are a number of variables that differsubstantially in each of the sugar mills:• Cultivated area• Yearly production of panela
Among the variables that do not differ significantly in brown sugar mills, we have:• The age of the cane when it is cut• In the number of hours of pressing per day• The number of basins in the stove
As mentioned above, GHG emissions in the production process of brown sugar occur basicallyin combustion. The following are the basic stages for estimating the base line (See Figure41):• Projected demand for panela is estimated in line with a 4.2% GDP growth estimate fromDANE (the government statistics office).
• Emissions factors from burning fire word are estimated in line with the IPCC’s estimate(Volumes 2 & 3) for emissions from firewood of 2.7 t of CO2/t of brown sugar.
• The emissions factors are multiplied by the fuel consumption indexes for brown sugarproduction; the result is tons of CO2 per ton of brown sugar produced.
• Finally, using the estimated production for brown sugar production, we obtain CO2emissions for the period 1992-2010 (GDP growth of 4.2%).
68 Mahecha, Cesar. Evaluation of Stoves: Brown Sugar Technology Transference Plan in Cundinamarca.CORPOICA. 1996.69 IPCC Guidelines for National greenhouse Inventories. Workbook, Volume 2: 1994.
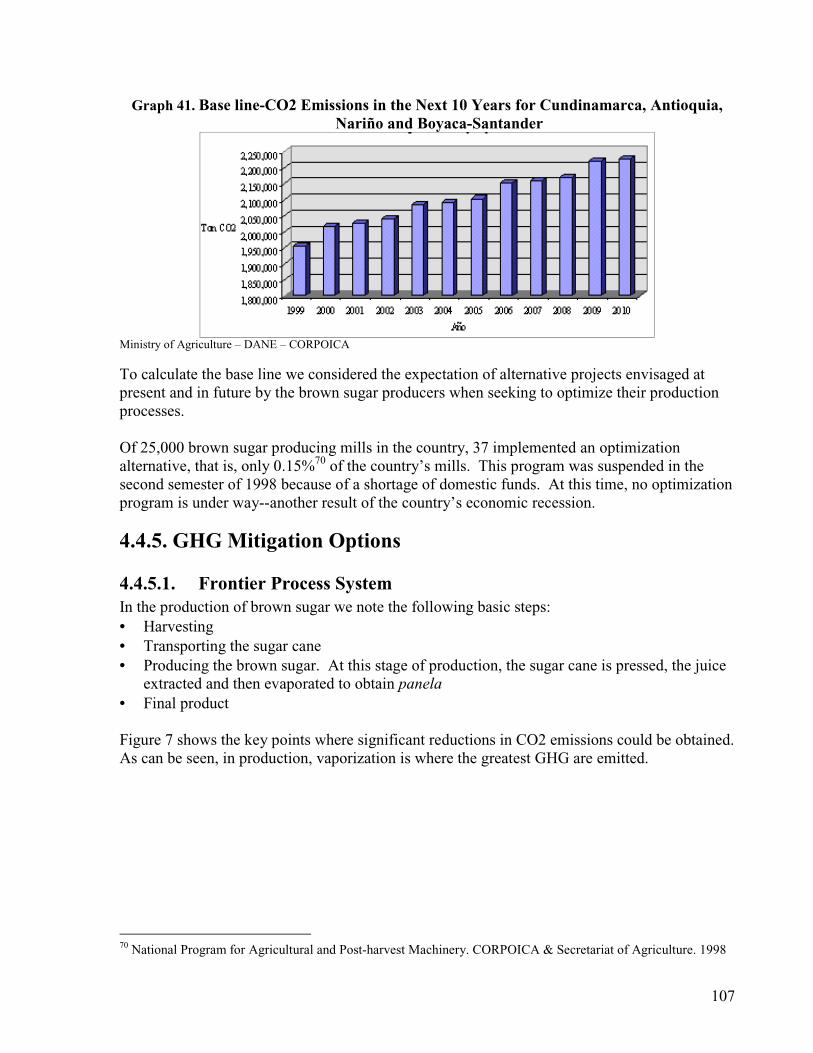
107
Graph 41. Base line-CO2 Emissions in the Next 10 Years for Cundinamarca, Antioquia,Nariño and Boyaca-Santander
Ministry of Agriculture – DANE – CORPOICA
To calculate the base line we considered the expectation of alternative projects envisaged atpresent and in future by the brown sugar producers when seeking to optimize their productionprocesses.
Of 25,000 brown sugar producing mills in the country, 37 implemented an optimizationalternative, that is, only 0.15%70 of the country’s mills. This program was suspended in thesecond semester of 1998 because of a shortage of domestic funds. At this time, no optimizationprogram is under way--another result of the country’s economic recession.
4.4.5. GHGMitigation Options
4.4.5.1. Frontier Process SystemIn the production of brown sugar we note the following basic steps:• Harvesting• Transporting the sugar cane• Producing the brown sugar. At this stage of production, the sugar cane is pressed, the juiceextracted and then evaporated to obtain panela
• Final product
Figure 7 shows the key points where significant reductions in CO2 emissions could be obtained.As can be seen, in production, vaporization is where the greatest GHG are emitted.
70 National Program for Agricultural and Post-harvest Machinery. CORPOICA & Secretariat of Agriculture. 1998
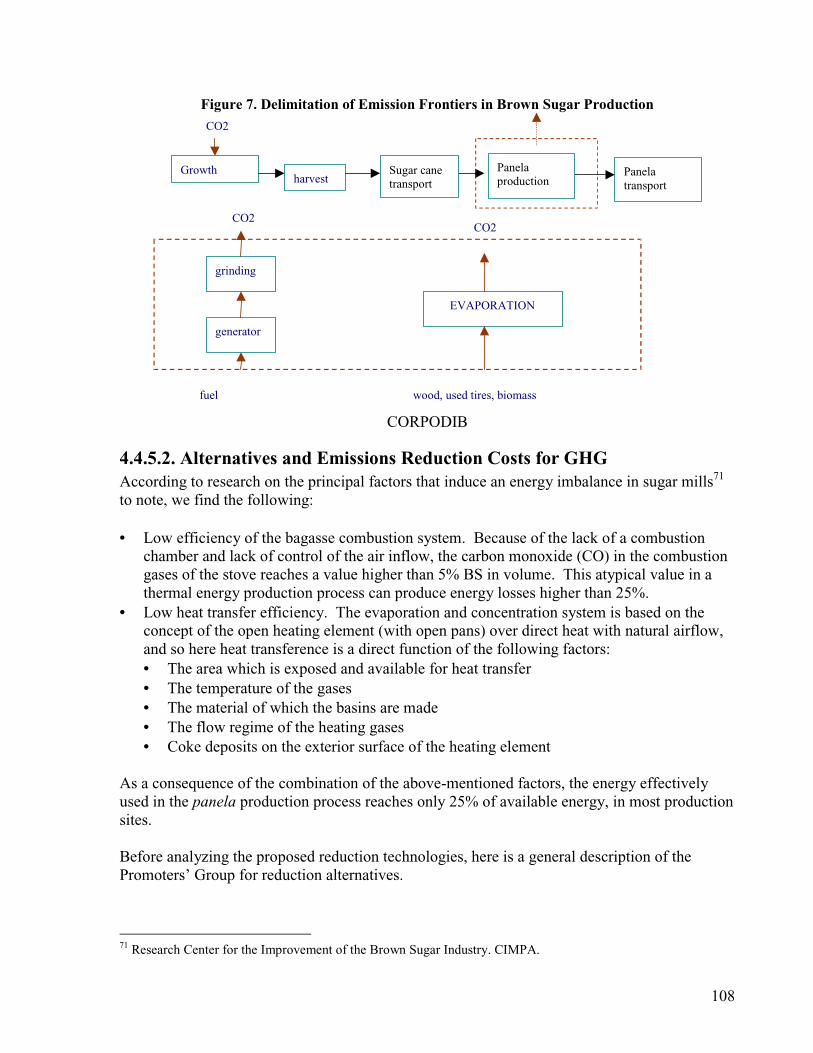
108
Figure 7. Delimitation of Emission Frontiers in Brown Sugar Production
CO2CO2
fuel wood, used tires, biomass
Growthharvest
Sugar canetransport
Panelatransport
CO2
grinding
generator
EVAPORATION
Panelaproduction
CORPODIB
4.4.5.2. Alternatives and Emissions Reduction Costs for GHGAccording to research on the principal factors that induce an energy imbalance in sugar mills71
to note, we find the following:
• Low efficiency of the bagasse combustion system. Because of the lack of a combustionchamber and lack of control of the air inflow, the carbon monoxide (CO) in the combustiongases of the stove reaches a value higher than 5% BS in volume. This atypical value in athermal energy production process can produce energy losses higher than 25%.
• Low heat transfer efficiency. The evaporation and concentration system is based on theconcept of the open heating element (with open pans) over direct heat with natural airflow,and so here heat transference is a direct function of the following factors:• The area which is exposed and available for heat transfer• The temperature of the gases• The material of which the basins are made• The flow regime of the heating gases• Coke deposits on the exterior surface of the heating element
As a consequence of the combination of the above-mentioned factors, the energy effectivelyused in the panela production process reaches only 25% of available energy, in most productionsites.
Before analyzing the proposed reduction technologies, here is a general description of thePromoters’ Group for reduction alternatives.
71 Research Center for the Improvement of the Brown Sugar Industry. CIMPA.
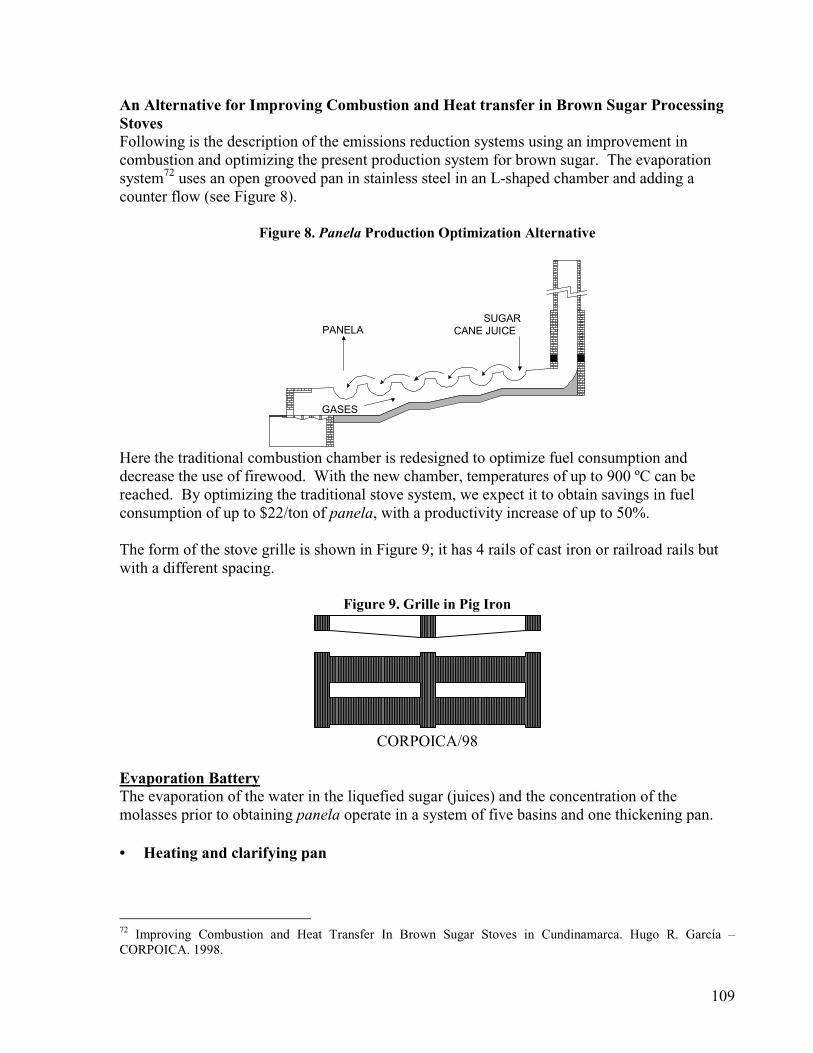
109
An Alternative for Improving Combustion and Heat transfer in Brown Sugar ProcessingStovesFollowing is the description of the emissions reduction systems using an improvement incombustion and optimizing the present production system for brown sugar. The evaporationsystem72 uses an open grooved pan in stainless steel in an L-shaped chamber and adding acounter flow (see Figure 8).
Figure 8. Panela Production Optimization Alternative
PANELASUGAR
CANE JUICE
GASES
Here the traditional combustion chamber is redesigned to optimize fuel consumption anddecrease the use of firewood. With the new chamber, temperatures of up to 900 ºC can bereached. By optimizing the traditional stove system, we expect it to obtain savings in fuelconsumption of up to $22/ton of panela, with a productivity increase of up to 50%.
The form of the stove grille is shown in Figure 9; it has 4 rails of cast iron or railroad rails butwith a different spacing.
Figure 9. Grille in Pig Iron
CORPOICA/98
Evaporation BatteryThe evaporation of the water in the liquefied sugar (juices) and the concentration of themolasses prior to obtaining panela operate in a system of five basins and one thickening pan.
• Heating and clarifying pan
72 Improving Combustion and Heat Transfer In Brown Sugar Stoves in Cundinamarca. Hugo R. García –CORPOICA. 1998.
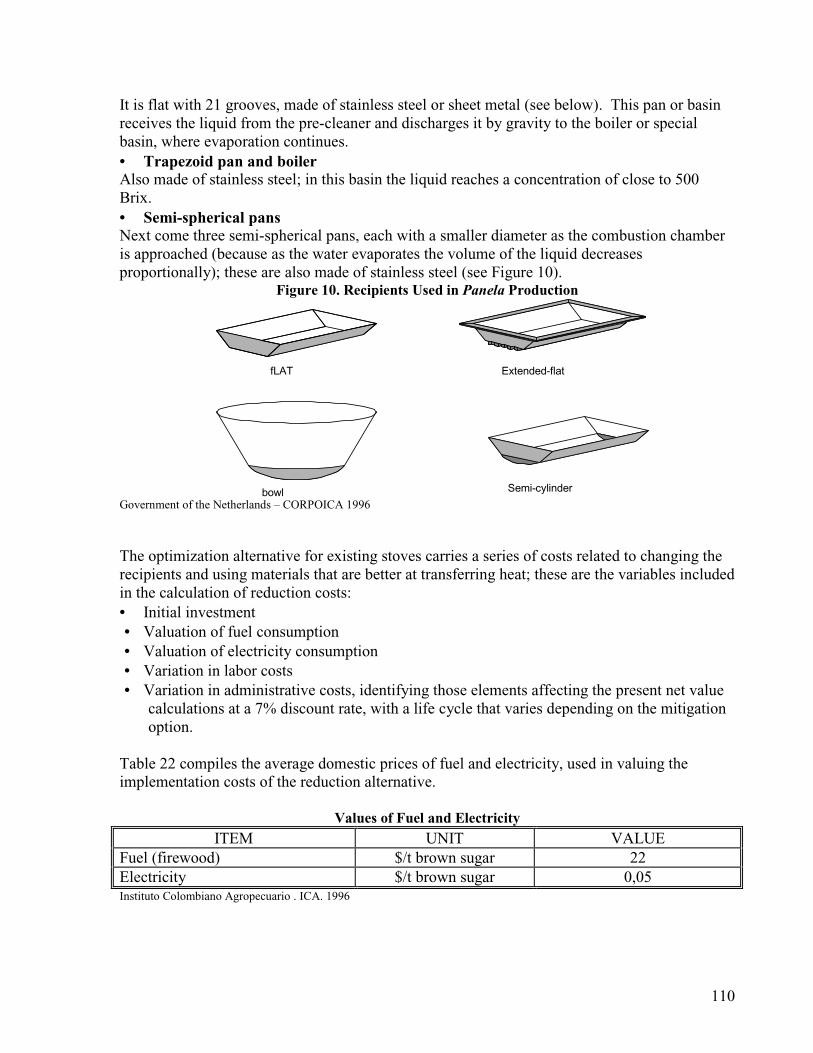
110
It is flat with 21 grooves, made of stainless steel or sheet metal (see below). This pan or basinreceives the liquid from the pre-cleaner and discharges it by gravity to the boiler or specialbasin, where evaporation continues.• Trapezoid pan and boilerAlso made of stainless steel; in this basin the liquid reaches a concentration of close to 500Brix.• Semi-spherical pansNext come three semi-spherical pans, each with a smaller diameter as the combustion chamberis approached (because as the water evaporates the volume of the liquid decreasesproportionally); these are also made of stainless steel (see Figure 10).
Figure 10. Recipients Used in Panela Production
fLAT Extended-flat
bowl Semi-cylinder
Government of the Netherlands – CORPOICA 1996
Reduction costsThe optimization alternative for existing stoves carries a series of costs related to changing therecipients and using materials that are better at transferring heat; these are the variables includedin the calculation of reduction costs:• Initial investment• Valuation of fuel consumption• Valuation of electricity consumption• Variation in labor costs• Variation in administrative costs, identifying those elements affecting the present net valuecalculations at a 7% discount rate, with a life cycle that varies depending on the mitigationoption.
Table 22 compiles the average domestic prices of fuel and electricity, used in valuing theimplementation costs of the reduction alternative.
Values of Fuel and ElectricityITEM UNIT VALUE
Fuel (firewood) $/t brown sugar 22Electricity $/t brown sugar 0,05Instituto Colombiano Agropecuario . ICA. 1996
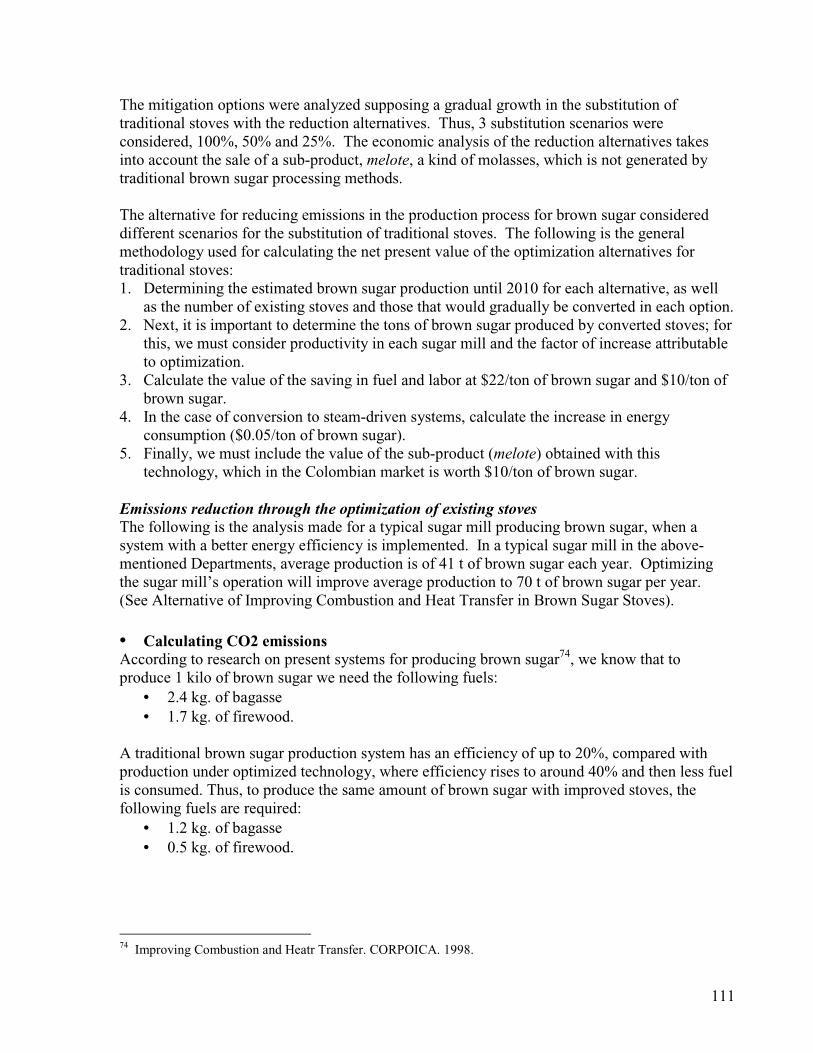
111
The mitigation options were analyzed supposing a gradual growth in the substitution oftraditional stoves with the reduction alternatives. Thus, 3 substitution scenarios wereconsidered, 100%, 50% and 25%. The economic analysis of the reduction alternatives takesinto account the sale of a sub-product, melote, a kind of molasses, which is not generated bytraditional brown sugar processing methods.
The alternative for reducing emissions in the production process for brown sugar considereddifferent scenarios for the substitution of traditional stoves. The following is the generalmethodology used for calculating the net present value of the optimization alternatives fortraditional stoves:1. Determining the estimated brown sugar production until 2010 for each alternative, as wellas the number of existing stoves and those that would gradually be converted in each option.
2. Next, it is important to determine the tons of brown sugar produced by converted stoves; forthis, we must consider productivity in each sugar mill and the factor of increase attributableto optimization.
3. Calculate the value of the saving in fuel and labor at $22/ton of brown sugar and $10/ton ofbrown sugar.
4. In the case of conversion to steam-driven systems, calculate the increase in energyconsumption ($0.05/ton of brown sugar).
5. Finally, we must include the value of the sub-product (melote) obtained with thistechnology, which in the Colombian market is worth $10/ton of brown sugar.
Emissions reduction through the optimization of existing stovesThe following is the analysis made for a typical sugar mill producing brown sugar, when asystem with a better energy efficiency is implemented. In a typical sugar mill in the above-mentioned Departments, average production is of 41 t of brown sugar each year. Optimizingthe sugar mill’s operation will improve average production to 70 t of brown sugar per year.(See Alternative of Improving Combustion and Heat Transfer in Brown Sugar Stoves).
• Calculating CO2 emissionsAccording to research on present systems for producing brown sugar74, we know that toproduce 1 kilo of brown sugar we need the following fuels:
• 2.4 kg. of bagasse• 1.7 kg. of firewood.
A traditional brown sugar production system has an efficiency of up to 20%, compared withproduction under optimized technology, where efficiency rises to around 40% and then less fuelis consumed. Thus, to produce the same amount of brown sugar with improved stoves, thefollowing fuels are required:
• 1.2 kg. of bagasse• 0.5 kg. of firewood.
74 Improving Combustion and Heatr Transfer. CORPOICA. 1998.
112
To calculate CO2 emissions, we used the indexes reported for firewood in Vols, 2 & 3 of theIPCC study. Emissions from burning bagasse are captured by the sugar cane plants in theirgrowth process by photosynthesis.
These are the emissions factors per ton of brown sugar:• 2.7 t of CO2/ton brown sugar, traditional stove process• 1.4 t of CO2/ton brown sugar, improved stove process.
With the demand forecast and the preceding factors, we can determine the base line foremissions for the traditional production process, and emissions for the reduction alternative (SeeGraph 42).
Graph 42. Base Line for a Traditional Sugar Mill and the Reduction Alternative
0
50
100
150
1999 2001 2003 2005 2007 2009
year
TonCO2
Ton CO2 Trad. stove
Ton CO2 alternative
CORPODIB• Value of the reductionTo estimate the value of the emissions reduction in the period 2001-2010, we analyze thefollowing factors:
• Investment: approximately $6,500 per sugar mill• Maintenance costs: estimated at 1% of the investment• Fuel costs: about $22/t of brown sugar are saved through implementing the reduction• Labor costs: about $10/t brown sugar are saved through implementing the reduction• Income from selling melote: additional income is obtained through selling melote in thereduction alternative, approximately $10/t brown sugar
• Discount rate: 7%
The cost per reduced ton is approximately $4/t CO2 for a traditional sugar mill.By optimizing the traditional stove a great reduction in environmental pollution could beobtained, because the use of firewood as an additional fuel is avoided, preventing felling treesthat are on average five years old, with a concomitant reduction of carbon monoxide of up to30%.
Alternative System Using SteamSteam technology allows the energy supplied for the brown sugar production process to bemore effectively used. Among items to be taken into account we find easy control oftemperature and ease of maintaining constant pressure in the system, and also the capacity to
113
transport large amounts of energy with the use of a small amount of mass. Using bagasse as theprincipal fuel and in a smaller proportion, firewood.
Here is a general description of the equipment used in manufacturing brown sugar, usingsteam75.
The BoilerThe humid bagasse, as it exits from the extraction process, is burned in an automatic tubularboiler specially designed for this purpose. The boiler generates steam at a pressure of about 100pounds, corresponding to a temperature of about 176 C.
The boiler can burn other solid fuels or hydrocarbons at the same time, if required to; inparticular, it can cleanly burn coal, an inexpensive and ecological fuel.
The equipment has a automatic control systems for operation and for cleaning the gases whichare emitted.
ClarifierIt is made of stainless steel; the juice exiting from the pre-cleaning system is heated andfloculated with natural elements; the floculated substance is extracted and put aside for otherapplications. A system of stainless steel tubes transfers the required heat to the liquid, whosetemperature is raised by stages in controlled fluctuations until it finally reaches its boiling point.The clarifier is an open recipient, and thus it is easy to clean the liquid and the heat exchangetubes.
EvaporatorHere the liquid is boiled, reducing its water content; its concentration rises quickly to 65 Brix.The evaporation system is an open one for reasons of hygiene, management and controllingbubbles. The evaporation system has the following characteristics:• The recipient which holds condensed liquid at 65 Brix., also capable of reaching the boilingpoint with steam from the boiler, to reach higher concentrations.
• An multiple point outflow system that delivers the product at 29 Brix. ready for finalprocessing, molding or granulation.
The system also has platforms for the operators, piping for the steam and for the return ofcondensed water to the furnace, as well as control and monitoring systems (see Figure 11).
75 Dynaterm Thermal Engineering. Brown Sugar: A Steam-driven Production System.
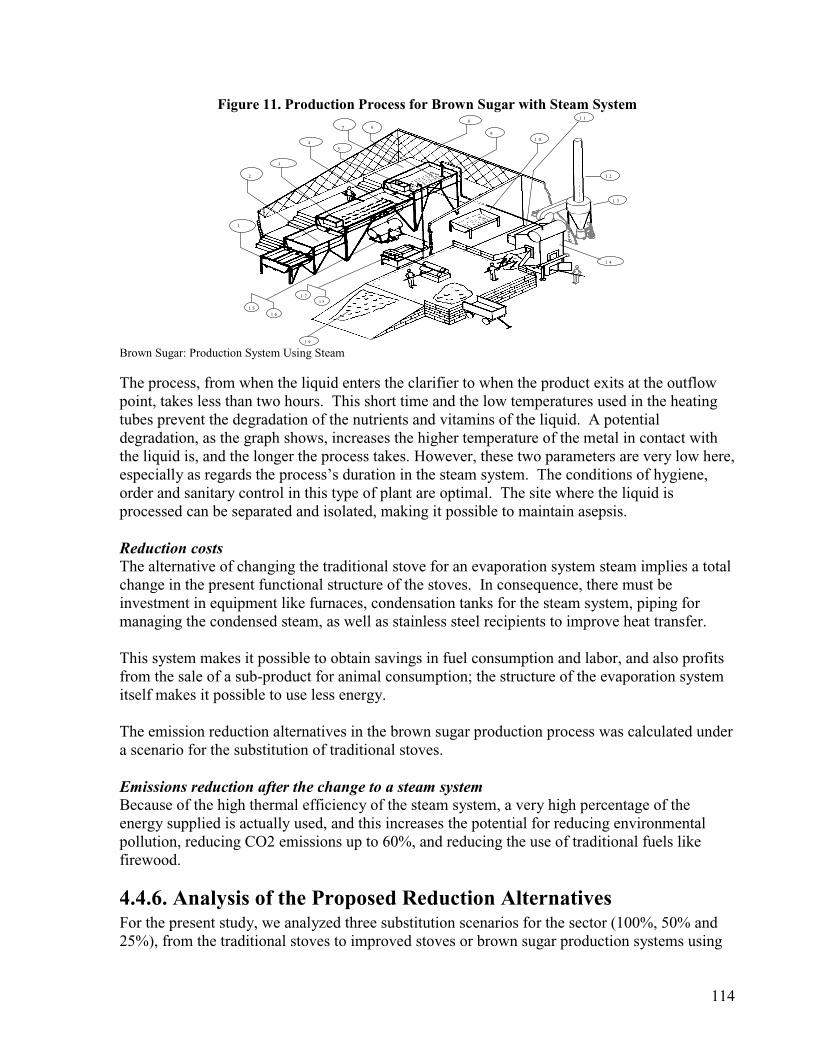
114
Figure 11. Production Process for Brown Sugar with Steam System7
45
6
3
2
1
8
91 0
1 1
1 2
1 3
1 4
1 51 6
1 71 8
1 9
Brown Sugar: Production System Using Steam
The process, from when the liquid enters the clarifier to when the product exits at the outflowpoint, takes less than two hours. This short time and the low temperatures used in the heatingtubes prevent the degradation of the nutrients and vitamins of the liquid. A potentialdegradation, as the graph shows, increases the higher temperature of the metal in contact withthe liquid is, and the longer the process takes. However, these two parameters are very low here,especially as regards the process’s duration in the steam system. The conditions of hygiene,order and sanitary control in this type of plant are optimal. The site where the liquid isprocessed can be separated and isolated, making it possible to maintain asepsis.
Reduction costsThe alternative of changing the traditional stove for an evaporation system steam implies a totalchange in the present functional structure of the stoves. In consequence, there must beinvestment in equipment like furnaces, condensation tanks for the steam system, piping formanaging the condensed steam, as well as stainless steel recipients to improve heat transfer.
This system makes it possible to obtain savings in fuel consumption and labor, and also profitsfrom the sale of a sub-product for animal consumption; the structure of the evaporation systemitself makes it possible to use less energy.
The emission reduction alternatives in the brown sugar production process was calculated undera scenario for the substitution of traditional stoves.
Emissions reduction after the change to a steam systemBecause of the high thermal efficiency of the steam system, a very high percentage of theenergy supplied is actually used, and this increases the potential for reducing environmentalpollution, reducing CO2 emissions up to 60%, and reducing the use of traditional fuels likefirewood.
4.4.6. Analysis of the Proposed Reduction AlternativesFor the present study, we analyzed three substitution scenarios for the sector (100%, 50% and25%), from the traditional stoves to improved stoves or brown sugar production systems using
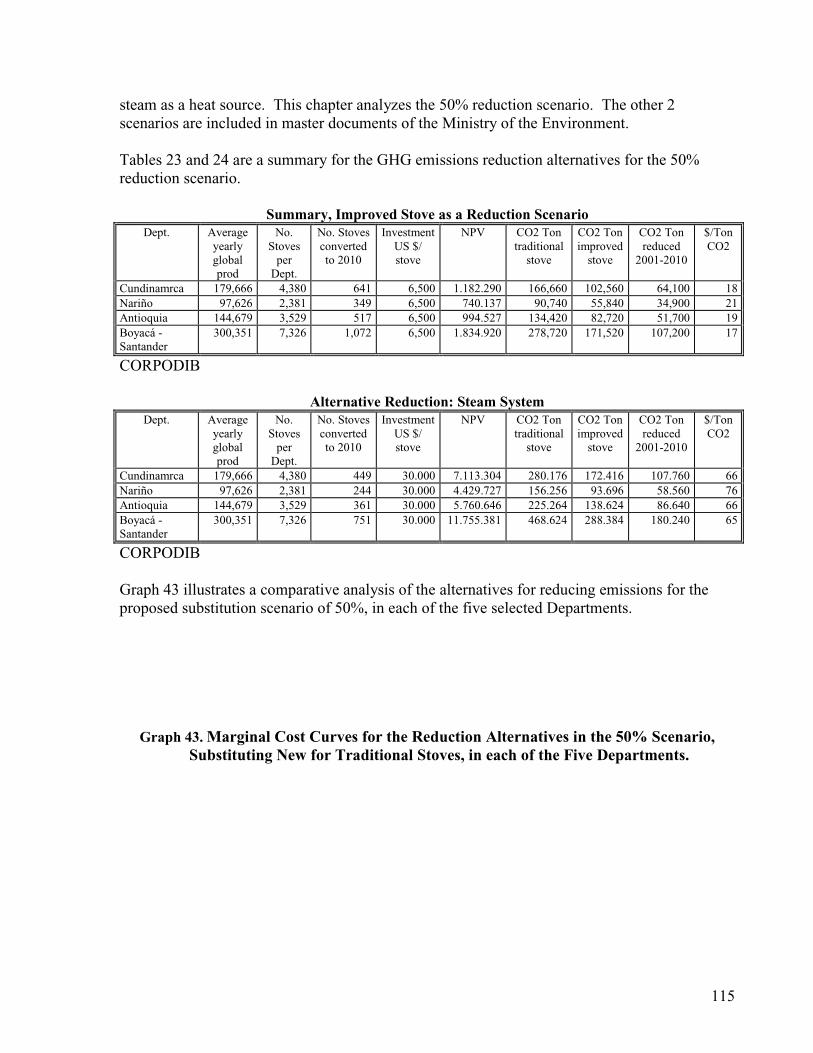
115
steam as a heat source. This chapter analyzes the 50% reduction scenario. The other 2scenarios are included in master documents of the Ministry of the Environment.
Tables 23 and 24 are a summary for the GHG emissions reduction alternatives for the 50%reduction scenario.
Summary, Improved Stove as a Reduction ScenarioDept. Average
yearlyglobalprod
No.StovesperDept.
No. Stovesconvertedto 2010
InvestmentUS $/stove
NPV CO2 Tontraditionalstove
CO2 Tonimprovedstove
CO2 Tonreduced2001-2010
$/TonCO2
Cundinamrca 179,666 4,380 641 6,500 1.182.290 166,660 102,560 64,100 18Nariño 97,626 2,381 349 6,500 740.137 90,740 55,840 34,900 21Antioquia 144,679 3,529 517 6,500 994.527 134,420 82,720 51,700 19Boyacá -Santander
300,351 7,326 1,072 6,500 1.834.920 278,720 171,520 107,200 17
CORPODIB
Alternative Reduction: Steam SystemDept. Average
yearlyglobalprod
No.StovesperDept.
No. Stovesconvertedto 2010
InvestmentUS $/stove
NPV CO2 Tontraditionalstove
CO2 Tonimprovedstove
CO2 Tonreduced2001-2010
$/TonCO2
Cundinamrca 179,666 4,380 449 30.000 7.113.304 280.176 172.416 107.760 66Nariño 97,626 2,381 244 30.000 4.429.727 156.256 93.696 58.560 76Antioquia 144,679 3,529 361 30.000 5.760.646 225.264 138.624 86.640 66Boyacá -Santander
300,351 7,326 751 30.000 11.755.381 468.624 288.384 180.240 65
CORPODIB
Graph 43 illustrates a comparative analysis of the alternatives for reducing emissions for theproposed substitution scenario of 50%, in each of the five selected Departments.
Graph 43. Marginal Cost Curves for the Reduction Alternatives in the 50% Scenario,Substituting New for Traditional Stoves, in each of the Five Departments.
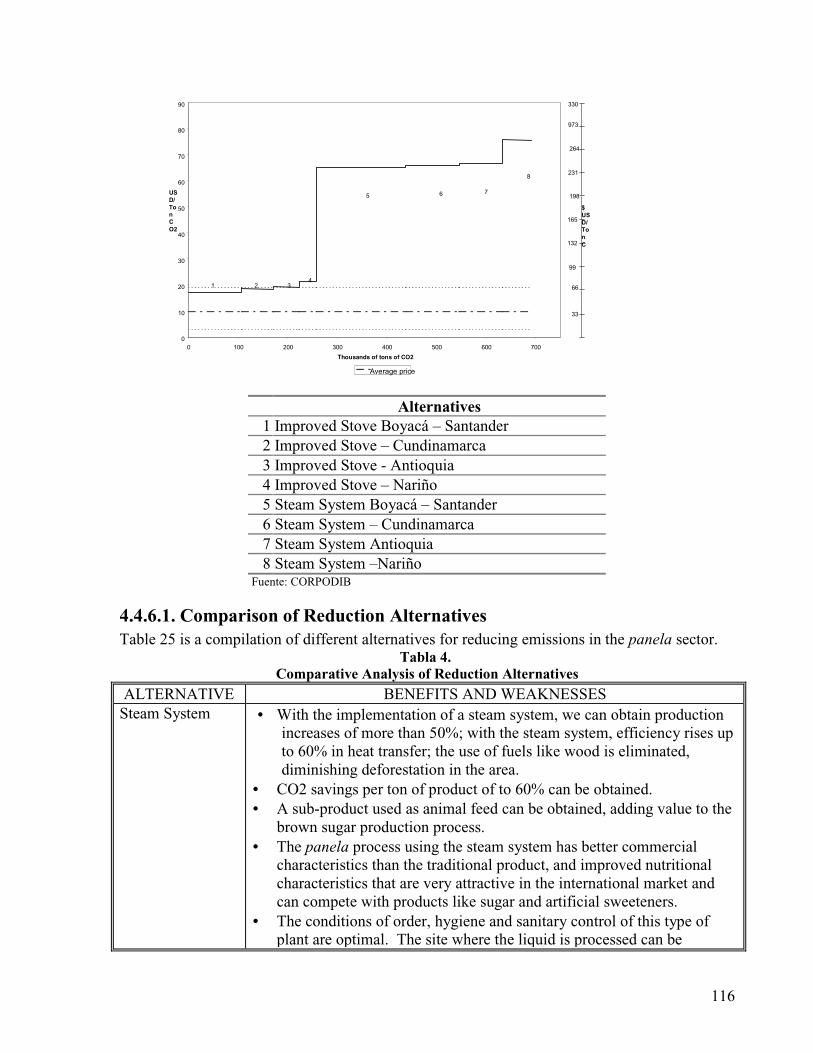
116
0
10
20
30
40
50
60
70
80
90
0 100 200 300 400 500 600 700
Thousands of tons of CO2
USD/TonCO2
Average price
1 2 34
5 6 7
8
$USD/TonC
33
66
99
132
165
198
231
264
973
330
Alternatives1 Improved Stove Boyacá – Santander2 Improved Stove – Cundinamarca3 Improved Stove - Antioquia4 Improved Stove – Nariño5 Steam System Boyacá – Santander6 Steam System – Cundinamarca7 Steam System Antioquia8 Steam System –Nariño
Fuente: CORPODIB
4.4.6.1. Comparison of Reduction AlternativesTable 25 is a compilation of different alternatives for reducing emissions in the panela sector.
Tabla 4.Comparative Analysis of Reduction Alternatives
ALTERNATIVE BENEFITS AND WEAKNESSESSteam System • With the implementation of a steam system, we can obtain production
increases of more than 50%; with the steam system, efficiency rises upto 60% in heat transfer; the use of fuels like wood is eliminated,diminishing deforestation in the area.
• CO2 savings per ton of product of to 60% can be obtained.• A sub-product used as animal feed can be obtained, adding value to thebrown sugar production process.
• The panela process using the steam system has better commercialcharacteristics than the traditional product, and improved nutritionalcharacteristics that are very attractive in the international market andcan compete with products like sugar and artificial sweeteners.
• The conditions of order, hygiene and sanitary control of this type ofplant are optimal. The site where the liquid is processed can be
117
ALTERNATIVE BENEFITS AND WEAKNESSESseparated and isolated, permitting adequate asepsis.
• Among possible barriers to developing the project is the high cost oftechnology, and it will be necessary for a number of production units tojoin together to acquire the technology.
Improved Stove • By optimizing the present stoves, production increases of up to 50%can be obtained, decreasing or eliminating the consumption of firewoodwhich contributes in great part to GHG and deforestation.
• A CO2 emission drop of up to 40% is obtained.• Among positive aspects to be taken into account, there is the generationof a sub-product for animal consumption which will add considerablevalue to brown sugar production.
• The brown sugar that is produced maintains the same characteristics ofthe traditional product; this product will not meet the expectations ofmodern consumers, and so this product will continue to be displaced byother products like sugar and artificial sweeteners. The samedeficiencies in the packaging, transportation and storage systems willcontinue, with considerable losses through the evident deterioration ofthe product.
4.4.7. Conclusions and RecommendationsImplementing steam technology would prevent emissions into the atmosphere in the evaluatedDepartments of Cundinamarca, Nariño, Antioquia and Boyaca-Santander of approximately a45,000 t of CO2 per year, and with the improved stove, approximately 25,000 t of CO2 peryear, supposing a substitution scenario of 50% of the traditional stoves presently operating andan anticipated growth of GDP of 4.2%.
If the Promoters’ Groups are developed for training purposes and for reducing transactionscosts, CDM is viable for intermediate investment in improved stoves, at a cost of up to $17 perton of CO2; however, the greatest costs stem from investment. A Promoter Group has anaverage cost of $1 per reduced ton.
With both alternatives for reducing emissions (improved stove and steam system) we obtainsavings in fuel consumption by not burning approximately 50% of the firewood, and alsoimprove the present combustion systems, leading to a rather significant decrease in the emissionof polluting gases and deforestation in these Departments. We note that the alternative of theimproved stove requires an additional pre-drying period for the bagasse before it is burned,which is not necessarily the case with the steam system, where the bagasse can be burned withthe humidity content it carries when exiting the pressing system.
With steam technology we obtain a product with a high nutritional content, accepted in theinternational market if we compare it to the product presently obtained through traditionalprocesses. The modern product can compete with sugar and artificial sweeteners, even thoughthe international market at present is not very interested in panela, or brown sugar products.
118
Steam technology makes it possible to significantly reduce CO2 emissions, up to 60%compared with traditional technology. The improved stove reduces about 40% of CO2emissions compared to the traditional stove.
Steam technology is more expensive than improving the stove, but this is compensated byobtaining pulverized brown sugar with a better nutritional value which can be exported andcompete with products like sugar and natural sweeteners, besides improving the process’sproductivity.
119
4.5. Competitiveness and Annual CER GenerationPotential: National Marginal Cost Curve
The development of strategies to maximize the direct and collateral benefits for Colombia ofCDM requires an economic and institutional analysis of the marginal cost curves of reducing. Itis fundamental to understand the economic potential pertaining to the range of options whichcould be implemented in the country, even under the restrictions imposed by CDM foradditionality and the price limits of CERs in the market. To better understand the economicpotential of implementing CDM in Colombia per sector and type of project, the Ministrydeveloped an analysis, with the Colombian Academy of Exact Physical and Natural Sciences.This made it possible to estimate the potential of generating additional foreign exchange fromthe Certificates for Emissions Reduction, which has positive implications for the balance oftrade. Finally, identifying sectors and types of products having the greatest potential enables usto direct a national program for training and support under the Colombian Foundation for theMitigation of GHGs--the entity proposed to manage CDM in Colombia.
4.5.1. Methodology
The option for emissions reduction consists of substituting present technology for one of thenew efficient technologies. The evaluation of each of the new technologies involves atechnical, economic and environmental analysis, where we compare in economic andenvironmental terms the two technological options which supply the same amount of energy orprovide the same service with the same degree of reliability.
For the Colombian case, we have considered technologies that have potential effects to reduceemissions and could be implemented before 2010. The criteria for selecting these technologieswere:
• The cost of the options• Technological maturity• Emissions reduction• Technical and economic viability• Previous research and available on these technologies• Transaction costs
The cost analysis considers the life cycle of the project, investment costs, operation andmaintenance and the cost of the fuels to be used, excluding taxes and subsidies, for each of theGHG reduction options, measured in CO2 equivalencies77. All these direct costs are then usedto estimate an annualized present net value and then the total annual cost is calculated, both forthe reference option (conventional option) and for the emissions reduction option (efficienttechnologies). The economic comparison between the two options is done calculating the
77 UNEP. 1998.
120
increment in annual costs as the difference between the reduction option’s costs and those of thereference option.
In parallel form, we calculate GHG emissions for the reference option and those of thereduction option. Yearly CO2, N2O and CH4 emissions in tons/year are calculated using theemissions factors of the 1996 IPCC methodology, and fuel consumption for each option. Then,all the emissions are reduced to CO2 equivalents using the GWP. The reduction is obtained byadding up the reference options emissions and subtracting the reduction option’s emissions. Apositive value indicates that the new option reduces GHG emissions into the atmosphere.
A possible indicator to value the advisability in cost/benefit terms of an option for emissionsreductions is the quotient of the cost increment for the reduction option divided by theemissions reductions in CO2 equivalence. The unit for this index is dollars/ton of CO2equivalence.
This cost-benefit index can be negative, zero or positive. A positive index indicates that theoption is not economically advantageous and its implementation will depend finally on somejustified economic support stemming from environmental advantages and/or because of someparticular conditions pertaining to the application. A negative index signifies that the option iseconomically advantageous and also reduces GHG emissions.
4.5.2. Results
This analysis contributes two different but complementary elements to the four sectoralanalyses presented previously. First, it evaluates a much broader range of options, including afar broader range of technological possibilities considered possible in the country. Second, itpresents an economic analysis of the yearly potential for reductions. By contrast, the sectoralanalyses present the total potential of reductions during the entire life cycle of projects. Bothanalyses are interesting, consistent and complementary, offering two evaluation perspectives ofthe country’s potential for participating in the Clean Development Mechanism.
Graph 44 presents the cost curve and summarizes the results of the emissions reduction scenarioconstructed for the Colombian case.

121
Graph 44. Cost Curve for Reducing GHGs Emissions – Colombian Case – Until 2010
CO2 Abatement Cost Curve: 2010
-200.
-100.
0.
100.
200.
300.
400.
500.
600.
0. 5. 10. 15. 20. 25. 30. 35. 40. 45.
Million tonnes CO2 Reduction
Cost(S/Tonne)
Academia Colombiana de Ciencias Exactas Fisicas Y Naturales, GTZ, Ministry of the Environment
With the cost curve, we apply an institutional and economic analysis of the potential expressedin the curve, to identify the most viable options in Colombia in the short and medium terms.For the national CDM program, whose fundamental principle will be the projects’ high quality,it will be necessary to comply with the additionality rule imposed by the Kyoto Protocol. Weassume that any project having the potential to be profitable and compete in the domesticinvestment portfolio would have been executed anyway without the presence of CDM, andwould be disqualified by the Executive Board of the CDM. This study assumes that projectswith costs per reduced ton below -$5.7 would not qualify for generating CERs, because theywould not comply with additionality. Although projects costing between $0 and -$5.07 perreduced ton look somewhat profitable, the barriers posed by risk, lack of funding and low rateof return compared with other investment opportunities in the country restrict the execution ofthese projects in the absence of the additional flow of resources which could flow from CDM.
The other hand, the price of CERs in international markets will determine which projects willbe executed. To the extent that the sale price of a CER (marginal profit) is greater than the costper captured ton in each incremental project of the curve (marginal cost), the producer shouldexecute the project. Using our potential price scenarios, choosing the high scenario will permitus to restrict the offer of CERs represented on the curve at the highest level of $19 per ton.Projects with costs greater than $19 per reduced ton would not be economically feasible if theydepend only on the flow of resources of the CDM.
From the point of view of economic potential, restricting the supply of projects under theadditionality criterion of -$5.07 and for the price of $19 used in our high market scenario, wecan estimate a potential reduction of 22.9M t of CO2 yearly. This corresponds to 13.1% of theexpected emissions for the period; that is, 174,6M t. In this case, the country’s emissions would
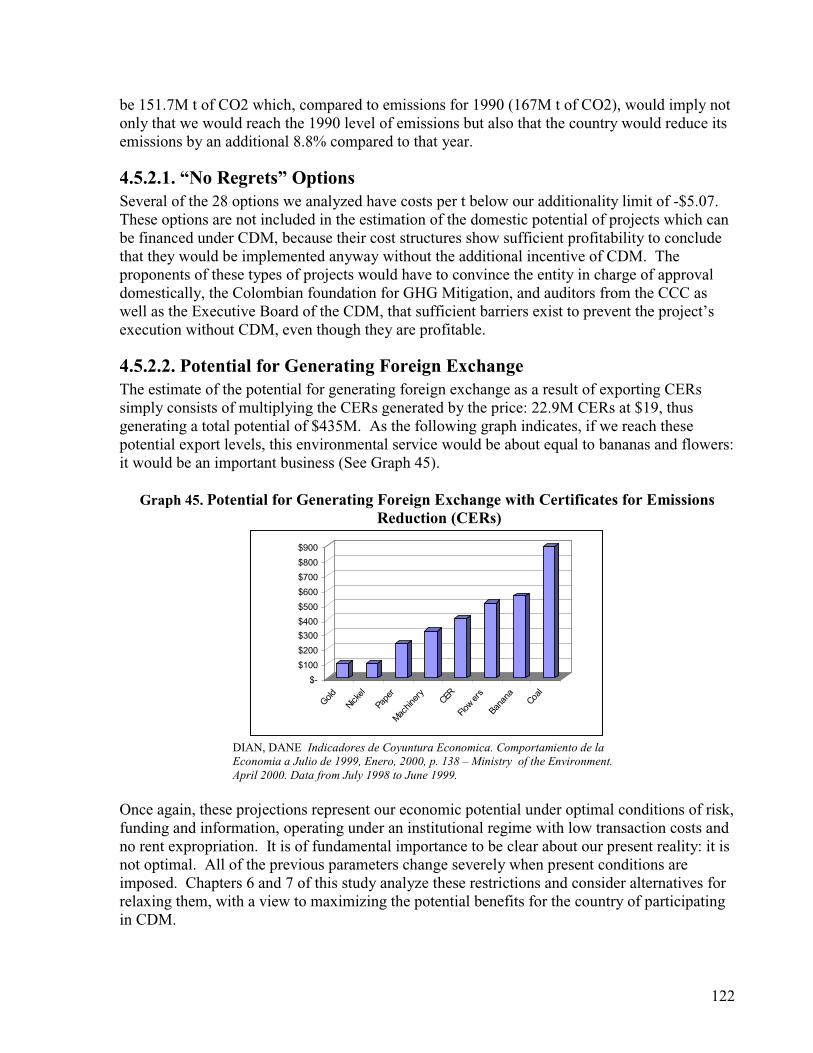
122
be 151.7M t of CO2 which, compared to emissions for 1990 (167M t of CO2), would imply notonly that we would reach the 1990 level of emissions but also that the country would reduce itsemissions by an additional 8.8% compared to that year.
4.5.2.1. “No Regrets” OptionsSeveral of the 28 options we analyzed have costs per t below our additionality limit of -$5.07.These options are not included in the estimation of the domestic potential of projects which canbe financed under CDM, because their cost structures show sufficient profitability to concludethat they would be implemented anyway without the additional incentive of CDM. Theproponents of these types of projects would have to convince the entity in charge of approvaldomestically, the Colombian foundation for GHG Mitigation, and auditors from the CCC aswell as the Executive Board of the CDM, that sufficient barriers exist to prevent the project’sexecution without CDM, even though they are profitable.
4.5.2.2. Potential for Generating Foreign ExchangeThe estimate of the potential for generating foreign exchange as a result of exporting CERssimply consists of multiplying the CERs generated by the price: 22.9M CERs at $19, thusgenerating a total potential of $435M. As the following graph indicates, if we reach thesepotential export levels, this environmental service would be about equal to bananas and flowers:it would be an important business (See Graph 45).
Graph 45. Potential for Generating Foreign Exchange with Certificates for EmissionsReduction (CERs)
$-
$100
$200
$300
$400
$500
$600
$700
$800
$900
Gold
Nickel
Paper
Machinery
CER
Flowers
Banana Coal
DIAN, DANE Indicadores de Coyuntura Economica. Comportamiento de laEconomia a Julio de 1999, Enero, 2000, p. 138 – Ministry of the Environment.April 2000. Data from July 1998 to June 1999.
Once again, these projections represent our economic potential under optimal conditions of risk,funding and information, operating under an institutional regime with low transaction costs andno rent expropriation. It is of fundamental importance to be clear about our present reality: it isnot optimal. All of the previous parameters change severely when present conditions areimposed. Chapters 6 and 7 of this study analyze these restrictions and consider alternatives forrelaxing them, with a view to maximizing the potential benefits for the country of participatingin CDM.
123
4.5.3. CER Export as a Way of Compensating the Effect ofReducing on Fossil Fuel Exports
Our analysis indicates that the industrialized countries and multinational companies arepositioning themselves to evolve toward a productive system based on lower GHG emissions.This trend is generating a new market for technological, financial and environmental productswhich is developing rapidly throughout the planet.
Even without ratification of the Kyoto Protocol, energy companies like British Petroleum andShell Oil, two giant multinational oil companies, have implemented internal programs forreducing emissions which are already producing results. In Japan, large-scale electricityproducers like Tokyo Power and Light are investing in forest projects in Asia to compensateCO2 emissions from operations where they burn coal. In London on April 1, 2000, themultinational Arthur Andersen consolidated a new investment fund worth millions to initiateinvestments in emissions reduction projects and the international emissions rights trading. OnApril 10, 2000 in Sydney, Australia, the Sydney Carbon Exchange was founded as aninternational market for emissions rights trading. The World Bank’s Prototype Fund for Carbonwas launched this year by investors from industrialized countries, with a view to placing $150million in CDM projects in developing countries. Before 2005, the European Union in tendsintends to establish GHG reductions through a system for trading emissions.
Equally, a number of industrialized countries are preparing to impose domestic regulatoryregimes to restrict GHG emissions. Countries like Great Britain, Australia, France, Denmark,Switzerland and Norway are preparing or have already implemented Pollution Charges for CO2or national systems for Emissions Rights Trading, to begin reducing. The U.S. government ispreparing a large domestic program for the use of renewable energy sources, for the samepurpose.
This is all happening in industrialized countries, even without the Kyoto Protocol. A greatnumber of companies, consumers and institutions in these societies have become aware of theproblems associated with the emission of nearly 1.35B t of CO2 (1,350,000,000 tons) into ouratmosphere each year.
4.5.3.1. Impacts on the Export of Fossil Fuels in ColombiaReducing CO2 emissions in industrialized countries will reduce, to some extent, our ownexports of fossil fuels. As stated above, this impact will occur with or without Kyoto Protocol.Even so, the magnitude of Impacts depends on the alternatives available to countriesimplementing reductions.
At the international level, we have a number of research studies and estimates on the probableeffects of implementing the Protocol on the economies of fossil fuel exporting countries. In oneof the most recent studies, by ABARE, a center for economic studies78 in Australia (anotherlarge coal exporter), these impacts are estimated in two scenarios. In the first, the Annex 1countries would comply with their commitments only by taking measures domestically, while
78 Australian Bureau of Agricultural and Resource Economics – ABARE, “Impacts of the Kyoto Protocol onDeveloping Countries. Canberra: June 2000.
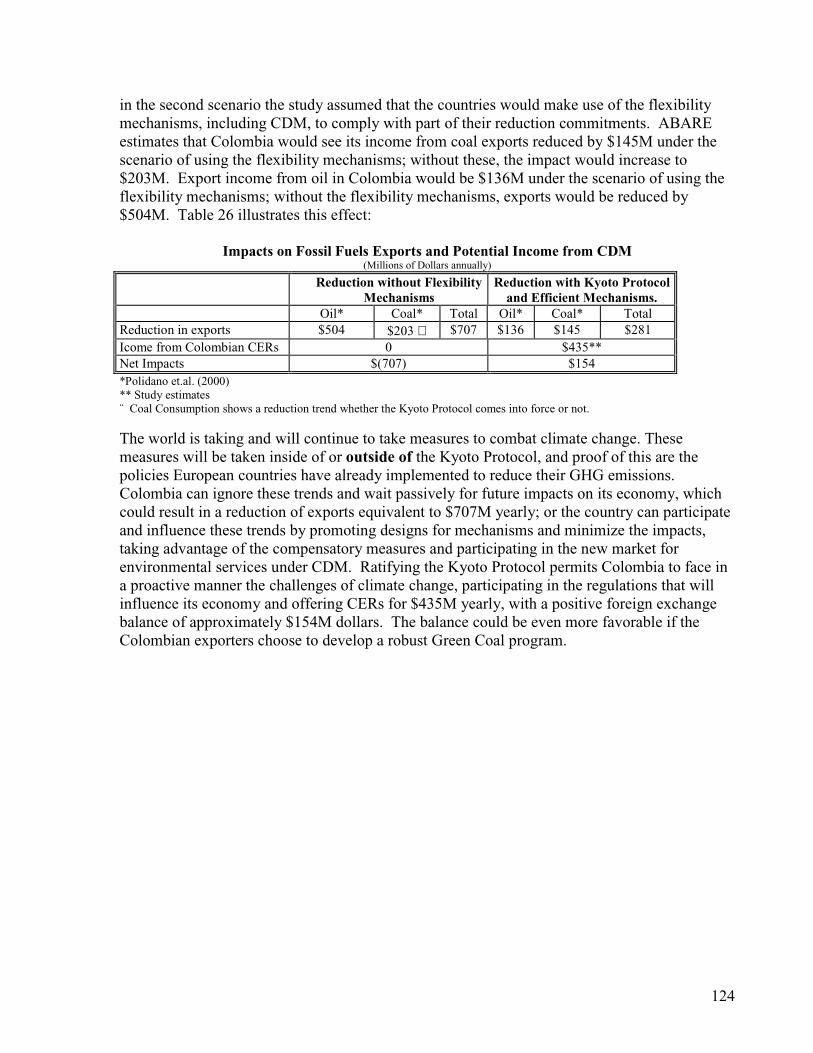
124
in the second scenario the study assumed that the countries would make use of the flexibilitymechanisms, including CDM, to comply with part of their reduction commitments. ABAREestimates that Colombia would see its income from coal exports reduced by $145M under thescenario of using the flexibility mechanisms; without these, the impact would increase to$203M. Export income from oil in Colombia would be $136M under the scenario of using theflexibility mechanisms; without the flexibility mechanisms, exports would be reduced by$504M. Table 26 illustrates this effect:
Impacts on Fossil Fuels Exports and Potential Income from CDM(Millions of Dollars annually)
Reduction without FlexibilityMechanisms
Reduction with Kyoto Protocoland Efficient Mechanisms.
Oil* Coal* Total Oil* Coal* TotalReduction in exports $504 $203 ∇ $707 $136 $145 $281Icome from Colombian CERs 0 $435**Net Impacts $(707) $154*Polidano et.al. (2000)** Study estimates¨ Coal Consumption shows a reduction trend whether the Kyoto Protocol comes into force or not.
The world is taking and will continue to take measures to combat climate change. Thesemeasures will be taken inside of or outside of the Kyoto Protocol, and proof of this are thepolicies European countries have already implemented to reduce their GHG emissions.Colombia can ignore these trends and wait passively for future impacts on its economy, whichcould result in a reduction of exports equivalent to $707M yearly; or the country can participateand influence these trends by promoting designs for mechanisms and minimize the impacts,taking advantage of the compensatory measures and participating in the new market forenvironmental services under CDM. Ratifying the Kyoto Protocol permits Colombia to face ina proactive manner the challenges of climate change, participating in the regulations that willinfluence its economy and offering CERs for $435M yearly, with a positive foreign exchangebalance of approximately $154M dollars. The balance could be even more favorable if theColombian exporters choose to develop a robust Green Coal program.

125
4.6. Competitiveness and Annual CER GenerationPotential: National Marginal Cost Curve
The development of strategies to maximize the direct and collateral benefits for Colombia ofCDM requires an economic and institutional analysis of the marginal cost curves of reducing. Itis fundamental to understand the economic potential pertaining to the range of options whichcould be implemented in the country, even under the restrictions imposed by CDM foradditionality and the price limits of CERs in the market. To better understand the economicpotential of implementing CDM in Colombia per sector and type of project, the Ministrydeveloped an analysis, with the Colombian Academy of Exact Physical and Natural Sciences.This made it possible to estimate the potential of generating additional foreign exchange fromthe Certificates for Emissions Reduction, which has positive implications for the balance oftrade. Finally, identifying sectors and types of products having the greatest potential enables usto direct a national program for training and support under the Colombian Foundation for theMitigation of GHGs--the entity proposed to manage CDM in Colombia.
4.6.1. Methodology
The option for emissions reduction consists of substituting present technology for one of thenew efficient technologies. The evaluation of each of the new technologies involves atechnical, economic and environmental analysis, where we compare in economic andenvironmental terms the two technological options which supply the same amount of energy orprovide the same service with the same degree of reliability.
For the Colombian case, we have considered technologies that have potential effects to reduceemissions and could be implemented before 2010. The criteria for selecting these technologieswere:
• The cost of the options• Technological maturity• Emissions reduction• Technical and economic viability• Previous research and available on these technologies• Transaction costs
The cost analysis considers the life cycle of the project, investment costs, operation andmaintenance and the cost of the fuels to be used, excluding taxes and subsidies, for each of theGHG reduction options, measured in CO2 equivalencies77. All these direct costs are then usedto estimate an annualized present net value and then the total annual cost is calculated, both forthe reference option (conventional option) and for the emissions reduction option (efficienttechnologies). The economic comparison between the two options is done calculating the
77 UNEP. 1998.

126
increment in annual costs as the difference between the reduction option’s costs and those of thereference option.
In parallel form, we calculate GHG emissions for the reference option and those of thereduction option. Yearly CO2, N2O and CH4 emissions in tons/year are calculated using theemissions factors of the 1996 IPCC methodology, and fuel consumption for each option. Then,all the emissions are reduced to CO2 equivalents using the GWP. The reduction is obtained byadding up the reference options emissions and subtracting the reduction option’s emissions. Apositive value indicates that the new option reduces GHG emissions into the atmosphere.
A possible indicator to value the advisability in cost/benefit terms of an option for emissionsreductions is the quotient of the cost increment for the reduction option divided by theemissions reductions in CO2 equivalence. The unit for this index is dollars/ton of CO2equivalence.
This cost-benefit index can be negative, zero or positive. A positive index indicates that theoption is not economically advantageous and its implementation will depend finally on somejustified economic support stemming from environmental advantages and/or because of someparticular conditions pertaining to the application. A negative index signifies that the option iseconomically advantageous and also reduces GHG emissions.
4.6.2. Results
This analysis contributes two different but complementary elements to the four sectoralanalyses presented previously. First, it evaluates a much broader range of options, including afar broader range of technological possibilities considered possible in the country. Second, itpresents an economic analysis of the yearly potential for reductions. By contrast, the sectoralanalyses present the total potential of reductions during the entire life cycle of projects. Bothanalyses are interesting, consistent and complementary, offering two evaluation perspectives ofthe country’s potential for participating in the Clean Development Mechanism.
Graph 44 presents the cost curve and summarizes the results of the emissions reduction scenarioconstructed for the Colombian case.
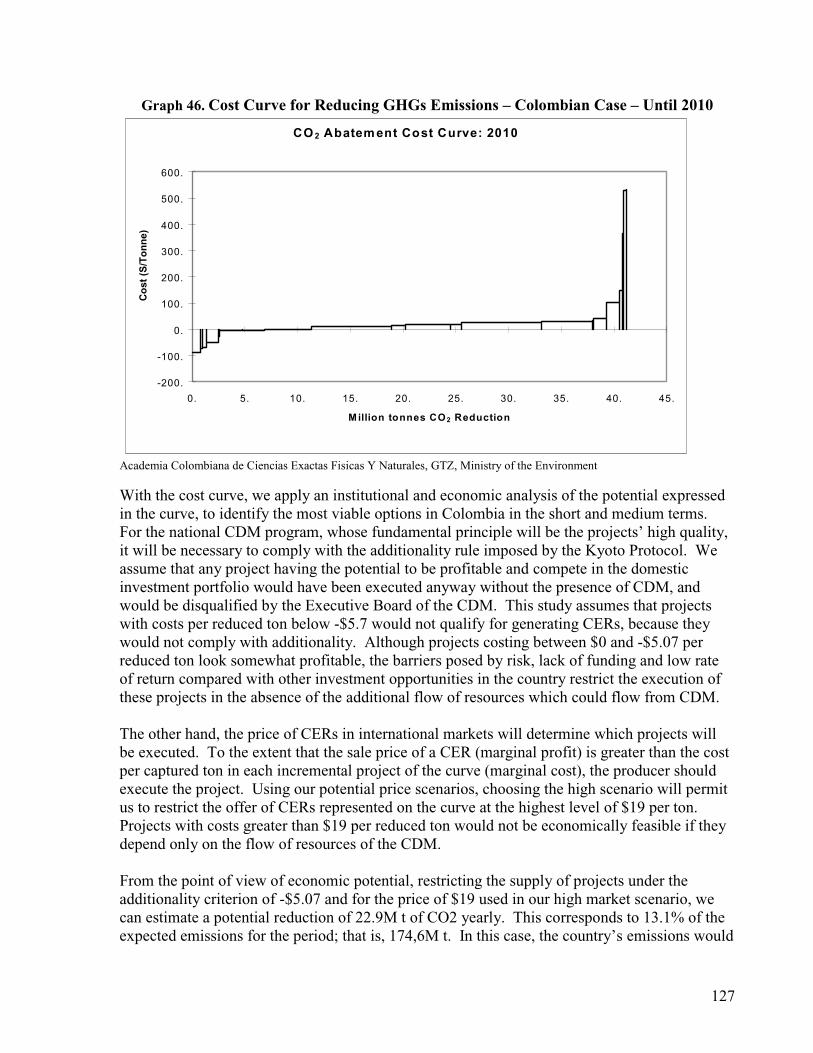
127
Graph 46. Cost Curve for Reducing GHGs Emissions – Colombian Case – Until 2010
CO2 Abatement Cost Curve: 2010
-200.
-100.
0.
100.
200.
300.
400.
500.
600.
0. 5. 10. 15. 20. 25. 30. 35. 40. 45.
Million tonnes CO2 Reduction
Cost(S/Tonne)
Academia Colombiana de Ciencias Exactas Fisicas Y Naturales, GTZ, Ministry of the Environment
With the cost curve, we apply an institutional and economic analysis of the potential expressedin the curve, to identify the most viable options in Colombia in the short and medium terms.For the national CDM program, whose fundamental principle will be the projects’ high quality,it will be necessary to comply with the additionality rule imposed by the Kyoto Protocol. Weassume that any project having the potential to be profitable and compete in the domesticinvestment portfolio would have been executed anyway without the presence of CDM, andwould be disqualified by the Executive Board of the CDM. This study assumes that projectswith costs per reduced ton below -$5.7 would not qualify for generating CERs, because theywould not comply with additionality. Although projects costing between $0 and -$5.07 perreduced ton look somewhat profitable, the barriers posed by risk, lack of funding and low rateof return compared with other investment opportunities in the country restrict the execution ofthese projects in the absence of the additional flow of resources which could flow from CDM.
The other hand, the price of CERs in international markets will determine which projects willbe executed. To the extent that the sale price of a CER (marginal profit) is greater than the costper captured ton in each incremental project of the curve (marginal cost), the producer shouldexecute the project. Using our potential price scenarios, choosing the high scenario will permitus to restrict the offer of CERs represented on the curve at the highest level of $19 per ton.Projects with costs greater than $19 per reduced ton would not be economically feasible if theydepend only on the flow of resources of the CDM.
From the point of view of economic potential, restricting the supply of projects under theadditionality criterion of -$5.07 and for the price of $19 used in our high market scenario, wecan estimate a potential reduction of 22.9M t of CO2 yearly. This corresponds to 13.1% of theexpected emissions for the period; that is, 174,6M t. In this case, the country’s emissions would

128
be 151.7M t of CO2 which, compared to emissions for 1990 (167M t of CO2), would imply notonly that we would reach the 1990 level of emissions but also that the country would reduce itsemissions by an additional 8.8% compared to that year.
4.6.2.1. “No Regrets” OptionsSeveral of the 28 options we analyzed have costs per t below our additionality limit of -$5.07.These options are not included in the estimation of the domestic potential of projects which canbe financed under CDM, because their cost structures show sufficient profitability to concludethat they would be implemented anyway without the additional incentive of CDM. Theproponents of these types of projects would have to convince the entity in charge of approvaldomestically, the Colombian foundation for GHG Mitigation, and auditors from the CCC aswell as the Executive Board of the CDM, that sufficient barriers exist to prevent the project’sexecution without CDM, even though they are profitable.
4.6.2.2. Potential for Generating Foreign ExchangeThe estimate of the potential for generating foreign exchange as a result of exporting CERssimply consists of multiplying the CERs generated by the price: 22.9M CERs at $19, thusgenerating a total potential of $435M. As the following graph indicates, if we reach thesepotential export levels, this environmental service would be about equal to bananas and flowers:it would be an important business (See Graph 45).
Graph 47. Potential for Generating Foreign Exchange with Certificates for EmissionsReduction (CERs)
$-
$100
$200
$300
$400
$500
$600
$700
$800
$900
Gold
Nickel
Paper
Machinery
CER
Flowers
Banana Coal
DIAN, DANE Indicadores de Coyuntura Economica. Comportamiento de laEconomia a Julio de 1999, Enero, 2000, p. 138 – Ministry of the Environment.April 2000. Data from July 1998 to June 1999.
Once again, these projections represent our economic potential under optimal conditions of risk,funding and information, operating under an institutional regime with low transaction costs andno rent expropriation. It is of fundamental importance to be clear about our present reality: it isnot optimal. All of the previous parameters change severely when present conditions areimposed. Chapters 6 and 7 of this study analyze these restrictions and consider alternatives forrelaxing them, with a view to maximizing the potential benefits for the country of participatingin CDM.

129
4.6.3. CER Export as a Way of Compensating the Effect ofReducing on Fossil Fuel Exports
Our analysis indicates that the industrialized countries and multinational companies arepositioning themselves to evolve toward a productive system based on lower GHG emissions.This trend is generating a new market for technological, financial and environmental productswhich is developing rapidly throughout the planet.
Even without ratification of the Kyoto Protocol, energy companies like British Petroleum andShell Oil, two giant multinational oil companies, have implemented internal programs forreducing emissions which are already producing results. In Japan, large-scale electricityproducers like Tokyo Power and Light are investing in forest projects in Asia to compensateCO2 emissions from operations where they burn coal. In London on April 1, 2000, themultinational Arthur Andersen consolidated a new investment fund worth millions to initiateinvestments in emissions reduction projects and the international emissions rights trading. OnApril 10, 2000 in Sydney, Australia, the Sydney Carbon Exchange was founded as aninternational market for emissions rights trading. The World Bank’s Prototype Fund for Carbonwas launched this year by investors from industrialized countries, with a view to placing $150million in CDM projects in developing countries. Before 2005, the European Union in tendsintends to establish GHG reductions through a system for trading emissions.
Equally, a number of industrialized countries are preparing to impose domestic regulatoryregimes to restrict GHG emissions. Countries like Great Britain, Australia, France, Denmark,Switzerland and Norway are preparing or have already implemented Pollution Charges for CO2or national systems for Emissions Rights Trading, to begin reducing. The U.S. government ispreparing a large domestic program for the use of renewable energy sources, for the samepurpose.
This is all happening in industrialized countries, even without the Kyoto Protocol. A greatnumber of companies, consumers and institutions in these societies have become aware of theproblems associated with the emission of nearly 1.35B t of CO2 (1,350,000,000 tons) into ouratmosphere each year.
4.6.3.1. Impacts on the Export of Fossil Fuels in ColombiaReducing CO2 emissions in industrialized countries will reduce, to some extent, our ownexports of fossil fuels. As stated above, this impact will occur with or without Kyoto Protocol.Even so, the magnitude of Impacts depends on the alternatives available to countriesimplementing reductions.
At the international level, we have a number of research studies and estimates on the probableeffects of implementing the Protocol on the economies of fossil fuel exporting countries. In oneof the most recent studies, by ABARE, a center for economic studies78 in Australia (anotherlarge coal exporter), these impacts are estimated in two scenarios. In the first, the Annex 1countries would comply with their commitments only by taking measures domestically, while
78 Australian Bureau of Agricultural and Resource Economics – ABARE, “Impacts of the Kyoto Protocol onDeveloping Countries. Canberra: June 2000.
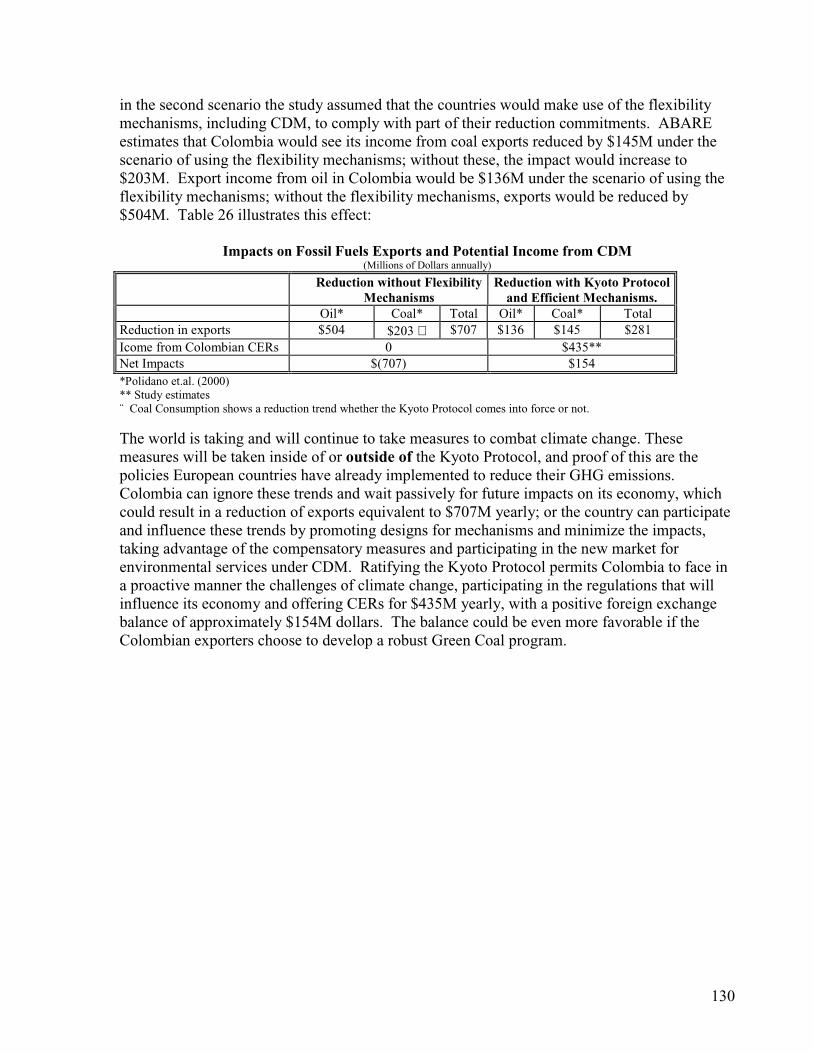
130
in the second scenario the study assumed that the countries would make use of the flexibilitymechanisms, including CDM, to comply with part of their reduction commitments. ABAREestimates that Colombia would see its income from coal exports reduced by $145M under thescenario of using the flexibility mechanisms; without these, the impact would increase to$203M. Export income from oil in Colombia would be $136M under the scenario of using theflexibility mechanisms; without the flexibility mechanisms, exports would be reduced by$504M. Table 26 illustrates this effect:
Impacts on Fossil Fuels Exports and Potential Income from CDM(Millions of Dollars annually)
Reduction without FlexibilityMechanisms
Reduction with Kyoto Protocoland Efficient Mechanisms.
Oil* Coal* Total Oil* Coal* TotalReduction in exports $504 $203 ∇ $707 $136 $145 $281Icome from Colombian CERs 0 $435**Net Impacts $(707) $154*Polidano et.al. (2000)** Study estimates¨ Coal Consumption shows a reduction trend whether the Kyoto Protocol comes into force or not.
The world is taking and will continue to take measures to combat climate change. Thesemeasures will be taken inside of or outside of the Kyoto Protocol, and proof of this are thepolicies European countries have already implemented to reduce their GHG emissions.Colombia can ignore these trends and wait passively for future impacts on its economy, whichcould result in a reduction of exports equivalent to $707M yearly; or the country can participateand influence these trends by promoting designs for mechanisms and minimize the impacts,taking advantage of the compensatory measures and participating in the new market forenvironmental services under CDM. Ratifying the Kyoto Protocol permits Colombia to face ina proactive manner the challenges of climate change, participating in the regulations that willinfluence its economy and offering CERs for $435M yearly, with a positive foreign exchangebalance of approximately $154M dollars. The balance could be even more favorable if theColombian exporters choose to develop a robust Green Coal program.
131
5. Strategies forAttainment of the National PotentialThe previous estimates represent the upper limit of the potential of CER exports. Clearly, thereare factors that limit reaching the maximum potential. The results of this study indicate thatthere are international and domestic factors that potentially restrict activity. If the objective ofthe National Strategy and the policy devised to implement it is to maximize potential benefitsfor the country, the strategy must be geared in resolving the limiting factors. To the extent thatthe policy will be successful in minimizing these factors, our CER export activity shouldincrease, along with its associated benefits.
5.1. Critical Design and Regulatory Elements to beNegotiated in the Sixth Conference of the Parties
The potential benefits of implementing an efficient and effective model are very great for theentire developing world, including Colombia. Even so, if COP negotiates regulations thatimpose unnecessary costs, barriers and restrictions to the model, the number of projects that willbe executed under CDM will be very small compared to the potential to be obtained under asimple, transparent and efficient mechanism. This section identifies elements in design andregulation that must be consolidated to maximize the potential benefits of CDM.
The general interest and goal of the Kyoto Protocol in terms of the Clean DevelopmentMechanism (CDM) is to promote sustainable development in developing countries and helpindustrialized countries to reach their emissions reduction goals. Of the analysis of the presentstudy demonstrates that promoting these goals is completely consistent with the nationalobjective of maximizing the potential benefits for the country of the instrument, inenvironmental, economic and also social terms.
We need a design capable of efficiently allocating economic resources to comply with Annex B,choosing the most cost-effective options for reduction in developing countries. The designshould minimize any component that restricts the flow of resources from Annex B to projectsvalidated under CDM, including transaction costs, charges, risks, uncertainties and barriers.Having required that emissions reductions be certified, the Conference of the Parties should notimpose unnecessary restrictions on the use of CDM, precisely because the options executed indeveloping countries reduce more emissions per peso invested. Budgets for decontamination inthe Annex B will achieve their goals with greater ease with CDM because the cost per reducedton is much lower.
Organized resistance to the Kyoto Protocol is directly related to the compliance costs for thegoals of Annex B. The U.S. government has estimated that its own compliance cost could dropby 85% if there are no barriers to participation in CDM projects. Maximizing investment indeveloping countries could notoriously reduce the trajectory of expected emissions, providingrapid growth to those countries, as expected at the beginning of the 21st century. In total, themost efficient way of reducing GHG concentrations in the atmosphere is through implementing
132
the most cost-effective options on the planet, and most of these are to be found in developingcountries.
As indicated in the previous section, arguments have been offered at the Conference of theParties that could notoriously limit CDM. It will be possible to negotiate these items andregulate them in favor of or against the interests of developing countries at the COP6conference in November 2000. This section identifies those areas toward which regulation ofthe CDM model should be most attentive, if it is to achieve greater economic efficiency andequally environmental efficiency. In this manner, the model would be poised to truly reach theobjectives of Article 12 and the CCC, and maximize the potential benefits for countries likeColombia.
Regulations should promote the inclusion of the greatest quantity and variety of projects forreducing and capturing GHG emissions. They must attract investment flows toward all sectors:energy, transportation, industry and forests. Colombia, as is the case with most developingcountries, has a particular interest in the forest sector’s not being excluded and also in seeingchanges in the use of land under CDM, because forests are a sector with great comparativeadvantages and a broad range of social and environmental benefits. The general lines that mustguide Colombia’s international strategy should include:
5.1.1. Ensuring CDM Implementation from January 2000Certain negotiators from developing countries, including China’s and Saudi Arabia’s, argue thatwe should not be in any hurry to implement CDM. However, every year that theimplementation is delayed could represent millions of dollars that fail to enter the Colombianeconomy. According to Article 12.10 of the Kyoto Protocol, CDM must be implemented from2000, with the remaining options set to operate in 2008. This establishes of window ofopportunity through which developing countries can execute emissions reduction projectswithout competition from projects operating through Emissions Trading Rights and JointImplementation. Negotiators must make sure that all CDM projects, from January 1, 2000,which comply with the criteria and regulations COP6 will eventually establish, and approved atthe Conference of the Parties, will receive CERs for all of the tons reduced during their lifecycles.
5.1.2. Minimizing International Transaction costs, Risks andBarriers
Many COP negotiators propose creating large-scale institutions to manage CDM, andinnumerable rules and charges for each CDM project. It is necessary to promote the creation ofefficient institutions and regulations for administering the CDM program. The requirementsmust be cautiously evaluated to maintain minimum costs with regard to the formulation,registration, approval, monitoring, verification and certification of CDM projects. As a generalrule, the design of CDM projects must be carefully evaluated from the standpoint of transactioncosts, risks and institutional barriers, to ensure the competitiveness of the Clean DevelopmentMechanism, compared to the other flexibility mechanisms.
133
5.1.3. Managing Base Lines and AdditionalityMany Annex B negotiators and entities question the capacity of developing countries to producereal GHG reductions, and insist on much stricter formulation methods for CDM projects thanfor reductions via the remaining Kyoto Mechanisms. The technical bases for developingprojects for CDM revolves around the generation of (a) base lines for emissions which mayhave occurred in the absence of the CDM project and, (b) estimates of the real reductions(additionality) with the project79. The goal of regulations must be to establish formulationmethods that are sufficient to promote real reductions, but without imposing on formulatorscosts that are too high.
Estimating the base line is a hypothetical exercise, because estimates could be based onproduction variables seen in the future. For example, the requirements for an estimate implycomplex analyses of combustion and technological processes that could be highly demanding interms of information and methodology, beyond the reach of small and medium-sizedindustrialists. Insistence on greater exactitude might require an econometric behavioral modelof the economic context surrounding the project during its life cycle, including an analysis ofprices of inputs, demand for the products, inflation and technological change, among others.
Depending on the demands on this topic as developed by COP, the cost of calculating a baseline of could be so demanding that only very large-scale projects could assume them. Thismight eliminate from the beginning much of the Colombian potential, which must involve ingreat measure small and medium industries and small farmers, to introduce new sources ofincome and investment to these economic actors. And a large number of technical entities areconducting research in the international field on options for reducing the cost of managing baselines, which will be presented and debated at COP6. Colombian negotiators should promote thealternative of having a greater possibility of implementation by small and medium sizedindustry and agriculture.
Proposals on proving the additionality of projects are equally complex, but more abstract.Article 12.5.c establishes that CERs must be generated on the basis of “ measurable benefits thatare in the long run related to the mitigation of climate change”, and “emissions reductionswhich are additional to those which would be produced in the absence of the activity of thecertified project”.
The environmental integrality of the Kyoto Protocol depends on the generation of realreductions. The purchase of a CER permits an Annex B emitter to add it to his allocatedamount of rights, and thus not have to reduce that ton at home. If the CER was generatedmistakenly, based on a reduction which would have occurred in any case in the developingcountry, there would be neither a reduction in Annex B nor a reduction in the developingcountry, with the result that GHG concentrations in the atmosphere would not be reduced as aconsequence of this particular CDM project.
79 Chapter 4 on formulating projects provides further information and analysis of base lines and additionality.
134
The international community is debating a number of alternatives for the additionality proof thatvary broadly in their requirements for information and their methodologies. These will bepresented and debated at COP6. Colombian negotiators should promote the alternative havingthe greatest chance of being implemented by small and medium-sized industry and agriculture.
5.1.4. Equal Treatment for the Three Flexibility MechanismsIt is necessary that the mechanisms have common bases and equal treatment, to reduce thecompetitive disadvantage CDM faces. It is unacceptable to weigh down CDM with excessiveregulations not required of the remaining mechanisms, especially because of the principle ofShared but Differentiated Responsibilities, a key element of the Climate Change Conventionand the Kyoto Protocol. This principle establishes the historical responsibility of Annex Bcountries in the accumulation of GHG, and global warming. Because of this, Annex Bcountries must be the first to accept national goals for GHG reduction. By contrast, developingcountries have contributed very little to the present accumulation: there, expected growth is inthe future. Their role until the end of the first compliance period is to assist Annex B incomplying with its goals and also to exercise the right to sustainable economic development.
A concern is that in light of the Kyoto Protocol (Article 12.8), CDM projects will pay apercentage of each transaction to finance assistance to developing countries vulnerable toclimate change, while the remaining Flexibility Mechanisms carry no “charge” of this nature.Clearly, the principle of Shared but Differentiated Responsibilities establishes that those whocaused global warming must assist developing countries that now suffer damage because ofthis. Instead, this charge mistakenly establishes a South-South transference, reducing thefunding, which ought to flow to sustainable development projects.
Negotiators must work to obtain a similar treatment to that offered in the remainingmechanisms, respecting the principle noted above, and preventing any charge or additionaldisadvantage from being applied to CDM, compared to the other Kyoto Mechanisms.
5.1.5. The Inclusion of SinksIn the forest sector, the other Latin American countries have a large competitive advantage forsequestering GHG from the atmosphere in the forest sector. Although both the Climate ChangeConvention80 and the Kyoto Protocol81 recognize the importance of sinks to mitigate climatechange, there is significant insistence on the part of international actors to exclude forestprojects from CDM82. In consequence, it is necessary to work for the inclusion in CDM of sinksprojects in all their dimensions--reforestation, restoration, afforestation, conservation andsustainable management of natural forests. It is imperative to maintain this source ofinvestment in this sector--so important for Colombia in environmental, economic and socialterms. To this end, Colombia and 15 other Latin American countries signed the document
80 CCC: p. 2, item 4; p. 5, item 8, Art. 3.3a; Art. 4.1a, 4.1b; 4.1c; 4.1d; 4.2a; 4.2b.81 KP: Art, 1a.ii; Art. 3.3; 5.2; 5.3; 6.1; 7.1; 10.a82 Opponents indicate that there is no explicit reference to sinks a of a in Article 12 of CDM. We note that Article17 establishing Emissions Trading Certificates does not refer to sinks either. Even so, both documents are clearand repeatedly stress the positive role of sequestration in GHG reduction.
135
Misc. FCCC/SB/1999/MISC.10/Add.3, clearly establishing their position in favor of theinclusion of sinks in CDM83.
This study has devoted special effort in its field analyses to counter arguments against theinclusion of sequestration in CDM. The chapter on the forest sector in this study identifies,evaluates and responds to the arguments against sequestration, with scientific methodology andevidence.
5.1.6. The Unilateral Model for Project Formulation Must beApproved to Maximize Participation of Colombian Projectsand Those from Other High-Risk Countries
The model for bilateral formulation requires the participation of two partners in each CDMproject: an agent from Annex B and one from a developing country. As indicated in theprevious section, this requirement notably increases transaction costs and creates forColombian formulators a problematic dependency. To expect an Annex B company toparticipate from the beginning places high-risk countries like Colombia at a clear disadvantage.We wish to unequivocally state that the presumption of the bilateral requirement is notestablished in Article 12: certain countries and entities have presumed it.
From the standpoint of Annex B, bilateral formulation imposes transaction costs that are muchhigher than is the case with the remaining compliance options. It is necessary to seek out apartner in a developing country, study and negotiate his participation in a project, developcontractual commitments, assume legal costs and administer the project jointly, among otheritems. Further, Annex B countries would have a broad range of developing countries in whichto invest: countries like Brazil, Costa Rica and Chile, for example, where the risks investorsfaces are low. With less risky options, many investors will avoid investing in Colombiabecause of their perception of the numerous and high risks84. For Colombia, the bilateral modelimposes comparative disadvantages that for many projects will be impossible to overcome.
Besides the bilateral model, COP should permit the unilateral model where formulation,financing and execution of CDM projects can be initiated and executed by public or privateentities from Non-Annex B countries. Private or public companies in Colombia could plan,execute and operate CDM projects without waiting to be chosen by an Annex B company.
In the unilateral model, the rules for certifying emissions reduction and generating CERs will beequal to those of the bilateral model. Each project must establish its base line and prove itsadditionality through the Operational Entities certified by COP. The reductions will be real,measurable and long run, as established under Article 12.
Another disadvantage of the bilateral model is that Annex B companies generally have a greaterpower of negotiation than their national counterparts, and could easily obtain CERs at costs
83 Pp.4 and 5.84 See Section 6.4 for a comparison of country risks and specific risks for CDM projects between Colombia andother countries.
136
lower than the market price. Instead, the unilateral model permits national generators of alreadygenerated CERs to receive the totality of the CERs generated and their complete value. Theycan place them in the national or international markets for sale at the best possible price,maximizing resource transferences from the Annex B country to the developing country.
This option is of particular importance for Colombia because it also makes it possible to includesmall projects. Generally, Annex B prefers mega-projects because the cost of transaction perCER generated is very low. Small reforestation, industrial reconversion and transportationprojects can generate high benefits at the local level, but the transaction costs and risks offormulating hundreds of small projects are very high. Annex B investors will be able to obtainthe same quantity of CERs with the formulation of a thermo-electrical reconversion or withindustrial plant. With the unilateral formulation model, purveyors of projects that are perceivedto have high risks, high transaction costs or that are small, will not have to wait to be selectedby Annex B investors to be eligible to participate in CDM, dramatically increasing the potentialfor participation of many Colombian projects.
This option depends on having access to financing for feasibility studies for projects and forinvestment in the project. A subsequent chapter identifies and analyzes the set of financingoptions that may exist for projects that are formulated unilaterally.
Annex B companies that favor the modality of unilateral formulation of CDM projects couldpurchase CERs in exchanges with no risk and with no transactions cost whatever. However,countries like China have manifested their opposition to the unilateral model.
With a view to promoting this modality, Colombian participated in developing, and signed with15 Latin American countries, the document Misc. FCCC/SB/1999/MISC.10/Add.3, whichclearly establishes their position in favor of the inclusion of the unilateral model in the CDM83.
5.1.7. Free Trading of CERs in Financial Exchanges and SecondaryMarkets Should not be Restricted
Several negotiators from G77 countries have argued that CERs should not be transacted inmarkets or stock exchanges, and that they should only be transferred to Annex B investors thatfinanced the projects producing the CERs. This is an extension of the bilateral modality forformulating projects and, in certain cases, an ideological manifestation against markets forexchanging negotiable emissions rights. However, no logical reason has been put forward forforbidding the exchange of CERs in secondary markets.
Clearly, the possibility of selling CERs in secondary markets is essential for the operation of theunilateral formulation model for projects, because when CERs are generated, one must be ableto sell them to the Annex B purveyor that offers the greatest value for them, whether it is anemitter company from any Annex B country, an institutional investor like a bank or a mutualfunds, or else an NGO that wishes to purchase the right, to prevent its future use.
83 P. 3, paragraph 1.
137
Institutional investors always strengthen markets because their investment analyses aresophisticated and they are prepared to speculate and assume certain investment risks thatconservative actors like thermo-electrics are not willing to take on in the initial phase of a newmarket. To enter the market for CERs, intermediaries must be able to resell them in the futureto the final demanders, that is Annex B emitters. Environmental NGOs that wish to promotethe reduction of emissions in developing countries and at the same time restrict even furtherpresent emissions from the Annex B, must be able to purchase CERs is world markets and takethem out of circulation, thus reducing total GHG emissions. The prohibition from freelyexchanging CERs in exchanges and secondary markets has no logic whatever, either ineconomic or environmental terms.
5.1.8. Limits Stemming from Supplementarity Should be Voluntaryfor Each Annex B Country
The Kyoto Protocol indicates that Annex B countries will be able to use CERs generated viaCDM “ …to contribute to compliance with a part of their reduction commitments.” Even so, theProtocol does not specify any numerical limitation. Certain countries and entities (principallyGermany and European NGOs) have taken the position that a specific quantitative restrictionmust be imposed on the use of CDM for complying with national goals, forcing Annex Bcountries to execute a specific percentage of reductions “at home.”
Given that the mitigating effect of reductions is equal at any place on the planet, this is amoralistic--and not an environmentalist--argument. The effect of forcing more reductionsinside Annex B will have two principal effects: first, it will increase the cost of compliance inAnnex B in general because access to cost-effective options in the developing world will berestricted. Second, quantitative reduction in demand for CERs proceeding from CDM willreduce the number of projects funded in developing countries, reduce the North-South flow ofresources and also the price per ton reduced. Among all the proposals of the COP, restrictionsstemming from supplementarity are the most devastating in light of CDM’s two objectives:instead of helping Annex B to comply with its obligations, this will make it more costly to doso. And instead of promoting sustainable development in developing countries, this will reducethe flow of resources notably.
Supplementarity must be voluntary for each Annex B country. The analysis of markets in thepresent study demonstrates that a very significant part of reductions will be executed at home inany case.
5.1.9. The Sustainable Development Criterion must be a NationalCriterion
Certain countries and NGOs preach that the COP must impose the criteria of sustainabledevelopment when evaluating and approving CDM projects. They argue that developingcountries have an incentive to implement any type of project that generates CERs for them,even if they do not favor the environment, like nuclear plants or destroying a native forest to
138
plant rapid-growth forests, merely to claim CERs. This shows no little lack of empathy withinstitutions in developing countries like environmental authorities and environmental licensers.
The criteria for defining sustainable development must be devised by each country, taking intoaccount their national priorities and particular environment. Designated national authoritiesfrom each country will play a crucial role in developing the criteria of sustainable developmentfor CDM projects; these criteria must emphasize beneficial externalities associated with theprojects like protecting basins, conserving biodiversity, energy efficiency and employment.
5.1.10. Promoting Financial Support for the Creation of a NationalCapacity
Maximizing potential benefits requires the consolidation of a national program directed toeducating about CDM and training in the formulation of the kind of project that is able toqualify. UNFCCC, IPCC, CAF (the Andean regional development agency), UNDP and otherinternational organisms have important resources for capacity-building; evidently, it isnecessary to make the best possible use of these resources to develop workshops, trainingprograms, and systems for transferring information (among others) for those sectors interestedin applying CDM, with a view to formulating and consolidating a national implementationprocess.
5.2. Strategies for National Capacity Building in the CDMProject Formulation and Development
5.2.1. IntroductionArticle 12 of the Kyoto Protocol states that “ …certified reductions obtained between 2000 andthe beginning of the first commitment period 87 can be used to contribute to meetingcommitments in the first compliance period,”88 thus creating a new opportunity for developingcountries to generate projects which reduce, prevent or mitigate emissions from GreenhouseGases.
This window constitutes an opportunity for countries like Colombia to attract a flow ofinvestment to the forest, industry and energy sectors. With a view to maximizing the potentialbenefits this opportunity represents, we identified the need to strengthen national capacity forformulating CDM projects, as a fundamental point in the implementation strategy for the CleanDevelopment Mechanism in Colombia.
However, there are questions like: What role should the State play to maximize thisopportunity, based on an innovative regulatory program? Just how should we develop anational capacity for formulating projects that will be competitive in this new market?
87 It is understood that this is the period 2008-2012.88 Kyoto Protocol.
139
In the creation of new international markets, the States participating in the internationalnegotiations to set up the new market have access to information for two purposes: (i.) Toidentify opportunities for the country based on the negotiations and their results, and (ii). Toserve as an initial source of information and training for the domestic productive sectors thatwould potentially benefit from the new regulatory mechanism, because these local actors do nothave perfect information on the potential benefits.
Based on these two goals, Colombia has been participating actively in the internationalnegotiations of CMCC and KP, and at the same time the Ministry of the Environment hasconducted comprehensive research on CDM opportunities for the country and also the domesticpotential of this market.
On the other hand, strengthening the capacity is a function of the skill of individuals andinstitutions to take and implement decisions and execute functions in an effective, efficient andsustainable manner89. At the individual level, capacity building refers to the process ofchanging attitudes and behavior, imparting knowledge and developing skills, also maximizingthe benefits derived from participating, and exchanging of knowledge and property.
This chapter presents the main lines of the strategy for building capacity on the domestic scenewith regard to project formulation from the standpoint of potential creators of developmentprojects in forestry, energy and industry proper.
5.2.2. MethodologyThe methodology we used is based on four points. First, analysis and knowledge of CDM as aconcomitant of the execution of the National Strategy Study; second, constant participation ininternational negotiations on this subject; third, the Ministry of the Environment’s experience intraining for new regulatory schemes90 and fourth, telephone surveys with representatives of theproducers’ associations in the country interested in CDM and with environmental authorities ofthe country (Ministry of the Environment; CORNARE and CVC—regional environmentalauthorities)
The results indicated that the principal points for developing the strategy are training schemesand disseminating information and guidelines for project formulation. To implement thesepoints, the Ministry of the Environment formulated a national training program devoted todifferent productive sectors and regions interested in CDM, to ensure that project proponentsshould have the greatest amount of information available for decision-making, if projects are tomaximize net benefits for the country. This program operates basically through workshops andseminars in the country, and also designs and publishes a web site with the relevant informationand methodological guides.
89 UNDP. Capacity Building for Environmental management. 1999. P. 10.90 The Ministry of the Environment has successfully implemented programs for controlling pollution, such as theProgram for Pollution Charges.
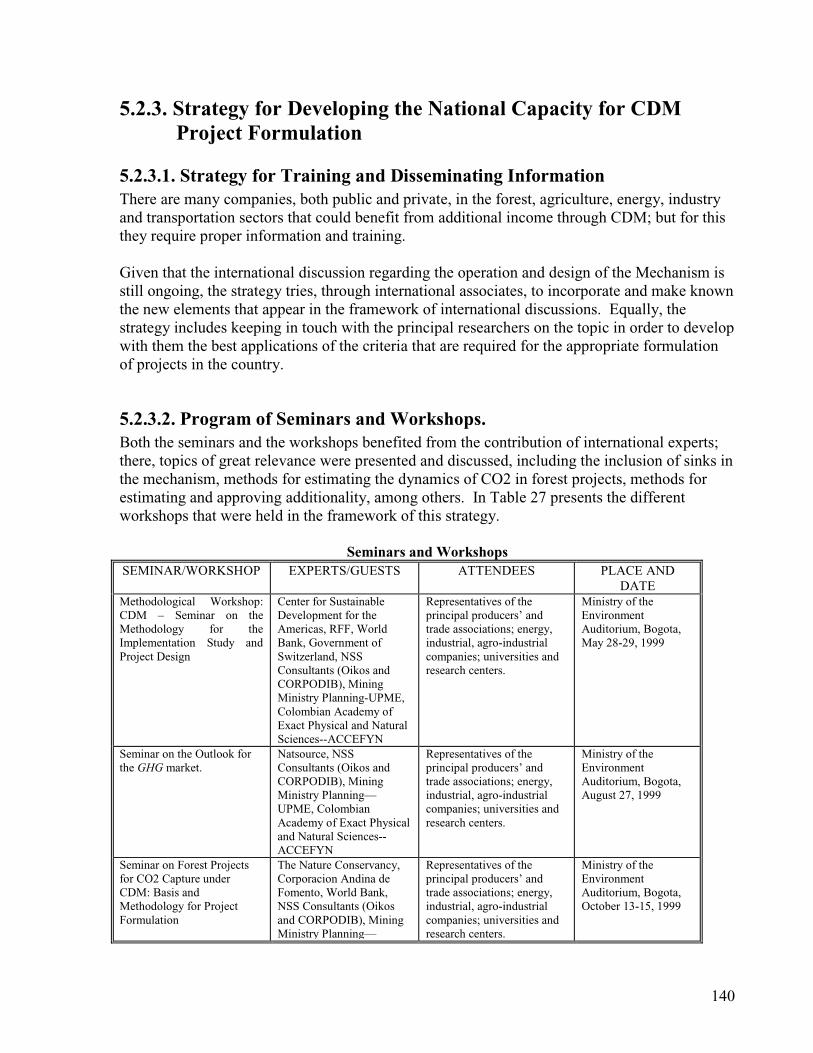
140
5.2.3. Strategy for Developing the National Capacity for CDMProject Formulation
5.2.3.1. Strategy for Training and Disseminating InformationThere are many companies, both public and private, in the forest, agriculture, energy, industryand transportation sectors that could benefit from additional income through CDM; but for thisthey require proper information and training.
Given that the international discussion regarding the operation and design of the Mechanism isstill ongoing, the strategy tries, through international associates, to incorporate and make knownthe new elements that appear in the framework of international discussions. Equally, thestrategy includes keeping in touch with the principal researchers on the topic in order to developwith them the best applications of the criteria that are required for the appropriate formulationof projects in the country.
5.2.3.2. Program of Seminars and Workshops.Both the seminars and the workshops benefited from the contribution of international experts;there, topics of great relevance were presented and discussed, including the inclusion of sinks inthe mechanism, methods for estimating the dynamics of CO2 in forest projects, methods forestimating and approving additionality, among others. In Table 27 presents the differentworkshops that were held in the framework of this strategy.
Seminars and WorkshopsSEMINAR/WORKSHOP EXPERTS/GUESTS ATTENDEES PLACE AND
DATEMethodological Workshop:CDM – Seminar on theMethodology for theImplementation Study andProject Design
Center for SustainableDevelopment for theAmericas, RFF, WorldBank, Government ofSwitzerland, NSSConsultants (Oikos andCORPODIB), MiningMinistry Planning-UPME,Colombian Academy ofExact Physical and NaturalSciences--ACCEFYN
Representatives of theprincipal producers’ andtrade associations; energy,industrial, agro-industrialcompanies; universities andresearch centers.
Ministry of theEnvironmentAuditorium, Bogota,May 28-29, 1999
Seminar on the Outlook forthe GHG market.
Natsource, NSSConsultants (Oikos andCORPODIB), MiningMinistry Planning—UPME, ColombianAcademy of Exact Physicaland Natural Sciences--ACCEFYN
Representatives of theprincipal producers’ andtrade associations; energy,industrial, agro-industrialcompanies; universities andresearch centers.
Ministry of theEnvironmentAuditorium, Bogota,August 27, 1999
Seminar on Forest Projectsfor CO2 Capture underCDM: Basis andMethodology for ProjectFormulation
The Nature Conservancy,Corporacion Andina deFomento, World Bank,NSS Consultants (Oikosand CORPODIB), MiningMinistry Planning—
Representatives of theprincipal producers’ andtrade associations; energy,industrial, agro-industrialcompanies; universities andresearch centers.
Ministry of theEnvironmentAuditorium, Bogota,October 13-15, 1999
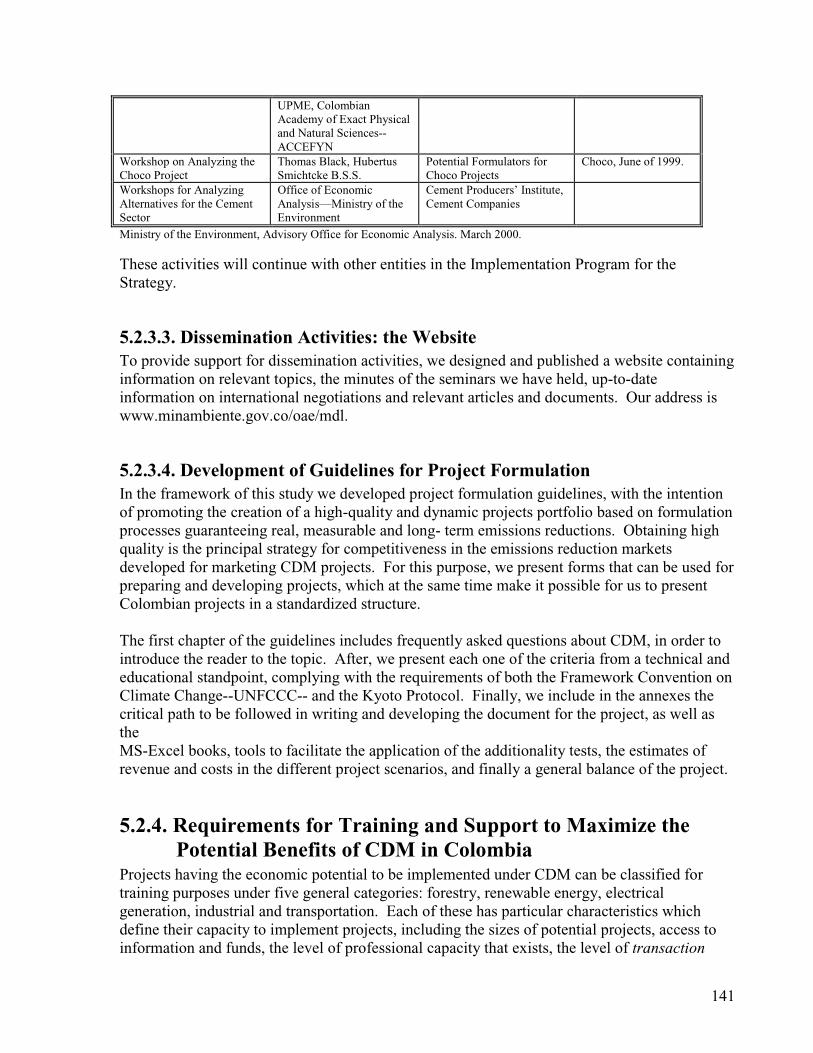
141
UPME, ColombianAcademy of Exact Physicaland Natural Sciences--ACCEFYN
Workshop on Analyzing theChoco Project
Thomas Black, HubertusSmichtcke B.S.S.
Potential Formulators forChoco Projects
Choco, June of 1999.
Workshops for AnalyzingAlternatives for the CementSector
Office of EconomicAnalysis—Ministry of theEnvironment
Cement Producers’ Institute,Cement Companies
Ministry of the Environment, Advisory Office for Economic Analysis. March 2000.
These activities will continue with other entities in the Implementation Program for theStrategy.
5.2.3.3. Dissemination Activities: the WebsiteTo provide support for dissemination activities, we designed and published a website containinginformation on relevant topics, the minutes of the seminars we have held, up-to-dateinformation on international negotiations and relevant articles and documents. Our address iswww.minambiente.gov.co/oae/mdl.
5.2.3.4. Development of Guidelines for Project FormulationIn the framework of this study we developed project formulation guidelines, with the intentionof promoting the creation of a high-quality and dynamic projects portfolio based on formulationprocesses guaranteeing real, measurable and long- term emissions reductions. Obtaining highquality is the principal strategy for competitiveness in the emissions reduction marketsdeveloped for marketing CDM projects. For this purpose, we present forms that can be used forpreparing and developing projects, which at the same time make it possible for us to presentColombian projects in a standardized structure.
The first chapter of the guidelines includes frequently asked questions about CDM, in order tointroduce the reader to the topic. After, we present each one of the criteria from a technical andeducational standpoint, complying with the requirements of both the Framework Convention onClimate Change--UNFCCC-- and the Kyoto Protocol. Finally, we include in the annexes thecritical path to be followed in writing and developing the document for the project, as well astheMS-Excel books, tools to facilitate the application of the additionality tests, the estimates ofrevenue and costs in the different project scenarios, and finally a general balance of the project.
5.2.4. Requirements for Training and Support to Maximize thePotential Benefits of CDM in Colombia
Projects having the economic potential to be implemented under CDM can be classified fortraining purposes under five general categories: forestry, renewable energy, electricalgeneration, industrial and transportation. Each of these has particular characteristics whichdefine their capacity to implement projects, including the sizes of potential projects, access toinformation and funds, the level of professional capacity that exists, the level of transaction
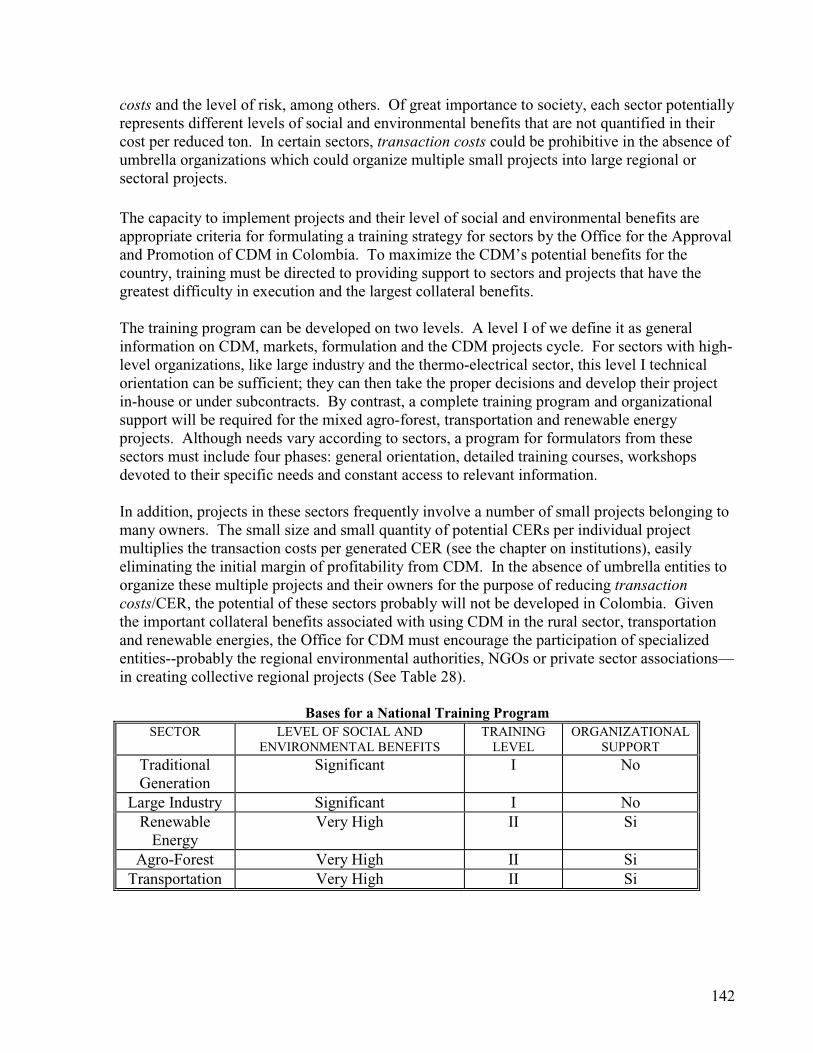
142
costs and the level of risk, among others. Of great importance to society, each sector potentiallyrepresents different levels of social and environmental benefits that are not quantified in theircost per reduced ton. In certain sectors, transaction costs could be prohibitive in the absence ofumbrella organizations which could organize multiple small projects into large regional orsectoral projects.
The capacity to implement projects and their level of social and environmental benefits areappropriate criteria for formulating a training strategy for sectors by the Office for the Approvaland Promotion of CDM in Colombia. To maximize the CDM’s potential benefits for thecountry, training must be directed to providing support to sectors and projects that have thegreatest difficulty in execution and the largest collateral benefits.
The training program can be developed on two levels. A level I of we define it as generalinformation on CDM, markets, formulation and the CDM projects cycle. For sectors with high-level organizations, like large industry and the thermo-electrical sector, this level I technicalorientation can be sufficient; they can then take the proper decisions and develop their projectin-house or under subcontracts. By contrast, a complete training program and organizationalsupport will be required for the mixed agro-forest, transportation and renewable energyprojects. Although needs vary according to sectors, a program for formulators from thesesectors must include four phases: general orientation, detailed training courses, workshopsdevoted to their specific needs and constant access to relevant information.
In addition, projects in these sectors frequently involve a number of small projects belonging tomany owners. The small size and small quantity of potential CERs per individual projectmultiplies the transaction costs per generated CER (see the chapter on institutions), easilyeliminating the initial margin of profitability from CDM. In the absence of umbrella entities toorganize these multiple projects and their owners for the purpose of reducing transactioncosts/CER, the potential of these sectors probably will not be developed in Colombia. Giventhe important collateral benefits associated with using CDM in the rural sector, transportationand renewable energies, the Office for CDM must encourage the participation of specializedentities--probably the regional environmental authorities, NGOs or private sector associations—in creating collective regional projects (See Table 28).
Bases for a National Training ProgramSECTOR LEVEL OF SOCIAL AND
ENVIRONMENTAL BENEFITSTRAININGLEVEL
ORGANIZATIONALSUPPORT
TraditionalGeneration
Significant I No
Large Industry Significant I NoRenewableEnergy
Very High II Si
Agro-Forest Very High II SiTransportation Very High II Si
143
5.2.4.1. Tools for the Formulation of High-Quality ProjectsOnce the Kyoto Protocol Mechanisms become operational, the GHG emissions generatingsources in countries with reduction commitments will have to identify the different reductionoptions and the costs associated with each of them. It is clear that this list of options includesthe alternatives that can be generated through the flexibility mechanisms, and thus thepossibility of executing projects for reduction, prevention and/or GHG emissions capture indeveloping countries.
Like any other final good, the possibility of marketing Colombian reduction certificates dependson their quality, on the associated risks, cost and, given the particularities of the Kyoto Protocolflexibility mechanisms, compliance with the eligibility criteria peculiar to CDM.
QualityWhich factors will affect the quality of projects, in positive or negative terms? Design, thefinancing options which are located and approved, the management plan, the operation andexecution of the project, the techniques for measuring reduction or capture of GHG emissions,among others. These factors will make or break the quality of Colombian CREss (CERs). Now,on the other hand certain points in the regulatory and operational framework of CDM stillremain to be defined. Topics like the operation, measurement mechanisms and projectcertification are not yet clear in the proposed scheme and are still the subject of internationalnegotiations. Certainly, this generates uncertainty both for potential project formulators and forpossible purchaser; in consequence, it is not yet possible to send clear signals about the qualityof certificates as regards these topics.
Using the formulation guides for projects, we present each of the criteria from a technical andeducational point of view, complying with the requirements of both UNFCCC and KP, so thatproject proponents can properly understand and apply each of these criteria, and alsostandardize the preparation and presentation of Colombian projects. The guidelines have twofundamental chapters: first, a pre-feasibility analysis with initial profiles, and then the concretesteps for project formulation.
Pre-feasibility AnalysisThis exercise seeks to deepen the analysis of the pre-selected alternatives, reducing uncertaintyand improving the quality of information in the search for the optimal alternative. At this stage,the project formulator should conduct an initial evaluation of the project based on localization,project owners, landowners, potential threats stemming from the change in the use of land,potential contribution of the projects to sustainable development and finally, generation ofCERs. If the initial profile of the project passes this evaluation, the formulation processcontinues; otherwise, another profile must be found, because it is quite probable that this projectwould not comply with the necessary requirements of CDM.
Formulation of the CDM ProjectWithin the formulation of the project, the proponent must present in detail each of the stepsnecessary to take a project to the point where it can be remitted to the national authority incharge of approving the project. The first step requires detailed definition and presentation ofall the activities that proponents wish to develop in the project’s framework, through which it
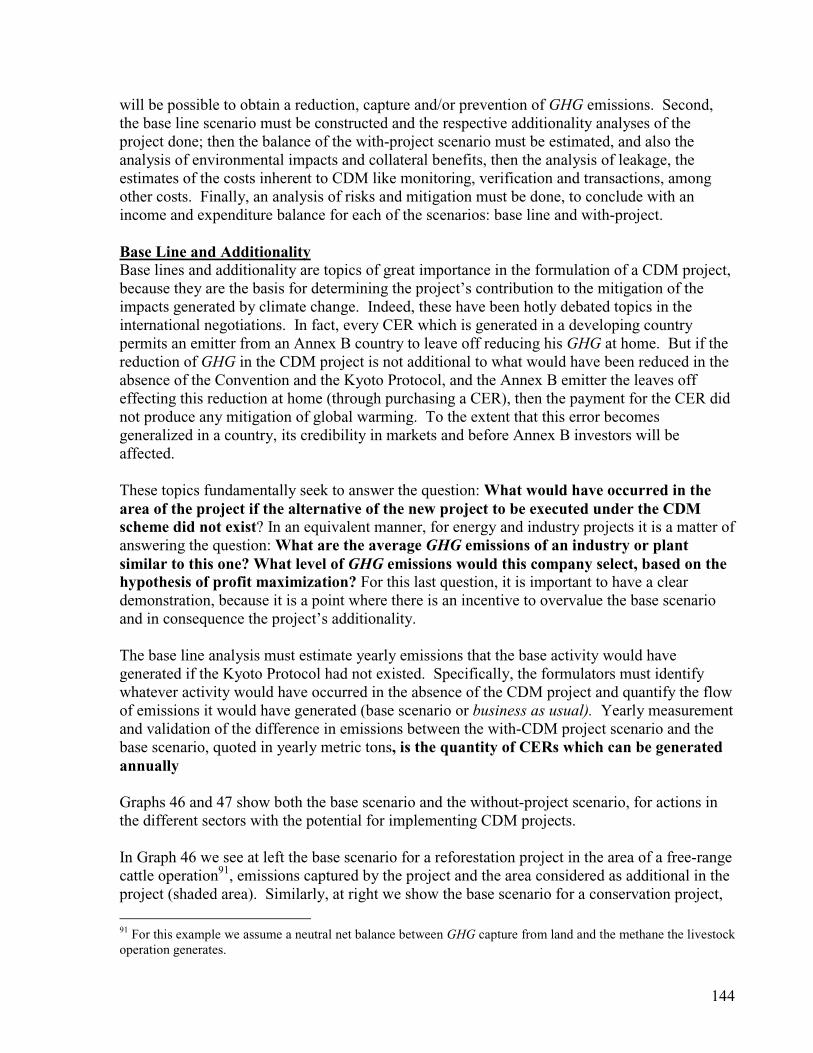
144
will be possible to obtain a reduction, capture and/or prevention of GHG emissions. Second,the base line scenario must be constructed and the respective additionality analyses of theproject done; then the balance of the with-project scenario must be estimated, and also theanalysis of environmental impacts and collateral benefits, then the analysis of leakage, theestimates of the costs inherent to CDM like monitoring, verification and transactions, amongother costs. Finally, an analysis of risks and mitigation must be done, to conclude with anincome and expenditure balance for each of the scenarios: base line and with-project.
Base Line and AdditionalityBase lines and additionality are topics of great importance in the formulation of a CDM project,because they are the basis for determining the project’s contribution to the mitigation of theimpacts generated by climate change. Indeed, these have been hotly debated topics in theinternational negotiations. In fact, every CER which is generated in a developing countrypermits an emitter from an Annex B country to leave off reducing his GHG at home. But if thereduction of GHG in the CDM project is not additional to what would have been reduced in theabsence of the Convention and the Kyoto Protocol, and the Annex B emitter the leaves offeffecting this reduction at home (through purchasing a CER), then the payment for the CER didnot produce any mitigation of global warming. To the extent that this error becomesgeneralized in a country, its credibility in markets and before Annex B investors will beaffected.
These topics fundamentally seek to answer the question:What would have occurred in thearea of the project if the alternative of the new project to be executed under the CDMscheme did not exist? In an equivalent manner, for energy and industry projects it is a matter ofanswering the question:What are the average GHG emissions of an industry or plantsimilar to this one? What level of GHG emissions would this company select, based on thehypothesis of profit maximization? For this last question, it is important to have a cleardemonstration, because it is a point where there is an incentive to overvalue the base scenarioand in consequence the project’s additionality.
The base line analysis must estimate yearly emissions that the base activity would havegenerated if the Kyoto Protocol had not existed. Specifically, the formulators must identifywhatever activity would have occurred in the absence of the CDM project and quantify the flowof emissions it would have generated (base scenario or business as usual). Yearly measurementand validation of the difference in emissions between the with-CDM project scenario and thebase scenario, quoted in yearly metric tons, is the quantity of CERs which can be generatedannually
Graphs 46 and 47 show both the base scenario and the without-project scenario, for actions inthe different sectors with the potential for implementing CDM projects.
In Graph 46 we see at left the base scenario for a reforestation project in the area of a free-rangecattle operation91, emissions captured by the project and the area considered as additional in theproject (shaded area). Similarly, at right we show the base scenario for a conservation project,
91 For this example we assume a neutral net balance between GHG capture from land and the methane the livestockoperation generates.
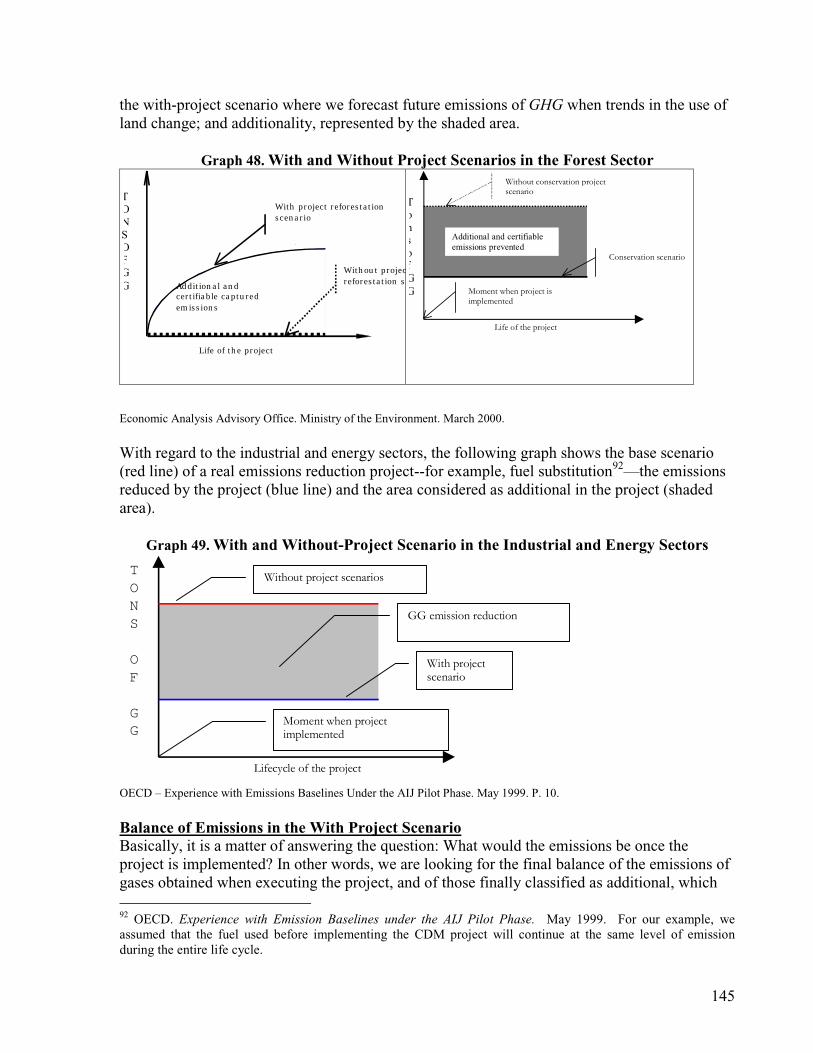
145
the with-project scenario where we forecast future emissions of GHG when trends in the use ofland change; and additionality, represented by the shaded area.
Graph 48. With and Without Project Scenarios in the Forest Sector
With project reforestationscenario
Life of the project
Additional andcertifiable capturedemissions
Without projecreforestation s
TONSOFGG
Life of the project
Without conservation projectscenario
Moment when project isimplemented
Conservation scenario
Additional and certifiableemissions prevented
TonsofGG
Economic Analysis Advisory Office. Ministry of the Environment. March 2000.
With regard to the industrial and energy sectors, the following graph shows the base scenario(red line) of a real emissions reduction project--for example, fuel substitution92—the emissionsreduced by the project (blue line) and the area considered as additional in the project (shadedarea).
Graph 49. With and Without-Project Scenario in the Industrial and Energy Sectors
With projectscenario
Without project scenarios
Lifecycle of the project
TONS
OF
GG
Moment when projectimplemented
GG emission reduction
OECD – Experience with Emissions Baselines Under the AIJ Pilot Phase. May 1999. P. 10.
Balance of Emissions in the With Project ScenarioBasically, it is a matter of answering the question: What would the emissions be once theproject is implemented? In other words, we are looking for the final balance of the emissions ofgases obtained when executing the project, and of those finally classified as additional, which
92 OECD. Experience with Emission Baselines under the AIJ Pilot Phase. May 1999. For our example, weassumed that the fuel used before implementing the CDM project will continue at the same level of emissionduring the entire life cycle.
146
will be marketed. For forest projects, this balance must be presented both for the project and itsarea of influence. The latter is an important source of information for the analysis of leakagethat is presented below.
Leakage in CDM ProjectsLeakage is not necessarily a characteristic of the project’s baseline or base scenario. However,this is a widely debated topic internationally, and it is necessary to do a comparative analysisbetween the with-project scenario and the base scenario. A leakage occurs when the activitiesthe project seeks to develop to capture or prevent emissions, in some manner trigger GHGemissions outside of the project’s direct area.
Specific CDM ActivitiesThese activities refer specifically to monitoring, verification and certifying the CO2 tons,because when formulating a CDM project we must take these requirements into account, sincevery probably the CDM Program will require them.
Associated RiskHere we analyze the risk from the prior standpoint of the project, trying to identify risk-generating factors and again their implications in minimization and management. Basically, itis a matter of identifying potential risks and their mitigation alternatives.
Cost AnalysisTo assist project proponents in this stage, this study developed spreadsheets on MS-Excel toobtain a complete revision of the expected cash flows of planned projects, making it possible toanalyze costs and revenues for both formulators and possible purchasers and/or investors.
The Excel material has four pages: first, Hypotheses and Results--where the calculations for theproject’s proof of additionality can be done; second, the Base Line Scenario; third, the With-CDM Project Scenario, and last the With-Project Scenario including possible incomeattributable to CDM.
5.2.5. ConclusionsThe owners of projects will require training for the appropriate formulation of base lines,registration, certification, domestic and international approval, measurement of GHG, estimateof additionality, certification of reductions and the generation of CERs. Without such training,many sectors will not understand the opportunity CDM offers at the present time. The ownersof projects will make many mistakes in the formulation process, the projects would then notqualify, and abundant resources will be expended unnecessarily. Because of this, the strategymust be directed to strengthening the capacity for formulating projects in all sectors interestedin participating in CDM
Given that in the country those sectors interested in formulating projects still lack detailedknowledge of the opportunity CDM represents, and that it is incumbent on the State at this timeto be the source of information and training, it is necessary, in the short and medium term, tocontinue to offer workshops and seminars like those which have been offered in the recent past.
147
This will make it possible for the sectors to understand the opportunity CDM offers and beprepared to participate competitively in the new market.
For the country to be able to maximize the net benefits of CDM, it is important to disseminateand implement standardized schemes for project formulation, so that project proponents willreceive clear signals regarding the presentation and preparation of products, to minimize costsand the time formulation takes.
Appropriate decision-making, especially investment decisions, is a function of availableinformation and proper understanding of it. Because of this, the State must work to disseminateinformation and train personnel efficiently, targeting the sectors with potential to implementCDM activities, both with a view to generating the respective CERs and to gain access to thecollateral benefits these represent. Often these collateral benefits will be of greater importancefor the nation in social terms than the value of the certificates themselves, thus it will be evenmore important for the State to provide incentives for developing a dynamic portfolio of high-quality projects.
5.3. Risk Management in CDM Projects in ColombiaSoon Colombia will begin to compete in the market for credits for reductions of CO2 and othergreenhouse gases (CERs), under the scheme of the Clean Development Mechanism. ForColombia to be competitive in this market, the country not only requires that any project itformulates should offer good profitability (low costs for reducing or capturing CO2), but it alsomust control and limit risks so that the projects are attractive for both foreign and domesticinvestors. In addition, the higher the perceived risk, the higher the return investors will expect.
There is no doubt that whatever CDM trading scheme is adopted will affect the risk analysesdifferent actors will make. Under the scheme of bilateral or multilateral trading, for example,the foreign investor (the purchaser of CERs) will assume most of the risk. Equally, under aunilateral scheme, the project’s local developer assumes the risk, eliminating virtually all riskfor purchasers of CERs (investors). Thus, risk differs also for different actors of the process.The country risk, for example, is a consideration of special importance for foreign investorsunder a bilateral scheme, but in a unilateral model it is practically irrelevant for local developersand investors.
5.3.1. General and Specific ObjectivesThis chapter concentrates on identifying risks for CDM projects in Colombia, and adequatemechanisms for mitigating, minimizing and providing coverage to make these projects andattractive for investors (both local and foreign).
In accordance with the general objectives that have been established, the specific objectivesdeveloped in the present chapter are as follows: to introduce the reader to the general aspects ofrisk management; to establish the risks of pre-implementation to which CDM is subject; toestablish the profile for country risk pertaining to Colombia, and its impact on a CDM program;
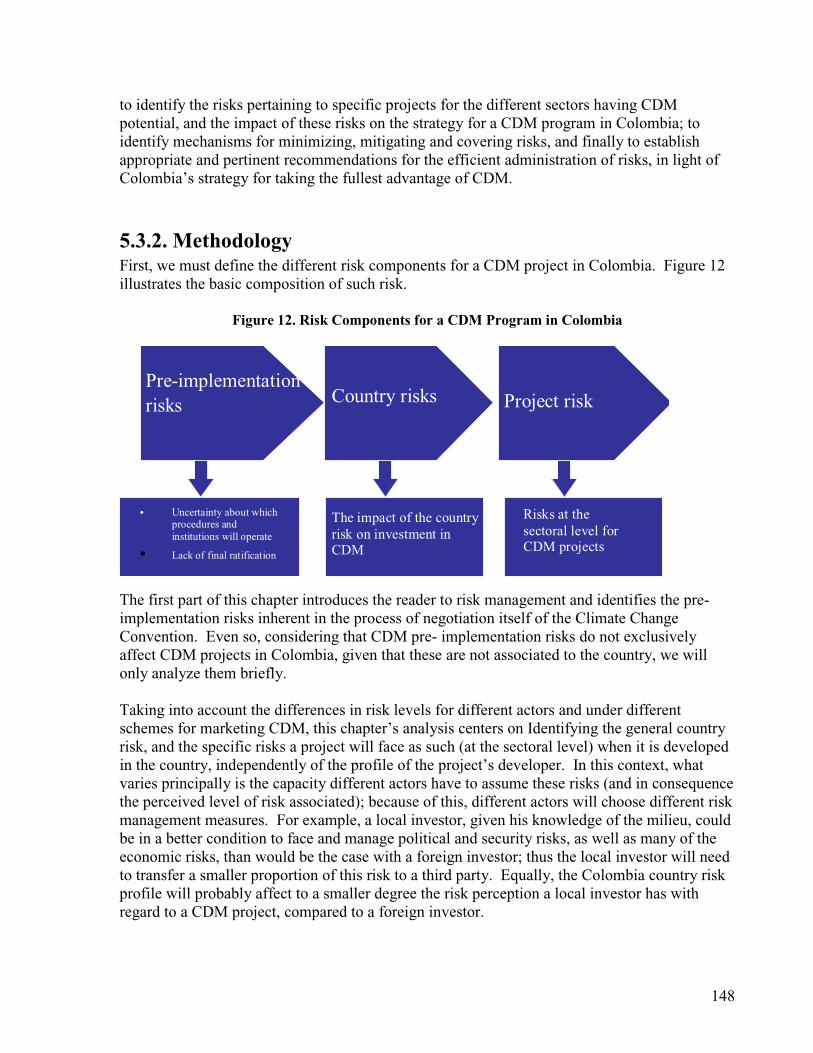
148
to identify the risks pertaining to specific projects for the different sectors having CDMpotential, and the impact of these risks on the strategy for a CDM program in Colombia; toidentify mechanisms for minimizing, mitigating and covering risks, and finally to establishappropriate and pertinent recommendations for the efficient administration of risks, in light ofColombia’s strategy for taking the fullest advantage of CDM.
5.3.2. MethodologyFirst, we must define the different risk components for a CDM project in Colombia. Figure 12illustrates the basic composition of such risk.
Figure 12. Risk Components for a CDM Program in Colombia
Pre-implementationrisks Country risks Project risk
The impact of the countryrisk on investment inCDM
• Uncertainty about whichprocedures andinstitutions will operate
• Lack of final ratification
Risks at thesectoral level forCDM projects
The first part of this chapter introduces the reader to risk management and identifies the pre-implementation risks inherent in the process of negotiation itself of the Climate ChangeConvention. Even so, considering that CDM pre- implementation risks do not exclusivelyaffect CDM projects in Colombia, given that these are not associated to the country, we willonly analyze them briefly.
Taking into account the differences in risk levels for different actors and under differentschemes for marketing CDM, this chapter’s analysis centers on Identifying the general countryrisk, and the specific risks a project will face as such (at the sectoral level) when it is developedin the country, independently of the profile of the project’s developer. In this context, whatvaries principally is the capacity different actors have to assume these risks (and in consequencethe perceived level of risk associated); because of this, different actors will choose different riskmanagement measures. For example, a local investor, given his knowledge of the milieu, couldbe in a better condition to face and manage political and security risks, as well as many of theeconomic risks, than would be the case with a foreign investor; thus the local investor will needto transfer a smaller proportion of this risk to a third party. Equally, the Colombia country riskprofile will probably affect to a smaller degree the risk perception a local investor has withregard to a CDM project, compared to a foreign investor.
149
Once the principal risks are identified, appropriate coverage and mitigation risks are identified.The adoption of appropriate and viable mitigation risks in cost-effectivity terms, can increaseCDM projets’ attractiveness in Colombia, taking into account that the perceived risk level forColombia is significant.
5.3.3. Description and Methodology for Drafting the Country RiskProfile
The perception of risk in Colombia potential investors in CDM projects have may, affects thefinal decision in investment decision, especially under a bilateral formulation and financingscheme where investment is constituted as a direct foreign investment. In this context, it isimportant to define the country risk profile, because it is one of the most frequently usedMechanisms to analyze perceived risks on the part of foreign investors93. The principalcomponents of the country risk profile analyzed for this risk component are:
• Political Risk• Security risk (“public order “)• Regulatory/ norms risk• Operational risks
• Economic and financial risk• Risk from economic structure• Risk from economic policy• Liquidity risk.
To develop the Colombia risk profile, we analyzed different risk qualifications for Colombiaissued by recognized qualifiers like Country Risk Service (The Economist Intelligence Unit),BRS (BERI’s Business Risk Service). Analysis of these qualifications is based on reviewing thecountry’s recent performance, as well as expected performance in the short run. For this, wealso reviewed relevant reports, articles and documents, like those issued by Standard andPoor’s, Control Risk Group, Coinvertir, and also magazines and newspapers.
In addition, we analyzed the medium and long run scenarios to help build the strategy, whichmust be followed to take advantage of CDM in the country, in whatever situation develops. Wealso compared Colombia with its main competitor countries in terms of country risk worldwide.
On the other hand, CDM projects face an institutional-type risk associated with the country,especially when we factor in the domestic approval projects require before the Executive Boardwill register them. The principal component of this institutional risk refers to establishinginefficient or inadequate institutions for CDM in the country. Now, the institution that will bein charge of evaluating, certifying and promoting the country CDM projects is discussed indetail in Chapter 7 on institutional design. The concrete risks associated with the operation ofthis office were given thoughtful consideration in the above- mentioned chapter and so they arenot discussed here. In the development of institutional design, we have foreseen the problems
93 Erb. Et al., Political Risk, Economic Risk and Financial Risk, Preliminary draft of the article published inFinancial Analysis Journal, Nov.-Dec. 1996.
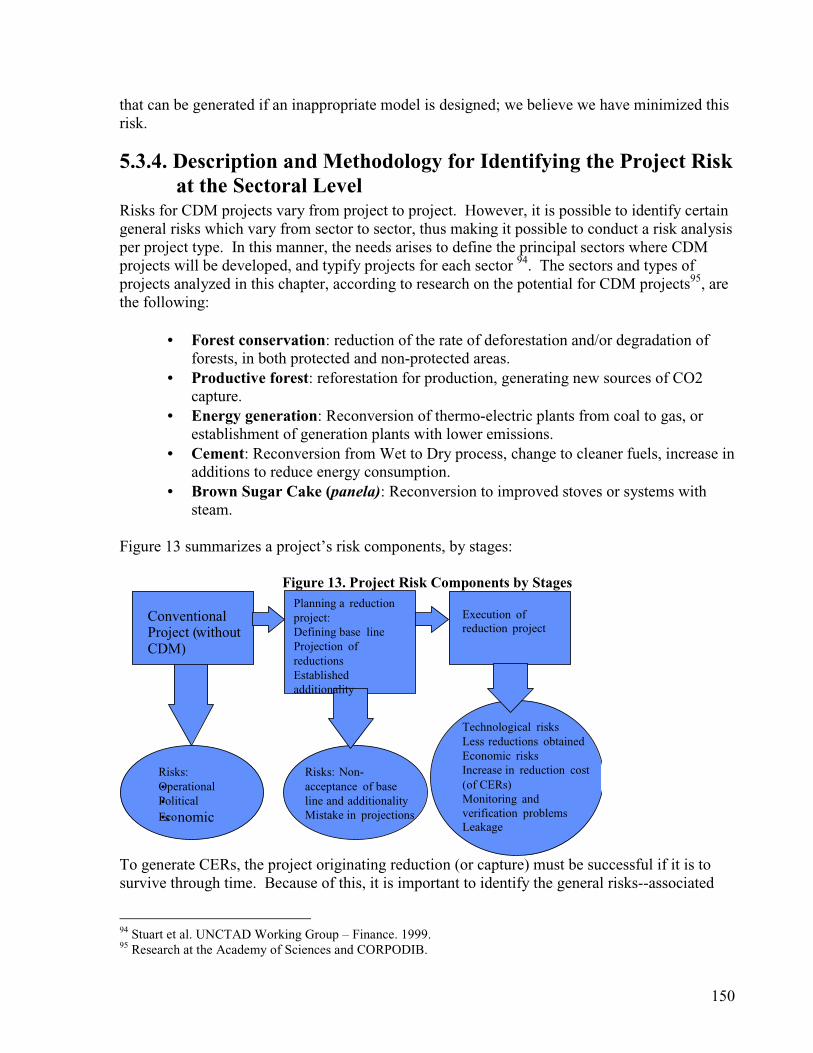
150
that can be generated if an inappropriate model is designed; we believe we have minimized thisrisk.
5.3.4. Description and Methodology for Identifying the Project Riskat the Sectoral Level
Risks for CDM projects vary from project to project. However, it is possible to identify certaingeneral risks which vary from sector to sector, thus making it possible to conduct a risk analysisper project type. In this manner, the needs arises to define the principal sectors where CDMprojects will be developed, and typify projects for each sector 94. The sectors and types ofprojects analyzed in this chapter, according to research on the potential for CDM projects95, arethe following:
• Forest conservation: reduction of the rate of deforestation and/or degradation offorests, in both protected and non-protected areas.
• Productive forest: reforestation for production, generating new sources of CO2capture.
• Energy generation: Reconversion of thermo-electric plants from coal to gas, orestablishment of generation plants with lower emissions.
• Cement: Reconversion from Wet to Dry process, change to cleaner fuels, increase inadditions to reduce energy consumption.
• Brown Sugar Cake (panela): Reconversion to improved stoves or systems withsteam.
Figure 13 summarizes a project’s risk components, by stages:
Figure 13. Project Risk Components by Stages
•••s
ConventionalProject (withoutCDM)
Planning a reductionproject:Defining base lineProjection ofreductionsEstablishedadditionality
Execution ofreduction project
Risks:OperationalPoliticalEconomic
Risks: Non-acceptance of baseline and additionalityMistake in projections
Technological risksLess reductions obtainedEconomic risksIncrease in reduction cost(of CERs)Monitoring andverification problemsLeakage
To generate CERs, the project originating reduction (or capture) must be successful if it is tosurvive through time. Because of this, it is important to identify the general risks--associated
94 Stuart et al. UNCTAD Working Group – Finance. 1999.95 Research at the Academy of Sciences and CORPODIB.
151
with conventional products that any project in the sector faces, and at the same time identify therisks for producing and verifying CERs96. For this, we analyzed specialize sectoral studies doneby Control Risk Service and other available sectoral research. In addition, we interviewedexperts and companies in the different sectors, with a view to identifying the risks specific toeach sector to which a CDM project might be exposed. Risks are measured qualitatively, usingthe different sectoral studies and interviews with the experts in each of the sectors.97
Following Joseph Jansson’s 98 methodology, the analysis of risk per sector for a CDM projectcan be broken down into three basic components, thus:• Technological/Operational Risks: Low performance compared to the projections foremissions reduced (including natural catastrophes).
• Political and/or regulatory risks: new regulations that can affect the project’s development,security and public order problems, property rights, non-compliance with regulations.
• Economic risks: unexpected increases in the costs of CERs; changes in the associatedconventional project’s economic and financial situation, which can negatively affect thegeneration of CERs (or their verification).
In addition, to the extent possible, the level of each risk identified99 is compared with the levelpresent in other Latin American countries like Mexico, Costa Rica, Brazil and Bolivia.
5.3.5. Identification of Mitigation and Coverage MechanismsAccording to the existing literature on the topic of risk, there are several alternatives formanaging risk100x. The principal alternatives are: to assume the risk completely, prevent it,reduce it, transfer it to someone more prepared to assume it, or cover it (summarized in themitigation and coverage options). The capacity to assume and manage a risk is nothomogeneous for all investors. In this way, the alternatives used to manage risk differaccording to the investor’s profile and the perceived level of risk.
In developing this section, we based our work on a review of the literature and examples ofexisting alternatives, and a review of the tools used by companies to manage risk, and identifyand analyze the causes or situations that generated risk, in order to seek possible solutions. Inthis way, it is possible to recommend to investors and project developers appropriate mitigationand coverage mechanisms for the different risks identified, so that they can decrease risk in a
96 Stuart et al. UNCTAD Working Group – Finance. 1999; Eyre Mundy, ARM and the Carbon Team, ForestryCarbon Sequestration Using the Clean Development Mechanisms: Fundamentals of Project Design, October1999.97 According to the article Political Risk, Economic Risk and Financial Risk, the qualification of political risk isbased on subjective analysis of available information, by experts. Daniel Hammer of ARM also recommendsconducting several interviews in each of the sectors, as the appropriate way of identifying risks.98 Janssen, J. Strategies for Risk Management of Joint Implementation Investments.99 The principal risks are determined as much by the probability of occurrence as by the magnitude and importanceof the potential loss, according to the methodology established in Forestry Carbon Sequestration Using the CleanDevelopment Mechanisms: Fundamentals of Project Design. October 1999.100 Janssen, J. Strategies for Risk Management of Joint Implementation Investments, Eyre Mundy, ARM and theCarbon Team, Forestry Carbon Sequestration Using the Clean Development Mechanisms: Fundamentals ofProject Design. October 1999. ARM and Eyre Mundy, Risk Mitigation in Forestry under Kyoto: Report to ForestTrends, May 28th 1999.
152
cost-effective way, thus increasing the potential attractiveness of CDM projects in Colombia.Clearly, managing risk increases the total cost of the project. However, once this additionalcost is taken on, the chances of final success for the project increase (or the probability of lossdecreases). At the beginning of this chapter, we tried to establish the cost of the differentmitigation and coverage mechanisms, but finally we desisted, because it is very difficult toestablish a standard for each sector, and not for each project. The cost of the mitigationmechanism depends on diverse factors, such as the specific risk generating conditions perproject, and the level of coverage or mitigation appropriate to the risk-aversion profile of eachinvestor.
5.3.6. Principal Conclusions and RecommendationsUntil the Kyoto Protocol is ratified, and the flexibility mechanisms regulated, uncertainty willpersist and in consequence the risks for early CDM project implementation will also persist.This situation undoubtedly operates as a brake to investment and to the development of projectsof this type. Even so, the risk must be weighed against the competitive advantages to be gainedif the market is developed in an appropriate fashion. In addition, at this stage of uncertainty it isprobable that the sort of projects that will be developed will be those having important collateralbenefits. The country’s present conditions make it possible to offer this type of benefitassociated with many of the projects with CDM potential. With the right campaign forcommunication and promotion, Colombia could become an excellent investment option at thisearly stage, under a bilateral scheme.
Taking into account the country’s high-risk situation, especially in the political sphere, theadoption of a unilateral trade model could be favorable for the development of CDM projects inColombia. However, we must consider is that the difficult economic and financial panoramawill make it difficult to find funding for these projects under an exclusive unilateral tradescheme. In addition, the high-risk scenario makes it important to adopt mitigation and riskcoverage measures, which will increase the cost for Colombian projects. On the other hand, thepositive side of this situation is that under these conditions it is easier for projects to complywith additionality, and the possibilities increase in terms of associated collateral benefits. Inany case, we recommend setting up multilateral financial sources to support the development ofCDM projects in the country.
With regard to medium and long term performance scenarios, they indicate high probability forscenarios where the country finds a negotiated settlement to the conflict which makes it possiblefor it to begin a recovery after a few years. The strategy that must be followed in developing aCDM program in Colombia varies according to the country’s ongoing situation. These differentstrategies are presented in summary in the Table 29:
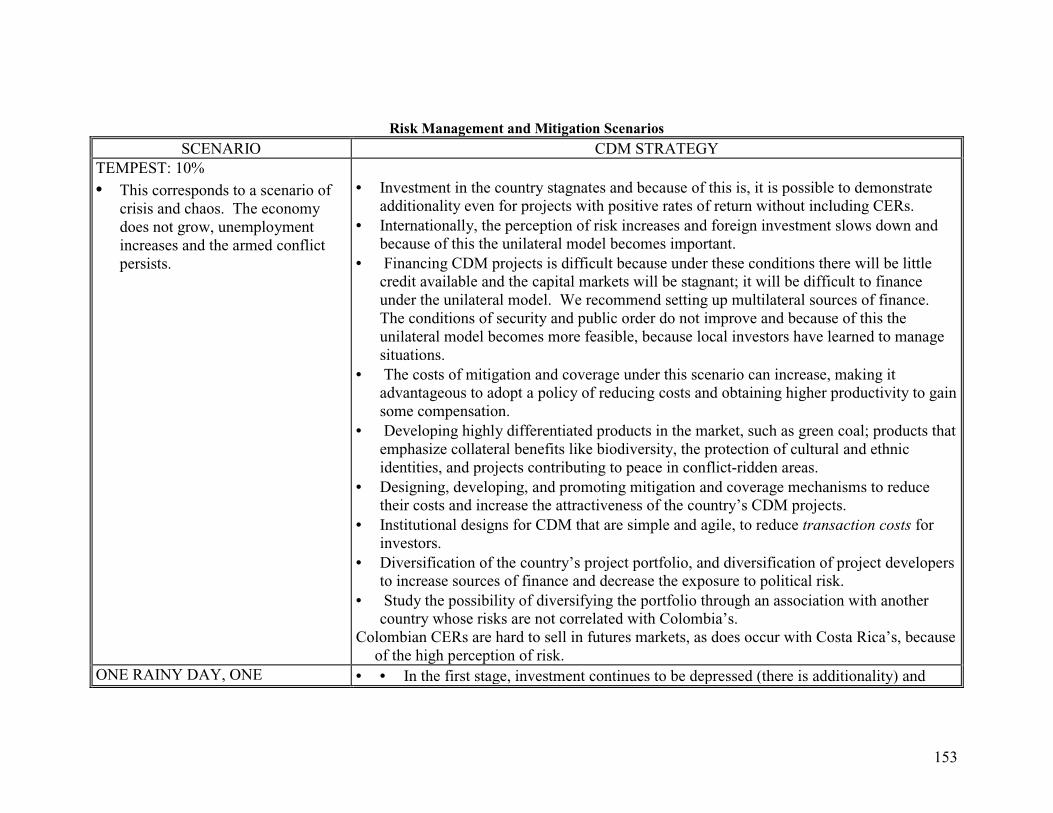
153
Risk Management and Mitigation ScenariosSCENARIO CDM STRATEGY
TEMPEST: 10%• This corresponds to a scenario ofcrisis and chaos. The economydoes not grow, unemploymentincreases and the armed conflictpersists.
• Investment in the country stagnates and because of this is, it is possible to demonstrateadditionality even for projects with positive rates of return without including CERs.
• Internationally, the perception of risk increases and foreign investment slows down andbecause of this the unilateral model becomes important.
• Financing CDM projects is difficult because under these conditions there will be littlecredit available and the capital markets will be stagnant; it will be difficult to financeunder the unilateral model. We recommend setting up multilateral sources of finance.The conditions of security and public order do not improve and because of this theunilateral model becomes more feasible, because local investors have learned to managesituations.
• The costs of mitigation and coverage under this scenario can increase, making itadvantageous to adopt a policy of reducing costs and obtaining higher productivity to gainsome compensation.
• Developing highly differentiated products in the market, such as green coal; products thatemphasize collateral benefits like biodiversity, the protection of cultural and ethnicidentities, and projects contributing to peace in conflict-ridden areas.
• Designing, developing, and promoting mitigation and coverage mechanisms to reducetheir costs and increase the attractiveness of the country’s CDM projects.
• Institutional designs for CDM that are simple and agile, to reduce transaction costs forinvestors.
• Diversification of the country’s project portfolio, and diversification of project developersto increase sources of finance and decrease the exposure to political risk.
• Study the possibility of diversifying the portfolio through an association with anothercountry whose risks are not correlated with Colombia’s.
Colombian CERs are hard to sell in futures markets, as does occur with Costa Rica’s, becauseof the high perception of risk.
ONE RAINY DAY, ONE • • In the first stage, investment continues to be depressed (there is additionality) and
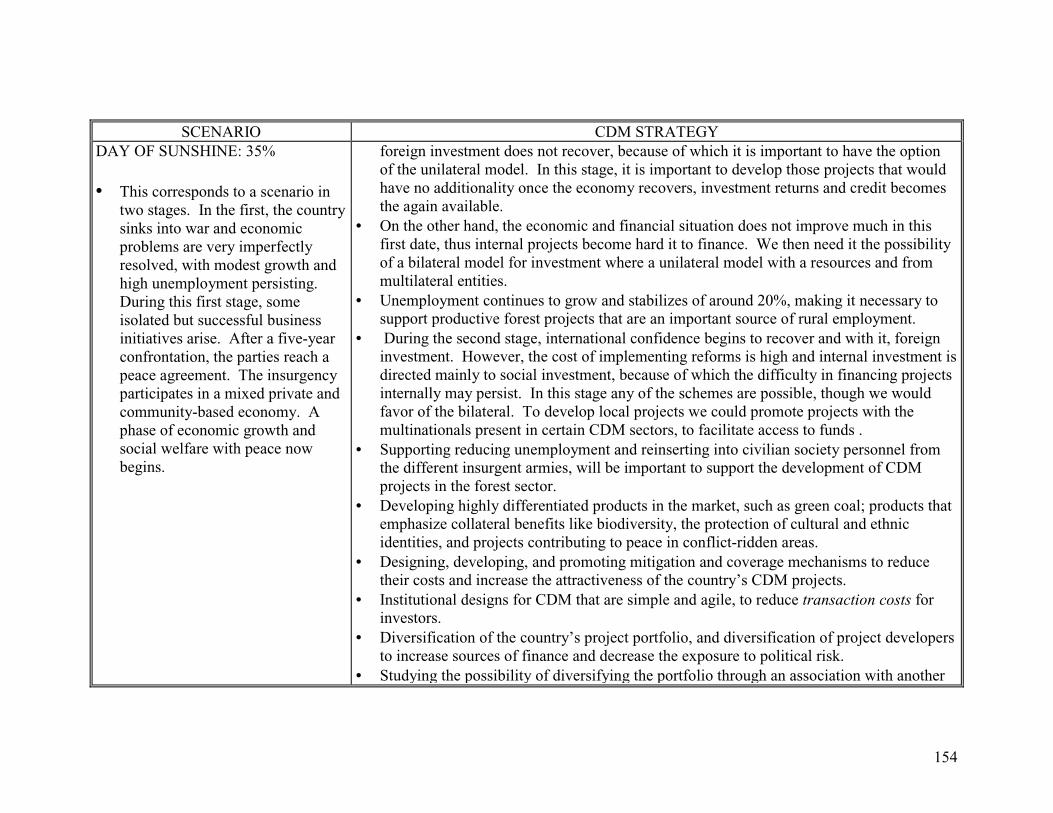
154
SCENARIO CDM STRATEGYDAY OF SUNSHINE: 35%
• This corresponds to a scenario intwo stages. In the first, the countrysinks into war and economicproblems are very imperfectlyresolved, with modest growth andhigh unemployment persisting.During this first stage, someisolated but successful businessinitiatives arise. After a five-yearconfrontation, the parties reach apeace agreement. The insurgencyparticipates in a mixed private andcommunity-based economy. Aphase of economic growth andsocial welfare with peace nowbegins.
foreign investment does not recover, because of which it is important to have the optionof the unilateral model. In this stage, it is important to develop those projects that wouldhave no additionality once the economy recovers, investment returns and credit becomesthe again available.
• On the other hand, the economic and financial situation does not improve much in thisfirst date, thus internal projects become hard it to finance. We then need it the possibilityof a bilateral model for investment where a unilateral model with a resources and frommultilateral entities.
• Unemployment continues to grow and stabilizes of around 20%, making it necessary tosupport productive forest projects that are an important source of rural employment.
• During the second stage, international confidence begins to recover and with it, foreigninvestment. However, the cost of implementing reforms is high and internal investment isdirected mainly to social investment, because of which the difficulty in financing projectsinternally may persist. In this stage any of the schemes are possible, though we wouldfavor of the bilateral. To develop local projects we could promote projects with themultinationals present in certain CDM sectors, to facilitate access to funds .
• Supporting reducing unemployment and reinserting into civilian society personnel fromthe different insurgent armies, will be important to support the development of CDMprojects in the forest sector.
• Developing highly differentiated products in the market, such as green coal; products thatemphasize collateral benefits like biodiversity, the protection of cultural and ethnicidentities, and projects contributing to peace in conflict-ridden areas.
• Designing, developing, and promoting mitigation and coverage mechanisms to reducetheir costs and increase the attractiveness of the country’s CDM projects.
• Institutional designs for CDM that are simple and agile, to reduce transaction costs forinvestors.
• Diversification of the country’s project portfolio, and diversification of project developersto increase sources of finance and decrease the exposure to political risk.
• Studying the possibility of diversifying the portfolio through an association with another
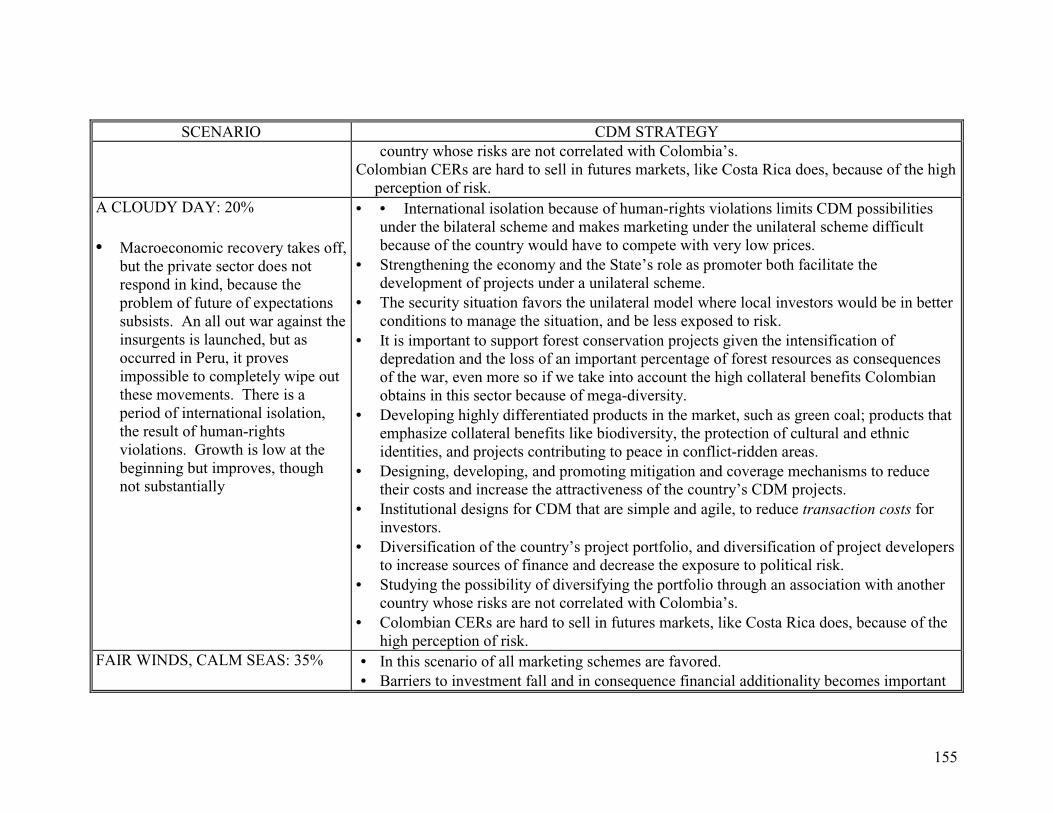
155
SCENARIO CDM STRATEGYcountry whose risks are not correlated with Colombia’s.
Colombian CERs are hard to sell in futures markets, like Costa Rica does, because of the highperception of risk.
A CLOUDY DAY: 20%
• Macroeconomic recovery takes off,but the private sector does notrespond in kind, because theproblem of future of expectationssubsists. An all out war against theinsurgents is launched, but asoccurred in Peru, it provesimpossible to completely wipe outthese movements. There is aperiod of international isolation,the result of human-rightsviolations. Growth is low at thebeginning but improves, thoughnot substantially
• • International isolation because of human-rights violations limits CDM possibilitiesunder the bilateral scheme and makes marketing under the unilateral scheme difficultbecause of the country would have to compete with very low prices.
• Strengthening the economy and the State’s role as promoter both facilitate thedevelopment of projects under a unilateral scheme.
• The security situation favors the unilateral model where local investors would be in betterconditions to manage the situation, and be less exposed to risk.
• It is important to support forest conservation projects given the intensification ofdepredation and the loss of an important percentage of forest resources as consequencesof the war, even more so if we take into account the high collateral benefits Colombianobtains in this sector because of mega-diversity.
• Developing highly differentiated products in the market, such as green coal; products thatemphasize collateral benefits like biodiversity, the protection of cultural and ethnicidentities, and projects contributing to peace in conflict-ridden areas.
• Designing, developing, and promoting mitigation and coverage mechanisms to reducetheir costs and increase the attractiveness of the country’s CDM projects.
• Institutional designs for CDM that are simple and agile, to reduce transaction costs forinvestors.
• Diversification of the country’s project portfolio, and diversification of project developersto increase sources of finance and decrease the exposure to political risk.
• Studying the possibility of diversifying the portfolio through an association with anothercountry whose risks are not correlated with Colombia’s.
• Colombian CERs are hard to sell in futures markets, like Costa Rica does, because of thehigh perception of risk.
FAIR WINDS, CALM SEAS: 35% • In this scenario of all marketing schemes are favored.• Barriers to investment fall and in consequence financial additionality becomes important
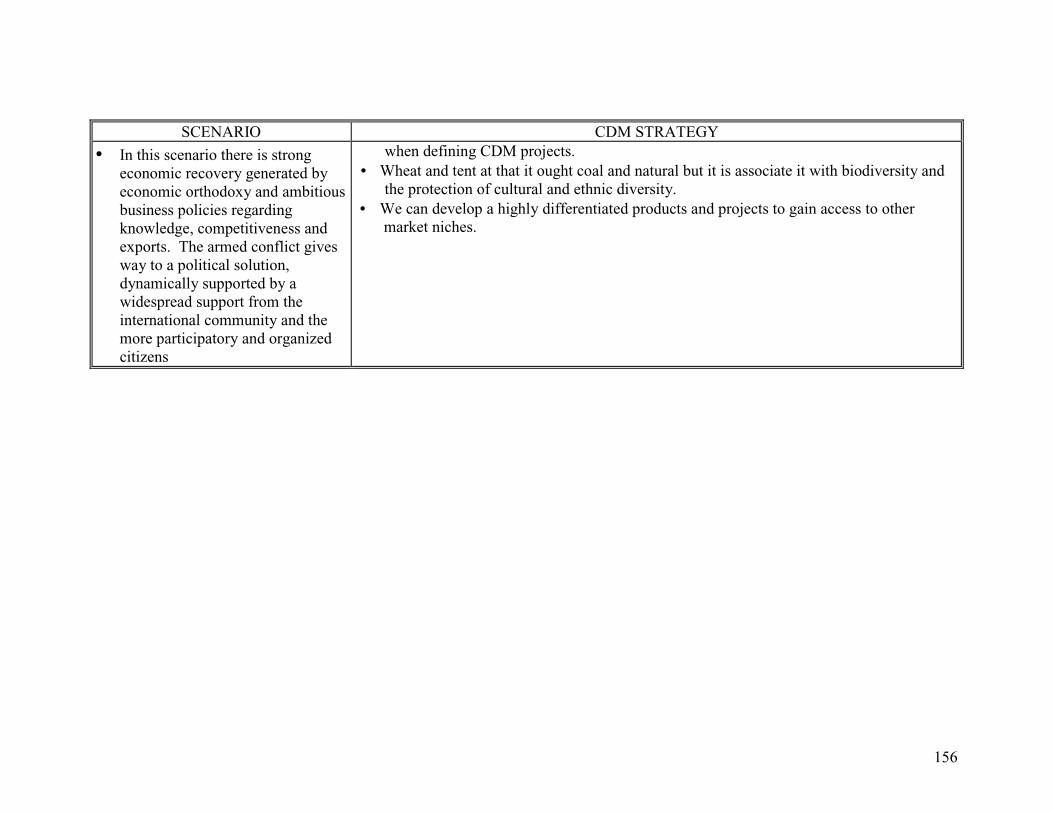
156
SCENARIO CDM STRATEGY
• In this scenario there is strongeconomic recovery generated byeconomic orthodoxy and ambitiousbusiness policies regardingknowledge, competitiveness andexports. The armed conflict givesway to a political solution,dynamically supported by awidespread support from theinternational community and themore participatory and organizedcitizens
when defining CDM projects.• Wheat and tent at that it ought coal and natural but it is associate it with biodiversity andthe protection of cultural and ethnic diversity.
• We can develop a highly differentiated products and projects to gain access to othermarket niches.
157
In assessing risk for a CDM project, patently this factor varies according to sector andtype of project. In general terms, we might say that Colombia is not at a disadvantagecompared to competitors like Mexico, Brazil, Bolivia and Costa Rica as regardstechnological risks. Regarding security and public order risks, at the project levelColombia is markedly at a disadvantage compared to other countries. Finally, regardingthe economic risks for a project, there are no great differences compared to risks thatcould arise in other countries, although the country’s macroeconomic situation could leadto a higher level of risk, especially compared to Costa Rica. In any case, there aremechanisms for mitigation and coverage, which would make it possible to manage riskappropriately, so that the possibilities of developing the project (or investment) wouldincrease and lead to success.
On the other hand, given existing differences in the capacity to manage and assumecertain risks, depending on the investor’s profile, the unilateral model becomes importantfor efficient management of the security and public order risks extant in the country.Local investors and businessmen have discovered models and mechanisms that make itpossible for them to operate under this condition, because they are aware of the situationand the dangers, and have gained experience in the matter. A CDM investor under abilateral trade scheme would, in principle, have more substantial reservations regardinginvestment in a project in Colombia, because of this risk situation.
Frequently, the mitigation and coverage measures we have identified are associated withgood project design, good knowledge of the situation and the circumstances surroundingthe project and affecting it. In this sense, the material offered in this chapter regardingrisk identification can benefit both local and foreign investors, providing an initialanalytical framework which will make it possible to pinpoint situations which couldpotentially be unfavorable for a particular project. It is the investor’s decision, whetheror not to adopt mitigation and coverage measures as he sees fit in light of a cost-benefitanalysis, and according to his situation and his risk-aversion profile. Unfortunately, theadoption of several of these measures increase the project’s cost, but do not necessarilyrule it out; in any case, the cost of risk will affect the marketing of a project under thebilateral or multilateral scheme.
Whatever institution we create to develop the CDM program in the country will play animportant role in risk mitigation and coverage, because certain of these measures are notreadily available to developers or investors individually, and in other cases theintervention of an umbrella organization might reduce the cost of certain measures. Theoffice for CDM will have to work with the national insurance industry to developspecialized policies to meet the particular needs of this type of project (an instance of thisin another sector is the agricultural insurance policy). At the same time, we must designa compensation fund for CERs and mechanisms to make it possible for investors todiversify their sources of CERs (and not concentrate them in a single project) becausethis too is an interesting option for mitigating risks.
Because an investor, depending on his risk profile, will be willing to assume greater risksto the extent that the return expected on investment also increases, the collateral benefits
158
that Colombian projects can offer in different scenarios are of the greatest importance.Thus the country, in particular the Office for CDM, must devise a strategy that will makeit possible to derive the greatest advantage from collateral benefits, and also provideappropriate information on this topic.
On the other hand, an appropriate and strong institution decreases the risk of non-additionality in projects and provides greater confidence to investors in matters related toverification and certification. This will undoubtedly contribute to minimize risk andimprove the marketing strategy for Colombian projects, becoming a guarantor of theproject quality.
In general terms, given the high perceived risk in Colombia and the country’s futurepanorama, there is no doubt that for Colombia it is indispensable to countenance the fullrange of marketing schemes which are presently under discussion: the unilateral model,the bilateral and the multilateral. Equally, it is of highest importance to include forestprojects in CDM. The Colombian project portfolio must be widely diversified, in termsof sectors, geographical areas, types of investors and types of domestic projectdevelopers, so that this diversification can become an important risk reductionmechanism.
5.4. Financing Options for CDM Projects under of theUnilateral Model in Colombia
In the unilateral model for developing CDM projects, financing for the design andimplementation of projects is the responsibility of local investors. In this context, it willbe very important to identify financial possibilities and the limits that may exist whentrying to gain access to these sources.
The country’s present situation, with restricted access to funding sources, either throughcredit or in capital markets, must be emphasized when justifying additionality in projects.In Colombia, economic circumstances, structural distortions and political risk have madesources of finance even more scarce.
5.4.1. General ConsiderationsThe present economic context makes it difficult to obtain financing. On one hand, thefinancial sector has a higher risk perception of its clients than a few years ago, anddespite the provisions on date which the banking superintendent see is the norms havemade mandatory common making the cost of credit drop in the banking sector, there is noclear recovery in terms of the supply of credit. It is also possible that low interest ratesand lower margins of intermediation are the causes of the tight credit.
One way in which the national government could contribute to stimulate banking activityand credit is through constituting guarantees. The classical way to manage risk forfinancial entities is through the constitution of guarantees in the form of mortgages,
159
securities, personal guarantees and funds. The National Fund for Guarantees has beengranting this kind of coverage of financial risk to less favored sectors and to projectshaving a national interest which have encountered difficulties in their developmentbecause of this kind of barrier. CDM projects could classify as projects of nationalinterest, if the country’s financial authorities classify them as such.
The perception of risk in the market regarding this kind of projects is how I, which makesit difficult to use mechanisms like the securitization of projects, which it would make itpossible to to obtain capital in the form of a participation in the project’s profits.According to the principle agents 101 working on this mechanism, the main institutionalinvestors (pension funds) and Colombian small and medium-sized investors, are reluctantto invest money in this type of paper in the market because of high risk perception andsometimes it because of legal restrictions 102
A possible solution to encourage the use of this tool could be the use of securitizationwith a credit content and mixed content (credit plus a share in the the project’s profits), toensure a fixed rent for potential purchasers. With these options, the project must begin togenerate a cash flow in the short run, which could become difficult in forest projects,whereas in projects for technological reconversion profits can be obtained nearlyimmediately. If forest projects are designed to obtain other kinds of rent in the short run,additional to those of CDM, their cash flows would be more adjusted to the requirementsof the securitization model, though it would be necessary to revise their additionalityunder the terms of the Kyoto Protocol.
A very important supply of resources can be found in venture capital funds with anenvironmental orientation. While in Colombia no fund of this nature has beenconstituted, elsewhere Latin America does have funds which are willing to invest inCDM projects in the country. The Colombian Ministry of the Environment is examiningthe possibility of encouraging green market projects 103 (which include the CDM) withventure capital. The constitution of this fund could be made with donations fromcountries interested in the idea, which might appeal to world class NGOs that includebusiness projects in their vision (WRI, CI, etc.) and international investors operating inthe country and interested in improving their institutional image in environmental affairs(oil company’s principally). Foreign investors can also be considered a potential sourceof venture capital, especially if such capital proceeds from countries interested inpurchasing CDM projects.
Different kinds of investors will offer funds, depending on who they are and what theywant. In general, commercial sources of funds work with businessmen, while thegovernment operates through different mechanisms to grant subsidies or low-cost loansto less capitalized agents. Certain special international cooperation programs also financedevelopers of community projects and nonprofit organizations. The information
101 Bolsa Nacional Agropecuaria (the agricultural futures market), Corfinsura, Cornare, etc.102 Mainly, institutional investors like pension funds work under limitations when investing in Variableincome papers.103 The ministry’s green markets program includes CDM projects.
160
regarding financial sources has been divided into: credit, non reimbursable sources andcapital market investment. Equally, we specify the beneficiaries according to the projectbeing funded.
5.4.2. Financial SourcesWe have established three categories to classify possible sources of financing for CDMprojects. These are credit lines, capital market instruments and finally, non-reimbursableresources.
These alternatives provide different possibilities for the formulator when he sets up theproject financially. Generally, the formulators must put up a percentage of totalinvestment and leverage the rest with different financial agent in the most cost-effectivemanner possible.
5.4.2.1. CreditIn credit we find and the typical Lines defined by the market and soft credit which seeksto provide incentives to certain sectors. CDM projects have the possibility of obtainingcredit resources geared to a specific sectors (cement, panela, forests, etc.) and also thosegeared to the environment, because they work in the productive sector and at the sametime favorite the environment (See Table 30).
Principal Lines of credit for CDM ProjectsBANK TYPE OF CREDIT BENEFICIARIES ACTIVITIES CDM
CAN FINANCEExport Import Bank(USA)
Bilateral &commercial
Public and privatesectors. Includesterritorial entities
EnergyIndustry
Eximbank (Japan) Bilateral &commercial
Public and privatesectors. Includesterritorial entities
ForestEnergyIndustry
Export DevelopmentCorporation (Canada)
Bilateral &commercial
Public and privatesectors. Includesterritorial entities
GuaranteesForestEnergyIndustry
Fonade Commercial Public and privatesectors
Pre-investment,several sectors
FEN Commercial Public and privatesectors
Energy
Banco Agrario Commercial Public and privatesectors
Forest
Finagro Commercial Public and privatesectors. Includesterritorial entities
Forest
161
We have not listed commercial banks for this type of project, although they all offercommercial lines in different productive sectors. This is because CDM projects ingeneral do not possess the requisite guaranties to gain access to credit. In interviews withvice-presidents for credit at the principal banks in the country, we found that credit isavailable if the risk associated with projects is covered by a real guarantee. The principaloption is that the National Fund for Guarantees should back an important percentage ofthese projects.
In the medium and long term, we must think about constituting a Guarantee Fund forCDM Projects with income from a percentage of CER exports, national governmentfunds and international cooperation. This fund would allow project formulators to havereal access to commercial credit.
5.4.2.2. Capital MarketsHere we have of the two most feasible options: venture capital and securitization.Activities like those developed in CDM projects are characterized by having high risks,investment horizons set at the medium and long-term and high expected profitability.With conditions like these, traditional financing mechanisms like credit do not meet theneeds of the entrepreneur and often remove the incentive for developing these projects.
In this sense, the financial mechanism embodied in Venture Capital Funds (VCF) makesit possible to support the development of companies interested in these markets. VCFscan offer investment resources to entrepreneurs interested in projects related toenvironmental reconversion, conservation, the sustainable use of biodiversity and theprotection of the environment. These funds, besides investing capital in a company,provide follow-up and also specialized consulting in different administrative areas.
VCFs play an important role in channeling savings and investment toward high-riskprojects that nevertheless have the expectation of high profits. This mechanism makes itpossible to develop companies that otherwise would never exist because of the type ofactivity they engage in and immature markets for their products.
VCFs are different from other financial institutions principally because of the value theyadd to venture companies, and also because they support activities in different areas ofthe company, besides the capital they supply. The percentage of participation incompanies or projects the funds invest in depends on the characteristics of each fund, butparticipation does not exceed 49%. The level of profit is set by the VCF’s directors,depending on the projects they are seeking and the maximum margin of risk they willaccept, and they establish an average percentage of profit per investment year.
At present there are three international venture capital funds that are looking forinvestment alternatives in Sustainable companies in Latin American. These funds haveincluded among their selection criteria that companies or projects should comply with thecriteria of biological and also social sustainability. These funds are Fondo terra Capital,Ecoempresas and Fondo Empresarial para la Reconversion. They have a total of 36million to invest in the region (see Table 31). In other developments, National venture-
162
capital funds are also being organized, some of for productive sectors and others for preestablished geographic regions, with a view to promoting the development of productiveactivities related to the environment.
Information on Venture Capital Funds in Latin AmericaFUND TERRA CAPITAL ECOEMPRESAS--
ECOENTERPTRISESFUND
FONDO EMPRERSARIAL PARALA CONSERVACION
INVEST-MENT
Between $500,000 and$2,25M
Between $50,000 and$800,000(Average $225,000)
Between $25,000 and $250,000
REQUIRE-MENTS
1. Positive impact onbiodiversity
2. Economically viable3. Omply with criteria of
sustainability underIADB, GEF and TCIrules.
1. Positive impact onconserving regionalenvironment.
2. Economic benefits forlocal communities andenvironmentalorganizations
Companies that support ecologicalconservation following the traditionalmodel of Conservation International
SECTORS AgricultureAquatic productionForestsNon-forest, non-woodproductsEcotourismOther activities related tobiodiversity
Positive impact onenvironmental conservationin the regionBeneficial economic resultsfor local communities andenvironmentalorganizations
Ecotourism in rainforests, coastal ormarine areas in tourist areas.Sustainable agriculture: in particularagro-forest producing coffee, cocoa,vanilla and raw materials forfarmaceutical products.Non-wood forest products: canefurniture, nuts, oils, etc.
The second option in capital market instruments is securitization. This is a diifferentinstrument from a venture fund in its perception of risk, because here we use paper ortitles in a productive projects, which it implies solidity and in the project’s cash flow andits owners. This solidity is what makes it possible to obtain good ratings on of this paperin a capital markets. In Colombia, this mechanism has been the developed in theconstruction and infrastructure is sectors, but it is only know beginning it to be appliedand in a forest, and agriculture and livestock sectors.
As its name indicates, securitization implies issuing titles to an autonomous patrimony104,through a special common fund, constituted by the goods and assets ceded by anoriginator through a mercantile trust contract, in order to bring in investors to finance thedevelopment of productive activities.
The mechanism can be developed by any financial agent. It requires project formulators,an interested investor, a financial entity, a trust fund, a risk qualifier for financial paperand an agent for placing the titles in stock markets. These are projects that require highinvestment in time for the financial structuring additional to the design of the CDMproject itself. Normally, this is a less expensive source of financing than bank credit. Insummary, its operation can be observed in Figure 14:
104 The patrimony is the project’s production of goods and services. In the case of CSDM projecrs, theassets are the CERs, as well as the project’s physical goods. In forest projects, this will be the forest itself;in energy projects, the reconverted equipment.
163
Figure 14. Operation of Securitization
TRUST:AUTONOMOUSPATRIMONY
Assets+Cash Flow
ISSUANCE OFTITLES
Brokers, CollectorsAdministrators
Investor
Resources:CreditParticipatoryMixed
This scheme is a simplified version given the number of agents that projects of this naturerequire, but in essence we have here the constitution of an autonomous patrimony for aproject, subsequently placed in the market through titles.
For the CDM, there is great potential in forest and energy projects, if we manage toreduce the perception of risk the projects now carry. As previously mentioned,purchasers are more attracted to titles which have a credit content; however, this isespecially complicated in forest projects because of the delay between investment andpotential profit. We must insist on the formulation of projects that are capable not onlyof generating CERs but also other goods and services that add value to the cash flow, aslong as these do not violate the additionality requirements established in the KyotoProtocol.
5.4.2.3. Non-Reimbursable ResourcesAt present, the most viable places to find this type of resource are the Initiative of theAmericas and Plante (the Colombian Government’s drug-crop substitution program).However, we do not rule out to the possibility of obtaining international cooperationresources distinct from Official Assistance for Development (limited in terms of financialadditionality).
These financial sources are geared toward non-profit entities and communities workingon environmental improvement and conservation. The Initiative for the Americas has acredit line for marketing environmental goods and services, among which GHG capture
164
and reduction105 projects are included. The Plante is more directed to the community inits crop substitution projects, both in forests and agro-forestry. These projects can bevery attractive for countries interested in social and environmental investment.
5.4.3. ConclusionsIn general, the Colombian market is not very open to financing projects with CDMcharacteristics. This coincides with the limitation in available sources of financing in themidst of the structural economic crisis Colombia is now enduring; faced with thissituation, the financial sector has responded with very tight credit.
This can favor additionality, because for projects that are still profitable financially, thereare no traditional sources of financing, a result of the perception of high risk associated toCDM business and the lack of financial resources in the market, too. In any case, projectformulators must clearly define their financial requirements and the possible sourcesthereof, because the unilateral scheme limits initial investment to whatever resources theformulators may obtain.
From the point of view of credit, there are some financial possibilities applicable toCDM, because they are directed to sectoral productive projects that have for some timehad access to specific lines and government support, as is the case with Bancoldex, IFIand FEN.
In capital markets, the most viable option is venture capital, and because of this theMinistry of the Environment is studying the possibility of setting up a fund of this typefor Colombia. Venture capital is a source that may become available for any type ofproject formulators.
Among non-reimbursable sources, those with the greatest possibility are those from theInitiative of the Americas and Plante, specifically for community projects and NGOs.
The final recommendation, bearing in mind the present difficulty in gaining access tofinancial resources, is to look for credit lines that multilateral organizations could offerfor CDM project development.
5.5. Design of CDM institutionsTo obtain the maximum possible benefit from using the CDM, Colombia must positionitself in the market with very high-quality projects, especially taking into account that ininternational markets, the country has a high level of perceived risk. In CDM terms,quality is established by having well formulated projects that comply entirely with theadditionality criterion established in the Kyoto Protocol, and that can also show greatcollateral benefits. To make sure of the high quality of Colombian projects is one of the
105 While not all the resources of the Initiative of the Americas are earmarked for CDM, the total amountavailable is $42M.
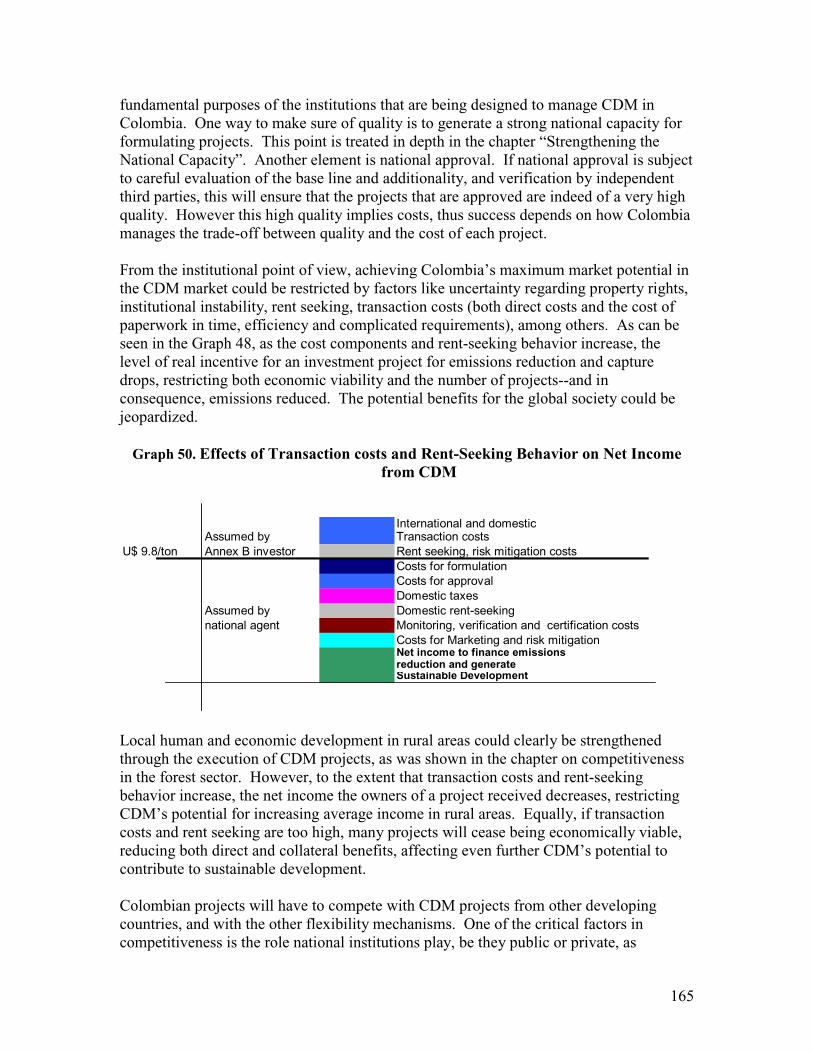
165
fundamental purposes of the institutions that are being designed to manage CDM inColombia. One way to make sure of quality is to generate a strong national capacity forformulating projects. This point is treated in depth in the chapter “Strengthening theNational Capacity”. Another element is national approval. If national approval is subjectto careful evaluation of the base line and additionality, and verification by independentthird parties, this will ensure that the projects that are approved are indeed of a very highquality. However this high quality implies costs, thus success depends on how Colombiamanages the trade-off between quality and the cost of each project.
From the institutional point of view, achieving Colombia’s maximum market potential inthe CDM market could be restricted by factors like uncertainty regarding property rights,institutional instability, rent seeking, transaction costs (both direct costs and the cost ofpaperwork in time, efficiency and complicated requirements), among others. As can beseen in the Graph 48, as the cost components and rent-seeking behavior increase, thelevel of real incentive for an investment project for emissions reduction and capturedrops, restricting both economic viability and the number of projects--and inconsequence, emissions reduced. The potential benefits for the global society could bejeopardized.
Graph 50. Effects of Transaction costs and Rent-Seeking Behavior on Net Incomefrom CDM
International and domesticAssumed by Transaction costs
U$ 9.8/ton Annex B investor Rent seeking, risk mitigation costsCosts for formulationCosts for approvalDomestic taxes
Assumed by Domestic rent-seekingnational agent Monitoring, verification and certification costs
Costs for Marketing and risk mitigationNet income to finance emissionsreduction and generateSustainable Development
Local human and economic development in rural areas could clearly be strengthenedthrough the execution of CDM projects, as was shown in the chapter on competitivenessin the forest sector. However, to the extent that transaction costs and rent-seekingbehavior increase, the net income the owners of a project received decreases, restrictingCDM’s potential for increasing average income in rural areas. Equally, if transactioncosts and rent seeking are too high, many projects will cease being economically viable,reducing both direct and collateral benefits, affecting even further CDM’s potential tocontribute to sustainable development.
Colombian projects will have to compete with CDM projects from other developingcountries, and with the other flexibility mechanisms. One of the critical factors incompetitiveness is the role national institutions play, be they public or private, as
166
facilitators for Colombia’s successful participation in the nascent carbon market. On theone hand, these institutions must promote very high-quality projects and broadparticipation in the generation of projects. On the other hand, their own design andoperation must be very careful with regard to transaction costs and the handling ofproperty rights.
5.5.1. Rent SeekingRent seeking is the pressure that economic or political agents exercise on decision-making processes with a view to capturing the greatest possible benefits for their ownprojects, without taking into account the maximization of net benefits for the society atlarge. This behavior leads to the inefficient allocation of resources by sidetrackingresources toward the agents with the greatest capacity to exert pressure on politicaldecisions. A common practice in developing countries, rent seeking in institutions couldbecome an even greater problem than transaction costs. High rent expropriations (fordiverse reasons) will decrease the flow of resources to emissions reduction projects, tothe point of making certain CDM projects quite unattractive for investors, communitiesor businessmen.
The problem of rent seeking in the CDM stems from uncertainty regarding the propertyrights associated with CERs. In the CDM model, economic actors from developingcountries generate positive externalities through the service of reducing GHG emissions;the service’s value is then recognized by Annex B emitters. Thus, the economic actorsreceive payment for benefits generated in benefit of the global society. If the investorswho generate positive externalities are the owners of the property rights embodied inCERs, and of the associated values, they can successfully defend their interests againstthe rent seeking that is commonplace, especially when there are changes inadministrations.
To the contrary, if the state does not clearly establish property rights, institutions andeconomic or political groups could extract large numbers of the CERs generated (or theirmonetary value), with arguments that sound full of merit but only end up weakeningCDM. To the extent that the portion extracted in this manner increases, the portioncorresponding to CDM investors decreases proportionally. At this point, return oninvestment drops and many projects at the margin cease being economically feasible. Inthis scenario, a smaller number of projects would be executed, limiting the possibility ofsustainable development. The cost per reduced ton would increase, displacing the supplycurve and increasing compliance costs for Annex B countries.
Depending on how strong rent seeking and the distortions it imposes it become, theimpact could be devastating for the CDM, inefficiently allocating resources proceedingfrom the Annex B, decreasing incentives for investors to implement projects andreducing the total amount of captured and reduced GHG. Equally, rent seeking is a forcethat could significantly affect the competitiveness of any country’s projects. If investorsperceive that a government appropriates a large percentage of CERs, they will seek outanother country where they will be guaranteed the use of the CERs generated by their
167
investment to comply with their commitments, because they enjoy recognition of theirproperty right over Certificates.
5.5.2. Transaction costsThe design of national institutions faces of two great challenges: on the one hand,transaction costs and must be minimized; and on the other, we must make sure thatColombian projects : (I) comply with a the criteria of the framework convention onclimate change and the Kyoto Protocol, especially additionality, and (ii) have sufficientlyhigh quality to be competitive in international markets and and generates substantialgoodwill of for the Colombian program, based on its high-quality.
The CDM is an international mechanism and the loss it must meet the requirements of toinstitutional levels: international and domestic. If of the criteria and institutions that amolecule late CDM internationally generate high transaction costs, there will be a lessTransactions than one might desire of, compromising the global community is capacity toobtain the GHG reductions in cost effectively and mobilize resources toward developingcountries with low marginal reduction costs. Equally, if domestic transaction costs arevery onerous, these will necessarily be reflected in the sale price of a final product,compromising the countries capacity to participate in the market. Thus, if transactioncosts at both levels are not to minimize, it is highly probable bid they should that theybecome so high that they reduce or even eliminate the comparative advantage to derivefrom having lower costs per reduced or captured ton, as is presently the case withdeveloping countries.
The framework Convention for Climate Change and the Kyoto Protocol establish a seriesof criteria for participating in the CDM, because of base it is necessary to guarantee thatprojects should fully meet these criteria, not only to take full Advantage of the potentialbenefits of the Mechanism Offers, but also to generate confidence and credibility withregard to Colombian projects in the international market. Critical topics include it theestablishment of a reliable baseline, clear property rights and the use of correctedmethodologies in project design. Even so the insistence on the high quality of projectscould imply transaction costs that are in certain cases it to hide. In consequence,Colombian regulations must be cautious when managing the trade off between higherquality and higher transaction costs.
The experience with programs for emissions trading based on projects demonstrates thattransaction costs are a Determining element in the economic efficiency andenvironmental effectiveness of these rights.
The U.S. President’s Economic Report to the Congress, in the section “Cost effectivenessof the Flexibility Mechanisms of the Kyoto Protocol” states: “An international emissionstrading rights system will not require a case-by-case review of each exchange; however,the CDM and Joint Implementation could require such review, and CDM projects willalso require independent certification. Furthermore, taxes for Administration andAdaptation will exert even more upward pressure on the costs of participating in CDM
168
projects. Reviews and taxes associated with the individual project approach could besimilar to those pertaining to the initial emissions trading rights programs …thatexperienced less activity than expected with less excess in bureaucratic revisions .”106
• The United States General Accounting Office (1982)107 evaluated regional programsfor compensating emissions in Los Angeles and San Francisco, and found that themost important obstacles to Implementing and developing markets for compensationsworth of the transaction costs it derived from the approval process and the cost oflocating and negotiating emissions rights.
• Hahn and Hester, cited by Stavins108 suggest that the Fox River program fornegotiable rights failed because of the enormous transaction costs derived fromadministrative requirements that eliminated the exchange’s potential profits.
• Research done for the offsets market and in Los Angeles by Hahn and Foster(1995)109, where they analyze Transactions from 1985 to 1992 and the effect oftransaction costs, concludes that in many cases the magnitude of transaction costs itexceeds the market value of the emissions reduction credits.
Each of the three Flexibility Mechanisms established by the Kyoto Protocol110 incurs intransaction costs when being executed. However, we are concerned that it precisely themechanism in which developing countries participate was conceived it with a muchhigher cost charge, compared it to those mechanisms in which industrialized countriesparticipate111. This year’s a technical meetings are preparing the design of themechanisms that will be approved at COP VI.
During the meetings of the CMCC in Bonn in April and June 1999, and at COP 5 inOctober 1999, we noted a clear trend toward imposing on CDM numerous requirements,and demands for a very precise information, while the requirements and transaction costsassociated to Joint Implementation and Emissions Trading were being minimized. Inaddition, there exist a series of risks that translate into additional transaction costs forprojects, through direct expenses for mitigation or because execution may involve delayand uncertainty.
Clearly, these items could place the CDM aimed at a clear a disadvantage compared toother compliance options of Annex . The Table 32 compares of risks of barriers and
106 Economic Report of the President Transmitted to the Congress. U.S. Government Printing office:February 2000.107 ”A Market Approach to Air Pollution Control Could reduce Compliance Sosts Without JeopardizingClean Air Goals”, USGAO: March 1982.108 Transaction costs and Negotiable Permits, Journal of Environmental Economics and Management, Vol.29. 1995.109 Designing More Efficient Markets, Journal of Law and Economics, Vol. 38, April 1995.110 Clean Development Mechanism (CDM), Joint Implementation (JI) among Annex b countries andInternational Emissions Trading (IET) among Annex B countries.. CDM is the only mechanism thatpermits investment in GHG reduction between industrialized countries and developing countries.111 See Chapter 6 (negotiating position and CDM design).
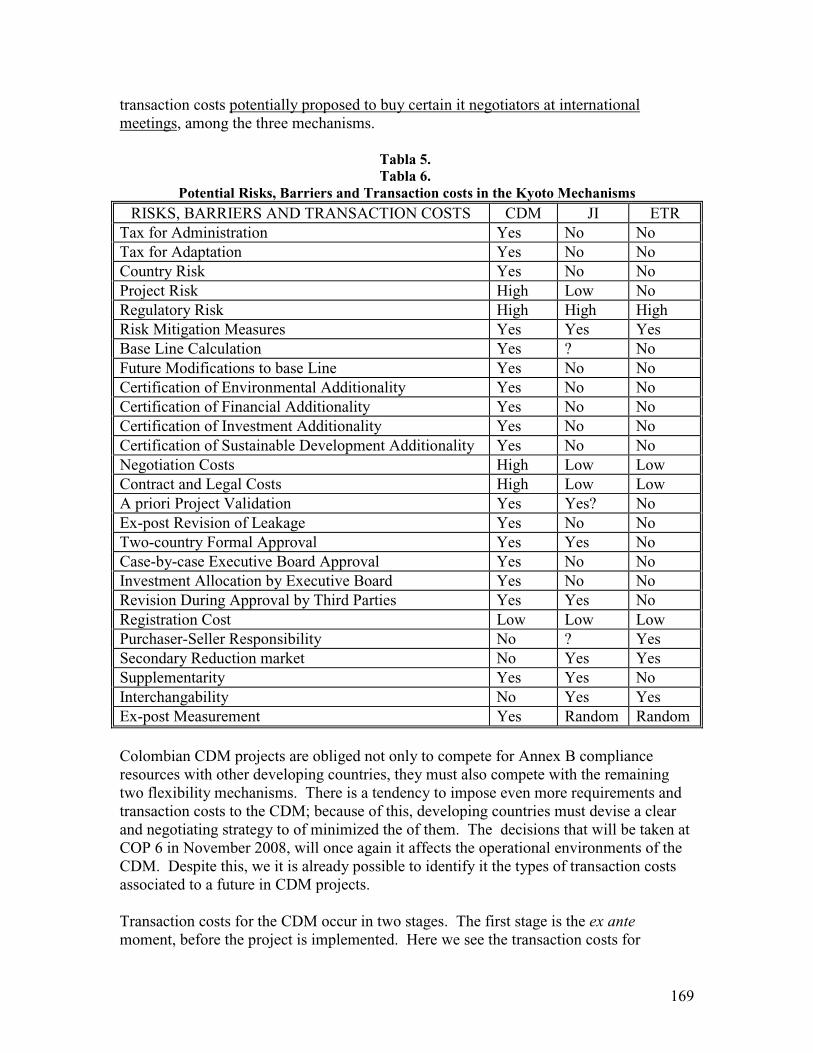
169
transaction costs potentially proposed to buy certain it negotiators at internationalmeetings, among the three mechanisms.
Tabla 5.Tabla 6.
Potential Risks, Barriers and Transaction costs in the Kyoto MechanismsRISKS, BARRIERS AND TRANSACTION COSTS CDM JI ETRTax for Administration Yes No NoTax for Adaptation Yes No NoCountry Risk Yes No NoProject Risk High Low NoRegulatory Risk High High HighRisk Mitigation Measures Yes Yes YesBase Line Calculation Yes ? NoFuture Modifications to base Line Yes No NoCertification of Environmental Additionality Yes No NoCertification of Financial Additionality Yes No NoCertification of Investment Additionality Yes No NoCertification of Sustainable Development Additionality Yes No NoNegotiation Costs High Low LowContract and Legal Costs High Low LowA priori Project Validation Yes Yes? NoEx-post Revision of Leakage Yes No NoTwo-country Formal Approval Yes Yes NoCase-by-case Executive Board Approval Yes No NoInvestment Allocation by Executive Board Yes No NoRevision During Approval by Third Parties Yes Yes NoRegistration Cost Low Low LowPurchaser-Seller Responsibility No ? YesSecondary Reduction market No Yes YesSupplementarity Yes Yes NoInterchangability No Yes YesEx-post Measurement Yes Random Random
Colombian CDM projects are obliged not only to compete for Annex B complianceresources with other developing countries, they must also compete with the remainingtwo flexibility mechanisms. There is a tendency to impose even more requirements andtransaction costs to the CDM; because of this, developing countries must devise a clearand negotiating strategy to of minimized the of them. The decisions that will be taken atCOP 6 in November 2008, will once again it affects the operational environments of theCDM. Despite this, we it is already possible to identify it the types of transaction costsassociated to a future in CDM projects.
Transaction costs for the CDM occur in two stages. The first stage is the ex antemoment, before the project is implemented. Here we see the transaction costs for
170
preparing the project, most of which are incurred in the project’s country of origin.Precisely at this stage, each country can minimize transaction costs for its projects. Theefficiency and transparency of the institutions created in the country will be determinantfor the program’s success and the maximization of its benefits. This can become a keythe competition among countries that offer CDM projects. If Colombia creates complex,bureaucratic and inefficient institutions, Annex B investors will execute their CDMprojects in other countries, where they can obtain approval at minimal transaction costs,delay and requirements; or they will use the remaining two flexibility mechanisms toreduce their cost for compliance. If we also take into account Colombia’a proficle as ahigh-risk country, it is of fundamental importance to design a solid, transparent andefficient entity.
The main costs of the ex ante stage are:• Cost of identifying the project• Cost of formulation• Cost of Approval• Cost of internalization and training• Cost of insurance and risk mitigation• Cost of validation
The second stage of transaction costs occurs during the project’s implementation. Theseare the transaction costs all projects must incur during implementation to be able tocomply with standards and procedures established for the operation of CDM.
The main costs of the implementation stage are:• Cost of monitoring• Cost of verification• Cost of Certification• Cost of marketing• Cost of searching (bilateral model)• Cost of negotiation (bilateral model)
The transaction costs that occur during the project’s implementation stage depend for themost part on the decisions the set of countries ratifying the Convention take regarding thedesign of the CDM. Colombia can influence the international negotiations to minimizeinsofar as possible these costs, without endangering the integrity or the credibility of thesystem112. Even so, a country individually can do little to affect costs that are the productof the CDM’s international operation once the Mechanism is regulated. In theColombian case, the effort to identify transaction costs that can be minimized to boostcompetitiveness must concentrate on the ex ante costs and those for marketing, becausethese will to a great degree be defined by the institution designed in Colombia as thefacilitating entity for the country’s participation in the international carbon market.
112 See Chapter 6 (negotiating position) for a discussion of international negotiating strategies.
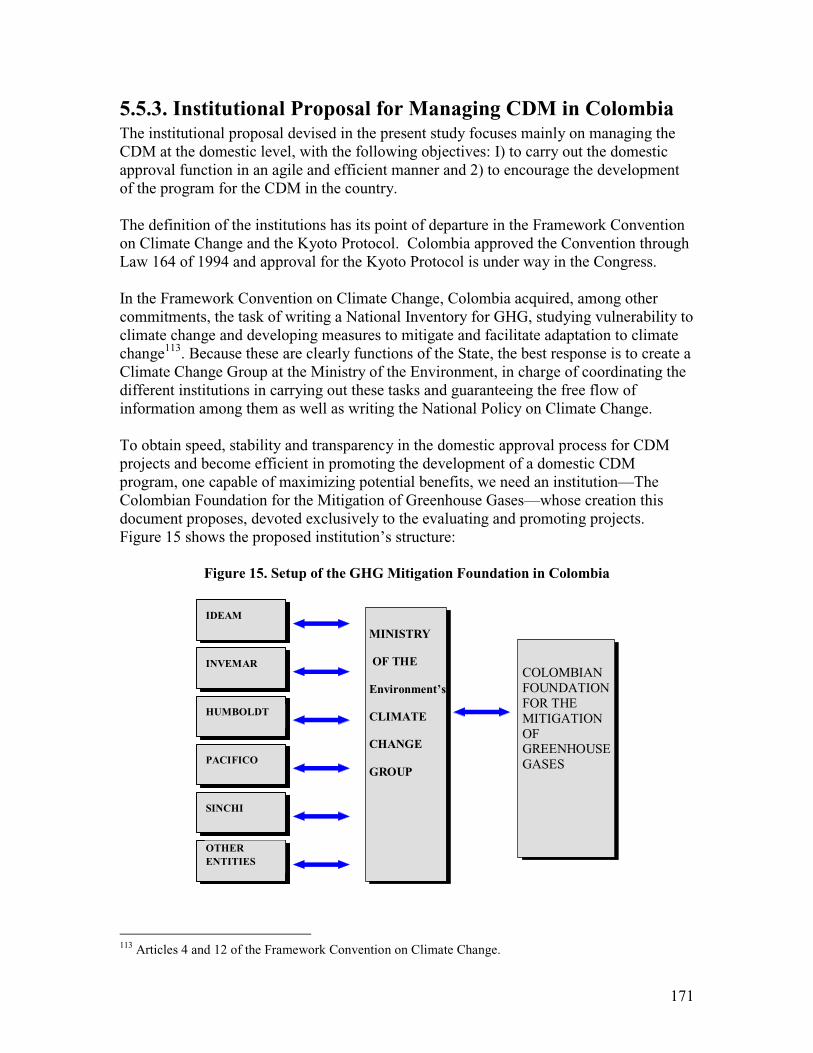
171
5.5.3. Institutional Proposal for Managing CDM in ColombiaThe institutional proposal devised in the present study focuses mainly on managing theCDM at the domestic level, with the following objectives: I) to carry out the domesticapproval function in an agile and efficient manner and 2) to encourage the developmentof the program for the CDM in the country.
The definition of the institutions has its point of departure in the Framework Conventionon Climate Change and the Kyoto Protocol. Colombia approved the Convention throughLaw 164 of 1994 and approval for the Kyoto Protocol is under way in the Congress.
In the Framework Convention on Climate Change, Colombia acquired, among othercommitments, the task of writing a National Inventory for GHG, studying vulnerability toclimate change and developing measures to mitigate and facilitate adaptation to climatechange113. Because these are clearly functions of the State, the best response is to create aClimate Change Group at the Ministry of the Environment, in charge of coordinating thedifferent institutions in carrying out these tasks and guaranteeing the free flow ofinformation among them as well as writing the National Policy on Climate Change.
To obtain speed, stability and transparency in the domestic approval process for CDMprojects and become efficient in promoting the development of a domestic CDMprogram, one capable of maximizing potential benefits, we need an institution—TheColombian Foundation for the Mitigation of Greenhouse Gases—whose creation thisdocument proposes, devoted exclusively to the evaluating and promoting projects.Figure 15 shows the proposed institution’s structure:
Figure 15. Setup of the GHGMitigation Foundation in Colombia
IDEAM
INVEMAR
HUMBOLDT
PACIFICO
SINCHI
OTHERENTITIES
MINISTRY
OF THE
Environment’s
CLIMATE
CHANGE
GROUP
COLOMBIANFOUNDATIONFOR THEMITIGATIONOFGREENHOUSEGASES
113 Articles 4 and 12 of the Framework Convention on Climate Change.
172
At present, Colombia is experiencing a severe process of fiscal adjustment, the result,among other factors, of commitments undertaken with the IMF. Because of this, creatingthe Climate Change Group in the short or even medium terms cannot imply hiring furtherfull-time personnel. The proposal for the group is to assign its functions partially todifferent officials at the Ministry of the Environment who work in related areas, and usesubcontractors for additional suport. The specific objectives, costs and potential fundingsources for this stage are presented in detail in the following chapter on Next Steps toTake for Implementing the Strategy.
5.5.3.1. Colombian Foundation for the Mitigation of Greenhouse GasesThe Colombian Foundation for the Mitigation of Greenhouse Gases will be created as theorganization to evaluate and promote CDM projects. It is necessary to take into accountthat this proposal is based on probable scenarios for regulating the mechanism, still to bedefined by the Conference of the Parties, and because of this whatever we do must besufficiently flexible to include these regulations when they are approved. In addition, ifthe entity we create begins operating before the regulations are approved and theManaging Board appoints Operational Entities, it must establish criteria, methodologies,validation and verification procedures, entities that can validate and verify, etc., to beused until such time when the regulations are published. The foundation’s institutionaldesign takes into account the following principles:
Efficiency: The approval process for projects must minimize transaction costs and be asagile as possible, with the obligation of ensuring high-quality projects. To apply thisprinciple, the foundation must develop clear approval criteria, that are pre-established andquantifiable, simple and with fixed approval times and with the participation of projectformulators and the appropriate professional capacity to evaluate and approve projects.Equally, to minimize transaction costs, the institution must have sufficient flexibility tocoordinate training and project marketing functions with specialized outfits, and promotethe participation of other specialized entities to maximize efficiency in generating andpromoting projects.
Transparency: Guaranteeing clear and consistent rules and minimizing rent seeking is offundamental importance. We must clearly establish the property rights of CERs,identifying the owners of the project and applying clear approval criteria that are pre-established and quantifiable, based on technical and not arbitrary reasoning, approvedwith the participation of the relevant sectors, with the oversight of auditors and theinterested sectors, with an agreement regarding procedures with the interested sectors;this implies having simple procedures with fixed time frames and publishing the criteria,procedures and projects that are approved.
Stability: It is necessary to reduce regulatory uncertainty and the process’s vulnerabilityto changes of administration. In CDM projects typically develop in the long term, thusstability in the rules affecting projects is indispensable to promote the projects in themarket and maintain the confidence of foreign investors in Colombian projects. In thissense, it is very important to guarantee stability in the criteria and evaluation procedures
173
in the long run, also maintaining the private sector’s participation and that of projectformulators in strategic decisions, creating a non-profit mixed or private institution (withthe participation of both public and private sectors) to minimize vulnerability to changesin the administration.
Participation: Interested sectors, both public and private, must participate in defining therules of the game and making decisions, to ensure the greatest possible benefits for thecountry’s sustainable development, minimizing the spaces for rent-seeking behavior andpreventing excessive barriers and requirements that increase transaction costs.
Quality of Projects: Colombia must become positioned in the international market as acountry offering very high-quality projects; for this, the commitment will be to produceprojects where a) reductions and capture are really additional to what would haveoccurred in the absence of the CDM; b) projects document collateral environmental andsocial benefits from reducing emissions and, c) projects comply with the criteria andmethodologies established internationally for the CDM.
Nature: We propose the foundation’s creation based on Article 96, Law 489 of 1998,which makes it possible for a public entity in association with others, including privateentities, to create a new non-profit entity to carry out its functions with greater efficiency.This new entity will operate under private law.
Mission: To maximize benefits for the country from the best use of the CDM through anagile efficient and transparent evaluation process and the promotion of high-quality CDMprojects.
Vision: To position Colombia among the first five countries of the region in theinternational market for CDM projects and CERs.
The principal functions of among the Colombian Foundation for the Mitigation ofgreenhouse Gases are:• Evaluation and approval of projects• Training for all interested sectors• Opening access to relevant mechanisms and sources of information, to help formulatehigh-quality projects
• Coordinate a marketing strategy with organizations specialized in foreign trade.
Managing Board:The Managing Board, which will have between five and seven members, shouldrepresent the government, the private sector and a representative from NGOs. Given thatthe objective is to maximize benefits for the country from using the CDM, this groupmust have the capacity to integrate environmental issues regarding the reduction, captureand prevention of GHG emissions with an understanding of international markets andforeign investment. In addition, the board must have the capacity to make agile andtransparent decisions.
174
Taking into account the foundation’s mission, vision and functions, the producers’associations and NGOs will choose their own representatives. The public sector will berepresented by the Minister of the Environment, who will preside, and the Ministry ofForeign Trade. Having representation from the public sector implies that this entityenjoys full support from the national government in implementing its functions. Thanksto the Managing Board’s multiple and diverse nature, every entity represented willprovide capital or make contributions in kind, to guarantee its capacity and operation.
Personnel:There will be an executive director, a forest technician, a technician in energy andtransportation and an administrator, to begin with a small organization not generatingvery high costs, but without restricting future growth in response to growing demand. Itis of fundamental importance to make sure of this organization’s capacity to contractexternal support or seeking support in existing networks or institutions like the ParksSystem, the National Center for Cleaner Production and the Ministry of Foreign Trade,among others. It is also possible to take advantage of regional organizations in theagricultural sector that could disseminates information on the CDM and provide training.
This proposal is the result of analyzing functions, studying institutions and applying theprinciples of efficiency, transparency, stability, participation and the need for high-quality projects. Legal matters must be further looked into and the initial agreementreached by the Consulting Committee (for this study) at meetings on December 17, 1999and January 17, 2000 must be developed.
The following chapter provides details on the activities foreseen for this institution’s firsttwo years, underlining one specific objective: strengthening its institutional capacity. Forthis, we require financial sustainability to permit the institution to support itself in themedium and long terms with no excessive increase in the transaction costs of projects. Inthe short run and while the market becomes consolidated, financial support from thegovernment and bilateral and multilateral institutions is basic to create, organize andconsolidate the institution, as the following chapter notes.
5.6. Conclusions and Recommendations1. To make sure of high-quality projects. To obtain the maximum possible benefit fromusing the CDM, Colombia must position itself in the market with high-qualityprojects, especially because the country carries the perception of having a high levelof risk in international markets. In CDM terms, quality is manifested with wellformulated projects that comply fully with the criterion of additionality established inthe Kyoto Protocol and which can show great collateral benefits. Making sure of thehigh-quality of Colombian projects is one of the fundamental purposes of theinstitutions designed to manage the CDM in Colombia. One element ensure qualitystems from generating a strong national capacity to formulate projects. Anotherelement is national approval. If national approval is subject to the application ofcareful evaluations of the baseline and additionality, and even verification on the partof independent third-parties, that ensures that the projects which are approved are
175
truly of very high quality. However this high quality implies costs, thus successdepends on how Colombia manages this trade-off between quality and costs inprojects.
2. Rent seeking and transaction costs determine in great measure the efficiency andefficacy of CDM. The analysis of rent seeking and transaction costs demonstratesthat if property rights regarding CERs do not clearly define the owner of the project,and if transaction costs are not minimized, the potential of CDM to producereductions in GHG concentrations--and also as an option for sustainabledevelopment--will be seriously compromised because they reduce net income for theproject’s owner.
3. Colombian projects must compete with projects it from other developing countriesand with the remaining Flexibility Mechanisms, and a critical factor incompetitiveness is to the role of national institutions, either public or private, as afacilitators of Colombia’s successful participation in the nascent Carbon market; theUS their design and operation must be very careful with transaction costs andproperty rights.
4. The search for rents can produce considerable negative impact on the Mechanism;depending on how strong rent seeking and the distortions it imposes are, impacts onCDM it can be devastating, distorting the efficient allocation of resources forreduction, decreasing incentives for investors to undertake projects and reducing theamount of GHG captured and reduced.
5. Rent seeking is an element which can significantly affect the competitiveness of acountry’s projects. If investors perceive that a government appropriates a largepercentage of CERs, they will seek out another country that guarantees that they canuse the CERs generated for investment to comply with their own commitments,because their property right over the certificates is recognized.
6. The efficiency and efficacy of CDM could hinge on property rights. Clearly,property rights and the value associated to CERs must belong to the actors thatdesign, invest and operate the project for reducing or capturing emissions.
7. Experience with tradable emissions permits programs based on projects shows thattransaction costs are a determining element in the economic efficiency andenvironmental effectiveness of projects; thus the design of institutions, both at thenational and international levels, must be especially careful to minimize potentialtransaction costs.
8. Developing a national strategy to minimize international transaction costs. ColombianCDM projects must compete with other developing countries not only for thecompliance resources of Annex B, they must also do so with the remaining twoflexibility mechanisms. There is a worrisome trend toward impose more
176
requirements and transaction costs on CDM, and in response developing countriesshould develop a clear negotiation strategy to minimize them.
9. The unilateral model can reduce transaction costs. There are many risks and costs,like those of negotiation, the search for partners, price uncertainty and country riskmitigation--as well as project risks and costs--that are all much lower under thebilateral scheme.
10. Minimizing ex ante transaction costs. These are costs incurred during the preparationof the project, for the most part inside the project’s country of origin. In consequence,the efficiency and transparency of the institutions created in the country will bedeterminant for the program’s success and the maximizing its benefits. This canbecome a principal element in competition among all countries offering CDMprojects. If Colombia sets up complex, bureaucratic and inefficient institutions,Annex B investors will place their CDM projects in other countries where they canobtain approval at minimal transaction costs, delays and requirements; or they willuse the remaining two flexibility mechanisms to reduce their compliance costs.Taking into account the high country risk profile Colombia carries, too, it isfundamentally important to design a solid, transparent and efficient institution.
11. In the Colombian case, the effort to identify transaction costs that can indeed beminimized to improve competitiveness must concentrate on ex ante costs and thosefor marketing, because these will for the most part be defined by the institutiondesigned in Colombia as the facilitating entity for the country’s participation in theinternational carbon market.
12. We should adopt the institutional proposal explained above because it is based oncareful analysis of transaction costs, functions, the cycle of CDM projects and theeffort to generate high-quality projects. The next steps in this implementation are 1)to create a practical legal framework and 2) to conclude the agreement.
13. It is fundamental that Colombia should not lose sight of the final objective of CDM:to maximize benefits for the country derived from participating in the internationalcarbon market.
177
6.Next Steps: Action Plan to Implement CDM inColombia
Based on the results of this Strategy Study, we identified the need to formulate an action plan toprovide continuity to the process of implementing CDM in the country. Below we present thestrategies to follow, based on the conclusions of the present study. All activities (and costs) setforth in this Implementation Program are additional and complementary to the NationalStrategy Study (NSS).
6.1. Objective
To implement the strategy to make the best possible use of the Clean Development Mechanism-CDM, maximizing for the country the benefits and opportunities applying this mechanismrepresents.
6.2. Structure of the Program and Components
The National Strategy for best use of CDM seeks to maximize the benefits for the country ofthis mechanism. These benefits will only become true if Colombia begins to participate andfinds the right position, with a dynamic very high-quality project portfolio in compliance withall the internationally established criteria and methodologies, and if on the other hand anefficient world market for carbon develops.
There are a series of barriers and limitations to achieving the Colombian potential. TheNational Strategy identified these limitations and now proposes actions to minimize oreliminate them.
The main limitations are: in the international ambit, a number of factors will affect Colombia’smodel and level of participation. Negotiations at the coming Conferences of the Parties (COP)and the Climate Change Convention (CCC) during the next three years, will established thedesign and mode of operation of CDM, and there are proposals under discussion which mightseverely affect the potential of developing countries, especially Colombia’s.
In the National ambit, there are several factors which could restrict the development of CDMand the potential benefits to be gained from it, including :
• Risk: the risks of investing and operating in Colombia high which places Colombia whencompared to other alternatives for CDM investment such as Costa Rica, Chile and Brazil,which compete for the same resources.
178
• Information: there is a generalized lack of information within the country regarding theCDM, the market and the rules of project formulation and commercialization. For themajority of communities, firms and individuals that could benefit from it, the CDM islargely unknown. Prospective project sponsors cannot formulate project without knowledgeof complex issues such as baselines and additionality, nor can they negotiate equitableparticipation in projects without information on related market dynamics or the expectedrange of future prices for CERs.
• Finance: Project development will be constrained by the lack of finance to supportprefeasibility and feasibility studies. Even if the unilateral model of project formulation isaccepted by COP6 to promote CDM activities in high-risk nations, Colombian projectdevelopers will be highly constrained by lack of capital available in local financial markets.
• Institutional Factors: In similar project-based emissions offset programs in other countries,official institutions have frequently imposed complex approval processes and hightransaction costs that limit returns and discourage investor participation. Bureaucraticinefficiency in the operation of national bureaucracies would further debilitate Colombia’scompetitiveness and net gains from the CDM. In order to maximize the potential benefitsfor the country, Colombia requires a stable, efficient, transparent and agile institutionalmechanism that minimizes risk and transaction costs.
The program is designed for three years and is divided into the following components, each ofwhich seeks to implement the strategies defined in the present study, to overcome the identifiedbarriers and limitations we have identified, that limit achieving the country’s potential in theCDM (see Figure 13).
1. To strengthen the country’s negotiating capacity in the different aspects of theConvention on Climate Change.
2. To strengthen the National Capacity to develop CDM projects and obtain appropriateadvantages from the benefits this mechanism represents for the country.
3. To support the CDM projects portfolio in Colombia in matters pertaining to funding,marketing and negotiation.
4. To create and operate a Venture Capital Fund with the objective of having a financialinstrument operating in Colombia to finance its own dynamic project portfolio.
5. To create and consolidate our institutional capacity to manage CD in Colombia, with aview to constituting and operating the institution for CDM in Colombia; and alsoconsolidate and ensure the institution’s continuity.
179
Components 2 and 3 are considered separately for a one-year period; from the second year theywill be managed by the institution operating CDM in Colombia, and thus will become part ofthe institution’s objectives and activities. It is important to note that while the institution isbeing constituted and becomes operational, these components cannot be set aside, which is whythey are noted separately, to be developed simultaneously with the creation of the institutionduring the first year and until it becomes operational.
Components 1 and 4 are considered for a three-year period separately, because their dimensionand objectives go beyond the scope of the objectives and competency of the above-mentionedinstitution.
In this order of ideas, the program contains the two phases: the first will developsimultaneously, during the first year, the five components, and from the second year theprogram will have three components: to strengthen negotiating capacity, set up the venturecapital fund and consolidate the new institution to manage the CDM, whose objectives will beto strengthen national capacity to formulate CDM project (component 2 of the first phase) andsupport the CDM projects portfolio in Colombia in matters pertaining to financing, marketingand negotiation (component 3 of the first phase).
Given that the new market’s rules will be determined internationally, as will the criteria andmethodology for projects and in great part the system’s efficiency, it is of fundamentalimportance that the country should possess sufficient negotiating capacity to enable it to defendits interests to maximize benefits. Equally, participating in negotiations will enhance thepossibility of having the best available information on markets, criteria and the methodology,and apply them to formulate competitive projects.
To strengthen national capacity to formulate projects, negotiate and finance them is a continualprocess that obeys the need to generate a dynamic project portfolio, that is, to ensure a flow ofinternationally competitive projects. These components are directed to eliminating the barriersmentioned above like risk management, the lack of information and access to financialresources. It is not a matter of generating a portfolio on a single occasion; the objective is todevelop Colombia’s potential as an export country for Certificates for Emissions throughCDM—and this requires continual support before the market is developed.
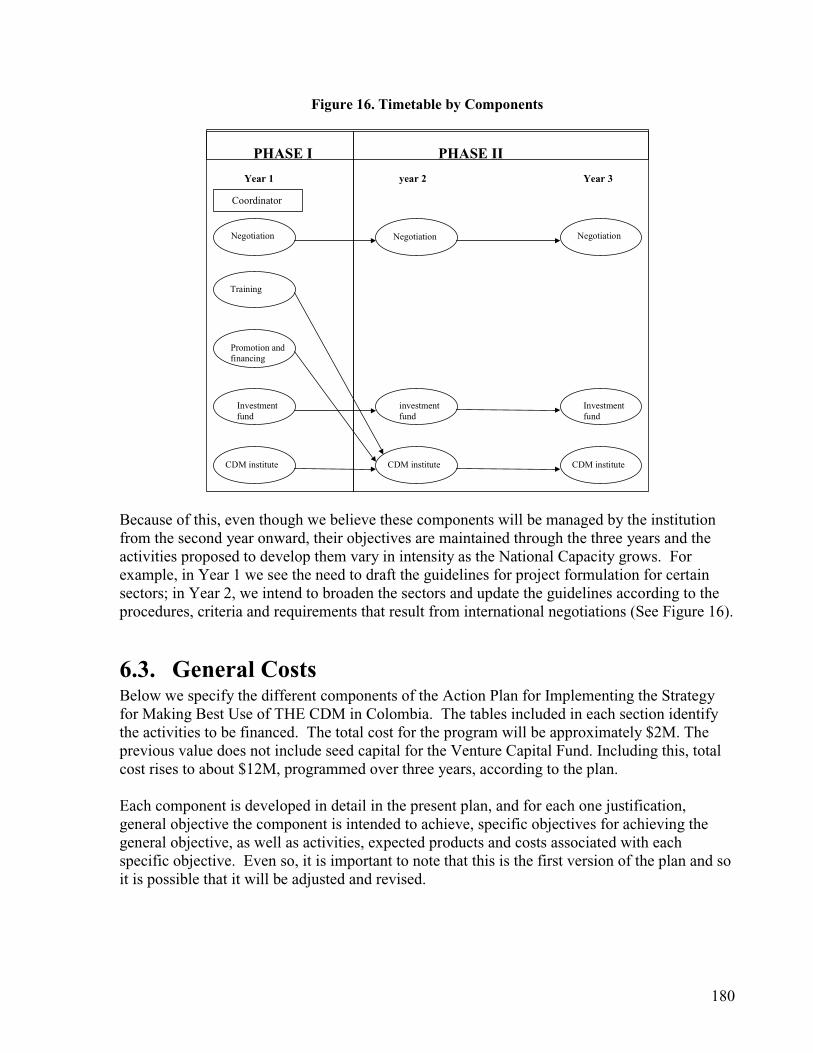
180
Figure 16. Timetable by Components
PHASE I PHASE II
Year 1 year 2 Year 3
Negotiation
Training
Promotion andfinancing
Investmentfund
CDM institute
NegotiationNegotiation
investmentfund
Investmentfund
CDM institute CDM institute
Coordinator
Because of this, even though we believe these components will be managed by the institutionfrom the second year onward, their objectives are maintained through the three years and theactivities proposed to develop them vary in intensity as the National Capacity grows. Forexample, in Year 1 we see the need to draft the guidelines for project formulation for certainsectors; in Year 2, we intend to broaden the sectors and update the guidelines according to theprocedures, criteria and requirements that result from international negotiations (See Figure 16).
6.3. General CostsBelow we specify the different components of the Action Plan for Implementing the Strategyfor Making Best Use of THE CDM in Colombia. The tables included in each section identifythe activities to be financed. The total cost for the program will be approximately $2M. Theprevious value does not include seed capital for the Venture Capital Fund. Including this, totalcost rises to about $12M, programmed over three years, according to the plan.
Each component is developed in detail in the present plan, and for each one justification,general objective the component is intended to achieve, specific objectives for achieving thegeneral objective, as well as activities, expected products and costs associated with eachspecific objective. Even so, it is important to note that this is the first version of the plan and soit is possible that it will be adjusted and revised.

181
6.4. Component 1: Strengthening Negotiating Capacity
Execution period: Phases I and II
JustificationBecause there is a group of countries that cause the great majority of GG, which are producedmainly in emissions originating in fossil fuels in the planet’s most advanced economies, thereduction commitments for these gases are assumed by Annex 1 countries, and must beobtained between 2008 and 2012.
The Climate Change Convention has undergone a process of negotiation and regulation. TheConvention’s ratification by the parties in 1994 and the initial proposal for goals were based onthe command and control concept: every country had a specific goal for reduction and had toreduce its emissions “at home”, with significant impact on its economy.
As mentioned above in Chapter 4, the regulatory systems imposed on developed countries inpast decades, based on command and control, alarmed industry, because of the high costs theywere obliged to carry (about 3% of GDP), reducing private profit and growth; thus, when theConvention was ratified, countries began to search for a way to effectively reduce the cost ofcompliance. In subsequent negotiations, two ways of reducing compliance costs were defined:(a) the compliance period was postponed from 2000 to 2008-2012 and, (b) the Kyoto Protocol’sFlexibility Mechanisms were adopted. These Flexibility Mechanisms are three variants of a“market-type” regulatory system called negotiable emissions rights, which make it possible toreduce the cost of environmental regulation.
Colombia has a special interest in the Climate Change Convention and the Kyoto protocol,because while it is not a GG emitter, it has a great opportunity to participate in the GG market,due to the high potential the country has to offer projects that help Annex 1 countries to complywith their obligations. Annex 2 countries can participate in a special way in the CDM.
At this time, the Climate Change negotiations are trying to define all the operational rules forthe flexibility mechanisms, granting priority to the definition of the CDM; the parties will alsomake decisions about the operational rules of the organisms which will direct the conventionand rules concerning compliance and verification of the commitments countries undertake.
Colombia has been a leader in the Climate Change Convention negotiations among the group ofLatin American countries with a special interest in the most cost-effective regulation of theCCC.
Certain lines of reasoning put forth at the Conference of the Parties could limit the CDMnotoriously. These points could be negotiated and regulated in favor or against the interest ofdeveloping countries at COP6 in November 200 and in the two following years. Regulation ofthe CDM model must be directed toward greater economic efficiency and environmentalefficacy, so that the mechanism should really meet the Kyoto Protocol’s goals and maximizepotential benefits for countries like Colombia.
182
On the international scene, any inefficient regulation of the Kyoto Protocol could distort theoperation of the CDM, severely restricting its potential for channeling resources toward cost-effective projects in developing countries. On the domestic scene, factors like a scarcity ofinformation, high risk, lack of funding, high transaction costs associated with institutionalinefficiency, can all limit the development of this potential. The National Program seeks toimplement practical and cost-effective strategies to overcome these limitations.
Regulation should promote the inclusion of the greatest number and variety of projects forreducing and capturing GG emissions. It must attract investment toward all sectors: energy,transportation, industry and forests. Colombia, like most developing countries, has a particularinterest in not excluding forests and changes in land use from the CDM, because it is a sectorwith great comparative advantages and broad social and environmental benefits. Inconsequence, the general ideas that should guide Colombia’s international strategy to maximizethe potential benefits of the CDM must include:
• Ensuring CDM implementation from January 2000• Minimizing international transaction costs, risks and barriers• Establish formulation methods for base lines and additionality, sufficient to produce realreductions, but not imposing costs which are too high on formulators
• Promote equal treatment for the 3 flexibility mechanisms• Promote the inclusion of sinks• Include the unilateral project formulation model to maximize the participation of projectsfrom Colombia and other high-risk countries
• Free trade of CERs on exchanges and secondary market should not be restricted• Limits for supplementarity must be voluntary for each Annex B country• The definition of the criteria of sustainable development must be the competency of eachcountry
• Other aspects of negotiations at CCC, where every country should participate actively, are:• Defining systems for monitoring gases in developing countries, to verify GG inventoriesand compliance with reduction goals
• Defining compensation mechanisms for countries highly vulnerable to climate changeeffects and the adaptability measures that can be adopted in each country affected, with theircorresponding funding mechanisms
• The forms of verification for the commitments the parties have acquired• Efficiency technology transfer among the parties involved• Best practices in the countries’ internal measures taken to reduce GG at home• Institutional definitions for directive organisms, verifiers, etc. in the Convention• Financial mechanisms for CCC.
The complexity of the topic and the country’s interest in correct regulation and implementationof the CCC’s principal points make it necessary to train Colombian negotiators to strengthenand make possible agreed national positions, support the ratification process of the KyotoProtocol and guarantee consistency at the different international meetings on the topic.

183
General ObjectiveTo strengthen the country’s negotiating capacity in different aspects of the Climate ChangeConvention:
Approximate cost: $362,900
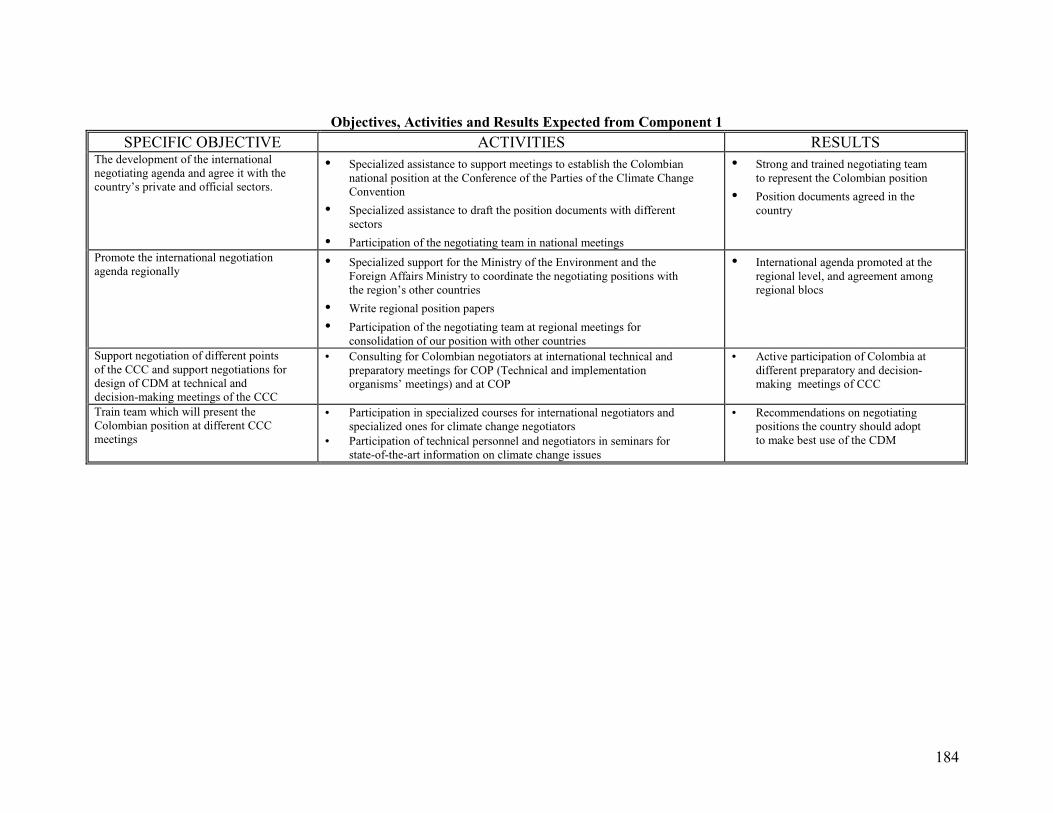
184
Objectives, Activities and Results Expected from Component 1SPECIFIC OBJECTIVE ACTIVITIES RESULTS
The development of the internationalnegotiating agenda and agree it with thecountry’s private and official sectors.
• Specialized assistance to support meetings to establish the Colombiannational position at the Conference of the Parties of the Climate ChangeConvention
• Specialized assistance to draft the position documents with differentsectors
• Participation of the negotiating team in national meetings
• Strong and trained negotiating teamto represent the Colombian position
• Position documents agreed in thecountry
Promote the international negotiationagenda regionally
• Specialized support for the Ministry of the Environment and theForeign Affairs Ministry to coordinate the negotiating positions withthe region’s other countries
• Write regional position papers
• Participation of the negotiating team at regional meetings forconsolidation of our position with other countries
• International agenda promoted at theregional level, and agreement amongregional blocs
Support negotiation of different pointsof the CCC and support negotiations fordesign of CDM at technical anddecision-making meetings of the CCC
• Consulting for Colombian negotiators at international technical andpreparatory meetings for COP (Technical and implementationorganisms’ meetings) and at COP
• Active participation of Colombia atdifferent preparatory and decision-making meetings of CCC
Train team which will present theColombian position at different CCCmeetings
• Participation in specialized courses for international negotiators andspecialized ones for climate change negotiators
• Participation of technical personnel and negotiators in seminars forstate-of-the-art information on climate change issues
• Recommendations on negotiatingpositions the country should adoptto make best use of the CDM
185
6.5. Component 2: Strengthening National Capacity forDeveloping CDM Projects
Execution Period: Phase 1
JustificationAs was presented in section 6.2. at the domestic level we identified the lack of informationas one of the principal potential restrictions to the CDM implementation. Because in thecountry those sectors interested in formulating projects do not yet have detailed knowledgeof the opportunity the CDM represents, and that the State has the best information, aproduct of its participation in international negotiations, the present study identified thebases for developing a national training program to enable the sectors to get to know theopportunities of CDM and be prepared to participate competitively in the new market.Appropriate decision-making, especially investment decisions, is a function of availableinformation and the correct understanding thereof.
General ObjectiveStrengthen the national capacity to make the best use of the benefits CDM represents forthe country.
Approximate cost: $332,724

186
Objectives, Activities and Results of Component 2OBJECTIVE ACTIVITIES EXPECTED RESULTS
Identify opportunities, on the demand andsupply sides, to make best use of CDMefficiently.Identify opportunities to make best use ofCDM in priority sectors and regions
• Identify, starting from the available information,potential for additional reductions that can guidecapacity building and also diversify the portfolio.
• Report on where activities, sectors and regions with thegreatest potential for best use of CDM are clearlyidentified and given priority, in capacity building terms
Strengthen the capacity of formulatorsin negotiation processes, in the searchfor investors
• Write basic guidelines to support the processes ofnegotiation and the search for investors
• Hold personalized sessions with the owners ofalready formulated projects
• Guidelines with key points to consider in a negotiationdirected to seeking investors for a project
• 20 project formulators with the capacity to negotiatetheir projects with potential investors
Disseminate information on CDM topotential sectors and key institutions• Disseminate opportunities and
advantages of CDM for Colombia• Disseminates the mechanism’s basic
operational framework
• Develop national seminar with local andinternational speakers
• Update web site• Write and perfect guidelines for sectoral project
formulation• Publications
• Producers’ associations, project developers,regional environmental authorities and regionalauthorities: informed about what CDM is and itsgeneral advantages
• Web site with updated information every threemonths
• Printed documents with information on CDMdistributed to key sectors and entities
• Train and support formulationprocesses according to the precisecharacteristics and needs of sectorsand regions identified
• Develop a program for a generaltechnical orientation in CDM projectformulation for sectors and/orregions with a high level of Installedcapacity
• Define the needs for specific information for eachsector with a high level of installed capacityidentified
• Develop training workshops for sectors• Develop workshops to train regional organizations
in ‘Training and Support for the Formulation ofCDM Projects’
• Report on where activities, sectors and regions withthe greatest potential for best use of CDM are clearlyidentified and given priority, in capacity buildingterms
• Develop an integral Training Programand organizational support for projectformulation in sectors or regions witha lower level of installed capacity, or
• Identified basic needs for information and trainingfor sectors with little capacity to formulate this typeof project
• Domestic seminars
• Workshops, seminars and documents designed• Formulators and Entities trained to formulate quality
projects• CDM projects formulated

187
OBJECTIVE ACTIVITIES EXPECTED RESULTSinvolving multiple small projects • Workshops for sectors
• Personalized Consulting for a specific potentialprojects
• Support and promote theestablishment of umbrellaorganizations to reduce thetransaction costs in sectors andregions involving multiple smallprojects
• Domestic seminars• Consulting on specific problems
• Key entities and organizations capable ofestablishing appropriate umbrella organizationswhich manage to reduce transaction costs
• Project formulators and umbrella organizationscontacted
• Projects under umbrella organizations formulated• Support the establishment of base
lines for sectors and regions topermit estimating the real potentialfor reductions, and certification bythe Colombian Government
• Develop a study to define base lines for regionsand sectors
• Necessary baselines for sectors are defined andcommunicated to potential project formulators,
• Communicate the results of theColombian NSS in the country andinternationally, so that the country'sand the region’s unified positionreflects our true potential fordeveloping CDM projects
• Presentations of the NSS results (and/orConsulting) at the national level to use them asinputs to support meetings for reaching agreementabout the Colombian national position regardingthe Conference of the Parties and the ClimateChange Convention
• Presentations of the NSS results (and/orConsulting) at the regional level to use them assupport for the coordination process of thepositions of other countries of the region
• Presentations of the results (and/or Consulting) ofthe NSS, at the international level to strengthenColombia's negotiating position at technical andpreparatory meetings
• Necessary base lines for regions are defined andcommunicated to potential project formulators
• Agreed national position in accordance with thecountry's true potential and the remaining results ofthe study, to facilitate the development of CDMprojects
• Agreed regional position, in accordance with thecountry's true potential and the remaining results of theNSS study, to permit making better use of CDM bydeveloping projects
• Informed and trained national negotiating teamregarding the country’s true potential and regarding theremaining results of the study, to promote regulation ofCDM facilitating the development of local projects

188
6.6. Component 3: Support for Financing andMarketing the CDM Projects Portfolio
Period of Execution: Phase I
JustificationMaximizing the potential benefits of taking best advantage of CDM in Colombia dependsin great measure on the domestic capacity to formulate, finance and execute high-qualityprojects. In this sense, the study in section 6.4. Identified key areas to support the financingand negotiating stages of the Colombian portfolio's projects. These areas are:
• Information process for formulation and negotiation• Sources and alternatives for financing• Schemes for risk mitigation• Strategic marketing of projects
This Component contains the activities necessary to support the process of financing theprojects of the Colombian portfolio, implementing the study's recommendations like:updating the study on the behavior of the international carbon market, strengthening theschemes for risk mitigation at the country and project levels and sources of financing.
General objectiveTo support to the process of financing, marketing and negotiating the Colombian portfolioof CDM projects.
Approximate cost: $305,990.

189
Objectives, Activities and Results of Component 3 (US Dollars)SPECIFIC OBJECTIVE ACTIVITIES EXPECTED RESULTS
Update Study on the Behaviorof the International CarbonMarketDesign and construct a system toperiodically collect information onthe emerging market for carboncredits of the Kyoto Protocol,tending to strengthen the NationalCapacity to make best use of theClean Development Mechanism
• Define the Theoretical Bases to determine thewillingness to pay to acquire Certificates for EmissionsReductions, on the part of potential Annex 1 investors
• Design and construct a system for the periodicalcollection of information to calculate the willingness topay for CERs
• Model of the behavior of the market for Certificates forEmissions Reductions and Analyze Principal Trends
• Technical support for the market study• Web site to gather information on markets, up and
running• Analytical document on the principal characteristics of
the market, for decision making
Mitigation Schemes AtCountry and Project LevelsStrengthen the scheme for riskmitigation through and appropriateformulation of projects
• Support the formulation of a pilot project in eachsector to validate and complement the results foundin the chapter on risk of the NSS. Consider thegenerating factors that can be mitigated with goodformulation, and proper information regardingpotential risks; and the principal considerations totake into account in writing contracts
• Document where there is a detailed explanation whatwas the impact, for the project's final formulation, ofconsidering each of the potential risks identified, andother risks that can be identified in the process (includinginsofar as possible a cost-benefit analysis)
• Guideline for risks that must be considered in deepformulation stage of projects, for each sector
Establish a compensation fund as acoverage mechanism for the riskassociated to CDM projects
• Identify specific risks that could be covered by thisfund, for each sector. Do in the actuarial study toestablish the required contributions (preferably incarbon) and the level of coverage
• Identify the best operational scheme for this fund
• Complete design of the compensation fund for CERsfor Colombia
Facilitate access to specializedinsurance policies
• Identify existing specific deficiencies in Colombiaregarding appropriate insurance policies for CDMprojects
• Identified appropriate insurance policies for theexisting projects in other sectors or other countries
• Establish contacts with international anddomestic insurers and re-insurers to facilitateaccess to specialized insurance policies
• Access to insurance policies against the principalresidual risks CDM projects face in Colombia
Sources of FinanceIdentify the needs for financing themain CDM project implementers havei C l bi (D d f fi i )
• Identify project cycles for main potential CDMsectors and associated cash flows
• Demand for finance in CDMprojects identified

190
SPECIFIC OBJECTIVE ACTIVITIES EXPECTED RESULTSin Colombia (Demand for financing) • Study the characteristics of the funding required
according to the results of the previous activity• Identify through a survey directed to project
developers, the principal needs and characteristicsrequired of sources of finance
Identify and characterize sources offinance available at present in domesticand international capital markets(present supply of financial sources)
• Investigate traditional sources of funds forproductive activities having CDM potential(reforestation, energy, industry, etc.)
• Investigate possibilities of international anddomestic funding under different modalities (non-reimbursable funds, credit and capital participation)
• Investigate willingness of principal financial actorsto establish financial lines for CDM
• Propose new sources of funds which can be set upwith multilateral organisms and domestic financialactors
• Create an information module on sources of financedirected to project developers
• Supply of financial sources identified and characterized• Proposal of new sources for different financial actors• Information module on available financial resources for
project developers
Marketing the ColombianPortfolioSupport the Colombian Portfolio’sprojects in the sale of CERs
• Develop and coordinate a strategy for marketingthe Colombian projects portfolio
• Promote the Colombian portfolio with potentialinvestors
• Document with marketing strategy• Projects of the Colombian portfolio financed

191
6.7. Component 4: Support for Developing a VentureCapital Fund for Financing CDM Projects
Period of Execution: Phases II and I
JustificationAs mentioned in the previous component, an important limitation to the development ofCDM in Colombia is the scarcity of financial resources. Because of CDM projects’ specialcharacteristics, often the traditional sources of capital do not adapt to the particular needsand conditions of this type of project. Because of this, we initially identified the importanceof establishing a financial mechanism for venture capital investment adjusted to the needsand characteristics of many CDM projects. Similar schemes exist and operate in otherplaces, like the World Bank’s Prototype Carbon Fund. Thus, a fund of this nature will bethe first specialized financial alternative established to support the development of CDMprojects in Colombia. Later, additional alternatives will be sought, identified as a result ofthe work of Component 3.
An important point in this component is that this fund should become an attractiveinvestment option for different entities and institutions of the public and private sectors.Because of the general nature of such a fund, clearly the target market varies substantiallyin each case, and one pre-feasibility study will not answer the questions of another. Evenso, certain elements of the study being done will be useful for the pre-feasibility study forthe Venture Capital Fund for CDM projects. Recommendations on the fund’s optimalstructure, in legal aspects, arising from the study, could be applied to the CDM projects’fund. Part of the initial financial analysis is applicable to both funds. But market analysisdoes differ markedly, as do certain elements of the financial analysis, which might vary inresponse to the characteristics of the different types of projects to finance with each fund.
General ObjectivesTo constitute and begin operating a venture capital fund to finance CDM projects inColombia.
Approximate cost: $204,000 (first year)$156,800 (second year)

192
Objectives, Activities and Estimated Costs of Component 4 (US Dollars)SPECIFIC OBJECTIVE ACTIVITIES PRODUCT
Set up a Venture Capital Fund (VCF) to finance CDM projectsin Colombia, directed to investors
• Study the feasibility of setting up a VCF for CDM projectsin Colombia and establish its Business Plan
• Find a company to administrate the fund under a negotiatedscheme and contract
• Support the administration at startup• Identify investors, and begin fund raising• Different investors place capital
VCF set up
Administrators ready to begin operations
Resources for fund available

193
6.8. Component 5: Creation and Consolidation ofInstitutional Capacity to Manage CDM in Colombia
Period of Execution: Phase I
JustificationThe operation of CDM requires the country’s approval for projects presented to theFramework Convention, to become registered as CDM projects. To maximize the benefitsfor the country from participating in CDM, Colombia requires an efficient and effectivenational institution to approve and promote projects, organized under clear and simplecriteria and procedures, approving high-quality projects. As the NSS states, transactioncosts associated with project approval determine the success or failure of project-basedmarket schemes. Equally, to guarantee high-quality projects and a broad portfolio, theColombian portfolio must be marketed abroad, just as formulators inside the country mustbe trained.
During the first year, all necessary steps will be taken to build this institution and inparallel, others must assume these functions until the institution is up and running.
General ObjectiveTo set up and begin operating an institution to manage CDM in Colombia.
Approximate cost: $84,475

194
Objectives, Activities and Estimated Costs and Results of Component 5 (US Dollars)OBJECTIVE ACTIVITIES PRODUCT
To found an institution to manage CDM in Colombia,including legal, financial and technical issues
• Provide consulting about financial resources andstartup of National Strategy to Make Best Use ofCDM in Colombia
• Legal study to determine competency, nature,constitution, contributions and other relevant issuesfor the CDM management institution, and dopaperwork to legally constitute entity
• Identify, negotiate and devise how potential partnerscan participate
• Identify and obtain investment and operating capitalfor the three first years, planning for financial self-sufficiency from year 4
• Financing, partners and strategic alliances defined• Legal study on competency, nature, constitution,
contributions and other relevant issues for creatingCDM management entity
• Institution constituted, legalized and registered• Charter and capital definedFunding defined and negotiated
Evaluate CDM projects developed until institution is upand running
• Write criteria and procedures for evaluating projects
• Identify the certification scheme, the companies andthe legal framework for certification in Colombia
• Document on criteria and procedures for CDMproject evaluation
• Document on schemes for certification, companiesand legal framework
Begin operating the institution, ensuring its continuity • Write the action plan• Write profiles for personnel and ensure the
institution’s physical plant and equipment• Promote and conclude inter- institutional
agreements with the relevant entities like the Unitfor National Natural Parks, the NATURAL Centerfor Cleaner Production, SINA, and the MicroEnergetic Planning Unit, etc.
• Action Plan for two years• Profiles written• Physical plant and equipment identified• Agreements

195
6.9. Consolidating Institutional Capacity for ManagingCDM in Colombia
Period of Execution: Phase II and III
JustificationOnce the institution to manage CDM in Colombia is constituted and operational, it willassume the components of strengthening the National Capacity, support for the CDMProject Portfolio in Colombia and the processes of financing, marketing, negotiating andevaluating these activities.
General objectiveConsolidate and make sure of the institution’s continuity (two years)
Approximate cost: $314,325 (first year)$269,075 (second year)$581,300 (third year)

196
Objectives, Activities, Expected Results (US Dollar)OBJECTIVE ACTIVITIES PRODUCT
Consolidate the institution’s operation Guarantee full-time personnel Executive directorManager
Forest expert
Evaluate potential CDM projectsUpdate the criteria for approval and the evaluationprocedures for projects
Guidelines for a evaluating and approving projects.Forms for project presentation
Evaluate projects and write recommendations for theirapproval
Projects portfolio
Create and maintain a system for registering projects Registry
Operate the system for registering projects Registry
Strengthening National CapacityIdentify opportunities, from demand and supply sides, to make efficient use of CDMIdentify opportunities to make best use of CDM inpriority sectors and regions
Identify, from the available information, additionalreduction potentials that permit the appropriate directionof capacity building activities, and also diversify theportfolio
Report, with clear identification and a priority list foractivities, sectors and regions having the greatestpotential for making best use of CDM, characterizedaccording to the requirements, in the dimension ofcapacity building
Strengthen the capacity of formulators in negotiations toseek investors
Update the basic general guidelines to support thenegotiation process and the search for investors
Guideline containing key points to remember in anegotiation directed to seeking investors for a project
Develop personalized meetings with owners of alreadyformulated projects
20 project formulators with the capacity to negotiatetheir projects with potential investors
Disseminate information on CDM To potential sectors and key Institutions and entitiesMake known the opportunities and advantages of CDMfor Colombia
Develop 2 national seminars yearly, with local andinternational speakers
Producers' associations from potential sectors, potentialproject developers, regional environmental entities andregional authorities--informed on what CDM is and itsgeneral advantages
Make known the mechanism’s basic lines of operation Update the Web site Web site with information updated every two months ofUpdate the project formulation guidelines Documents with information on CDM updated in
accordance with the methodologies and criteria, andextended to new sectors
Publications Documents with information on CDM printed anddistributed to key sectors and entities
Train and support for formulation processes, per characteristics and needs of sectors and regionsDevelop a program of general technical orientation inCDM project formulation for sectors and/or regions witha high level of installed capacity
Define the specific information needs for each sectorwith a high installed capacity
Required workshops for sectors and regions designed

197
OBJECTIVE ACTIVITIES PRODUCTDevelop training workshops for sectors Sectors with high capacity to formulate CDMDevelop workshops to train regional institutions in‘Training and Support for Formulating CDM projects’
Entities enabled to train and support CDM projectformulation
Develop an integral Training Program and organizationalsupport for project formulation in sectors or regions witha lower level of installed capacity, or involving multiplesmall projects
Domestic seminars Formulators and Entities trained to formulate qualityprojects and
Seminars for sectors Formulators and Entities trained to formulate qualityprojects
Personalized Consulting for specific potential projects CDM projects formulated
Support and promoted the establishment of umbrellaorganizations to reduce transaction costs in sectors andregions involving multiple small projects
Domestic seminars Key entities and organizations capable of establishingappropriate umbrella organizations that manage toreduce transaction costs
Promote the creation of umbrella groups Formulators of projects and umbrella organizationscontacted. Projects under umbrella organizationsformulated
Support for Financing and Marketing CDM ProjectsIdentified and characterize sources of financing availableat present in domestic and international capital markets(present offering of financial sources)
Investigate traditional sources of finance for productiveactivities having CDM potential (reforestation, energy,industry, etc.)Investigate possibilities for the domestic andinternational financing under different modalities: non-reimbursable resources, credit and capital participationInvestigate willingness of principal financial agents toestablish lines for financing CDM
Offering of financial sources identified and characterizedProposal for new sources of funds from differentfinancial agentsInformation module on available sources of informationfor project developers
Provide a periodic information on the emerging marketfor carbon credits
Operate the system for periodic collection of informationpermitting the calculation of willingness to pay for CERs
Web site for gathering information on markets inoperation
Run the behavioral model of the market for Certificatesfor Emissions Reduction and analyze principal trends
Analytical document on principal characteristics of themarket, for decision making
Prepare and update continually information on thecarbon market
Database with potential investors, price trends, etc.
Promote National participation in the internationalcarbon market
Coordinate marketing strategy with outfits specialized inforeign trade
Market strategy under way
Promote the Colombian portfolio with potential investors Portfolio of projects financed; CERs sold
Promote the adoption of the risk mitigation measures Access to instrument for mitigating and coveringspecialist risks
Maintenance costs for infrastructure: rent,communications, services
198
7.Next Steps: Action Plan to Implement CDM inColombia
Based on the results of this Strategy Study, we identified the need to formulate an action plan toprovide continuity to the process of implementing CDM in the country. Below we present thestrategies to follow, based on the conclusions of the present study. All activities (and costs) setforth in this Implementation Program are additional and complementary to the NationalStrategy Study (NSS).
7.1. Objective
To implement the strategy to make the best possible use of the Clean Development Mechanism-CDM, maximizing for the country the benefits and opportunities applying this mechanismrepresents.
7.2. Structure of the Program and Components
The National Strategy for best use of CDM seeks to maximize the benefits for the country ofthis mechanism. These benefits will only become true if Colombia begins to participate andfinds the right position, with a dynamic very high-quality project portfolio in compliance withall the internationally established criteria and methodologies, and if on the other hand anefficient world market for carbon develops.
There are a series of barriers and limitations to achieving the Colombian potential. TheNational Strategy identified these limitations and now proposes actions to minimize oreliminate them.
The main limitations are: in the international ambit, a number of factors will affect Colombia’smodel and level of participation. Negotiations at the coming Conferences of the Parties (COP)and the Climate Change Convention (CCC) during the next three years, will established thedesign and mode of operation of CDM, and there are proposals under discussion which mightseverely affect the potential of developing countries, especially Colombia’s.
In the National ambit, there are several factors which could restrict the development of CDMand the potential benefits to be gained from it, including :
• Risk: the risks of investing and operating in Colombia high which places Colombia whencompared to other alternatives for CDM investment such as Costa Rica, Chile and Brazil,which compete for the same resources.

199
• Information: there is a generalized lack of information within the country regarding theCDM, the market and the rules of project formulation and commercialization. For themajority of communities, firms and individuals that could benefit from it, the CDM islargely unknown. Prospective project sponsors cannot formulate project without knowledgeof complex issues such as baselines and additionality, nor can they negotiate equitableparticipation in projects without information on related market dynamics or the expectedrange of future prices for CERs.
• Finance: Project development will be constrained by the lack of finance to supportprefeasibility and feasibility studies. Even if the unilateral model of project formulation isaccepted by COP6 to promote CDM activities in high-risk nations, Colombian projectdevelopers will be highly constrained by lack of capital available in local financial markets.
• Institutional Factors: In similar project-based emissions offset programs in other countries,official institutions have frequently imposed complex approval processes and hightransaction costs that limit returns and discourage investor participation. Bureaucraticinefficiency in the operation of national bureaucracies would further debilitate Colombia’scompetitiveness and net gains from the CDM. In order to maximize the potential benefitsfor the country, Colombia requires a stable, efficient, transparent and agile institutionalmechanism that minimizes risk and transaction costs.
The program is designed for three years and is divided into the following components, each ofwhich seeks to implement the strategies defined in the present study, to overcome the identifiedbarriers and limitations we have identified, that limit achieving the country’s potential in theCDM (see Figure 13).
6. To strengthen the country’s negotiating capacity in the different aspects of theConvention on Climate Change.
7. To strengthen the National Capacity to develop CDM projects and obtain appropriateadvantages from the benefits this mechanism represents for the country.
8. To support the CDM projects portfolio in Colombia in matters pertaining to funding,marketing and negotiation.
9. To create and operate a Venture Capital Fund with the objective of having a financialinstrument operating in Colombia to finance its own dynamic project portfolio.
10. To create and consolidate our institutional capacity to manage CD in Colombia, with aview to constituting and operating the institution for CDM in Colombia; and alsoconsolidate and ensure the institution’s continuity.
200
Components 2 and 3 are considered separately for a one-year period; from the second year theywill be managed by the institution operating CDM in Colombia, and thus will become part ofthe institution’s objectives and activities. It is important to note that while the institution isbeing constituted and becomes operational, these components cannot be set aside, which is whythey are noted separately, to be developed simultaneously with the creation of the institutionduring the first year and until it becomes operational.
Components 1 and 4 are considered for a three-year period separately, because their dimensionand objectives go beyond the scope of the objectives and competency of the above-mentionedinstitution.
In this order of ideas, the program contains the two phases: the first will developsimultaneously, during the first year, the five components, and from the second year theprogram will have three components: to strengthen negotiating capacity, set up the venturecapital fund and consolidate the new institution to manage the CDM, whose objectives will beto strengthen national capacity to formulate CDM project (component 2 of the first phase) andsupport the CDM projects portfolio in Colombia in matters pertaining to financing, marketingand negotiation (component 3 of the first phase).
Given that the new market’s rules will be determined internationally, as will the criteria andmethodology for projects and in great part the system’s efficiency, it is of fundamentalimportance that the country should possess sufficient negotiating capacity to enable it to defendits interests to maximize benefits. Equally, participating in negotiations will enhance thepossibility of having the best available information on markets, criteria and the methodology,and apply them to formulate competitive projects.
To strengthen national capacity to formulate projects, negotiate and finance them is a continualprocess that obeys the need to generate a dynamic project portfolio, that is, to ensure a flow ofinternationally competitive projects. These components are directed to eliminating the barriersmentioned above like risk management, the lack of information and access to financialresources. It is not a matter of generating a portfolio on a single occasion; the objective is todevelop Colombia’s potential as an export country for Certificates for Emissions throughCDM—and this requires continual support before the market is developed.
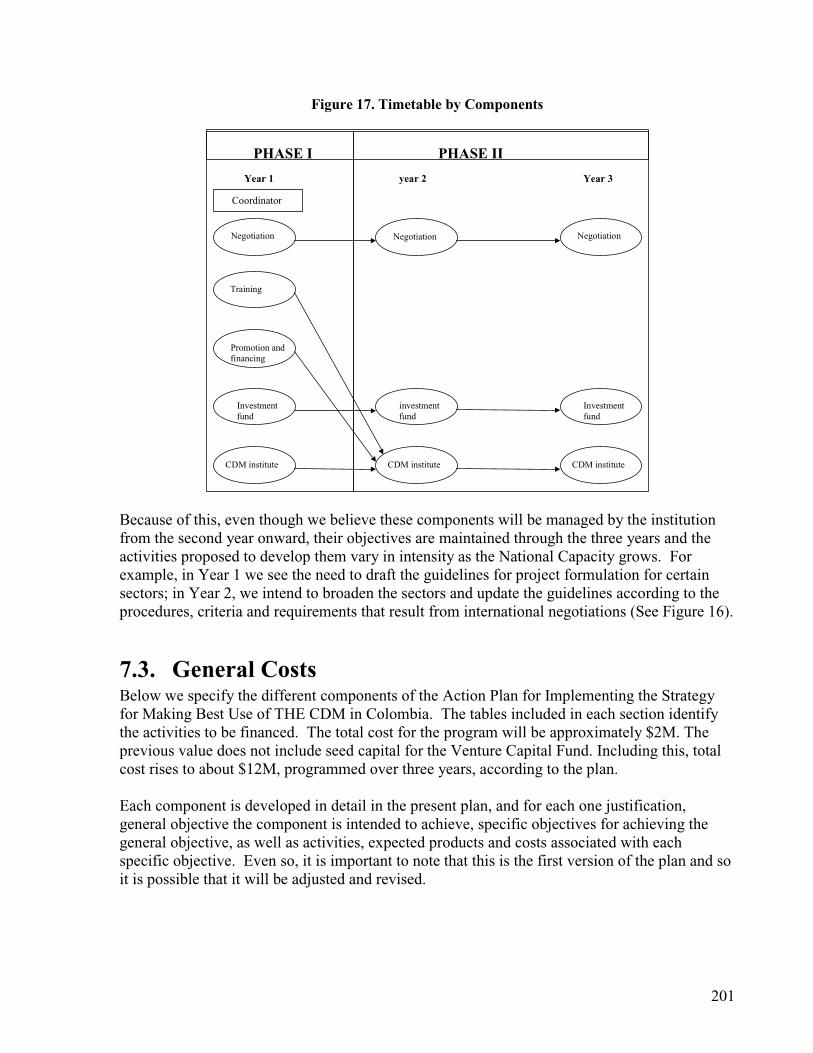
201
Figure 17. Timetable by Components
PHASE I PHASE II
Year 1 year 2 Year 3
Negotiation
Training
Promotion andfinancing
Investmentfund
CDM institute
NegotiationNegotiation
investmentfund
Investmentfund
CDM institute CDM institute
Coordinator
Because of this, even though we believe these components will be managed by the institutionfrom the second year onward, their objectives are maintained through the three years and theactivities proposed to develop them vary in intensity as the National Capacity grows. Forexample, in Year 1 we see the need to draft the guidelines for project formulation for certainsectors; in Year 2, we intend to broaden the sectors and update the guidelines according to theprocedures, criteria and requirements that result from international negotiations (See Figure 16).
7.3. General CostsBelow we specify the different components of the Action Plan for Implementing the Strategyfor Making Best Use of THE CDM in Colombia. The tables included in each section identifythe activities to be financed. The total cost for the program will be approximately $2M. Theprevious value does not include seed capital for the Venture Capital Fund. Including this, totalcost rises to about $12M, programmed over three years, according to the plan.
Each component is developed in detail in the present plan, and for each one justification,general objective the component is intended to achieve, specific objectives for achieving thegeneral objective, as well as activities, expected products and costs associated with eachspecific objective. Even so, it is important to note that this is the first version of the plan and soit is possible that it will be adjusted and revised.
202
7.4. Component 1: Strengthening Negotiating Capacity
Execution period: Phases I and II
JustificationBecause there is a group of countries that cause the great majority of GG, which are producedmainly in emissions originating in fossil fuels in the planet’s most advanced economies, thereduction commitments for these gases are assumed by Annex 1 countries, and must beobtained between 2008 and 2012.
The Climate Change Convention has undergone a process of negotiation and regulation. TheConvention’s ratification by the parties in 1994 and the initial proposal for goals were based onthe command and control concept: every country had a specific goal for reduction and had toreduce its emissions “at home”, with significant impact on its economy.
As mentioned above in Chapter 4, the regulatory systems imposed on developed countries inpast decades, based on command and control, alarmed industry, because of the high costs theywere obliged to carry (about 3% of GDP), reducing private profit and growth; thus, when theConvention was ratified, countries began to search for a way to effectively reduce the cost ofcompliance. In subsequent negotiations, two ways of reducing compliance costs were defined:(a) the compliance period was postponed from 2000 to 2008-2012 and, (b) the Kyoto Protocol’sFlexibility Mechanisms were adopted. These Flexibility Mechanisms are three variants of a“market-type” regulatory system called negotiable emissions rights, which make it possible toreduce the cost of environmental regulation.
Colombia has a special interest in the Climate Change Convention and the Kyoto protocol,because while it is not a GG emitter, it has a great opportunity to participate in the GG market,due to the high potential the country has to offer projects that help Annex 1 countries to complywith their obligations. Annex 2 countries can participate in a special way in the CDM.
At this time, the Climate Change negotiations are trying to define all the operational rules forthe flexibility mechanisms, granting priority to the definition of the CDM; the parties will alsomake decisions about the operational rules of the organisms which will direct the conventionand rules concerning compliance and verification of the commitments countries undertake.
Colombia has been a leader in the Climate Change Convention negotiations among the group ofLatin American countries with a special interest in the most cost-effective regulation of theCCC.
Certain lines of reasoning put forth at the Conference of the Parties could limit the CDMnotoriously. These points could be negotiated and regulated in favor or against the interest ofdeveloping countries at COP6 in November 200 and in the two following years. Regulation ofthe CDM model must be directed toward greater economic efficiency and environmentalefficacy, so that the mechanism should really meet the Kyoto Protocol’s goals and maximizepotential benefits for countries like Colombia.

203
On the international scene, any inefficient regulation of the Kyoto Protocol could distort theoperation of the CDM, severely restricting its potential for channeling resources toward cost-effective projects in developing countries. On the domestic scene, factors like a scarcity ofinformation, high risk, lack of funding, high transaction costs associated with institutionalinefficiency, can all limit the development of this potential. The National Program seeks toimplement practical and cost-effective strategies to overcome these limitations.
Regulation should promote the inclusion of the greatest number and variety of projects forreducing and capturing GG emissions. It must attract investment toward all sectors: energy,transportation, industry and forests. Colombia, like most developing countries, has a particularinterest in not excluding forests and changes in land use from the CDM, because it is a sectorwith great comparative advantages and broad social and environmental benefits. Inconsequence, the general ideas that should guide Colombia’s international strategy to maximizethe potential benefits of the CDM must include:
• Ensuring CDM implementation from January 2000• Minimizing international transaction costs, risks and barriers• Establish formulation methods for base lines and additionality, sufficient to produce realreductions, but not imposing costs which are too high on formulators
• Promote equal treatment for the 3 flexibility mechanisms• Promote the inclusion of sinks• Include the unilateral project formulation model to maximize the participation of projectsfrom Colombia and other high-risk countries
• Free trade of CERs on exchanges and secondary market should not be restricted• Limits for supplementarity must be voluntary for each Annex B country• The definition of the criteria of sustainable development must be the competency of eachcountry
• Other aspects of negotiations at CCC, where every country should participate actively, are:• Defining systems for monitoring gases in developing countries, to verify GG inventoriesand compliance with reduction goals
• Defining compensation mechanisms for countries highly vulnerable to climate changeeffects and the adaptability measures that can be adopted in each country affected, with theircorresponding funding mechanisms
• The forms of verification for the commitments the parties have acquired• Efficiency technology transfer among the parties involved• Best practices in the countries’ internal measures taken to reduce GG at home• Institutional definitions for directive organisms, verifiers, etc. in the Convention• Financial mechanisms for CCC.
The complexity of the topic and the country’s interest in correct regulation and implementationof the CCC’s principal points make it necessary to train Colombian negotiators to strengthenand make possible agreed national positions, support the ratification process of the KyotoProtocol and guarantee consistency at the different international meetings on the topic.

204
General ObjectiveTo strengthen the country’s negotiating capacity in different aspects of the Climate ChangeConvention:
Approximate cost: $362,900

205
Objectives, Activities and Results Expected from Component 1SPECIFIC OBJECTIVE ACTIVITIES RESULTS
The development of the internationalnegotiating agenda and agree it with thecountry’s private and official sectors.
• Specialized assistance to support meetings to establish the Colombiannational position at the Conference of the Parties of the Climate ChangeConvention
• Specialized assistance to draft the position documents with differentsectors
• Participation of the negotiating team in national meetings
• Strong and trained negotiating teamto represent the Colombian position
• Position documents agreed in thecountry
Promote the international negotiationagenda regionally
• Specialized support for the Ministry of the Environment and theForeign Affairs Ministry to coordinate the negotiating positions withthe region’s other countries
• Write regional position papers
• Participation of the negotiating team at regional meetings forconsolidation of our position with other countries
• International agenda promoted at theregional level, and agreement amongregional blocs
Support negotiation of different pointsof the CCC and support negotiations fordesign of CDM at technical anddecision-making meetings of the CCC
• Consulting for Colombian negotiators at international technical andpreparatory meetings for COP (Technical and implementationorganisms’ meetings) and at COP
• Active participation of Colombia atdifferent preparatory and decision-making meetings of CCC
Train team which will present theColombian position at different CCCmeetings
• Participation in specialized courses for international negotiators andspecialized ones for climate change negotiators
• Participation of technical personnel and negotiators in seminars forstate-of-the-art information on climate change issues
• Recommendations on negotiatingpositions the country should adoptto make best use of the CDM

206
7.5. Component 2: Strengthening National Capacity forDeveloping CDM Projects
Execution Period: Phase 1
JustificationAs was presented in section 6.2. at the domestic level we identified the lack of informationas one of the principal potential restrictions to the CDM implementation. Because in thecountry those sectors interested in formulating projects do not yet have detailed knowledgeof the opportunity the CDM represents, and that the State has the best information, aproduct of its participation in international negotiations, the present study identified thebases for developing a national training program to enable the sectors to get to know theopportunities of CDM and be prepared to participate competitively in the new market.Appropriate decision-making, especially investment decisions, is a function of availableinformation and the correct understanding thereof.
General ObjectiveStrengthen the national capacity to make the best use of the benefits CDM represents forthe country.
Approximate cost: $332,724
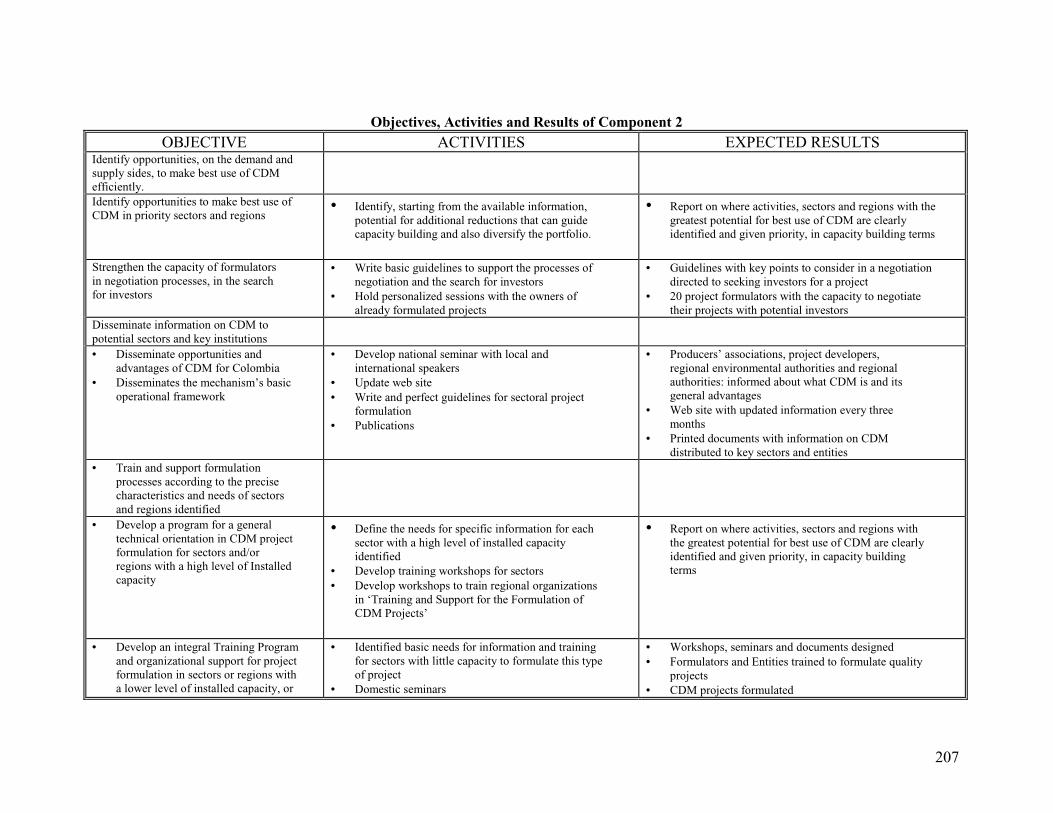
207
Objectives, Activities and Results of Component 2OBJECTIVE ACTIVITIES EXPECTED RESULTS
Identify opportunities, on the demand andsupply sides, to make best use of CDMefficiently.Identify opportunities to make best use ofCDM in priority sectors and regions
• Identify, starting from the available information,potential for additional reductions that can guidecapacity building and also diversify the portfolio.
• Report on where activities, sectors and regions with thegreatest potential for best use of CDM are clearlyidentified and given priority, in capacity building terms
Strengthen the capacity of formulatorsin negotiation processes, in the searchfor investors
• Write basic guidelines to support the processes ofnegotiation and the search for investors
• Hold personalized sessions with the owners ofalready formulated projects
• Guidelines with key points to consider in a negotiationdirected to seeking investors for a project
• 20 project formulators with the capacity to negotiatetheir projects with potential investors
Disseminate information on CDM topotential sectors and key institutions• Disseminate opportunities and
advantages of CDM for Colombia• Disseminates the mechanism’s basic
operational framework
• Develop national seminar with local andinternational speakers
• Update web site• Write and perfect guidelines for sectoral project
formulation• Publications
• Producers’ associations, project developers,regional environmental authorities and regionalauthorities: informed about what CDM is and itsgeneral advantages
• Web site with updated information every threemonths
• Printed documents with information on CDMdistributed to key sectors and entities
• Train and support formulationprocesses according to the precisecharacteristics and needs of sectorsand regions identified
• Develop a program for a generaltechnical orientation in CDM projectformulation for sectors and/orregions with a high level of Installedcapacity
• Define the needs for specific information for eachsector with a high level of installed capacityidentified
• Develop training workshops for sectors• Develop workshops to train regional organizations
in ‘Training and Support for the Formulation ofCDM Projects’
• Report on where activities, sectors and regions withthe greatest potential for best use of CDM are clearlyidentified and given priority, in capacity buildingterms
• Develop an integral Training Programand organizational support for projectformulation in sectors or regions witha lower level of installed capacity, or
• Identified basic needs for information and trainingfor sectors with little capacity to formulate this typeof project
• Domestic seminars
• Workshops, seminars and documents designed• Formulators and Entities trained to formulate quality
projects• CDM projects formulated
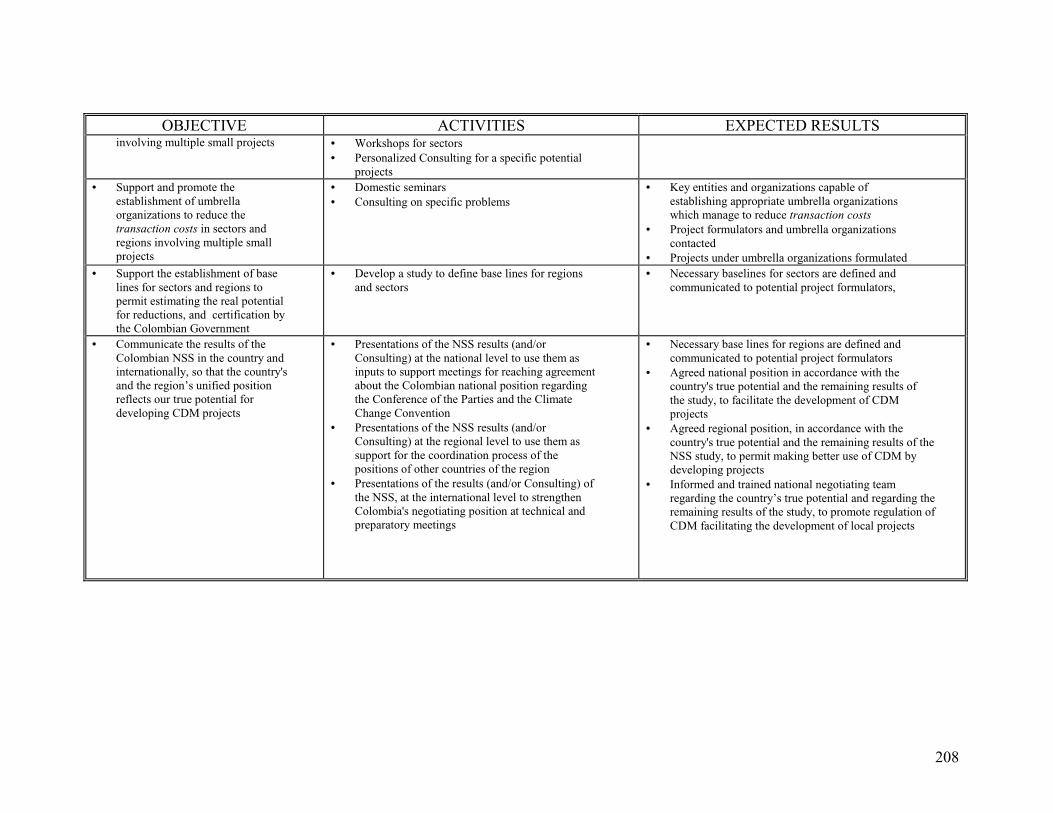
208
OBJECTIVE ACTIVITIES EXPECTED RESULTSinvolving multiple small projects • Workshops for sectors
• Personalized Consulting for a specific potentialprojects
• Support and promote theestablishment of umbrellaorganizations to reduce thetransaction costs in sectors andregions involving multiple smallprojects
• Domestic seminars• Consulting on specific problems
• Key entities and organizations capable ofestablishing appropriate umbrella organizationswhich manage to reduce transaction costs
• Project formulators and umbrella organizationscontacted
• Projects under umbrella organizations formulated• Support the establishment of base
lines for sectors and regions topermit estimating the real potentialfor reductions, and certification bythe Colombian Government
• Develop a study to define base lines for regionsand sectors
• Necessary baselines for sectors are defined andcommunicated to potential project formulators,
• Communicate the results of theColombian NSS in the country andinternationally, so that the country'sand the region’s unified positionreflects our true potential fordeveloping CDM projects
• Presentations of the NSS results (and/orConsulting) at the national level to use them asinputs to support meetings for reaching agreementabout the Colombian national position regardingthe Conference of the Parties and the ClimateChange Convention
• Presentations of the NSS results (and/orConsulting) at the regional level to use them assupport for the coordination process of thepositions of other countries of the region
• Presentations of the results (and/or Consulting) ofthe NSS, at the international level to strengthenColombia's negotiating position at technical andpreparatory meetings
• Necessary base lines for regions are defined andcommunicated to potential project formulators
• Agreed national position in accordance with thecountry's true potential and the remaining results ofthe study, to facilitate the development of CDMprojects
• Agreed regional position, in accordance with thecountry's true potential and the remaining results of theNSS study, to permit making better use of CDM bydeveloping projects
• Informed and trained national negotiating teamregarding the country’s true potential and regarding theremaining results of the study, to promote regulation ofCDM facilitating the development of local projects
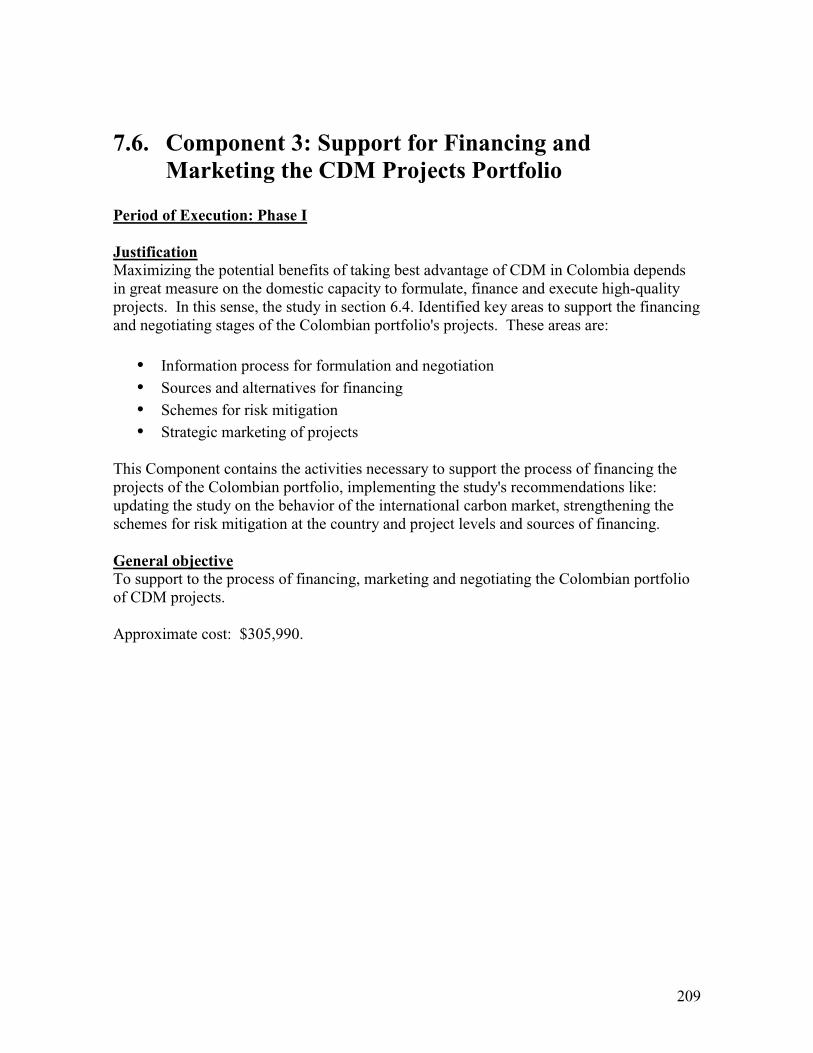
209
7.6. Component 3: Support for Financing andMarketing the CDM Projects Portfolio
Period of Execution: Phase I
JustificationMaximizing the potential benefits of taking best advantage of CDM in Colombia dependsin great measure on the domestic capacity to formulate, finance and execute high-qualityprojects. In this sense, the study in section 6.4. Identified key areas to support the financingand negotiating stages of the Colombian portfolio's projects. These areas are:
• Information process for formulation and negotiation• Sources and alternatives for financing• Schemes for risk mitigation• Strategic marketing of projects
This Component contains the activities necessary to support the process of financing theprojects of the Colombian portfolio, implementing the study's recommendations like:updating the study on the behavior of the international carbon market, strengthening theschemes for risk mitigation at the country and project levels and sources of financing.
General objectiveTo support to the process of financing, marketing and negotiating the Colombian portfolioof CDM projects.
Approximate cost: $305,990.
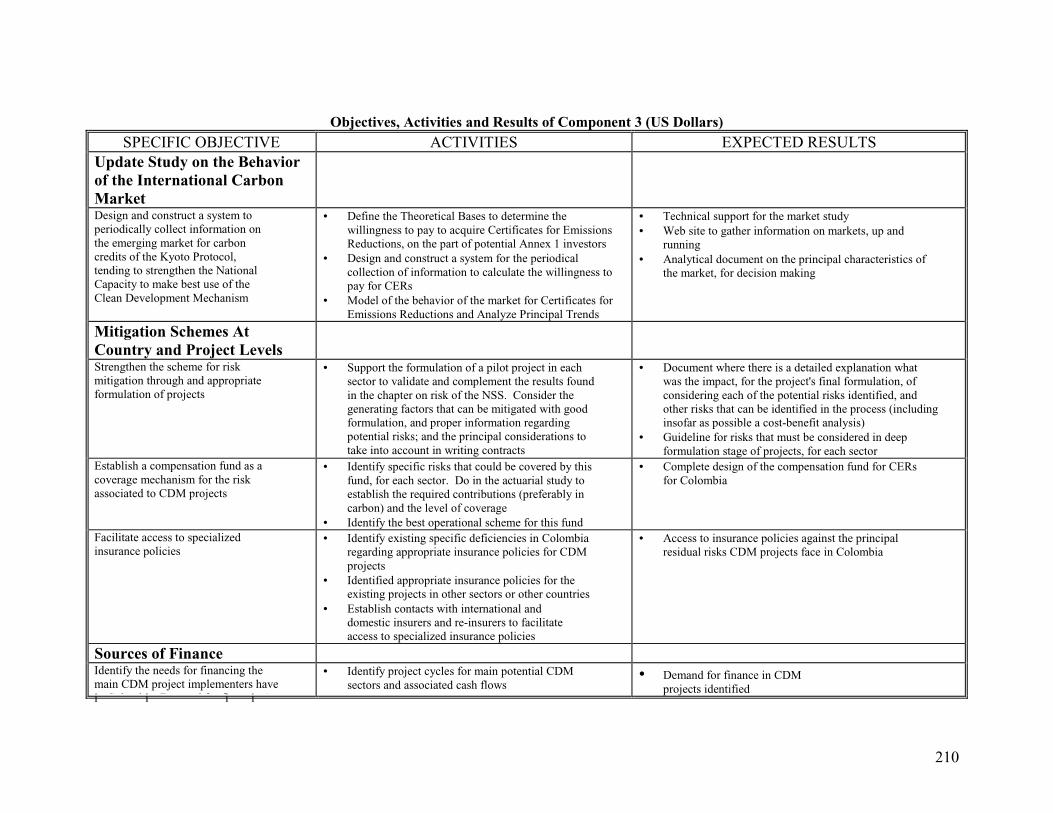
210
Objectives, Activities and Results of Component 3 (US Dollars)SPECIFIC OBJECTIVE ACTIVITIES EXPECTED RESULTS
Update Study on the Behaviorof the International CarbonMarketDesign and construct a system toperiodically collect information onthe emerging market for carboncredits of the Kyoto Protocol,tending to strengthen the NationalCapacity to make best use of theClean Development Mechanism
• Define the Theoretical Bases to determine thewillingness to pay to acquire Certificates for EmissionsReductions, on the part of potential Annex 1 investors
• Design and construct a system for the periodicalcollection of information to calculate the willingness topay for CERs
• Model of the behavior of the market for Certificates forEmissions Reductions and Analyze Principal Trends
• Technical support for the market study• Web site to gather information on markets, up and
running• Analytical document on the principal characteristics of
the market, for decision making
Mitigation Schemes AtCountry and Project LevelsStrengthen the scheme for riskmitigation through and appropriateformulation of projects
• Support the formulation of a pilot project in eachsector to validate and complement the results foundin the chapter on risk of the NSS. Consider thegenerating factors that can be mitigated with goodformulation, and proper information regardingpotential risks; and the principal considerations totake into account in writing contracts
• Document where there is a detailed explanation whatwas the impact, for the project's final formulation, ofconsidering each of the potential risks identified, andother risks that can be identified in the process (includinginsofar as possible a cost-benefit analysis)
• Guideline for risks that must be considered in deepformulation stage of projects, for each sector
Establish a compensation fund as acoverage mechanism for the riskassociated to CDM projects
• Identify specific risks that could be covered by thisfund, for each sector. Do in the actuarial study toestablish the required contributions (preferably incarbon) and the level of coverage
• Identify the best operational scheme for this fund
• Complete design of the compensation fund for CERsfor Colombia
Facilitate access to specializedinsurance policies
• Identify existing specific deficiencies in Colombiaregarding appropriate insurance policies for CDMprojects
• Identified appropriate insurance policies for theexisting projects in other sectors or other countries
• Establish contacts with international anddomestic insurers and re-insurers to facilitateaccess to specialized insurance policies
• Access to insurance policies against the principalresidual risks CDM projects face in Colombia
Sources of FinanceIdentify the needs for financing themain CDM project implementers havei C l bi (D d f fi i )
• Identify project cycles for main potential CDMsectors and associated cash flows
• Demand for finance in CDMprojects identified
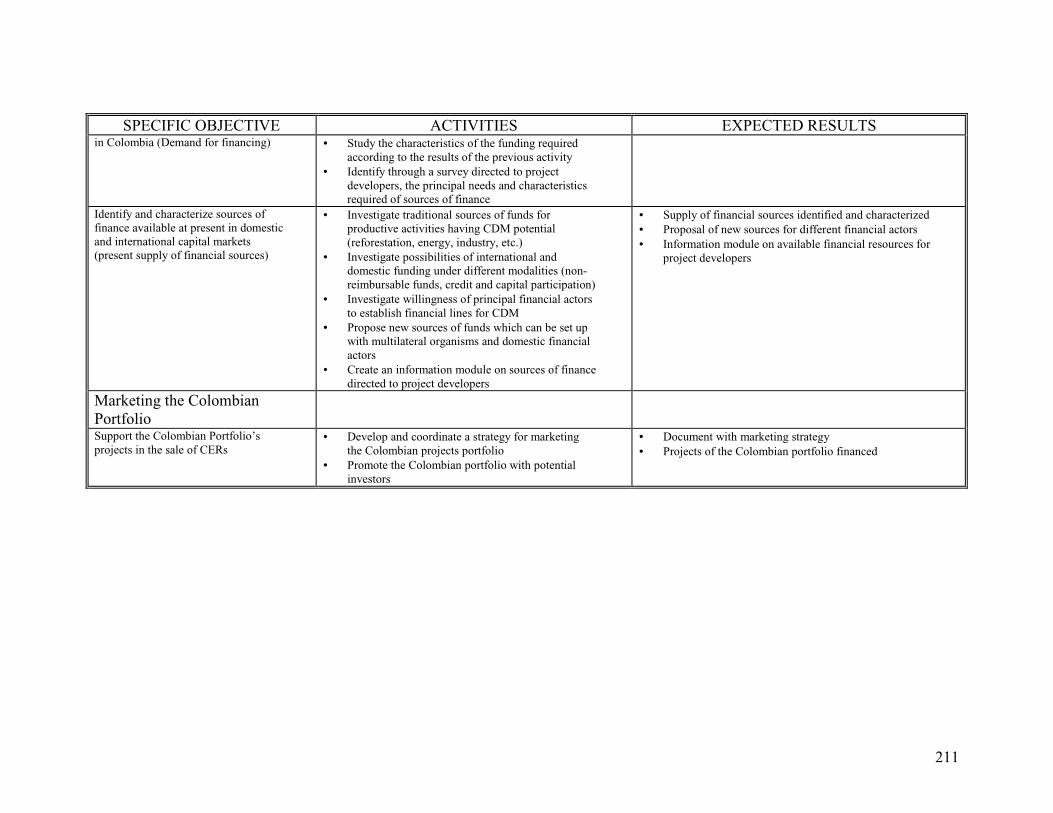
211
SPECIFIC OBJECTIVE ACTIVITIES EXPECTED RESULTSin Colombia (Demand for financing) • Study the characteristics of the funding required
according to the results of the previous activity• Identify through a survey directed to project
developers, the principal needs and characteristicsrequired of sources of finance
Identify and characterize sources offinance available at present in domesticand international capital markets(present supply of financial sources)
• Investigate traditional sources of funds forproductive activities having CDM potential(reforestation, energy, industry, etc.)
• Investigate possibilities of international anddomestic funding under different modalities (non-reimbursable funds, credit and capital participation)
• Investigate willingness of principal financial actorsto establish financial lines for CDM
• Propose new sources of funds which can be set upwith multilateral organisms and domestic financialactors
• Create an information module on sources of financedirected to project developers
• Supply of financial sources identified and characterized• Proposal of new sources for different financial actors• Information module on available financial resources for
project developers
Marketing the ColombianPortfolioSupport the Colombian Portfolio’sprojects in the sale of CERs
• Develop and coordinate a strategy for marketingthe Colombian projects portfolio
• Promote the Colombian portfolio with potentialinvestors
• Document with marketing strategy• Projects of the Colombian portfolio financed
212
7.7. Component 4: Support for Developing a VentureCapital Fund for Financing CDM Projects
Period of Execution: Phases II and I
JustificationAs mentioned in the previous component, an important limitation to the development ofCDM in Colombia is the scarcity of financial resources. Because of CDM projects’ specialcharacteristics, often the traditional sources of capital do not adapt to the particular needsand conditions of this type of project. Because of this, we initially identified the importanceof establishing a financial mechanism for venture capital investment adjusted to the needsand characteristics of many CDM projects. Similar schemes exist and operate in otherplaces, like the World Bank’s Prototype Carbon Fund. Thus, a fund of this nature will bethe first specialized financial alternative established to support the development of CDMprojects in Colombia. Later, additional alternatives will be sought, identified as a result ofthe work of Component 3.
An important point in this component is that this fund should become an attractiveinvestment option for different entities and institutions of the public and private sectors.Because of the general nature of such a fund, clearly the target market varies substantiallyin each case, and one pre-feasibility study will not answer the questions of another. Evenso, certain elements of the study being done will be useful for the pre-feasibility study forthe Venture Capital Fund for CDM projects. Recommendations on the fund’s optimalstructure, in legal aspects, arising from the study, could be applied to the CDM projects’fund. Part of the initial financial analysis is applicable to both funds. But market analysisdoes differ markedly, as do certain elements of the financial analysis, which might vary inresponse to the characteristics of the different types of projects to finance with each fund.
General ObjectivesTo constitute and begin operating a venture capital fund to finance CDM projects inColombia.
Approximate cost: $204,000 (first year)$156,800 (second year)
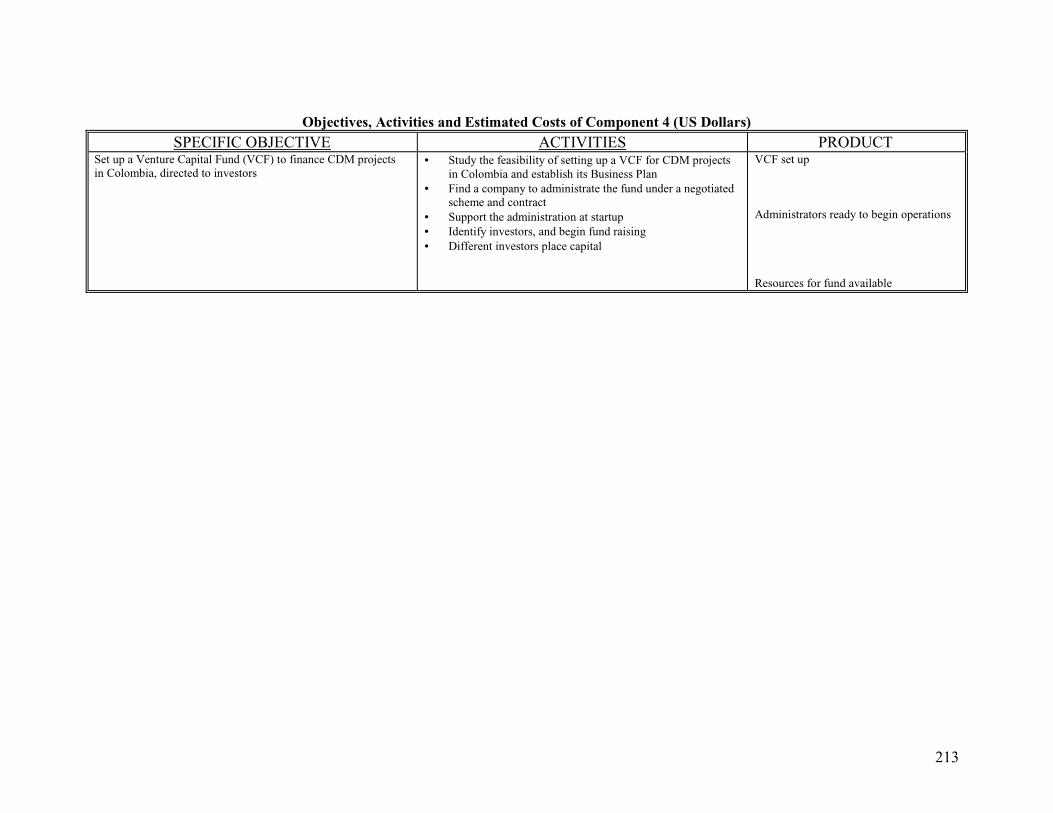
213
Objectives, Activities and Estimated Costs of Component 4 (US Dollars)SPECIFIC OBJECTIVE ACTIVITIES PRODUCT
Set up a Venture Capital Fund (VCF) to finance CDM projectsin Colombia, directed to investors
• Study the feasibility of setting up a VCF for CDM projectsin Colombia and establish its Business Plan
• Find a company to administrate the fund under a negotiatedscheme and contract
• Support the administration at startup• Identify investors, and begin fund raising• Different investors place capital
VCF set up
Administrators ready to begin operations
Resources for fund available
214
7.8. Component 5: Creation and Consolidation ofInstitutional Capacity to Manage CDM in Colombia
Period of Execution: Phase I
JustificationThe operation of CDM requires the country’s approval for projects presented to theFramework Convention, to become registered as CDM projects. To maximize the benefitsfor the country from participating in CDM, Colombia requires an efficient and effectivenational institution to approve and promote projects, organized under clear and simplecriteria and procedures, approving high-quality projects. As the NSS states, transactioncosts associated with project approval determine the success or failure of project-basedmarket schemes. Equally, to guarantee high-quality projects and a broad portfolio, theColombian portfolio must be marketed abroad, just as formulators inside the country mustbe trained.
During the first year, all necessary steps will be taken to build this institution and inparallel, others must assume these functions until the institution is up and running.
General ObjectiveTo set up and begin operating an institution to manage CDM in Colombia.
Approximate cost: $84,475
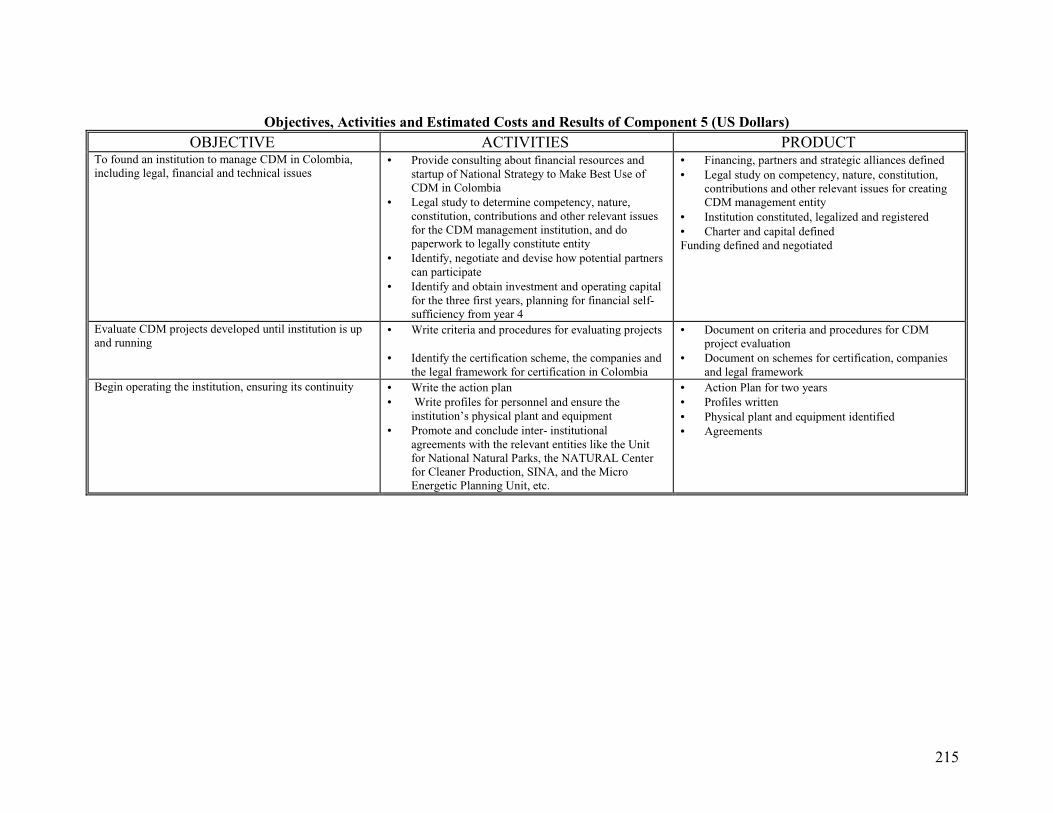
215
Objectives, Activities and Estimated Costs and Results of Component 5 (US Dollars)OBJECTIVE ACTIVITIES PRODUCT
To found an institution to manage CDM in Colombia,including legal, financial and technical issues
• Provide consulting about financial resources andstartup of National Strategy to Make Best Use ofCDM in Colombia
• Legal study to determine competency, nature,constitution, contributions and other relevant issuesfor the CDM management institution, and dopaperwork to legally constitute entity
• Identify, negotiate and devise how potential partnerscan participate
• Identify and obtain investment and operating capitalfor the three first years, planning for financial self-sufficiency from year 4
• Financing, partners and strategic alliances defined• Legal study on competency, nature, constitution,
contributions and other relevant issues for creatingCDM management entity
• Institution constituted, legalized and registered• Charter and capital definedFunding defined and negotiated
Evaluate CDM projects developed until institution is upand running
• Write criteria and procedures for evaluating projects
• Identify the certification scheme, the companies andthe legal framework for certification in Colombia
• Document on criteria and procedures for CDMproject evaluation
• Document on schemes for certification, companiesand legal framework
Begin operating the institution, ensuring its continuity • Write the action plan• Write profiles for personnel and ensure the
institution’s physical plant and equipment• Promote and conclude inter- institutional
agreements with the relevant entities like the Unitfor National Natural Parks, the NATURAL Centerfor Cleaner Production, SINA, and the MicroEnergetic Planning Unit, etc.
• Action Plan for two years• Profiles written• Physical plant and equipment identified• Agreements
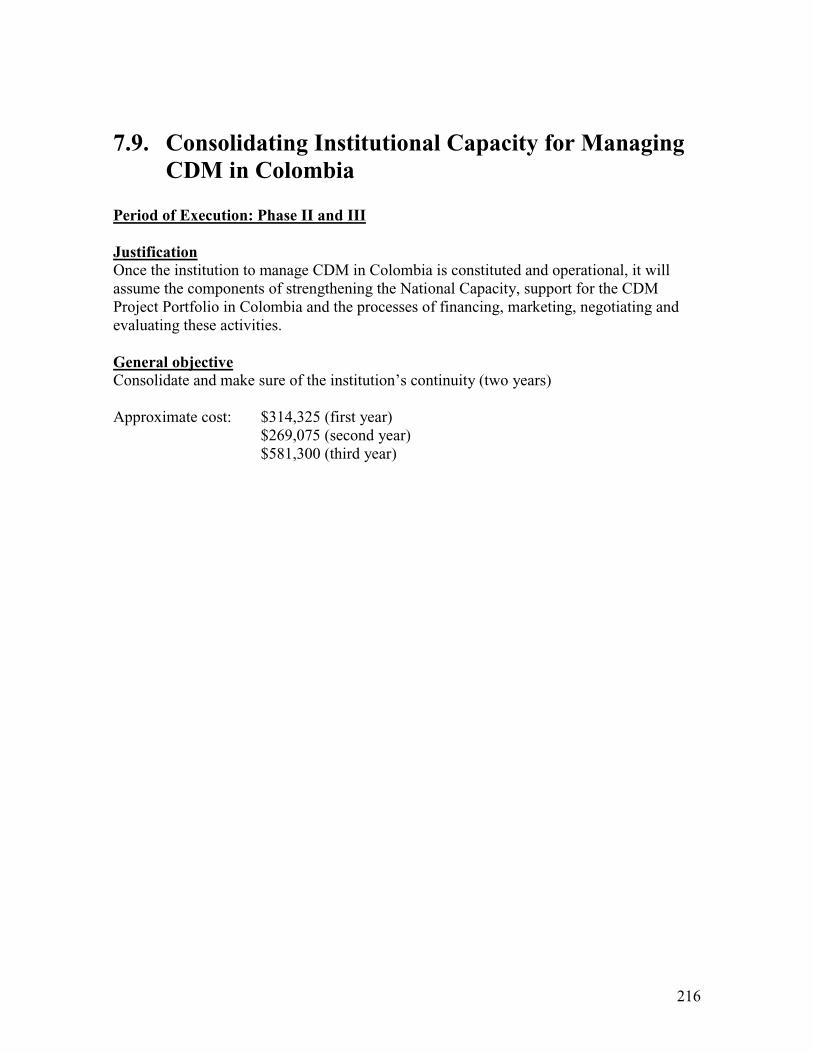
216
7.9. Consolidating Institutional Capacity for ManagingCDM in Colombia
Period of Execution: Phase II and III
JustificationOnce the institution to manage CDM in Colombia is constituted and operational, it willassume the components of strengthening the National Capacity, support for the CDMProject Portfolio in Colombia and the processes of financing, marketing, negotiating andevaluating these activities.
General objectiveConsolidate and make sure of the institution’s continuity (two years)
Approximate cost: $314,325 (first year)$269,075 (second year)$581,300 (third year)
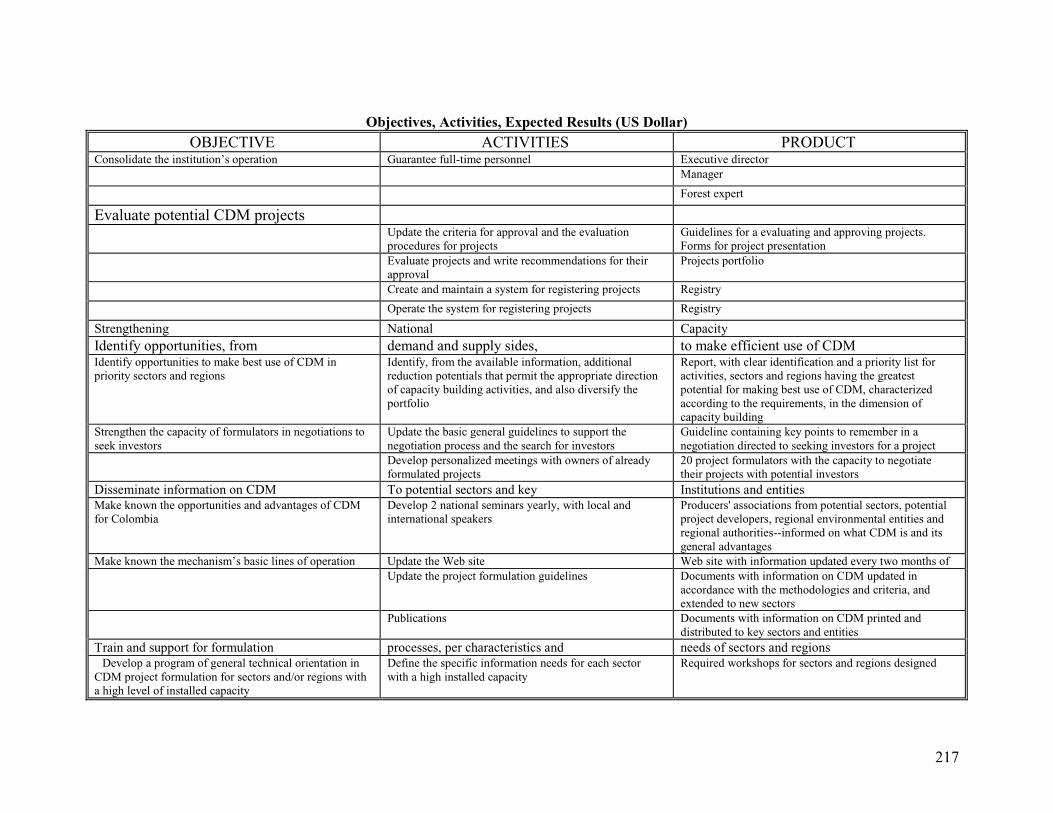
217
Objectives, Activities, Expected Results (US Dollar)OBJECTIVE ACTIVITIES PRODUCT
Consolidate the institution’s operation Guarantee full-time personnel Executive directorManager
Forest expert
Evaluate potential CDM projectsUpdate the criteria for approval and the evaluationprocedures for projects
Guidelines for a evaluating and approving projects.Forms for project presentation
Evaluate projects and write recommendations for theirapproval
Projects portfolio
Create and maintain a system for registering projects Registry
Operate the system for registering projects Registry
Strengthening National CapacityIdentify opportunities, from demand and supply sides, to make efficient use of CDMIdentify opportunities to make best use of CDM inpriority sectors and regions
Identify, from the available information, additionalreduction potentials that permit the appropriate directionof capacity building activities, and also diversify theportfolio
Report, with clear identification and a priority list foractivities, sectors and regions having the greatestpotential for making best use of CDM, characterizedaccording to the requirements, in the dimension ofcapacity building
Strengthen the capacity of formulators in negotiations toseek investors
Update the basic general guidelines to support thenegotiation process and the search for investors
Guideline containing key points to remember in anegotiation directed to seeking investors for a project
Develop personalized meetings with owners of alreadyformulated projects
20 project formulators with the capacity to negotiatetheir projects with potential investors
Disseminate information on CDM To potential sectors and key Institutions and entitiesMake known the opportunities and advantages of CDMfor Colombia
Develop 2 national seminars yearly, with local andinternational speakers
Producers' associations from potential sectors, potentialproject developers, regional environmental entities andregional authorities--informed on what CDM is and itsgeneral advantages
Make known the mechanism’s basic lines of operation Update the Web site Web site with information updated every two months ofUpdate the project formulation guidelines Documents with information on CDM updated in
accordance with the methodologies and criteria, andextended to new sectors
Publications Documents with information on CDM printed anddistributed to key sectors and entities
Train and support for formulation processes, per characteristics and needs of sectors and regionsDevelop a program of general technical orientation inCDM project formulation for sectors and/or regions witha high level of installed capacity
Define the specific information needs for each sectorwith a high installed capacity
Required workshops for sectors and regions designed
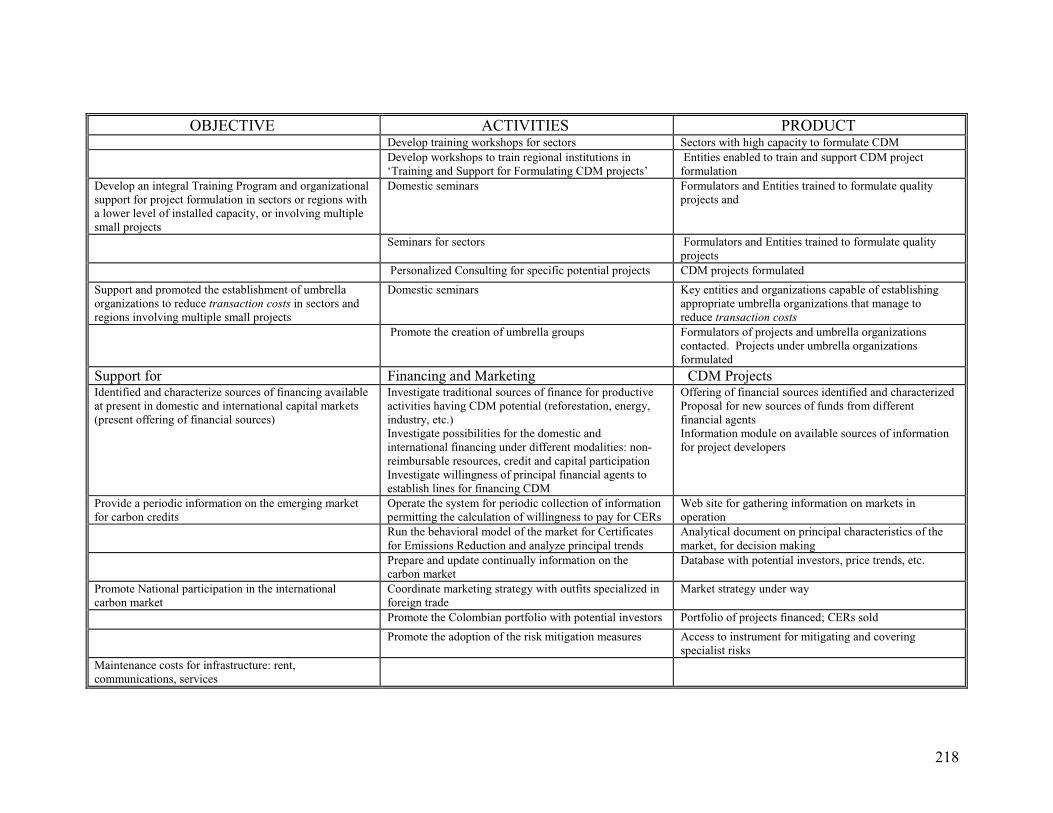
218
OBJECTIVE ACTIVITIES PRODUCTDevelop training workshops for sectors Sectors with high capacity to formulate CDMDevelop workshops to train regional institutions in‘Training and Support for Formulating CDM projects’
Entities enabled to train and support CDM projectformulation
Develop an integral Training Program and organizationalsupport for project formulation in sectors or regions witha lower level of installed capacity, or involving multiplesmall projects
Domestic seminars Formulators and Entities trained to formulate qualityprojects and
Seminars for sectors Formulators and Entities trained to formulate qualityprojects
Personalized Consulting for specific potential projects CDM projects formulated
Support and promoted the establishment of umbrellaorganizations to reduce transaction costs in sectors andregions involving multiple small projects
Domestic seminars Key entities and organizations capable of establishingappropriate umbrella organizations that manage toreduce transaction costs
Promote the creation of umbrella groups Formulators of projects and umbrella organizationscontacted. Projects under umbrella organizationsformulated
Support for Financing and Marketing CDM ProjectsIdentified and characterize sources of financing availableat present in domestic and international capital markets(present offering of financial sources)
Investigate traditional sources of finance for productiveactivities having CDM potential (reforestation, energy,industry, etc.)Investigate possibilities for the domestic andinternational financing under different modalities: non-reimbursable resources, credit and capital participationInvestigate willingness of principal financial agents toestablish lines for financing CDM
Offering of financial sources identified and characterizedProposal for new sources of funds from differentfinancial agentsInformation module on available sources of informationfor project developers
Provide a periodic information on the emerging marketfor carbon credits
Operate the system for periodic collection of informationpermitting the calculation of willingness to pay for CERs
Web site for gathering information on markets inoperation
Run the behavioral model of the market for Certificatesfor Emissions Reduction and analyze principal trends
Analytical document on principal characteristics of themarket, for decision making
Prepare and update continually information on thecarbon market
Database with potential investors, price trends, etc.
Promote National participation in the internationalcarbon market
Coordinate marketing strategy with outfits specialized inforeign trade
Market strategy under way
Promote the Colombian portfolio with potential investors Portfolio of projects financed; CERs sold
Promote the adoption of the risk mitigation measures Access to instrument for mitigating and coveringspecialist risks
Maintenance costs for infrastructure: rent,communications, services
219
8.Executive Summaries of the Project Portfolio
8.1. Conservation of Natural Forests under Threat intheTinigua Park and La Macarena
Project presented by the Asociación Campesina Ambiental de los Parques Tinugua y LaMacarena, to qualify for the Clean Development Mechanism of the Kyoto Protocol.
The present project is part of 10 projects proposed for the Colombian CDM Portfolio, coveringan area belonging to the Amazon and Orinoco systems, representing a large region of thecountry. The conditions and characteristics of the place (3 natural national parks) present thenecessary conditions for a proposal of this nature, because for conserving and protecting thearea, it is necessary to seek out economic alternatives for the community presently living in theregion, and change the present systems of agriculture and livestock raising, characterized bytheir harmful environmental effects. The important role of Tinugua Park as a biologicalcorridor between the Picacho and La Macarena parks, makes an immediate solution for itsconservation and viability imperative.
The project was conceived initially to last 30 years but, given the attributes of economic,environmental and social sustainability of the design, we can expect further extensions both inthe area of influence (including the entire Tinugua Park and the special management area of LaMacarena) and in the project’s duration.
The principal problem seen in the area of the project (Tinigua National Natural Park and thesector bordering on La Macarena Park) is selective intervention of the natural forest (rainforest)and second, the establishment--tending to increase--of on-the-range cattle, and coca cultivation.In the 52,000 hectares that are part of the project's area, this situation has reached criticalproportions. The processes of selective intervention of forests and cattle are advancing close tothe rivers (High and Mid Guayabero, Duda and Guaduas), that are also the main areas ofhuman settlement.
The present situation of Tinugua and La Macarena shows that inside the limits of the parks,there lives a population that uses and exerts pressures on the natural forest, and in consequenceendangers the ecosystem and biodiversity.
The transformation of these present agricultural and livestock productive systems that areunsustainable, moving toward systems with mixed forest and pasture, mixed agriculture andforest, forests and the managed natural forests, all of which will make it possible to conservesystems and develop the soil, conserve and incorporate the regional biodiversity into productivesystems, protect and improve the use of water resources, and sequester and store significantquantities of carbon from the atmosphere. In addition, these positive impacts will lead to a
220
higher valuation of natural and planted forests, as important capital, and to the diversificationof regional production and an increase in family income.
With the project we expect to protect 48,650 hectares to provide environmental services, toreconvert 3,350 hectares of agricultural and cattle production to forest systems (150 hectares),agriculture and forests (700 hectares) and forest and pasture (2,500 hectare). The activities tobe executed are: training and technology transference, use of renewable energy sources, landdeeds and the establishment of a pilot technological farm with integral functions such assupplying the communities’ basic economic needs, encouraging research with a study centerfor wood products, non-wood products and other economic alternatives like the management ofnative fauna species, and educate in matters related to the environment and the community. Inparallel, there will be a series of collateral benefits leading to an improvement in the standardof living of the local population, with their active participation in conserving in the parks.
With regard to CO2 emissions, the project's expected results are:a) To sequester 558,057 t of CO2 on 3,350 hectares of land and multiple purpose forestplantation, and also on 2,980 hectares of land devoted to the natural regeneration of thevegetation, during 30 years.
b) Reduce 14,592,382 t of CO2 on 45,670 ha of natural forest and decrease the consumptionof firewood through efficient cooking, during 30 years.
c) To substitute 138,987 t of CO2 emissions in 30 years, through substituting solar panels forgasoline electric generators.
The community living in the area, aware that they are direct actors in this project’s execution,will channel all of their actions of environmental commitment through the organization theycreated themselves: the Asociación Campesina Ambiental de los Parques Tinigua y LaMacarena (ACATM, executive agency), which will offer them necessary support to be toassimilate the change in mentality and techniques that are required. The activities to bedeveloped will be coordinated with the institutions representing the Unidad EspecialAdministrativa del Sistema de Parques Nacionales (National Parks Managing Unit), and otherentities present in the area.
8.2. Conservation and Restoration of Forests in the MidAtrato, in the Colombian Pacific
Project presented by the Consejo Comunitario Mayor del Medio Atrato—ACIA, tobenefit from the Kyoto Protocol’s Clean Development Mechanism.
The present project for conservation and restoration of forests in the Mid Atrato under theframework of the Clean Development Mechanism, was formulated by the ConsejoComunitario Mayor del Medio Atrato, the Instituto de Investigaciones Ambientales del Pacificoand the consulting team on forests.
The executor of this project will be the Consejo Comunitario Mayor del Medio Atrato, ownerof the collective property rights of the project area (865,000 ha) and the project area (95,000
221
ha). The Instituto de Investigaciones Ambientales del Pacifico will be co-executor of theproject and will also have the support of the Corporacion Autonoma para el DesarrolloSostenible del Choco—CODECHOCO. We also expect the participation of universities,territorial entities among others. To administrate the project we will create a structure to permitthe direct participation of the owners of the territory, but one also guaranteeing an optimaltechnical level and favoring low transactions costs.
The Mid Atrato is a region inhabited by 8,000 African Colombian families is (in the systemarea) a; this region is bordered on the west and part of the east with Native Colombianreservations; at the north lies the region of the Lower Atrato (intensive forest and cattleproduction) and to the south is Quibdo, in the capital, with growing demand for naturalresources.
The Mid Atrato is a region characterized by rainforest and very humid rainforest, with rainfallbetween 4,000 and 10,000 mm Yearly, an average temperature of 26 degrees C. and relativehumidity of 94.6%. The area is rich in biodiversity and native species (262 species with morethan 2.5 cm of diameter on 0.1 hectare, Gentry 1968) and was considered by the Biopacific-GEF Project as the Colombian Pacific district having the highest priority for the conservationof biodiversity.
The region’s wealth resides in its ample environmental resources, in water, forest canopy andbiodiversity.
Principal economic activities in the Mid Atrato region are itinerant agriculture, mining, fishing,woodcutting, hunting and gathering forest products. While African Colombian communitiesare mostly devoted to artisanal forms of these activities, increasingly, activity involves theintensive and inappropriate exploitation of timber, on-the-range cattle operations, large-scalemining—all of which endanger Mid Atrato forests (deforestation stands at 0.55% yearly,according to IGAC 1998; 99% of the landscape will change in 13 years, according to Casas1998); adding to these threats, we note the under-valuation of environmental impacts frominfrastructure mega-projects designed for the region and intensive lumber operations as well ason-the-range cattle operations in neighboring areas.
The project’s duration is 25 years and its intention is to contribute especially to sustainabledevelopment in the Mid Atrato basin, capturing and preventing GG emissions and contributingin general to the development of the biological and geographical region of Choco.
To achieve this objective, the project plans to implement conservation programs, sustainableforest management, tree-based energy production and reforestation of 93,500 ha, with thefollowing specific objectives:
• Establish appropriate management for 60,000 ha of community forest devoted toCivilian Society Reserves
• Establish sustainable harvesting of certified tropical woods on 20,000 ha of naturalforests on low hills
• Generate 10 MW from bio-diesel fuel produced on 3,500 ha that can be reforested
222
• Establish, on 10,000 ha of degraded land, forest and mixed forest and agriculturalsystems.
Regarding the CDM objectives, the program will try to obtain:• The prevention of emissions of 12,936,887 t of CO2 on 60,000 conserved ha offorest, 20,000 ha of managed natural forest and by substituting 8,000 wood-firedhearths for high-efficiency wood stoves
• Fix 3,661,690 t of CO2 on 13,500 ha of forest plantations• Substitute emissions of 193,636 t of CO2 from burning fossil fuels.
The project is directed to mitigating and countering the trend toward destroying the forest (14%in 25 years) and lowering this to 1% yearly, with a positive differential in captured CO2 andpreventing emissions through direct action. The program will work with the actors of theforest’s problems (owners and others), providing a higher standard of living for the localpopulation.
Sustainable management of the forest, through alternative clean technologies, will makepossible to garner better benefits from the forest without decreasing its average stored CO2 andinstead increasing it. In this manner, it will be possible to sequester in an organized way, asmall positive differential in fixed CO2.
In addition, to the previous points, the project seeks to sequester CO2 by repopulating the forestthrough pure or mixed (forest and agriculture) reforestation. In the without- project scenario,this will not happen.
CO2 emissions substitution will work through changing fossil fuels for green fuel (bio-diesel)and in consequence we will generate more KWh with smaller CO2 emissions, with higherefficiency.
Finally, decreasing the consumption of firewood will guarantee a smaller volume of woodextracted from the forest from this use, by distributing efficient stoves to 8,000 families.
As collateral benefits, we foresee an improvement in median monthly income for ruralproducers, gradual capital formation, the transformation of raw materials, added value,employment and placing competitive agricultural products in markets, reinvestment of capitalin the region, gradual transition of productive systems or present social and politicalarrangements toward new and more efficient and effective ways of acting.
223
8.3. Management of Forests, Forest Systems, Agro-Forestsand Tree-driven Energy for Economic, Social andEnvironmental Optimization of Land use in Calamar,Colombian Amazon
Project presented by the Asociacion Colombiana de Reforestadores e Industriales de laMadera—ACOFORE and Calamar Municipality to benefit from the Kyoto Protocol’s CleanDevelopment Mechanism.
This project intends to generate opportunities and immediate benefits for all the inhabitants andlocal producers of Calamar, located in Guaviare Department in northwest Amazonia.
The project’s initial duration is 25 years, but due to its design attributes of economic,environmental and social sustainability, we expect a future extension, in both area and duration.
The transformation of present and unsustainable agricultural and cattle operations to mixedforest and pasture, agriculture and forest, forest and natural managed forest systems—theproject’s goal—will make it possible to conserve and develop the land and soil, conserve andincorporate the region’s biodiversity into production, protect and better use water resources,and sequester significant CO2 from the atmosphere. In addition, its impacts will lead to avaluation of natural forests and plantations as an important asset, and also to diversifyingregional production and increasing family income.
On the other hand, the project intends to use fuels from forest biomass planted on degradedareas to generate power and, among others: a) substitute expensive fossil fuels trucked in fromdistant places, benefiting local trade, b) rehabilitate land affected by erosion, c) add value toagriculture and livestock operations and d) improve management of CO2 emissions.
The above-mentioned impacts will shore up processes of real coca substitution, pacificationand the consolidation of a style of development that is harmonious with the biophysical,geopolitical and cultural conditions in the region.
First, the project will gradually adopt the more appropriate technologies for zoning theproductive areas under a territorial ordering framework. Second, appropriate technology willbe used to classify the forest, set up mixed forest and pasture, and agriculture and forestsystems, creating self-managed units for viable forest and mixed production, with marketingfacilities. The project emphasizes forest species suitable for lumber and non-wood products,and also environmental services. Third, there will be continual transparent follow-up andevaluation and also clear and reliable certification for the sustainable origin and quality ofproducts and services.
In terms of the CO2 emissions balance, expected results from the project are:a) To sequester 3,915,944 t of CO2 on 15,350 ha of forest plantations, during 25 years;b) Substitute 216,206 t of CO2 from burning fossil fuels, during 25 years;c) Reduce 30,880,340 t of CO2 by preserving 100,000 ha of natural forest.
224
The project will be executed by the Asociacion Colombiana de Reforestadores e Industrialesde la Madera—ACOFORE and the institutions, authorities and citizens of CalamarMunicipality.
8.4. Conservation, Restoration and Management of theBiological Corridor ‘Purace National Park’ and‘Cueva de los Guacharos’ National Park, in SouthernHuila Department
Project presented by the Corporacion Autonoma Regional del Alto Magdalena—CAM--and theAsociacion de Grupos Ecologicos y Cabildos Verdes ALTO YUMA, to benefit from the KyotoProtocol’s Clean Development Mechanism.
This project intends to generate immediate benefits and opportunities for all the inhabitants andrural producers of the municipalities of San Agustin, Pitalito, Palestina and Acevedo, located inthe south of Huila Department in theMacizo Colombiano.
The project’s initial duration is 30 years, but due to its design attributes of economic,environmental and social sustainability, we expect a future extension, in both area and duration.
The transformation of present and unsustainable agricultural and cattle operations to mixedforest and pasture, agriculture and forest, forest and natural managed forest systems—theproject’s goal—will make it possible to conserve and develop the land and soil, conserve andincorporate the region’s biodiversity into production, protect and better use water resources,and sequester significant CO2 from the atmosphere. In addition, its impacts will lead to avaluation of natural forests and plantations as an important asset, and also to diversifyingregional production and increasing family income.
The above noted impacts will help us to shore up processes of real substitution of the illicitdrug economy (opium poppy), and also those of pacification and consolidation of adevelopment model that maintains harmony with the physical, geopolitical and culturalconditions in the region.
First, the project will gradually adopt the more appropriate technologies for zoning theproductive areas under a territorial ordering framework. Second, appropriate technology willbe used to classify the forest, set up mixed forest and pasture, and agriculture and forestsystems, creating self-managed units for viable forest and mixed production, with marketingfacilities. The project emphasizes forest species suitable for lumber and non-wood products,and also environmental services. Third, there will be continual transparent follow-up andevaluation and also clear and reliable certification for the sustainable origin and quality ofproducts and services.
225
The environmental authority of Huila Department, the Corporacion Autonoma Regional delAlto Magdalena-- responsible for the present project-- in its concern to search for an alternativeto support sustainable development in areas where a social and environmental conflicts aregrowing day by day, has formulated this project to be be executed by the Asociacion de GruposEcologicos y Cabildos Verdes ALTO YUMA, which represents ecological groups andindigenous Native Colombian governments in the South of Huila Department before stateentities and NGOs at the regional, and national and international levels. The project area islocated in the Gran Macizo Colombiano, the area where of the three Andean Cordilleras meet.This area was declared a Reserve of the World Biosphere in January 1980; this great ecosystemis made up of the three Natural National Parks: Purace, Nevado del Huila and Cueva de losGuacharos. From the Colombian Macizo in Huila, with 853,000 ha, a corridor joining thepresent Purace Park with Cueva de los Guacharos was chosen. This corridor, which we call theBiological Corridor, covers 84,465 ha. The project’s area of influence is the total area of thefour municipalities, 298,644 ha.
The project area will be a transit corridor for flora and fauna through different zones, a vitallyimportant ecosystem at this time suffering 3,77% deforestation, which indicates that this areawill disappear within the duration of the project. Its importance resides not only in itsbiodiversity and great beauty but also in the quality and quantity of its water resources, amongwhich the most important is the Magdalena River, but there are also other important riversystems upon which human populations depend, such as the Guarapas (Palestina), Guachicos(Pitalito), Quebradas el Quebradon (San Agustin), and also reserved areas with the sources ofother important rivers—Naranjos, Balseros and Granadillos.
In terms of CO2 emissions, the project's expected results are:• To sequester 6,553,732 t of CO2 on 25,916 hectares of forest plantations and mixedagricultural and forest, and forest and pasture systems, during 30 years
• To reduce 17,977,104 t of CO2 from the management of 6,661 hectares and theconservation of 51,829 hectares of natural forests.
8.5. Contribution to Mitigating Climate Change throughForest Development in the Region of the Paramo deGuerrero, by the CAR
Project presented by the Corporacion Autonoma Regional de Cundinamarca—CAR, to benefitfrom the Kyoto Protocol’s Clean Development Mechanism.
The paramos, or Andean highlands, are a world apart, full of mist, light rain and cloudsadhered to rock and earth and plants; they are complex high mountain systems above the upperlimit of Andean forests. From functional, biological and geographical, and social points ofview, the highlands are considered strategic ecosystems, principally because of their greatpotential to store and regulate water. No doubt, their conservation is vital for water, andeconomic development. From a cultural standpoint, these areas have played an important rolein the relationship between man and the mountain--as sacred places of great value, living inmyths and legends.
226
The highlands are extremely vulnerable to the effects of human action, and because of this Law99 of 1993 established that they are areas of special protection, including highlands, lowerhighlands, water sources and the recharge zones of aquifers. The Ministry of the Environmentand regional environmental authorities are regulating their protection and sustainable use.However, despite the conservation programs regional authorities and municipalities have beendeveloping to maintain vegetation cover in the highlands, the high areas vital to waterproduction and flow have been deforested of their relicts of native vegetation due to an increasein agriculture, livestock, and mining. Because of this, it is necessary to develop strongerprograms to guarantee the area’s sustainability. To this end, we intend to develop the project“Contribution to the Mitigation of Climate Change and Forest Development in the Region ofParamo de Guerrero”, with the Regional Authority, CAR, as the executive agency. Theobjective is to conserve and manage and sustainably develop in a viable way, the complex riversystem of the Guerrero highland area, because of its strategic importance for water, society andthe environment in the regions of Ubate and the western Bogota Savannah.
The project is located in Cundinamarca Department (Colombia) in the area of jurisdiction ofthe CAR—Corporacion Autonoma Regional de Cundinamarca. This project lies in the area ofthe Zipaquira and Ubate Regional Office and the municipalities of Zipaquira, Cogua, Tausa andCarmen de Carupa. The project covers an area of 13,050 hectares and its area of influence isthe entire highland of 23,500 hectares in the above-mentioned municipalities. The GuerreroHighland lies between 3,200 m above sea level and at 3,650 m above sea level in the Loma dela Caldera, in the northern part of the area.
The project’s execution is planned for a period of 25 years, to conserve 5,050 hectares of thehighland under severe threat from agriculture, livestock and mining. The project guarantees torestore vegetation on 6,000 hectares of land now degraded through unsustainable activities andreconvert 2,000 hectares of agricultural and livestock production land to forest, agriculture andforest, and forest and pasture systems.
The Regional Environmental Authority, CAR, a public entity with its own patrimony andindependence, is legally empowered to administer the area, the environment and the renewablenatural resources, and will act as a leader in the region's sustainable development, inaccordance with national policy. However, the project will negotiate agreements with thepotato growers and the owners of livestock to guarantee the achievement and permanence ofthe project objectives. In addition other institutions like the municipal and technicalagricultural technical units, UMATA, and the mayors' offices of the four municipalities wherethe project is located, will also provide assistance; training and technology transfer activitieswill engage the active participation of the area’s farming community in general.
In this way, we expect that when the project ends there will be 5,050 hectares of the GuerreroHighland properly conserved and protected from the pressure exerted by the increase oftraditional agriculture and livestock activities; we also expect to have restored ecologically6,000 hectares of highland ecosystems by favoring the processes of natural succession; finally2,000 hectares of land with traditional agricultural and livestock systems will be converted toforest, agriculture and forest, and forest and pasture systems.
227
We expect the project to generate in the community a culture of conservation and protection ofthe ecosystem, involving people in the appropriate management of the highland area andtraining them in the management of improved agricultural and forest systems, in marketing,improving their products and income to reduce the pressure of traditional activities on thisecosystem. At the same time whe will have guaranteed in quantitative and qualitative terms theprotection of water resources feeding into the lakes of Hato and Neusa, which provide drinkingwater to Bogota and other smaller centers to in the region.
In a CDM in terms, the expected results are:• To capture 587,661 t of CO2 on 5,050 hectares of highland• To sequester 728,464 t of CO2 on 6,000 hectares through natural regeneration of thevegetation, and on 2,000 and hectares of reconverting land, with forest and agricultural andforest systems.
8.6. Establishing, Restoring and Conserving Rainforestand Andean Forests to Capture GG on the Meseta deBucaramanga, CDMB Jurisdiction
Project presented by the Corporacion Autonoma Regional para la Defensa de la Meseta deBucaramanga—CDMB, to benefit from the Kyoto Protocol’s Clean Development Mechanism.
The corporation was charged from 1981 with the management and ordering of the region of theupper basin of the Lebrija River. Under Law 99, after 1993 the Corporation’s jurisdiction wasextended to another 300,000 ha, for a total of 486,360 ha. The new area the CDMB received ischaracterized by complex social problems (with both guerillas and paramilitaries), which isalso being used for unsustainable agricultural and livestock operations; in certain areas, theland is virtually abandoned by its owners.
With this situation and the corporation's limited resources for investing in the short and mediumterms, CDM appears as an additional source of income to implement programs to recoverdegraded areas and conserve strategic environmental areas that are being severely threatened bythe unsustainable anthropic activities of human beings. We consider it necessary, then, toexecute a project in the north east of Santander Department, to establish, restore and conserveforest ecosystems for the purpose of maintaining the environmental basis for the region's socialand economic development, and as a contribution to stabilizing greenhouse gases.
The project covers of the municipalities of Giron, Lebrija, Rionegro and El Playon in the areaof jurisdiction of this regional environmental authority, the Corporacion Autonoma Regionalpara la Defensa de la Meseta de Bucaramanga—CDMB. It lies about 70 km from thedepartmental capital, Bucaramanga.
The without-project scenario will lead to critical conditions in the long run, principally becauseof on-the-range cattle operations, which now cover 34,644 hectares. If current trends continue,
228
we expect that in the next 25 years a further 10,500 hectares of forest already under threat and8,500 hectares of natural forest in good condition will also be destroyed.
We estimate that the project will conserve in 25 years 20,000 hectares of natural forest undersevere threat, preserving and protecting biodiversity and eco-systemic equilibrium. We expectto protect 2,000 hectares of land degraded by the inadequate exploitation of the forest andinappropriate agricultural and livestock activities, permitting natural regeneration. We expectto establish and manage 10,000 hectares of protected forest, with appropriate exploitation;2,000 hectares of systems for agriculture and forests and 3,000 hectares of systems for forestand pasture, on land presently degraded by itinerant agriculture and on-the-range cattleoperations. For these purposes, we intend to purchase 5,000 hectares of land presently coveredby low bush, with the presence of on-the-range agriculture and severely threatened naturalforests.
NGOs, community organizations, local community action boards, farmers’ associations,producers associations and local water boards, with the technical and administrative advice ofthe CDMB will execute the project.
The Corporation will develop a methodology based on the following activities: 1) Involving thelocal communities and rural landowners with the project’s execution; 2) Formulating andimplementing a large-scale reforestation program to capture CO2 and offer sustainable goodsand services; 3) Preserving and managing natural forests and their biodiversity; 4) Creating andstrengthening a system for protecting the forest; 5) Concluding agreements with landowners forthe creation of reserved areas for civil society in a segment of each of the properties involved inthe program, and 6) Consolidating inter-institutional coordination for effective management ofthe program, including CDMB, NGOs, private enterprise and all actors involved in any waywith this project.
In this sense, we expect at the end of the project to have conserved and managed in asustainable way 20,000 hectares of natural forests and plantations, to have recovered 2,000hectares of degraded land, with another 2,000 hectares of degraded land recovered through thenatural regeneration of vegetation. In addition, 15,000 hectares will be reforested, of which5,000 were purchased, with protecting forest--with production and agriculture and forest, andforest and pasture systems, in areas previously lacking vegetation and with a trend towarddegradation.
In addition, there will be a decrease in the extraction of timber and burning the underbrush,which have been cultural practices in local agriculture. The pressure on the area's existingnatural forests will decrease, because besides providing education for environmentalawareness, communities in the project's area of influence will have a higher standard of livingand better job opportunities locally, guaranteeing in this manner the rational use, managementand economic exploitation of natural resources, and in a certain measure, countering migrationof the rural population to urban areas.
With regard to the Clean Development Mechanism:
229
• To sequester 3,001,727 t of CO2 on 15,000 hectares of forest plantations and agricultureand forest, and forest and pasture systems, and on 2,000 hectares where the vegetation willregenerate naturally, during 25 years
• To reduce the 4,406,403 t of CO2 by conserving and managing 20,000 hectares of naturalforests.
8.7. Conversion of Land Used for On-the-range Cattle andItinerant Agriculture to Forests, Agriculture andForest, and Forest and Pasture Systems for RuralProduction and Power Generation in Puerto Carreño,Colombian Orinoco
Project presented by the Governor’s office of Vichada Department, to benefit from the KyotoProtocol’s Clean Development Mechanism.
Vichada Department, located in eastern Colombia, has strong potential for developingattractive economic alternatives for rural producers, to develop this region’s potential to placeproducts on domestic and international markets. The project for the municipality of PuertoCarreño has the basic objective of transforming the present productive systems—that is, on-the-range cattle and itinerant agriculture--into systems based on forest plantations, agriculture andforests, and forest and pasture, all of which will make it possible to generate collateraleconomic, social, political and environmental benefits for this region of the country.
The project will first endeavor to reconvert 18,000 hectares presently used for on-the-rangecattle and itinerant agriculture into forest plantations, agriculture and forests, and forest andpasture, in a 25-year period. The second goal is to conserve, preserve and use in a sustainablemanner 25,000 hectares, the relicts of natural forests, and eliminate seasonal burning activitieson grassland covering 18,000 hectares, presently used for on-the-range cattle operations. Onthe other hand, the project intends to use forest biomass fuel from trees planted on degradedareas (due to the overuse of grass and burning), to generate 3MW and also to: a) improve localcommercial conditions by avoiding having to truck in costly fossil fuels from faraway regions;b) rehabilitate land affected by erosion; c) add value to agricultural and livestock production; d)improve the management of CO2 emissions.
The strategies we envisage include concluding equitable strategic alliances between differentactors and sectors, to develop the region. This will involve organizing and creating theappropriate institutions for processing and marketing products and services, and for businessdevelopment; it will also involve training personnel to conduct and conclude the process ofterritorial ordering and one for zoning the use of land in individual productive units, andadopting and developing appropriate technology for agricultural and livestock production andthe management of natural resources. In particular, we see the importance of incorporatingproper practices and forest management into agricultural and livestock production, to inducemulti-functional land use, also including the provision of public and environmental services.
230
Forest resources must also be used to rehabilitate and develop soil and land, to producerenewable energy, adding further value to agricultural and livestock production. The existingrelation between jobs and the area of production must also be improved. A system for thecertification of products and services must be developed. Domestic and international marketsinterested in sustainable products and services must be developed. Rural producers must begiven the appropriate technical alternatives to prevent the use of burning as a tool for managingweeds and grassland.
The proponent and responsible entity for this project is the Office of the Governor of VichadaDepartment and the executive entity will be the Environmental Authority CORPOICA,Regional Office No. 8, where the project’s executive director and working team will be located.An executive committee will be created to direct the project and a consulting technicalcommittee will support and provide technical advice to the executive, the organization and therural producers who will participate in the project.
In terms of the balance of CO2 emissions, the project's expected results are:
a) To sequester 1,062,600 t of CO2 on 18,000 ha. of forest plantation, during 25 years;b) To substitute 190,767 t of CO2 from burning fossil fuels, during 25 years;c) c) To reduce 3,780,500 t of CO2 from conserving 25,000 ha. with natural forests.
8.8. Recovery and Integrated Management of Ecosystemsto Conserve Biodiversity and Implement the CleanDevelopment Mechanism in Uraba
Project presented by the Corporacion Autonoma para el Desarrollo Sostenible de Uraba--CORPOURABA, to benefit from the Kyoto Protocol’s Clean Development Mechanism.
In the Abibe Range, at the extreme north of the Colombian Western Cordillera, there are forestswith high biodiversity indexes that are under severe threat because of the expansion of theagricultural frontier and the unsustainable extraction of wood as a raw material for agriculturaland agro-industrial activities. Equally, forest wetlands or forests on floodplains—globallyimportant ecosystems--dominated by the Cativo species (Prioria Copaifera), of which less than10% remain. The area’s mangroves are also severely degraded from different unsustainableactivities of the human inhabitants. All this makes it imperative to promote programs and set upeconomic and social instruments to maintain the environment and preserve and increase forestreserves, through establishing new plantations, mixed agriculture and forest, and forest andpasture systems, and manage secondary forests and succession.
Because of all this, and in light of the magnitude of these problems and the limited resourcesavailable to apply solutions, the Corporacion Autonoma para el Desarrollo Sostenible deUraba, CORPOURABA, sees in CDM a complementary source of financial resources for theimplementation of forest projects that generate environmental benefits and contribute to moresustainable rural development in the region. To this end, we designed the Project for the
231
Integrated Management and Recovery of Ecosystems, the Conservation of Biodiversity andImplementation of the Clean Development Mechanism in Uraba. The project’s generalobjectives are to order, recover and manage in a sustainable manner the strategic forested land,developing sustainable goods and services, and preserving biodiversity in central Uraba (574,900 ha.), part of Antioquia Department in the municipalities of Apartado, Carepa, Chigorodo,Muatata and Turbo .
The project’s duration is 30 years, covering a total area of 150,000 ha, and will conserve andmanage 8,000 ha. of relict Cativo forest, 5,000 ha. of mangroves, 45,000 ha. of wetlands andforested wetlands and 52,000 ha. of rainforest in the Abibe Range, for a total of 110,000 ha. ofthreatened rainforest, including the establishment of 10,000 ha. of plantations, to protect, createsustainable goods and services in the river basins, and 15,000 ha. of mixed agriculture andforest, and forest and pasture systems, for sustainable development and conservation. Otheractivities include the natural regeneration of vegetation on 15,000 of degraded forest andfinally, decreasing pressure on natural forests through the extraction of fire-wood, by replacing1,500 unsustainable hearths with efficient stoves.
Through the Sociedad Promotora Forestal De Uraba—Proforest, a regional and legally-constituted entity, we will implement the strategy for promoting sustainable forest programsand create management and follow-up mechanisms for the commitments acquired during theprocess of implementing CDM in Uraba. Through agreements with SENA (governmentaltraining service) and other public and private organizations, CORPOURABA will work tostrengthen institutions for the application of the policy on forests, directed to conservingforests, biodiversity and forest development in the region.
We expect, at the end of the project, that 110,000 ha. of natural forest will be appropriatelyconserved. Other priorities are to guarantee water resources, the recharge of aquifers. Thebiodiversity of mangrove ecosystems, Catival and hillside forests will also be protected. On15,000 of degraded forest land, ecological restoration will be accomplished through favoringnatural succession; 25, ha. of soil previously under conflicted use will be covered withprotective and productive forest, with higher agricultural and livestock production throughincorporating techniques for agriculture and animal management and mixed agriculture andforest, and forest and pasture systems. The consumption of fire-wood extracted from theregion’s forests will also drop, relaxing pressure on natural forests.
In addition to the preceding actions, we expect to increase employment and income for localinhabitants, develop research in forests, encourage social mediation and normalization anddiversify regional production. This will improve the standard of living and help to solve theeconomic, social and cultural problems at the root of the unsustainable exploitation of forests.
Besides preserving biodiversity and increasing social welfare, technology for agriculture, forestmanagement and natural resources management will be introduced. Economically viable,culturally and socially acceptable and environmentally sustainable technology must betransferred to manage the ecosystem.
Regarding CO2 emissions, the project’s expected results are:
232
• To sequester 7,451,483 t of CO2 on 25,000 forest plantations and mixed agriculture andforest, and forest and pasture systems, during 30 years.
• To reduce 21, 668,774 t of CO2 through managing 15,000 ha. and conserving 110,000 ha.of natural forests
8.9. Conservation and Expansion of Forest Covering toRegulate Water Resources and Manage GG Emissionsas a Sustainable Development Option in QuindioDepartment
Project presented by the Corporacion Autonoma Regional del Quindio, the FundacionHerencia Verde, CIPAV and the organized communities of the minuicipalities of Salento,Calarca and Pijao, to benefit from the Kyoto Protocol’s Clean Development Mechanism.
The present project’s intention is to generate short-run opportunities and benefits for all ruralproducers from a sector of the municipalities of Calarca, Salento and Pijao, in QuindioDepartment, in the Colombian Andes Mountains.
The transformation of present unsustainable production systems in agriculture and livestock,creating mixed forest and pasture, and agriculture and forest and forest systems, and themanagement of natural forests—the project’s goals—will make it possible to conserve anddevelop the land and soil, conserve and incorporate regional biodiversity into productivesystems, protect and better use water resources (of great importance in this project), andsequester significant quantities of atmospheric carbon. In addition, its impacts will add value tonatural forests and plantations as important assets, diversify regional production and improvefamily income for rural producers.}
Regarding CO2 emissions, the project’s expected results are:• To sequester 1,916,516 t of CO2 on 4,000 ha. of forest plantations and mixed forest andpasture, and agriculture and forest, and on 1,000 ha. left to natural regeneration, during 30years;
• To reduce 7,229,171 t of CO2 through the conservation of 15,000 of natural forests.
The project, during 30 years, will be executed by the Corporacion Autonoma Regional delQuindio (CRQ), SIPAV, Fundacion Herencia Verde and the area’s organized comunities.
8.10. Economic and Social Development of RuralCommunities in Colombia’s Caribbean Plain Based on
233
the Sustainable Management of Natural Forests andForest Plantations
Project presented by the Municipality of Zambrano (Bolivar), and the Empresa MonterreyForestal S.A., to benefit from the Kyoto Protocol’s Clean Development Mechanism.
The present project has the intention of generating short-run opportunities and benefits for allrural inhabitants and producers of the Municipality of Zambrano, located in BolivarDepartment on the left bank of the Magdalena River, on the Caribbean Plain.
The Colombian Caribbean plain has been the object of a longstanding and intense process ofoccupation and natural resource use. Today, the landscape is dominated by large areas wherethere are on-the-range cattle and agriculture operations. Tropical dry forests and rainforestspreviously covering the region have virtually disappeared. Recent estimate are that only 1% ofthe region’s original dry forest remains.Monterrey Forestal, for over 15 years, has developedforest activities in Zambrano, with social, economic and environmental strategies that are worthmaintaining in the long run, and replicating. The project, through the transformation ofunsustainable agricultural and livestock systems presently used in the region, plans to createmixed forest and pasture, and agriculture and forest, forest systems and natural forestmanagement. The conservation and development of land and soil, the incorporation of regionalbiodiversity into production, protection and better use of water resources and fixing significantamounts of atmospheric CO2 are a response to benefit the population and sustain economicdevelopment in the region. In addition, the expected impacts will add value to natural forestsand plantations as important assets and will diversify regional production. On the other hand,this project intends to transfer the company’s land deeds to Zambrano’s inhabitants, who haveindeed helped and contributed to prove that forest activities, with some encouragement, mightwell be the response to the needs of local farming communities and appropriate naturalresource management.
The numerous title deeds local inhabitants have received from the Instituto Colombiano deReforma Agraria (INCORA) on the project’s land, have not produced the expected welfare forrural producers because on them, people have continued to replicate the same productionsystems responsible for exhausting natural resources, and in consequence, land property hasbecome concentrated once again. By contrast, producers that began to implement alternativesystems with the company’s support, have seen their average monthly income risesignificantly. This situation inspired the idea of taking the initiative and involving a largerlocal population and transferring technology to the greatest number of rural producers in thearea.
The project’s general objective is to generate a profitable productive and sustainable alternativefor farmers in Zambrano, based on appropriate forest and forest plantation management. Thespecific objectives are:• Establish and consolidate, for the region’s farming population, a practical system formanaging and producing sustainable non-wood products on 6,311 ha. of natural forest,under a cooperative system, in Zambrano
234
• Manage and use sustainably 11,184 ha. of forest plantations, established from 1990, inZambrano
• Establish and manage sustainably 5,000 ha. of forest plantations, productive and protecting,with wood species, on land held by small and medium landowners, in Zambrano
• Reestablish natural vegetation on 1,475 ha. of degraded land, by overuse of pastures orinappropriate agricultural practices, on land held by small farmers in the region.
Regarding CO2 emissions, the project’s expected results are:
• To sequester 3,069,064 t of CO2 on 17,659 ha. of forest plantations, mixed agriculture andforest, and forest and pasture systems and on land left to natural regeneration, during 25years
• To reduce 749,539 t of CO2 through the conservation of 6,311 ha. of natural forests.
The project, planned for 25 years, will be executed by Monterrey Forestal S.A. incoordination with the municipality of Zambrano and the local farmers’ associations.These three actors have worked together for many years in a harmonious andcommunal way in all actions implemented up to the present.
8.11.Wind Energy Development in Upper Guajira
Project presented by Empresas Publicas de Medellin
The project (Wind Energy in Upper Guajira) includes feasibility studies, design, constructionand operation of a windmill park generating 20-25 MW (first phase) close to Puerto Bolivar, LaGuajira Department, in north eastern Colombia. The system would be connected to the nationalelectricity grid (Sistema de Transmision Naciona, STNl) to meet part of the country’s demandand contribute to reduce GG by displacing energy installation and generation based on thermalfossil fuels plants.
According to studies done to date, for this first phase we would build a 24,7MW park with 17NORDEX N 60/1300 aero-generators which on average are expected to generate 92.872 MWhper year, which would be transmitted, distributed and marketed by the STN, the EmpresasPublicas de Medellin and its partners. For this, a 7-kilometer 110KV line interconnecting thewindmill park will be built.
According to research and analysis of GG emissions reduction at the Academia Colombiana deCiencias, who calculated the base scenario (base line) based on the Expansion Plan forGeneration/Transmission of the UPME (Mining Ministry Planning Office), a reduction inemissions of 0,7Kg/KWh generated is expected; thus the planned windmill park wouldcontribute to reduce about 56,000 t of CO2/year.
235
The project is in the pre-feasibility stage. Analyses have established the technical,environmental and social and cultural viability of the project in this first phase. Compatibility,replicability and potential for expansion have also been established. At present, stations arebeing set up and contacts with GTZ are under way to evaluate the region’s wind-generatingpotential and the project’s technical, economic and environmental viability.
To the preceding points, we must add that fact that the region’s wind-generating potential ismuch higher in dry seasons, when reservoirs are at their lowest levels and the country´s thermalgenerating park is operating under a heavier load, which would make it optimal to add in wind-generated power at these times, maximizing GG reductions.
The project is near Puerto Bolivar, east of Portete Bay, in Uribia Municipality, La GuajiraDepartment, which covers the peninsula at the extreme north east of Colombia. The site is at72E and 12,25N.
The project is highly compatible and concordant with national policies on development, energy,the environment and technology, especially as regards sustainable development, efficient andclean energy technology, global trends, scientific and technological development and theconservation and improvement of environmental quality.
Power generation from wind-powered energy displaces thermal gas and coal generation in thenational energy system and thus reduces fossil fuels consumption, with the associatedenvironmental benefits from this reduction, like less CO2, SO2, N2O, CH4, and CO, all ofwhich are greenhouse gases contributing to global climate change. Besides a reduction inconsumption, transported volumes are reduced, avoiding spills and leaks.
During construction, the main impacts are the alteration of vegetation covering because ofaccess road-building, the foundations, and installing towers and building the connecting line.Even so, these impacts are minimal, not only because the port is nearby, as is the sub-station(about 5 Km.), but also because the area is hot, dry and semi-desert, with low dispersed rainfall,saline soil and consequently very little fauna and vegetation, and virtually no water.
During operation, the main impacts will be the alteration of the landscape and the noise of theturbines’ propellers, and impacts on birds, which will be limited and occasional because thearea's species flight paths are rarely higher than 15 m. and no migration routes of birds throughthe area have been detected yet. This, however, must be studied in greater detail in thefeasibility study.
At the domestic level, besides the increase in energy self-sufficiency and the effect on economicdevelopment in general, the character of being a “demonstration project” will have considerablepositive effects on the energy and technology sectors because the project will be the occasion ofa technology transfer in planing and implementing wind energy and will make it possible tostudy the potential for further development in the region.
236
Regionally, wind energy potentially could be one of the few development possibilities, for theregion’s precarious conditions for agriculture and forests, livestock, and with little water, makedevelopment practically impossible based on other renewable resources.
Other impacts in this field relate to improving the financial structure of Uribia through taxes andpaying compensation and rights of way to the population, as well as employment duringconstruction and the project’s future attraction for tourists and interested visitors, as an offshootof activity at the Cabo de la Vela, 20 kilometers away.
Because a Colombian Native community, the Wayuu, live in the area, we consider that the mainenvironmental impacts are related to this community’s society and culture. Though residents inthe area are highly dispersed and only rarely does one see groups of houses in the project’s areaof direct influence, it could alter local community dynamics and at some point might requireresolving conflicts arising from the project’s interaction with the local population (managingimpacts, negotiations, complaints, etc. These aspects will be studied together with communityparticipants from the feasibility stage onward, to minimize their negative aspects.
237
2. Bibliography
A. Denny Ellerman, Henry D. Jacoby and Annelene Decaux, Analysis of Post-Kyoto CO2Emissions Trading Using Marginal Abatement Curves. Octubre 1998.
A. Denny Ellerman, Henry D. Jacoby and Annelene Decaux. The Effects on DevelopingCountries of the Kyoto Protocol and CO2 Emissions Trading. Nov 1998.
Academia Colombiana de ciencias exactas físicas y naturales. Opciones de mitigación deemisiones de gases de efecto de invernadero en Colombia. 1998
Acofore, Asociación Colombiana de Reforestadores e Industriales de la Madera. Bosques YFuturos, Medio Ambiente Desde La Perspectiva Empresarial. No.17. Octubre/diciembre 1997.Colombia.
Acofore, BIRF (Banco Internacional de Reconstrucción y Fomento), Ministerio del MedioAmbiente. Boletín SITEP (Sistema Técnico Estadistico para Plantaciones ForestalesIndustriales en Colombia). AÑO 3, No.5. Septiembre de 1999. Colombia
Administration Economic Analysis. The Kyoto Protocol and the President´s Policies toAddress Climate Change. Julio 1998.
Alan S. Manne, Richard G Richels. The Kyoto Protocol: A cost-effective strategy for meetingenvironmental objectives?. Julio 1998.
ARM Carbon Team. Risk Mitigation In Forestry Under Kyoto. Mayo 28 de 1999.
Banco de la República. Indicadores Económicos, Tercer Trimestre.1999. Colombia.
Banco de la República. Reportes del Emisor No. 10. Inflación, Incertidumbre Y CrecimientoEn Colombia. Santafé de Bogotá. Enero. 2000.
Baumert, K. The Clean Development Mechanism: Understanding the addicionality. The Cleandevelopment Mechanism. Draft working papers (1998). CSDA &WRI ( 1998).
BERI S.A. Business Risk Service (BRS) User Guide. 1998
Bernstein Paul M, Montgomery David W., Rutherford F. Thomas. Global Impacts of the KyotoAgreement: Results from the MS-MRT Model. Resource and Energy Economics 21 (1999).
Bjart J. Holtsmark. From the Kyoto Protocol to the fossil fuel markets.
Boccara, B., Beers, D. Colombia´S Foreign Currency Rating Lowered To Bb.Outlook Stable.
238
BPR Asociados. Estudio sectorial de riesgo BRP. Sector gaseosas, cervezas y bebidasalcoholicas. 1999.
Brennglass, A. Investment Guarantee And Political Risk Insurance Programs.
Brown, P. (1998) Climate, Biodiversity, and Forest. Issues and Opportunities Emerging fromthe Kyoto Protocol. WRI & IUCN.
Brown, P.; Cabarle, B.; Livernash, R. (1998). Carbon Counts: Estimating Climate ChangeMitigation in Forestry Projects. WRI
Business Risk Service. Benefits From Use Of The Business Risk Service. 1998.
Business Risk Service. Principios De La Evaluación De Riego País. 1998.
Castro, Mauricio. La región Salento. CRQ. 1995.
Chomitz, K (1998). Baselines for Greenhouses Gas Reductions. Problems, Precedents,Solutions. World Bank. Draft Paper.
Coinvertir, Corporación Invertir en Colombia. Colombia Marco Legal. Mayo de 1999.Santafé de Bogotá.
Coinvertir, Corporación Invertir en Colombia. COLOMBIA. Investment Banks And CreditRating Agencies´ Views On The Economy. Diciembre de 1999. Santafé de Bogotá, Colombia.
Coinvertir, Corporación Invertir en Colombia. Estatuto De Inversiones Internacionales.Febrero de 1999, Colombia.
Coinvertir, Corporación Invertir en Colombia. Guia Para La Inversión Extrajera. Marzo de1999. Santafé de Bogotá.
Coinvertir, Corporación Invertir en Colombia. Inversion Extranjera En Colombia, Informe DelPirmer Semestre De 1999. Octubre de 1999, Colombia.
CONAMA. Auditoría del Plan de Prevención y Descontaminación Atmosférica para la RegiónMetropolitana (PPDA). Capítulo 1, pag 12. 1999 .
Conif, Corporación Nacional de Investigación y Fomento Forestal. Boletin de proteccionforestal no.3. Plagas / enfemedades. Septiembre de 1998. Colombia.
Conif, Corporación Nacional de Investigación y Fomento Forestal. Boletin de proteccionforestal no.4. Plagas / incendios. Junio de 1999. Colombia.
Consejo Superior de Comercio Exterior. Resultados Del Comercio Exterior En 1999. Santafé deBogotá. Febrero 29.2000.
239
Consensus Economics Inc. Latin American Consensus Forecasts. Diciembre 13 de 1999,United Kingdom
Control Risks Group. Colombia Business Planer. Enero 20 de 2000. Bogotá, Colombia.
Control Risks Group. Estudio De Riesgos De Inversion De Sectores Economicos. Enero de2000. Bogotá, Colombia.
Control Risks Group. Estudio De Riesgos. Enero 20 de 2000. Bogotá, Colombia
Convención Marco de las Naciones Unidas Sobre el Cambio Climático. Protocolo de Kioto.1998
Corporación Colombiana de Investigación Agropecuaria – CORPOICA – Credit Suisse.Emerging Markets Bi-Weekly. Octubre 1.1999.
Dales, J.H. Land, Water and Ownership. Canadian Journal of Economics I (4) Noviembre1968.
DCR. DCR Downgrades Colombia To Bbb, Investment Grande Maintained. Septiembre 9 de1999.
Designing More Efficient Markets: Lessons From Los Angeles Smog Control. Journal of Lawand Economics, Vol 38, Abril. 1995
Dobie, Philip. Capacity Building for Sustainable Development - Models for National Strategy.Approaches to Sustainability Series. New York. Abril de 1999.
Dominique van der Mensbrugghe. A (Preliminary) Analysis of the Kyoto Protocol: Using theOECD GREEN Model.
Dudek; Wiener. Joint Implementation, Transactions Costs And Climate Change. OECD, Paris,1996
Duvigneaud, P. Concepts sur la productivité primarie des ecosystems forestiers. In Ecologie etConservation 4 . Unesco, París. 1971.
Ecocarbón, UPME. Planteamiento Estrategico Del Programa De Reconversion A TecnologiasLimpias En Termoelectricas. 1997.
Edmonds Jae, Scott Michael J. et al. International emissions trading & Global climate change.Pew Center on Climate Change, Diciembre 1999.
240
EIA Energy Information Administration - Greenhouse Gases and the Kyoto Protocol Chapter:Comparing the costs estimates for the Kyoto Protocol” Energy Information Administration.International Energy Outlook 1999, DOE/EIA-0484(99) Washington, DC.
El Tiempo. Lecturas dominicales. Geografía de la guerra. Santafé de Bogotá. Octubre 17 de1999.
Embree, S. Climate Change And The Evolving Market For Ghg Emissions Reductions,Background Information. 18 de junio de 1999.
Environmental Defense Fund (1998). Cooperative Mechanisms Under the Kyoto Protocol.
Erb, C., Harvey, C. Y Viskanta, T. Political Risk, Economic Risk And Financial Risk.Financial Analyst Journal. November / December 1996.
Evans, J. Plantation forestry in the tropics. Cap.22 factores ecologicos y productividad alargo plazo. 1982.
FAO. Ecosistemas de los Bosques tropicales. Informe sobre el estado de conocimiento.UNESCO/PNUMA/FAO. 1980
Federación Nacional de Paneleros – FEDEPANELA-
Ferreira, P. (Instituto de Investigaciones de Recursos Biológicos Alexander Von Humboldt).Colombia´S Forest Policy And Management (Draft). 1996.
Figueres et al, WRI. The CDM, A Multilateral Model in The Clean Development Mechanism.Draft Workign Papers, 1998.
Hendriks, C.A; Worrell. E. Greenhouse Gas R&D Program. Emission Reduction ofGreenhouse Gases from the Cement Industry. 1998.
Herrera, G. (Departamento Nacional de Planeación, Unidad de Desarrollo Agrario). LaActividad Silvicola Nacional, Sus Limitantes Y Perspectivas Para Una Mayor Competitividad.Enero de 1999. Santafé de Bogotá, Colombia.
Herzog Howard, Drake Elisabeth, Adams Eric. CO2 Capture, Reuse, and Storage Technologiesfor Mitigating Global Climate Change. Energy Laboratory Massachusetts Institute ofTechnology, Enero 1997.
Holtsmark Bjart J. From the Kyoto Protocol to the fossil fuel markets. Center for InternationalClimate and Environmental Research in Oslo (CICERO), 1998.
Hyde, W. The Pattern Of Forest Development And Common Policy Impacts On The Forest.Agosto de 1996. Bogotá, Colombia.
241
ICRG. Country risk ratings. Colombia 4th quarter 1999.
IDEAL global.com. Colombia: The Floor On Local Rates And The Sovereign Debt Ceiling.June 11.1999.
IDEAL global.com. Emerging Markets Repackaged. August 1.1999.
IDEAM. El Medio Ambiente en Colombia. 1998.
IIF. Summary Apraisal Colombia. August 6.1999.
Instituto Colombiano de Productores de Cemento – ICPC. Potenciales de la IndustriaColombiana del Cemento en la Aplicación del Mecanismo de Desarrollo Limpio – ConvenciónMarco de Cambio Climático. 1999.
Instituto de Hidrología, Meteorología y Estudios Ambientales – IDEAM. Inventario nacionalde fuentes y sumideros de gases de efecto invernadero. 1999
Instituto de Investigaciones Alexander von Humboldt. Informe nacional sobre el estado de labiodiversidad y mapa general de ecosistemas de Colombia. 1998.
Intergovernmental Panel on Climate Change. Special Report on Land Use, Land Use Change,and Forestry. Draft - Octubre de 1999.
IPCC. Guidelines for National Greenhouse Invenories. Reference Manual, Volumen 3, 1994
IPCC. Guidelines for National Greenhouse Invenories.Workbook, Volumen 2, 1994
Janssen, J. Risk Mangement Of Investments In Cdm Projects. 28 de agosto de 1999. Suiza.Janssen, J. Strategies For Risk Management Of Joint Implementation Investments. IWOeDiscussion Paper No.48. May, 1997.
Jhonston Paul, Santillo David, Stringer Ruth. Ocean Disposal/Sequestration of Carbon Dioxidefrom Fossil Fuel Production and Use: An Overview of Rational, Techniques and Implications.Greenpeace Research Laboratories, Marzo 1999.
JIRC (1997). General Guidelines for Baselines Studies. Ducth JI Registration Center. DenHaag.
Johannes Bollen, Arjen Gielen, and Hans Timmer. Compliance with the Kyoto Protocol.
Jotzo Frank, Heyhoe Edwina, Woffenden Kate, Brown Stephen, Fisher Brian y Tupulé Vivek;.Impacts of the Kyoto Protocol on Developing Countries. ABARE report, Canberra, Marzo2000.
242
Kira, T y colaboradores. Assesment of primary production in tropical and equatorial forest. . InEcologie et Conservation 4 . Unesco, París. 1971.
Léeme. G. La productividad primaria del Bosque. in Ecología Forestal. Editado por P.Pesson.Ediciones Mundi – Prensa. Madrid. 1974.
MacDicken, K. A Guide to monitoring carbon storage in forestry and agroforestry project.Winrock International Institute for Agricultural Developmet. Arlington. USA. 1997.
Matsuo, Naoki. Proposal for Step-by-Step Baseline Standardization for CDM - From Project -Specific to Generalized Formula. IGES. Octubre de 1999.
Michaelowa, Axel. Template for Baselines Studies for World Bank AIJ, CDM and JI Projects.Study for the World Bank Climate Change Team. Deciembre de 1999.
MIGA, Multilateral Investment Guarantee Agency. Country Responsibility Of Miga Officers.Junio 6.1999
MIGA, Multilateral Investment Guarantee Agency. Financial Institution Guide. Junio 6.1999
MIGA, Multilateral Investment Guarantee Agency. Investment Guarantee Guide. 6 de Junio de1999.
MIGA, Multilateral Investment Guarantee Agency. Legal And Claims Department. Junio6.1999.
MIGA, Multilateral Investment Guarantee Agency. Miga In Latin America And The Caribbean.Junio 6.1999
MIGA, Multilateral Investment Guarantee Agency. Overview Of Miga´S Investment MarketingServices (Ims) Department. Junio 6.1999
MIGA, Multilateral Investment Guarantee Agency. Overview Of Miga´S Investment GuaranteeServices. Junio 6.1999
Ministerio de Agricultura. Instrumentos De Credito Y Capitalizacion Para El SectorAgropecuario. 1999, Colombia.
Ministerio de Comercio Exterior - Colombia. La Importanica Del Mercado NorteamericanoPara Colombia. Santafé de Bogotá. Marzo 8.2000.
Ministerio del Medio Ambiente, SGS Colombia S.A. Seminario-Taller ImplementacionConjunta. 19 de noviembre de 1997. Santafé de Bogotá, Colombia.
Ministerio del Medio Ambiente. Incentivos Tributarios A La Inversion Ambiental. 1998.Santafé de Bogotá, Colombia.
243
Ministerio del Medio Ambiente. Plan nacional de desarrollo forestal, documento paradiscusion. Octubre de 1999. Colombia.
Ministerio del Medio Ambiente. Politica De Bosques. Enero 31 de 1996. Santafé de Bogotá,Colombia.
Ministerio del Medio Ambiente. Programa Para La Implementacion Del Plan EstrategicoPara La Restauracion Y El Establecimiento De Bosques En Colombia (Plan Verde) BosquesPara La Paz, 1998-2002. Julio de 1999. Santafé de Bogotá, Colombia.
Ministerio del Medio Ambiente. Nuestros Bosques. Consulta cartográfica sobre medioambiente y ecosistemas estratégicos. Hamburgo Editorial e Impresora. Santa Fe de Bogotá.1996.
Ministerio del Medio Ambiente. Plan Verde. 1999.
Ministry of Agriculture, Food and Rural Affairs, Canadá. Risk Assessment Frameworks.www.gov.on.ca. 1999.
Mokate, Karen; Castro, Raul. Evaluación Económica y Social de Proyectos. Universidad delos Andes. 1998.
Mokate, Karen; Castro, Raul. Evaluación Financiera de Proyectos. Universidad de los Andes.1998.
Moura Acosta, P., Stuart, M., Pinard, M., Phillips, G. Issues Related Monitoring, VerificationAns Certification Of Forestry- Based Carbon Offset Projects.
Mundy, E. Forestry carbon sequestration using the clean development mechasnism.Fundamentals of project design. Octubre de 1999. Bogotá, Colombia.
Naciones Unidas, Secretaría del Cambio Climático. El Protocolo De Kyoto De La ConvenciosSobre El Cambio Climatico. Octubre de 1998. Francia.
OECD (1999). Status of Research on Project Baselines Under UNFCCC and the KyotoProtocol.
OECD (1999): Experience with Emission Baselines Under the AIJ Pilot Phase.
Overman J. et al, Estimación de la biomasa aérea en el bosque del medio Caquetá. ColombiaAmazónica. vol. 4 No. 2. 1990.
Presidencia de la República, Departamento Nacional de Planeación. Colombia, The BeginningOf A New Era. Enero 21 de 2000. Cartagena de Indias, Colombia.
244
Radcliffe, J. Coverage Of Political Risk By The Private Insurance Industry. 1986.
Revista Dinero No. 102. 25 de febrero de 2000. Santafé de Bogotá, Colombia.
Revista Dinero No. 75. 14 de diciembre de 1998. Santafé de Bogotá, Colombia.
Revista Dinero No. 92. 10 de septiembre de 1999. Santafé de Bogotá, Colombia.
Revista Dinero RO No. 100. Enero 28.2000. . Santafé de Bogotá, Colombia.
Revista Semana No.924. 17-24 de enero de 2000. Santafé de Bogotá, Colombia.
Revista Semana No.933. 20-27 de marzo de 2000. Santafé de Bogotá, Colombia.
Ronald D. Sands, James A. Edmonds, Son H. Kim, Christopher N. MacCracken and MarshallA. Wise. The Cost of Mitigating United States Carbon Emissions in the Post-2000 Period.Pacific Northwest National Laboratory.
Sánchez-Páez, H. y R. Alvarez (eds.). Diagnóstico y zonificación preliminar de los manglaresdel Caribe de Colombia. MMA/OIMT. 1997.
Santander Investment. Analisis De Mercados Emergentes, Colombia-Cemento Y Construccion.29 de mayo de 1998. Bogotá, Colombia.
Standard and Poor´s. Published Ratings. Septiembre 22.1999.
Stephen Brown, Darren Kennedy , Cain Polidano, Kate Woffenden , Guy Jakeman , BrettGraham, Frank Jotzo, Brian S. Fisher. Economic impacts of the Kyoto Protocol: Accountingfor the three major greenhouse gases. ABARE, Mayo 1999.
Swiss Re. Corporate Risk Financing – The Emergence Of A New Market. 1998. Zurich.
Swiss Re. Del Riesgo Al Capital, Consideraciones Desde El Punto De Vista Del Seguro. 1999.Zurich.
Swiss Re. La Responsabilidad Civil Ambiental Y Su Seguro. 1997. Zurich.
Swiss Re. La Transferencia Alternativa De Riesgos Para Empresas: ¿Moda O Paradigma DeLa Gestion De Riesgos Del Siglo Xxi?. 29 de marzo de 1999. Zurich.
Swiss Re. Rethinking Risk Financing. 1996. Zurich.
Swiss Re. Seguro De Perdida De Beneficios. 1998. Zurich.
Swiss Re. Special Risks. 1998. Zurich.
245
The Aerospace Corporation. Non-Quantitative Methods For Risk Management. 25 deseptiembre de 1997.
The CDM: Institutional Design Issues and Ideas, Scoping/Issues Paper,2000, as yetunpublished.
The Economist Intelligence Unit. Country Risk Service, December Handbook. Diciembre 17de 1999, United Kingdom.
The Economist Intelligence Unit. Country Risk Service, Risk Rating Review, 4th Quarter 1999.Noviembre 22 de 1999, United Kingdom.
The Economist Intelligence Unit. Country Risk Service Colombia. Diciembre 17 de 1999,United Kingdom.
The Nature Conservancy (1998). Ranking Parks in Peril Sites for Carbon Offset Potential.Trexler and Associates, Inc.
The Nature Conservancy. Protocolo De Kioto: Implicaciones Para El Desarrollo SostenibleDe Los Paises Andinos. Septiembre de 1998. Quito, Ecuador.
Thomson, Koy. Capacity Development in the Environment - A Practical Aid to SustainableDevelopment? EC Aid and Sustainable Development Briefing Paper. No.12. 1996.
Transaction Costs and Tradeable Permits. Journal of Environmental Economics andManagement. Vol.29. 1995
Tupulé V, Brown S, Lim J, Polidano C, Pant H and Fisher B. An economic assessment of theKyoto Protocol using the Global Trade and Environment Model. ABARE, Sept 1998.
UNDP. Capacity Building for Environmental Management. New York. 1999.
UNFCCC. National Communications from Parties Included in Annex I to the Convention -Greenhouse gas Inventory Data 1993-1997. FCCC/SBI/1991/12, Septiembre 29, 1999.
Unidad de Planeación Minero Energética – UPME. Escenarios y estrategias en minería yenergía. 1999
Unidad de Planeación Minero Energética – UPME. Plan de expansión referencia generación –transmisión. 1998 – 2010.
Unidad de Planeación Minero Energética – UPME. Planteamiento estratégico del programa dereconversión a tecnologías limpias en termoeléctricas. 1997.
Uniform Reporting Format - URF. 1999
246
United Nations Development Programme. Issues & options. The clean developmentmechanism. 1998. New York.
United Nations, Building International Public-Private Partnership. The Clean DevelopmentMechanism, A Preliminary Examination Of Technical, Financial & Institutional Issues.Octubre de 1999.
UPME, Unidad de Planeación Minero Energética. La cadena del gas natural en colombia.Actualizacion 99. Mayo de 1999. Santafé de Bogotá, Colombia.
UPME, Unidad de Planeación Minero Energética. Plan De Expansion Referencia GeneracionTransmision, 1998-2010. 1999. Santafé de Bogotá, Colombia.
US Government Printing Office. Economic Report of the President Transmitted to theCongress. Febrero 2000.
USGAO. A Market Approach to Air Pollution Control Could Reduce Compliance CostsWithout Jeopardizing Clean Air Goals. Marzo 1982
Valderrama, M. y H. Mondragón. Desarrollo y Equidad con Campesinos. Misión Rural. Vol.2. IICA/Tercetr Mundo Editores. Santa Fe de Bogotá. 1998.
Van der Mensbrugghe Dominique. (Preliminary) Analysis of the Kyoto Protocol: Using theOECD GREEN Model. OECD Development Centre. March 1 1998.
Villa, A. Sostenibilidad y Medio Ambiente: políticas, estrategias y caminos de acción. MisionRural, vol. 4. IICA/Tercer Mundo Editores. Santa Fe de Bogotá. 1998.
Warwick J. McKibbin, Robert Shackleton, Peter J. Wilcoxen. The Potential Effects ofInternational Carbon Emissions Permit Trading Under the Kyoto Protocol.
Whittaker, R & Woodwell, G. Measurements of net primary production of fores. In Ecologie etConservation 4 . Unesco, París. 1971.
World Bank. Colombia Economic And Social Development Issues For The Short And MediumTerm. Noviembre 19.1998.
Yamin, Farhana. Bilateral, Multilateral and Other Approaches to the CDM, in The CleanDevelopment Mechanism, Draft Working Papers, Figueres et al, 1998.
Yamin, Farhana. Operational and Institutional Challenges, en Issues and Options, The CleanDevelopment Mechanism. UNDP, 1998.
Zhang ZhongXiang. Estimating the Size of the Potential Market for All Three FlexibilityMechanisms under the Kyoto Protocol. Final Report Prepared for the Asian DevelopmentBank. Noviembre 1999.

THE WORLD BANK
1818 H Street, N.W.Washington, D.C. 20433 USATelephone 202 473 1816