Embed Size (px)
Citation preview
F E B R UA RY 2 0 2 1
N ATION AL REPORT O N EARLY-STAGE
ENTREPRENEURSHIP I N T H E UN ITED STATES: 2020

NATIONAL REPORT ON EARLY-STAGE ENTREPRENEURSHIP IN THE UNITED STATES: 2020
AUTHORSRobert FairlieI and Sameeksha DesaiII
SPECIAL THANKSKim Wallace Carlson, Kim Farley, Alyse Freilich, Lacey Graverson,
Travis Howe, Jessica Looze, Hayden Murray, Kayla Smalley
Explore the Kauffman Indicators further at: www.kauffman.org/indicators
Questions, inquiries/correspondence, and follow up: [email protected]
Suggested citation: Fairlie, Robert and Sameeksha Desai (2021) National Report on Early-Stage Entrepreneurship in the United States: 2020, Kauffman Indicators of Entrepreneurship, Ewing Marion Kauffman Foundation: Kansas City.
I professor, University of California, Santa Cruz; consultant, Ewing Marion Kauffman Foundation II director of special projects and advisory support, Ewing Marion Kauffman Foundation
This is a report published by the Ewing Marion Kauffman Foundation utilizing content and data from multiple sources and external contributors. Every effort has been made to verify the accuracy of the information contained in this report and is believed
to be correct as of the publication date. Nonetheless, this material is for informational purposes, and you are solely responsible for validating the applicability and accuracy of the information in any use you make of it.
© 2021, Ewing Marion Kauffman Foundation

NATIONAL REPORT ON EARLY-STAGE ENTREPRENEURSHIP IN THE UNITED STATES: 2020
EARLY-STAGE ENTREPRENEURSHIP
IN THE UNITED STATES
This report tracks four indicators capturing early-stage entrepreneurship activity in the United States:
Rate of new entrepreneurs
Opportunity share of new entrepreneurs
Startup early job creation
Startup early survival rate
These indicators collectively inform the Kauffman Early-Stage Entrepreneurship (KESE) Index,
a summary index of entrepreneurial activity.

NATIONAL REPORT ON EARLY-STAGE ENTREPRENEURSHIP IN THE UNITED STATES: 2020 | 2
TABLE OF CONTENTSExecutive Summary .................................................................................................... 3
National Trends in Early-Stage Entrepreneurship in 2020 ..................................................................................... 3
Kauffman Indicators of Entrepreneurship ....................................................................... 4Table 1: Kauffman Indicators of Entrepreneurship and KESE Index (2020) .......................................................... 6
NATIONAL TRENDS IN THE RATE OF NEW ENTREPRENEURS ..........................................................7Figure 1: Rate of New Entrepreneurs Over Time (1996–2020) .............................................................................. 7
Demographic Trends in the Rate of New Entrepreneurs .................................................................................. 7
Figure 2 and Table 2: Rate of New Entrepreneurs by Sex (1996–2020) ........................................................ 8
Figure 3 and Table 3: Rate of New Entrepreneurs by Race and Ethnicity (1996–2020) ................................ 9
Figure 4 and Table 4: Rate of New Entrepreneurs by Nativity (1996–2020) ................................................ 10
Figure 5 and Table 5: Rate of New Entrepreneurs by Age Group (1996–2020) ........................................... 11
Figure 6 and Table 6: Rate of New Entrepreneurs by Education (1996–2020) ............................................ 12
Figure 7 and Table 7: Rate of New Entrepreneurs by Veteran Status (1996–2020) .................................... 13
NATIONAL TRENDS IN THE OPPORTUNITY SHARE OF NEW ENTREPRENEURS ..................................... 14Figure 8 and Table 8: Opportunity Share of New Entrepreneurs Over Time (1996–2020) .................................. 14
Demographic Trends in the Opportunity Share of New Entrepreneurs ........................................................... 15
Figure 9: Opportunity Share of New Entrepreneurs by Sex (1998–2020) .................................................... 15
Figure 10: Opportunity Share of New Entrepreneurs by Race and Ethnicity (1998–2020) .......................... 15
Figure 11: Opportunity Share of New Entrepreneurs by Nativity (1998–2020) ........................................... 16
Figure 12: Opportunity Share of New Entrepreneurs by Age Group (1998–2020) ....................................... 16
Figure 13: Opportunity Share of New Entrepreneurs by Education (1998–2020) ....................................... 17
Figure 14: Opportunity Share of New Entrepreneurs by Veteran Status (1998–2020) ................................ 17
NATIONAL TRENDS IN STARTUP EARLY JOB CREATION ................................................................... 18Figure 15: Startup Early Job Creation Over Time (1996–2020) ........................................................................... 18
NATIONAL TRENDS IN STARTUP EARLY SURVIVAL RATE ................................................................. 19Figure 16: Startup Early Survival Rate Over Time (1996–2020) .......................................................................... 19
KAUFFMAN EARLY-STAGE ENTREPRENEURSHIP (KESE) INDEX .................................................... 20Figure 17 and Table 9: Kauffman Early-Stage Entrepreneurship (KESE) Index Over Time (1996–2020) ............ 20
References ..............................................................................................................21

NATIONAL REPORT ON EARLY-STAGE ENTREPRENEURSHIP IN THE UNITED STATES: 2020 | 3
Executive Summary The Kauffman Indicators of Early-Stage Entrepreneurship is a set of measures that represents new business creation in the United States, integrating several high-quality, timely sources of information on early-stage entrepreneurship.
This report presents four indicators that track early-stage entrepreneurship for the years 1996–2020: rate of new entrepreneurs reflects the number of new entrepreneurs in a given month, opportunity share of new entrepreneurs is the percentage of new entrepreneurs who created their businesses out of opportunity instead of necessity, startup early job creation is the total number of jobs created by startups per capita, and startup early survival rate is the one-year average survival rate for new firms. National trends are reported for the four indicators as well as some demographic trends for the rate of new entrepreneurs and opportunity share of new entrepreneurs.
The rate of new entrepreneurs was substantially higher in 2020 than in 2019 or in previous years, reflecting more transitions into entrepreneurial activity, broadly defined, among the population during pandemic conditions. At the same time, the opportunity share of this activity plummeted to the lowest share in 25 years, indicating that many of these transitions were undertaken by people with few other options for economic engagement.
National Trends in Early-Stage Entrepreneurship in 2020:• Nationally, the rate of new entrepreneurs in 2020 was
0.38 percent, meaning that an average of 380 out of every 100,000 adults became new entrepreneurs in a given month. The monthly rate increased substantially in 2020 as the economy went through the shutdowns, job losses, and reopenings that characterized the COVID-19 pandemic.
- The rate of new entrepreneurs was 0.30 percent among women and 0.48 percent among men, reflecting large increases for both from the previous year.
- In 2020, the rate of new entrepreneurs was 0.52 percent among Latinos, 0.38 percent among African Americans, 0.35 percent among Asians, and 0.36 percent among Whites. It increased for all groups from the previous year.
- The rate of new entrepreneurs was 0.59 percent for immigrants – substantially higher than that for native-born Americans (0.34 percent). The rate of new entrepreneurs increased for both groups over the past year.
- The rate of new entrepreneurs was highest among the 45–54 year age group (0.49 percent) and lowest among the 20–34 year age group (0.28 percent). It increased sharply for all age groups.
• The opportunity share of new entrepreneurs was 69.8 percent in 2020, representing a substantial drop from 2019 (86.9 percent). This opportunity share of new entrepreneurs is the lowest over the past 25 years and perhaps longer. The decline from 2019 to 2020 during the pandemic was 17.1 percentage points, much larger than the one-year decline of 6.9 percentage points from 2008 to 2009 during the Great Recession.
- The opportunity share of new entrepreneurs declined sharply for both women and men in 2020.
- All ethnic and racial groups experienced large drops in the opportunity share in 2020, reversing upward trends over the past few years. Asian new entrepreneurs experienced the largest drop in the opportunity share (10.4 percentage points), followed by African American new entrepreneurs (6.3 percentage points).
- The opportunity share of new entrepreneurs dropped substantially for immigrants and the native-born population in 2020.
The monthly rate increased substantially in 2020 as the economy went through the shutdowns, job losses, and reopenings that characterized the COVID-19 pandemic.
EXECUTIVE SUMMARY

NATIONAL REPORT ON EARLY-STAGE ENTREPRENEURSHIP IN THE UNITED STATES: 2020 | 4
Kauffman Indicators of EntrepreneurshipThe Kauffman Indicators of Early-Stage Entrepreneurship captures early-stage entrepreneurial activity, broadly defined. It includes four key early-stage measures of entrepreneurial activity:
1. Rate of new entrepreneurs: the broadest measure possible for business creation by the population.
2. Opportunity share of new entrepreneurs: the percentage of new entrepreneurs who created a business out of choice instead of necessity.
3. Startup early job creation: the number of jobs created in the first year of business per capita.
4. Startup early survival rate: the rate of survival in the first year of business.
The first two indicators reflect early entrepreneurial activity among the population, and the next two capture first-year business trends. A summary index of entrepreneurship activity, the KESE Index, is also created from these four indicators. The KESE Index evenly weights contributions from
the four indicators and presents a snapshot of early-stage entrepreneurial activity.
The purpose of these indicators is to provide a guidepost for early-stage entrepreneurial activity so that interested individuals and organizations can better understand trends in different aspects of new business creation. No single indicator can provide a complete picture of all types of entrepreneurial activity at any given time. For example, if the rate of new entrepreneurs were to increase rapidly while the startup early survival rate stayed fairly constant, it would suggest a need for further exploration of the causes of this difference. Along the same lines, if an indicator were to differ significantly across demographic groups, it would point to questions about the reasons for such variation.
The four early-stage entrepreneurship indicators and the summary index1 are reported at the national level. Some demographic trends are also reported for the rate of new entrepreneurs and opportunity share of new entrepreneurs: sex (men, women), race and ethnicity (Asian, African American, Latino, White), nativity (immigrant, native-born), age (20–34, 35–44, 45–54, 55–65 years), and veteran status.
Each of the indicators is based on either a nationally representative sample of more than a half-million observations
- All age groups experienced large decreases in the opportunity share, reversing upward trends since the Great Recession.
• Startup early job creation and startup early survival rates are based on data cycles that end in March, meaning that both indicators cover the first few months of 2020.
- National startup early job creation in 2020 was 5.0 jobs per capita, meaning that startups hired 5 jobs for every 1,000 people.
- The startup early survival rate was 78.1 percent in 2020, meaning that almost eight in 10 startups survived the first year. This survival rate was down substantially from the previous year, and it was the first drop in the survival rate since the Great Recession.
• The overall KESE Index — an equally-weighted composite of the four indicators — was -0.2 nationally. The index dropped substantially from 1.1 in 2019, recording the largest drop since the Great Recession. The index is normalized at zero.
The purpose of these indicators is to provide a guidepost for early-stage entrepreneurial activity so that interested individuals and organizations can better understand trends in different aspects of new business creation.
1. Refer to Fairlie and Desai (2020) for more on the measurement approach for the indicators.
KAUFFMAN INDICATORS OF ENTREPRENEURSHIP

NATIONAL REPORT ON EARLY-STAGE ENTREPRENEURSHIP IN THE UNITED STATES: 2020 | 5
each year, or the universe of employer businesses in the United States (roughly 5 million businesses), using datasets of the U.S. Census Bureau and U.S. Bureau of Labor Statistics. The indicators track changes in entrepreneurial activity over time,
across geographies, and among various demographic groups. Similar to many measures derived from large longitudinal datasets, the indicators are limited by sampling, interpretation, and reporting constraints.
4. STARTUP EARLY SURVIVAL RATEStartup early survival rate refl ects early-stage business performance among startups within their fi rst year. It measures the percentage of new employer establishments that are still active after one year of operation.4
This indicator is an annual measure of immediate, and not long-term, survival.
Source: Business Employment Dynamics (BED),a database of the Bureau of Labor Statistics.
1. RATE OF NEW ENTREPRENEURSThe rate of new entrepreneurs provides a broad measure of entrepreneurship, capturing all new business owners, regardless of business size or origin. As such, it includes businesses of all types, regardless of their growth potential or the intentions of their owners. It captures all new business owners, including those who own incorporated or unincorporated businesses, and those who are employers or non-employers.
The rate of new entrepreneurs captures the percentage of the adult, non-business owner population that starts a business each month. New business owners are defi ned here as those individuals who worked an average of 15 or more hours per week in their businesses in the preceding month.
Source: Author calculation using microdata from the Current Population Survey (CPS), a monthly survey of the U.S. Bureau of the Census and Bureau of Labor Statistics.
2. OPPORTUNITY SHARE OF NEW ENTREPRENEURS
The opportunity share of new entrepreneurs provides broad insight into the infl uence of economic conditions on overall business creation among new entrepreneurs. It distinguishes between individuals who are “opportunity entrepreneurs” – including those coming out of work, school, or another labor market status – and individuals who are “necessity entrepreneurs” due to unemployment.2 The opportunity share of new entrepreneurs refl ects the percent of the total number of new entrepreneurs who were not unemployed and not looking for a job as they started a new business. Although the motivations for starting businesses can differ (and can be seen in the context of weak economic conditions and high unemployment rates), necessity businesses could eventually become very successful.
Source: Author calculation using microdata from the Current Population Survey (CPS), a monthly survey of the U.S. Bureau of the Census and Bureau of Labor Statistics.
3. STARTUP EARLY JOB CREATIONStartup early job creation captures the early employment of a cohort of startup businesses in their fi rst year. It is an annual measure of the number of total jobs that are created by startups in their fi rst year, and it is normalized by the population. As a result, it refl ects total employment created by an average new employer fi rm in its fi rst year for every 1,000 people. This measure represents the job creation power of startups in their fi rst year of operations.3
Source: Startup data come from Business Employment Dynamics (BED), a database of the Bureau of Labor Statistics; population estimates come from the U.S. Census Bureau.
2. See Fairlie and Fossen (2017). 3. The measure does not directly refl ect long-term job creation, compensation, longevity of a job, or job and industry characteristics that may infl uence job trends in startups.4. This indicator measures the early survival rates of new establishments rather than new fi rms. New establishments can be generated from existing businesses (see Fairlie and Desai,
2020). Historically, the establishment survival rate has been very similar to the fi rm survival rate.
KAUFFMAN INDICATORS OF ENTREPRENEURSHIP

NATIONAL REPORT ON EARLY-STAGE ENTREPRENEURSHIP IN THE UNITED STATES: 2020 | 6
Kauffman Early-Stage Entrepreneurship (KESE) IndexThe KESE Index is a summary index that reflects early-stage entrepreneurial activity, broadly defined. It is an equally weighted index of the four indicators of early-stage entrepreneurship activity that has a mean of zero, and it is normalized based on the first two decades of available data (1996–2015).5
The KESE Index is a composite of the four indicators. In some cases, therefore, an index score may be driven by one very high or low indicator. As such, for more specific insights, we recommend that users focus primarily on each individual indicator and less on the overall composite score.
Table 1 provides values for the four indicators and the KESE Index for the United States in 2020.
TABLE 1 KAUFFMAN INDICATORS OF ENTREPRENEURSHIP AND KESE INDEX (2020)
RATE OF NEW ENTREPRENEURS
OPPORTUNITY SHARE OF NEW
ENTREPRENEURS
STARTUP EARLY JOB CREATION
STARTUP EARLY SURVIVAL RATE
KAUFFMAN EARLY-STAGE
ENTREPRENEURSHIP (KESE) INDEX
Percent of adults becoming entrepreneurs in a given month, year average
Percent of entrepreneurs driven
by opportunity
Jobs created by startups per 1,000 people
Percent of firms surviving one year
after founding
Equally weighted average of four
indicators
0.38% 69.8% 5.0 78.1% -0.2
5. The KESE Index is normalized using Z-scores for each variable for the first two years of available data (1996-2015) to fix the measure over time and capture variation over essentially two business cycles. Over this period, the index is normalized to have a mean of zero and a standard deviation of one. This methodological adjustment in the index calculation started in 2020 (see Fairlie and Desai, 2020).
The KESE Index presents a snapshot of early-stage entrepreneurial activity and evenly
weights contributions from the four indicators. It can be used to track changes in
entrepreneurial activity over time.
KAUFFMAN EARLY-STAGE ENTREPRENEURSHIP
(KESE) INDEX
KAUFFMAN INDICATORS OF ENTREPRENEURSHIP

NATIONAL REPORT ON EARLY-STAGE ENTREPRENEURSHIP IN THE UNITED STATES: 2020 | 7
NATIONAL TRENDS IN THE RATE OF NEW ENTREPRENEURSThe rate of new entrepreneurs reflects how many adults start a business, on average each month, in a year. Figure 1 presents the rate of new entrepreneurs from 1996 to 2020. In 2020, an average of 0.38 percent of the adult population, or 380 out of 100,000 adults, created a new business each month.6
The rate of new entrepreneurs increased sharply from 2019 to 2020. During tumultuous times such as the COVID-19 pandemic, the rate of new entrepreneurs can increase substantially as businesses close and restart, and workers are laid off and turn to part-time business activities. The measure is based on month-to-month movement into new business activity. The large-scale damage to the economy that began near the end of March 2020 showed up in more movement into and out of self-employment and new business activity during 2020 than in previous years. The Great Recession also witnessed an increase in the rate of new entrepreneurs, but this increase was much smaller than the unprecedented pandemic-induced recession of 2020.
1996 1998 2000 2002 2004 2006 2008 2010 2012 2014 2016 2018 20200.0%
0.1%
0.2%
0.3%
0.4%
0.5%
FIGURE 1 RATE OF NEW ENTREPRENEURS OVER TIME (1996–2020)
Source: Estimates calculated from the Current Population Survey
The rate of new entrepreneurs
captures the percentage of the adult,
non-business owner population that
starts a business each month. This
indicator captures all new business
owners, including those who own
incorporated or unincorporated
businesses, and those who are
employers or non-employers.7
RATE OF NEW ENTREPRENEURS
DEMOGRAPHIC TRENDS IN THE RATE OF NEW ENTREPRENEURS
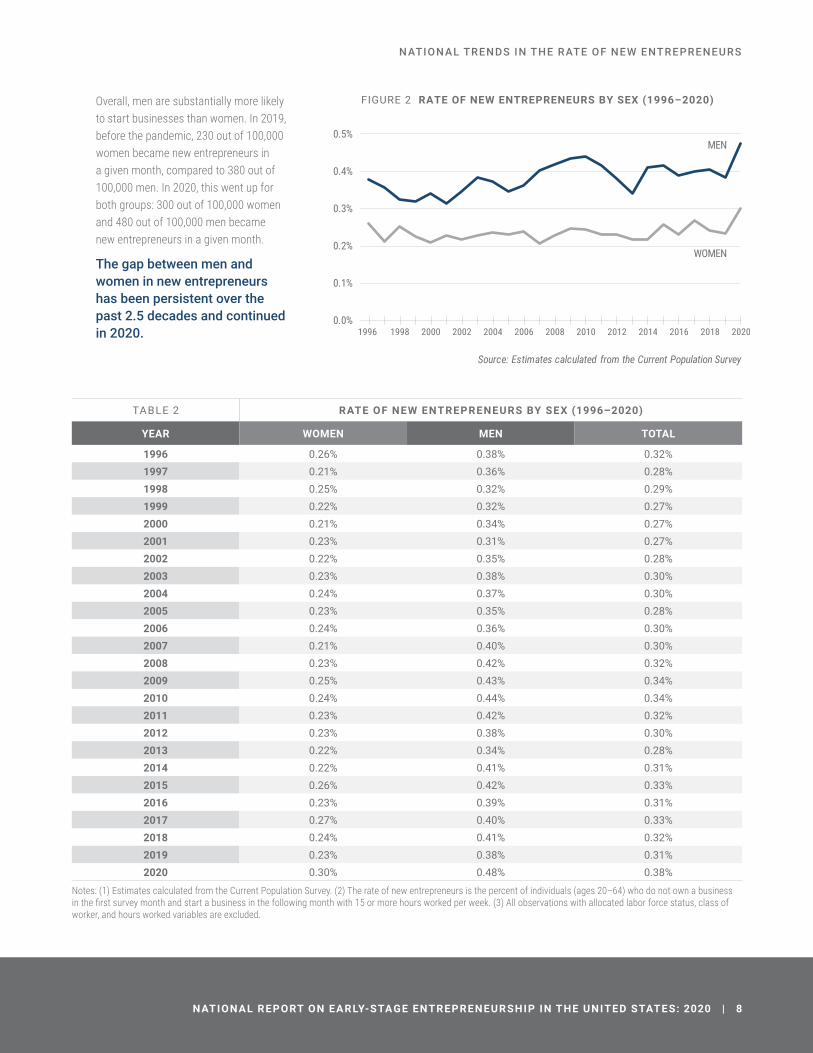
The rate of new entrepreneurs increased substantially for both women and men. Figure 2 and Table 2 show these trends. For women, the rate of new entrepreneurs increased from 0.23 percent in 2019 to 0.30 percent in 2020. For men, it increased from 0.38 percent in 2019 to 0.48 percent in 2020.
During tumultuous times such as the COVID-19 pandemic, the rate of new entrepreneurs can increase substantially as businesses close and restart, and workers are laid off and turn to part-time business activities.
6. Estimates of annual business creation rates would be approximately six to eight times higher. They are not twelve times higher than monthly rates because an individual could start and exit the business multiple times in the same year. See Fairlie and Desai (2020).
7. All observations with allocated labor force status, class of worker, and hours worked variables are excluded.
NATIONAL TRENDS IN THE RATE OF NEW ENTREPRENEURS
NATIONAL REPORT ON EARLY-STAGE ENTREPRENEURSHIP IN THE UNITED STATES: 2020 | 8
FIGURE 2 RATE OF NEW ENTREPRENEURS BY SEX (1996–2020)
Source: Estimates calculated from the Current Population Survey
MEN
WOMEN
1996 1998 2000 2002 2004 2006 2008 2010 2012 2014 2016 2018 20200.0%
0.1%
0.2%
0.3%
0.4%
0.5%
Overall, men are substantially more likely to start businesses than women. In 2019, before the pandemic, 230 out of 100,000 women became new entrepreneurs in a given month, compared to 380 out of 100,000 men. In 2020, this went up for both groups: 300 out of 100,000 women and 480 out of 100,000 men became new entrepreneurs in a given month.
The gap between men and women in new entrepreneurs has been persistent over the past 2.5 decades and continued in 2020.
TABLE 2 RATE OF NEW ENTREPRENEURS BY SEX (1996–2020)
YEAR WOMEN MEN TOTAL
1996 0.26% 0.38% 0.32%1997 0.21% 0.36% 0.28%1998 0.25% 0.32% 0.29%1999 0.22% 0.32% 0.27%2000 0.21% 0.34% 0.27%2001 0.23% 0.31% 0.27%2002 0.22% 0.35% 0.28%2003 0.23% 0.38% 0.30%2004 0.24% 0.37% 0.30%2005 0.23% 0.35% 0.28%2006 0.24% 0.36% 0.30%2007 0.21% 0.40% 0.30%2008 0.23% 0.42% 0.32%2009 0.25% 0.43% 0.34%2010 0.24% 0.44% 0.34%2011 0.23% 0.42% 0.32%2012 0.23% 0.38% 0.30%2013 0.22% 0.34% 0.28%2014 0.22% 0.41% 0.31%2015 0.26% 0.42% 0.33%2016 0.23% 0.39% 0.31%2017 0.27% 0.40% 0.33%2018 0.24% 0.41% 0.32%2019 0.23% 0.38% 0.31%2020 0.30% 0.48% 0.38%
Notes: (1) Estimates calculated from the Current Population Survey. (2) The rate of new entrepreneurs is the percent of individuals (ages 20–64) who do not own a business in the first survey month and start a business in the following month with 15 or more hours worked per week. (3) All observations with allocated labor force status, class of worker, and hours worked variables are excluded.
NATIONAL TRENDS IN THE RATE OF NEW ENTREPRENEURS

NATIONAL REPORT ON EARLY-STAGE ENTREPRENEURSHIP IN THE UNITED STATES: 2020 | 9
The rate of new entrepreneurs increased sharply for all ethnic and racial groups.8
Figure 3 and Table 3 provide estimates of the rate of new entrepreneurs by race and ethnicity.
Over most of the time period covered, the rate of new entrepreneurs is highest among Latinos and lowest among African Americans.
WHITE BLACK
LATINO
ASIAN
0.0%
0.1%
0.2%
0.3%
0.4%
FIGURE 3 RATE OF NEW ENTREPRENEURS BY RACE AND ETHNICITY (1996–2020)
Source: Estimates calculated from the Current Population Survey
0.5%
0.6%
Source: Estimates calculated from the Current Population Survey.
1996 1998 2000 2002 2004 2006 2008 2010 2012 2014 2016 2018 2020
TABLE 3 RATE OF NEW ENTREPRENEURS BY RACE AND ETHNICITY (1996–2020)
YEAR ASIAN BLACK LATINO WHITE TOTAL
1996 0.29% 0.21% 0.32% 0.33% 0.32%1997 0.23% 0.19% 0.32% 0.29% 0.28%1998 0.25% 0.18% 0.27% 0.31% 0.29%1999 0.24% 0.21% 0.31% 0.28% 0.27%2000 0.22% 0.23% 0.29% 0.28% 0.27%2001 0.30% 0.21% 0.29% 0.27% 0.27%2002 0.26% 0.24% 0.30% 0.28% 0.28%2003 0.29% 0.23% 0.40% 0.30% 0.30%2004 0.28% 0.22% 0.34% 0.31% 0.30%2005 0.26% 0.23% 0.31% 0.29% 0.28%2006 0.31% 0.24% 0.34% 0.30% 0.30%2007 0.33% 0.22% 0.40% 0.30% 0.30%2008 0.34% 0.22% 0.46% 0.31% 0.32%2009 0.31% 0.27% 0.46% 0.33% 0.34%2010 0.37% 0.24% 0.56% 0.31% 0.34%2011 0.32% 0.23% 0.52% 0.29% 0.32%2012 0.31% 0.21% 0.40% 0.29% 0.30%2013 0.28% 0.19% 0.38% 0.27% 0.28%2014 0.33% 0.22% 0.46% 0.29% 0.31%2015 0.29% 0.23% 0.46% 0.32% 0.33%2016 0.34% 0.22% 0.48% 0.28% 0.31%2017 0.31% 0.30% 0.50% 0.30% 0.33%2018 0.33% 0.24% 0.51% 0.29% 0.32%2019 0.30% 0.24% 0.44% 0.29% 0.31%2020 0.35% 0.38% 0.52% 0.36% 0.38%
Notes: (1) Estimates calculated from the Current Population Survey. (2) The rate of new entrepreneurs is the percent of individuals (ages 20–64) who do not own a business in the fi rst survey month and start a business in the following month with 15 or more hours worked per week. (3) Race and Latino codes changed in 2003. Estimates for 2003 only include individuals reporting one race. (4) All observations with allocated labor force status, class of worker, and hours worked variables are excluded.
8. See https://www.census.gov/topics/population/race/about.html for Census classifi cations. We use categories for which there were suffi cient sample sizes to present accurate estimates. As a result, we are unable to include data for Native American, Native Hawaiian, or individuals of two or more races.
NATIONAL TRENDS IN THE RATE OF NEW ENTREPRENEURS

NATIONAL REPORT ON EARLY-STAGE ENTREPRENEURSHIP IN THE UNITED STATES: 2020 | 10
The rate of new entrepreneurs increased substantially for both immigrants and the native-born population in 2020, but it continues to remain higher for immigrants. The 2020 rate of new entrepreneurs among immigrants is 0.59 percent, which is substantially higher than the 0.34 percent rate for the native born. Figure 4 and Table 4 report estimates of the rate of new entrepreneurs by nativity.
TABLE 4 RATE OF NEW ENTREPRENEURS BY NATIVITY (1996–2020)
YEAR IMMIGRANT NATIVE-BORN TOTAL
1996 0.36% 0.31% 0.32%1997 0.33% 0.27% 0.28%1998 0.31% 0.28% 0.29%1999 0.32% 0.26% 0.27%2000 0.32% 0.26% 0.27%2001 0.31% 0.26% 0.27%2002 0.36% 0.26% 0.28%2003 0.38% 0.29% 0.30%2004 0.41% 0.28% 0.30%2005 0.33% 0.28% 0.28%2006 0.38% 0.28% 0.30%2007 0.46% 0.27% 0.30%2008 0.52% 0.28% 0.32%2009 0.51% 0.30% 0.34%2010 0.62% 0.28% 0.34%2011 0.55% 0.27% 0.32%2012 0.49% 0.26% 0.30%2013 0.43% 0.25% 0.28%2014 0.52% 0.27% 0.31%2015 0.53% 0.29% 0.33%2016 0.52% 0.26% 0.31%2017 0.56% 0.28% 0.33%2018 0.53% 0.27% 0.32%2019 0.44% 0.28% 0.31%2020 0.59% 0.34% 0.38%
Notes: (1) Estimates calculated from the Current Population Survey. (2) The rate of new entrepreneurs is the percent of individuals (ages 20–64) who do not own a business in the first survey month and start a business in the following month with 15 or more hours worked per week. (3) All observations with allocated labor force status, class of worker, and hours worked variables are excluded.
0.0%
0.1%
0.2%
0.3%
0.4%
0.7%
FIGURE 4 RATE OF NEW ENTREPRENEURS BY NATIVITY (1996–2020)
Source: Estimates calculated from the Current Population Survey
IMMIGRANT
NATIVE-BORN
0.5%
0.6%
1996 1998 2000 2002 2004 2006 2008 2010 2012 2014 2016 2018 2020
NATIONAL TRENDS IN THE RATE OF NEW ENTREPRENEURS

NATIONAL REPORT ON EARLY-STAGE ENTREPRENEURSHIP IN THE UNITED STATES: 2020 | 11
Figure 5 and Table 5 report estimates of the rate of new entrepreneurs by age group. All of the age groups experienced sharp increases in the rate of new entrepreneurs in 2020. The rate of new entrepreneurs is lowest among the youngest group aged 20-34 years (0.28 percent) and highest in the age group of 45-54 years (0.49 percent).
35–44
0.0%
0.1%
0.2%
0.3%
0.4%
Source: Estimates calculated from the Current Population Survey
0.5%
FIGURE 5 RATE OF NEW ENTREPRENEURS BY AGE GROUP (1996–2020)
20–34
45–54
55–64
1996 1998 2000 2002 2004 2006 2008 2010 2012 2014 2016 2018 2020
TABLE 5 RATE OF NEW ENTREPRENEURS BY AGE GROUP (1996–2020)
YEAR AGES 20–34 AGES 35–44 AGES 45–54 AGES 55–64 TOTAL
1996 0.28% 0.31% 0.36% 0.34% 0.32%1997 0.27% 0.27% 0.28% 0.31% 0.28%1998 0.26% 0.31% 0.28% 0.33% 0.29%1999 0.26% 0.27% 0.28% 0.28% 0.27%2000 0.22% 0.27% 0.30% 0.34% 0.27%2001 0.23% 0.27% 0.30% 0.32% 0.27%2002 0.24% 0.29% 0.31% 0.30% 0.28%2003 0.23% 0.36% 0.31% 0.35% 0.30%2004 0.25% 0.31% 0.31% 0.37% 0.30%2005 0.27% 0.30% 0.26% 0.33% 0.28%2006 0.24% 0.30% 0.35% 0.34% 0.30%2007 0.24% 0.33% 0.35% 0.31% 0.30%2008 0.26% 0.34% 0.35% 0.36% 0.32%2009 0.24% 0.40% 0.36% 0.40% 0.34%2010 0.26% 0.40% 0.35% 0.39% 0.34%2011 0.27% 0.33% 0.37% 0.33% 0.32%2012 0.23% 0.34% 0.34% 0.34% 0.30%2013 0.18% 0.31% 0.36% 0.31% 0.28%2014 0.22% 0.33% 0.36% 0.37% 0.31%2015 0.24% 0.40% 0.37% 0.37% 0.33%
2016 0.22% 0.35% 0.36% 0.35% 0.31%
2017 0.24% 0.35% 0.39% 0.38% 0.33%2018 0.23% 0.36% 0.38% 0.37% 0.32%2019 0.24% 0.33% 0.36% 0.34% 0.31%2020 0.28% 0.41% 0.49% 0.41% 0.38%
Notes: (1) Estimates calculated from the Current Population Survey. (2) The rate of new entrepreneurs is the percent of individuals (ages 20–64) who do not own a business in the fi rst survey month and start a business in the following month with 15 or more hours worked per week. (3) All observations with allocated labor force status, class of worker, and hours worked variables are excluded.
All of the age groups experienced sharp increases in the rate of new entrepreneurs in 2020.
NATIONAL TRENDS IN THE RATE OF NEW ENTREPRENEURS

NATIONAL REPORT ON EARLY-STAGE ENTREPRENEURSHIP IN THE UNITED STATES: 2020 | 12
The rate of new entrepreneurs increased for all education groups in 2020. Figure 6 and Table 6 report estimates by education level. The rate of new entrepreneurs is highest among the group with less than a high school education (0.59 percent).9
LESS THAN HIGH SCHOOL
0.0%
0.1%
0.2%
0.3%
0.4%
FIGURE 6 RATE OF NEW ENTREPRENEURS BY EDUCATION (1996–2020)
Source: Estimates calculated from the Current Population Survey
0.5%
0.6%
0.7%
HIGH SCHOOL GRADUATE
COLLEGE GRADUATE SOME COLLEGE
1996 1998 2000 2002 2004 2006 2008 2010 2012 2014 2016 2018 2020
TABLE 6 RATE OF NEW ENTREPRENEURS BY EDUCATION (1996–2020)
YEAR LESS THAN HIGH SCHOOL
HIGH SCHOOL GRADUATE
SOME COLLEGE
COLLEGE GRADUATE TOTAL
1996 0.39% 0.31% 0.33% 0.31% 0.32%1997 0.35% 0.27% 0.31% 0.26% 0.28%1998 0.33% 0.30% 0.30% 0.29% 0.29%1999 0.29% 0.29% 0.29% 0.26% 0.27%2000 0.35% 0.29% 0.28% 0.26% 0.27%2001 0.31% 0.26% 0.27% 0.31% 0.27%2002 0.35% 0.29% 0.27% 0.31% 0.28%2003 0.44% 0.31% 0.32% 0.29% 0.30%2004 0.39% 0.29% 0.30% 0.33% 0.30%2005 0.35% 0.28% 0.31% 0.29% 0.28%2006 0.38% 0.29% 0.33% 0.30% 0.30%2007 0.42% 0.30% 0.28% 0.33% 0.30%2008 0.46% 0.35% 0.30% 0.30% 0.32%2009 0.49% 0.38% 0.30% 0.34% 0.34%2010 0.59% 0.34% 0.31% 0.33% 0.34%2011 0.57% 0.33% 0.31% 0.29% 0.32%2012 0.52% 0.34% 0.28% 0.28% 0.30%2013 0.48% 0.28% 0.27% 0.28% 0.28%2014 0.48% 0.34% 0.27% 0.32% 0.31%2015 0.50% 0.35% 0.33% 0.33% 0.33%2016 0.56% 0.32% 0.31% 0.28% 0.31%2017 0.61% 0.37% 0.31% 0.30% 0.33%2018 0.60% 0.37% 0.29% 0.29% 0.32%2019 0.44% 0.34% 0.29% 0.30% 0.31%2020 0.59% 0.42% 0.43% 0.36% 0.38%
Notes: (1) Estimates calculated from the Current Population Survey. (2) The rate of new entrepreneurs is the percent of individuals (ages 20–64) who do not own a business in the fi rst survey month and start a business in the following month with 15 or more hours worked per week. (3) All observations with allocated labor force status, class of worker, and hours worked variables are excluded.
The rate of new entrepreneurs is highest among the group with less than a high school education.
9. This fi nding may partially refl ect a high level of necessity entrepreneurship for this group. See Fairlie and Fossen (2017).
NATIONAL TRENDS IN THE RATE OF NEW ENTREPRENEURS

NATIONAL REPORT ON EARLY-STAGE ENTREPRENEURSHIP IN THE UNITED STATES: 2020 | 13
Figure 7 and Table 7 report estimates of the rate of new entrepreneurs by veteran status. In 2020, the rate of new entrepreneurs increased sharply to 0.32 percent for veterans. The non-veteran rate increased to 0.39 percent in 2020.
0.0%
0.1%
0.2%
0.3%
0.4%
0.5%
FIGURE 7 RATE OF NEW ENTREPRENEURS BY VETERAN STATUS (1996–2020)
Source: Estimates calculated from the Current Population Survey
NON-VETERAN
VETERAN
1996 1998 2000 2002 2004 2006 2008 2010 2012 2014 2016 2018 2020
TABLE 7 RATE OF NEW ENTREPRENEURS BY VETERAN STATUS (1996–2020)
YEAR NON-VETERANS VETERANS TOTAL
1996 0.31% 0.36% 0.32%1997 0.27% 0.32% 0.28%1998 0.29% 0.27% 0.29%1999 0.26% 0.30% 0.27%2000 0.26% 0.32% 0.27%2001 0.26% 0.36% 0.27%2002 0.27% 0.32% 0.28%2003 0.30% 0.37% 0.30%2004 0.30% 0.31% 0.30%2005 0.28% 0.33% 0.28%2006 0.29% 0.35% 0.30%2007 0.30% 0.35% 0.30%2008 0.32% 0.35% 0.32%2009 0.34% 0.30% 0.34%2010 0.34% 0.27% 0.34%2011 0.32% 0.30% 0.32%2012 0.30% 0.28% 0.30%2013 0.28% 0.23% 0.28%2014 0.31% 0.31% 0.31%2015 0.34% 0.26% 0.33%2016 0.31% 0.25% 0.31%2017 0.34% 0.21% 0.33%2018 0.32% 0.26% 0.32%2019 0.31% 0.19% 0.31%2020 0.39% 0.32% 0.38%
Notes: (1) Estimates calculated from the Current Population Survey. (2) The rate of new entrepreneurs is the percent of individuals (ages 20–64) who do not own a business in the first survey month and start a business in the following month with 15 or more hours worked per week. (3) All observations with allocated labor force status, class of worker, and hours worked variables are excluded. (4) The total sample size is slightly larger than the sum of the veteran and non-veteran sample sizes from 1996 to 2005 because of missing values for veteran status in those years.
NATIONAL TRENDS IN THE RATE OF NEW ENTREPRENEURS

NATIONAL REPORT ON EARLY-STAGE ENTREPRENEURSHIP IN THE UNITED STATES: 2020 | 14
The rate of new entrepreneurs includes
entrepreneurs and businesses
of all types. It can be useful to
distinguish between individuals who
are “opportunity entrepreneurs,”
including those coming out of wage
and salary work, school, or other labor
market status, and individuals who
are “necessity entrepreneurs,” due
to unemployment.10 This distinction
offers some insight into the influence
of economic conditions on overall
business creation. The opportunity
share of new entrepreneurs reflects
the percent of the total number of
new entrepreneurs who were not
unemployed and not looking for a job
as they started the new business.
OPPORTUNITY SHARE OF NEW ENTREPRENEURS
1996 81.1%1997 79.5%1998 80.8%1999 83.9%2000 86.4%2001 83.0%2002 76.8%2003 77.1%
2004 79.3%2005 79.1%2006 80.8%2007 80.2%2008 80.7%2009 73.8%2010 74.2%2011 74.1%
TABLE 8 OPPORTUNITY SHARE OF NEW ENTREPRENEURS OVER TIME (1996–2020)
NATIONAL TRENDS IN THE OPPORTUNITY SHARE OF NEW ENTREPRENEURS The opportunity share represents new business activity that is inspired by opportunity rather than necessity (figure 8 and table 8). Nationally, the opportunity share of new entrepreneurs plummeted in 2020. It decreased from 86.9 percent in 2019 to 69.8 percent in 2020, representing the largest drop over the past 25 years and perhaps much longer.
The sharp decrease in the opportunity share in 2020 reflects the massive economic losses during the pandemic. As non-essential businesses closed to stop the rapid spread of COVID-19 and consumers cut back on in-person consumption, the share of new business creation originating from opportunities fell precipitously.
The decline in opportunity share of new entrepreneurs from 2019 to 2020 was 17.1 percentage points. In comparison, the drop in the opportunity share from 2008 to 2009 during the Great Recession was 6.9 percentage points.
FIGURE 8 OPPORTUNITY SHARE OF NEW ENTREPRENEURS OVER TIME (1996–2020)
Source: Estimates calculated from the Current Population Survey
55.0%
60.0%
65.0%
70.0%
75.0%
80.0%
85.0%
90.0%
95.0%
100.0%
50.0% 1996 1998 2000 2002 2004 2006 2008 2010 2012 2014 2016 2018 2020
The decline in opportunity share of new entrepreneurs from 2019 to 2020 was 17.1 percentage points. In comparison, the drop in the opportunity share from 2008 to 2009 during the Great Recession was 6.9 percentage points.
2012 78.4%2013 78.2%2014 79.6%2015 84.0%2016 86.3%2017 84.4%2018 86.2%2019 86.9%2020 69.8%
10. See Fairlie and Fossen (2017).
NATIONAL TRENDS IN THE OPPORTUNITY SHARE OF NEW ENTREPRENEURS

NATIONAL REPORT ON EARLY-STAGE ENTREPRENEURSHIP IN THE UNITED STATES: 2020 | 15
DEMOGRAPHIC TRENDS IN THE OPPORTUNITY SHARE OF NEW ENTREPRENEURS
We also examined trends in the opportunity share of new entrepreneurs by demographic groups. Three-year moving averages are reported to increase the precision of estimates. The opportunity share of new entrepreneurs decreased sharply for both women and men in 2020. In the past few years prior to the pandemic, there had been a general upward trend in the opportunity share for both women and men as the economy continued to grow (fi gure 9 reports estimates).
The opportunity share of new entrepreneurs is lower for men than for women, 78.2% compared to 84.9%. Furthermore, the opportunity share of new entrepreneurs for women has generally been more stable than that for men.
Source: Estimates calculated from the Current Population Survey
FIGURE 9 OPPORTUNITY SHARE OF NEW ENTREPRENEURS BY SEX (1998–2020)
60.0%
70.0%
80.0%
90.0%
100.0%
50.0%
MEN
WOMEN
1998 2000 2002 2004 2006 2008 2010 2012 2014 2016 2018 2020
Source: Estimates calculated from the Current Population Survey
FIGURE 10 OPPORTUNITY SHARE OF NEW ENTREPRENEURS BY RACE AND ETHNICITY (1998–2020)
60.0%
70.0%
80.0%
90.0%
100.0%
50.0%
1998 2000 2002 2004 2006 2008 2010 2012 2014 2016 2018 2020
BLACK LATINO
ASIAN
WHITE
The opportunity share of new entrepreneurs for women has generally been more stable than that for men.
All ethnic and racial groups experienced large decreases in the opportunity share of new entrepreneurs in 2020, reversing upward trends over the past few years. Figure 10 reports estimates of the opportunity share of new entrepreneurs by race and ethnicity. The opportunity share for Asians experienced the largest drop from 93.1 percent in 2019 to 82.7 percent in 2020. African Americans also experienced a relatively large drop in the opportunity share from 82.0 percent in 2019 to 75.7 percent in 2020.
All ethnic and racial groups experienced large decreases in the opportunity share of new entrepreneurs in 2020, reversing upward trends over the past few years.
NATIONAL TRENDS IN THE OPPORTUNITY SHARE OF NEW ENTREPRENEURS

NATIONAL REPORT ON EARLY-STAGE ENTREPRENEURSHIP IN THE UNITED STATES: 2020 | 16
The opportunity share of new entrepreneurs also decreased sharply for immigrants in 2020. Figure 11 reports estimates of the opportunity share of new entrepreneurs by nativity. The drop of 6.6 percentage points from 88.0 percent in 2019 to 81.4 percent in 2020 was larger than the drop of 4.2 percentage points for the native-born population. In general, however, the opportunity share is higher for immigrants than for native-born Americans.
Source: Estimates calculated from the Current Population Survey
FIGURE 11 OPPORTUNITY SHARE OF NEW ENTREPRENEURS BY NATIVITY (1998–2020)
60.0%
70.0%
80.0%
90.0%
100.0%
50.0%
IMMIGRANT
NATIVE-BORN
1998 2000 2002 2004 2006 2008 2010 2012 2014 2016 2018 2020
Figure 12 reports opportunity share of new entrepreneurs by age group. All age groups experienced large decreases in the opportunity share in 2020, reversing upward trends since the Great Recession. The indicator ranges between the oldest age group (81.7 percent) and the youngest age group (80 percent).
Source: Estimates calculated from the Current Population Survey
FIGURE 12 OPPORTUNITY SHARE OF NEW ENTREPRENEURS BY AGE GROUP (1998–2020)
60.0%
70.0%
80.0%
90.0%
100.0%
50.0%
20–34
55–64
35–44
45–54
1998 2000 2002 2004 2006 2008 2010 2012 2014 2016 2018 2020
All age groups experienced large decreases in the opportunity share in 2020, reversing upward trends since the Great Recession.
NATIONAL TRENDS IN THE OPPORTUNITY SHARE OF NEW ENTREPRENEURS

NATIONAL REPORT ON EARLY-STAGE ENTREPRENEURSHIP IN THE UNITED STATES: 2020 | 17
Source: Estimates calculated from the Current Population Survey
FIGURE 14 OPPORTUNITY SHARE OF NEW ENTREPRENEURS BY VETERAN STATUS (1998–2020)
60.0%
70.0%
80.0%
90.0%
100.0%
50.0%
VETERAN
NON-VETERAN
1998 2000 2002 2004 2006 2008 2010 2012 2014 2016 2018 2020
The opportunity share of new entrepreneurs also decreased in 2020 for all education levels. The opportunity share is generally higher with each education level. Figure 13 reports estimates of this indicator by education level. The lowest opportunity share of new entrepreneurs in 2020 was for less than high school (77.3 percent), and the highest was among high school graduates (83.1 percent).
Source: Estimates calculated from the Current Population Survey
FIGURE 13 OPPORTUNITY SHARE OF NEW ENTREPRENEURS BY EDUCATION (1998–2020)
60.0%
70.0%
80.0%
90.0%
100.0%
50.0%
1998 2000 2002 2004 2006 2008 2010 2012 2014 2016 2018 2020
HIGH SCHOOL GRADUATELESS THAN HIGH SCHOOL
COLLEGE GRADUATE
SOME COLLEGE
The opportunity share is generally higher with each education level.
Figure 14 reports estimates of the opportunity share of new entrepreneurs by veteran status. The opportunity share of new entrepreneurs decreased in 2020 among veterans, reversing a longer-term positive trend since the Great Recession. The opportunity share is lower among veterans (74.9 percent) than non-veterans (81.2 percent).
NATIONAL TRENDS IN THE OPPORTUNITY SHARE OF NEW ENTREPRENEURS

NATIONAL REPORT ON EARLY-STAGE ENTREPRENEURSHIP IN THE UNITED STATES: 2020 | 18
Startup early job creation measures
how many total jobs are created
by startups in their first year and is
normalized by the population.
STARTUP EARLY JOB CREATION
NATIONAL TRENDS IN STARTUP EARLY JOB CREATION The number of jobs created by startups in their first year was 5.0 jobs per 1,000 people in 2020, essentially unchanged from the previous year. Figure 15 presents the indicator from 1996 to 2020. The measure of jobs is from March 2020 (the last month of the first quarter), and thus it largely predates the pandemic-related changes in demand, supply, and public policy that started in full force after March 2020 (Fairlie 2020).
The longer-term trends in the level of startup early job creation are worrisome. Although the 2016–2020 rates represent the highest levels since 2008 and continue the general upward trend since 2012, levels remain substantially lower in recent years than they were prior to the Great Recession and especially during the 1990s. Furthermore, the past few years have not experienced an increase, raising concerns about a plateau. For comparison, startup early job creation per capita peaked at 7.9 in 1997, and it has since declined by almost a third.
FIGURE 15 STARTUP EARLY JOB CREATION OVER TIME (1996–2020)
Source: Calculated from the Business Employment Dynamics
2
3
4
5
6
7
8
JOBS
PER
1,0
00 P
EOPL
E
9
1
01996 1998 2000 2002 2004 2006 2008 2010 2012 2014 2016 2018 2020
Although the 2016–2020 rates represent the highest levels of startup early job creation since 2008 and continue the general upward trend since 2012, levels remain substantially lower in recent years than they were prior to the Great Recession and especially during the 1990s. Furthermore, the past few years have not experienced an increase, raising concerns about a plateau.
NATIONAL TRENDS IN EARLY STARTUP JOB CREATION

NATIONAL REPORT ON EARLY-STAGE ENTREPRENEURSHIP IN THE UNITED STATES: 2020 | 19
The startup early survival rate, an
early-stage indicator of business
performance, measures the percentage
of new employer establishments
that are still active after one year of
operation.
STARTUP EARLY SURVIVAL RATE
NATIONAL TRENDS IN THE STARTUP EARLY SURVIVAL RATE The startup early survival rate dropped from 79.4 percent in 2019 to 78.1 percent in 2020. This decline captures the early stages of the impact of the COVID-19 pandemic because it measures changes between March 2019 and March 2020. Figure 16 presents this indicator at the national level from 1996 to 2020.
Prior to 2020, the startup early survival rate trended upward from 75.3 percent in 2009, when it hit a low point in the Great Recession, to 79.4 percent in 2019. Since 2012, the startup early survival rate has remained relatively constant at between 79.2 percent and 79.7 percent. Survival rates generally show a pro-cyclical pattern. The drop in the startup early survival rate shows the early part of the pandemic-induced recession, but it does not capture the full extent of the pandemic in 2020 because it measures March to March changes instead of April to April or later month-to-month changes (Fairlie 2020).
FIGURE 16 STARTUP EARLY SURVIVAL RATE OVER TIME (1996–2020)
Source: Calculated from the Business Employment Dynamics
60.0%
65.0%
70.0%
75.0%
80.0%
85.0%
90.0%
1996 1998 2000 2002 2004 2006 2008 2010 2012 2014 2016 2018 2020
The drop in the startup early survival rate shows the early part of the pandemic-induced recession, but it does not capture the full extent of the pandemic in 2020.
NATIONAL TRENDS IN EARLY STARTUP SURVIVAL RATE

NATIONAL REPORT ON EARLY-STAGE ENTREPRENEURSHIP IN THE UNITED STATES: 2020 | 20
Kauffman Early-Stage Entrepreneurship (KESE) IndexFigure 17 and Table 9 present the KESE Index from 1996–2020. The KESE Index is centered at zero, which is the average over the first two decades of available data (1996–2015). Thus, a positive index value indicates that the index is above this two-decade average, and a negative value indicates that it is below this average, which essentially covers two business cycles.11
The KESE Index dropped substantially from 2019 to 2020. The index dropped from 1.1 in 2019 to -0.2 in 2020, which represents one of the largest single-year drops over the past 25 years. The index in 2019 was more than one standard deviation above its normalized value; whereas, the index in 2020 was below the mean. The few years prior to 2020 have some of the highest levels recorded over the past 25 years. The lowest point for the KESE Index was in 2009 at -1.9.
FIGURE 17 KAUFFMAN EARLY-STAGE ENTREPRENEURSHIP (KESE) INDEX OVER TIME (1996–2020)
Source: Calculated from CPS and BED data
-2.00
-1.50
0.00
0.50
1.00
1.50
-2.50
-1.00
-0.50
2.00
1996 1998 2000 2002 2004 2006 2008 2010 2012 2014 2016 2018 2020
Using the four key indicators, we create
the KESE Index, an equally weighted
index of the four normalized indicators
of entrepreneurship activity:
1) Rate of new entrepreneurs2) Opportunity share of new
entrepreneurs3) Startup early job creation4) Startup early survival rate
KESE INDEX
1996 1.41997 0.21998 0.51999 1.12000 1.32001 0.12002 -1.72003 -0.2
2004 0.42005 0.02006 1.02007 0.12008 0.02009 -1.92010 -1.42011 -1.0
TABLE 9 KESE INDEX OVER TIME
2012 -0.32013 -1.02014 0.12015 1.42016 1.22017 1.52018 1.22019 1.12020 -0.2
11. See Fairlie and Fossen. (12) The summary index is also rescaled so that a one-unit change in the index is the equivalent of a one-standard deviation change in the index (as measured by the annual variation over the same two-decade time period).
KAUFFMAN EARLY-STAGE ENTREPRENEURSHIP (KESE) INDEX

NATIONAL REPORT ON EARLY-STAGE ENTREPRENEURSHIP IN THE UNITED STATES: 2020 | 21
REFERENCESFairlie, R. 2020. “The Impact of COVID-19 on Small Business Owners: The First Three Months after
Social-Distancing Restrictions.” Journal of Economics and Management Strategy, 29(4): 727–740.
Fairlie, R. and Desai, S. 2020. “Early-Stage Entrepreneurship: Some Key Indicators and a Summary Index.” Research working paper series. Ewing Marion Kauffman Foundation.
Fairlie, R. and Fossen, F. 2017. “The Two Components of Business Creation: Opportunity versus Necessity Entrepreneurship.” Stanford Institute for Economic Policy Research Discussion Paper No. 17–014.
U.S. Bureau of Labor Statistics, Civilian Noninstitutional Population [CNP16OV], retrieved from FRED, Federal Reserve Bank of St. Louis. https://fred.stlouisfed.org/series/CNP16OV
U.S. Bureau of Labor Statistics. 2017. Labor Force Statistics from the Current Population Survey. (CPS). http://www.bls.gov/cps/
U.S. Census Bureau. 2017. Business Dynamics Statistics (BDS). https://www.census.gov/ces/dataproducts/bds/
REFERENCES

Explore the Kauffman Indicators further at: www.kauffman.org/indicators
Questions, inquiries/correspondence, and follow up: [email protected]
National Report on Early-Stage Entrepreneurship in the United States: 2020
4801 ROCKHILL ROADKANSAS CITY, MISSOURI 64110
816-932-1000 www.kauffman.org