Embed Size (px)
Citation preview
Annual Report
2011
NATIONAL REFERENCE LABORATORY CAMPYLOBACTER
(Food, Feed and Animal Health)
Department of Agriculture, Food and Marine,
Backweston Laboratory Complex,
Celbridge,
Co. Kildare.
2
Background
In 2006 following the designation of a number of additional European Union Reference
Laboratories (EURL’s) Member States (MS) were required under Article 33 of regulation
882 / 2004 to designate National Reference Laboratories (NRL) for each EURL. The De-
partments of Health and Agriculture, Food and the Marine assigned these NRL functions to
a number of laboratories within the Backweston Campus. Among the NRL’s (Food, Feed
and Animal Health) at Backweston are:
· NRL Salmonella
· NRL Campylobacter
· NRL E. coli
· NRL Listeria and Staphylococci
· NRL Antimicrobial Resistance
· NRL Parasites
· NRL TSE’s
In addition to testing official samples additional functions of NRL’s as specified in Article
33 of Regulation 882/2004 include:
(a) collaborating with the EURL’s in their area of competence;
(b) (b) coordinating, for their area of competence, the activities of official laboratories
responsible for the analysis of samples in accordance with Article 11;
(c) where appropriate, organising comparative tests between the official national laborato-
ries and ensuring an appropriate follow up of such comparative testing;
(d) ensuring the dissemination to the competent authority and official national laboratories
of information that the EURL’s supply;
(e) providing scientific and technical assistance to the competent authority for the imple-
mentation of coordinated control plans adopted in accordance with Article 53.
NR
L Ca
mp
ylob
acter: A
NN
UA
L REP
OR
T 20
11
3
Introduction
Campylobacteriosis in humans is caused by thermotolerant Campylobacter spp. and the infective dose
is generally low. The species most commonly associated with human infection is C. jejuni, followed
by C. coli, and C. lari. The incubation period in humans averages from two to five days. Patients may
experience mild to severe symptoms, with common clinical symptoms including watery, sometimes
bloody diarrhoea, abdominal pain, fever, headache and nausea. Usually, infections are self-limiting
and last only a few days. Infrequently, extra intestinal infections or post-infection complications such
as reactive arthritis and neurological disorders occur. C. jejuni has become the most recognised antece-
dent cause of Guillain-Barré syndrome, a polio-like form of paralysis that can result in respiratory fail-
ure and severe neurological dysfunction and even death (EFSA 2011).
Campylobacter spp. are widespread in nature. The principal reservoirs are the alimentary tract of wild
and domesticated birds and mammals. They are prevalent in food animals, such as poultry, cattle, pigs
and sheep, in pets, including cats and dogs, in wild birds and in environmental water sources. Animals,
however, rarely succumb to disease caused by these organisms. The bacteria can readily contaminate
various foodstuffs, including meat, raw milk and dairy products and less frequently fish and fishery
products, mussels and fresh vegetables. Among sporadic human cases, contact with live poultry, con-
sumption of poultry meat, drinking water from untreated water sources and contact with pets and other
animals have been identified as the major sources of infections. Cross contamination during food-
preparation in the home has also been described as an important transmission route. Raw milk and
contaminated drinking water have been causes of large outbreaks (EFSA 2011).
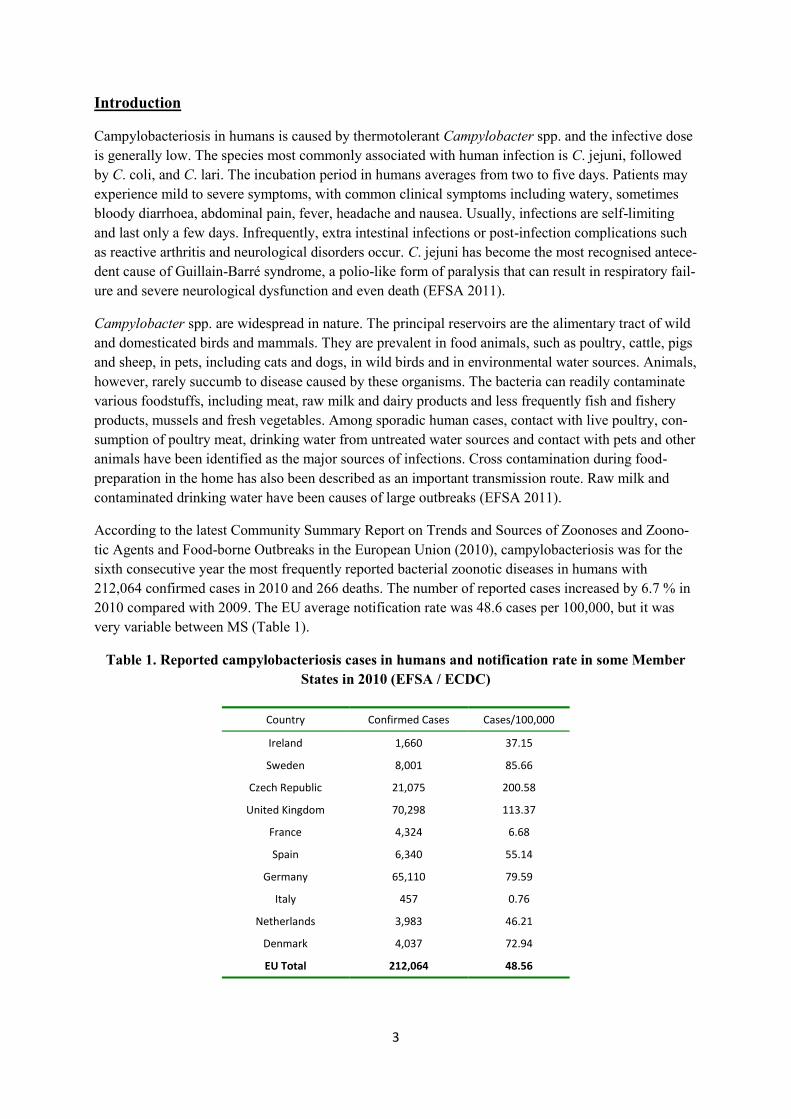
According to the latest Community Summary Report on Trends and Sources of Zoonoses and Zoono-
tic Agents and Food-borne Outbreaks in the European Union (2010), campylobacteriosis was for the
sixth consecutive year the most frequently reported bacterial zoonotic diseases in humans with
212,064 confirmed cases in 2010 and 266 deaths. The number of reported cases increased by 6.7 % in
2010 compared with 2009. The EU average notification rate was 48.6 cases per 100,000, but it was
very variable between MS (Table 1).
Table 1. Reported campylobacteriosis cases in humans and notification rate in some Member
States in 2010 (EFSA / ECDC)
Country Confirmed Cases Cases/100,000
Ireland 1,660 37.15
Sweden 8,001 85.66
Czech Republic 21,075 200.58
United Kingdom 70,298 113.37
France 4,324 6.68
Spain 6,340 55.14
Germany 65,110 79.59
Italy 457 0.76
Netherlands 3,983 46.21
Denmark 4,037 72.94
EU Total 212,064 48.56
4
The most frequently reported Campylobacter species in 2010 was C. jejuni which accounted for
93.4% of the confirmed cases characterised at the species level, it was followed by C. coli (2.3%), C.
lari (0.22%) and C. upsaliensis (0.006%).
Most of the test information reported on Campylobacter in foodstuffs relates to broiler meat and prod-
ucts thereof. At EU level, 29.6% of fresh broiler meat units were found positive for Campylobacter,
varying from 3.1% to 90.0% among reporting MS. In fresh turkey meat, 29.5% of tested units were
found positive for the organism. In samples of fresh pig meat and bovine meat, Campylobacter was
detected less frequently at levels of 0.6% and 0.4%, respectively. Campylobacter was detected in other
foodstuffs only occasionally, including some findings in milk from cows and cheeses.
In 2010, the proportion of Campylobacter-positive broiler flocks was 18.2% ranging from 0% to
92.9% among MSs. In the case of pigs and cattle, fewer MSs provided data, but on average 34.8% of
pigs and 51.2% of pig herds tested positive, while the corresponding figures for cattle were 6.2% and
24.3%.
Campylobacter was reported as the third causative agent of food-borne outbreaks after Salmonella and
viruses, with 470 reported outbreaks, i.e. 8.9%% of all reported outbreaks. There was a large variation
in human infections resulting from outbreaks in the different MS, ranging from <0.01 per 100,000 for
Spain to 4.59 for Malta; the average for the EU was 0.10. Broiler meat and raw milk were reported as
the most important food vehicles in food-borne Campylobacter outbreaks, responsible for 63.0% and
18.5% of outbreaks where a strong link could be confirmed.
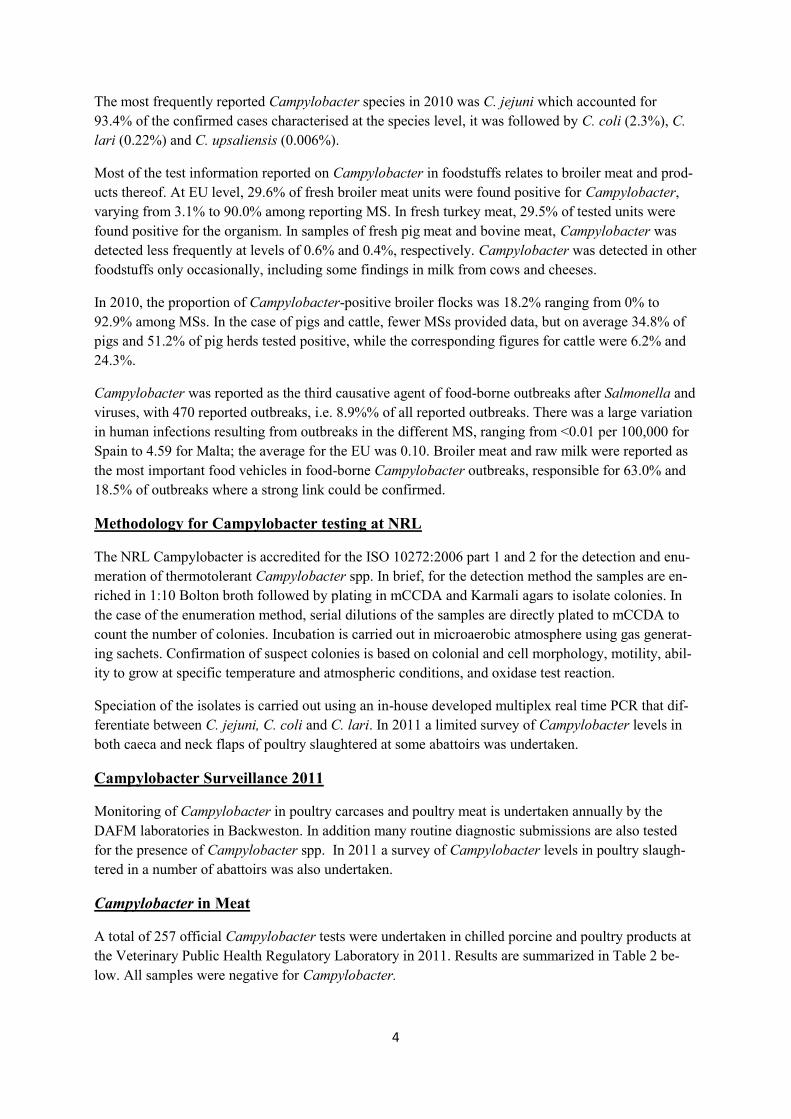
Methodology for Campylobacter testing at NRL
The NRL Campylobacter is accredited for the ISO 10272:2006 part 1 and 2 for the detection and enu-
meration of thermotolerant Campylobacter spp. In brief, for the detection method the samples are en-
riched in 1:10 Bolton broth followed by plating in mCCDA and Karmali agars to isolate colonies. In
the case of the enumeration method, serial dilutions of the samples are directly plated to mCCDA to
count the number of colonies. Incubation is carried out in microaerobic atmosphere using gas generat-
ing sachets. Confirmation of suspect colonies is based on colonial and cell morphology, motility, abil-
ity to grow at specific temperature and atmospheric conditions, and oxidase test reaction.
Speciation of the isolates is carried out using an in-house developed multiplex real time PCR that dif-
ferentiate between C. jejuni, C. coli and C. lari. In 2011 a limited survey of Campylobacter levels in
both caeca and neck flaps of poultry slaughtered at some abattoirs was undertaken.
Campylobacter Surveillance 2011
Monitoring of Campylobacter in poultry carcases and poultry meat is undertaken annually by the
DAFM laboratories in Backweston. In addition many routine diagnostic submissions are also tested
for the presence of Campylobacter spp. In 2011 a survey of Campylobacter levels in poultry slaugh-
tered in a number of abattoirs was also undertaken.
Campylobacter in Meat
A total of 257 official Campylobacter tests were undertaken in chilled porcine and poultry products at
the Veterinary Public Health Regulatory Laboratory in 2011. Results are summarized in Table 2 be-
low. All samples were negative for Campylobacter.
5
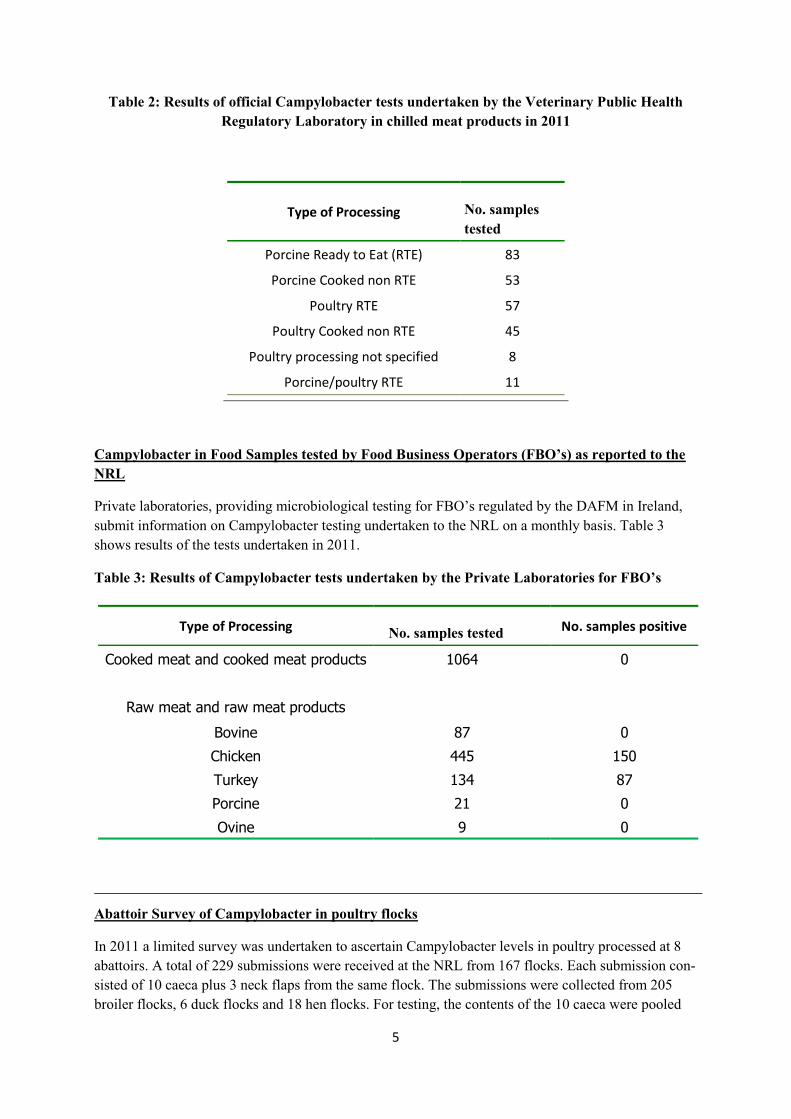
Table 2: Results of official Campylobacter tests undertaken by the Veterinary Public Health
Regulatory Laboratory in chilled meat products in 2011
Campylobacter in Food Samples tested by Food Business Operators (FBO’s) as reported to the
NRL
Private laboratories, providing microbiological testing for FBO’s regulated by the DAFM in Ireland,
submit information on Campylobacter testing undertaken to the NRL on a monthly basis. Table 3
shows results of the tests undertaken in 2011.
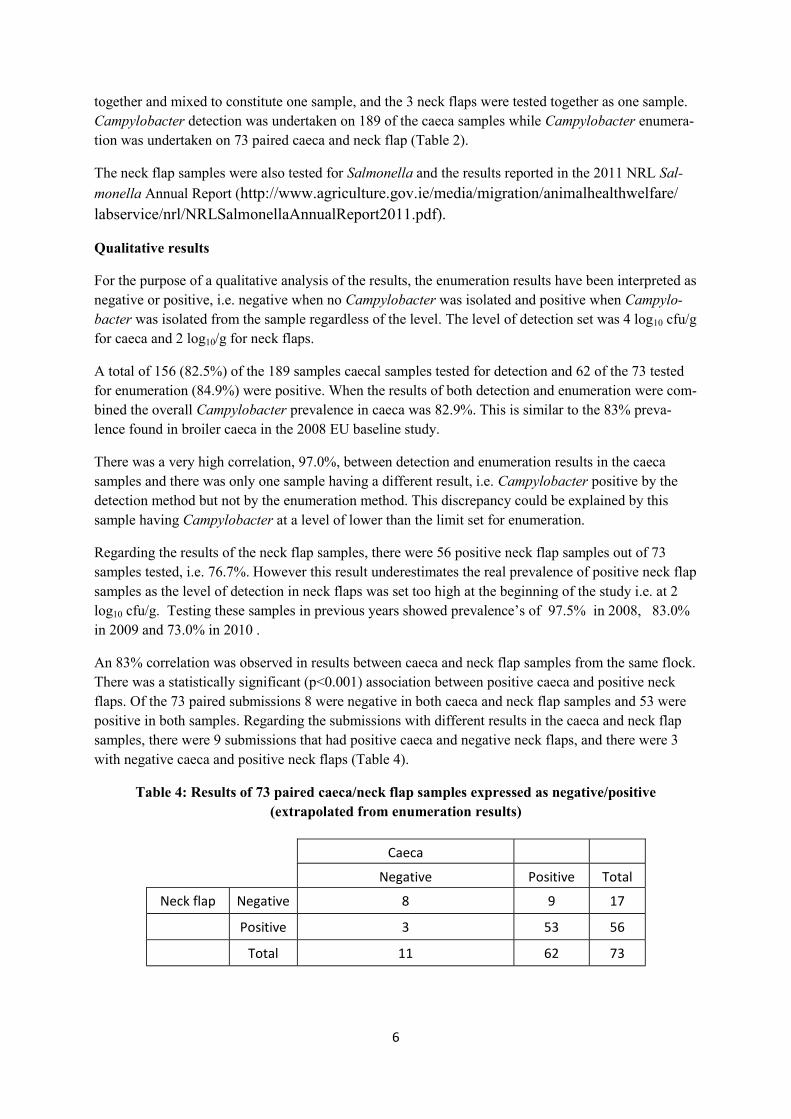
Table 3: Results of Campylobacter tests undertaken by the Private Laboratories for FBO’s
Abattoir Survey of Campylobacter in poultry flocks
In 2011 a limited survey was undertaken to ascertain Campylobacter levels in poultry processed at 8
abattoirs. A total of 229 submissions were received at the NRL from 167 flocks. Each submission con-
sisted of 10 caeca plus 3 neck flaps from the same flock. The submissions were collected from 205
broiler flocks, 6 duck flocks and 18 hen flocks. For testing, the contents of the 10 caeca were pooled
Type of Processing No. samples
tested
Porcine Ready to Eat (RTE) 83
Porcine Cooked non RTE 53
Poultry RTE 57
Poultry Cooked non RTE 45
Poultry processing not specified 8
Porcine/poultry RTE 11
Type of Processing No. samples tested
No. samples positive
Cooked meat and cooked meat products 1064 0
Raw meat and raw meat products
Bovine 87 0
Chicken 445 150
Turkey 134 87
Porcine 21 0
Ovine 9 0
6
together and mixed to constitute one sample, and the 3 neck flaps were tested together as one sample.
Campylobacter detection was undertaken on 189 of the caeca samples while Campylobacter enumera-
tion was undertaken on 73 paired caeca and neck flap (Table 2).
The neck flap samples were also tested for Salmonella and the results reported in the 2011 NRL Sal-
monella Annual Report (http://www.agriculture.gov.ie/media/migration/animalhealthwelfare/
labservice/nrl/NRLSalmonellaAnnualReport2011.pdf).
Qualitative results
For the purpose of a qualitative analysis of the results, the enumeration results have been interpreted as
negative or positive, i.e. negative when no Campylobacter was isolated and positive when Campylo-
bacter was isolated from the sample regardless of the level. The level of detection set was 4 log10 cfu/g
for caeca and 2 log10/g for neck flaps.
A total of 156 (82.5%) of the 189 samples caecal samples tested for detection and 62 of the 73 tested
for enumeration (84.9%) were positive. When the results of both detection and enumeration were com-
bined the overall Campylobacter prevalence in caeca was 82.9%. This is similar to the 83% preva-
lence found in broiler caeca in the 2008 EU baseline study.
There was a very high correlation, 97.0%, between detection and enumeration results in the caeca
samples and there was only one sample having a different result, i.e. Campylobacter positive by the
detection method but not by the enumeration method. This discrepancy could be explained by this
sample having Campylobacter at a level of lower than the limit set for enumeration.
Regarding the results of the neck flap samples, there were 56 positive neck flap samples out of 73
samples tested, i.e. 76.7%. However this result underestimates the real prevalence of positive neck flap
samples as the level of detection in neck flaps was set too high at the beginning of the study i.e. at 2
log10 cfu/g. Testing these samples in previous years showed prevalence’s of 97.5% in 2008, 83.0%
in 2009 and 73.0% in 2010 .
An 83% correlation was observed in results between caeca and neck flap samples from the same flock.
There was a statistically significant (p<0.001) association between positive caeca and positive neck
flaps. Of the 73 paired submissions 8 were negative in both caeca and neck flap samples and 53 were
positive in both samples. Regarding the submissions with different results in the caeca and neck flap
samples, there were 9 submissions that had positive caeca and negative neck flaps, and there were 3
with negative caeca and positive neck flaps (Table 4).
Table 4: Results of 73 paired caeca/neck flap samples expressed as negative/positive
(extrapolated from enumeration results)
Caeca
Negative Positive Total
Neck flap Negative 8 9 17
Positive 3 53 56
Total 11 62 73
7
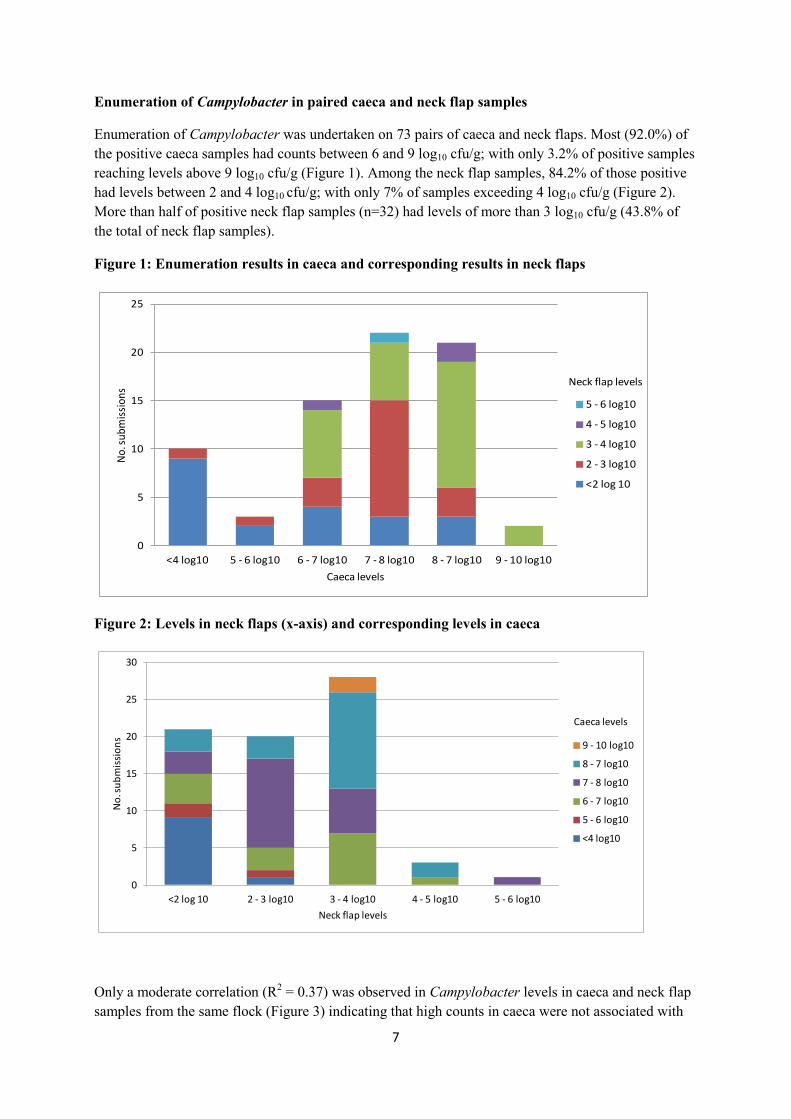
Enumeration of Campylobacter in paired caeca and neck flap samples
Enumeration of Campylobacter was undertaken on 73 pairs of caeca and neck flaps. Most (92.0%) of
the positive caeca samples had counts between 6 and 9 log10 cfu/g; with only 3.2% of positive samples
reaching levels above 9 log10 cfu/g (Figure 1). Among the neck flap samples, 84.2% of those positive
had levels between 2 and 4 log10 cfu/g; with only 7% of samples exceeding 4 log10 cfu/g (Figure 2).
More than half of positive neck flap samples (n=32) had levels of more than 3 log10 cfu/g (43.8% of
the total of neck flap samples).
Figure 1: Enumeration results in caeca and corresponding results in neck flaps
Figure 2: Levels in neck flaps (x-axis) and corresponding levels in caeca
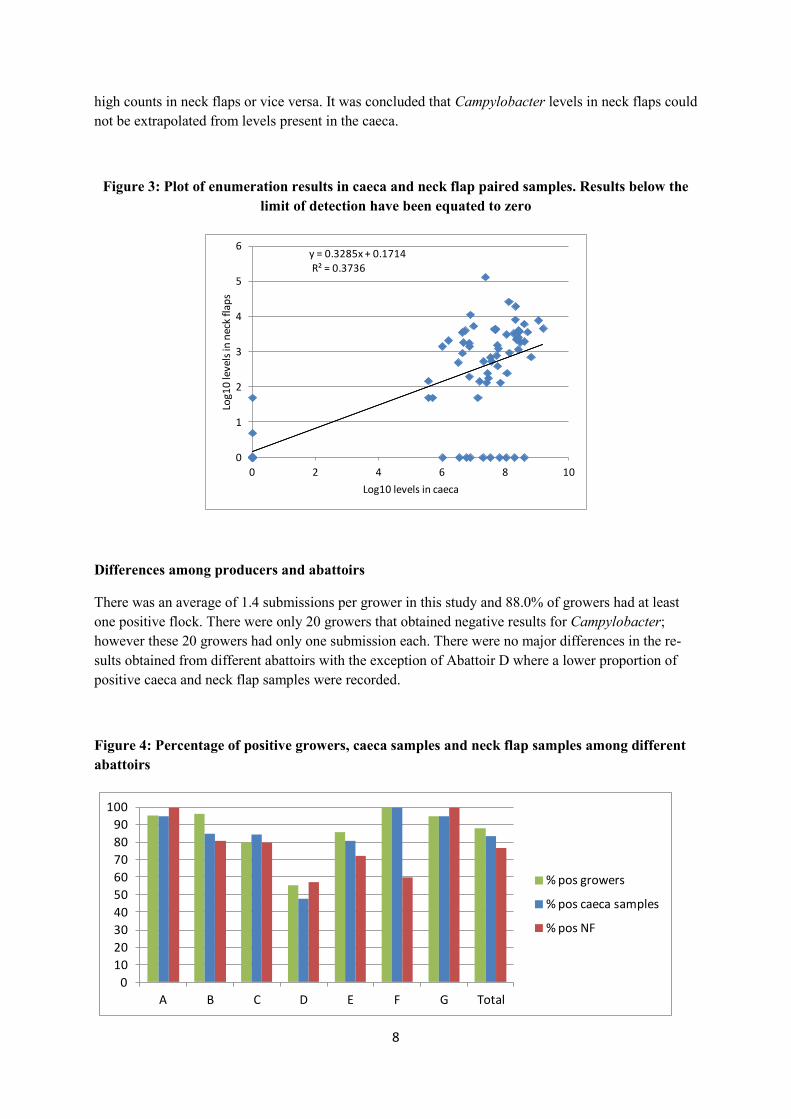
Only a moderate correlation (R2 = 0.37) was observed in Campylobacter levels in caeca and neck flap
samples from the same flock (Figure 3) indicating that high counts in caeca were not associated with
0
5
10
15
20
25
<4 log10 5 - 6 log10 6 - 7 log10 7 - 8 log10 8 - 7 log10 9 - 10 log10
No.
sub
mis
sion
s
Caeca levels
5 - 6 log10
4 - 5 log10
3 - 4 log10
2 - 3 log10
<2 log 10
Neck flap levels
0
5
10
15
20
25
30
<2 log 10 2 - 3 log10 3 - 4 log10 4 - 5 log10 5 - 6 log10
No
. su
bm
issi
on
s
Neck flap levels
9 - 10 log10
8 - 7 log10
7 - 8 log10
6 - 7 log10
5 - 6 log10
<4 log10
Caeca levels
8
high counts in neck flaps or vice versa. It was concluded that Campylobacter levels in neck flaps could
not be extrapolated from levels present in the caeca.
Figure 3: Plot of enumeration results in caeca and neck flap paired samples. Results below the
limit of detection have been equated to zero
Differences among producers and abattoirs
There was an average of 1.4 submissions per grower in this study and 88.0% of growers had at least
one positive flock. There were only 20 growers that obtained negative results for Campylobacter;
however these 20 growers had only one submission each. There were no major differences in the re-
sults obtained from different abattoirs with the exception of Abattoir D where a lower proportion of
positive caeca and neck flap samples were recorded.
Figure 4: Percentage of positive growers, caeca samples and neck flap samples among different
abattoirs
y = 0.3285x + 0.1714
R² = 0.3736
0
1
2
3
4
5
6
0 2 4 6 8 10
Log1
0 le
vels
in n
eck
flap
s
Log10 levels in caeca
0
10
20
30
40
50
60
70
80
90
100
A B C D E F G Total
% pos growers
% pos caeca samples
% pos NF
9
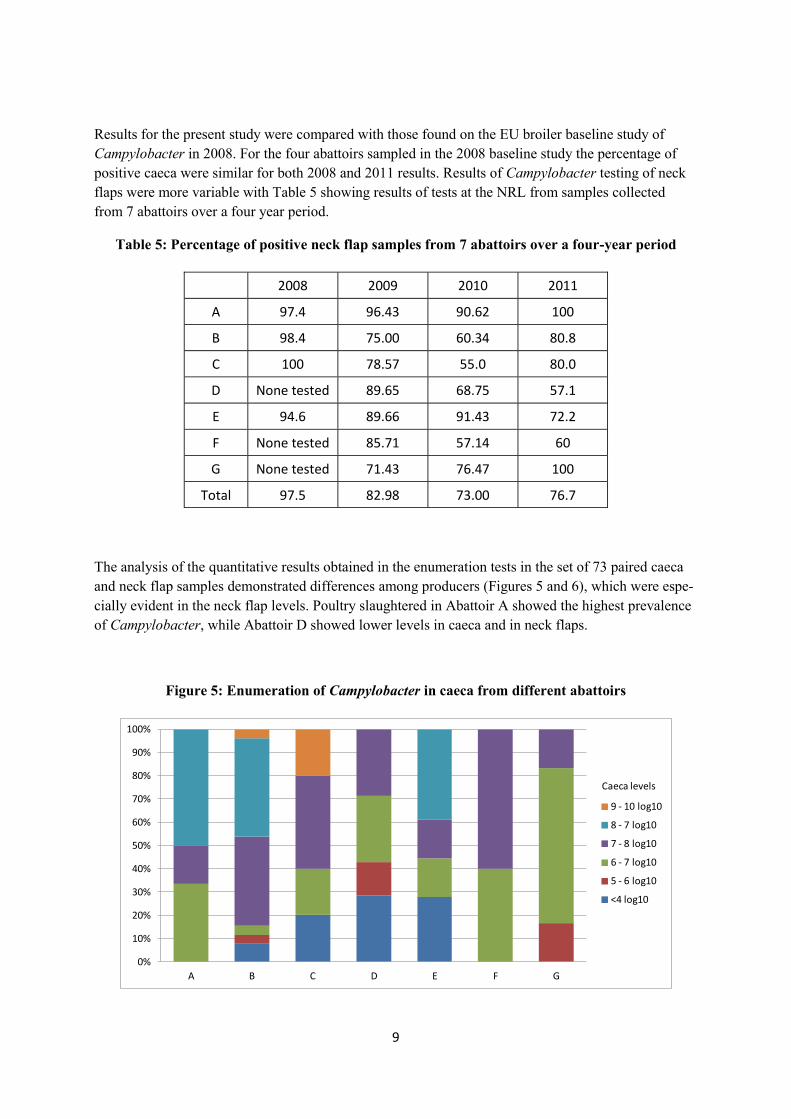
Results for the present study were compared with those found on the EU broiler baseline study of
Campylobacter in 2008. For the four abattoirs sampled in the 2008 baseline study the percentage of
positive caeca were similar for both 2008 and 2011 results. Results of Campylobacter testing of neck
flaps were more variable with Table 5 showing results of tests at the NRL from samples collected
from 7 abattoirs over a four year period.
Table 5: Percentage of positive neck flap samples from 7 abattoirs over a four-year period
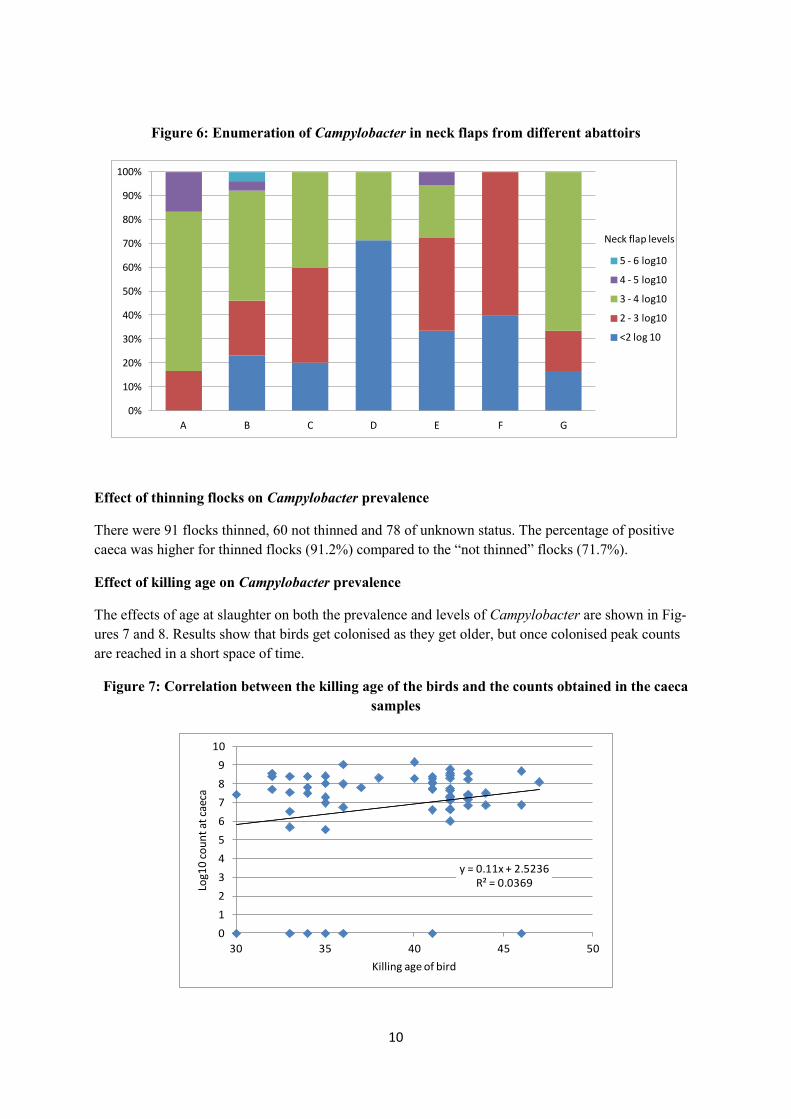
The analysis of the quantitative results obtained in the enumeration tests in the set of 73 paired caeca
and neck flap samples demonstrated differences among producers (Figures 5 and 6), which were espe-
cially evident in the neck flap levels. Poultry slaughtered in Abattoir A showed the highest prevalence
of Campylobacter, while Abattoir D showed lower levels in caeca and in neck flaps.
Figure 5: Enumeration of Campylobacter in caeca from different abattoirs
2008 2009 2010 2011
A 97.4 96.43 90.62 100
B 98.4 75.00 60.34 80.8
C 100 78.57 55.0 80.0
D None tested 89.65 68.75 57.1
E 94.6 89.66 91.43 72.2
F None tested 85.71 57.14 60
G None tested 71.43 76.47 100
Total 97.5 82.98 73.00 76.7
0%
10%
20%
30%
40%
50%
60%
70%
80%
90%
100%
A B C D E F G
9 - 10 log10
8 - 7 log10
7 - 8 log10
6 - 7 log10
5 - 6 log10
<4 log10
Caeca levels
10
Figure 6: Enumeration of Campylobacter in neck flaps from different abattoirs
Effect of thinning flocks on Campylobacter prevalence
There were 91 flocks thinned, 60 not thinned and 78 of unknown status. The percentage of positive
caeca was higher for thinned flocks (91.2%) compared to the “not thinned” flocks (71.7%).
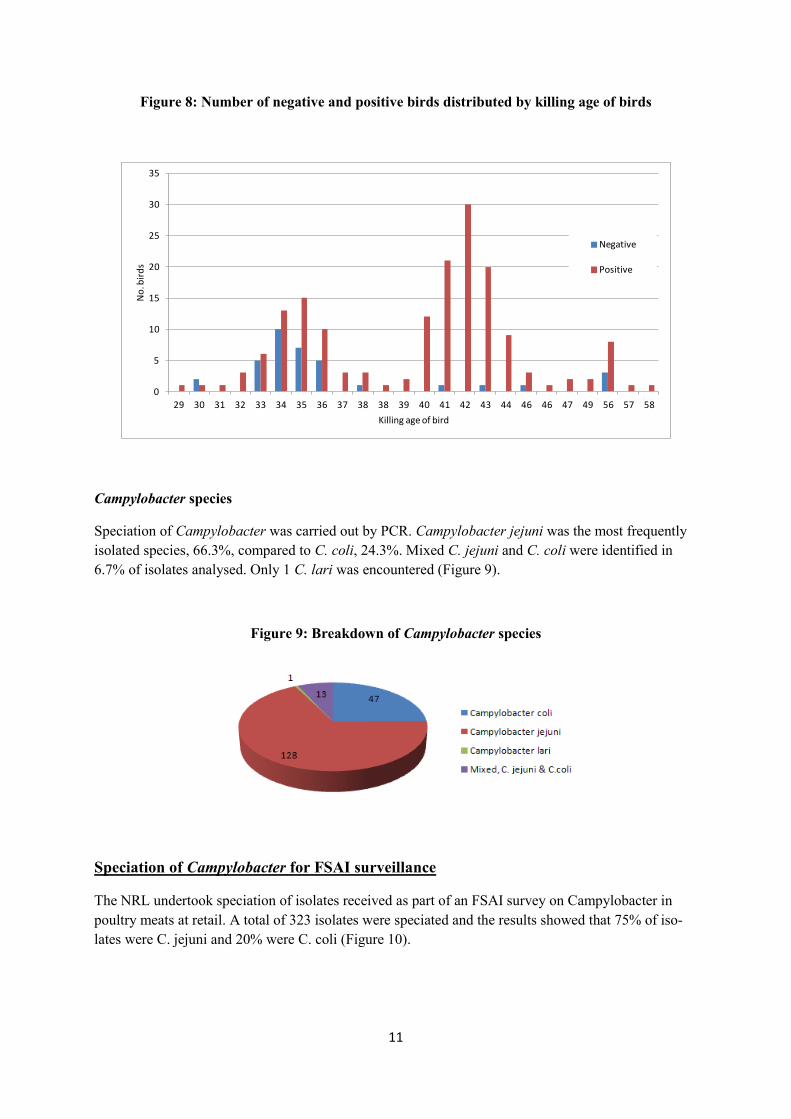
Effect of killing age on Campylobacter prevalence
The effects of age at slaughter on both the prevalence and levels of Campylobacter are shown in Fig-
ures 7 and 8. Results show that birds get colonised as they get older, but once colonised peak counts
are reached in a short space of time.
Figure 7: Correlation between the killing age of the birds and the counts obtained in the caeca
samples
0%
10%
20%
30%
40%
50%
60%
70%
80%
90%
100%
A B C D E F G
5 - 6 log10
4 - 5 log10
3 - 4 log10
2 - 3 log10
<2 log 10
Neck flap levels
y = 0.11x + 2.5236R² = 0.0369
0
1
2
3
4
5
6
7
8
9
10
30 35 40 45 50
Log1
0 c
ou
nt
at c
aeca
Killing age of bird
11
Figure 8: Number of negative and positive birds distributed by killing age of birds
Campylobacter species
Speciation of Campylobacter was carried out by PCR. Campylobacter jejuni was the most frequently
isolated species, 66.3%, compared to C. coli, 24.3%. Mixed C. jejuni and C. coli were identified in
6.7% of isolates analysed. Only 1 C. lari was encountered (Figure 9).
Figure 9: Breakdown of Campylobacter species
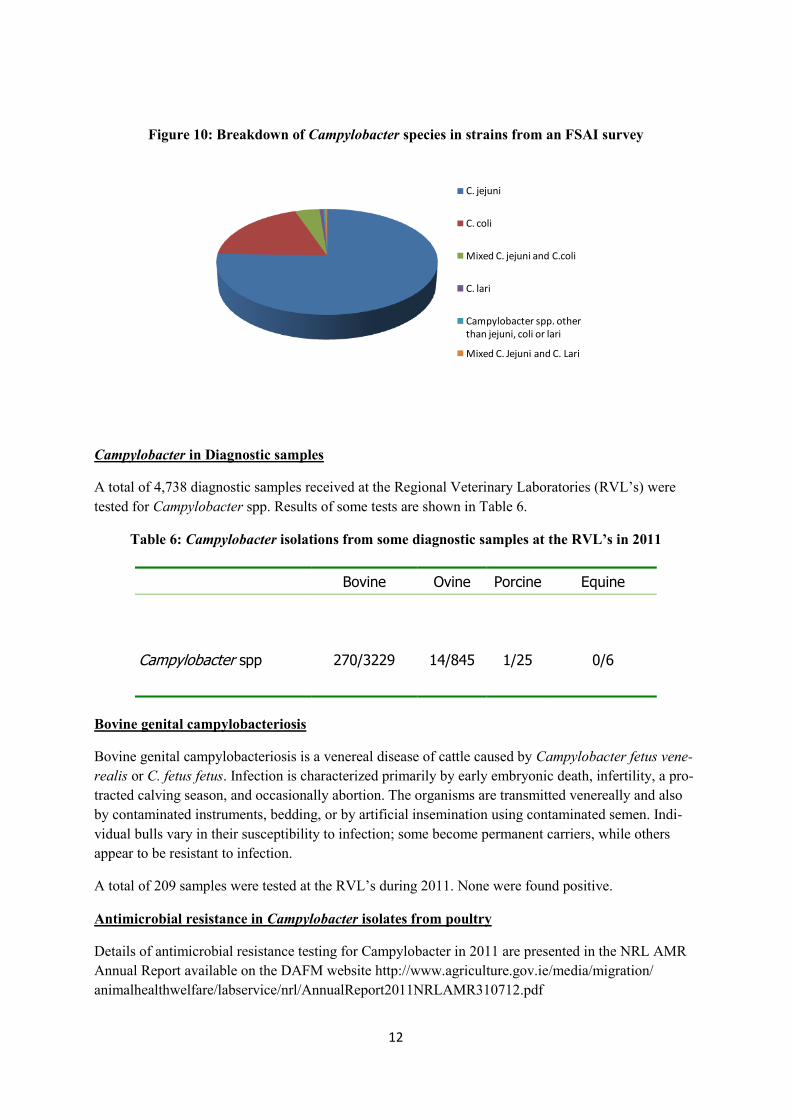
Speciation of Campylobacter for FSAI surveillance
The NRL undertook speciation of isolates received as part of an FSAI survey on Campylobacter in
poultry meats at retail. A total of 323 isolates were speciated and the results showed that 75% of iso-
lates were C. jejuni and 20% were C. coli (Figure 10).
0
5
10
15
20
25
30
35
29 30 31 32 33 34 35 36 37 38 38 39 40 41 42 43 44 46 46 47 49 56 57 58
No
. bir
ds
Killing age of bird
Negative
Positive
12
Figure 10: Breakdown of Campylobacter species in strains from an FSAI survey
Campylobacter in Diagnostic samples
A total of 4,738 diagnostic samples received at the Regional Veterinary Laboratories (RVL’s) were
tested for Campylobacter spp. Results of some tests are shown in Table 6.
Table 6: Campylobacter isolations from some diagnostic samples at the RVL’s in 2011
Bovine genital campylobacteriosis
Bovine genital campylobacteriosis is a venereal disease of cattle caused by Campylobacter fetus vene-
realis or C. fetus fetus. Infection is characterized primarily by early embryonic death, infertility, a pro-
tracted calving season, and occasionally abortion. The organisms are transmitted venereally and also
by contaminated instruments, bedding, or by artificial insemination using contaminated semen. Indi-
vidual bulls vary in their susceptibility to infection; some become permanent carriers, while others
appear to be resistant to infection.
A total of 209 samples were tested at the RVL’s during 2011. None were found positive.
Antimicrobial resistance in Campylobacter isolates from poultry
Details of antimicrobial resistance testing for Campylobacter in 2011 are presented in the NRL AMR
Annual Report available on the DAFM website http://www.agriculture.gov.ie/media/migration/
animalhealthwelfare/labservice/nrl/AnnualReport2011NRLAMR310712.pdf
C. jejuni
C. coli
Mixed C. jejuni and C.coli
C. lari
Campylobacter spp. other than jejuni, coli or lari
Mixed C. Jejuni and C. Lari
Bovine Ovine Porcine Equine
Campylobacter spp
270/3229
14/845
1/25
0/6
13
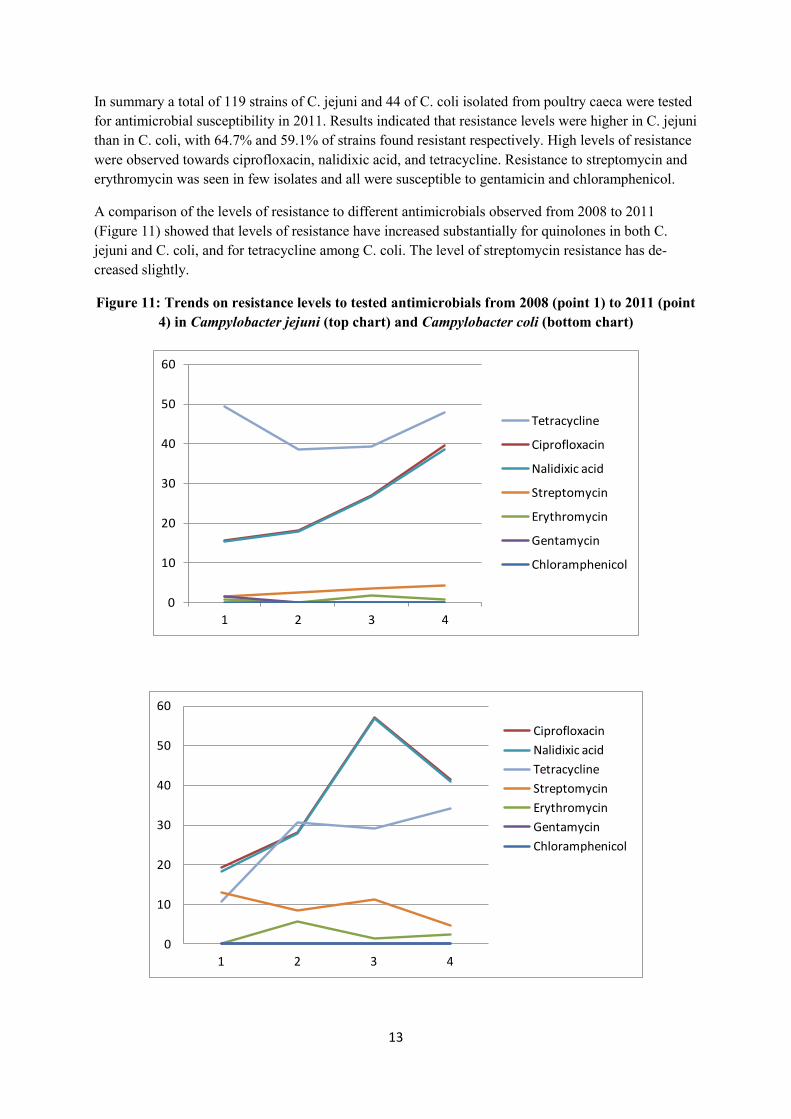
In summary a total of 119 strains of C. jejuni and 44 of C. coli isolated from poultry caeca were tested
for antimicrobial susceptibility in 2011. Results indicated that resistance levels were higher in C. jejuni
than in C. coli, with 64.7% and 59.1% of strains found resistant respectively. High levels of resistance
were observed towards ciprofloxacin, nalidixic acid, and tetracycline. Resistance to streptomycin and
erythromycin was seen in few isolates and all were susceptible to gentamicin and chloramphenicol.
A comparison of the levels of resistance to different antimicrobials observed from 2008 to 2011
(Figure 11) showed that levels of resistance have increased substantially for quinolones in both C.
jejuni and C. coli, and for tetracycline among C. coli. The level of streptomycin resistance has de-
creased slightly.
Figure 11: Trends on resistance levels to tested antimicrobials from 2008 (point 1) to 2011 (point
4) in Campylobacter jejuni (top chart) and Campylobacter coli (bottom chart)
0
10
20
30
40
50
60
1 2 3 4
Tetracycline
Ciprofloxacin
Nalidixic acid
Streptomycin
Erythromycin
Gentamycin
Chloramphenicol
0
10
20
30
40
50
60
1 2 3 4
Ciprofloxacin
Nalidixic acid
Tetracycline
Streptomycin
Erythromycin
Gentamycin
Chloramphenicol
14
Summary points
1. The percentage of Campylobacter positive poultry flocks and poultry meat samples remain
similar levels to those found in the 2008 baseline survey.
2. There is a significant correlation between positive flocks and positive neck flap samples.
3. In the event that targets levels for Campylobacter are considered the data presented in this re-
port might serve as a useful guide. Most positive flocks have counts between 6 and 9 log10 cfu/g; with
only 3.2% of positive samples reaching levels above 9 log10 cfu/g. Most of the positive neck flaps have
levels between 2 and 4 log10 cfu/g; with only 7% of samples exceeding levels of 4 log10 cfu/g. Ap-
proximately one half of neck flap samples have levels of more than 3 log10 cfu/g.
4. There is an association between the killing age and Campylobacter status of flock, with a higher
percentage of flocks killed late in life showing positive results. There is also an association between
thinning and the presence of Campylobacter in caeca.
5. One abattoir showed a significantly lower percentage of positive flocks in its suppliers and also
lower Campylobacter counts in positive samples.
Quality Manager: Don O’Grady, MSc
Tel: 353 1 6157148
Fax: 353 1 6157116
Email: [email protected]
Technical Manager: Montserrat Gutierrez, DVM, PhD
Tel: 353 1 6157222
Fax: 353 1 6157116
Email: [email protected]
NRL Contact & Head Division: John Egan, MVB, MVM, PhD, FRCVS
Tel: 353 1 6157138
Fax: 353 1 6157116
Email: [email protected]
15
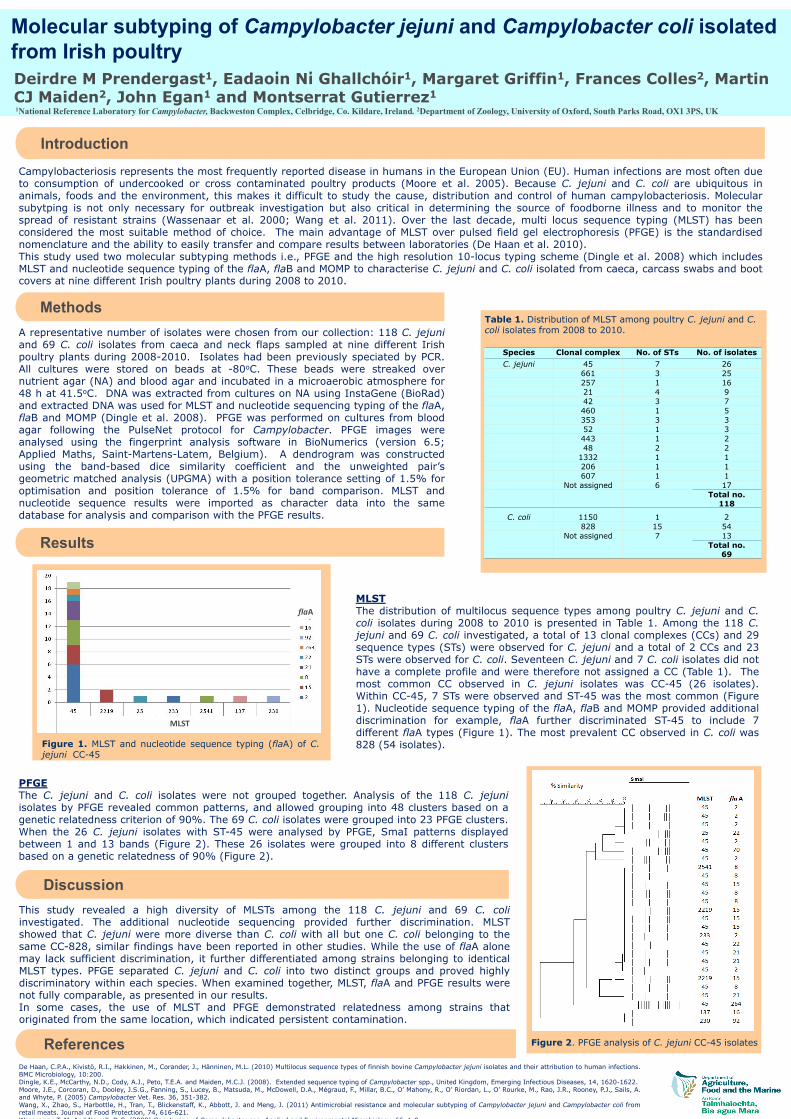
Deirdre M Prendergast1, Eadaoίn Nί Ghallchóir1, Margaret Griffin1, Frances Colles2, Martin CJ Maiden2, John Egan1 and Montserrat Gutierrez1
1National Reference Laboratory for Campylobacter, Backweston Complex, Celbridge, Co. Kildare, Ireland. 2Department of Zoology, University of Oxford, South Parks Road, OX1 3PS, UK
Introduction
Molecular subtyping of Campylobacter jejuni and Campylobacter coli isolated
from Irish poultry
Results
This study revealed a high diversity of MLSTs among the 118 C. jejuni and 69 C. coliinvestigated. The additional nucleotide sequencing provided further discrimination. MLSTshowed that C. jejuni were more diverse than C. coli with all but one C. coli belonging to thesame CC-828, similar findings have been reported in other studies. While the use of flaA alonemay lack sufficient discrimination, it further differentiated among strains belonging to identicalMLST types. PFGE separated C. jejuni and C. coli into two distinct groups and proved highlydiscriminatory within each species. When examined together, MLST, flaA and PFGE results werenot fully comparable, as presented in our results.In some cases, the use of MLST and PFGE demonstrated relatedness among strains thatoriginated from the same location, which indicated persistent contamination.
De Haan, C.P.A., Kivistö, R.I., Hakkinen, M., Corander, J., Hänninen, M.L. (2010) Multilocus sequence types of finnish bovine Campylobacter jejuni isolates and their attribution to human infections.BMC Microbiology, 10:200.Dingle, K.E., McCarthy, N.D., Cody, A.J., Peto, T.E.A. and Maiden, M.C.J. (2008). Extended sequence typing of Campylobacter spp., United Kingdom, Emerging Infectious Diseases, 14, 1620-1622.Moore, J.E., Corcoran, D., Dooley, J.S.G., Fanning, S., Lucey, B., Matsuda, M., McDowell, D.A., Mégraud, F., Millar, B.C., O’ Mahony, R., O’ Riordan, L., O’ Rourke, M., Rao, J.R., Rooney, P.J., Sails, A.and Whyte, P. (2005) Campylobacter Vet. Res. 36, 351-382.Wang, X., Zhao, S., Harbottle, H., Tran, T., Blickenstaff, K., Abbott, J. and Meng, J. (2011) Antimicrobial resistance and molecular subtyping of Campylobacter jejuni and Campylobacter coli fromretail meats. Journal of Food Protection, 74, 616-621.Wassenaar, T. M. And Newell, D.G. (2000) Genotyping of Campylobacter spp. Applied and Environmental Microbiology, 66, 1-9.
Campylobacteriosis represents the most frequently reported disease in humans in the European Union (EU). Human infections are most often dueto consumption of undercooked or cross contaminated poultry products (Moore et al. 2005). Because C. jejuni and C. coli are ubiquitous inanimals, foods and the environment, this makes it difficult to study the cause, distribution and control of human campylobacteriosis. Molecularsubytping is not only necessary for outbreak investigation but also critical in determining the source of foodborne illness and to monitor thespread of resistant strains (Wassenaar et al. 2000; Wang et al. 2011). Over the last decade, multi locus sequence typing (MLST) has beenconsidered the most suitable method of choice. The main advantage of MLST over pulsed field gel electrophoresis (PFGE) is the standardisednomenclature and the ability to easily transfer and compare results between laboratories (De Haan et al. 2010).This study used two molecular subtyping methods i.e., PFGE and the high resolution 10-locus typing scheme (Dingle et al. 2008) which includesMLST and nucleotide sequence typing of the flaA, flaB and MOMP to characterise C. jejuni and C. coli isolated from caeca, carcass swabs and bootcovers at nine different Irish poultry plants during 2008 to 2010.
A representative number of isolates were chosen from our collection: 118 C. jejuniand 69 C. coli isolates from caeca and neck flaps sampled at nine different Irishpoultry plants during 2008-2010. Isolates had been previously speciated by PCR.All cultures were stored on beads at -80oC. These beads were streaked overnutrient agar (NA) and blood agar and incubated in a microaerobic atmosphere for48 h at 41.5oC. DNA was extracted from cultures on NA using InstaGene (BioRad)and extracted DNA was used for MLST and nucleotide sequencing typing of the flaA,flaB and MOMP (Dingle et al. 2008). PFGE was performed on cultures from bloodagar following the PulseNet protocol for Campylobacter. PFGE images wereanalysed using the fingerprint analysis software in BioNumerics (version 6.5;Applied Maths, Saint-Martens-Latem, Belgium). A dendrogram was constructedusing the band-based dice similarity coefficient and the unweighted pair’sgeometric matched analysis (UPGMA) with a position tolerance setting of 1.5% foroptimisation and position tolerance of 1.5% for band comparison. MLST andnucleotide sequence results were imported as character data into the samedatabase for analysis and comparison with the PFGE results.
MLSTThe distribution of multilocus sequence types among poultry C. jejuni and C.coli isolates during 2008 to 2010 is presented in Table 1. Among the 118 C.jejuni and 69 C. coli investigated, a total of 13 clonal complexes (CCs) and 29sequence types (STs) were observed for C. jejuni and a total of 2 CCs and 23STs were observed for C. coli. Seventeen C. jejuni and 7 C. coli isolates did nothave a complete profile and were therefore not assigned a CC (Table 1). Themost common CC observed in C. jejuni isolates was CC-45 (26 isolates).Within CC-45, 7 STs were observed and ST-45 was the most common (Figure1). Nucleotide sequence typing of the flaA, flaB and MOMP provided additionaldiscrimination for example, flaA further discriminated ST-45 to include 7different flaA types (Figure 1). The most prevalent CC observed in C. coli was828 (54 isolates).
Table 1. Distribution of MLST among poultry C. jejuni and C. coli isolates from 2008 to 2010.
Figure 1. MLST and nucleotide sequence typing (flaA) of C.jejuni CC-45
PFGEThe C. jejuni and C. coli isolates were not grouped together. Analysis of the 118 C. jejuniisolates by PFGE revealed common patterns, and allowed grouping into 48 clusters based on agenetic relatedness criterion of 90%. The 69 C. coli isolates were grouped into 23 PFGE clusters.When the 26 C. jejuni isolates with ST-45 were analysed by PFGE, SmaI patterns displayedbetween 1 and 13 bands (Figure 2). These 26 isolates were grouped into 8 different clustersbased on a genetic relatedness of 90% (Figure 2).
Figure 2. PFGE analysis of C. jejuni CC-45 isolates
Species Clonal complex No. of STs No. of isolates
C. jejuni 45 7 26
661 3 25
257 1 16
21 4 9
42 3 7
460 1 5
353 3 3
52 1 3
443 1 2
48 2 2
1332 1 1
206 1 1
607 1 1
Not assigned 6 17
Total no.118
C. coli 1150 1 2
828 15 54
Not assigned 7 13
Total no.69
MLST
flaA
Methods
Discussion
References