Embed Size (px)
Citation preview
HomelandHomelandSecuritySecurity
National Population, Economic, and Infrastructure Impacts of Pandemic Influenza with Strategic RecommendationsPrepared by
National Infrastructure Simulation & Analysis CenterInfrastructure Analysis and Strategy DivisionOffi ce of Infrastructure ProtectionU.S. Department of Homeland Security
October 2007
For Offi cial Use Only (FOUO)
HomelandHomelandSecuritySecurity For Offi cial Use Only (FOUO)


FOR OFFICIAL USE ONLY
National Population, Economic, and Infrastructure Impacts of Pandemic
Influenza with Strategic Recommendations
10 October 2007
Prepared by: National Infrastructure Simulation & Analysis Center
Infrastructure Analysis and Strategy Division Office of Infrastructure Protection Department of Homeland Security
OFFICIAL USE ONLY May be exempt from public release under the Freedom of Information Act (5 U.S.C. 552), exemption number andcategory: 5: Privileged Information .
Department of Energy review required before public release Name/Org: James P. Smith, LANL
Date: 10 October 2007
FOR OFFICIAL USE ONLY
For additional information about this study or to discuss collaboration
opportunities with the Office of Infrastructure Protection, National Infrastructure
Simulation and Analysis Center (NISAC), please contact the Center using the
following e-mail address: [email protected].
the official views or policy of the U.S. Department of Homeland Security or the United States Government.
Disclaimer: The findings and recommendations expressed or implied in this analysis do not necessarily reflect

FOR OFFICIAL USE ONLY
Table of Contents Table of Contents........................................................................................................................... iii List of Figures ................................................................................................................................ vi List of Tables ................................................................................................................................. ix Acknowledgements.........................................................................................................................xi Abstract.........................................................................................................................................xiii Executive Summary .........................................................................................................................1
Introduction............................................................................................................................... 1 Approach................................................................................................................................... 1 Population Impacts.................................................................................................................... 2
Epidemiology ...................................................................................................................2 Workforce.........................................................................................................................2
Infrastructure Impacts ............................................................................................................... 3 Energy .............................................................................................................................3 Water and Wastewater Treatment ....................................................................................3 Telecommunications ........................................................................................................4 Public Health and Healthcare ...........................................................................................4 Transportation ..................................................................................................................4 Agriculture and Food .......................................................................................................5 Banking and Finance........................................................................................................5
Economic Impacts..................................................................................................................... 5 Uncertainty Analysis................................................................................................................. 6
Feasibility of Mitigation Strategies ..................................................................................6 Conclusions............................................................................................................................... 6
National Population, Economic, and Infrastructure Impacts of Pandemic Influenza with Strategic
Recommendations - Full Report.. ..............................................................................................9 1. Introduction.............................................................................................................................101 2. Phase 1 - Approach ...................................................................................................................13 3. Population Impacts....................................................................................................................17
3.1 Epidemiological Impacts ................................................................................................. 17 3.2 Workforce Impacts........................................................................................................... 20
3.2.1 Excess Absenteeism .............................................................................................22 3.2.2 Workforce Reduction Mitigation Measures .........................................................24
FOR OFFICIAL USE ONLY iii

FOR OFFICIAL USE ONLY
3.2.3 Pandemic Influenza Workforce Reduction Risks ................................................25 3.2.4 Impacted Assets....................................................................................................29
4. Infrastructure Impacts .............................................................................................................323 4.1 Energy .............................................................................................................................. 33
4.1.1 Electric Power ......................................................................................................33 4.1.2 Natural Gas...........................................................................................................36
4.2 Water and Wastewater Treatment.................................................................................... 38 4.3 Telecommunications and Information Technology ......................................................... 39 4.4 Public Health and Healthcare........................................................................................... 41 4.5 Transportation .................................................................................................................. 47
4.5.1 Airfreight ..............................................................................................................48 4.5.2 Rail System ..........................................................................................................48 4.5.3 Container Port Operations....................................................................................49
4.6 Agriculture and Food ....................................................................................................... 50 4.6.1 Milk Supply..........................................................................................................51 4.6.2 Food Supply and Distribution ..............................................................................52
4.7 Banking and Finance........................................................................................................ 56 5. Economic Impacts.....................................................................................................................59
5.1 National Economic Impacts............................................................................................. 59 5.2 Economic Subsector Impacts........................................................................................... 61 5.3 Regional Economic Impacts ............................................................................................ 63
6. Phase 2 - Uncertainty Analysis .................................................................................................65
6.1 Uncertainty Analysis Methodology ................................................................................. 66 6.1.1 Uncertainty Analysis Design................................................................................67 6.1.2 Results of Uncertainty Analysis ...........................................................................68
6.2 Effectiveness of Mitigation Strategies ............................................................................. 72 6.2.1 Mitigation Effectiveness Approach......................................................................72 6.2.2 Observations.........................................................................................................74
6.3 Robustness Evaluation ..................................................................................................... 76 6.3.1 Approach ...............................................................................................................76 6.3.2 Observations.........................................................................................................76
6.4 Feasibility of Intervention Strategies ............................................................................... 78 6.4.1 Vaccine and Antiviral Preparedness.....................................................................78 6.4.2 Student Dismissal .................................................................................................78 6.4.3 Social Distancing..................................................................................................79
6.5 Trade-Off Analysis ........................................................................................................... 79
FOR OFFICIAL USE ONLY iv
FOR OFFICIAL USE ONLY 7. Conclusions...............................................................................................................................87
7.1 Population ......................................................................................................................... 87 Epidemiology .................................................................................................................87 Workforce.......................................................................................................................89
7.2 Infrastructure.................................................................................................................... 89 Energy ...........................................................................................................................90 Water and Wastewater ...................................................................................................90 Telecommunications and Information Technology .......................................................90 Public Health and Healthcare .........................................................................................90 Transportation ................................................................................................................91 Agriculture and Food .....................................................................................................91 Banking and Finance......................................................................................................91
7.3 Economic Impact ............................................................................................................. 92 7.4 Follow-on Analysis.......................................................................................................... 92
FOR OFFICIAL USE ONLY v

FOR OFFICIAL USE ONLY
This page intentionally blank.
FOR OFFICIAL USE ONLY vi

FOR OFFICIAL USE ONLY
List of Figures Figure 1-1. Pandemic influenza Phase 1 analysis elements...........................................................12 Figure 3-1. National impacts of pandemic influenza and potential mitigation strategies on the
clinical attack rate ....................................................................................................................17 Figure 3-2. Correlation of clinical attack rate with household size; individuals in large
households are more likely to become ill ................................................................................19 Figure 3-3. Peak day of pandemic by county for the Baseline scenario........................................19 Figure 3-4. Information flow for calculation of infrastructure workforce impacts in the pandemic
influenza analysis.....................................................................................................................20 Figure 3-5. National absenteeism rates by scenario and average days missed per worker ...........22 Figure 3-6. Summary of NIAC survey results on criticality of workforce by CI/KR sector.........26 Figure 3-7. County-level commuting workforce characterization.................................................28 Figure 3-8. Population-mobility-weighted average peak workforce reduction in the Fear-40
scenario ....................................................................................................................................30 Figure 4-1. Generating stations (greater than 500 MW) in or near counties with high absenteeism
on day 70 in the Fear-40 scenario ............................................................................................34 Figure 4-2. Change in telecommunications demand from the baseline in a Fear-40 scenario ......40 Figure 4-3. Simulated national hospital occupancy rate (required beds/staffed beds) for 7
scenarios...................................................................................................................................42 Figure 4-4. Day of peak hospital occupancy by hospital service area for the Baseline and
Anticipated Intervention scenarios ..........................................................................................45 Figure 4-5. Firm size distribution by number of employees: Food, Wholesale, and Retail ..........54 Figure 4-6. Regional variation in supply and demand for breakfast cereal ...................................55 Figure 5-1. Average GDP losses by type of shock and industry: Year 1, Baseline scenario ........62 Figure 5-2. Percent changes in GDP by state: Baseline scenario, Year 1 .....................................63 Figure 6-1. Box-and-whisker plots of pandemic influenza deaths for matrix scenarios ...............69 Figure 6-2. Average influenza-related fatalities for 6 vaccine strategies ......................................70 Figure 6-3. Clinical attack rate for each of the 82 intervention effectiveness scenarios ...............74 Figure 6-4. Relative preference of intervention strategies over the likelihood of a pandemic
influenza for a risk-neutral decision maker (excludes social distancing scenarios) ................81 Figure 6-5. Relative preference of intervention strategies over the likelihood of a pandemic for a
risk-neutral decision maker......................................................................................................83 Figure 6-6. Satisfaction/regret analysis for selected pairs of intervention strategies not involving
quarantine.................................................................................................................................85
FOR OFFICIAL USE ONLY vii

FOR OFFICIAL USE ONLY
This page intentionally blank.
FOR OFFICIAL USE ONLY viii
FOR OFFICIAL USE ONLY
List of Tables Table 2-1. Epidemiological scenarios............................................................................................15 Table 3-1. CI/KR workforce within the United States ..................................................................21 Table 3-2. National absenteeism rates for CI/KR sectors in pandemic influenza scenarios .........23 Table 3-3. Hospitals, wastewater treatment plants, and nuclear power plants with greatest
workforce reductions in the Fear-40 scenario: an example of facility impacts .......................31 Table 4-1. Number of power plants potentially at risk (Fear-40 scenario) and generating
capacities..................................................................................................................................36 Table 4-2. Natural gas dependency by RTO..................................................................................38 Table 4-3. Summary of healthcare simulations .............................................................................43 Table 5-1. Losses in National GDP, by scenario: Year 1 and Years 1-10, constant 2006 dollars 60 Table 6-1. Scenario matrix: vaccination strategies and scenario sets evaluated in the uncertainty
analysis.....................................................................................................................................68 Table 6-2. Comparison of matrix scenario averages .....................................................................71 Table 6-3. Value structure showing indifference equivalencies between decision metrics ..........80 Table 6-4. Order of multiattribute preference for vaccination strategies absent social distancing,
showing incremental equivalent cost for successively less-preferred alternatives..................82 Table 6-5. Order of trade-off preference for vaccination strategies with social distancing
included, showing incremental equivalent cost for successively less-preferred alternatives ..83 Table 6-6. Satisfaction and regret statistics for selected pairs of intervention strategies not
involving quarantine. ...............................................................................................................85
FOR OFFICIAL USE ONLY ix

FOR OFFICIAL USE ONLY
This page intentionally blank.
FOR OFFICIAL USE ONLY x

FOR OFFICIAL USE ONLY
Acknowledgements
Robert Stephan, Assistant Secretary for Infrastructure Protection, DHS Merrick E. Krause, Director, Infrastructure Analysis and Strategy Division
Gerald Frazier, NISAC Program Manager
National Infrastructure Simulation and Analysis Center (NISAC) Research Team Sandia National Laboratories (SNL), Los Alamos National Laboratory (LANL), and Others
Project Leads for the Pandemic Influenza Report: Theresa Brown, SNL Sharon DeLand, SNL Dennis Powell, LANL James P. Smith, LANL NISAC Contributors: Deborah Belasich, SNL Russell Bent, LANL Orr Bernstein, SNL Walt Beyeler, SNL Brian Bush, LANL Thomas Corbet, Jr., SNL Leticia Cuellar, LANL Jim Curry, SNL Lori R. Dauelsberg, LANL Sara Del Valle, LANL Sue Downes, SNL Brian Edwards, LANL Stephan Eidenbenz, LANL Mark Ehlen, SNL Lory Ellebracht, SNL Jim Ellison, SNL Mary Ewers, LANL Jeanne Fair, LANL Silvio Flaim, LANL John Florez, LANL Julia Gavrilov, LANL Tim Germann, LANL Kriste Henson, LANL
Gary Hirsch, SNL (consultant) David Izraelevitz, LANL Dean Jones, SNL Sabina Jordan, SNL Kai Kadau, LANL Angie Kelic, SNL Dmitry Keselman, LANL Perry Klare, LANL Deborah Kubicek, LANL Montiago LaBute, LANL Lois Lauer, SNL Rene LeClaire, LANL Verne Loose, SNL Benjamin McMahon, LANL Timothy McPherson, LANL Jason Min, SNL Susan Mniszewski, LANL Lisa Moore, LANL Alexander Outkin, LANL Venkatesh Ramaswamy, LANL Rashad Raynor, SNL Jane Riese, LANL Phil Romero, LANL Johnathan Rush, LANL Marvin Salazar, LANL Andrew Seirp, LANL Phillip Stroud, LANL Stephen Sydoriak, LANL C. David Tallman, LANL Robert Taylor, SNL Sunil Thulasidasan, LANL
Loren Toole, LANL Adam Turk, SNL Sheila Van Cuyk, LANL Vanessa Vargas, SNL Laurie Wiggs, LANL Mike Wilson, SNL Guanhua Yan, LANL NISAC Editors: Lisa Inkret, LANL Judy Jones, SNL Louise Maffitt, SNL Caroline Spaeth, LANL Other Acknowledgements: Helen Cui, LANL Robert Gislason, LANL Randy Michelsen, LANL Bobby Milstein, Centers for Disease Control and Prevention Glenn Paulson, University of Medicine and Dentistry of New Jersey Michael Samsa, Argonne National Laboratory Kermit Short, LANL Lillian Snyder, SNL David Thompson, Argonne National Laboratory (consultant) William Thompson, Centers for Disease Control and Prevention
We would also like to acknowledge the close collaboration and partnership of
Dr. Til Jolly, Deputy Assistant Secretary, Office of Health Affairs, DHS.
FOR OFFICIAL USE ONLY xi

FOR OFFICIAL USE ONLY
This page intentionally blank.
FOR OFFICIAL USE ONLY xii
FOR OFFICIAL USE ONLY
Abstract The National Infrastructure Simulation and Analysis Center (NISAC) is a Congressionally mandated modeling, simulation, and analysis program. NISAC prepares and shares analyses of critical infrastructure and key resources (CI/KR) including their interdependencies, vulnerabilities, consequences, and other complexities. Consisting of management and outreach personnel in Washington, DC, and analytical staff at the Sandia and Los Alamos National Laboratories, NISAC operates under the direction of the Department of Homeland Security (DHS), Office of Infrastructure Protection (OIP), Infrastructure Analysis and Strategy Division (IASD). The National Strategy for Pandemic Influenza Implementation Plan, issued by the White House Homeland Security Council in 2006, directed NISAC to examine the potential impacts of a pandemic influenza on the United States population, infrastructure, and economy. In cooperation with the DHS Office of Health Affairs, NISAC analyzed pandemic influenza interventions ranging from “do nothing” scenarios through full intervention, including pharmaceutical, social, and policy components. The analysis results indicate that effective, reasonable mitigations to a pandemic influenza do exist, but they must be implemented early and consistently across the Nation in order to contain the disease until a strain-specific vaccine can be produced and distributed. Certain critical infrastructures will be strained by a severe pandemic, but if planning for critical worker training and certification occurs well in advance of a pandemic, the strain on most critical infrastructures can be mitigated. However, the NISAC analysis did find that the current U.S. healthcare system cannot adequately address a severe pandemic; increasing the healthcare capacity through supplemental facilities can mitigate this deficiency. The estimated cost of implementing the necessary mitigation strategies ranges from $2 to $80 billion, depending largely on the effectiveness of the suite of intervention tools and policies used. Meanwhile, the predicted GDP losses of a pandemic could reach over $100 billion in the first year alone.
FOR OFFICIAL USE ONLY xiii

FOR OFFICIAL USE ONLY
This page intentionally blank.
FOR OFFICIAL USE ONLY xiv

FOR OFFICIAL USE ONLY
Executive Summary Introduction Preparedness is the key to mitigating the health, social, and economic impacts of a pandemic influenza. Public health strategies that significantly reduce the spread of the disease have the broadest impact on mitigating potential consequences. Among the many potential intervention strategies, strain-specific vaccination is considered the single best intervention action because it prevents the spread of a potential pandemic-inducing virus. Producing sufficient supplies of such a vaccine, however, can take 4 to 6 months. This development time necessitates the use of other interventions, including antiviral treatments and student dismissal, to delay the onset of the pandemic until a strain-specific vaccine is available. Decisions concerning the type, timing, and duration of intervention strategies are critical because the intervention chosen can dramatically affect the economic and infrastructure consequences of a pandemic. Approach In support of the U.S. Department of Homeland Security’s (DHS’s) Office of Infrastructure Protection (OIP), the National Infrastructure Simulation and Analysis Center (NISAC) conducts modeling, simulation, and analyses to address critical infrastructure and key resources (CI/KR) protection and preparedness issues related to natural and manmade disasters. NISAC’s technical capabilities include data analysis; infrastructure and infrastructure interdependency modeling and simulation; decision support methodologies and tools; risk analysis; and knowledge management system design, development, and management. In 2006, the White House Homeland Security Council issued the National Strategy for Pandemic Influenza Implementation Plan directing DHS/OIP/NISAC to examine the potential impacts of a pandemic influenza on the U.S. population, CI/KR, and economy. This report presents the results of both phases of the pandemic influenza study:
• Phase 1: An assessment of the likelihood and magnitude of impacts of pandemic influenza on the U.S. population, CI/KR, and economy as a result of workplace absenteeism
• Phase 2: An analysis of the uncertainty in the impacts on CI/KR and the economy due to variability in disease characteristics, sociological response, and mitigation strategies
NISAC modeled scenarios of influenza progression that represent reasonable mitigation plans and provide a broad characterization of government, business, school, and individual behavior modifications. In addition to behavior modifications, NISAC analyzed variation in the availability of antivirals, vaccines, and other medical supplies. All scenarios were drawn from Homeland Security Council and Department of Health and Human Services guidance for pandemic preparedness. NISAC compared the relative effectiveness of the simulated response and mitigation strategies of each scenario in terms of the impact on the population, the workforce, infrastructure operations, the demand for infrastructure services, and the economy; the simulations were based on the characteristics of an influenza
FOR OFFICIAL USE ONLY 1

FOR OFFICIAL USE ONLY
strain similar to the 1918 strain. After assessing the potential infrastructure and economic impacts, NISAC also evaluated the implications of uncertainty on public health intervention strategies. Alternative intervention strategies and scenarios of societal response to the disease yielded different impacts on the population and on the Public Health and Healthcare Sector. The epidemiological results were translated to workplace absenteeism estimates, which were then analyzed for impacts on infrastructure operation and service provision. The combined effects of absenteeism, mortality, infrastructure service impacts, and demand shocks cause persistent changes to the U.S. economy. Population Impacts Epidemiology The NISAC study used simulations to assess the epidemiological impact of a pandemic on the U.S. population. Simulations revealed the following: the severity of an unchecked pandemic influenza; the relative value of simulated interventions; and the consequences of behaviors of businesses, schools, and individuals. All scenarios in the simulations use a baseline disease assessment, which results in more than 25 percent of the population becoming symptomatic if isolation is not implemented or protective measures are not taken. In these scenarios, assumptions ranged from a no mitigation strategy to a vaccination-based mitigation strategy to a behavior modification mitigation strategy. Simulation results indicate that local population demographics are an important factor in disease spread, with a high correlation between infection rate and household size, income, and the presence of children. Consequently, the emergence of the epidemic is likely to be reflected in geographic and demographic clusters of influenza infection across the Nation. Among pharmaceutical interventions, the most effective solution is expected to be a vaccine well-matched to the pandemic strain. Successful intervention strategies will delay the onset of the pandemic until sufficient vaccine is produced. Thus, the development of new technology to increase production rates is of paramount importance. Effective antivirals can also be an important part of intervention, although these alone cannot delay the onset of a pandemic. Along with vaccinations and antivirals, student dismissal was determined to be a necessary feature of a successful intervention strategy. However, student isolation is shown to be significantly less effective if delayed until 1 percent or more of the population becomes infected. Comparatively, work closures were determined to provide little ameliorative impact. Workforce A pandemic can cause workforce absenteeism in several ways: a worker can become sick and possibly die, a worker may need to stay home to care for a sick child or one who is dismissed from school, or a worker may stay home out of fear or by choice. The impacts of a pandemic influenza on the infrastructure and economic components of society will vary geospatially and
FOR OFFICIAL USE ONLY 2

FOR OFFICIAL USE ONLY
by sector, depending on the characteristics of the local population and the demographics of the workforce in the operation and maintenance of each infrastructure. Two potential impacts of concern are service supply reductions and increased demand due to worker behavior or health status changes. The pattern of absenteeism observed under the various scenarios suggests that, even under those scenarios that experience relatively high absenteeism rates, the likely impacts on labor and services will be most pronounced over a period lasting only a few weeks. Business and CI/KR owners and operators have several options for responding to the increased absenteeism that might result from a combination of illness, the need to care for ill family members, and self-isolation during a pandemic. The impact of pandemic influenza on CI/KR is not only the result of the pandemic itself, but also society’s response to the event. For instance, planned interventions that encourage workforce absenteeism can potentially cause an increase in CI/KR system problems. Additionally, the principal component in the relative risk of CI/KR system failure is not the magnitude of the workforce reduction but rather the vulnerability of individual facilities to workforce reduction and the consequent loss of a given facility. Infrastructure Impacts NISAC modeled the potential impacts of workforce absenteeism on U.S. infrastructure to determine if CI/KR operations are vulnerable to inconsistencies during a pandemic. The results of these analyses are summarized below. Energy NISAC used 2 modeling approaches to evaluate assumptions regarding the effect of workforce absenteeism on power plant operations in the electric power subsector. Both approaches led to the conclusion that it is unlikely an influenza pandemic would cause disruptions of the power grid, even at the peak of the most severe scenario examined. This analysis found that only under the most stringent assumptions of the tolerable levels of operator absenteeism—the absence of a single operator causes the plant to be idled—would the utility operators need to implement rolling brownouts to prevent blackouts and large-scale power disruptions. Absenteeism is not likely to have a significant impact on the U.S. natural gas infrastructure, even under the most severe epidemic scenario examined. Barring a shortfall in natural gas production or a rise in demand above the capacity to deliver, fuel limitation will not be a problem for the electric power subsector. Water and Wastewater Treatment Pandemic influenza could affect the water and wastewater CI/KR as a result of demand or supply shocks. Direct human consumption is a minimal portion of residential water use; thus, it is unlikely that individuals staying at home will change water demand sufficiently to affect any system dynamics. The greatest risk to water and wastewater CI/KR from pandemic influenza is
FOR OFFICIAL USE ONLY 3

FOR OFFICIAL USE ONLY
the reduction of available operators and support staff due to absenteeism. Establishing priority contracts with local engineering firms can mitigate this risk. Telecommunications Potential impacts on telecommunications CI/KR include supply shocks caused by operation and maintenance crew shortages and demand shocks caused by shifts in population distribution when portions of the workforce remain at home. The primary risk is localized call drops (up to 14 percent of calls dialed) due to excessive loads resulting from the shifts in population behaviors during a pandemic, such as working from home and increased dial-up Internet usage. Public Health and Healthcare The models of the Public Health and Healthcare Sector CI/KR indicate that this sector would be highly impacted by a pandemic influenza. It would see a direct increase in demand for service as a result of increased morbidity and mortality related to the pandemic. Meanwhile, healthcare workforce reductions would be comparable to reductions in other sectors. However, an increase in the number of healthcare workers, volunteers, temporary workers, or medically trained staff from the armed services could offset those losses. The key findings for this sector are as follows:
• Surge capacity. Assuming that hospitals are operating at the average annual occupancy of licensed beds and there is no government-directed mitigation strategy, the U.S. healthcare system will be overwhelmed in 7 to 10 weeks and will turn away 3 to 4 million patients. If hospitals are already operating at 90 percent occupancy of licensed beds at the beginning of a pandemic, the system will be overwhelmed in 3 to 6 weeks.
• Surge duration. With no government-directed mitigation strategy in place, the U.S. healthcare system will be at full capacity for a total of 3 to 6 weeks. Effective government interventions can limit the hospital overflow to a few hospitals that operate at capacity for a few weeks.
• Dependence on emergency services. The U.S. healthcare system is highly dependent on the Emergency Services Sector. During a pandemic, with little or no government-directed mitigation, this tight interdependency could weaken the response to the epidemic.
• Healthcare costs. With no government-directed mitigation strategy, costs to existing U.S. healthcare facilities would be $17 to $19 billion in aggregate. Including new or temporary facilities, overall healthcare costs could be $80 billion.
Transportation NISAC considered a wide variety of modes in the Transportation Sector CI/KR, including aviation, highway, rail, mass transit, pipeline, and maritime. The analysis indicated that demand for passenger transportation services (that is, mass transit and air transportation) would likely decline at a rate similar to the loss of capacity due to absenteeism. As a result, reduced availability of passenger transportation capacity is not likely to be a serious problem. Demand for freight movements, however, is unlikely to fall very much during a pandemic, making
FOR OFFICIAL USE ONLY 4
FOR OFFICIAL USE ONLY
absenteeism levels in this segment of greater concern. If extreme widespread self-isolation occurs, the rail system could lose half of its shipping capacity; consequently, it would be necessary to assign shipping priority to life-sustaining goods like food, fuel, and medical supplies. Agriculture and Food For the agriculture and food CI/KR, NISAC evaluated whether the production and, to a limited degree, the demand conditions under the various scenarios would cause shortages in consumer food supplies. For processed foods, there is a sufficient buffer in manufacturing capacity to tolerate labor shortages of 10 percent for a time period of weeks to months. For example, in 1 study that focused on milk supply dynamics, the production and transportation impacts resulting from the unmitigated pandemic scenario were not sufficient to significantly disrupt the flow of milk to consumers. Overall, pandemic-related workforce absenteeism would not severely affect the Agriculture and Food Sector. Banking and Finance Three primary effects of a global pandemic on the banking and finance CI/KR are the operational impacts from absenteeism; panic; and disruptions of underlying infrastructure and services, such as Telecommunications, Energy, and third-party service providers (security, cleaning, etc.). Although financial systems have robust backup operational structures, NISAC simulations indicate that a simultaneous loss of personnel operating the backup and the main sites could affect the capability to transfer operations from 1 site to another. Furthermore, certain financial system functions require a high degree of coordination among a large number of diverse participants and could therefore be affected by pandemic-related absenteeism. Economic Impacts A pandemic will cause at least 3 distinct economic impacts or “shocks” to the economy:
• Supply shock. This is a temporary reduction in the working population due to worker illness, the illness of family members, or voluntary self-isolation because of fear of contracting illness.
• Demand shock. This is a temporary reduction and reallocation of consumption of particular goods and services.
• Population shock. This is a permanent loss of population and the workforce due to deaths.
The effects of absenteeism are greatest in manufacturing, followed by the finance and insurance, retail, wholesale, real estate, and construction subsectors.
FOR OFFICIAL USE ONLY 5

FOR OFFICIAL USE ONLY
Uncertainty Analysis Variabilities in disease characteristics, disease severity, pharmaceutical availability, intervention effectiveness, and behavioral response contribute to the uncertainty in the outcome of a future pandemic. The uncertainty in disease characteristics also drives uncertainty in the illness attack rate, the number of deaths, the stress on the healthcare system, healthcare costs, and total economic impact. This uncertainty hinders the ability to devise a single intervention strategy that will minimize costs and maximize effectiveness. Feasibility of Mitigation Strategies Effective mitigation strategies reduce the clinical attack rate and the stress on the healthcare system by delaying the spread of the pandemic, allowing time to develop strain-specific vaccines and, in the long run, reducing the number of deaths. Effective mitigation strategies also have the potential to reduce fear-based behaviors that lead to excessive absenteeism (for example, widespread self-isolation resulting from understandable caution or a fear of contracting the illness). Potentially feasible mitigation strategies include the following:
• Vaccination and antiviral preparedness. While an effective strain-specific vaccine should be the ultimate goal, the major issue with respect to feasibility of vaccination-based intervention is production capacity. Existing capacity is insufficient, and it is unlikely to be increased without advances in technology.
• Social distancing. Simulations indicate social distancing could be a very effective mitigation strategy in reducing disease transmission. Potential measures include improving hygiene, wearing masks, decreasing physical contact, and increasing physical separation.
• Student dismissal. Student dismissal is an important measure in social distancing strategies. Simulations suggested that high levels of compliance are needed in dismissing students after influenza is identified in a community. The feasibility of this measure depends on several factors: the ability of the detection system to diagnose and report influenza, the ability to trigger dismissals in timely fashion, and the willingness of public and private institutions to implement the dismissals.
Conclusions Predicting the impacts of an influenza pandemic on the U.S. population and economy and understanding the effectiveness of alternative mitigation strategies depends on a large number of factors. The factors include virulence and transmissibility of the disease, the effects the disease might have on different age groups, community and CI/KR workforce demographics, individual behavioral responses, and the capacity of the Public Health and Healthcare Sector to provide adequate medical care for those stricken by the disease. NISAC modeled and analyzed numerous individual and combined mitigation strategies accounting for uncertainties in disease
FOR OFFICIAL USE ONLY 6
FOR OFFICIAL USE ONLY
epidemiology, social behavioral response, mitigation measure effectiveness, and CI/KR resiliency to influenza-induced workforce absenteeism. The results of this study suggest the following high-level conclusions:
• Combinations of multiple early interventions, including student dismissal, social distancing, voluntary self-isolation, vaccines, and antivirals, can delay and mitigate a pandemic outbreak until the production and distribution of a strain-specific vaccine are possible.
• The healthcare system will be highly stressed; seriously ill people will be forced to rely on alternative care strategies if the patient load generated by a severe pandemic is similar to patient loads experienced during the worst pandemics in the past. The healthcare system’s capability to defend the population against a pandemic can be enhanced by preplanning for alternate care measures, rapidly identifying and treating influenza cases, effectively coordinating individual and community-based behavioral modifications, and quickly producing a strain-specific vaccine.
• Most infrastructure systems outside of the Public Health and Healthcare Sector are predicted to continue to function at or near normal levels under epidemiologically successful mitigation strategies, but the operations of several infrastructures may be pushed near a point of failure.
• The healthcare costs related to implementing mitigation strategies during a pandemic are predicted to be up to $80 billion depending on the success of the interventions, and the predicted gross domestic product losses could be up to $100 billion in the first year, independent of the direct healthcare costs associated with a pandemic scenario.
The 2007-2008 influenza season would be a good time to begin nationwide education about influenza and simple personal preventative measures that apply both to normal seasonal outbreaks of influenza and to the more serious specter of a pandemic influenza. The upcoming influenza season also presents an opportunity to familiarize responders and the population as a whole with implementation of intervention measures. A major natural disaster or terrorist incident in an area already heavily impacted by pandemic influenza could be too much for society or infrastructure to handle. Such an event was not investigated in this study. This multiple threat-vector scenario and many other situations and policy excursions present dozens of useful topics for further analysis.
FOR OFFICIAL USE ONLY 7

FOR OFFICIAL USE ONLY
This page intentionally blank.
FOR OFFICIAL USE ONLY 8

FOR OFFICIAL USE ONLY
National Population, Economic, and Infrastructure Impacts of
Pandemic Influenza with Strategic Recommendations
Full Report
FOR OFFICIAL USE ONLY 9

FOR OFFICIAL USE ONLY
This page intentionally blank.
FOR OFFICIAL USE ONLY 10
FOR OFFICIAL USE ONLY
1. Introduction The United States experienced 3 pandemic influenza outbreaks in the 20th century. The impact of each varied depending on the virulence of the influenza, but all resulted in a tragic number of deaths totaling approximately 500,000 in 1918, 70,000 in 1958, and 34,000 in 1968. Many in the public and private sectors are concerned about the impacts of a future pandemic influenza on the U.S. population and consequently on critical infrastructure and the economy. The U.S. Department of Homeland Security (DHS) directed the National Infrastructure Simulation and Analysis Center (NISAC) and the Critical Infrastructure Protection Decision Support System (CIPDSS)1 program to analyze the implications of pandemic influenza. This report presents the results of that study. NISAC conducted the study in 2 phases:
• Phase 1: An assessment of the likelihood and magnitude of impacts of pandemic influenza on the U.S. population, CI/KR, and the economy as a result of workplace absenteeism
• Phase 2: An analysis of the uncertainty in the impacts on CI/KR and the economy due to variability in disease characteristics, sociological response, and mitigation strategies
NISAC determined the likelihood and magnitude of population, critical infrastructure, and economic impacts from pandemic influenza by evaluating a series of 7 disease, response, and mitigation scenarios approved by the DHS Office of Health Assurance (OHA). Using a suite of tools and a multidisciplinary approach, NISAC compared relative efficacies of simulated response and mitigation strategies for an influenza strain with disease characteristics similar to the 1918 strain. The scenarios specifically addressed effects on the population, the workforce, infrastructure operations, demand for infrastructure services, and the economy. The approach for performing these analyses (Figure1-1) started with detailed epidemiological simulations of a 1918-like pandemic influenza. Alternative intervention strategies and scenarios of societal response to the disease yielded different impacts on the population and on the Public Health and Healthcare Sector. The epidemiological results were translated to workplace absenteeism estimates, which were then analyzed for impacts on infrastructure operation and provision of service. The combined effects of absenteeism, mortality, infrastructure service impacts, and demand shocks cause persistent changes to the U.S. economy. Macroeconomic models provided estimates of the net impact by economic sector at the state and national levels.
1 The DHS Science and Technology Directorate has provided support to develop the CIPDSS program through FY
2007. The CIPDSS is now an integral element to NISAC; the combined capabilities are hereinafter referred to as NISAC.
FOR OFFICIAL USE ONLY 11

FOR OFFICIAL USE ONLY
Epidemic Dynamics
Other Infrastructure
Sectors
Economic Impacts
Population Impacts:Deaths, Health
Disease ControlInterventions
Public Health &Healthcare
Infrastructure
Workforce reductions, demand side changes
Outages, disruptions, service degradations
Figure 1-1. Pandemic influenza Phase 1 analysis elements
FOR OFFICIAL USE ONLY 12
FOR OFFICIAL USE ONLY
2. Phase 1 - Approach The impacts of a pandemic influenza on the U.S. population and its economy depend on factors including disease characteristics, societal and governmental responses, and the capacities and capabilities for the manufacture of effective vaccines and antiviral treatments, among others. In the first phase of this analysis, NISAC used 2 epidemiological simulation systems to determine the progression and overall impact of a pandemic on the population: the Epidemic Simulation System (EpiSimS)2 and EpiCast.3
• EpiSimS, a regional epidemiological simulation system with street-level resolution, is used to track individuals’ everyday activities. In an EpiSimS modeling run, infected individuals may change their behavior during the course of their illness, continuing their normal behavior until they become ill.
• EpiCast is a national-scale model of disease progression that combines person-to-person disease transmission dynamics with population demographic and mobility data from the U.S. Census Bureau and the Bureau of Transportation Statistics.
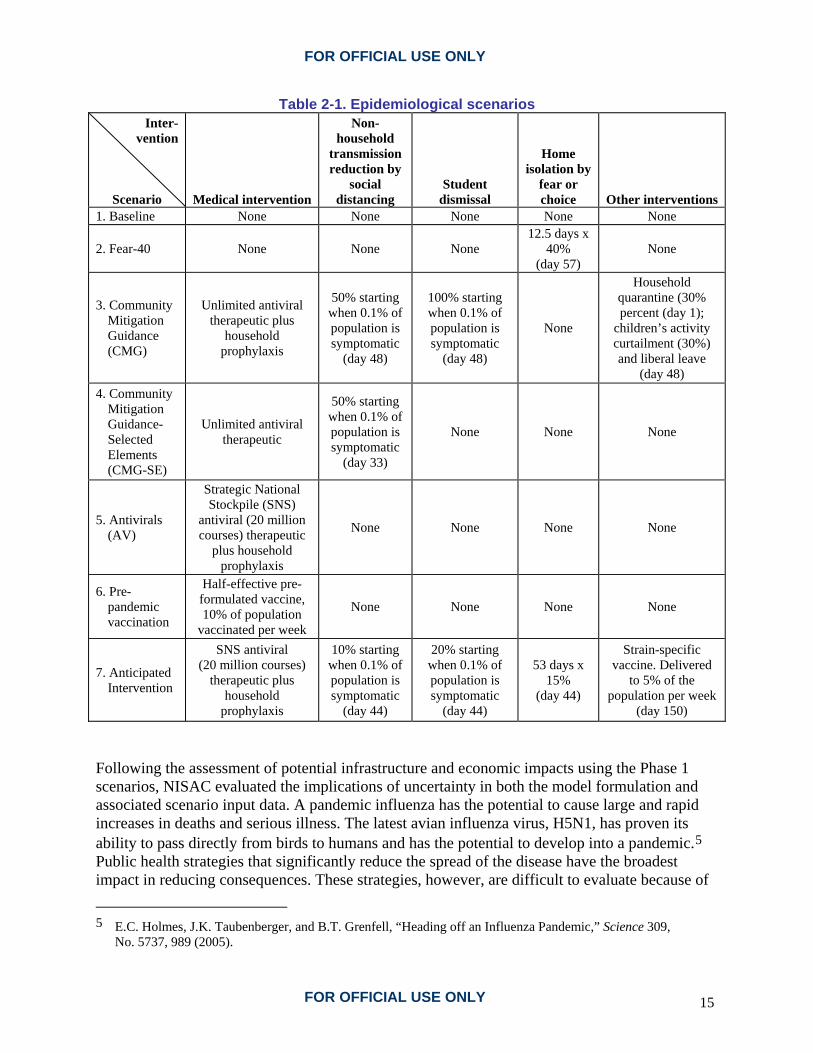
Simulations of 7 influenza epidemiological scenarios (Table 2-1) represent reasonable mitigation plans and provide a characterization of government, business, school, and individual behavior modifications. Successful mitigation of an influenza pandemic is predicated on the confluent implementation of multiple intervention actions. This analysis used only a subset of possible intervention actions to characterize the overall sensitivity of infrastructure and economic systems. The Homeland Security Council4 described 3 of the 7 scenarios: unmitigated disease spread (Baseline), Community Mitigation Guidance (CMG), and Community Mitigation Guidance-Selected Elements (CMG-SE). In each scenario, the simulated influenza strain is similar to the 1918 influenza strain. Merging the results from the EpiSimS and EpiCast simulations provided a national-scale characterization of the disease progression and its implications in terms of illnesses, deaths, and the associated workforce reductions. The 7 Phase 1 scenarios were:
1. Baseline: No intervention, unconstrained pandemic 2. Fear-40: Only strong voluntary self-isolation as a result of normal caution or fear
(beginning on day 57, ramping up to 40 percent on day 63, then ramping back down to 0 on day 70), no intervention
3. Community Mitigation Guidance (CMG): Unlimited antivirals, strong social distancing, complete student dismissal for duration of epidemic, no circulating symptomatic people (“liberal leave”), partial quarantine of the families of sick people from day 1, partial reduction in children’s activities, and no voluntary self-isolation
2 S. Eubank, H. Goclu, A. Kumar, M. Marathe, A. Srinivasan, Z. Totoczkal, N. Wang, “Modelling Disease
Outbreaks in Realistic Urban Social Networks,” Nature 429, pp. 180-184 (2004).
3 T.C. Germann, K. Kadau, I.M. Longini, C.M. Macken, “Mitigation Strategies for Pandemic Influenza in the United States,” Proc. Natl. Acad. Sci. U.S.A. 103, 5935-5940 (2006).
4 Homeland Security Council, National Strategy for Pandemic Influenza-Implementation Plan ( 2006).
FOR OFFICIAL USE ONLY 13

FOR OFFICIAL USE ONLY
4. Community Mitigation Guidance-Selected Elements (CMG-SE): Unlimited antivirals and strong social distancing only
5. Antivirals: Application of stockpile antivirals only 6. Pre-pandemic Vaccine: Partially effective vaccine at a reasonable production rate 7. Anticipated: Stockpile-only antivirals, mild social distancing, limited student dismissal,
weak voluntary self-isolation, and normal vaccine production and timing. (Note: Social distancing encompasses a variety of behavioral modifications that can reduce disease transmission, including improved hygiene, handshake avoidance, maintenance of interpersonal space, and mask-wearing; changes in activities, such as following bans on public events, are treated as separately distinct interventions and are not included in social distancing as defined in this analysis.)
FOR OFFICIAL USE ONLY 14
FOR OFFICIAL USE ONLY
Table 2-1. Epidemiological scenarios Inter-
vention
Scenario Medical intervention
Non-household
transmission reduction by
social distancing
Student dismissal
Home isolation by
fear or choice Other interventions
1. Baseline None None None None None
2. Fear-40 None None None 12.5 days x
40% (day 57)
None
3. Community Mitigation Guidance (CMG)
Unlimited antiviral therapeutic plus
household prophylaxis
50% starting when 0.1% of population is symptomatic
(day 48)
100% starting when 0.1% of population is symptomatic
(day 48)
None
Household quarantine (30% percent (day 1);
children’s activity curtailment (30%) and liberal leave
(day 48) 4. Community
Mitigation Guidance-Selected Elements (CMG-SE)
Unlimited antiviral therapeutic
50% starting when 0.1% of population is symptomatic
(day 33)
None None None
5. Antivirals (AV)
Strategic National Stockpile (SNS)
antiviral (20 million courses) therapeutic
plus household prophylaxis
None None None None
6. Pre-pandemic vaccination
Half-effective pre-formulated vaccine, 10% of population
vaccinated per week
None None None None
7. Anticipated Intervention
SNS antiviral (20 million courses)
therapeutic plus household
prophylaxis
10% starting when 0.1% of population is symptomatic
(day 44)
20% starting when 0.1% of population is symptomatic
(day 44)
53 days x 15%
(day 44)
Strain-specific vaccine. Delivered
to 5% of the population per week
(day 150) Following the assessment of potential infrastructure and economic impacts using the Phase 1 scenarios, NISAC evaluated the implications of uncertainty in both the model formulation and associated scenario input data. A pandemic influenza has the potential to cause large and rapid increases in deaths and serious illness. The latest avian influenza virus, H5N1, has proven its ability to pass directly from birds to humans and has the potential to develop into a pandemic.5 Public health strategies that significantly reduce the spread of the disease have the broadest impact in reducing consequences. These strategies, however, are difficult to evaluate because of 5 E.C. Holmes, J.K. Taubenberger, and B.T. Grenfell, “Heading off an Influenza Pandemic,” Science 309,
No. 5737, 989 (2005).
FOR OFFICIAL USE ONLY 15
FOR OFFICIAL USE ONLY
the uncertainties in data and models. Furthermore, historical data may not apply to a future pandemic. The impact of a pandemic depends on many disease characteristics that cannot be known in advance, including the viral shedding pattern, the mode and efficiency of transmission, and the duration of various disease stages. Intervention strategies include vaccination, use of antivirals, and social distancing measures. Vaccination with a strain-specific vaccine has the prospect of reducing the risk from a potential pandemic-inducing virus. The dilemma is that such a vaccine takes time to develop and produce. Currently, the 4 to 6 months required to develop and produce an effective vaccine necessitates the use of other measures, such as dismissing students or using a partially effective pre-pandemic vaccine, to delay the onset of the pandemic until the vaccine is available. The timing and duration of implementation of these measures are crucial. Illness, the need to care for sick family members, community protection strategies, and voluntary self-isolation could significantly increase worker absenteeism, affecting infrastructure operations and the economy.
FOR OFFICIAL USE ONLY 16

FOR OFFICIAL USE ONLY
3. Population Impacts 3.1 Epidemiological Impacts Simulations of the 7 Phase 1 scenarios revealed the severity of an unchecked pandemic influenza; the relative value of interventions; and the consequences of behaviors of businesses, schools, and individuals. Figure 3-1 outlines the mortality rate and the clinical attack rate for each of the 7 scenarios; it also includes the rates for seasonal influenza outbreaks. The CMG, CMG-SE, and Anticipated scenarios produced illness and fatality outcomes similar to, or less severe than, those observed for seasonal influenza outbreaks.
Figure 3-1. National impacts of pandemic influenza and potential mitigation strategies on the clinical attack rate
FOR OFFICIAL USE ONLY 17
FOR OFFICIAL USE ONLY
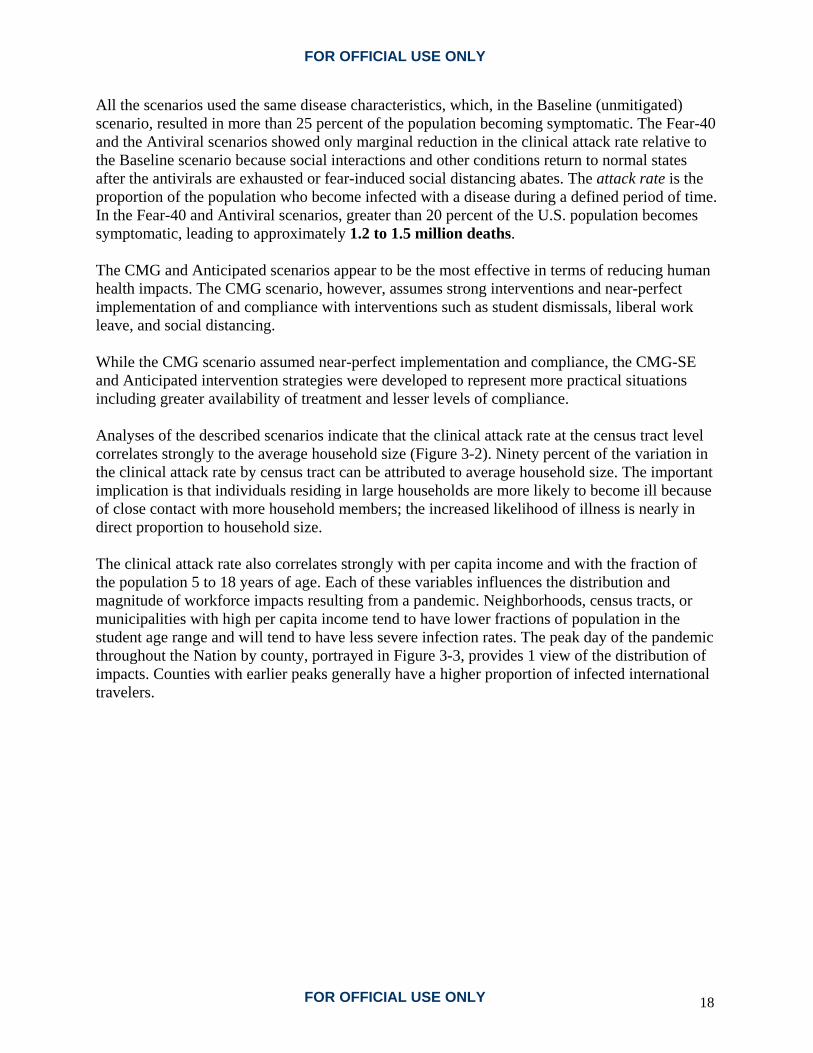
All the scenarios used the same disease characteristics, which, in the Baseline (unmitigated) scenario, resulted in more than 25 percent of the population becoming symptomatic. The Fear-40 and the Antiviral scenarios showed only marginal reduction in the clinical attack rate relative to the Baseline scenario because social interactions and other conditions return to normal states after the antivirals are exhausted or fear-induced social distancing abates. The attack rate is the proportion of the population who become infected with a disease during a defined period of time. In the Fear-40 and Antiviral scenarios, greater than 20 percent of the U.S. population becomes symptomatic, leading to approximately 1.2 to 1.5 million deaths. The CMG and Anticipated scenarios appear to be the most effective in terms of reducing human health impacts. The CMG scenario, however, assumes strong interventions and near-perfect implementation of and compliance with interventions such as student dismissals, liberal work leave, and social distancing. While the CMG scenario assumed near-perfect implementation and compliance, the CMG-SE and Anticipated intervention strategies were developed to represent more practical situations including greater availability of treatment and lesser levels of compliance. Analyses of the described scenarios indicate that the clinical attack rate at the census tract level correlates strongly to the average household size (Figure 3-2). Ninety percent of the variation in the clinical attack rate by census tract can be attributed to average household size. The important implication is that individuals residing in large households are more likely to become ill because of close contact with more household members; the increased likelihood of illness is nearly in direct proportion to household size. The clinical attack rate also correlates strongly with per capita income and with the fraction of the population 5 to 18 years of age. Each of these variables influences the distribution and magnitude of workforce impacts resulting from a pandemic. Neighborhoods, census tracts, or municipalities with high per capita income tend to have lower fractions of population in the student age range and will tend to have less severe infection rates. The peak day of the pandemic throughout the Nation by county, portrayed in Figure 3-3, provides 1 view of the distribution of impacts. Counties with earlier peaks generally have a higher proportion of infected international travelers.
FOR OFFICIAL USE ONLY 18

FOR OFFICIAL USE ONLY
Figure 3-2. Correlation of clinical attack rate with household
size; individuals in large households are more likely to become ill
Figure 3-3. Peak day of pandemic by county for the Baseline scenario
FOR OFFICIAL USE ONLY 19

FOR OFFICIAL USE ONLY
3.2 Workforce Impacts A pandemic will cause worker absenteeism in several ways: a worker can become sick and possibly die; a worker may need to stay home to care for children who are sick or dismissed from school; or a worker may stay home because of fear or to avoid social contacts. The impacts of an influenza pandemic on the infrastructure and economic components of society vary geospatially depending upon the local characteristics of the population, infrastructure operations, and economic activity. Estimated impacts on business output by location depend on absenteeism rates for the infrastructure and industry. Figure 3-4 shows a simplified process flow diagram for translating disease-modeling results into workforce absenteeism. The analysis used data from the Bureau of Labor Statistics (BLS) and Department of Commerce business and employment information aggregated by both Standard Industrial Classification (SIC) and North American Industry Classification System (NAICS) codes.
Infrastructure Operations Impacts
Workforce Absenteeism Calculations
Reductionin Labor by Industry
Reductionin Labor by
CriticalInfrastructure
Reductionin
InfrastructureService
Provision
EPICASTEPISimSResults
Critical Infrastructure
Workforce Characterization
BLS Employment by
Industry and Occupation
NAICS -DHS/NISAC
Industry-Critical Infrastructure
Mapping
Census County Business Patterns
Employment Estimates
SIC to NAICS Mapping
(as necessary)
Figure 3-4. Information flow for calculation of infrastructure workforce
impacts in the pandemic influenza analysis
FOR OFFICIAL USE ONLY 20

FOR OFFICIAL USE ONLY
Table 3-1 summarizes the distribution of workforces across the 17 CI/KR sectors based on data from the U.S. Census Bureau and the U.S. Department of Agriculture.6,7 The Dams Sector is not included as a separate entry in this table. Employees for dams that generate power (hydroelectric) are included in the Energy Sector workforce. Other dam operation employees may be included in the Government Facilities, the Drinking Water and Water Treatment Systems, or the Commercial Facilities total workforce. The largest critical infrastructure workforce is Commercial Facilities with greater than 75 million workers. The next largest sectors are Public Health and Healthcare, Agriculture and Food, and Banking and Finance, which have 10 to 100 times the workforce of utility sectors such as Energy, Water and Wastewater, and Telecommunications. Although several sectors have a similar workforce size, the risk from a pandemic differs across CI/KR sectors due to the workforce demographics and whether their operation and maintenance are performed on a local, regional, or national scale. The 2 potential impacts of concern are service supply reductions and increased demand due to behavior or health status changes.
Table 3-1. CI/KR workforce within the United States CI/KR Sector Total Workforce
Commercial Facilities 76,365,000 Public Health and Healthcare 13,047,000 Agriculture and Food 9,178,000 Banking and Finance 6,011,000 Government Facilities 3,002,000 Defense Industrial Base 2,736,000
Transportation Systems 2,422,500 Information Technology 1,779,000 Chemical 1,614,000 Energy 752,000 Telecommunications 353,000 Commercial Nuclear Reactors, Materials, and Waste 268,000
Drinking Water and Water Treatment Systems 250,000 Postal and Shipping 210,000 Emergency Services 165,000 National Monuments and Icons 6,000 Dams Included in other sectors
6 U.S. Census Bureau, “County Business Patterns,” (2003).
7 U.S. Department of Agriculture, Economic Research Service, “United States Farm and Farm Related Employment,” (2003).
FOR OFFICIAL USE ONLY 21

FOR OFFICIAL USE ONLY
3.2.1 Excess Absenteeism EpiSimS was designed to track the movement of individuals between home and work locations across regions, thus providing a valuable tool for assessing the workforce impacts of pandemic influenza. Output from a simulation of 6 counties in southern California representing approximately 19 million people, or more than 6 percent of the U.S. population of 293 million, characterized workforce availability within the CI/KR across a wide region. Workforce availability results, merged with the corresponding EpiCast results on the timing of regional epidemics, provided a national geospatial assessment of the workforce impacts from pandemic influenza. Figure 3-5 shows the nationwide absenteeism rate for the various scenarios. The Fear-40 scenario, which incorporates the expectation cited in the National Strategy for Pandemic Influenza that 40 percent of the population will stay home during the worst weeks of the pandemic, produces the highest absenteeism rate. The Anticipated scenario examines a lower but longer lasting rate of fear-based, stay-home behavior, peaking at 15 percent of the population. The CMG scenario results in significant absenteeism because student dismissals require family members to attend to children at home.
Figure 3-5. National absenteeism rates by scenario and average days missed per worker
FOR OFFICIAL USE ONLY 22
FOR OFFICIAL USE ONLY
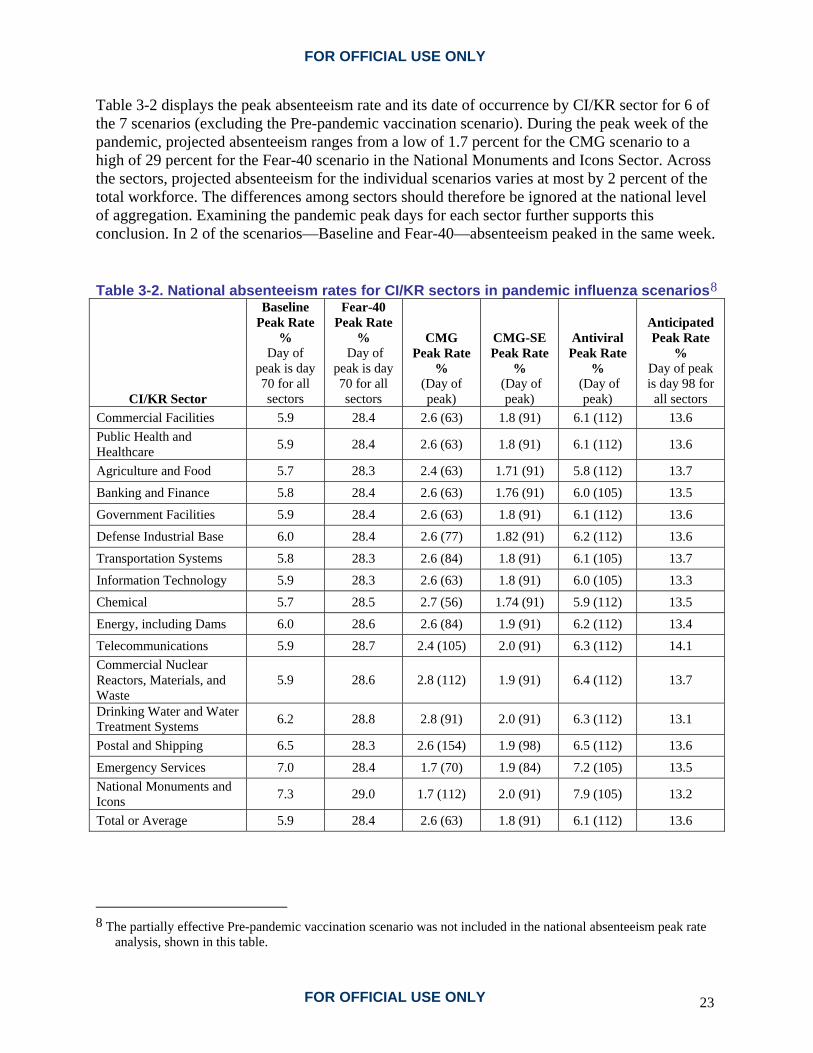
Table 3-2 displays the peak absenteeism rate and its date of occurrence by CI/KR sector for 6 of the 7 scenarios (excluding the Pre-pandemic vaccination scenario). During the peak week of the pandemic, projected absenteeism ranges from a low of 1.7 percent for the CMG scenario to a high of 29 percent for the Fear-40 scenario in the National Monuments and Icons Sector. Across the sectors, projected absenteeism for the individual scenarios varies at most by 2 percent of the total workforce. The differences among sectors should therefore be ignored at the national level of aggregation. Examining the pandemic peak days for each sector further supports this conclusion. In 2 of the scenarios—Baseline and Fear-40—absenteeism peaked in the same week. Table 3-2. National absenteeism rates for CI/KR sectors in pandemic influenza scenarios8
CI/KR Sector
Baseline Peak Rate
% Day of
peak is day 70 for all sectors
Fear-40 Peak Rate
% Day of
peak is day 70 for all sectors
CMG Peak Rate
% (Day of peak)
CMG-SE Peak Rate
% (Day of
peak)
Antiviral Peak Rate
% (Day of
peak)
Anticipated Peak Rate
% Day of peak is day 98 for all sectors
Commercial Facilities 5.9 28.4 2.6 (63) 1.8 (91) 6.1 (112) 13.6 Public Health and Healthcare 5.9 28.4 2.6 (63) 1.8 (91) 6.1 (112) 13.6
Agriculture and Food 5.7 28.3 2.4 (63) 1.71 (91) 5.8 (112) 13.7
Banking and Finance 5.8 28.4 2.6 (63) 1.76 (91) 6.0 (105) 13.5
Government Facilities 5.9 28.4 2.6 (63) 1.8 (91) 6.1 (112) 13.6
Defense Industrial Base 6.0 28.4 2.6 (77) 1.82 (91) 6.2 (112) 13.6
Transportation Systems 5.8 28.3 2.6 (84) 1.8 (91) 6.1 (105) 13.7
Information Technology 5.9 28.3 2.6 (63) 1.8 (91) 6.0 (105) 13.3
Chemical 5.7 28.5 2.7 (56) 1.74 (91) 5.9 (112) 13.5
Energy, including Dams 6.0 28.6 2.6 (84) 1.9 (91) 6.2 (112) 13.4
Telecommunications 5.9 28.7 2.4 (105) 2.0 (91) 6.3 (112) 14.1 Commercial Nuclear Reactors, Materials, and Waste
5.9 28.6 2.8 (112) 1.9 (91) 6.4 (112) 13.7
Drinking Water and Water Treatment Systems 6.2 28.8 2.8 (91) 2.0 (91) 6.3 (112) 13.1
Postal and Shipping 6.5 28.3 2.6 (154) 1.9 (98) 6.5 (112) 13.6
Emergency Services 7.0 28.4 1.7 (70) 1.9 (84) 7.2 (105) 13.5 National Monuments and Icons 7.3 29.0 1.7 (112) 2.0 (91) 7.9 (105) 13.2
Total or Average 5.9 28.4 2.6 (63) 1.8 (91) 6.1 (112) 13.6
8 The partially effective Pre-pandemic vaccination scenario was not included in the national absenteeism peak rate
analysis, shown in this table.
FOR OFFICIAL USE ONLY 23

FOR OFFICIAL USE ONLY
In 2 of the 7 scenarios, CMG-SE and Antiviral, absenteeism peaks for all infrastructure sectors within a period of 10 to 14 days. Only in the CMG scenario was there a substantial difference in peak absenteeism among sectors, with the day of peak absenteeism ranging from 8 to 22 weeks, or 56 to 154 days. However, absenteeism is so low in the CMG scenario—roughly 0.6 to 1.0 percent—that differences among sectors are negligible. The weekly pattern of absenteeism peaked rather abruptly in the CMG-SE and Antiviral scenarios and dropped off dramatically in subsequent weeks. This pattern suggests that, even in those scenarios that experience relatively high absenteeism rates, the likely impacts on labor and critical infrastructure services will be most pronounced over a period of only a few weeks. 3.2.2 Workforce Reduction Mitigation Measures To mitigate the impact of workforce absenteeism, CI/KR owners and operators, in addition to business owners, have several options available with which to respond to increased absenteeism that may result from illness, the need to care for ill family members, and fear-based self-isolation during a pandemic:
• Extend shifts and overtime for healthy workers • Postpone voluntary leave • Postpone elective surgeries, healthcare, and dental care • Hire temporary workers • Hire permanent workers to replace deceased workers • Split shifts to decrease social density in the workplace • Cross-train staff to fill in for absent staff • Reassign critical workers (such as certified plant operators) to other locations • Defer regularly scheduled maintenance projects • Permit employees to work from home • Pay ill workers to stay home • Enact social distancing measures such as mask-wearing
Extended work hours and workweeks are reasonable for a 2- to 3-week period during the peak of a pandemic. Within the Public Health and Healthcare Sector, the increased demand for doctor, clinic, and hospital medical care may well exceed the available maximum capacity of these services. In other CI/KR sectors, there may not be enough qualified staff at individual facilities to compensate for absent workers through the use of overtime alone. Most CI/KR operations require planning and evaluation of potential system impacts starting at the facility and individual system levels. When planning for pandemic-induced absenteeism, CI/KR operators must be cognizant of their critical worker types and of the time required for training and certification. For example, emergency medical services are highly dependent on emergency medical technicians (EMTs), and these workers require certification. Certification is also required for other healthcare workers, some classes of water and wastewater system operators, and nuclear power plant operators, among others. CI/KR facility operators can also provide education and training on influenza risks to critical workers to minimize the likelihood of self-isolation.
FOR OFFICIAL USE ONLY 24

FOR OFFICIAL USE ONLY
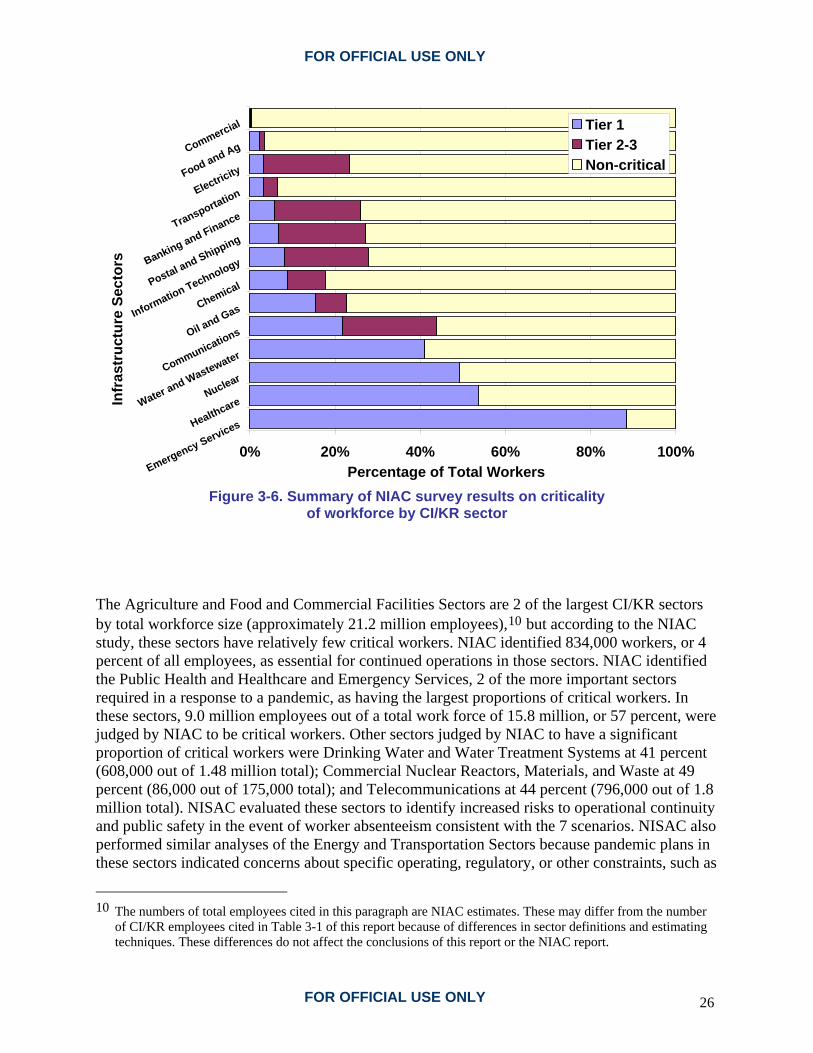
A National Infrastructure Advisory Council (NIAC)9 report released in January 2007 emphasizes the importance of risk communication strategies before and during a pandemic influenza. For the risk communication plans to be successful, the plans need to be initiated and tested well in advance of the arrival of a pandemic. NIAC also notes that continued data collection and analyses of critical worker types are needed, as are training plans directed specifically at contingencies during a pandemic influenza (rather than plans that only address normal staff transitions). 3.2.3 Pandemic Influenza Workforce Reduction Risks Workforce reductions resulting from death, illness, or behavioral responses to a pandemic are a threat to infrastructures. Workforce reduction risks exist when specific workers, or classes of workers, are necessary for the continued safe operation of an infrastructure system. The key to assessing the risks to CI/KR from an influenza pandemic is understanding and characterizing the workforce structure. NISAC used information available in the NIAC study to approximate CI/KR operational risks. Although the NIAC report does not contain information on the ability of CI/KR to sustain operations during a pandemic, it does provide information on the composition of the workforce for each CI/KR (Figure 3-6). NIAC used 3 categories to describe worker criticality: (1) essential for continued operation (Tier 1); (2) essential to efficient operation (Tier 2 to 3); and (3) important but non-critical. The NIAC study’s criteria for determining a worker’s level of criticality were sector-specific. CI/KR sectors with relatively large percentages of critical workers are most vulnerable to disruption when high levels of absenteeism occur.
9 R. Denlinger, M. Marsh, B. Rhode, “The Prioritization of Critical Infrastructure for a Pandemic Outbreak in the
United States Working Group: Final Report and Recommendations by the Council,” National Infrastructure Advisory Council, January 16, 2007 <http://www.dhs.gov/xlibrary/assets/niac/niac-pandemic-wg_v8-011707.pdf>.
FOR OFFICIAL USE ONLY 25
FOR OFFICIAL USE ONLY
0% 20% 40% 60% 80% 100%Emergency ServicesHealthcare
Nuclear
Water and WastewaterCommunicationsOil and GasChemical
Information Technology
Postal and Shipping
Banking and FinanceTransportationElectricityFood and AgCommercialIn
fras
truc
ture
Sec
tors
Percentage of Total Workers
Tier 1Tier 2-3Non-critical
Figure 3-6. Summary of NIAC survey results on criticality
of workforce by CI/KR sector The Agriculture and Food and Commercial Facilities Sectors are 2 of the largest CI/KR sectors by total workforce size (approximately 21.2 million employees),10 but according to the NIAC study, these sectors have relatively few critical workers. NIAC identified 834,000 workers, or 4 percent of all employees, as essential for continued operations in those sectors. NIAC identified the Public Health and Healthcare and Emergency Services, 2 of the more important sectors required in a response to a pandemic, as having the largest proportions of critical workers. In these sectors, 9.0 million employees out of a total work force of 15.8 million, or 57 percent, were judged by NIAC to be critical workers. Other sectors judged by NIAC to have a significant proportion of critical workers were Drinking Water and Water Treatment Systems at 41 percent (608,000 out of 1.48 million total); Commercial Nuclear Reactors, Materials, and Waste at 49 percent (86,000 out of 175,000 total); and Telecommunications at 44 percent (796,000 out of 1.8 million total). NISAC evaluated these sectors to identify increased risks to operational continuity and public safety in the event of worker absenteeism consistent with the 7 scenarios. NISAC also performed similar analyses of the Energy and Transportation Sectors because pandemic plans in these sectors indicated concerns about specific operating, regulatory, or other constraints, such as
10 The numbers of total employees cited in this paragraph are NIAC estimates. These may differ from the number
of CI/KR employees cited in Table 3-1 of this report because of differences in sector definitions and estimating techniques. These differences do not affect the conclusions of this report or the NIAC report.
FOR OFFICIAL USE ONLY 26

FOR OFFICIAL USE ONLY
limits on worker hours and restrictions on the types of equipment that certain workers are allowed to operate. Population attributes such as geospatial and demographic distributions, employment patterns, and local transit patterns relative to the size and location of key CI/KR components are likely to be important factors in determining which facilities are impacted. Workforce mobility could exacerbate or dampen peak county-level absenteeism rates if the workforce in a given county is either drawn heavily from a different highly impacted county or if it is distributed among a number of counties with differing levels of impacts. To evaluate the importance of worker mobility on absenteeism levels, NISAC used the county-level disease attack rate from the epidemiology modeling and the population mobility data from the U.S. Census (Figure 3-7) to update the estimates of the county-level workforce reductions. The team then used the location of CI/KR in the Agriculture and Food, Commercial Facilities, Drinking Water and Water Treatment Systems, Commercial Nuclear Reactors, Materials and Waste, and Telecommunications Sectors to compute the distribution of peak workforce reduction levels in each of these sectors, thus characterizing the risks from regional workforce reductions. Because there are no National data detailing the workplace locations and residences of CI/KR workers, the team evaluated workforce reduction risks as a function of the aggregate worker mobility. The key workforce assumptions in this analysis are (1) critical infrastructure worker mobility is the same as county worker mobility and (2) the NIAC study is an accurate representation of infrastructure workforce composition with respect to critical workers. This work extended the analysis to characterize the risk to infrastructure assets from workforce reduction. In so doing, NISAC was able to evaluate both the national and asset-specific risk from an influenza pandemic. Identifying the specific facilities most likely to be impacted by workforce absenteeism helps state and local planning officials prepare for location-specific impacts.
FOR OFFICIAL USE ONLY 27

FOR OFFICIAL USE ONLY
Figure 3-7. County-level commuting workforce characterization
Evaluation of each scenario indicates that workforce reductions are equivalent across all critical CI/KR. The proportion of workers that will be afflicted by a pandemic influenza will not be significantly different from 1 CI/KR to another. The analysis indicates the impact of pandemic influenza on CI/KR is not only the result of the pandemic itself, but also society’s response to the event. Planned interventions that encourage workforce absenteeism will potentially cause more infrastructure system problems. In the case of unmitigated pandemic influenza where infected people consistently enter the country at major ports of entry,11 the principal component in the relative risk of CI/KR system failure is not the average magnitude of the workforce reduction but the vulnerability of individual facilities to workforce reduction and the consequences stemming from the loss of any given facility. The relative risk is determined more by individual facility properties, such as the degree of automation, the age of facilities, and the level of staff training and cross-training, rather than by the level of workforce reduction. The nature of the relative risk occurs because pandemic
11 T.C. Germann, K. Kadau, I.M. Longini, C.A. Macken, “Mitigation Strategies for Pandemic Influenza in the
United States.” Proceedings of the National Academy of Sciences of the United States of America 103:5935 (2006).
FOR OFFICIAL USE ONLY 28

FOR OFFICIAL USE ONLY
infections spread very quickly and therefore nearly simultaneously affect the workforce across the country, leading to a time-coincident profile of illness and resulting workforce reduction across large geographic areas. In a mild pandemic or effectively mitigated pandemic, peak effects are spread over several months and facilities will be more able to share workers. 3.2.4 Impacted Assets Figure 3-8 shows the population-mobility-weighted average workforce reduction in the Fear-40 scenario. The peak absenteeism is greatest in that scenario; infrastructure systems in the majority of the country experience greater than 30 percent workforce reductions. Table 3-3 lists the subset of individual healthcare, wastewater, and nuclear power facilities in the country that are estimated to have the greatest peak workforce reduction in the Fear-40 scenario. Simulation results indicate that mid-sized hospitals, water treatment plants, and power plants in Alabama will be consistently impacted by workforce reductions of greater than 40 percent. Populations and economies that rely on those facilities have a higher risk of service disruptions, loss of life, and loss of productivity during a pandemic if a large percentage of workers respond to the event by staying home to avoid becoming ill. However, the differences in risk relative to the rest of the country are not significant.
FOR OFFICIAL USE ONLY 29
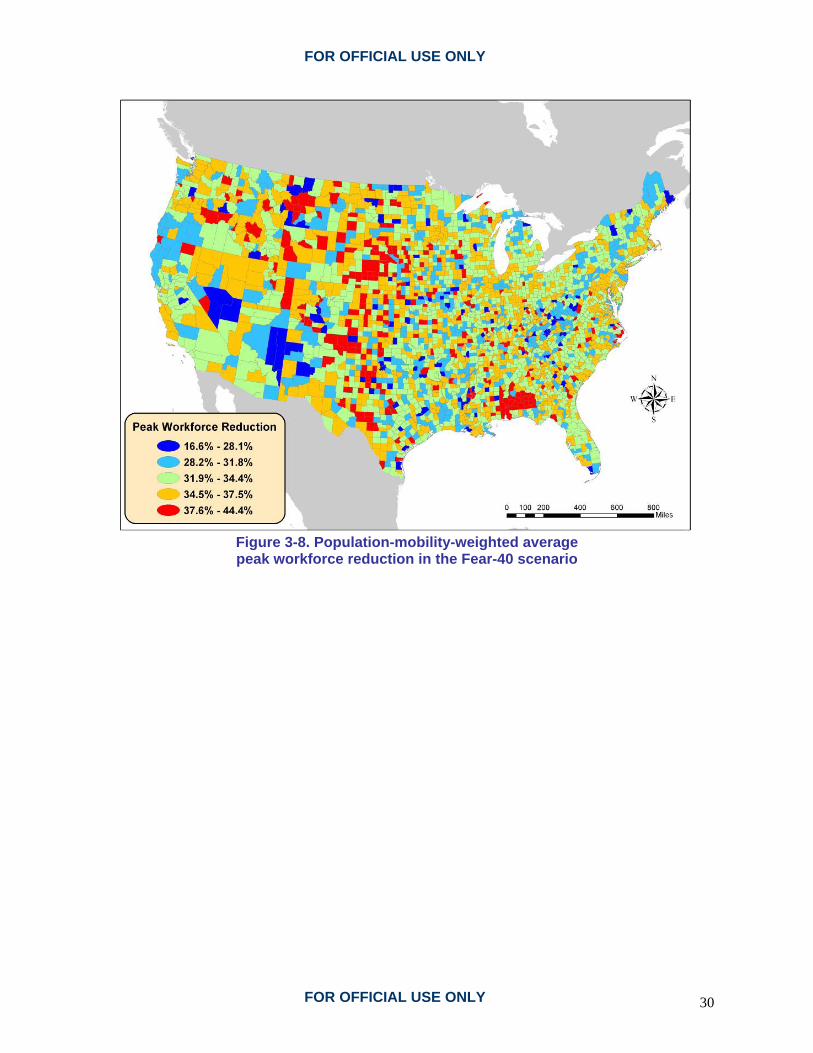
FOR OFFICIAL USE ONLY
Figure 3-8. Population-mobility-weighted average peak workforce reduction in the Fear-40 scenario
FOR OFFICIAL USE ONLY 30

FOR OFFICIAL USE ONLY
Table 3-3. Hospitals, wastewater treatment plants, and nuclear power plants with greatest workforce reductions in the Fear-40 scenario: an example of facility impacts
Name County State Hospitals Douglas County Memorial Douglas SD Monroe County Monroe AL Crenshaw Community Crenshaw AL Medical Center Enterprise Coffee AL Elba General Coffee AL L V Stabler Memorial Butler AL Georgiana Butler AL Dale Medical Center Dale AL Troy Regional Medical Center Pike AL Dundy County Dundy NE Wastewater Treatment Plants Hudson Branch Monroe AL Monroeville Double Branch Monroe AL Enterprise 2 College Street Coffee AL Enterprise Southeast Lagoon Coffee AL Greenville Butler AL Dothan Little Choctawhatchee Houston AL Ozark Southside Dale AL Troy Walnut Creek Pike AL Wright Smith Jr. Mobile AL Daphne Water Reclamation Facility Baldwin AL Nuclear Power Plants Farley 1/2 Houston AL Wolf Creek Station Coffey KS Yankee-Rowe Franklin MA Calvert Cliffs l/2 Calvert MD Duane Arnold Linn IA Cooper Station Nemaha NE Dresden 1/2/3 Grundy IL Peach Bottom 1/2/3 York PA Harris Wake NC Comanche Peak 1/2 Somervell TX
FOR OFFICIAL USE ONLY 31

FOR OFFICIAL USE ONLY
This page intentionally blank.
FOR OFFICIAL USE ONLY 32
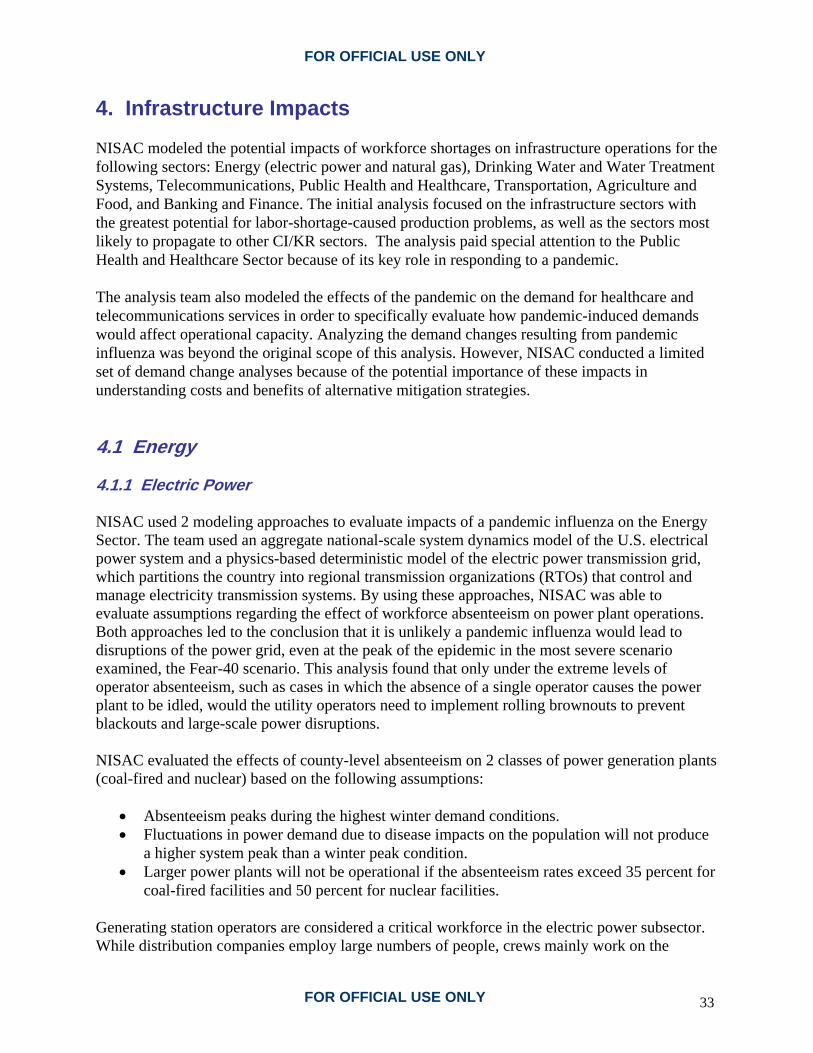
FOR OFFICIAL USE ONLY
4. Infrastructure Impacts NISAC modeled the potential impacts of workforce shortages on infrastructure operations for the following sectors: Energy (electric power and natural gas), Drinking Water and Water Treatment Systems, Telecommunications, Public Health and Healthcare, Transportation, Agriculture and Food, and Banking and Finance. The initial analysis focused on the infrastructure sectors with the greatest potential for labor-shortage-caused production problems, as well as the sectors most likely to propagate to other CI/KR sectors. The analysis paid special attention to the Public Health and Healthcare Sector because of its key role in responding to a pandemic. The analysis team also modeled the effects of the pandemic on the demand for healthcare and telecommunications services in order to specifically evaluate how pandemic-induced demands would affect operational capacity. Analyzing the demand changes resulting from pandemic influenza was beyond the original scope of this analysis. However, NISAC conducted a limited set of demand change analyses because of the potential importance of these impacts in understanding costs and benefits of alternative mitigation strategies. 4.1 Energy 4.1.1 Electric Power NISAC used 2 modeling approaches to evaluate impacts of a pandemic influenza on the Energy Sector. The team used an aggregate national-scale system dynamics model of the U.S. electrical power system and a physics-based deterministic model of the electric power transmission grid, which partitions the country into regional transmission organizations (RTOs) that control and manage electricity transmission systems. By using these approaches, NISAC was able to evaluate assumptions regarding the effect of workforce absenteeism on power plant operations. Both approaches led to the conclusion that it is unlikely a pandemic influenza would lead to disruptions of the power grid, even at the peak of the epidemic in the most severe scenario examined, the Fear-40 scenario. This analysis found that only under the extreme levels of operator absenteeism, such as cases in which the absence of a single operator causes the power plant to be idled, would the utility operators need to implement rolling brownouts to prevent blackouts and large-scale power disruptions. NISAC evaluated the effects of county-level absenteeism on 2 classes of power generation plants (coal-fired and nuclear) based on the following assumptions:
• Absenteeism peaks during the highest winter demand conditions. • Fluctuations in power demand due to disease impacts on the population will not produce
a higher system peak than a winter peak condition. • Larger power plants will not be operational if the absenteeism rates exceed 35 percent for
coal-fired facilities and 50 percent for nuclear facilities.
Generating station operators are considered a critical workforce in the electric power subsector. While distribution companies employ large numbers of people, crews mainly work on the
FOR OFFICIAL USE ONLY 33

FOR OFFICIAL USE ONLY
planned replacement of equipment, such as poles and conductors. If half of the crews were absent, the power supply would not likely be interrupted; instead, the company would forego planned replacements for the duration of the labor shortage. As this equipment is generally in working condition, delaying replacement for a few weeks would not likely impact power delivery. Though they generally employ fewer people, transmission companies and distribution companies function in a nearly identical manner. Figure 4-1 shows the generating plants with capacities of greater than 500 megawatts (MW) that are located in or near a county with more than 25 percent absenteeism on day 70 of the Fear-40 scenario (the scenario with the highest absenteeism). Plants with capacities of greater than 500 MW are considered representative of baseload generating plants that are operationally significant in most RTOs. The loss of smaller plants can be mitigated to a greater degree through incremental power imports or use of other generating units.
Figure 4-1. Generating stations (greater than 500 MW) in or near
counties with high absenteeism on day 70 in the Fear-40 scenario
FOR OFFICIAL USE ONLY 34
FOR OFFICIAL USE ONLY
Fifty-nine plants located in or near counties with high absenteeism were found to be potentially susceptible to staffing shortfalls. NISAC estimated staffing levels for each generating unit by using county-level workforce impacts for the Fear-40 scenario and then compared them to minimum staffing levels needed to maintain operation. NISAC assumed that under emergency conditions, utilities are likely to impose 12-hour shifts to avoid plant shutdown. This assumption reduces the number of generating units that may be idled due to absenteeism by approximately 35 percent. Southern Company’s Farley Plant, located in Dothan, Alabama, is the 1 nuclear power plant located in an area where absenteeism approaches 50 percent at the peak and which might be shut down. The plant, owned by Alabama Power and operated by Southern Nuclear Operating Company, is 1 of 3 nuclear facilities in the Southern Company electric system and has a total capacity of 890 MW. Using staff from other plants in the Southern Company system could prevent disruption, but that solution would require either that nuclear power plant operators be certified for each plant or that the Nuclear Regulatory Commission grant an exception to the certification requirement. RTOs with low power reserves, less than 20 percent above projected demand, may be overly reliant on imports or susceptible to generating capacity losses within the local system if large power plants are idled due to workforce absenteeism. Peak demand conditions typically occur for less than 500 hours of the winter months, indicating a relatively small likelihood that low reserves would correspond with a pandemic influenza outbreak. Table 4-1 lists the number of plants that may be idled and peak reserves available by RTO. If all 21 of these generating units are simultaneously idled, the affected RTOs have adequate capacity to offset the loss, with 1 exception in the Carolinas, where imports would be needed to offset the loss. In the case of the Carolinas, an additional loss of import capacity in the RTO serving that area may compromise system reliability. Uncertainty in this assessment increases if adjoining RTOs reduce their imports because the imports are included in the reserve estimate. Consultation with utilities potentially affected by shortfalls would be required to improve confidence in these results.
FOR OFFICIAL USE ONLY 35

FOR OFFICIAL USE ONLY
Table 4-1. Number of power plants potentially at risk
(Fear-40 scenario) and generating capacities
RTO Units
at Risk MW12 at Risk
MW Import
Peak reserve
(%) Comment Midwest Independent System Operator (MISO)
8 2,474 3,330 7.7 Adequate unless abnormal outages
Southern Power Pool (SPP)
3 2,074 770 20.3 Adequate
Pennsylvania-Jersey-Maryland (PJM)13 Interconnection
6 1,739 - - Adequate
Southern (STHRN) 2 1,046 - - Adequate Electric Reliability Council of Texas (ERCOT)
1 762 - - Adequate
Carolina Power and Light (CAR)
1 703 2,700 1.0 Inadequate without reliable imports
Total 21 8,797 4.1.2 Natural Gas Absenteeism is not likely to have a significant impact on U.S. natural gas facilities, even under the most severe epidemic scenario examined. The expected impacts are limited to 1 RTO and are not likely to cause disruptions in operations nationwide. With the exception of new well-drilling operations and repair at local distribution companies, natural gas production and distribution are not labor-intensive. Production wells produce gas on their own from high gas pressure in the well itself; therefore, 1 operator can monitor many production wells. Transmission pipeline compressor stations and storage fields are operated remotely with little or no onsite personnel; 1 operator can monitor many compressor stations or wells in a storage field. New well-drilling operations are important because they compensate for declining production in old wells. However, a reduction in new well drilling over a few weeks or months will have very little impact on current supplies. Variations in weather would almost certainly play a larger role than worker absenteeism in determining the market for natural gas during a pandemic.
12 PJM originally referred to the Pennsylvania-Jersey-Maryland ISO; it now includes all or portions of 13 Mid-
Atlantic states and the District of Columbia.
13 Planning projections for PJM, STHRN, and ERCOT indicate export conditions are likely. However, this analysis does indicate some units are at risk.
FOR OFFICIAL USE ONLY 36

FOR OFFICIAL USE ONLY
In local natural gas distribution companies, the network operates based on the gas pressure in the feeding transmission pipelines; few personnel are needed for operations. The majority of personnel are involved in capital repairs or replacement of old distribution pipes and equipment that are still in good working order, as well as repairs of system failures. During the period of a pandemic, local distribution companies would almost certainly curtail capital repairs and focus on addressing failures. Over a period of a few weeks to months, this curtailment should not lead to noticeable deterioration of the distribution system. Natural gas processing plants perform the key function of bringing gas from the well and purifying it to the quality necessary for pipeline transmission. Consultation with industry experts would be useful in determining how these plants operate under higher-than-normal absenteeism conditions. One focus of the NISAC study was the possible dependency impacts of shortages of gas-fired generation on electric infrastructure. Without a shortfall in natural gas production and delivery, there would not be a fuel limitation problem for the electric power subsector unless the demand for natural gas increases above the capacity to deliver. The following points are important to consider:
• RTOs will fare differently when faced with potential shortfalls of gas supply used for generation (distribution by RTO is summarized in Table 4-2).
• If natural gas imports are curtailed significantly, utilities in the western United States that are heavily dependent on gas-fired generation, especially those in California, may be forced to rely even more heavily on natural gas from the Northwest and Southwest.
• Given moderate curtailment, the Southern (STHRN) and Electric Reliability Council of Texas (ERCOT) RTOs can access adequate local production to satisfy demand because of their proximity to well fields in the Gulf of Mexico. The Pennsylvania-Jersey-Maryland Interconnection (PJM), Midwest Independent System Operator (MISO), and Southern Power Pool (SPP) RTOs are likely to maintain sufficient local storage and production to handle fluctuations from average conditions over short durations.
• The Carolina Power and Light (CAR) RTO is a net importer of natural gas and may be at risk for gas curtailment. Because this RTO has also been identified as potentially inadequate in generation reserve at system peak, significant curtailment may exacerbate this condition. Combined with significant loss in electric imports, CAR may be at risk for load shedding. This situation may justify further analysis to determine how contingency planning may mitigate such conditions.
FOR OFFICIAL USE ONLY 37

FOR OFFICIAL USE ONLY
Table 4-2. Natural gas dependency by RTO
RTO MW Gas-
Fired
Percent Installed Capacity
Processing Plants
Storage Fields
Compressor Stations
ERCOT 35,901 57 311 36 161 PJM 29,990 24 23 181 410
CALIF 28,013 55 14 13 37 MISO 24,077 21 81 7 83 SPP 20,658 54 8 31 228
STHRN 16,578 38 8 4 52 CAR 3,434 9 0 1 13
4.2 Water and Wastewater Treatment Pandemic influenza could affect the water and wastewater CI/KR through either demand or supply shocks. Direct human consumptive use is a minimal portion of residential water use; thus, it is unlikely that individuals staying at home will change water demand significantly enough to affect system dynamics. Network service demands could be altered by a pandemic influenza if significant numbers of commercial and industrial facilities close down, thereby eliminating their normal usage. Predicting this occurrence is highly uncertain and was not attempted in this study. Demand reductions could produce increased water residence times in the network, resulting in the increased risk of water quality reductions and off-flavors in the water, although the water remains potable. Given that the local-scale shift in population dynamics in a pandemic influenza will occur over a period of weeks, any demand-driven reduction in water quality will be temporary, and the risk from exposure to lower-quality water will be minimal. Wastewater collection and treatment is also unlikely to be affected by the demand changes related to the temporary shift in population dynamics. The greatest risk to the Drinking Water and Water Treatment Systems Sector from pandemic influenza is the reduction of available operators and support staff due to illness. The Drinking Water and Water Treatment Systems Sector is not especially labor intensive. Treatment plant operators monitor and adjust gauges to determine necessary changes in process control operation. Changes include rectifying equipment faults, modifying chemical feed rates, increasing water sampling and analysis, and tracing sources of equipment faults. The increasing degree of automation and the limited number of facilities produce a relatively small workforce for the water sector throughout the country. The workforce reduction analysis indicates workforce reductions at water and wastewater facilities can be expected to be as high as 45 percent. Water and wastewater utilities have a number of possible response approaches to managing the absenteeism risk. First, they can contract with local engineering and construction firms for short-term repair and operation assistance. Second, they can develop mutual aid agreements with other
FOR OFFICIAL USE ONLY 38

FOR OFFICIAL USE ONLY
utilities for staff and materials assistance. Third, they can cross-train existing staff at facilities to increase operational labor redundancies. At first glance, mutual aid agreements appear to be a strong option because the cooperating facilities can have enough distance between them to limit the overlapping effects of an event. However, the simulation indicated that mutual aid agreements might not assist in the response to a pandemic; this approach works for most natural disasters, but a pandemic influenza is more global in scale. While some large cities may be able to borrow staff from surrounding counties temporarily, the pandemic peak for most counties in the United States occurs at 10 to 11 weeks from the initiation of the pandemic. This means that both parties could be affected simultaneously, greatly reducing the value of a mutual aid agreement. Cross-training existing staff or developing contracts with local engineering firms may be better options for utilities. 4.3 Telecommunications and Information Technology Potential impacts to the Telecommunications and Information Technology Sector CI/KR include supply shocks caused by operation and maintenance crew shortages and demand shocks due to shifts in population distribution caused by portions of the workforce remaining at home. NISAC used an operation and maintenance model that represents the telecommunications network, workers, and component inventory to simulate workforce reduction on telecommunications system operation and maintenance. This operation and maintenance model focused on the wireline voice network. The simulation results indicate that worker shortages should not disrupt wireline telecommunications because the issue is not the availability of labor within the individual sectors. Instead, it is how the demand for services will change as a result of a pandemic and ensuing mitigation measures. Operations in the last mile of both the Internet and wireless infrastructures are sufficiently different from wireline voice; they may need to be evaluated separately in future analyses because of potentially different failure rates and differences in operations center staffing. The labor-intensive portions of telecommunications operations are the repair functions on critical components in the infrastructure, which are performed both by operations center workers and by field technicians. Operations center workers staff a typically 24-hour monitoring center and perform software-based repair functions. They do not require repair components to be dispatched to solve a problem. Field technicians are dispatched to sites for physical network failures (transport cable cuts, downed lines, and so forth) to repair or replace components in the network. Both categories of workers arrive on shift and then are dispatched to perform tasks. The rate and length of dispatch are dependent on the amount of damage in the network and, in the case of field technicians, available replacement components. The normal network damage rate over the course of 1 year is 0.27 percent. For the normal damage rate in the model, 120 field technicians and 7 operations center workers are dispatched at any given time. In the Fear-40 scenario, the number of workers dispatched goes down slightly during the peak absenteeism of the pandemic. The network damage rate settles to a new equilibrium of 0.28 percent. The new equilibrium results from workers who do not return after their absence, thereby diminishing the available workforce. During the peak of the pandemic, the
FOR OFFICIAL USE ONLY 39

FOR OFFICIAL USE ONLY
available workers work overtime, keeping the differences in the damage rate negligible. This result is replicated in the other scenarios, thus indicating that the operation and maintenance of the telecommunications CI/KR is robust under a wide range of workforce conditions. Call drops are another potential impact of a pandemic. They are a result of excessive loads following the temporary shift in population behaviors during a pandemic, such as working from home. NISAC used call generation models to incorporate the activity patterns of the population at the wire-center level to produce calling profiles that mimic the changes in communication behavior during the course of the outbreak. 15 consecutive weeks of population data for these counties are used to compare the changes in the telecommunications traffic patterns on the telephone exchange switches and cellular network elements in the respective areas. The impact of the pandemic and any associated mitigation strategies were evaluated by comparing the ratio of load conditions at the initiation of the simulation relative to the peak load conditions. Because many people stay at home in the Fear-40 scenario, the proportion of calls originating from home will increase, and the proportion of calls originating from work will decrease. Figure 4-2 illustrates the difference in calling demands (not the actual traffic) between the normal operating conditions and the Fear-40 scenario at the national level. The plot shows individual wire center service areas color-coded by shifts in demand, and it highlights the areas of the country where large shifts in call volume are expected (shown in orange and red). As expected, the greatest increase in call demand occurs in the major metropolitan areas. The wire centers experiencing the largest increase in calls are at risk of not being able to handle the increased volume. If the call volume exceeds the switch capacity, call blocking will occur. Calls will be delayed and re-dialing calling behaviors may exacerbate the problem.
Figure 4-2. Change in telecommunications demand from the
baseline in a Fear-40 scenario
FOR OFFICIAL USE ONLY 40
FOR OFFICIAL USE ONLY
A significant amount of the traffic consists of Internet dial-up sessions due to telecommuting-type activities. Such calls are usually much longer than voice calls and lead to much higher holding times. This increase, along with a Fear-40 scenario, causes a number of wire centers to experience greater rejection rates due to insufficient capacity. The call-by-call simulations for the Fear-40 scenario show that an average of 14 percent of local calls can not be completed on the first attempt. 4.4 Public Health and Healthcare The specter of a pandemic influenza has raised concerns about the U.S. healthcare system’s surge capacity and capability to respond to a large outbreak of an acute ailment. The increased morbidity and mortality related to the pandemic will cause a direct increase in demand for healthcare service. At the same time, healthcare workforce reductions are predicted to be comparable to reductions in other sectors modeled in the current analysis. The epidemiological-absenteeism models are not intended or designed to capture the workforce participation required if there is a surge in the need for medical services during a pandemic. The models do predict the number of sick and symptomatic, as well as the number of persons dying each week. Although the models showed net reductions in the health services workforce resulting from the pandemic, an increase in the number of healthcare workers, volunteers, temporary workers, or medically trained staff from the armed services could offset those losses. NISAC estimated healthcare service impacts at the national and local levels. Nationally, in most of the scenarios, the Public Health and Healthcare Sector is overloaded as a result of increased demand for care. This demand arises from both symptomatic people and the worried well, a combination of people who believe they have influenza due to flu-like symptoms or fear. (The team assumed the number of worried well was 20 percent greater than the number of symptomatic people.) The ability of the healthcare system to provide care may decline significantly as the demand for care increases; healthcare providers may contract the virus or may avoid work out of fear of contracting the virus. Healthcare providers are more likely to come in contact with symptomatic people and are more likely to use effective distancing measures than the rest of the population. Overloading of the healthcare system occurs at all levels including physicians’ offices, emergency facilities, and hospitals. According to the planning assumptions for the severe scenario in the HHS Pandemic Influenza Plan,14 half of the people who become ill from pandemic influenza virus would be expected to seek outpatient medical care, and 11 percent would need to be hospitalized. Figure 4-3 shows the national hospital occupancy rate for the 7 study scenarios. In the Baseline, Fear-40, Antiviral, and Pre-pandemic Vaccine scenarios, hospitals become fully occupied and stay full for a much longer time than the pandemic itself lasts, as hospitals must catch up with normal care delayed during the pandemic. Hospital
14 Department of Health and Human Services, HHS Pandemic Influenza Plan, November 2005,
<http://www.hhs.gov/pandemicflu/plan/>.
FOR OFFICIAL USE ONLY 41

FOR OFFICIAL USE ONLY
crowding is relieved earlier in the Fear-40 scenario than in the Baseline scenario, and earlier still in the Pre-pandemic Vaccine scenario, because there are fewer symptomatic individuals in those scenarios. The Antiviral scenario is similar to the Baseline scenario except that the use of antivirals delays the pandemic for about a month. In contrast, the Anticipated and CMG scenarios are effective in limiting the spread of the disease; consequently, the healthcare system is not overwhelmed in those scenarios. The CMG-SE scenario falls between the other scenarios, with the hospitals being fully occupied for a period of time but not as long as in the Baseline, Fear-40, Antiviral, or Pre-pandemic Vaccine scenarios.
0.6
0.7
0.8
0.9
1
1.1
1.2
0 50 100 150 200 250 300 350
Time (days)
Ove
rall
Hosp
ital O
ccup
ancy
Rat
e
BaselineFear-40CMGCMG-SEAntiviralPre-Pandemic VaccineAnticipated Intervention
Figure 4-3. Simulated national hospital occupancy rate (required beds/staffed beds) for 7 scenarios
In the 4 scenarios that exhibit extreme healthcare overloading—the Baseline, Fear-40, Antiviral, and Pre-pandemic Vaccine scenarios—there is not enough hospital capacity to accommodate all the people who become seriously ill. As a result, many patients will need to be treated in temporary facilities. Model simulations indicate that hospitals would support about 4 to 5 million pandemic influenza patients, and there would be a need for temporary facilities for an additional 1 to 3 million patients. Summary statistics for the scenarios are given in Table 4-3. The cost figures in the table include estimates of the cost of ambulatory care, such as visits to physicians’ offices and clinics, hospitalization costs, and costs of vaccines and antivirals, if any.
FOR OFFICIAL USE ONLY 42

FOR OFFICIAL USE ONLY
The costs are based on those by Meltzer,15 excluding the value of time lost from work, which is included instead as part of economic impact. The costs are converted from 1995 dollars to 2005 dollars using the consumer price index inflation for medical care. There is a significant amount of variability in normal hospital occupancy rates. The U.S. average occupancy rate was 66 percent in 2003, but occupancy rates ranged from 53 to 81 percent for different states.16 The national CIPDSS simulations for this study divided the country into the 10 Federal Emergency Management Agency (FEMA) regions; the average 2003 occupancy rate for those regions ranged from 59 to 77 percent.
Table 4-3. Summary of healthcare simulations Scenario Factor Baseline Fear-40 CMG CMG-SE Antivirals
Pre-pandemic Vaccine Anticipated
Number Illnesses 74 M 61 M 1.2 M 28 M 69 M 39 M 2.6 M
Number Hospitalized 8.1 M 6.6 M 140,000 3.0 M 7.6 M 4.2 M 280,000
Number Deaths 1.5 M 1.2 M 25,000 550,000 1.4 M 780,000 52,000 Peak Death Rate (per hour) 1,700 1,500 16 340 1,400 930 32
Day of Peak Death Rate 69 66 61 81 105 63 70
Cost of Healthcare $81 B $68 B $1.7 B $35 B $50 B $79 B $9.0 B
In areas where the hospital occupancy rate is initially higher, the hospitals will fill up faster and remain crowded longer, and more patients will have to be shifted to temporary facilities. Note that under normal conditions, urban hospitals are generally more crowded than rural hospitals, and many urban hospitals might be overloaded even in the scenarios that do not show overcrowding for the country as a whole. When this information is coupled with the expected time lag of the pandemic between urban and rural areas, simulations suggest there may be excess hospital capacity in rural areas, temporarily. NISAC used a hospital surge model to study the impacts on healthcare facilities from a pandemic influenza. The team evaluated 5 of the 7 scenarios using the hospital surge model: the Baseline, Fear-40, CMG, CMG-SE, and Anticipated intervention scenarios. The team used the planning assumptions in the HHS Pandemic Influenza Plan17 promulgated by the Centers for Disease Control (CDC) to parameterize the hospital surge model. The analysis indicates that concerns
15 M.I. Meltzer, N.J. Cox, K. Fukuda, “The Economic Impact of Pandemic Influenza in the United States: Priorities
for Intervention,” Emerging Infectious Diseases 5, No. 5, 659–671 (1999).
16 NCHS, “Health, United States, 2005 with Chartbook on Trends in the Health of Americans,” National Center for Health Statistics (2005).
17 Department of Health and Human Services, “HHS Pandemic Influenza Plan,” November 2005, <http://www.hhs.gov/pandemicflu/plan/>.
FOR OFFICIAL USE ONLY 43

FOR OFFICIAL USE ONLY
regarding U.S. healthcare system capacity are valid. Simulations indicate that the current U.S. healthcare system alone will not be able to support the patient load if 11 percent of symptomatic people seek hospitalization, as described in the CDC guidance on pandemic influenza preparedness. Figure 4-4 compares the number of days from the onset of pandemic until individual hospitals reach their maximum occupancy for the Baseline and Anticipated scenarios. Assuming that hospitals are operating at 90 percent occupancy at the initiation of the pandemic, the analysis concludes that nearly every hospital will reach full capacity. However, each case differs in the time at which hospitals, urban and rural, reach full occupancy. In the Baseline scenario, nearly every hospital reached full capacity within 5 to 8 weeks after the beginning of the pandemic. In the Anticipated scenario, hospitals reached full capacity within 10 to 17 weeks from initiation of the pandemic. In each case, multiple hospitals were at full capacity before the peak of the pandemic.
FOR OFFICIAL USE ONLY 44

FOR OFFICIAL USE ONLY
Baseline
Anticipated
Figure 4-4. Day of peak hospital occupancy by hospital service area for the Baseline and Anticipated Intervention scenarios
FOR OFFICIAL USE ONLY 45

FOR OFFICIAL USE ONLY
To treat the increased influx of patients during the peak of the pandemic, temporary facilities will need to be established early. To avoid relocation of patients, the simulations indicate that temporary healthcare facilities should be concentrated in the largest U.S. cities because their residual hospital capacity will be exhausted first. The key findings for the Public Health and Healthcare Sector include the following:
• Surge capacity. Assuming that hospitals are operating at the average annual occupancy of licensed beds and there is no government-directed mitigation strategy, the U.S. healthcare system will be overwhelmed in 7 to 10 weeks and will turn away 3 to 4 million patients. If hospitals are already operating at 90 percent occupancy of licensed beds at the beginning of a pandemic, the system will be overwhelmed in 3 to 6 weeks.
• Surge duration. With no government-directed mitigation strategy in place, the U.S. healthcare system will be at full capacity for a total of 3 to 6 weeks. Government interventions can limit the hospital overflow to a few hospitals that operate at capacity for a few weeks.
• Dependence on emergency services. During a pandemic with little or no government intervention, the U.S. healthcare system is highly dependent on the Emergency Services Sector. During a pandemic with government intervention, the dependence on emergency services is less acute.
• Healthcare costs. With no government-directed mitigation strategy, costs to existing U.S. healthcare facilities to cover ambulatory care and hospitalization for all infected cases are $17 to $19 billion in aggregate. Government interventions, where feasible, can minimize the healthcare costs of a pandemic.
One of the largest concerns is the number of people who will need hospitalization but will be denied because of hospital overcrowding. On a national level in most of the scenarios, the healthcare system is overloaded as a result of increased demand for care from symptomatic people. The overloading occurs at every level, with all states and nearly all counties having unserved population. In each scenario, California, Texas, New York, and Florida have the greatest amount of patient overflow. Locally in each state, the impacts of hospital overloading will be greatest in the most populous regions, as these regions can expect a greater number of patients. San Francisco, Los Angeles, New York City, Houston, Dallas, Miami, and Tampa will have the majority of patient overflows. However, the analysis was specific to existing healthcare facilities and does not presently account for the ability to mobilize and build temporary hospitals and treatment centers. Given the potentially high human cost of limited healthcare system support for pandemic response, NISAC recommends that temporary facilities be established early and maintained for the majority of the pandemic. Furthermore, regional hospital coordinating councils and emergency management officials need to include temporary hospitals in their emergency diversion planning. Many healthcare facilities in the country are either part of a system of hospitals or members of regional hospital coordinating councils that plan and respond to local disasters. During a pandemic, these organizations mediate emergency diversions, and these emergency diversions
FOR OFFICIAL USE ONLY 46

FOR OFFICIAL USE ONLY
require operational emergency management systems that could be chokepoints in some regions. NIAC defines nearly 90 percent of emergency services workers as critical, and therefore even small potential workforce impacts can affect emergency services and the sectors that rely on them. Simulations indicated that failures in the Emergency Services Sector pose a significant risk to operation of the healthcare system during a pandemic. NISAC recommends that emergency medical technicians (EMTs) be given priority status for vaccination because the training requirements for certification limit the available pool of replacement workers and because EMTs are critically necessary to the healthcare system. The final issue considered for the Public Health and Healthcare Sector is hospital financial viability during and after the pandemic. Depending on the mitigation strategy chosen, the costs to the Public Health and Healthcare Sector could be $0.5 to $19 billion. Mitigation strategies such as CMG and Anticipated intervention scenarios will effectively reduce the number of people who are infected by pandemic influenza and would also significantly lower costs to the healthcare industry versus the other mitigation strategies. These costs need to be considered in the context of the broader economic impact and the feasibility of implementing each proposed mitigation measure. 4.5 Transportation Workforce absenteeism will affect the transport of people and freight. Analysis of workforce absenteeism impacts in the Transportation Sector considered a wide variety of transportation modes, including airlines, trucking, railroads, mass transit, pipelines, barges, and ports. The analysis indicates that demand for passenger transportation services (mass transit and air transportation) would likely decline at a rate similar to or exceeding the loss of capacity due to absenteeism. As a result, limited passenger transportation capacity is unlikely to be a serious problem. Demand for freight movements, however, is unlikely to fall significantly during a pandemic, so there is greater concern about this segment of the Transportation Sector. Within freight transportation, some operations are likely to be more susceptible than others. Analysis efforts have focused on the 3 areas where significant effects of absenteeism are most likely—airfreight, railroads, and container ports. Analyses for each of these areas used peak absenteeism rates from earlier analytical results of this study—5.8 percent (Baseline), 14 percent (Anticipated), and 28 percent (Fear-40)—but extended the duration of the peak absenteeism to evaluate how long it takes for congestion to propagate through the transportation networks. The analyses indicate the following:
• The loss of airfreight capacity is roughly linear with absenteeism levels. • Moderate peak absenteeism levels (14 percent) and long absenteeism durations (6 weeks
or more) are sufficient to cause critical problems at most major rail yards. The impacts of higher peak absenteeism (28 percent) are even longer and more immediate.
Impacts at ports are strongly dependent on operation specifics, such as shared terminals. Most of the individual terminals at the Port of Los Angeles could withstand high levels of absenteeism if the duration of the pandemic is not excessive. If the peak of a pandemic occurred in October (the
FOR OFFICIAL USE ONLY 47
FOR OFFICIAL USE ONLY
busiest month at the Port of Los Angeles) the congestion would be severe. There was insufficient data to evaluate the impacts at the Port of New York and New Jersey. 4.5.1 Airfreight The analysis of the effects of absenteeism on the movement of airfreight is based on the Air Transportation Optimization Model (ATOM), which was developed by NISAC for assessing a variety of DHS concerns related to air transportation.18 NISAC used the peak absenteeism rates for each scenario as the basis for the analysis and rescaled the available capacity on all routings uniformly across the national network for each scenario. The simplifying assumption is that the peak absenteeism in transportation will be simultaneous nationwide. This assumption will tend to overpredict the constraints on the network and thus lead to a somewhat conservative analysis. However, the overall conclusion that a reduction in system capacity is proportional to the absenteeism rate is the most useful insight gained from the airfreight analysis. 4.5.2 Rail System Significant portions of the national rail system are operating near capacity. Substantial absenteeism would likely disrupt freight movements in some important corridors, such as the Union Pacific rail lines connected to the Ports of Los Angeles and Long Beach. There have been several instances in recent years where local bottlenecks in portions of the rail system have had ripple effects across the network. As classification yards (where trains are assembled and disassembled and individual freight cars are sorted as they move through the network) became clogged, freight cars and locomotives became unavailable in the needed locations, and shippers’ goods became “stuck” in the system.19
The analysis of potential delays in rail shipments resulting from pandemic-induced excess absenteeism is based on the Rail Network Analysis System (R-NAS) model. This model was developed by NISAC in order to address DHS concerns related to the rail industry.20 It simulates the flows of shipments across links of the rail network in a way that recognizes the effects of congestion in the network resulting from limited capacity. As flow over a link increases, the congestion and resulting travel time increase. If the ultimate capacity of a link is reached, no additional flow can be accommodated. It is possible that with a major influenza outbreak, some freight usually carried by the railroads could not be moved until operations return to normal. Identifying when such situations might occur is an important element of the analysis.
18 D. Jones, C. Davis, J. Lloyd, K. Jones, O. Bernstein, L. Nozick, M. Turnquist, “Contingency Planning for
Passenger Air Transportation,” Sandia National Laboratories Report (2005).
19 D. Machalaba, “Railroad Blues: Woes at Union Pacific Create a Bottleneck for the Economy,” Wall Street Journal, July 22, 2004, page A1.
20 D. Jones, L. Nozick, M. Turnquist, “Impact Analysis of Potential Disruptions to Major Railroad Bridges in the U.S., Phase I Report,” National Infrastructure Simulation and Analysis Center Project Report, (2003).
FOR OFFICIAL USE ONLY 48
FOR OFFICIAL USE ONLY
Congestion occurs primarily at the large classification yards in the rail network. The analysis of the potential effects of absenteeism in the national rail network focused on 18 of the largest classification yards operated by the 4 largest U.S. railroads. At the lowest peak absenteeism rate analyzed, 5.8 percent, NISAC estimates that the effective capacity of the rail yards considered will be reduced approximately 3 percent. Absenteeism also results in additional train cancellations and a modest increase in average train length. If the traffic volume on the rail system is unchanged, the average time each railcar spends at each yard (dwell times) increases by 4 to 17 hours. The team expects origin-destination times for most shipments to increase by 1 to 3 days. At the mid-level peak absenteeism rate of 14 percent, the estimated reduction in effective capacity for the major rail yards is approximately 10 percent. If the total volume of shipments is unaffected by absenteeism in other industries, this reduction is likely to push all 18 of these major yards to a critical situation; the input rate of arriving cars to be processed will exceed the capacity of the yard, and the delays will grow progressively longer over time until operations return to normal and the backlog of shipments is gradually cleared through the system (6 months or more). At the highest peak absenteeism rate scenario analyzed, 28 percent for the Fear-40 scenario, the situation is even worse. The demand on the major rail yards is likely to be 60 to 70 percent above their effective capacity, but operations will return to normal faster because absenteeism is more acute (higher absenteeism lasting for a shorter period of time) than in the other scenarios. Of course, the shipping industries are very likely to be experiencing similar absenteeism rates. As a result, shipment volumes may be substantially decreased. Nevertheless, at the very high absenteeism rate of 28 percent, there is likely to be an enormous disruption in the rail system over a period of 2 months or more. 4.5.3 Container Port Operations To analyze the impact of substantial levels of absenteeism at container ports, NISAC developed a queuing model to represent the process of loading and unloading containers from ships at specific ports. Dockside operations are typically a limiting factor in port performance. The 3 largest ports (Los Angeles, Long Beach, and New York-New Jersey) handle approximately 50 percent of the nation’s total container traffic, as measured by 20-foot ton equivalent units (TEUs). In 2005, the Port of Los Angeles handled about 7.4 million TEUs, and the Port of Long Beach handled about 6.7 million TEUs.21, 22 The team focused on the Port of Los Angeles to analyze the impacts of substantial absenteeism caused by pandemic influenza on port performance because it is the largest of the seaports and has the best available data. Future analyses might consider international and supply chain factors more fully.
21 Port of Los Angeles, “2005 TEU Report,” < http://www.portoflosangeles.org/factsfigures_Annual_2005.htm>.
22 Port of Long Beach, “Yearly TEUs, 2005,” <http//www.polb.com/economics/port_stats/yearly_teus.asp>.
FOR OFFICIAL USE ONLY 49

FOR OFFICIAL USE ONLY
The Port of Los Angeles has 8 terminals operated by various terminal companies. Generally, each terminal has vessel berths, gantry cranes for loading/unloading ships, and container yard facilities for staging and storing containers. Different ocean carriers have agreements with each terminal operator for use of their facilities. Some carriers have arrangements to use multiple terminals, while others only have arrangements with a single terminal. The peak volume at the Los Angeles port occurs in October. These analyses are based on an average month’s arrival rate and use October data as the peak arrival rate. To calibrate the Port of Los Angeles queuing models, the team used the Vessel Movement files available from the Maritime Administration.23 The scenario analyses are based on a forecasted overall demand level of 9.6 million TEUs for 2007. Most terminals in the port can probably tolerate the varying peak absenteeism rates analyzed—5.8 percent, 14 percent, and 28 percent. Delays in processing times would certainly increase, especially in the most severe scenario, where the total time in port increases by about 40 to 50 percent. Terminal 6, the Seaside Terminal, does not have enough capacity to accommodate the highest level of absenteeism. Furthermore, the carriers using this terminal do not currently have arrangements with other terminals at the Port of Los Angeles. At the average monthly volume, absenteeism increases the average processing time for a container in port from 60 hours to 152 hours (approximately 6.3 days). This delay would be a severe problem. If the peak of the pandemic occurs in October, the peak throughput month, delays would significantly increase. Although it is similar in many respects to the Port of Los Angeles, the Port of Long Beach does have a higher proportion of terminals with overlap in the carriers they service. This means that it is somewhat less susceptible to the capacity constraints at a single terminal which cause significant delays, as is seen at Terminal 6 in the Los Angeles analysis. The Port of New York and New Jersey in the New York City area processes a lower total volume of containers than the Los Angeles and Long Beach ports and has a slower growth rate; but it does have tighter constraints on expansion and a different set of capacity issues. The team has anecdotal data (from conversations with port officials) that the capacity-limiting element of the New York/New Jersey port is the container yard rather than the dockside operations. However, NISAC has been unable to obtain hard data on which to base an analysis of this issue. The conclusion is that the Port of New York and New Jersey is likely to respond differently than the Los Angeles and Long Beach ports to substantial worker absenteeism, but NISAC presently does not have sufficient information to predict the differences in effects. 4.6 Agriculture and Food The study evaluated whether the production and, to a limited degree, the demand conditions under the various scenarios will cause shortages in consumer food supplies. In the food subsector, there is a sufficient buffer in manufacturing capacity to tolerate long-term labor shortages. For example, in 1 study that focused on milk supply dynamics, the production and 23 U.S. Department of Transportation, “Vessel Movement Files for 2005,” Maritime Administration, Washington,
DC, 2007, <http://www.nvmc.uscg.gov/download.html>.
FOR OFFICIAL USE ONLY 50

FOR OFFICIAL USE ONLY
transportation impacts resulting from the Baseline absenteeism scenario were not sufficient to significantly disrupt the flow of milk to consumers. The Agriculture and Food Sector, as a whole, would not be severely impacted by pandemic-related workforce absenteeism for the 7 disease and mitigation scenarios analyzed. High absenteeism (on the order of 40 percent or more) for extended periods of time (over 4 weeks, depending on the percentage of absenteeism and the food subsector) produces shortages at the retail level. 4.6.1 Milk Supply To gain insight into how labor shortages may impact food supply chains over time, the analysis team modeled the structure and dynamics of a regional milk supply chain from production through retail distribution. This model was used to study oscillations in milk inventories given various labor shortage scenarios. Milk production is not seasonal, so it provides a good case study for evaluating the effects on the entire supply chain. Results for specific crops may vary, as the timing of the pandemic relative to the planting cycle may influence production rates. The milk supply chain model was designed to be regional in scope and to represent the major functional segments of the milk supply chain, including farm production, food processing and packaging, distribution, retail, and consumer demand. This analysis does not include potential price impacts due to labor costs or supply shortages. NISAC used the Baseline and Fear-40 scenarios to evaluate the milk supply chain model. Within these 2 scenarios, the team considered the effect of consumer demand on the supply chain. First, the team ran each scenario assuming that the consumption rate followed the same pattern as the other process rates in the supply chain. Second, the team ran each scenario while holding consumer demand constant at the initial equilibrium value. Finally, to estimate product shortages, the team used consumer demand and retail sales to calculate a product availability ratio. For example, if consumer demand is greater than retail sales, then product availability will be less than 1, indicating that some fraction of consumer demand was not met. The Baseline scenario, in which absenteeism peaks at about 6 percent, did not show a significant impact on consumer product availability. Under the more stringent assumption that assumed demand for milk remained constant during the pandemic, a maximum of 3 percent of retail milk demand was not met. Under the assumption that retail demand falls during the pandemic, no retail milk shortage occurred. It appears that in both cases, existing inventory levels were sufficient to dampen much of the production oscillations caused by the absenteeism rates in the Baseline scenario. The Fear-40 scenario has a noticeable impact on the milk supply chain. In this case, product availability at the retail level dropped by almost 50 percent for both the constant and variable retail demand cases. Although all of the supply chain elements remained operational during the high-impact scenario, a greater than 25 percent reduction in labor availability and the corresponding decrease in production output throughout the milk supply chain caused significant shortages in product at the retail level. It is important to note that assumptions used in the model
FOR OFFICIAL USE ONLY 51
FOR OFFICIAL USE ONLY
are notional estimates of how a milk supply chain operates. NISAC used these estimates to conduct studies on the relative impact of various scenarios and assumptions. 4.6.2 Food Supply and Distribution The U.S. manufactured foods value chain is the primary means of providing food to the U.S. population. The value chain incorporates the contributions from the network of firms that bring food and agricultural products to market and ranges from agricultural inputs to the final delivery of products to consumers. While NIAC’s characterization of the infrastructure workforce showed that only a small fraction of the workforce in the Agriculture and Food Sector has been identified as critical, the food industry has several characteristics that made it a candidate for further analysis: (1) it is relatively labor-intensive, (2) the industry contains a large number of small firms that are generally less resilient to workforce disruptions, and (3) the industry relies upon special handling and relatively quick transport of products between links in the value chain. The analysis of the vulnerability of the manufactured foods industry subsector to labor shortages from a pandemic influenza found:
• The industry is resilient to labor shortages resulting from 10 percent absenteeism due to illness and the need to care for ill family members over a period of 7 weeks.
• Significant impacts occur at the 40 percent absenteeism level if it lasts longer than 4 weeks.
• The potential impacts include: − Overall shortages in many processed food industries because of the lack of sufficient
excess capacity to offset production losses resulting from absenteeism − Increased volatility in inventories and productivity throughout the food industry value
chain (the “bullwhip” effect) as a result of the increased shipping distances and times; increased volatility will result in periodic short-term shortages followed by periodic overstocks throughout the system
• Wholesale and retail subsectors in large metropolitan areas are most likely to experience the first shortages due to their high concentrations of final consumption demand and the relatively long distances of wholesalers from food manufacturing operations. Shortages occurred on some goods while others remained available; consumers are expected to adjust their eating habits to what they can buy. Where shortages occurred, they took 3 to 5 weeks to develop and lasted on the order of 2 to 4 weeks. Full food supplies were restored within 2 weeks of labor levels returning to normal.
• Bulk materials industries (for example, flour milling operations) were not a limiting factor at even the higher absenteeism levels, in part because of the assumption that food industry usage would receive priority over nonfood industry usage. There could be shortages in the nonfood industries dependent on those bulk materials.
A relatively straightforward means of mitigating food shortages is to stockpile packaged and processed foods at locations up and down the value chain and across the country. Long-distance/long-time shipments do provide inventories; for example, long-distance imports of processed foods provide an inherent stockpile. Because wholesalers are widely distributed across the country and are located short distances from their customers, these firms could be part of a
FOR OFFICIAL USE ONLY 52

FOR OFFICIAL USE ONLY
national food security strategy. In this strategy, when a pandemic is considered imminent (perhaps 8 weeks before), wholesale firms, particularly those serving metropolitan areas, could begin stockpiling foods. Once the pandemic is indicated, the stockpiles could be distributed or rationed throughout the anticipated duration of the pandemic. The analysis is based upon a firm-level model24 of the food value chain constructed from publicly available industry statistics and industry economic accounts tables.25, 26, 27, 28 Firm sizes for different sectors of the industry are shown in Figure 4-5. Note that the bulk of overall output is concentrated in the larger firms. For example, the NAICS 3119811 (Commercial Bakeries) firms with 99 employees or fewer represent 85 percent of all such firms but contribute only 17 percent of output. Regional variations in production versus consumption are portrayed in Figure 4-6. Using breakfast cereal as an example, the figure depicts regions with a high supply of and a high demand for a particular long-shelf-life food product.
24 E.D. Eidson and M.A. Ehlen, “NISAC Agent-Based Laboratory for Economics (N-ABLE): Overview of Agent
and Simulation Architectures,” Sandia National Laboratories SAND2005-0263, February 2005.
25 U.S. Census Bureau, “Sector 31: Manufacturing: Geographic Area Series: Industry Statistics for the States, Metropolitan and Micropolitan Statistical Areas, Counties, and Places: 2002,” 2002 U.S. Census, <http://factfinder.census.gov/>.
26 U.S. Census Bureau, “County Business Patterns,” <http://www.census.gov/epcd/cbp/view/cbpview.html.
27 U.S. Census Bureau, “U.S. International Trade Statistics: Value of Exports, General Imports, and Imports by Country by 6-digit NAICS,” <http://censtats.census.gov/cgi-bin/naic3_6/naicMonth.pl>.
28 U.S. Bureau of Economic Analysis, “Industry Economic Accounts: 1997 Data Files: 1997 Supplementary Make, Use and Direct Requirements Tables at the Detailed Level,” <http://www.bea.gov/industry/io_benchmark.htm>.
FOR OFFICIAL USE ONLY 53

FOR OFFICIAL USE ONLY
Food (NAICS 311)
Wholesale (NAICS 4244) Retail (NAICS 4451) Figure 4-5. Firm size distribution by number of employees: Food, Wholesale, and Retail29
29 Graph is based on NAICS 311, 4244, and 4451, which is a subset of all firms in the food industry; for example,
it excludes fresh fruit, vegetables. Source of data: U.S. Census Bureau, “2002 County Business Patterns (NAICS),” U.S. Department of Commerce, Washington, D.C. April 12, 2007, <http://censtats.census.gov/cbpnaic/cbpnaic.shtml>.
FOR OFFICIAL USE ONLY 54

FOR OFFICIAL USE ONLY
Supply
Demand
Figure 4-6. Regional variation in supply and demand for breakfast cereal NISAC analyzed the following types of labor disruption to identify the duration of disruption required to cause food shortages:
• A 10 percent loss of labor in the food manufacturing and wholesale subsectors over a 7-week period. This level of disruption is consistent with peak absenteeism levels due to illness and the need to care for ill family members during a severe pandemic.
• A 40 percent loss of labor in the industry and wholesale subsectors over a 7-week period. This level of disruption is consistent with national planning assumptions about absenteeism due to voluntary self-isolation as well as to illness and the need to care for family, but it is more than double the expected worst case.
Critical assumptions were as follows:
• Any given percentage of labor shortage (for example, 40 percent) results in the same percentage of firms that do not operate over the pandemic period. In reality, some firms with less than 40 percent lost labor will close, while other firms may take more than a 40 percent loss of labor to close. Barring further data, this translation of labor to firms is the first approximation of absenteeism impact on operations. NISAC recommends further sensitivity analysis and research on the effects of labor losses on the productivity of firms in the food industry.
• During a pandemic, citizens consume food at the same level and distribution as they normally do, with the exception of increased preference toward processed and storable foods.
• There is no massive pre-stocking of food at the industry or wholesale levels, even though, as explained above, pre-stocking is an important policy consideration.
• There is no massive culling of poultry stocks; massive culling could cause large losses in the poultry industry.
• The balance of trade with other nations remains the same. While other nations (for example, Canada and Mexico) could potentially supply the U.S. with more food, they will likely be conducting similar loss mitigation strategies for their own manufactured food industries and would not have excess product for U.S. import.
• Food inputs that are used for nonhuman food applications (for example, flour milling for dog food) and that are in tight supply will be prioritized for human food production.
FOR OFFICIAL USE ONLY 55
FOR OFFICIAL USE ONLY
• While a number of manufactured food subsectors follow annually fluctuating cycles, the changes in value chain measures between normal and pandemic scenario conditions would be greater than changes caused by annual fluctuations. For example, the decrease in corn milling inventories resulting from pandemic-caused labor shortages is much larger than the decrease caused by annual harvest and winter usage-based changes.
Simulations of a 40 percent loss of labor indicate there would be shortages at a number of retail food locations across the country beginning 2 to 4 weeks into the disruption. Industry and wholesale subsectors would experience shortages that last most of the disruption period. Some industries could take up to 4 months to recover. The duration of the impact corresponds to a market disruption sufficient to cause market restructuring, and the disruptions could cause industries to experience a bullwhip effect and retail firms to experience shortages. However, the impacts would not be great enough to cause the industries and firms to close. Because it is assumed that disease progression across the Nation occurs in a single wave and affects all sectors simultaneously, NISAC’s simulated regional and sector dynamics should be considered general in nature. 4.7 Banking and Finance There are 3 primary mechanisms by which a pandemic could affect the financial system: (1) operational impacts caused by high absenteeism, leading to the inability to perform routine operations in a timely manner or the inability to resolve problems in the underlying infrastructure (order sending, processing) as they arise, (2) panic, or (3) disruptions to underlying infrastructures and services—Telecommunications, Energy, and third-party service providers (security, cleaning, etc.). Hong Kong’s Hang Seng stock index dropped almost 10 percent during the severe acute respiratory syndrome (SARS) epidemic in Spring 2003. The impact of a global pandemic could be even greater, particularly in the scope of assets and markets affected. The Hang Seng decline lasted until “the number of new cases was on a sustained downwards trend.”30 Thus, a pandemic may affect the market for an extended period. The magnitude of impacts to the Nation’s financial system infrastructure will be heavily dependent upon the adequacy of each individual firm’s business continuity planning (BCP). Current BCP focuses on restoring infrastructure and critical functions in the face of a short-lived event such as a terrorist strike or natural disaster. Most do not prepare for conditions that may exist during a pandemic, such as high absenteeism. Issues such as employee cross-training on the most critical functions and remote access of existing infrastructure and capabilities become very important in a pandemic influenza context. Important financial system participants have robust backup infrastructures. However, a potentially unique threat presented by a pandemic is that personnel who operate both the backup and the main sites could be affected simultaneously, thus limiting the capability to transfer 30 Citibank, Global Portfolio Strategist, “Avian Flu Science, Scenarios and Stock Ideas,” November 17, 2005.
FOR OFFICIAL USE ONLY 56

FOR OFFICIAL USE ONLY
operations from 1 site to another. Certain financial system functions require a high degree of coordination among a large number of diverse participants—coordination that can be affected by a pandemic. One example is Fedwire; while its total daily volume is approximately $2 trillion, the total intra-day liquidity used by the participants at any particular moment is unlikely to exceed $50 billion, consisting of approximately $15 billion of Federal Reserve balances and approximately $30 billion31 of intra-day borrowing from Federal Reserve. Thus, when Fedwire participants send funds, they are expecting that matching funds will quickly arrive in their accounts. This coordination has been broken before, for example by the events of September 11, 2001, when the Federal Reserve had to provide approximately $45 billion of additional discount window loans to system participants in order to keep Fedwire functioning. Certain organizations have done a significant amount of work in developing BCPs that specifically address a pandemic influenza. One such organization is the Federal Financial Institutions Examination Council, which prepared a study of the threat presented by an avian flu outbreak and developed a number of recommendations that would allow mitigating at least some of the problems expected to arise from this threat.
31 J.J. McAndrews, S.M. Potter, “Liquidity Effects of the Events of September 11, 2001,” FRBNY Economic Policy
Review, November 2002.
FOR OFFICIAL USE ONLY 57

FOR OFFICIAL USE ONLY
This page intentionally blank.
FOR OFFICIAL USE ONLY 58

FOR OFFICIAL USE ONLY
5. Economic Impacts In addition to potential CI/KR impacts, a pandemic influenza will cause at least 3 distinct economic impacts or “shocks” to the economy: (1) supply shock, which is a temporary reduction in the working population due to their own illness, the illness of family members, or the fear of illness; (2) demand shock, which is a temporary reduction and reallocation of consumption of particular goods and services; and (3) population shock, which is a permanent loss of population and the workforce due to deaths. It is assumed that the supply and demand shocks resulting from each scenario occur primarily in the first year of the pandemic and that the population shocks cause long-term shifts in business operations. These economic analyses were conducted without considering the costs of formulating, implementing, or enforcing the actions that make up the scenarios. These costs are likely directly related to the number of provisions involved with each scenario. For example, the CMG and Anticipated scenarios require student dismissal, quarantine, or vaccine development, which are likely to be costly. This analysis did not assume a loss of income for school staff as a result of student dismissal, as it is not clear that would occur. The supply, demand, and population shocks represent the combined effects of epidemiological, workforce, and infrastructure impacts. Macroeconomic simulations for the Baseline, Fear-40, CMG, CMG-SE, Antiviral, and Anticipated scenarios used the following assumptions:
• The levels of worker absenteeism for each scenario translated into reductions in labor productivity and employment by industry, including the infrastructure sectors.
• The estimated reduction in population for each scenario reduces the long-run workforce and thus overall capacity of the economy.
• There is increased spending on healthcare for each scenario. 5.1 National Economic Impacts Table 5-1 lists the economic impacts of each scenario, measured as changes in U.S. gross domestic product (GDP) over a 10-year period.32 The range of impacts listed for each scenario reflected variations in the consumer demand response, assumed in this analysis to decrease for select durable goods and services and to increase for healthcare expenditures. The modeled changes in consumer behavior implied a 0.2 to 2.2 percent reduction in GDP, which is in line with the 0.5 percent demand shock estimated by others for the 1918 pandemic. In Year 1, the Baseline scenario economic impacts were between $120 and $350 billion, or 1.1 to 3.1 percent of U.S. GDP, depending upon assumptions about consumer demand. The CMG-SE had the lowest economic impacts for Year 1 due to a combination of low absenteeism and deaths, and CMG had the lowest economic impacts for Years 1 through 10 because of fewer deaths. This reduction over the Baseline was due to fewer ill people, which reduced workplace absenteeism, and fewer
32 This analysis does not include the Pre-pandemic Vaccine scenario.
FOR OFFICIAL USE ONLY 59
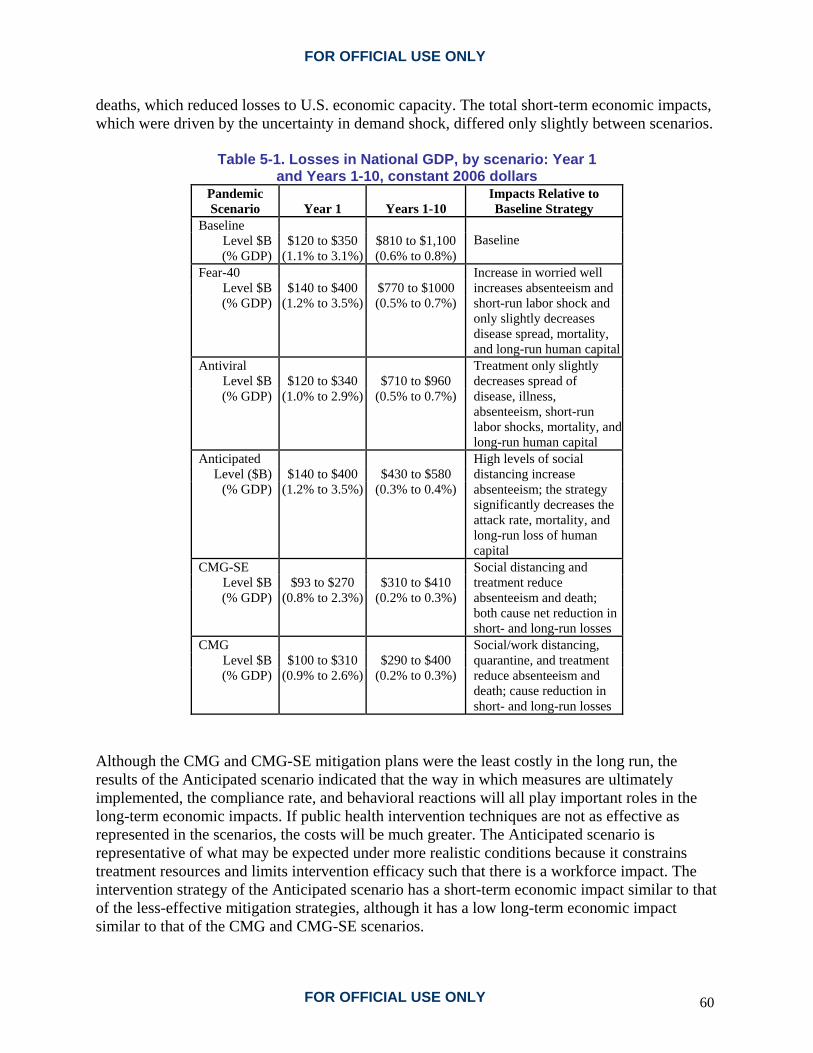
FOR OFFICIAL USE ONLY
deaths, which reduced losses to U.S. economic capacity. The total short-term economic impacts, which were driven by the uncertainty in demand shock, differed only slightly between scenarios.
Table 5-1. Losses in National GDP, by scenario: Year 1 and Years 1-10, constant 2006 dollars
Pandemic Scenario Year 1 Years 1-10
Impacts Relative to Baseline Strategy
Baseline Level $B $120 to $350 $810 to $1,100 (% GDP) (1.1% to 3.1%) (0.6% to 0.8%)
Baseline
Fear-40 Level $B $140 to $400 $770 to $1000 (% GDP) (1.2% to 3.5%) (0.5% to 0.7%)
Increase in worried well increases absenteeism and short-run labor shock and only slightly decreases disease spread, mortality, and long-run human capital
Antiviral Level $B $120 to $340 $710 to $960 (% GDP) (1.0% to 2.9%) (0.5% to 0.7%)
Treatment only slightly decreases spread of disease, illness, absenteeism, short-run labor shocks, mortality, and long-run human capital
Anticipated Level ($B) $140 to $400 $430 to $580
(% GDP) (1.2% to 3.5%) (0.3% to 0.4%)
High levels of social distancing increase absenteeism; the strategy significantly decreases the attack rate, mortality, and long-run loss of human capital
CMG-SE Level $B $93 to $270 $310 to $410 (% GDP) (0.8% to 2.3%) (0.2% to 0.3%)
Social distancing and treatment reduce absenteeism and death; both cause net reduction in short- and long-run losses
CMG Level $B $100 to $310 $290 to $400 (% GDP) (0.9% to 2.6%) (0.2% to 0.3%)
Social/work distancing, quarantine, and treatment reduce absenteeism and death; cause reduction in short- and long-run losses
Although the CMG and CMG-SE mitigation plans were the least costly in the long run, the results of the Anticipated scenario indicated that the way in which measures are ultimately implemented, the compliance rate, and behavioral reactions will all play important roles in the long-term economic impacts. If public health intervention techniques are not as effective as represented in the scenarios, the costs will be much greater. The Anticipated scenario is representative of what may be expected under more realistic conditions because it constrains treatment resources and limits intervention efficacy such that there is a workforce impact. The intervention strategy of the Anticipated scenario has a short-term economic impact similar to that of the less-effective mitigation strategies, although it has a low long-term economic impact similar to that of the CMG and CMG-SE scenarios.
FOR OFFICIAL USE ONLY 60

FOR OFFICIAL USE ONLY
FOR OFFICIAL USE ONLY 61
5.2 Economic Subsector Impacts The hardest-hit economic subsectors are manufacturing, which would lose an estimated $95 billion in output, followed by finance and insurance, with a $40 billion loss, and retail trade, with a $32 billion loss. These impacts can be attributed to demand, supply, and population shocks. Each has a different impact across economic subsectors (Figure 5-1). Demand shock has a strong impact on many of the subsectors. For example, demand is specifically reduced in a number of the manufacturing subsectors that produce final goods for consumers; these are the “direct” economic impacts. Other subsectors that provide goods and services to the manufacturing subsector also lose sales; these are “indirect” impacts. The lost manufacturing wages reduce purchases across consumer spending categories; these are “induced” impacts. Unlike the demand shock, the supply shock is distributed across subsectors based on employment levels. The effects of absenteeism-based supply shock are greatest in manufacturing, followed by finance and insurance, retail, wholesale, real estate, and construction. The population shock is likewise strongest in manufacturing, followed by real estate and finance and insurance, reflecting the combined effects of large numbers of employees in these three subsectors.

FOR
OFFIC
IAL U
SE ON
LY
Figure 5-1. Average GDP losses by type of shock and industry: Year 1, Baseline scenario
62 FO
R O
FFICIA
L USE O
NLY

FOR OFFICIAL USE ONLY
5.3 Regional Economic Impacts Similar to subsector impacts, the Year 1 impacts vary regionally across the country. Figure 5-2 presents the percent change in GDP for each state in Year 1. California, Michigan, Indiana, New York, and some New England states bear the brunt of the GDP percentage reductions.
Figure 5-2. Percent changes in GDP by state: Baseline scenario, Year 1
GDP losses correlate with the levels of population and manufacturing activity. For example, the large impacts in California and Michigan are likely due to the combined effects of the population shock and the demand shock. Both states have significant manufacturing subsectors and experience major losses of demand for consumer durables. Other highly populated states, such as Florida, experience lower-than-average impacts due to lower-than-average manufacturing activity.
FOR OFFICIAL USE ONLY 63

FOR OFFICIAL USE ONLY
This page intentionally blank.
FOR OFFICIAL USE ONLY 64

FOR OFFICIAL USE ONLY
6. Phase 2 - Uncertainty Analysis Phase 2 of NISAC’s pandemic influenza study extended the Phase 1 study to explore the range of potential consequences due to uncertainty about the disease and the relative likelihood of different outcomes. Just like many natural phenomena, such as hurricanes and earthquakes, the consequences of a pandemic are related to the severity of the event. The severity of the next pandemic is not known. Assumptions have been made that the next pandemic will be similar to known historical influenza pandemics; this may not be the case, however. Public health officials are concerned that the avian influenza H5N1 virus may, through reassortment or adaptation, become easily transmissible in humans. The observed case mortality rate for this viral strain is currently 55 percent, making it far deadlier than the 2 percent case mortality rate of the 1918 pandemic. Additionally, the case fatality rate estimates have ranged up to 33 percent for selected populations for the 1918 pandemic.33 These facts lend credence to the possibility that the next pandemic could be far worse than known historical examples. Uncertainty analysis is a method for filling in knowledge gaps with reasonable assumptions based on what is known and evaluating the effect of those assumptions to assess the consequences of future pandemics and the relative frequency of possible outcomes. The results of uncertainty analysis provide estimates of potential outcomes of a future pandemic, that is, the illness attack rate, number of deaths, stress on the healthcare system, and healthcare costs. These results can inform policy designed to mitigate pandemic effects. Policy decisions on pandemic influenza planning are better supported by assessing, through statistical analyses, a large set of plausible outcomes. Because statistical analyses address complex scenarios, uncertainties, and numerous potential strategies, this type of analysis can be more effective in creating policy options for dealing with the uncertainties in an influenza pandemic. Preparedness planning for a pandemic should be based on successful mitigation of expected consequences up to a certain limit, where the limit is often defined by resource constraints. Uncertainty analysis provides a basis for estimating the affordable limits in planning. Analyzing individual scenarios can help develop effective strategies for addressing uncertainty, but the individual scenarios by themselves assess only a tiny fraction of the potential manifestations of the disease. Individual scenarios and specific mitigation strategies are based on strong assumptions that may be overly optimistic given the complexities in disease response. Policy decisions on pandemic influenza planning are better supported by assessing, through statistical analyses, a larger set of plausible outcomes. Because statistical analyses address complex scenarios, uncertainties, and numerous potential strategies, this type of analysis can be more effective in creating a policy tool for dealing with the uncertainties in an influenza pandemic. To address uncertainty in both disease characteristics and model structure, NISAC used 3 structurally diverse epidemiological models: EpiSimS, Loki-Infect, and Generalized Infectious Disease (GID). These models have different strengths and each was investigated with uncertainty 33 R.J. Hatchett, C.E. Mecher, M. Lipsitch, “Public Health Interventions and Epidemic Intensity during the 1918
Influenza Pandemic,” Proc. Nat. Acad. Sci. 104:7582-7587 (2007).
FOR OFFICIAL USE ONLY 65

FOR OFFICIAL USE ONLY
analysis techniques to assess the effects of mitigation strategies on different disease manifestations. These models have varied disease characteristics, intervention timing and effectiveness, and compliance rates. Using these models, NISAC assessed a wide range of combinations of interventions and analyzed the outcomes in order to identify characteristics of robust strategies. EpiSimS and Loki-Infect examined relatively few disease manifestations and focused on interventions with a high degree of detail. GID, on the other hand, examined a large number of disease manifestations but modeled intervention strategies with a relatively low degree of detail. The Phase 2 part of the study also characterized the range and distribution of outcomes and applied an analysis method based on risk, consequences, and decision-maker values to evaluate trade-offs between alternative strategies. NISAC used EpiSimS to simulate the effects of various response strategies in a large region. The model created a population that is statistically equivalent to the population of southern California, 19 million individuals, and simulated their day-to-day activities. The agent-based model treats entities (individuals, groups) explicitly as agents. Individual agents are endowed with behavioral rules for internal states and interaction with other agents or the external environment. EpiSimS explicitly represented each of the 6 million households and 1 million businesses in southern California, estimating disease impacts by location and by industry classification. The EpiSimS agent-based simulation approach focused on the transmission of the disease and the impacts of different intervention strategies on disease spread. Loki-Infect is a generalized networked-agent modeling toolkit developed by NISAC to model critical infrastructures, interdependencies, and potential cascading failures. The Loki pandemic simulation approach combines both agents and explicit social networks and focuses on the effectiveness of interventions under different scenarios and uncertainties. The GID model is part of the suite of models developed under the CIPDSS program. It contains a compartmental Susceptible-Exposed-Infected-Recovered34 (SEIR) epidemiology model formulation. GID is linked to a population model (in order to track inter-regional travel and labor availability), a public healthcare model, and an economic impact model. These models were used to analyze impacts of a pandemic on the Public Health and Healthcare Sector infrastructure and to perform sensitivity and uncertainty analysis. The uncertainty analysis results were applied to a decision model on the basis of a multi-attribute utility decision theory to compare mitigation strategies and trade-offs in a risk-informed context. 6.1 Uncertainty Analysis Methodology Uncertainty analysis characterizes the range and distribution of outcomes from an event. As applied to the analysis of pandemic influenza, the purpose is to assess the efficacy of various mitigation strategies and to support preparedness planning. This method first characterizes the disease in terms of probability distributions of specific disease characteristics. A probability distribution describes the likelihood that a parameter will take on a given value. Instead of using descriptive terms such as “likely,” “unlikely,” “probable,” or “possible,” this analysis uses 34 H.W. Hethcote, “The Mathematics of Infectious Diseases,” SIAM Review 42, No. 4, 599-653 (2000).
FOR OFFICIAL USE ONLY 66

FOR OFFICIAL USE ONLY
specific probability function to define the range and likelihood of parameter values. Common probability distributions include the normal, the well known “bell curve,” and the uniform, where all values are equally likely. When possible, the distributions are derived from data presented in peer-reviewed literature. If the data is sparse, the distributions are derived from subject matter experts. The distributions are used to generate possible manifestations of pandemic influenza. With each disease manifestation, mitigation strategies and the impacts on infrastructures are evaluated. Because there are scores of parameters that define the disease, NISAC used sensitivity analysis to identify the most influential parameters. Sensitivity analysis enabled the NISAC team to focus on the smallest set of meaningful factors, and uncertainty analysis was used to estimate the likelihood of consequences. 6.1.1 Uncertainty Analysis Design Uncertainty analysis shows how different manifestations of the disease result in a range of expected outcomes. For example, uncertainty analysis can address what would happen if pandemic influenza were far more deadly than the 1918 influenza virus. To accomplish this type of analysis, the uncertainties of the model parameters representing disease characteristics, disease severity, pharmaceutical availability, intervention effectiveness, and behavioral response are characterized by probability distributions. NISAC used the 7 original scenarios to create 243 simulated disease scenarios for evaluation using the GID model; they each have differing biological characteristics, preparedness plans, sociological responses, and pandemic response policies. For these scenarios, NISAC evaluated the 6 vaccination strategies listed in Table 6-1. This set of vaccination strategies allowed the team to evaluate both single-intervention strategies and combinations. NISAC looked at each of these vaccination strategies under 4 possible combinations, or scenario sets, of social distancing measures and antiviral use, also shown in Table 6-1. By combining the vaccination strategies and scenario sets, the analysis team developed a matrix of 24 scenarios, including a Baseline scenario with no new mitigation measures. The resulting simulation data was used to assess the outcome distributions of disease fatalities, total illnesses, economic losses, impact on healthcare infrastructure, and other key consequence metrics. For the purpose of this analysis, contact tracing is defined as the identification and isolation of not-yet-ill individuals who have come in contact with an identified ill person. Targeted vaccination means vaccinating identified contacts rather than vaccinating specific demographic groups (for example, the elderly and children). Social distancing includes many means of reducing contact with other people, but primarily by means of voluntary self-quarantine.
FOR OFFICIAL USE ONLY 67

FOR OFFICIAL USE ONLY
Table 6-1. Scenario matrix: vaccination strategies and scenario sets evaluated in the uncertainty analysis
Scenario set for each vaccination strategy Designation No social distancing and no antivirals noSDnoAV No social distancing and antivirals noSDAV Social distancing and no antivirals SDnoAV Social distancing and antivirals SDAV
Vaccination strategies No vaccination or contact tracing 1 Contact tracing and quarantine without vaccination 2 Mass vaccination with strain-specific vaccine 3 Mass vaccination with pre-pandemic vaccine 4 Targeted followed by mass vaccination with pre-pandemic vaccine 5 Targeted vaccination with pre-pandemic vaccination 6
Overall, NISAC found significant variability in the number of illnesses and fatalities, worker absenteeism levels, and economic impacts over the range of biological, sociological, intervention, and policy input variables. The input parameters that were most significant in influencing pandemic outcomes are the following:
• Reproductive number (R0) • Proportion of transmission occurring prior to symptoms • Recovery time • Fraction of infected people who are asymptomatic • Relative contagion of people who are asymptomatic • Contact tracing effectiveness • Case fatality rate • Antiviral production rate
The impact of a pandemic influenza is highly sensitive to the infectiousness of the virus, especially how infectious the virus is prior to individuals showing symptoms. The majority of these parameters describe the biological variability of the virus, with the exception of the effectiveness of contact tracing and antiviral production rate. The biological parameters are uncontrolled variables in the sense that they are specified by nature. To address these variables, mitigation strategies must reduce disease the transmission and the case mortality rate. Other modeled parameters are controllable, such as the antiviral stockpile, antiviral production rate, and pre-pandemic vaccine stockpile. Preparedness planning should focus on these parameters, balanced with resource limits and cost constraints, to develop cost-effective mitigation strategies. 6.1.2 Results of Uncertainty Analysis Results indicate that the consequences of next pandemic could vary significantly. The variation in outcome is primarily due to the uncertainty of the characteristics of the influenza disease. Figure 6-1 shows the range of total deaths for each of the 24 matrix scenarios in a conventional box-and-whisker format. The lower vertical limit of the rectangular box represents the 25th percentile, and the upper vertical limit marks the 75th percentile. The line within each box indicates the 50th percentile, or median value, and the circled plus sign indicates the average
FOR OFFICIAL USE ONLY 68

FOR OFFICIAL USE ONLY
value. The “whisker” above each box extends to the lesser of 2 values: the highest value in the distribution or a value equal to 1.5 times the range between the 25th and 75th percentiles (the height of the box). The whisker that extends below a box is defined in similar fashion. Other, more extreme values are considered outliers and are indicated individually above the whiskers by asterisks. The vaccination and mitigation strategies are as described in Table 6-1. The box and whisker plot shows the range and likelihood of potential outcomes and allows comparison of those factors for each of the scenarios. It reveals that the use of multiple intervention strategies decreases the uncertainty in the potential outcomes, specifically deaths due to the pandemic, and by correlation, the long-term economic costs. At the same time, even the strategies that involve multiple interventions can have extreme outcomes, up to 20 million deaths. Such extreme outcomes have very low probability but are indicative of worst-case scenarios.
StrategySDAVSDnoAVnoSDAVnoSDnoAV
654321654321654321654321
35
30
25
20
15
10
5
0
Mill
ions
of D
eath
s
Figure 6-1. Box-and-whisker plots of pandemic influenza
deaths for matrix scenarios
FOR OFFICIAL USE ONLY 69

FOR OFFICIAL USE ONLY
Figure 6-2 shows the average number of deaths for each of the 24 scenario sets described in Table 6-1. For this set of mitigations, the greatest reduction in illness and deaths occurs with social distancing, which reduces the average number of deaths by about a factor of 5. The best vaccination strategy is a combination of mass vaccination with a pre-pandemic vaccine followed by mass vaccination with a fully effective vaccine (vaccination strategy 4), as it consistently lowers death rates. Table 6-2 compares the average values of several key consequences across all ranges of inputs. The underlying assumption is that the case mortality rate varies between 0.5 and 20 percent, although higher values are modeled as less probable. The modeled death rate is also affected by quality of care, which can decline when the healthcare system is overloaded.
1 2 3 4 5 6
SDAV
SDnoAV
noSDAV
noSDnoAV
0
1
2
3
4
5
6
7
Mill
ions
of D
eath
s
Vaccination Strategy
Vaccination Strategies: 1. No vacc or contact tracing 2. CT w/o vacc 3. Mass vacc, no early vacc 4. Mass vacc w/ early vacc 5. Target/mass vacc w/ early vacc 6. Targeted vacc w/ early vacc
Figure 6-2. Average influenza-related fatalities for 6 vaccine strategies
FOR OFFICIAL USE ONLY 70

FOR OFFICIAL USE ONLY
Table 6-2. Comparison of matrix scenario averages
Scenario Set
Vaccina-tion
Strategy*
Flu Illnesses (millions)
Flu Hospital-izations
(millions) Flu Deaths (millions)
1-Year Lost GDP (%)
Peak Fraction Workers Unavail-able (%)
Health-care Cost ($billions)
1 100 22.7 6.6 2.9 13 220 2 72 16.2 4.6 2.7 14 170 3 92 21.0 6.1 2.8 13 200 4 59 13.2 3.8 1.8 8 130 5 63 14.2 4.1 2.3 13 150
No Social Distancing, No
Antivirals
6 68 15.4 4.4 2.5 14 160 1 93 21.1 6.1 2.7 12 210 2 68 15.3 4.4 2.6 13 170 3 85 19.3 5.6 2.5 12 190 4 53 11.9 3.5 1.6 7 120 5 58 13.0 3.8 2.1 12 140
No Social Distancing, Antivirals
6 63 14.3 4.1 2.3 13 160 1 41 8.9 2.4 6.0 22 100 2 35 7.6 2.1 6.0 21 90 3 32 7.1 2.0 4.3 21 80 4 22 4.9 1.3 2.8 14 50 5 26 5.6 1.6 4.0 20 70
Social Distancing, No
Antivirals
6 32 7.0 1.9 5.5 20 80 1 37 8.1 2.2 5.6 20 90 2 33 7.1 1.9 5.6 19 90 3 29 6.3 1.8 4.0 20 70 4 19 4.2 1.1 2.6 13 50 5 23 5.0 1.4 3.7 19 70
Social Distancing, Antivirals
6 29 6.4 1.7 5.1 19 80 *Vaccination Strategy
1. No vaccination or contact tracing 2. Contact tracing and quarantine without vaccination 3. Mass vaccination with strain-specific vaccine 4. Mass vaccination with pre-pandemic vaccine 5. Targeted followed by mass vaccination with pre-pandemic vaccine 6. Targeted vaccination with pre-pandemic vaccination
Of all the 24 strategies, a combination of social distancing, antivirals, and vaccination strategy 4 results in the lowest healthcare costs; it is most effective in reducing the spread of the pandemic and has moderate peak absenteeism (13 percent). The results indicate that all of the modeled mitigation strategies provided some reduction in the number of illnesses and deaths that would otherwise result from an unmitigated pandemic influenza. The social distancing model assumes that the rate of social distancing is proportional to the rate of infection, delayed by a time constant. The model is based on literature describing societal response to the 2003 global outbreak of severe acute respiratory syndrome (SARS), a viral respiratory illness. The public health literature is sparse on the topic of behavioral responses to a pandemic, such as voluntary self-quarantine. NISAC recommends that more research be conducted on this topic.
FOR OFFICIAL USE ONLY 71
FOR OFFICIAL USE ONLY
If mass vaccination does not occur until a fully effective vaccine is developed (vaccination strategy 3), there is little reduction in deaths because the pandemic will have largely run its course. Mass vaccination with a stockpile of partially effective vaccine (vaccination strategy 4) is the best vaccination strategy, but it does not perform as well without social distancing because of the limited quantity available in the initial stockpile. The results show only a small reduction in deaths from contact tracing and quarantine, with or without vaccination (vaccination strategies 2, 5, and 6). The scenarios that include antivirals (labeled “AV” in the figures) have lower deaths than the corresponding scenarios without antivirals, but the reduction in deaths is relatively modest. However, social distancing (labeled “SD” in the figures) provides substantial reduction in deaths, even without any contact tracing or vaccination. On average, antivirals appear to reduce deaths by about 8 percent, social distancing appears to reduce deaths by about 62 percent, and the combination of social distancing plus antivirals appears to reduce deaths by about 66 percent (there is some variation around these numbers for the various vaccination strategies). The results shown in Table 6-2 indicate that contact tracing and quarantine reduce illness and fatalities in the non-social-distancing scenarios by approximately 30 percent, roughly reducing fatalities to a range of 4.4 to 4.6 million from an unmitigated range of 6.1 to 6.6 million (no social distancing, vaccination strategy 2). It is clear that the scenarios including targeted pre-pandemic vaccination (vaccination strategies 5 and 6) also reduce deaths; but approximately 75% of the reduction is a result of the contract tracing and quarantine alone. The efficacy of these strategies is dependent on the level of contact tracing effectiveness achieved. 6.2 Effectiveness of Mitigation Strategies Effective mitigation strategies reduce the clinical attack rate and the stress on the healthcare system by delaying the spread of the pandemic, allowing time to develop strain-specific vaccines and, in the long run, reducing the number of deaths. Effective mitigation strategies also have the potential to reduce fear-based behaviors, such as widespread self-isolation, that lead to excessive absenteeism. 6.2.1 Mitigation Effectiveness Approach NISAC analyzed 82 detailed scenarios to evaluate their effectiveness in terms of the measures implemented, the estimated compliance with the measures, and the timing of the implementation. The team used the EpiSimS simulation methodology and a pandemic influenza disease model35 for the evaluation. The scenarios are as follows:
35 P.D. Stroud, S.Y. Del Valle, S.M. Mniszewski, J.M. Riese, S.J. Sydoriak, Pandemic Influenza Impact Analysis
Report: Simulations of Disease Spread and Intervention Effectiveness, Los Alamos National Laboratory Unclassified Report 06-7066, pg. 1-80 (2006).
FOR OFFICIAL USE ONLY 72
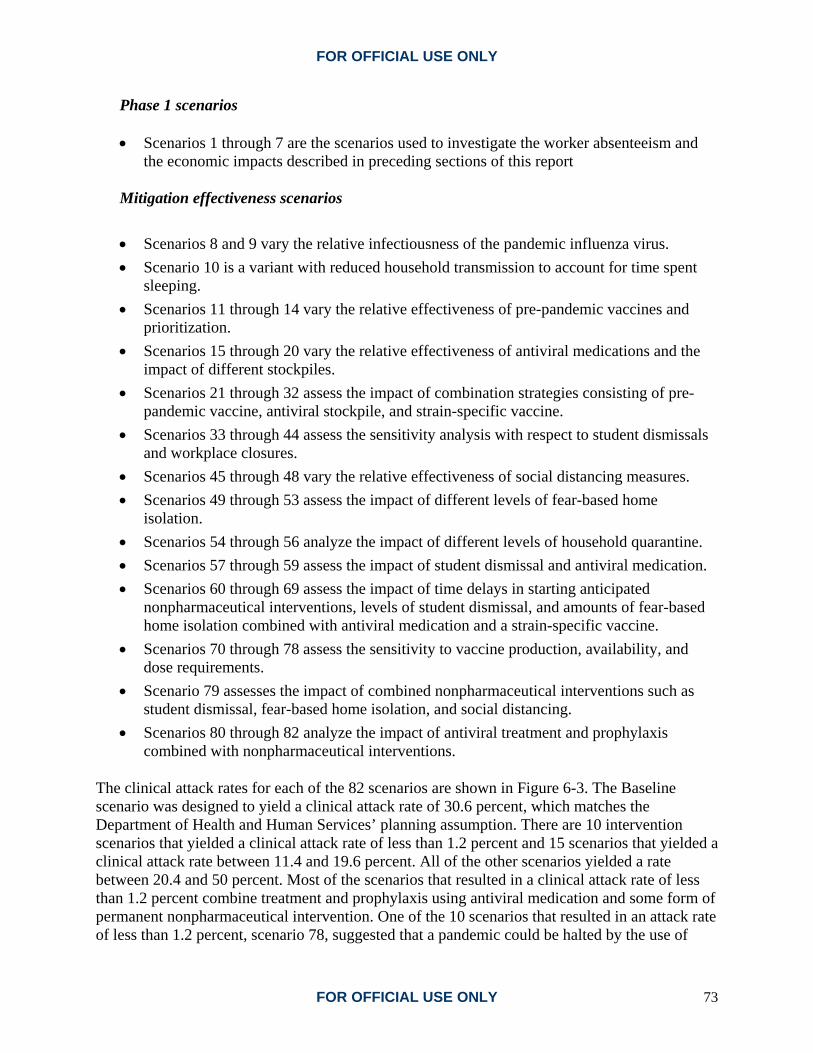
FOR OFFICIAL USE ONLY
Phase 1 scenarios • Scenarios 1 through 7 are the scenarios used to investigate the worker absenteeism and
the economic impacts described in preceding sections of this report Mitigation effectiveness scenarios
• Scenarios 8 and 9 vary the relative infectiousness of the pandemic influenza virus. • Scenario 10 is a variant with reduced household transmission to account for time spent
sleeping. • Scenarios 11 through 14 vary the relative effectiveness of pre-pandemic vaccines and
prioritization. • Scenarios 15 through 20 vary the relative effectiveness of antiviral medications and the
impact of different stockpiles. • Scenarios 21 through 32 assess the impact of combination strategies consisting of pre-
pandemic vaccine, antiviral stockpile, and strain-specific vaccine. • Scenarios 33 through 44 assess the sensitivity analysis with respect to student dismissals
and workplace closures. • Scenarios 45 through 48 vary the relative effectiveness of social distancing measures. • Scenarios 49 through 53 assess the impact of different levels of fear-based home
isolation. • Scenarios 54 through 56 analyze the impact of different levels of household quarantine. • Scenarios 57 through 59 assess the impact of student dismissal and antiviral medication. • Scenarios 60 through 69 assess the impact of time delays in starting anticipated
nonpharmaceutical interventions, levels of student dismissal, and amounts of fear-based home isolation combined with antiviral medication and a strain-specific vaccine.
• Scenarios 70 through 78 assess the sensitivity to vaccine production, availability, and dose requirements.
• Scenario 79 assesses the impact of combined nonpharmaceutical interventions such as student dismissal, fear-based home isolation, and social distancing.
• Scenarios 80 through 82 analyze the impact of antiviral treatment and prophylaxis combined with nonpharmaceutical interventions.
The clinical attack rates for each of the 82 scenarios are shown in Figure 6-3. The Baseline scenario was designed to yield a clinical attack rate of 30.6 percent, which matches the Department of Health and Human Services’ planning assumption. There are 10 intervention scenarios that yielded a clinical attack rate of less than 1.2 percent and 15 scenarios that yielded a clinical attack rate between 11.4 and 19.6 percent. All of the other scenarios yielded a rate between 20.4 and 50 percent. Most of the scenarios that resulted in a clinical attack rate of less than 1.2 percent combine treatment and prophylaxis using antiviral medication and some form of permanent nonpharmaceutical intervention. One of the 10 scenarios that resulted in an attack rate of less than 1.2 percent, scenario 78, suggested that a pandemic could be halted by the use of
FOR OFFICIAL USE ONLY 73

FOR OFFICIAL USE ONLY
only pharmaceutical interventions. However, this approach would require antiviral medication and a very large, highly effective vaccine stockpile of 75 million courses each week, with an effectiveness of 80 percent. All these scenarios assume very timely and rapid identification of new influenza cases, which in reality may not be feasible.
Figure 6-3. Clinical attack rate for each of the 82 intervention effectiveness scenarios
6.2.2 Observations The EpiSimS simulation observations are as follows:
• Combined mitigation strategies can buy time until a strain-specific vaccine is available. • The only mitigation strategies that delay the pandemic peak by more than 150 days (the
time required to develop a vaccine using current development methods) are those that include dismissing 100 percent of students before 0.1 percent of the population becomes infected. Student dismissal alone is not effective.
• The combination of pharmaceutical and nonpharmaceutical interventions can greatly decrease the impact of a pandemic and delay the outbreak. However, nonpharmaceutical
FOR OFFICIAL USE ONLY 74
FOR OFFICIAL USE ONLY
interventions must remain in effect for the duration of the pandemic to avoid generating waves of infections.
• There are strategies that do not require dismissing 100 percent of students but still reduce the clinical attack rate below 2 percent. However, these strategies require high levels of prolonged social distancing (50 percent reduction in contacts) or a plentiful supply of highly effective antivirals and strain-specific vaccine in order to provide doses for nearly all of the population.
• A combination of nonpharmaceutical and pharmaceutical interventions can be used to balance the human health and economic impacts of the epidemic. Both interventions reduce morbidity and mortality, but nonpharmaceutical interventions increase worker absenteeism while pharmaceutical interventions limit worker absenteeism.
• Implementing interventions in a timely manner is crucial. The epidemic is highly sensitive to a delay in starting interventions. Early identification and reporting of influenza cases can lead to rapid interventions. Effective notification of the general public is very important in limiting the size and length of a pandemic.
• Earlier and faster production of a pandemic influenza vaccine can control the pandemic. If a vaccine can be produced 4 months earlier than expected (based on egg-based seasonal influenza vaccine production) and at a production rate sufficient to vaccinate 95 percent of the population within a 1-month period, the pandemic can be held well below seasonal influenza levels.
• A pre-pandemic vaccine, developed prior to the potential pandemic on the basis of avian strains, will not be well-matched to the pandemic strain and will have a minimal impact on reducing the number of cases. Therefore, increasing vaccine effectiveness and production should be a high priority.
• The availability of an antiviral stockpile is crucial. One of the most important parameters identified is the number of courses of antiviral medications in the stockpile. Antiviral usage can, by itself, delay the pandemic. Combining any other response strategy with a high antiviral stockpile will improve the outcome. An effective monitoring system and a good distribution network are crucial for this mitigation strategy to work.
• Other factors that are not crucial to intervention effectiveness: − Random vaccination versus vaccination targeted at the elderly and children. Random
vaccination may be somewhat more effective than traditional, seasonal flu-targeted vaccination in reducing the peak of the pandemic, although this strategy may prolong the outbreak.
− A 1-dose vaccine and a 2-dose vaccine result in similar outcomes. A vaccine for a completely new influenza strain may require 2 doses to provide 80 percent effectiveness. The simulation results indicate if twice as many people are vaccinated with 30 percent effectiveness, which is possible with a single dose approach, the mortality rate is slightly lower than when half as many people receive the 2-dose treatment.
FOR OFFICIAL USE ONLY 75
FOR OFFICIAL USE ONLY
6.3 Robustness Evaluation 6.3.1 Approach NISAC used Loki-Infect,36, 37 a community-scale infectious disease model, to represent an explicit, multiple-overlapping network of social contacts within a stylized community of 10,000 individuals. This analysis compared and evaluated the likely effectiveness and costs of mitigation strategy combinations. In the analysis, NISAC used a baseline to provide a reference behavior around which model parameter values were bounded and considered a core matrix of 1,792 scenarios. These scenarios encompass and bound possible system behavior for influenza infectivity ranging from infectivity similar to that of the 1918 pandemic to twice that of the 1918 pandemic. NISAC created the scenarios from a matrix of 64 community containment strategy combinations, with assumed compliance ranging from good to very good and assumed regional policy implementation ranging from full to none. NISAC then considered a series of perturbations to this core scenario matrix that encompassed influenza manifestations most representative of normal flu38 to manifestations least representative of normal flu;39 implementation thresholds for mitigation activity from restrictive to lax; diagnosed cases within the community at day 10, 30, and 100; administration of pre-pandemic vaccine at proposed levels from uniform to age-class targeted; and social contact networks from most representative, emphasizing transmission within the young, to least representative, showing uniform transmission among both young and adults. With this final series of perturbations, the number of simulations increased to 86,016. To capture the variability that is expected from community to community as a result of how the community is structured and how the disease enters each community, the team created 100 versions of the community for each of these scenario perturbations, resulting in a total of 8,601,600 simulations. 6.3.2 Observations Several observations can be made on the robustness of the interventions in this model. Assuming that infectivity is at the 1918 level and that antivirals reduce infections by 60 percent, strategies can be found that reduce the illness rate to below 5 percent of the population, the infected attack rate to 10 percent of the population, and the death rate to nearly zero. This can be done while
36 R.J. Glass, L.M. Glass, W.E. Beyeler, Local Mitigation Strategies for Pandemic Influenza, SAND2005-7955J,
prepared for the Department of Homeland Security under the National Infrastructure Simulation and Analysis Center (2005).
37 R.J. Glass, L.M. Glass, W.E. Beyeler, H.J. Min, “Design of Targeted Social Distancing Strategies for Pandemic Influenza,” Emerging Infectious Diseases 12, No. 11 (2006) <www.cdc.gov/eid>.
38 N.M. Ferguson, D.A.T. Cummings, C. Fraser, J.C. Cajka, P.C. Cooley, D.S. Burke, “Strategies for Mitigating an Influenza Pandemic,” Nature doi:10.1038/nature04795 (2006).
39 I.M. Longini, J.S. Koopman, A.S. Monto, J.P. Fox, “Estimating Household and Community Transmission Parameters for Influenza,” Am. J Epidemiol. 115, pg. 736-751 (1982).
FOR OFFICIAL USE ONLY 76

FOR OFFICIAL USE ONLY
also keeping to the constraints of the current U.S. stockpile and limiting the absenteeism cost to fewer than 7 days. The best strategy combination is to dismiss students; to implement social distancing at 90 percent compliance for all children, teenagers, and adults (excluding those in the home); to reduce the contacts at work by 50 percent; and to implement household-based antiviral prophylaxis. This combination withstands changes in the social contact network that remove enhanced transmission by children and teenagers and applies to a range of disease manifestation characteristics that are consistent with modeling studies found in the literature. Strategy effectiveness depends on rapid implementation; on effective antiviral courses for 4 percent of the population; and on a high degree of public compliance with social distancing measures, antiviral treatment of affected persons, and antiviral prophylaxis distributed by the Public Health and Healthcare Sector. The most important component of effective community containment is a high compliance rate with mandatory social distancing measures, including student dismissal and workplace distancing. For infectivity similar to that of the 1918 pandemic, administering antiviral prophylaxis alone does not stop the spread of disease, but it does reduce the amount of absenteeism when used in conjunction with other mitigations. High compliance with social distancing measures is still necessary to contain the pandemic in this model. While dismissing students imposes the largest cost in the number of days that adults are at home, containment strategies that dismiss students and that implement social distancing of children and teens are very effective when layered with home antiviral prophylaxis. Implementing social distancing for adults and seniors, including a 50 percent reduction in contact at work, can minimize adult days at home to an average of 6 days per adult. Simulations that embed a community within a region that is doing nothing to abate the epidemic, allowing full contact through the workplace, show the importance of implementing regional community containment strategies. Without such regional policy, the best community containment strategy is full social distancing layered with household antiviral prophylaxis at a 90 percent compliance rate, which reduces infectious attack rates below 10 percent but requires antiviral doses for 9 percent of the population. However, this option exceeds the current stockpile and doubles the number of days that adults are at home. Therefore, an uncoordinated community policy could be very costly. A uniform policy for community containment provides more effective pandemic mitigation action. Administering pre-pandemic vaccinations at current levels, 7 percent coverage and 50 percent efficacy, does not significantly influence the influenza spread, even when children and teens are targeted. If effective community containment strategies are implemented, the entire community can be protected until sufficient strain-specific vaccine is produced. Pre-pandemic vaccine, at the current levels and efficacy, could then be used primarily to assure that critical infrastructures continue to function during the pandemic, thus providing essential services for a broader spectrum of the population.
FOR OFFICIAL USE ONLY 77

FOR OFFICIAL USE ONLY
6.4 Feasibility of Intervention Strategies In Phase 2, NISAC also evaluated the feasibility of some intervention strategies by assessing the current Federal plan for vaccine and antiviral preparedness, the mitigation potential of dismissing students, and potential social distancing measures. 6.4.1 Vaccine and Antiviral Preparedness The current Federal pandemic influenza plan for vaccine and antiviral preparedness40 calls for sufficient vaccine to vaccinate the entire U.S. population within 6 months of the emergence of a virus with pandemic potential; antiviral treatment for those who are infected; and a national stockpile consisting of 40 million doses of vaccine for influenza virus subtypes considered a substantial pandemic risk (currently avian H5N1) and 81 million treatment courses of antiviral drugs, enough for approximately 25 percent of U.S. population with 6 million doses in reserve for containment. When the vaccine matches the strain and the recipients are healthy adults, the vaccine is 70 to 90 percent effective.41 However, production capacity limits the feasibility of vaccination-based intervention. Federal planning goals require the manufacturing capacity to produce 100 million doses per year in order to develop and maintain the stockpile, plus an additional capacity to produce 600 million doses of strain-specific vaccine within 6 months of the emergence of a pandemic virus. Existing manufacturing capacity is insufficient and is unlikely to be increased without advances in technology. Using the H5N1 virus as an example, egg-based vaccine production capacity would have to be 16 times the current capacity in order to produce the required quantity of the vaccine. The current stockpile of H5N1 vaccine is 3 million courses, with a projected 40 million courses by the end of 2009.42 Existing manufacturing capacity is not sufficient to develop and maintain a larger stockpile for H5N1 because vaccines have a limited shelf life. If a pandemic strain other than H5N1 emerges, there will be an even smaller stockpile of strain-specific vaccine because the vaccine stockpile for that particular strain may not have been developed. 6.4.2 Student Dismissal Student dismissal is an important component in community containment and social distancing strategies. Simulations suggest that high levels of compliance are needed soon after influenza is
40 G.W. Parker, “Pandemic Influenza Preparedness: Update on the Development and Acquisition of Medical
Countermeasures,” (2007) <http://www.hhs.gov/asl/testify/t070124b.html>.
41 Centers for Disease Control, “Questions and Answers: Flu Shot,” <http://www.cdc.gov/flu/about/qa/flushot.htm>.
42 A. S. Fauci, “Pandemic Influenza: The Road to Preparedness,” United States Department of Health and Human Services (2006), <http://www.hhs.gov/asl/testify/t060302a.html>.
FOR OFFICIAL USE ONLY 78

FOR OFFICIAL USE ONLY
identified in a community, before 0.1 percent of the population becomes infected. The feasibility of this measure depends on several factors: the ability of the healthcare system to diagnose and report influenza, the ability to trigger dismissals in timely manner, and the willingness of public and private institutions to implement the dismissals. In the baseline simulations, the dismissal threshold is reached in the first 30 to 33 days. With greater transmission rates, the threshold can be reached in less than 10 days. The results of this study did not indicate if the current system, which involves individual doctors and hospitals diagnosing and reporting to state-level health departments and CDC, will trigger actions quickly enough. In addition, schools are managed at local school board level with state and Federal oversight. It will require careful planning at all levels across the country to achieve 100 percent compliance. 6.4.3 Social Distancing Simulations indicate that social distancing can be a very effective mitigation strategy if distancing measures are sufficient to provide a significant reduction (approximately 50 percent) in disease transmission without disrupting business operations. Potential social distancing measures include improving hygiene, wearing masks, decreasing physical contacts, and increasing physical separation between individuals in all settings. It is not possible to determine the effectiveness of specific combinations of social distancing measures in this modeling framework. 6.5 Trade-Off Analysis NISAC results from the uncertainty analysis scenarios are used as the basis for modeling the relative trade-offs of each intervention strategy. This analytic approach has historically been used as an aid to decision making under conditions of uncertainty. In this decision model, disparate consequences are put on an equivalent basis through the use of a value structure that defines consequences that have equivalent influence on the decision. Four high-level factors are considered: (1) the costs of the intervention strategy, including the costs of preparation, stockpiling, and implementation in the event of a pandemic; (2) the economic costs, including lost GDP and the cost of pandemic-related healthcare and emergency services; (3) the number of influenza illnesses; and (4) the number of influenza-related fatalities. Table 6-3 specifies the value structure, or indifference equivalencies, used to evaluate the consequences resulting from the 24 mitigation strategies. An indifference equivalence is the relationship between 2 metrics that both have the same influence on the decision. For this analysis, a $5 million increase in economic costs has the same influence as 1 additional influenza-related fatality. One additional case of illness is equivalent to an increase of $10,000 in economic costs or an additional $10,000 to adopt and implement an intervention strategy. The indifference equivalency ascribed to influenza-related fatalities, $5 million, is consistent with the value structures used in a majority of historical Federal policy studies concerning safety measures, environmental health impacts, and medical interventions, which generally adopt values ranging from $5 to $6.5 million. An OSHA regulation, which limited exposure to methylene chloride, noted a per-life savings of $12.7 million. When considering the value of an
FOR OFFICIAL USE ONLY 79
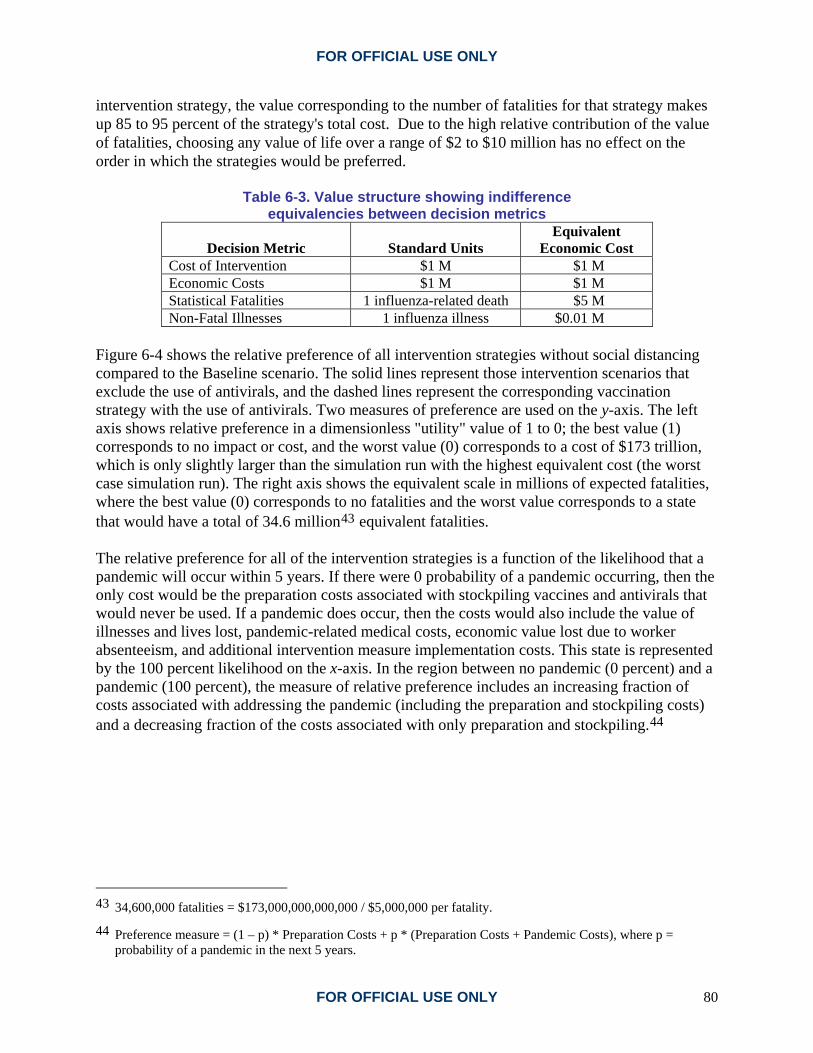
FOR OFFICIAL USE ONLY
intervention strategy, the value corresponding to the number of fatalities for that strategy makes up 85 to 95 percent of the strategy's total cost. Due to the high relative contribution of the value of fatalities, choosing any value of life over a range of $2 to $10 million has no effect on the order in which the strategies would be preferred.
Table 6-3. Value structure showing indifference equivalencies between decision metrics
Decision Metric Standard Units Equivalent
Economic Cost Cost of Intervention $1 M $1 M Economic Costs $1 M $1 M Statistical Fatalities 1 influenza-related death $5 M Non-Fatal Illnesses 1 influenza illness $0.01 M
Figure 6-4 shows the relative preference of all intervention strategies without social distancing compared to the Baseline scenario. The solid lines represent those intervention scenarios that exclude the use of antivirals, and the dashed lines represent the corresponding vaccination strategy with the use of antivirals. Two measures of preference are used on the y-axis. The left axis shows relative preference in a dimensionless "utility" value of 1 to 0; the best value (1) corresponds to no impact or cost, and the worst value (0) corresponds to a cost of $173 trillion, which is only slightly larger than the simulation run with the highest equivalent cost (the worst case simulation run). The right axis shows the equivalent scale in millions of expected fatalities, where the best value (0) corresponds to no fatalities and the worst value corresponds to a state that would have a total of 34.6 million43 equivalent fatalities. The relative preference for all of the intervention strategies is a function of the likelihood that a pandemic will occur within 5 years. If there were 0 probability of a pandemic occurring, then the only cost would be the preparation costs associated with stockpiling vaccines and antivirals that would never be used. If a pandemic does occur, then the costs would also include the value of illnesses and lives lost, pandemic-related medical costs, economic value lost due to worker absenteeism, and additional intervention measure implementation costs. This state is represented by the 100 percent likelihood on the x-axis. In the region between no pandemic (0 percent) and a pandemic (100 percent), the measure of relative preference includes an increasing fraction of costs associated with addressing the pandemic (including the preparation and stockpiling costs) and a decreasing fraction of the costs associated with only preparation and stockpiling.44
43 34,600,000 fatalities = $173,000,000,000,000 / $5,000,000 per fatality.
44 Preference measure = (1 – p) * Preparation Costs + p * (Preparation Costs + Pandemic Costs), where p = probability of a pandemic in the next 5 years.
FOR OFFICIAL USE ONLY 80

FOR OFFICIAL USE ONLY
No Social Distancing
0.80
0.81
0.82
0.83
0.84
0.85
0.86
0.87
0.88
0.89
0.90
0.91
0.92
0.93
0.94
0.95
0.96
0.97
0.98
0.99
1.00
0% 10% 20% 30% 40% 50% 60% 70% 80% 90% 100%
Likelihood of Influenze Pandemic Within Five Years
Rel
ativ
e Pr
efer
ence
0.00
0.35
0.69
1.04
1.38
1.73
2.08
2.42
2.77
3.11
3.46
3.81
4.15
4.50
4.84
5.19
5.54
5.88
6.23
6.57
6.92
Equivalent Expected Fatalities (Millions)
noSDnoAV1noSDnoAV2noSDnoAV3noSDnoAV4noSDnoAV5noSDnoAV6noSDAV1noSDAV2noSDAV3noSDAV4noSDAV5noSDAV6
Scenario Settings: noSDnoAV No Social Distancing, No Antivirals noSDAV No Social Distancing, Antivirals SDnoAV Social Distancing, No Antivirals SDAV Social Distancing and Antivirals
Vaccination Strategies: 1 No vaccination or contact tracing 2 Contact tracing without vaccination 3 Mass vaccination only with strain-specific vaccine 4 Mass vaccination with early vaccine 5 Targeted followed by mass vaccination with early vaccine 6 Targeted vaccination with early vaccine
Figure 6-4. Relative preference of intervention strategies over the
likelihood of a pandemic influenza for a risk-neutral decision maker (excludes social distancing scenarios)
The costs for stockpiling vaccines and antivirals were calculated over a 5-year period. This includes the costs of stockpile maintenance and replacement of expired doses for the 5 years. Because these costs are very small compared to economic losses and the equivalent cost of illnesses and fatalities, the results shown in Figure 6-4 are also indicative of much longer time horizons. Of the intervention strategies shown, the least preferred would be the Baseline, or no intervention scenario (noSDnoAV1), because it has the lowest relative preference and highest equivalent fatality measure over the likelihood range. All of the other strategies would be preferred over the Baseline scenario by the vertical difference displayed between that strategy and the Baseline at a given likelihood. Likewise, any strategy with a higher utility value, or lower equivalent fatality value, would be preferred over another strategy with a lower utility value, or higher equivalent fatality value. The vertical difference between the two strategies is equal to the difference in relative preference. For example, if a pandemic strikes (100 percent on the x-axis) and if a strategy of mass vaccination with a partially effective vaccine (noSDnoAV4) is chosen over no intervention (noSDnoAV1), the total impacts including costs, illnesses, and deaths will reduced by the equivalent of 2.8 million fatalities (6.7 million minus 3.9 million). When antivirals are used (noSDAV4), the expected benefit is equivalent to nearly 3.2 million fatalities (6.7 minus 3.5
FOR OFFICIAL USE ONLY 81

FOR OFFICIAL USE ONLY
million). In other words, the addition of antivirals reduces health and economic impacts equivalent to another 400,000 lives (Table 6-4).
Table 6-4. Order of multiattribute preference for vaccination strategies absent social distancing, showing incremental
equivalent cost for successively less-preferred alternatives Incremental Additional
Equivalent Fatalities (thousands) Vaccination
Strategy Vaccination Strategy Description noAV AV 4 Mass vaccination with early vaccine Best Best 5 Targeted followed by mass vaccination with early vaccine 326 357 6 Targeted vaccination with early vaccine 324 346 2 Contact tracing without vaccination 136 307 3 Mass vaccination only with no early vaccine 1,475 1,197 1 No vaccination or contact tracing 477 497
Figure 6-5 shows the relative preference for the intervention strategies that include social distancing both with and without the use of antivirals. These strategies are displayed on the same axis scales as Figure 6-4 for ease of comparison. Overall, as a group, those strategies that include social distancing show a 50 to 70 percent reduction in the impacts of a pandemic over strategies without social distancing. Unfortunately, it was not possible to model individual social distancing policies as part of this uncertainty analysis, so little additional commentary can be made with respect to the effectiveness of specific social distancing policies. It is clear, however, that extensive and effective social distancing, particularly in the early stages of a pandemic, can have a significant impact on disease progression. Table 6-5 shows a preference ordering of vaccination strategies both with and without the use of antivirals when social distancing is included. The preference order is similar to the ordering without social distancing, except that antiviral use reverses the preference order of strategies 3 and 6. However, this reversal is not significant because the difference in benefits between these scenarios is very small: only 43,000 and 9,000 equivalent fatalities for no antivirals and antivirals, respectively. Because of uncertainty, the choice of an intervention strategy, even the optimally preferred choice, can have some chance of resulting in greater losses than a less-preferred intervention strategy if a pandemic does occur.
FOR OFFICIAL USE ONLY 82

FOR OFFICIAL USE ONLY
Relative Preference of PI Intervention MeasuresWith Social Distancing
0.80
0.81
0.82
0.83
0.84
0.85
0.86
0.87
0.88
0.89
0.90
0.91
0.92
0.93
0.94
0.95
0.96
0.97
0.98
0.99
1.00
0% 10% 20% 30% 40% 50% 60% 70% 80% 90% 100%
Likelihood of Influenze Pandemic Within Five Years
Rel
ativ
e Pr
efer
ence
0.00
0.35
0.69
1.04
1.38
1.73
2.08
2.42
2.77
3.11
3.46
3.81
4.15
4.50
4.84
5.19
5.54
5.88
6.23
6.57
6.92
Equivalent Expected Fatalities (Millions)
SDnoAV1SDnoAV2SDnoAV3SDnoAV4SDnoAV5SDnoAV6SDAV1SDAV2SDAV3SDAV4SDAV5SDAV6
Scenario Settings: noSDnoAV No Social Distancing, No Antivirals noSDAV No Social Distancing, Antivirals SDnoAV Social Distancing, No Antivirals SDAV Social Distancing and Antivirals
Vaccination Strategies: 1 No vaccination or contact tracing 2 Contact tracing without vaccination 3 Mass vaccination only with strain-specific vaccine 4 Mass vaccination with pre-pandemic vaccine 5 Targeted followed by mass vaccination with pre-pandemic vaccine 6 Targeted vaccination with pre-pandemic vaccine
Figure 6-5. Relative preference of intervention strategies over the
likelihood of a pandemic for a risk-neutral decision maker (social distancing scenarios)
Table 6-5. Order of trade-off preference for vaccination strategies with social distancing included, showing incremental equivalent
cost for successively less-preferred alternatives Incremental Additional
Equivalent Fatalities (thousands) Vaccination
Strategy Vaccination Strategy Description noAV AV 4 Mass vaccination with early vaccine Best Best 5 Targeted followed by mass vaccination with early vaccine 250 297 6 Targeted vaccination with early vaccine 394
3 (AV) Mass vaccination only with no early vaccine 364 3 Mass vaccination only with no early vaccine 43
6 (AV) Targeted vaccination with early vaccine 9 2 Contact tracing without vaccination 135 209 1 No vaccination or contact tracing 354 259
FOR OFFICIAL USE ONLY 83
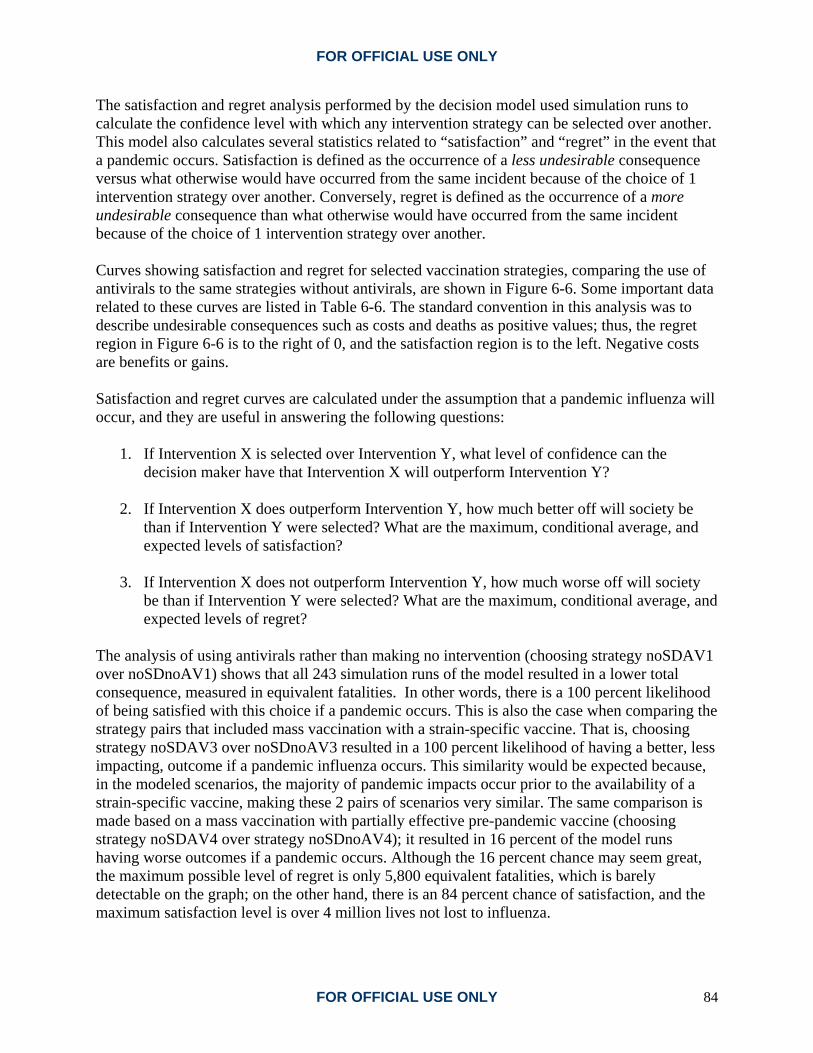
FOR OFFICIAL USE ONLY
The satisfaction and regret analysis performed by the decision model used simulation runs to calculate the confidence level with which any intervention strategy can be selected over another. This model also calculates several statistics related to “satisfaction” and “regret” in the event that a pandemic occurs. Satisfaction is defined as the occurrence of a less undesirable consequence versus what otherwise would have occurred from the same incident because of the choice of 1 intervention strategy over another. Conversely, regret is defined as the occurrence of a more undesirable consequence than what otherwise would have occurred from the same incident because of the choice of 1 intervention strategy over another. Curves showing satisfaction and regret for selected vaccination strategies, comparing the use of antivirals to the same strategies without antivirals, are shown in Figure 6-6. Some important data related to these curves are listed in Table 6-6. The standard convention in this analysis was to describe undesirable consequences such as costs and deaths as positive values; thus, the regret region in Figure 6-6 is to the right of 0, and the satisfaction region is to the left. Negative costs are benefits or gains. Satisfaction and regret curves are calculated under the assumption that a pandemic influenza will occur, and they are useful in answering the following questions:
1. If Intervention X is selected over Intervention Y, what level of confidence can the decision maker have that Intervention X will outperform Intervention Y?
2. If Intervention X does outperform Intervention Y, how much better off will society be
than if Intervention Y were selected? What are the maximum, conditional average, and expected levels of satisfaction?
3. If Intervention X does not outperform Intervention Y, how much worse off will society
be than if Intervention Y were selected? What are the maximum, conditional average, and expected levels of regret?
The analysis of using antivirals rather than making no intervention (choosing strategy noSDAV1 over noSDnoAV1) shows that all 243 simulation runs of the model resulted in a lower total consequence, measured in equivalent fatalities. In other words, there is a 100 percent likelihood of being satisfied with this choice if a pandemic occurs. This is also the case when comparing the strategy pairs that included mass vaccination with a strain-specific vaccine. That is, choosing strategy noSDAV3 over noSDnoAV3 resulted in a 100 percent likelihood of having a better, less impacting, outcome if a pandemic influenza occurs. This similarity would be expected because, in the modeled scenarios, the majority of pandemic impacts occur prior to the availability of a strain-specific vaccine, making these 2 pairs of scenarios very similar. The same comparison is made based on a mass vaccination with partially effective pre-pandemic vaccine (choosing strategy noSDAV4 over strategy noSDnoAV4); it resulted in 16 percent of the model runs having worse outcomes if a pandemic occurs. Although the 16 percent chance may seem great, the maximum possible level of regret is only 5,800 equivalent fatalities, which is barely detectable on the graph; on the other hand, there is an 84 percent chance of satisfaction, and the maximum satisfaction level is over 4 million lives not lost to influenza.
FOR OFFICIAL USE ONLY 84

FOR OFFICIAL USE ONLY
0.00
0.10
0.20
0.30
0.40
0.50
0.60
0.70
0.80
0.90
1.00
-4,000 -3,500 -3,000 -2,500 -2,000 -1,500 -1,000 -500 0 500
Equivalent Fatalities (Thousands)
Cum
ulat
ive
Prob
abili
tynoSDAV1 over noSDnoAV1 noSDAV3 over noSDnoAV3 noSDAV4 over noSDnoAV4
SatisfactionRegion
RegretRegion
Choice of noSDAV1 over noSDnoAV1
Choice of noSDAV3 over noSDnoAV3
Choice of noSDAV4 over noSDnoAV4
Figure 6-6. Satisfaction/regret analysis for selected pairs
of intervention strategies not involving quarantine
Table 6-6. Satisfaction and regret statistics for selected pairs of intervention strategies not involving quarantine
(satisfaction and regret are presented as equivalent fatalities) More-Preferred Selected over Less-Preferred Intervention
Satisfaction / Regret
noSDAV1 Selected
over noSDnoAV1
noSDAV3 Selected
over noSDnoAV3
noSDAV4 Selected
over noSDnoAV4
Likelihood of satisfaction 100% 100% 84% Maximum possible satisfaction 2,905 4,133 4,161 Average conditional satisfaction 511 541 448 Expected satisfaction 511 541 378 Likelihood of regret 0% 0% 16% Maximum possible regret 0 0 6 Average conditional regret 2 Expected regret 0.3 Expected overall satisfaction 511 541 377
FOR OFFICIAL USE ONLY 85

FOR OFFICIAL USE ONLY
This page intentionally blank.
FOR OFFICIAL USE ONLY 86

FOR OFFICIAL USE ONLY
7. Conclusions Predicting the impacts of an influenza pandemic on the U.S. population and economy and understanding the effectiveness of alternative mitigation strategies depends on a large number of factors. The factors include the virulence and transmissibility of the disease, the effects the disease might have on different age groups, community and CI/KR workforce demographics, individual behavioral responses, and the capacity of the Public Health and Healthcare Sector to provide adequate medical care for those stricken by the disease. NISAC modeled and analyzed numerous individual and combined mitigation strategies. The models account for the uncertainties in disease epidemiology, social behavioral response, mitigation measure effectiveness, and CI/KR resiliency to influenza-induced workforce absenteeism. 7.1 Population Epidemiology The best solution, because it avoids the significant loss of life and GDP, is an effective vaccine. New vaccine development and production technology is important. If a strain-specific vaccine can be produced in half the time expected with conventional technology (currently 4 to 6 months) and produced at a rate sufficient to vaccinate 95 percent of the population within a 1-month period, pandemic influenza illnesses could be held to levels similar to or below seasonal influenza levels. Pre-pandemic vaccines are typically not well-matched to the pandemic strain and will be less effective than strain-specific vaccines. Increasing vaccine effectiveness and production capacity should be a high priority. Recommendations
• Develop an effective monitoring system to detect infections • Promote development of new vaccine technology • Develop an effective medical supply distribution network • Conduct pre-pandemic mass vaccination followed by strain-specific mass vaccination • Use new vaccine in combination with other mitigation strategies
Multiple mitigations are required for success (for example: antivirals alone are ineffective; social distancing alone is ineffective; pre-pandemic vaccination alone is ineffective; and so forth). The time at which the death rate peaks could vary by 1 to 2 months, depending on which mitigation strategy is implemented. To reduce deaths, illnesses, and absenteeism, a strategy is needed that delays and minimizes the pandemic outbreak until there is sufficient production and distribution of highly effective vaccines and antiviral drugs. Recommendations
• Plan for and exercise multi-mitigation interventions • Implement household-based interventions, student dismissal, and social distancing
measures as early as possible and maintain all three until a strain-specific vaccine can be developed
FOR OFFICIAL USE ONLY 87
FOR OFFICIAL USE ONLY
Vaccine for a pandemic influenza strain may require 2 doses to provide 80 percent effectiveness. However, NISAC simulation results indicate that if twice as many people are vaccinated with 30 percent effectiveness, which is possible with a single dose approach, the mortality rate is slightly lower than when half as many people receive the 2-dose treatment. The availability of an antiviral stockpile is crucial. One of the most important parameters identified is the number of antiviral doses in the stockpile for treatment and prophylaxis. Antiviral usage by itself can delay the pandemic but only with efficient detection of symptomatic cases and huge stockpiles. The current Department of Health and Human Services planned antiviral stockpile is insufficient to delay a pandemic long enough for an effective vaccine to be developed. Combining any other mitigation strategy with prophylaxis antiviral use will reduce illness and fatality rates. Recommendations
• Produce and stockpile antivirals • Develop faster antiviral production • Develop an effective distribution network
The only mitigation strategies that delay the pandemic peak by more than 4 to 6 months, which is the estimated time required to develop a strain-specific vaccine using current technology, are those that include dismissing 100 percent of students before 0.1 percent of the population develops symptoms. Student dismissal alone is not effective; it is a necessary, but not sufficient, mitigation. Recommendations
• Dismiss students before 0.1 percent of population becomes infected • Dismiss students until a vaccine is available • Plan for concerns related to hourly wageworkers when students are dismissed
A combination of nonpharmaceutical and pharmaceutical mitigation strategies can be used to balance the human health and economic impacts of the epidemic. Both strategies reduce morbidity and mortality. Nonpharmaceutical strategies increase worker absenteeism and correspondingly increase losses to the U.S. economy; pharmaceutical strategies reduce worker absenteeism. The effectiveness of all mitigation strategies is highly sensitive to when those strategies are initiated. Recommendations
• Ensure early identification and reporting of influenza cases to support rapid implementation of mitigation strategies
• Measure sensitive parameters, such as vaccine effectiveness, as early as possible to manage expectations and response
• Educate the population to help limit uncontrolled fear-based absenteeism • Balance healthcare costs versus absenteeism costs
Certain segments of the U.S. population, including households below the poverty line, large households, and less educated households will experience a higher than average impact during a
FOR OFFICIAL USE ONLY 88

FOR OFFICIAL USE ONLY
pandemic influenza. There will be a high fraction of sick and dead among uninsured and underinsured families. Recommendations
• Plan mitigation strategies to limit the impacts on these households, including increasing access to medical care and disease prevention education
• Preposition supplies appropriately; impacts are not geographically uniform Workforce Voluntary absenteeism is likely to be higher than medical absenteeism. Some states may be affected by absenteeism rates at 25 percent or greater than those of other states due to demographic differences in their populations. The infrastructures in those states with the greater absenteeism rates may experience a corresponding infrastructure impact. Facilities in some counties will have higher absenteeism. The most impacted assets and counties vary by scenario. To maintain operational continuity, planning at the facility should begin well in advance of a pandemic. The Emergency Services and Public Health and Healthcare Sectors CI/KR have the greatest percentage of “critical” workers while simultaneously being most important to the Nation’s ability to respond to a pandemic. The workers in these subsectors are also in a harder-hit demographic group on average. Recommendations
• Plan well in advance at the facility level • Be aware of training and licensing requirements for critical workers • Consider safety and logistical limitations when planning for pandemic • Educate workers on the nature of a pandemic influenza • Train workers in facility-level response
7.2 Infrastructure Under all tested scenarios, NISAC’s analysis indicates that CI/KR across the Nation will continue to function, although several infrastructures may experience local to regional degradation of operations lasting only a few weeks. Potential mitigation strategies for all CI/KR sectors modeled include the following:
• Extend shifts and overtime for healthy workers • Postpone voluntary leave • Postpone nonessential activities including regularly scheduled maintenance projects • Substitute contract workers for absent regular workers • Cross-train employees, if possible • Liberalize telecommuting practices
FOR OFFICIAL USE ONLY 89
FOR OFFICIAL USE ONLY
Energy Workforce absenteeism related to a pandemic influenza is not expected to affect electric power supplies, although some generating plants may experience reduced workforce continuity at the peak of the pandemic. Natural gas supplies, even under the most severe epidemic scenario examined in the analysis, are not affected by workforce absenteeism. Water and Wastewater The greatest risk to the water and wastewater CI/KR during a pandemic influenza is the reduction of available operators and support personnel. Most water and wastewater facilities will experience peak workforce absenteeism at nearly the same rate, thus rendering mutual aid agreements between facilities mostly ineffective. Recommendations
• Cross-train staff and establish support contracts with local engineering firms to mitigate the risk presented by absenteeism
• Be prepared to issue water-boiling orders if chlorine supply is interrupted
Telecommunications and Information Technology Telecommunications systems are generally expected to function normally during a pandemic influenza. Occasional redialing may occur in some major metropolitan areas due to increased telecommuting, but call drops are not expected to exceed 14 percent of dialed calls. It is unlikely that mitigation strategies will need to be implemented in this CI/KR. Public Health and Healthcare The Public Health and Healthcare Sector will be overloaded. Geographic healthcare worker substitution may not be possible. Recommendations
• Design and implement staff cross-training and supplemental staffing plans • Assign a high priority to vaccinating EMTs
Based on average annual occupancy rates, hospitals will be overwhelmed in 8 to 10 weeks. With no government-directed mitigation strategy in place, the U.S. healthcare system will be at full capacity for 3 to 6 weeks. The patient overflow is expected to exceed 4 million people. The overflow will be most pronounced in Texas, California, Florida, and New York. A concurrent natural disaster would further increase overloading. An effective mitigation strategy can minimize healthcare impacts, but not completely. With no government-directed mitigation strategy, costs to existing U.S. healthcare facilities are expected to be $17 to $19 billion in aggregate. Total healthcare costs, including additional temporary facilities, could be up to $80 billion in the absence of a government-directed mitigation strategy. Government interventions, where feasible, can minimize the healthcare costs of a pandemic. Recommendations
• Plan for staffed temporary treatment facilities
FOR OFFICIAL USE ONLY 90

FOR OFFICIAL USE ONLY
Transportation Workforce absenteeism will affect the transport of people and freight. Loss of airfreight capacity is roughly linear with absenteeism levels. Moderate peak absenteeism levels (14 percent) and long durations of absenteeism (6 to 8 weeks) are sufficient to cause critical problems at most major rail yards, with even larger impacts at higher peak absenteeism levels (28 percent). Impacts at ports are strongly dependent on operation specifics, such as shared terminals. Recommendations
• Consider strong mitigation measures and/or encourage customers to make arrangements with other ports to avoid delays at Terminal 6 of the Port of Los Angeles
Agriculture and Food The Agriculture and Food Sector is resilient to labor shortages in a case with 10 percent absenteeism lasting 7 weeks or longer. Significant impacts occur at the 40 percent absenteeism level lasting for 3 weeks or longer (more than double the expected worst-case absenteeism). The potential impacts include shortages in many processed food industries because of the lack of sufficient excess capacity to offset production losses resulting from absenteeism; increased volatility in inventories and productivity throughout the food industry value chain as a result of the increased shipping distances and times; and increased volatility resulting in periodic short-term shortages followed by periodic overstocks throughout the system. Full food supplies were restored within 2 weeks of labor levels returning to normal. Recommendations
• Stockpile packaged and processed foods at locations up and down the value chain and across the country; distribute the stockpiles as the pandemic progresses to mitigate food shortages
• Leave borders open for the transportation of goods
Banking and Finance The magnitude of impacts to the Nation’s financial system infrastructure will be heavily dependent upon the adequacy of each individual firm’s business continuity planning. Businesses and infrastructures can limit the projected workforce impacts if each facility develops and implements a thorough business continuity plan; the plan should incorporate Federal government-recommended maximum absenteeism planning levels and address uncertainty in workforce response to a pandemic influenza. Recommendations
• Develop and exercise business continuity plans
FOR OFFICIAL USE ONLY 91

FOR OFFICIAL USE ONLY
7.3 Economic Impact Short-term economic impacts of a pandemic influenza are driven by a decrease in demand; long-term economic impacts are driven by the number of fatalities. The effects of the absenteeism-based supply shock are greatest in manufacturing, followed by finance and insurance, retail, wholesale, real estate, and construction. The effects of workforce absenteeism are strongest in manufacturing, followed by real estate and finance and insurance, reflecting the large numbers of employees in manufacturing and the labor intensity in the finance and insurance and real estate subsectors. Suboptimal mitigation strategies are not only less effective, they can cost significantly more to implement and can more adversely affect the economy. Recommendations
• Expect gross domestic product costs to be approximately $100 billion in the first year • Plan for additional healthcare costs of $2 to $80 billion, depending on mitigation strategy
effectiveness • Expect more than 90 percent of long-term impacts to result from the number of fatalities
7.4 Follow-on Analysis NISAC primarily studied pandemic influenza epidemiology and its impacts on population, healthcare, and economics. However, a result of the NISAC study was the elucidation of other areas that should be further analyzed to provide a more comprehensive and more certain understanding of the effects of a pandemic influenza. These studies could include the following:
• Analyze workforce substitution facility-level strategies including variables such as temporary workforce staffing, mutual aid agreements, and cross training
• Model the temporary healthcare facilities and workers necessary to survive a pandemic, including training requirements and optimal facility placement
• Model particular hot spots, major metropolitan areas, and local phenomena at high-resolution
• Analyze the sensitivity/uncertainty and impacts for other infrastructure sectors not examined in this study
• Model the impacts of cross-sector interdependencies, especially supply chains • Consider a pandemic twice as severe as the one done in this study. (The 1918 pandemic
saw localized mortality rates up to 15 times the national average. When assessing infrastructure impacts and doing local planning, it is reasonable to account for 90 percent of all likely outcomes by considering mortality rates double the 1918 rate.)
• Analyze potential medical stockpile (antivirals vaccines, respirators, etc.) and distribution plans to address efficacy, prioritization, and political issues
• Build realistic, comprehensive exercises • Determine an effective border management strategy that considers the different pandemic
initiation scenarios, the impacts of port-of-entry restrictions, the impacts of natural and forced reductions in business and tourism through border management, and options for realistically managing tradeoffs
FOR OFFICIAL USE ONLY 92

FOR OFFICIAL USE ONLY
• Analyze the likely spread of pandemic contagion, including across international borders by vectors other than human
• Devise education plans on prevention and treatment for home healthcare protocols • Model the effectiveness of facemasks and respirators in preventing the spread of the
disease • Determine conditions and modes under which a pandemic, seemingly under control,
might restart • Comprehensively assess worker criticality for continued operation of infrastructure under
workforce reduction • Develop new technologies for faster vaccine production • Recommend state, tribal, and local asset allocation policies • Recommend national level policies
FOR OFFICIAL USE ONLY 93

FOR OFFICIAL USE ONLY
This page intentionally blank.
FOR OFFICIAL USE ONLY 94


HomelandHomelandSecuritySecurity
National Population, Economic, and Infrastructure Impacts of Pandemic Influenza with Strategic RecommendationsPrepared by
National Infrastructure Simulation & Analysis CenterInfrastructure Analysis and Strategy DivisionOffi ce of Infrastructure ProtectionU.S. Department of Homeland Security
October 2007
For Offi cial Use Only (FOUO)
HomelandHomelandSecuritySecurity For Offi cial Use Only (FOUO)