Embed Size (px)
Citation preview
National Paediatric Hospital Project
Planning Application
Appendix 12.1 – Ambient Air Quality Standards
August 2015

9-1
Appendix 12.1: Ambient Air Quality Standards
National standards for ambient air pollutants in Ireland have generally ensued from Council Directives enacted in the EU (& previously the EC & EEC) (see Table 12.1 - 12.2). The initial interest in ambient air pollution legislation in the EU dates from the early 1980s and was in response to the most serious pollutant problems at that time which was the issue of acid rain. As a result of this sulphur dioxide, and later nitrogen dioxide, were both the focus of EU legislation. Linked to the acid rain problem was urban smog associated with fuel burning for space heating purposes. Also apparent at this time were the problems caused by leaded petrol and EU legislation was introduced to deal with this problem in the early 1980s.
In recent years the EU has focused on defining a basis strategy across the EU in relation to ambient air quality. In 1996, a Framework Directive, Council Directive 96/62/EC, on ambient air quality assessment and management was enacted. The aims of the Directive are fourfold. Firstly, the Directive’s aim is to establish objectives for ambient air quality designed to avoid harmful effects to health. Secondly, the Directive aims to assess ambient air quality on the basis of common methods and criteria throughout the EU. Additionally, it is aimed to make information on air quality available to the public via alert thresholds and fourthly, it aims to maintain air quality where it is good and improve it in other cases.
As part of these measures to improve air quality, the European Commission has adopted proposals for daughter legislation under Directive 96/62/EC. The first of these directives to be enacted, Council Directive 1999/30/EC, has been passed into Irish Law as S.I. No 271 of 2002 (Air Quality Standards Regulations 2002), and has set limit values which came into operation on 17th June 2002. Council Directive 1999/30/EC, as relating to limit values for sulphur dioxide, nitrogen dioxide, lead and particulate matter, is detailed in Table 12.1. The Air Quality Standards Regulations 2002 detail margins of tolerance, which are trigger levels for certain types of action in the period leading to the attainment date. The margin of tolerance varies from 60% for lead, to 30% for 24-hour limit value for PM10, 40% for the hourly and annual limit value for NO2 and 26% for hourly SO2 limit values. The margin of tolerance commenced from June 2002, and will start to reduce from 1 January 2003 and every 12 months thereafter by equal annual percentages to reach 0% by the attainment date. A second daughter directive, EU Council Directive 2000/69/EC, has published limit values for both carbon monoxide and benzene in ambient air as set out in Table 12.2. This has also been passed into Irish Law under the Air Quality Standards Regulations 2002.
The most recent EU Council Directive on ambient air quality was published on the 11/06/08 which has been transposed into Irish Law as S.I. 180 of 2011. Council Directive 2008/50/EC combines the previous Air Quality Framework Directive and its subsequent daughter directives. Provisions were also made for the inclusion of new ambient limit values relating to PM2.5. The margins of tolerance specific to each pollutant were also slightly adjusted from previous directives as outlined in Table 12.1. In regards to existing ambient air quality standards, it is not proposed to modify the standards but to strengthen existing provisions to ensure that non-compliances are removed. In addition, new ambient standards for PM2.5 are included in Directive 2008/50/EC. The approach for PM2.5 is to establish a target value of 25 µg/m3, as an annual average (to be attained everywhere by 2010) and a limit value of 25 µg/m3, as an annual average (to be attained everywhere by 2015), coupled with a target to reduce human exposure generally to PM2.5 between 2010 and 2020. This exposure reduction target will range from 0% (for PM2.5 concentrations of less than 8.5 µg/m3 to 20% of the average exposure indicator (AEI) for concentrations of between 18 - 22 µg/m3). Where the AEI is currently greater than 22 µg/m3 all appropriate measures should be employed to reduce this level to 18 µg/m3 by 2020. The AEI is based on measurements taken in urban background locations averaged over a three year period from 2008 - 2010 and again from 2018-2020. Additionally, an exposure concentration obligation of 20 µg/m3 has been set to be complied with by 2015 again based on the AEI.
Although the EU Air Quality Limit Values are the basis of legislation, other thresholds outlined by the EU Directives are used which are triggers for particular actions. The Alert Threshold is defined in Council Directive 96/62/EC as “a level beyond which there is a risk to human health from brief exposure and at which immediate steps shall be taken as laid down in Directive 96/62/EC”. These steps include undertaking to ensure that the necessary steps are taken to inform the public (e.g. by means of radio, television and the press).
The Margin of Tolerance is defined in Council Directive 96/62/EC as a concentration which is higher than the limit value when legislation comes into force. It decreases to meet the limit value by the attainment date. The Upper Assessment Threshold is defined in Council Directive 96/62/EC as a concentration above which high quality measurement is mandatory. Data from measurement may be supplemented by information from other sources, including air quality modelling.
An annual average limit for both NOX (NO and NO2) is applicable for the protection of vegetation in highly rural areas away from major sources of NOX such as large conurbations, factories and high road vehicle activity such as a dual carriageway or motorway. Annex VI of EU Directive 1999/30/EC identifies that monitoring to demonstrate compliance with the NOX limit for the protection of vegetation should be carried out distances greater than:
9-2
EIS National Paediatric Hospital Project – Chapter 12: Appendices
5 km from the nearest motorway or dual carriageway
5 km from the nearest major industrial installation
20 km from a major urban conurbation
As a guideline, a monitoring station should be indicative of approximately 1000 km2 of surrounding area.
Under the terms of EU Framework Directive on Ambient Air Quality (96/62/EC), geographical areas within member states have been classified in terms of zones. The zones have been defined in order to meet the criteria for air quality monitoring, assessment and management as described in the Framework Directive and Daughter Directives. Zone A is defined as Dublin and its environs, Zone B is defined as Cork City, Zone C is defined as 21 urban areas with a population greater than 15,000 and Zone D is defined as the remainder of the country. The Zones were defined based on among other things, population and existing ambient air quality.
EU Council Directive 96/62/EC on ambient air quality and assessment has been adopted into Irish Legislation (S.I. No. 33 of 1999). The act has designated the Environmental Protection Agency (EPA) as the competent authority responsible for the implementation of the Directive and for assessing ambient air quality in the State. Other commonly referenced ambient air quality standards include the World Health Organisation. The WHO guidelines differ from air quality standards in that they are primarily set to protect public health from the effects of air pollution. Air quality standards, however, are air quality guidelines recommended by governments, for which additional factors, such as socio-economic factors, may be considered.
Air Dispersion Modelling
The inputs to the DMRB model consist of information on road layouts, receptor locations, annual average daily traffic movements, annual average traffic speeds and background concentrations (UK DEFRA 2007). Using this input data the model predicts ambient ground level concentrations at the worst-case sensitive receptor using generic meteorological data.
The DMRB has recently undergone an extensive validation exercise (UK DEFRA 2009) as part of the UK’s Review and Assessment Process to designate areas as Air Quality Management Areas (AQMAs). The validation exercise was carried out at 12 monitoring sites within the UK DEFRAs national air quality monitoring network. The validation exercise was carried out for NOX, NO2 and PM10, and included urban background and kerbside/roadside locations, “open” and “confined” settings and a variety of geographical locations (UK DEFRA 2009).
In relation to NO2, the model generally over-predicts concentrations, with a greater degree of over-prediction at “open” site locations. The performance of the model with respect to NO2 mirrors that of NOx showing that the over-prediction is due to NOx calculations rather than the NOx:NO2 conversion. Within most urban situations, the model overestimates annual mean NO2 concentrations by between 0 to 40% at confined locations and by 20 to 60% at open locations. The performance is considered comparable with that of sophisticated dispersion models when applied to situations where specific local validation corrections have not been carried out.
The model also tends to over-predict PM10. Within most urban situations, the model will over-estimate annual mean PM10 concentrations by between 20 to 40%. The performance is comparable to more sophisticated models, which, if not validated locally, can be expected to predict concentrations within the range of 50%.
Thus, the validation exercise has confirmed that the model is a useful screening tool for the Second Stage Review and Assessment, for which a conservative approach is applicable (UK DEFRA 2009).
National Paediatric Hospital Project
Planning Application
Appendix 12.2 – Dust Minimisation Plan
August 2015

9-1
Appendix 12.2: Dust Minimisation Plan
A dust minimisation plan will be formulated for the construction phase of the project, as construction activities are likely to generate some dust emissions. This dust minimisation plan will form part of the construction management plan (CMP) for each of the developments associated with the proposed integrated National Paediatric Hospital Project. The potential for dust to be emitted depends on the type of construction activity being carried out in conjunction with environmental factors including levels of rainfall, wind speeds and wind direction. The potential for impact from dust depends on the distance to potentially sensitive locations and whether the wind can carry the dust to these locations. The majority of any dust produced will be deposited close to the potential source and any impacts from dust deposition will typically be within several hundred metres of the construction area.
In order to ensure that no dust nuisance occurs, a series of measures will be implemented. Site roads shall be regularly cleaned and maintained as appropriate. Hard surface roads shall be swept to remove mud and aggregate materials from their surface while any un-surfaced roads shall be restricted to essential site traffic only. Furthermore, any road that has the potential to give rise to fugitive dust must be regularly watered, as appropriate, during dry and/or windy conditions.
Vehicles using site roads shall have their speed restricted, and this speed restriction must be enforced rigidly. Indeed, on any un-surfaced site road, this shall be 20 km per hour, and on hard surfaced roads as site management dictates. Vehicles delivering material with dust potential shall be enclosed or covered with tarpaulin at all times to restrict the escape of dust.
All vehicles exiting the site shall make use of a wheel wash facility, preferably automatic, prior to entering onto public roads, to ensure mud and other wastes are not tracked onto public roads. Public roads outside the site shall be regularly inspected for cleanliness, and cleaned as necessary.
Material handling systems and site stockpiling of materials shall be designed and laid out to minimise exposure to wind. Water misting or sprays shall be used as required if particularly dusty activities are necessary during dry or windy periods.
Furthermore, during movement of the soil both on and off-site, trucks will be stringently covered with tarpaulin at all times. Before entrance onto public roads, trucks will be adequately inspected to ensure no potential for dust emissions.
At all times, the procedures put in place will be strictly monitored and assessed. In the event of dust nuisance occurring outside the site boundary, significant dust producing activities will be immediately terminated and satisfactory procedures implemented to rectify the problem before the resumption of the operations.
The dust minimisation plan shall be reviewed at regular intervals during the construction phase to ensure the effectiveness of the procedures in place and to maintain the goal of minimisation of dust through the use of best practise and procedures.

National Paediatric Hospital Project
Planning Application
Appendix 12.3– Air Dispersion Modelling
August 2015

National Paediatric Hospital Project
New Flue Design
Air dispersion modelling assessment
REP1
Planning | 3 August 2015
This report takes into account the particular instructions and requirements of our client.
It is not intended for and should not be relied upon by any third party and no responsibility is undertaken to any third party. Job number 237976-00
Ove Arup & Partners Ireland Ltd
Arup
50 Ringsend Road Dublin 4 Ireland www.arup.com
REP1 | Planning | 3 August 2015 | Arup
J:\237000\237976-00\4. INTERNAL\4-04 REPORTS\4-04-02 CONSULTING\AIR MODELLING\AIR DISPERSION MODELLING REPORT DRAFT 2 PLANNING ISSUE.DOCX
Document Verification
Job title New Flue Design Job number
237976-00
Document title Air dispersion modelling assessment File reference
Document ref REP1
Revision Date Filename Report.docx Draft 1 15 Jun
2015 Description First draft
Prepared by Checked by Approved by
Name Cormac McKenna Sinead Whyte Ger Bythell
Signature
Draft 2 24 Jun 2015
Filename Air dispersion modelling report draft 2.docx Description
Prepared by Checked by Approved by
Name Cormac Mc Kenna Sinead Whyte Ger Bythell
Signature
Planning 3 Aug 2015
Filename Air dispersion modelling report draft 2 planning issue Description No material change from Draft 2
Prepared by Checked by Approved by
Name Cormac McKenna Sinead Whyte Edith Blennerhassett
Signature
Filename Description
Prepared by Checked by Approved by
Name
Signature
Issue Document Verification with Document �
National Paediatric Hospital Project New Flue Design
Air dispersion modelling assessment
REP1 | Planning | 3 August 2015 | Arup
J:\237000\237976-00\4. INTERNAL\4-04 REPORTS\4-04-02 CONSULTING\AIR MODELLING\AIR DISPERSION MODELLING REPORT DRAFT 2 PLANNING ISSUE.DOCX
Contents
Page
1 Introduction 1
2 Methodology 1
2.1 Legislative background 1
2.2 Modelling methodology 2
3 Receiving environment 6
4 Results of modelling assessment 7
4.1 Ground level concentrations (GLC) 7
4.2 Sensitive receptors 8
5 Conclusions 8
6 References 8
Figures
Figure 1 Sensitive Receptor Locations
Figure 2 Isopleth

REP1 | Planning | 3 August 2015 | Arup
J:\237000\237976-00\4. INTERNAL\4-04 REPORTS\4-04-02 CONSULTING\AIR MODELLING\AIR DISPERSION MODELLING REPORT DRAFT 2 PLANNING ISSUE.DOCX
Page 1
1 Introduction
It is intended to provide a new energy centre at the proposed new children’s hospital to be located at the site of the existing St James’s Hospital.
This report considers the cumulative air quality impact associated with emissions from both existing and new sources on site. Once operational, the following combustion sources will be provided on site:
• Four hot water boilers
• Two CHP engines
• Three steam boilers
A modelling assessment of nitrogen oxide emissions is carried out. Predicted values plus background levels are compared to air quality standards.
2 Methodology
2.1 Legislative background
In order to reduce the risk of poor air quality, national and European statutory bodies have set limit values in ambient air for a range of air pollutants. These limit values are set for the protection of human health and ecosystems.
On 12 April 2011, the Air Quality Standards Regulations (AQS) 2011 (S.I. No. 180 of 2011) came into force and transposed EU Directive 2008/50/EC into Irish law. The purpose of the 2011 regulations is to establish limit values and alert thresholds for concentrations of certain pollutants, to provide for the assessment of certain pollutants using methods and criteria common to other European Member States, to ensure that adequate information on certain pollutant concentrations is obtained and made publically available and to provide for the maintenance and improvement of ambient air quality where necessary.
The limit values established under these regulations relevant to this assessment are included in Table 1 below.
National Paediatric Hospital Project New Flue DesignAir dispersion modelling assessment
REP1 | Planning | 3 August 2015 | Arup
J:\237000\237976-00\4. INTERNAL\4-04 REPORTS\4-04-02 CONSULTING\AIR MODELLING\AIR DISPERSION MODELLING REPORT DRAFT 2 PLANNING ISSUE.DOCX
Page 2
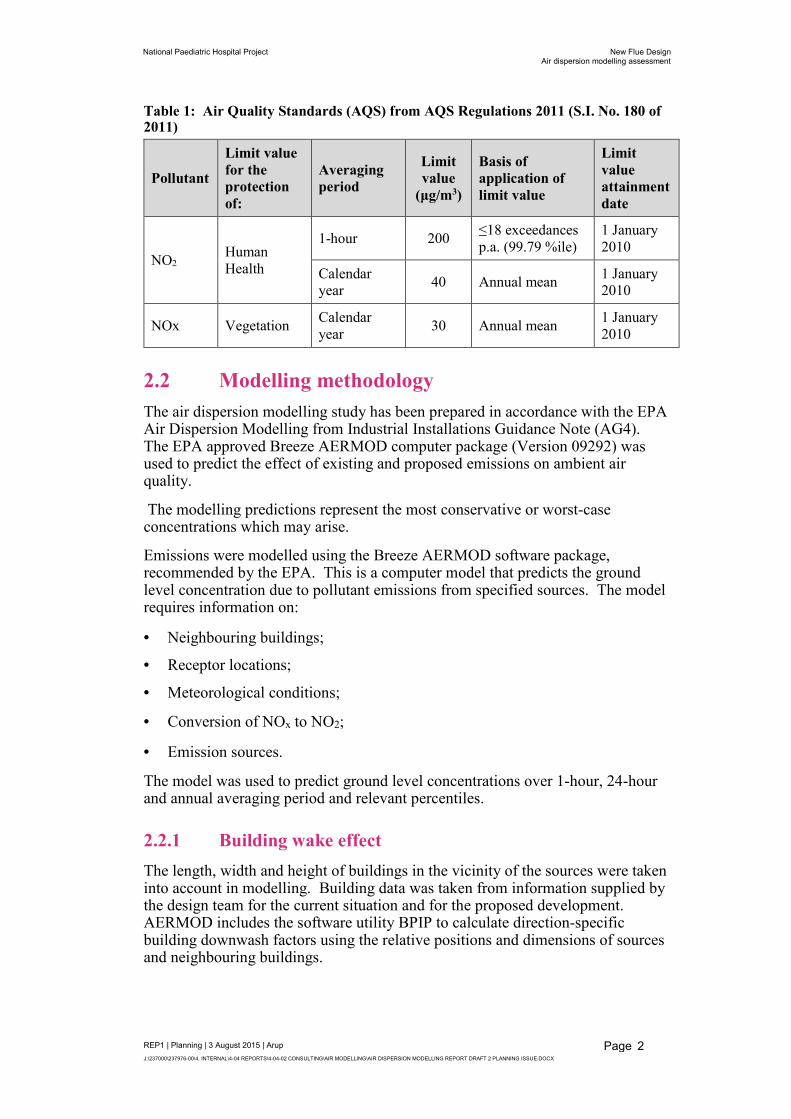
Table 1: Air Quality Standards (AQS) from AQS Regulations 2011 (S.I. No. 180 of 2011)
Pollutant
Limit value
for the
protection
of:
Averaging
period
Limit
value
(µg/m3)
Basis of
application of
limit value
Limit
value
attainment
date
NO2 Human Health
1-hour 200 ≤18 exceedances p.a. (99.79 %ile)
1 January 2010
Calendar year
40 Annual mean 1 January 2010
NOx Vegetation Calendar year
30 Annual mean 1 January 2010
2.2 Modelling methodology
The air dispersion modelling study has been prepared in accordance with the EPA Air Dispersion Modelling from Industrial Installations Guidance Note (AG4). The EPA approved Breeze AERMOD computer package (Version 09292) was used to predict the effect of existing and proposed emissions on ambient air quality.
The modelling predictions represent the most conservative or worst-case concentrations which may arise.
Emissions were modelled using the Breeze AERMOD software package, recommended by the EPA. This is a computer model that predicts the ground level concentration due to pollutant emissions from specified sources. The model requires information on:
• Neighbouring buildings;
• Receptor locations;
• Meteorological conditions;
• Conversion of NOx to NO2;
• Emission sources.
The model was used to predict ground level concentrations over 1-hour, 24-hour and annual averaging period and relevant percentiles.
2.2.1 Building wake effect
The length, width and height of buildings in the vicinity of the sources were taken into account in modelling. Building data was taken from information supplied by the design team for the current situation and for the proposed development. AERMOD includes the software utility BPIP to calculate direction-specific building downwash factors using the relative positions and dimensions of sources and neighbouring buildings.
National Paediatric Hospital Project New Flue DesignAir dispersion modelling assessment
REP1 | Planning | 3 August 2015 | Arup
J:\237000\237976-00\4. INTERNAL\4-04 REPORTS\4-04-02 CONSULTING\AIR MODELLING\AIR DISPERSION MODELLING REPORT DRAFT 2 PLANNING ISSUE.DOCX
Page 3
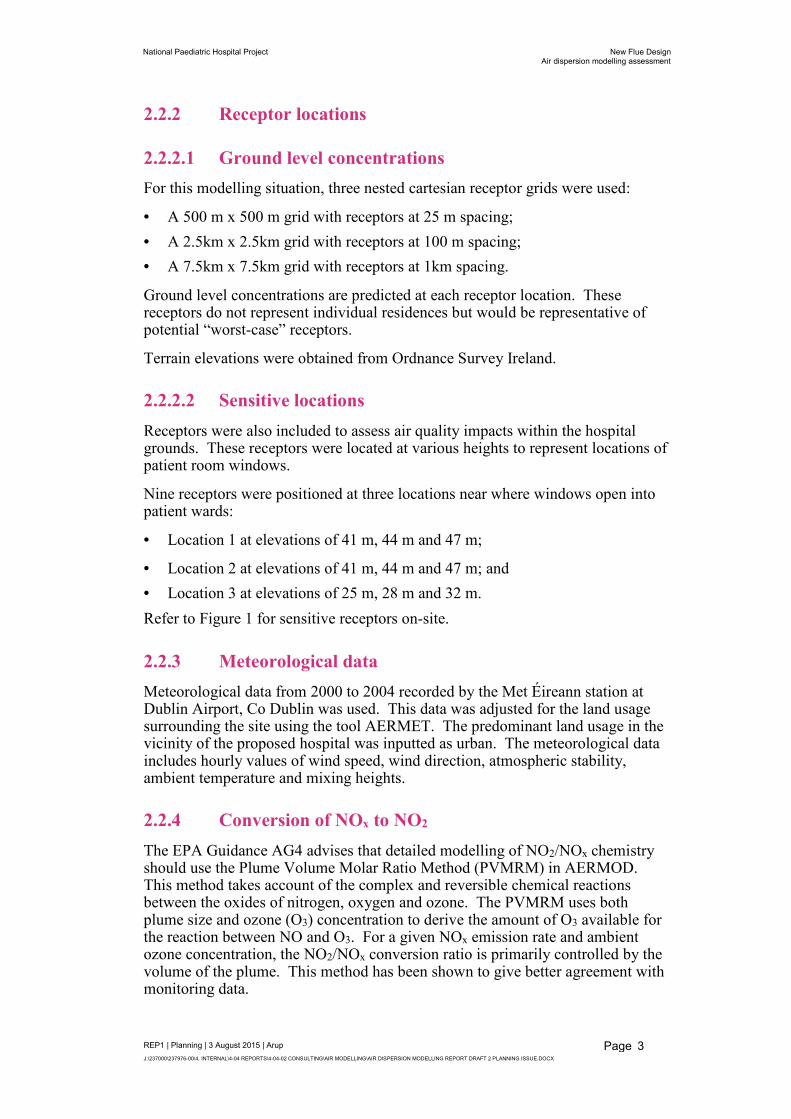
2.2.2 Receptor locations
2.2.2.1 Ground level concentrations
For this modelling situation, three nested cartesian receptor grids were used:
• A 500 m x 500 m grid with receptors at 25 m spacing;
• A 2.5km x 2.5km grid with receptors at 100 m spacing;
• A 7.5km x 7.5km grid with receptors at 1km spacing.
Ground level concentrations are predicted at each receptor location. These receptors do not represent individual residences but would be representative of potential “worst-case” receptors.
Terrain elevations were obtained from Ordnance Survey Ireland.
2.2.2.2 Sensitive locations
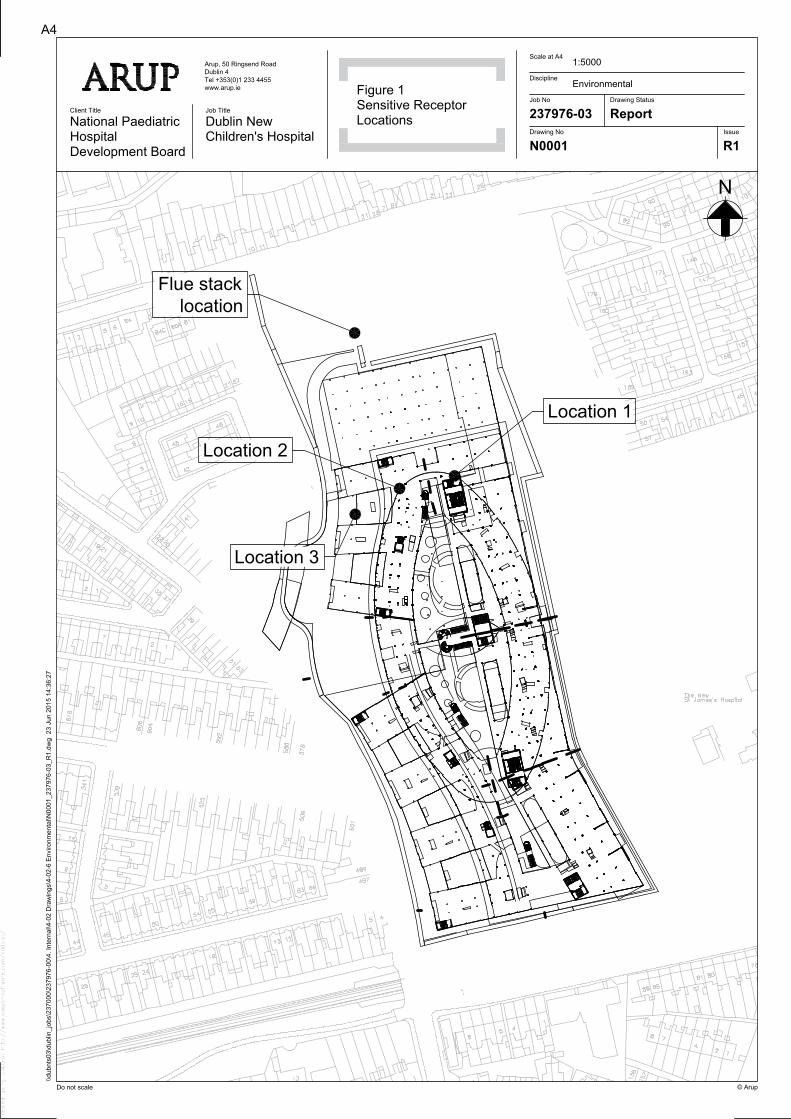
Receptors were also included to assess air quality impacts within the hospital grounds. These receptors were located at various heights to represent locations of patient room windows.
Nine receptors were positioned at three locations near where windows open into patient wards:
• Location 1 at elevations of 41 m, 44 m and 47 m;
• Location 2 at elevations of 41 m, 44 m and 47 m; and
• Location 3 at elevations of 25 m, 28 m and 32 m.
Refer to Figure 1 for sensitive receptors on-site.
2.2.3 Meteorological data
Meteorological data from 2000 to 2004 recorded by the Met Éireann station at Dublin Airport, Co Dublin was used. This data was adjusted for the land usage surrounding the site using the tool AERMET. The predominant land usage in the vicinity of the proposed hospital was inputted as urban. The meteorological data includes hourly values of wind speed, wind direction, atmospheric stability, ambient temperature and mixing heights.
2.2.4 Conversion of NOx to NO2
The EPA Guidance AG4 advises that detailed modelling of NO2/NOx chemistry should use the Plume Volume Molar Ratio Method (PVMRM) in AERMOD. This method takes account of the complex and reversible chemical reactions between the oxides of nitrogen, oxygen and ozone. The PVMRM uses both plume size and ozone (O3) concentration to derive the amount of O3 available for the reaction between NO and O3. For a given NOx emission rate and ambient ozone concentration, the NO2/NOx conversion ratio is primarily controlled by the volume of the plume. This method has been shown to give better agreement with monitoring data.
National Paediatric Hospital Project New Flue DesignAir dispersion modelling assessment
REP1 | Planning | 3 August 2015 | Arup
J:\237000\237976-00\4. INTERNAL\4-04 REPORTS\4-04-02 CONSULTING\AIR MODELLING\AIR DISPERSION MODELLING REPORT DRAFT 2 PLANNING ISSUE.DOCX
Page 4
For the PVMRM calculation, the following assumptions are made, as advised by EPA guidance:
• Background ozone is 50.7µg/m3 (average of Zone A monitoring from EPA long term data).
• NO2/NOx equilibrium ratio = 0.90.
• NO2/NOx in-stack ratio = 0.10.
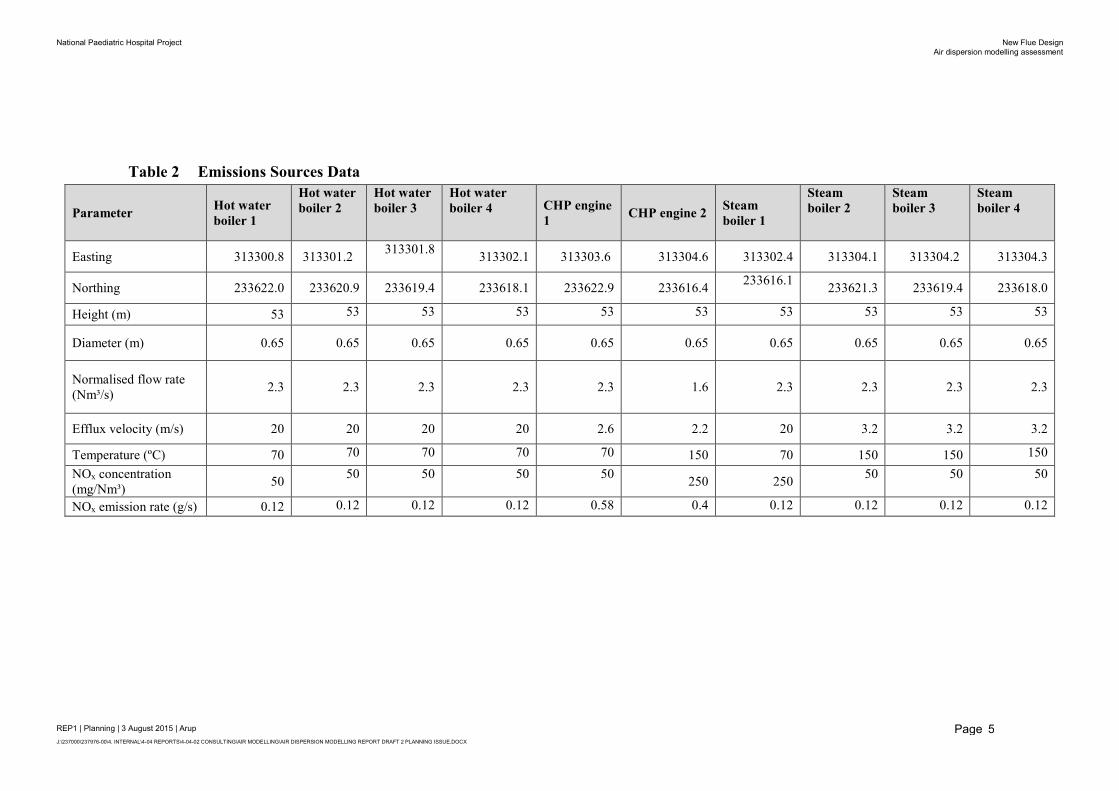
2.2.5 Emission sources
The emission source characteristics are given in Table 2.
National Paediatric Hospital Project New Flue Design
Air dispersion modelling assessment
REP1 | Planning | 3 August 2015 | Arup
J:\237000\237976-00\4. INTERNAL\4-04 REPORTS\4-04-02 CONSULTING\AIR MODELLING\AIR DISPERSION MODELLING REPORT DRAFT 2 PLANNING ISSUE.DOCX
Page 5
Table 2 Emissions Sources Data
Parameter Hot water
boiler 1
Hot water
boiler 2
Hot water
boiler 3
Hot water
boiler 4 CHP engine
1 CHP engine 2
Steam
boiler 1
Steam
boiler 2
Steam
boiler 3
Steam
boiler 4
Easting 313300.8 313301.2 313301.8
313302.1 313303.6 313304.6 313302.4 313304.1 313304.2 313304.3
Northing 233622.0 233620.9 233619.4 233618.1 233622.9 233616.4 233616.1
233621.3 233619.4 233618.0
Height (m) 53 53 53 53 53 53 53 53 53 53
Diameter (m) 0.65 0.65 0.65 0.65 0.65 0.65 0.65 0.65 0.65 0.65
Normalised flow rate (Nm³/s)
2.3 2.3 2.3 2.3 2.3 1.6 2.3 2.3 2.3 2.3
Efflux velocity (m/s) 20 20 20 20 2.6 2.2 20 3.2 3.2 3.2
Temperature (ºC) 70 70 70 70 70 150 70 150 150 150
NOx concentration (mg/Nm³)
50 50 50 50 50
250 250 50 50 50
NOx emission rate (g/s) 0.12 0.12 0.12 0.12 0.58 0.4 0.12 0.12 0.12 0.12
National Paediatric Hospital Project New Flue Design
Air dispersion modelling assessment
REP1 | Planning | 3 August 2015 | Arup
J:\237000\237976-00\4. INTERNAL\4-04 REPORTS\4-04-02 CONSULTING\AIR MODELLING\AIR DISPERSION MODELLING REPORT DRAFT 2 PLANNING ISSUE.DOCX
Page 6
3 Receiving environment
The Environmental Protection Agency (EPA) monitors air quality in Ireland. The most recent air quality monitoring reports from the EPA were published in 2014, 2013 and 2012 describing air quality for 2013, 2012 and 2011 respectively. The zoning of areas adopted in Ireland under the Air Quality Framework Directive 96/62/EC is as follows:
• Zone A (Dublin Conurbation);
• Zone B (Cork Conurbation);
• Zone C (16 Cities and Towns with population greater than 15,000, including Naas); and
• Zone D (Rural Ireland: areas not in Zones A, B and C).
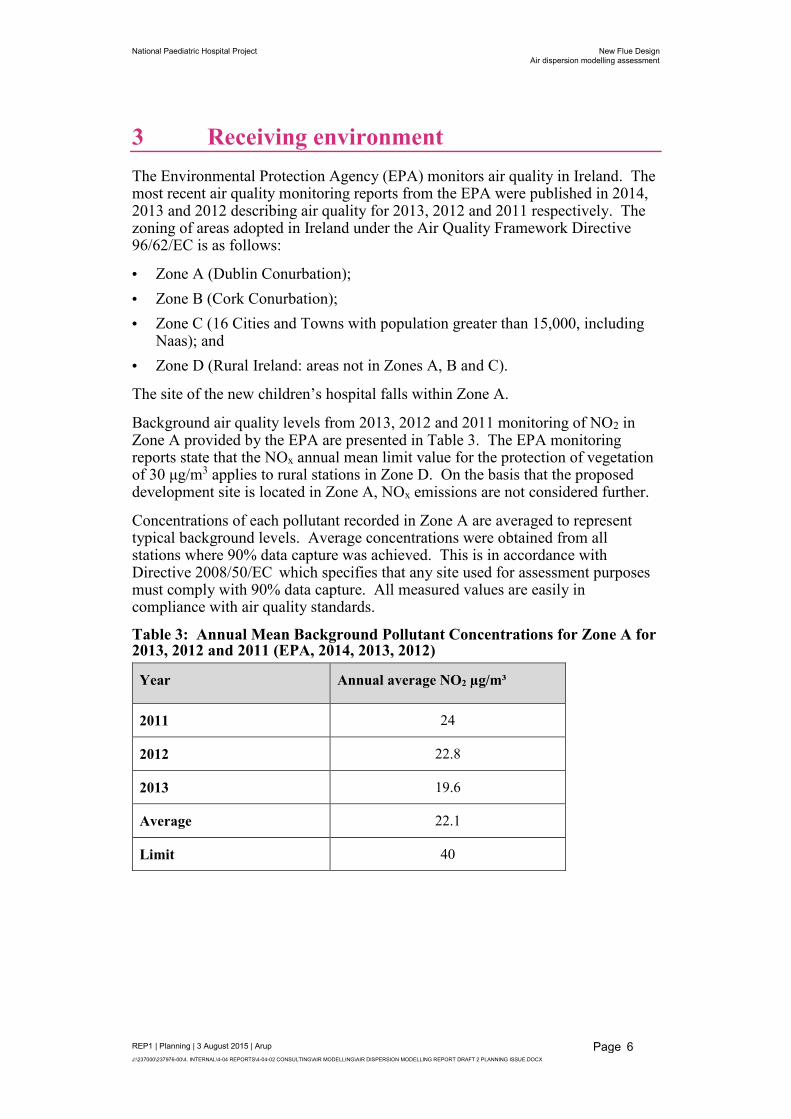
The site of the new children’s hospital falls within Zone A.
Background air quality levels from 2013, 2012 and 2011 monitoring of NO2 in Zone A provided by the EPA are presented in Table 3. The EPA monitoring reports state that the NOx annual mean limit value for the protection of vegetation of 30 µg/m3 applies to rural stations in Zone D. On the basis that the proposed development site is located in Zone A, NOx emissions are not considered further.
Concentrations of each pollutant recorded in Zone A are averaged to represent typical background levels. Average concentrations were obtained from all stations where 90% data capture was achieved. This is in accordance with Directive 2008/50/EC which specifies that any site used for assessment purposes must comply with 90% data capture. All measured values are easily in compliance with air quality standards.
Table 3: Annual Mean Background Pollutant Concentrations for Zone A for 2013, 2012 and 2011 (EPA, 2014, 2013, 2012)
Year Annual average NO2 µg/m³
2011 24
2012 22.8
2013 19.6
Average 22.1
Limit 40
National Paediatric Hospital Project New Flue Design
Air dispersion modelling assessment
REP1 | Planning | 3 August 2015 | Arup
J:\237000\237976-00\4. INTERNAL\4-04 REPORTS\4-04-02 CONSULTING\AIR MODELLING\AIR DISPERSION MODELLING REPORT DRAFT 2 PLANNING ISSUE.DOCX
Page 7
4 Results of modelling assessment
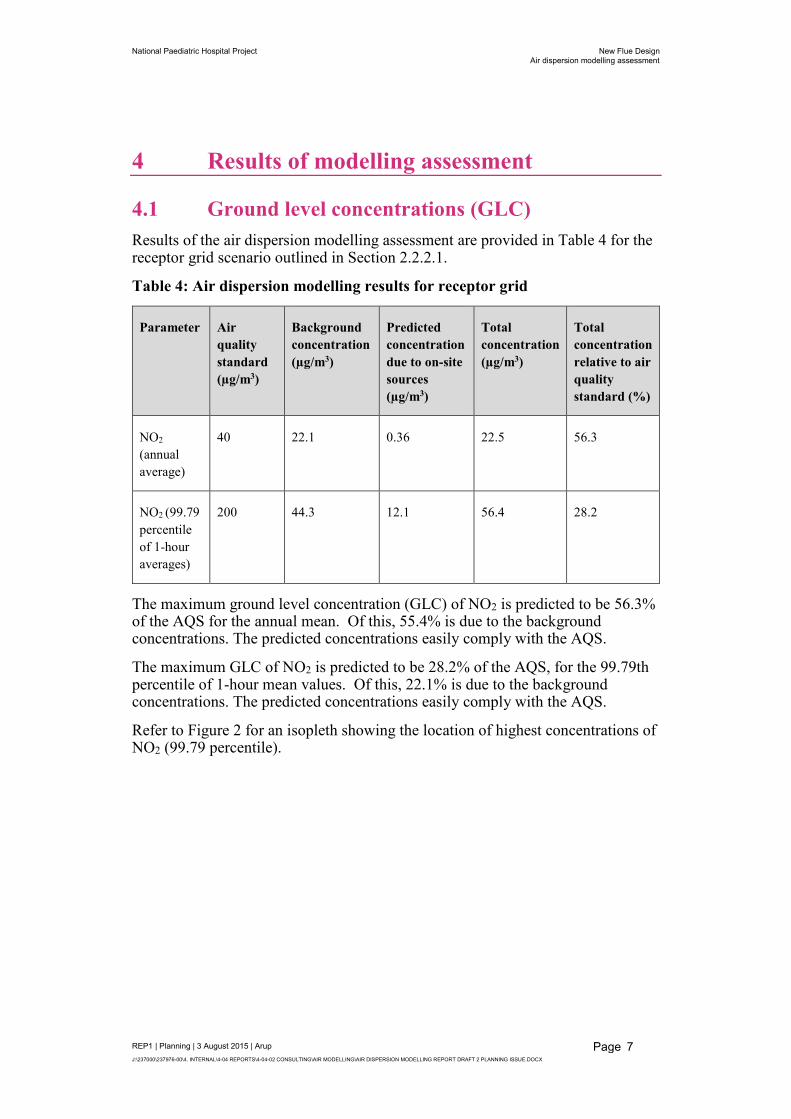
4.1 Ground level concentrations (GLC)
Results of the air dispersion modelling assessment are provided in Table 4 for the receptor grid scenario outlined in Section 2.2.2.1.
Table 4: Air dispersion modelling results for receptor grid
Parameter Air
quality
standard
(µg/m3)
Background
concentration
(µg/m3)
Predicted
concentration
due to on-site
sources
(µg/m3)
Total
concentration
(µg/m3)
Total
concentration
relative to air
quality
standard (%)
NO2
(annual average)
40 22.1 0.36 22.5 56.3
NO2 (99.79 percentile of 1-hour averages)
200 44.3 12.1 56.4 28.2
The maximum ground level concentration (GLC) of NO2 is predicted to be 56.3% of the AQS for the annual mean. Of this, 55.4% is due to the background concentrations. The predicted concentrations easily comply with the AQS.
The maximum GLC of NO2 is predicted to be 28.2% of the AQS, for the 99.79th percentile of 1-hour mean values. Of this, 22.1% is due to the background concentrations. The predicted concentrations easily comply with the AQS.
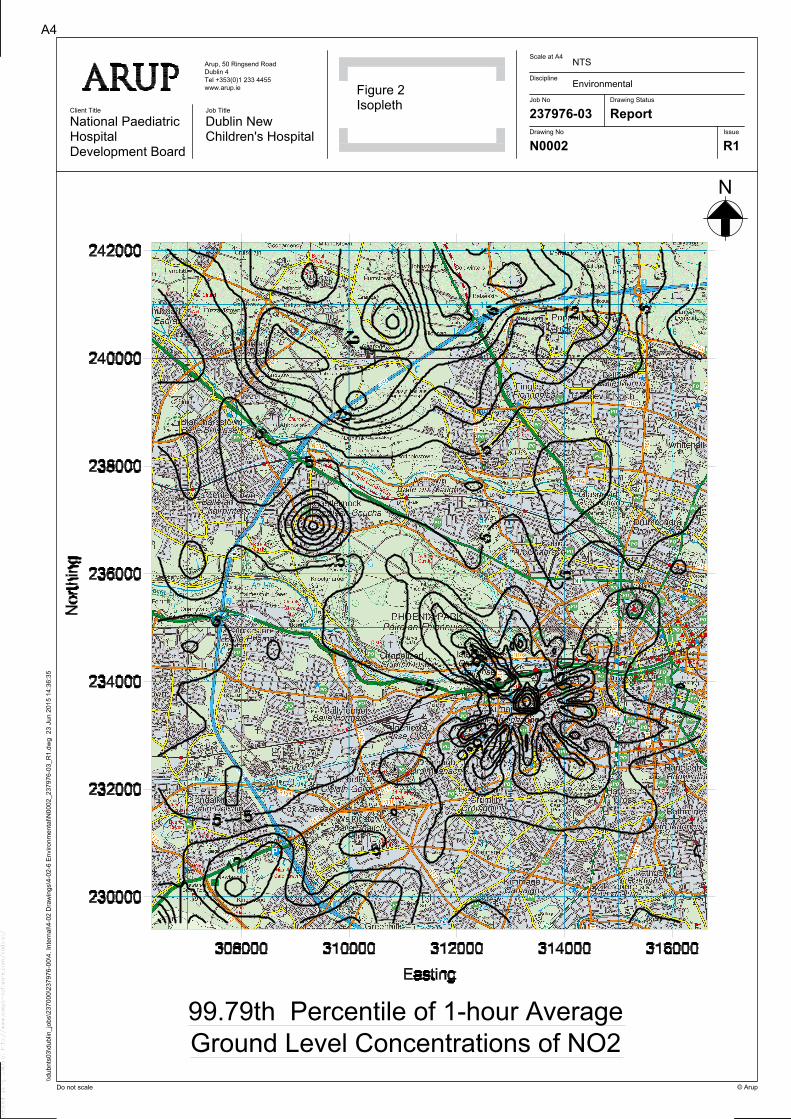
Refer to Figure 2 for an isopleth showing the location of highest concentrations of NO2 (99.79 percentile).
National Paediatric Hospital Project New Flue Design
Air dispersion modelling assessment
REP1 | Planning | 3 August 2015 | Arup
J:\237000\237976-00\4. INTERNAL\4-04 REPORTS\4-04-02 CONSULTING\AIR MODELLING\AIR DISPERSION MODELLING REPORT DRAFT 2 PLANNING ISSUE.DOCX
Page 8
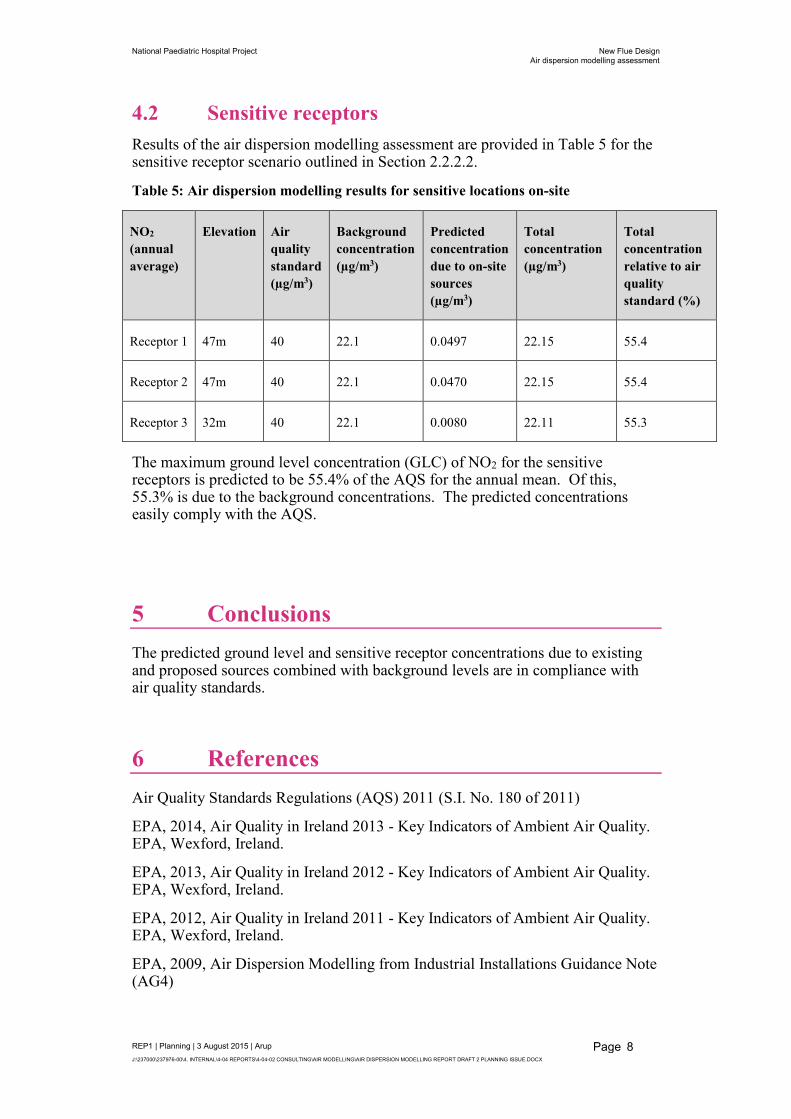
4.2 Sensitive receptors
Results of the air dispersion modelling assessment are provided in Table 5 for the sensitive receptor scenario outlined in Section 2.2.2.2.
Table 5: Air dispersion modelling results for sensitive locations on-site
NO2
(annual
average)
Elevation Air
quality
standard
(µg/m3)
Background
concentration
(µg/m3)
Predicted
concentration
due to on-site
sources
(µg/m3)
Total
concentration
(µg/m3)
Total
concentration
relative to air
quality
standard (%)
Receptor 1 47m 40 22.1 0.0497 22.15 55.4
Receptor 2 47m 40 22.1 0.0470 22.15 55.4
Receptor 3 32m 40 22.1 0.0080 22.11 55.3
The maximum ground level concentration (GLC) of NO2 for the sensitive receptors is predicted to be 55.4% of the AQS for the annual mean. Of this, 55.3% is due to the background concentrations. The predicted concentrations easily comply with the AQS.
5 Conclusions
The predicted ground level and sensitive receptor concentrations due to existing and proposed sources combined with background levels are in compliance with air quality standards.
6 References
Air Quality Standards Regulations (AQS) 2011 (S.I. No. 180 of 2011)
EPA, 2014, Air Quality in Ireland 2013 - Key Indicators of Ambient Air Quality. EPA, Wexford, Ireland.
EPA, 2013, Air Quality in Ireland 2012 - Key Indicators of Ambient Air Quality. EPA, Wexford, Ireland.
EPA, 2012, Air Quality in Ireland 2011 - Key Indicators of Ambient Air Quality. EPA, Wexford, Ireland.
EPA, 2009, Air Dispersion Modelling from Industrial Installations Guidance Note (AG4)

National Paediatric Hospital Project New Flue Design
Air dispersion modelling assessment
REP1 | Planning | 3 August 2015 | Arup
J:\237000\237976-00\4. INTERNAL\4-04 REPORTS\4-04-02 CONSULTING\AIR MODELLING\AIR DISPERSION MODELLING REPORT DRAFT 2 PLANNING ISSUE.DOCX
Page 9
Figures

National Paediatric Hospital Project New Flue Design
Air dispersion modelling assessment
REP1 | Planning | 3 August 2015 | Arup
J:\237000\237976-00\4. INTERNAL\4-04 REPORTS\4-04-02 CONSULTING\AIR MODELLING\AIR DISPERSION MODELLING REPORT DRAFT 2 PLANNING ISSUE.DOCX
Figure 1 Sensitive Receptor Locations Figure 2 Isopleth
Location 1
Location 2
Location 3
Flue stack
location
N0001 R1
237976-03
Environmental
1:5000
Report
Figure 1
Sensitive Receptor
Locations
Dublin New
Children's Hospital
National Paediatric
Hospital
Development Board
Arup, 50 Ringsend Road
Dublin 4
Tel +353(0)1 233 4455
www.arup.ie
\\dubnts03\dublin_jobs\237000\237976-00\4. Internal\4-02 D
raw
ings\4-02-6 E
nvironm
ental\N
0001_237976-03_R
1.dw
g 23 Jun 2015 14:36:27
Do not scale © Arup
A4
Job No
Discipline
Scale at A4
Drawing No Issue
Drawing Status
Job TitleClient Title
N
Created using CADplot http://www.oasys-software.com/cadplot/
N0002 R1
237976-03
Environmental
NTS
Report
Figure 2Isopleth
Dublin New
Children's Hospital
National Paediatric
Hospital
Development Board
Arup, 50 Ringsend Road
Dublin 4
Tel +353(0)1 233 4455
www.arup.ie
\\dubnts03\dublin_jobs\237000\237976-00\4. Internal\4-02 D
raw
ings\4-02-6 E
nvironm
ental\N
0002_237976-03_R
1.dw
g 23 Jun 2015 14:36:35
Do not scale © Arup
A4
Job No
Discipline
Scale at A4
Drawing No Issue
Drawing Status
Job TitleClient Title
N
99.79th Percentile of 1-hour Average
Ground Level Concentrations of NO2
Created using CADplot http://www.oasys-software.com/cadplot/