Embed Size (px)
Citation preview

National Oceanic and Atmospheric Administration
Mission Statement
The National Oceanic and Atmospheric Administration’s (NOAA’s) mission is to describe and predict changes in the Earth’s environment, and conserve and manage wisely the nation’s coastal and marine resources so as to ensure sustainable economic opportunities.
NOAA’s mission is to describe and predict changes in the Earth’s environment and conserve and manage the nation’s coastal and marine resources to ensure sustainable economic opportunities. NOAA continues to develop new technologies, improve operations, and supply the scientific basis for managing natural resources and solving environmental problems. The FY 2003 request reaffirms NOAA’s role by providing resources to maintain essential service, facilitate progress in key investment areas of national interest, and address statutory obligations.
NOAA conducts research to develop new technologies, improve operations, and supply the scientific basis for managing natural resources and solving environmental problems. NOAA’s comprehensive system for acquiring observations—from satellites and radar to ships and submersibles—provides the quality data and information needed for the safe conduct of daily life and the efficient pursuit of the complex activities of modern society. Common products and services include weather and climate warnings and forecasts, environmental technologies, marine fisheries statistics and regulations, nautical charts, assessments of environmental changes, and hazardous materials response information. These capabilities, products, and services support the domestic security and global competitiveness of the United States, and they affect the lives of nearly every citizen.
NOAA provides the resources to maintain essential services, facilitate progress in key investment areas of national interest, and address statutory obligations. To provide these services, NOAA needs to strike an appropriate balance among the environmental assessment, prediction, and stewardship needs of the nation. This requires management of natural resources and assessment and prediction of the Earth’s environment. NOAA’s efforts are key components of the U.S. Department of Commerce’s strategic plan and contribute significantly to achieving the department’s strategic goals.
The challenge of investing strategically in the nation’s future is accompanied by the requirement of effective agency management, to identify and realize opportunities for savings, and to focus on what matters to Americans. NOAA envisions a 21st century in which environmental stewardship, assessment, and prediction serve as keystones to enhancing economic prosperity and quality of life, more effectively protecting lives and property, and strengthening the U.S. balance of trade. This vision depends on NOAA’s achievements in the following areas:
215

National Oceanic and Atmospheric Administration
• Creation and dissemination of reliable assessments and predictions of weather, climate, space environment, ocean and living marine resources, and nautical and geodetic phenomena and systems
• Implementation of integrated approaches to environmental management and ocean and coastal resources stewardship
• Assurance of continual operational observing capabilities, including buoys, satellites, ships, submersibles, and radar
• Construction and use of new information networks such as investment in state-of-the-art computing capabilities
• Development of public-private, interagency, and international partnerships for the expansion, transfer, and archiving of environmental knowledge
• Investment in scientific research and the development of new technologies to improve current operations and prepare for the future
• Improvement of NOAA’s abilities to serve its customers and forge stronger ties with its partners and stakeholders.
Priorities
Department-wide
• Natural resources--In support of this program, NOAA will work to reduce overfishing and overcapitalization of the nation’s fishery resources, better manage protected and threatened resources, protect coastal habitats from continued loss and degradation, explore new frontiers in ocean research, conduct more research into the effects of climate changes on the oceans and atmosphere, and promote safe navigation. NOAA will also work toward improving short-term weather, water, and climate forecast and warning products and services, as well as improving its ability to predict longer-term climate variability.
• Information technology security and addressing single point vulnerabilities--The public, from emergency managers to the media to schools, depends on NOAA products such as satellite imagery, tornado warnings, and so on. It is clear that a number of our systems and products are at risk of disruption or discontinuance because of the usage of only primary delivery systems. In critical areas NOAA lacks backup systems and redundancy. Constant attacks by hackers will compromise NOAA’s information technology systems if the agency is unable to address these vulnerabilities and ensure a secure operation. NOAA will work to address these vulnerabilities and ensure the continuation of secure operations.
• Education partnership program with minority serving institutions--NOAA contributes to the department’s education partnership program with minority serving institutions. This program cuts across all of NOAA’s strategic goals and helps train students in sciences that serve NOAA’s mission.
NOAA
• Severe weather and satellite continuity--Few things the federal government does are as critical as issuing severe storm warnings and protecting the life and safety of Americans. Improvement in the ability to observe, forecast, and warn the public of hurricanes, severe storms, and flash floods will remain one of NOAA’s highest priorities. With the development and deployment of a prototype high-resolution imaging sensor, NOAA is working in conjunction with the National Aeronautics and Space Administration to continuously monitor coastal ocean areas for harmful algae blooms, coral reef deterioration, pollution changes, fisheries management, and navigation safety. Continued high-priority interagency research and service programs
216 FY 2001 APPR and FY 2003 APP

National Oceanic and Atmospheric Administration
will lead to the improvement in hurricane track prediction and intensity forecasts; quantitative precipitation forecasts; lead time for tornado, severe storm, and flash flood warnings; and improved forecasts and warnings of river flood stages and flooding. It is clear that we have the technological capability to improve these products, which also are critical for water management and hydroelectric power.
• Climate observations and services--During recent years, there has been a growing demand from emergency managers, the private sector, the research community, decisionmakers in the United States, international governmental agencies, and the general public to provide timely data and information about climate variability, climate change, and trends in extreme weather events. The economic and social needs for continuous, reliable climate data and longer-range climate forecasts have been clearly demonstrated. This program supports the transition of our current research efforts and knowledge into operational systems and products. To do this, NOAA will focus its efforts to address key deficiencies in its observation and data management systems, implement new ocean observations, and develop a broad spectrum of new forecast products.
• Assistance to the energy sector--A large number of NOAA programs either are, or can be, of significant assistance to the U.S. energy industry. NOAA programs such as weather service forecasts, climate data, hydrological forecasts, and electronic navigational charts can significantly improve electrical power generation, electrical load forecasting, and fuel transportation. NOAA is ready to address America’s energy issues and work towards providing immediate and short-term benefits to the industry and build upon ongoing base programs to provide the necessary infrastructure and continuity for longer-term research and development.
• Modernization of NOAA fisheries--Fisheries modernization is a long-term commitment to improve the structure, processes, and business approaches of NOAA fisheries to succeed in their mission. NOAA is adapting to a changing world that includes environmental and biological risks and uncertainties that are compounded by economic and human behavior associated with fisheries. NOAA will continue to make significant programmatic investments in several critical areas to change NOAA fisheries’ way of doing business by remedying significant underinvestments in science and management.
• Marine transportation system--NOAA is an active participant in the interagency and industry partnership to improve the marine transportation system and is actively involving its stakeholders and other Commerce agencies in this effort. Ensuring safe and efficient port operations is vital to maintaining the global competitiveness of the U.S. port industry and U.S. exports. NOAA’s role in the marine transportation system is to support the maritime infrastructure by giving the mariner the best information possible to improve situational awareness for safe and efficient navigation. To achieve this goal, NOAA will continue to improve its integrated suite of surveying, charting, measuring water levels, and positioning services in order to increase the efficient movement of goods while significantly reducing the risk of marine accidents and resulting environmental damage.
• Sustain healthy coasts--Coastal ecosystems are powerful engines that fuel the nation’s economy. Over one-half of the U.S. population now lives and works within 50 miles of the coast. One in every six U.S. jobs is marine-related and one-third of the nation’s gross domestic product is produced in coastal areas. This economic activity depends on productive coastal habitats, clean coastal waters, and healthy coastal ecosystems. NOAA’s role in ensuring the continuity of this economic activity is to predict and reduce the impacts of storms on coastal watersheds, conserve and restore coastal habitats, and explore new ocean habitats.
• Infrastructure--NOAA’s infrastructure has a direct impact on its ability to satisfy the demands of its mission, and the condition and readiness of this infrastructure have consequential effects on human welfare, economic well-being, and the advancement of the state of science. NOAA will continue to revitalize its infrastructure in preparation for the unique challenges of the new millennium. Within its infrastructure, NOAA proposes investments in people and corporate systems, data collection, vessels, aircraft, and facilities.
FY 2001 APPR and FY 2003 APP 217

National Oceanic and Atmospheric Administration
FY 2003 Program Changes
Operations, Research, and Facilities
National Ocean Service (NOS) Base Increase/Decrease
FTE Amount FTE AmountNavigation Services 626 $112,142 +6 +$10,038
An increase of +6 FTE and +$9,850 is requested for the address survey backlog and contracts program to initiate a vessel lease or time charter for approximately 330 days at sea and 500 square nautical miles of hydrographic surveying in the Gulf of Mexico. An increase of 0 FTE and +$188 is requested for activities required to increase the nation’s access to the National Spatial Reference System.
Ocean Resources Conservation and 418 $122,603 0 +$15 Assessment
An increase of 0 FTE and +$250 is requested in the Ocean Assessment Program to expand research efforts to reduce the loss of life and property due to coastal storms in the pilot region of the St. John’s river watershed in northeastern Florida by applying a cross-section of NOAA capabilities. An increase of 0 FTE and +$2,000 is also requested to promote restoration of coastal areas through enhanced partnerships and regional monitoring efforts. NOAA will leverage and strengthen its efforts through regional planning and partnerships with industry, states, and coastal communities. Reductions are requested for the following programs: Cooperative Institute for Coastal and Estuarine Environmental Technology (0 FTE; -$750); National Fish and Wildlife Foundation grant program (0 FTE; -$500); and the Coastal Ocean Science program by deferring some research into future years (0 FTE; -$985).
Ocean and Coastal Management 183 $139,849 0 +$700
Building on the FY 2001 and FY 2002 funding, an increase of 0 FTE and +$700 is requested to bring the National Marine Sanctuaries up to a minimal baseline operation level by enhancing the capacity of each of the 13 sanctuaries. The results will improve protection of important sanctuary resources, including coral reefs, endangered marine mammals, sensitive habitats, and significant cultural resources.
National Marine Fisheries Service (NMFS)
Fisheries Research and Management 1,350 $332,415 +37 +$16,411Services
Increases are requested of +26 FTE and +$9,906 to modernize and expand annual stock assessments; of +7 FTE and +$1,500 to support development of a multi-year comprehensive social sciences program within NOAA fisheries; of +4 FTE and +$3,250 to build a national observer program for the collection of high quality fisheries and environmental data from commercial and recreational fishing vessels to assess impacts on marine resources and fishing communities and to monitor compliance with marine resource laws and regulations; of 0 FTE and +$3,000 to fund NMFS’s National Environmental Policy Act implementation; and of 0 FTE and +$1,000 to support the Regional Fisheries Management Councils’ increased workload in implementing the Sustainable Fisheries Act of 1996 amendments to the Magnuson-Stevens Fishery Management and Conservation Act and corresponding and supporting international management measures. Reductions are requested in the following programs: Gulf of Mexico Consortium project in the Science and Technology line item (0 FTE; -$1,500); West Coast Observers (0 FTE; -$345); and the Conservation and Management base
218 FY 2001 APPR and FY 2003 APP

National Oceanic and Atmospheric Administration
(0 FTE; -$400). In addition, the Administration proposes to add authority for transferable quota systems in the reauthorization of the Magnuson-Stevens Act.
Base Increase/Decrease FTE Amount FTE Amount
Protected Resources Research and Management Services
654 $145,926 +37 +$11,294
Increased resources of 0 FTE and +$1,000 are requested to provide funds to state partners in the Endangered Species Act, Section 6 cooperative conservation program; of +3 FTE and +$1,400 to provide the necessary research to recover highly endangered marine turtles; of +1 FTE and +$1,000 to scientifically determine whether two key endangered whales--humpbacks and bowheads--have recovered and are candidates for delisting; of 0 FTE and +$45 to enhance research under the Marine Mammal Protection Act; of +18 FTE and +$12,000 to implement the Columbia River system biological opinions; and of +15 FTE and +$2,150 for conservation and management base programs. Reductions are requested for the following programs: Stellar Sea Lion Recovery---Alaska Sea Life Center (0 FTE; -$2,300); Stellar Sea Lion Recovery---North Pacific Universities (0 FTE; -$2,700); Bottlenose Dolphin Research (0 FTE; -$1,250); and the Protected Species Management base (0 FTE; -$51).
Habitat Conservation Research and 149 $47,215 +13 -$800Management Services
An increase of +13 FTE and +$2,000 is requested for Fish and Wildlife Coordination Act activities to support an Energy Permit Rapid Response initiative. Reductions are requested for the following programs reflecting decreased requirements: Blue Crab Research Consortium (0 FTE; -$900); Chesapeake Bay Oyster Research (0 FTE; -$1,150); and Chesapeake Bay Studies (0 FTE; -$750).
Enforcement and Surveillance 196 $43,594 0 +$7,400Services
An increase of 0 FTE and +$2,000 is requested for the NOAA fisheries enforcement modernization. In addition, an increase of 0 FTE and +$5,400 is requested to modernize and expand the national Vessel Management System. These resources will support the program that will monitor approximately 1,500 vessels and is expandable.
Oceanic and Atmospheric Research (OAR)
Climate Research 352 $152,027 +5 +$18,937
Increases of +1 FTE and +$558 are requested for base funding of operational scientific activities; of +2 FTE and +$18,000 for NOAA’s participation in the President’s new multi-agency Climate Change Research Initiative; and of +2 FTE and +$2,000 for the Arctic Research Initiative---Study of Environmental Arctic Change. Reductions are requested for the Climate and Global Change Program (0 FTE; -$1,121); and the International Pacific Research Center (0 FTE; -$500).
Weather and Air Quality Research 244 $54,561 +7 +$4,485
Increases of +3 FTE and +$385 are requested for base funding of operational scientific activities at the Forecast Systems Laboratory and the Space Environmental Center; of +2 FTE and +$1,000 for the U.S. Weather Research Program; of 0 FTE and +$6,100 for the Administration’s new Energy Security Program; and of 0 FTE and +$6,100 to develop new technologies for forecasting and detecting tornadoes and other forms of severe weather and disseminate this information to the public.
FY 2001 APPR and FY 2003 APP 219

National Oceanic and Atmospheric Administration
Reductions are requested for the following programs: Space-based Wind Profiler Lidar Technology (0 FTE; -$1,000); and the AIRMAP project (0 FTE; -$3,000) reflecting reduced program requirements.
Base Increase/Decrease FTE Amount FTE Amount
Ocean, Coastal, and Great Lakes Research
184 $116,562 -20 -$62,410
A decrease of -20 FTE and -$62,410 is requested to reflect the transfer of the National Sea Grant College Program from NOAA to the National Science Foundation. The National Science Foundation will request funding of $57,000 for the program, which will be awarded to universities through a competitive process. NOAA will be consulted on identifying research priorities.
Information Technology, Research 7 $12,800 0 $0and Development, and Science Education
No increase is proposed for this subactivity.
National Weather Service (NWS)
Operations and Research 4,459 $620,576 0 +$11,388
Increased funding of 0 FTE and +$1,388 is requested in the Local Warnings and Forecasts base for operation of the new Weather Forecast Office (WFO) in Huntsville; of 0 FTE and +$3,000 to address the critical maintenance backlog at all WFOs; of 0 FTE and +$4,500 to bring Advanced Hydrologic Prediction Service capabilities to coastal watersheds in the southeast and northwest and to accelerate nationwide implementation of river and flood forecasting; and of 0 FTE and +$2,500 to initiate a multi-year plan to provide state-of-the-art weather observation and forecast products in support of aviation safety.
Systems Operations and Maintenance 212 $90,304 0 +$3,000
Funding in this subactivity reflects the incremental costs of operations and maintenance associated with the Next Generation Weather Radar, Automated Surface Observing System, and the Advanced Weather Interactive Processing System programs.
Increased funding of 0 FTE and +$3,000 is needed for the operations and maintenance of a new National Weather Service Telecommunication Gateway backup facility.
National Environmental Satellite, Data, and Information Service (NESDIS)
Environmental Satellite Observing 433 $83,092 0 +$8,660Systems
Funding in this subactivity supports the operation of current, on-orbit Geostationary and polar-orbiting satellites and the acquisition of data from nonNOAA satellites and processing and supplying data to users. Funding associated with the acquisition of Geostationary and polar-orbiting operational environmental satellites, including the Polar Convergence program, is reflected in the Procurement, Acquisition, and Construction account.
220 FY 2001 APPR and FY 2003 APP

National Oceanic and Atmospheric Administration
An increase of 0 FTE and +$250 is requested to enhance security at Wallops and Fairbanks to protect critical satellite control facilities; of 0 FTE and +$2,260 to properly operate and maintain the Fairbanks Satellite command and data acquisition station; of 0 FTE and +$3,050 to expand on-site maintenance and to review and redesign procedures that will reduce the risk to continuity of critical satellite product processing and distribution operations; of 0 FTE and +$2,000 to improve support for weather and hazards product processing and distribution; of 0 FTE and +$2,600 to accelerate the development of new satellite data assimilation science at the Joint (NOAA/National Aeronautic and Space Administration) Center for Satellite Data Assimilation; and of 0 FTE and +$500 for environmental algorithm development for climate monitoring and to develop climate products.
A decrease of 0 FTE and -$2,000 is requested for the Global Winds Demonstration Project with the University of New Hampshire.
Base Increase/Decrease FTE Amount FTE Amount
Data Centers and Information Services 256 $64,333 0 -$4,194
The goal of this subactivity is to provide environmental data and information products and services to meet the needs of government, the public, and critical economic sectors.
An increase of 0 FTE and +$2,750 is requested to develop an improved climate data and information delivery service that will be nationally coordinated to provide regional climate services and assessments; of 0 FTE and +$1,100 to develop the next generation of environmental information providing online climate information and statistics especially valuable to the energy sector; of 0 FTE and +$800 to update the World Oceans Database to transition from research and development to sustained operational service; of 0 FTE and +$500 to provide stable funding for extending America’s climate record--Paleoclimatology; and of 0 FTE and +$292 for establishing a long-term archive for Solar X-ray Imager data from Geostationary satellites.
Reduced funding of 0 FTE and -$9,636 is requested to continue the Climate Data Base Modernization and Utilization program at a sufficient level to meet National Environmental Satellite, Data, and Information Service program needs. This will allow entry of climate records, archive services, database development, and online services.
Program Support
Corporate Services 933 $72,337 +8 +$7,500
An increase of 0 FTE and +$2,146 is requested for the Under Secretary and Associate Offices to maintain a minimum level of funding necessary to provide centralized executive management; of 0 FTE and +$1,354 to adequately fund policy formulation and direction operations; and of +8 FTE and +$4,000 to develop a comprehensive, enterprise-wide approach to information technology (IT) security throughout NOAA. This program is being developed in coordination with the department’s overarching IT security effort.
Facilities 15 $16,635 0 +$7,952
An increase of 0 FTE and +$2,700 is requested for a multi-year plan to eliminate numerous health and safety issues at various NOAA facilities; of 0 FTE and +$702 for operations and maintenance of the Western Regional Center in Seattle, which is falling into disrepair; of 0 FTE and +550 for investigation of opportunities for improved energy management across NOAA; and of 0 FTE and +$4,000 for ongoing environmental contamination cleanup and restoration on the Pribilof Islands.
FY 2001 APPR and FY 2003 APP 221

National Oceanic and Atmospheric Administration
Base Increase/DecreaseFTE Amount FTE Amount
Marine and Aviation Operations 734 $99,307 +80 +$9,465
All costs of ongoing maintenance, minor repairs, and planning for future fleet modernization and replacement efforts are accounted for in this subactivity. Expenditures for future fleet modernization activities are accounted for in the Procurement, Acquisition, and Construction account.
Increased funding is requested for operating expenses of the recommissioned FAIRWEATHER (+62 FTE and +$4,100) and the new Agate Pass (YTT) vessel (+2 FTE and +$350); to increase the number of days at sea for UNOLS vessels to support research in the Pacific Ocean and Alaskan waters (0 FTE and +$2,500); and to increase NOAA Corps billets to 254 (+16 FTE and +$815). The additional NOAA Corps officers are needed to operate NOAA ships and aircraft, which will allow more flexible scheduling for all officers. Increases of 0 FTE and +$250 are also requested for maintenance of the AGATE PASS, which is larger and more sophisticated than the vessel it will replace; of 0 FTE and +$450 for maintenance of the FAIRWEATHER; and of 0 FTE and +$1,000 to perform depot-level maintenance of the WP-3D hurricane hunter aircraft.
Procurement, Acquisition, and Construction (PAC)
The PAC account captures the nonrecurring costs of acquiring and improving capital assets used by NOAA in carrying out its varied missions. This account is grouped into three common activities: systems acquisition, which contains projects associated with modernizing NOAA’s weather services, including satellite procurements; construction, which contains projects involving new construction, or major modification of existing facilities; and fleet replacement, which contains funding to support modernization of NOAA’s fleet of research vessels either through new construction, major modification to existing vessels, or long term acquisition of capacity from third parties.
National Ocean Service (NOS)
Systems Acquisition 0 $8,412 0 +$11,600
Increased funding of 0 FTE and +$1,600 is requested to meet core National Estuarine Research Reserve System construction and land acquisition needs and opportunities for partnership and of 0 FTE and +$10,000 to address system-wide construction and renovation needed at the National Marine Sanctuaries.
National Marine Fisheries Service (NMFS)
Construction 0 $3,000 0 +$14,000
Increased funding of 0 FTE and +$2,000 is requested to begin the third phase of an ongoing renovation project of the Galveston fisheries laboratory complex and of 0 FTE and +$12,000 to begin construction of a new Honolulu fisheries laboratory including possible consolidation with a new Western Pacific Regional Office.
Oceanic and Atmospheric Research (OAR)
Systems Acquisition 0 $11,350 0 -$766
Reduced funding of 0 FTE and -$766 is needed at the Geophysical Fluids Dynamics Laboratory to maintain a multi-year acquisition for a state-of-the-art high performance computing system for climate research.
222 FY 2001 APPR and FY 2003 APP

National Oceanic and Atmospheric Administration
National Weather Service (NWS)
Base Increase/DecreaseFTE Amount FTE Amount
Systems Acquisition 55 $57,098 0 +$7,848
Increased funding is required as follows: to accelerate the Radiosonde Network Replacement effort to improve availability of critical data, reduce spiraling maintenance costs, and avoid radiospectrum interference (0 FTE and +$2,000); to increase weather and climate supercomputing capability to meet the NWS’s long term goals for improving weather and climate forecasts and products (0 FTE and +$6,160); and to provide backup capability to the weather and climate supercomputer to eliminate a single point of failure for weather and climate forecasts (0 FTE and +$7,148).
No funding is needed for NWS’s Telecommunications Gateway backup as the capital acquisition is complete (0 FTE and -$7,460).
Construction 0 $10,630 0 $0
This activity funds renovation and replacement of weather forecast offices in the continental United States, Alaska, and the Pacific Islands. No additional funding is needed in FY 2003.
National Environmental Satellite, Data, and Information Service (NESDIS)
Systems Acquisition 100 $559,035 0 +$40,360
Increases are requested to continue the triagency acquisition of the next generation polar-orbiting satellite (0 FTE and +$79,850) and to provide a backup site to protect NESDIS’s satellite data processing and distribution capability (0 FTE and +$2,800). Increases of 0 FTE and +$6,000 are also requested for a joint venture with the National Aeronautics and Space Administration (NASA) to develop a coastal ocean remote sensing imager for Geostationary satellites that will permit high resolution observations of harmful algal blooms, hypoxia, and volcanic ash and of 0 FTE and +$3,000 for data processing and archiving of information from NASA’s Earth Observing System Satellites to take the first steps toward making operational use of these datasets.
Decreases are proposed for the polar-orbiting satellite K-N’ procurement as the series nears completion (0 FTE and -$16,214); and for the Geostationary satellite acquisition program, reflecting the phasing down of the GOES I-M procurement and a series of successful launches (0 FTE and -$35,076).
Construction 0 $3,550 0 +$9,890
An increase of 0 FTE and +$8,890 is requested for the new Suitland satellite operations command and control center for building outfitting, increased security measures, and continuity of operations; and of 0 FTE and +$1,000 for continuing a multi-year program to rehabilitate the Fairbanks and Wallops satellite control facilities at Fairbanks and Wallops and to improve security there.
Program Support
Systems Acquisition 35 $17,127 0 +$7,394
Increased funding of 0 FTE and +$8,400 is requested to upgrade the instrumentation on the Gulfstream IV hurricane surveillance aircraft to improve storm-tracking forecasts.
FY 2001 APPR and FY 2003 APP 223

National Oceanic and Atmospheric Administration
Reduced funding of 0 FTE and -$1,006 is requested for the Commerce Administrative Management System, which will become the financial system of record for NOAA in FY 2003.
Base Increase/Decrease FTE Amount FTE Amount
Fleet Replacement 0 $5,400 0 +$48,659
An increase of 0 FTE and +$3,185 is required for major repair of the WHITING hydrographic survey vessel and of 0 FTE and +$45,474 for acquisition of an acoustically quiet Fisheries Research Vessel to replace the 40-year old ALBATROSS IV.
Other Accounts
Pacific Coastal Salmon Recovery
The Pacific Coastal Salmon Recovery account was established in FY 2000 to share the costs of state, local, and tribal salmon conservation initiatives. This fund supports NOAA’s contribution to a broad interdepartmental initiative to bolster and integrate federal capabilities to assist in the conservation of at-risk salmon runs in California, Oregon, Washington, and Alaska. Grants are matched with 25% nonfederal contributions. The fund was established under the Secretary of Commerce’s existing authorities under the Endangered Species Act and is made available through agreements with the governors of each state for distribution to state, local, and tribal efforts. The Secretary has established terms and conditions to ensure effective use of the funds, as well as specific reporting requirements to ensure full accountability by users of the fund. NOAA is requesting a decrease of $47.4 million from the enacted level. Included in the request is funding to capitalize the Northern and Southern Transboundary Funds.
224 FY 2001 APPR and FY 2003 APP

National Oceanic and Atmospheric Administration
Targets and Performance Summary
Performance Goal 1: Build sustainable fisheries FY 1999 FY 1999 FY 2000 FY 2000 FY 2001 FY 2001 FY 2002 FY 2003
Measure Target Actual Target Actual Target Actual Target Target Reduce the Number of Overfished Major Stocks of Fish from 56 to 45 by FY 2007 Reduce the Number of Major Stocks with an "Unknown" Stock Status to No More than 98 by FY 2007 Increase the Percentage of Plans to Rebuild Overfished Major Stocks to Sustainable Levels
New New New 56 New N/A1 55 55
New New New 120 New N/A1 120 118
New New New 93% New N/A1 94% 96%
Performance Goal 2: Sustain healthy coasts FY 1999 FY 1999 FY 2000 FY 2000 FY 2001 FY 2001 FY 2002 FY 2003
TargetMeasure Target Actual Target Actual Target Actual Target Number of Acres of Coastal Habitat Benefited (Cumulative)
New New New New New 116,000 122,000 132,000
Reduce Introductions and Effects of Invasive Species in a Total of Six Regions within the United States
1 0 1 1 2 2 2 2
Percentage of U.S. Shoreline and Inland Areas that Have Improved Ability to Reduce Coastal Hazard Impacts
5% 5% 14% 6% 6% 6% 15% 15%
Performance Goal 3: Recover protected species FY 1999 FY 1999 FY 2000 FY 2000 FY 2001 FY 2001 FY 2002 FY 2003
TargetMeasure Target Actual Target Actual Target Actual Target Reduce by 10 (from a FY 2000baseline of 27) by FY 2007, theNumber of Threatened Species atRiskIncrease the Number ofCommercial Fisheries that HaveInsignificant Marine MammalMortalityReduce by 11 (from a FY 2000baseline of 29) by FY 2007, theNumber of Endangered Speciesat Risk of Extinction
New New New New 2 2 2 5
New New New New 2 2 6 6
New New New New 3 3 6 6
1 Pending release of the Report to Congress, Status of Fisheries of the United States, 2001.
FY 2001 APPR and FY 2003 APP 225
National Oceanic and Atmospheric Administration
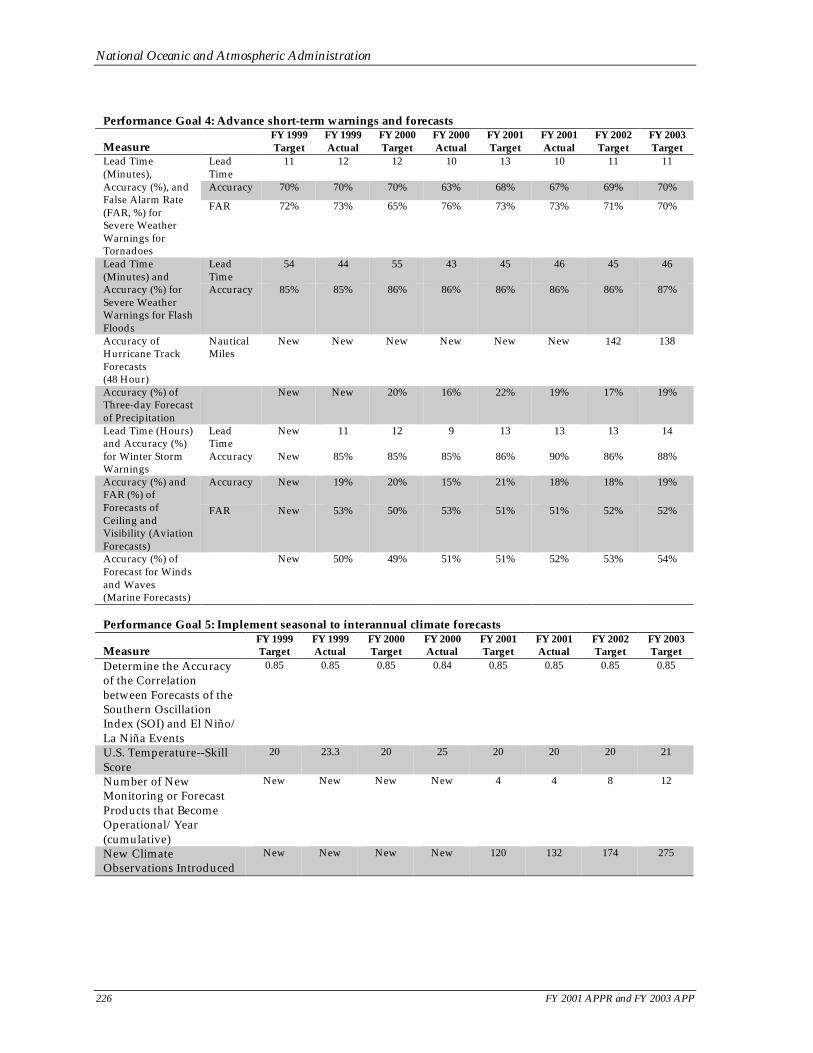
Performance Goal 4: Advance short-term warnings and forecasts FY 1999 FY 1999 FY 2000 FY 2000 FY 2001 FY 2001 FY 2002 FY 2003
Measure Target Actual Target Actual Target Actual Target Target Lead Time Lead 11 12 12 10 13 10 11 11 (Minutes), Time Accuracy (%), and Accuracy 70% 70% 70% 63% 68% 67% 69% 70% False Alarm Rate FAR 72% 73% 65% 76% 73% 73% 71% 70%(FAR, %) for Severe Weather Warnings for Tornadoes
Lead Time
54 44 55 43 45 46 45 46Lead Time (Minutes) and Accuracy (%) for Severe Weather Warnings for Flash Floods
Accuracy 85% 85% 86% 86% 86% 86% 86% 87%
Accuracy of Hurricane Track Forecasts (48 Hour)
Nautical Miles
New New New New New New 142 138
Accuracy (%) of Three-day Forecast of Precipitation
New New 20% 16% 22% 19% 17% 19%
Lead Time
New 11 12 9 13 13 13 14Lead Time (Hours) and Accuracy (%) for Winter Storm Warnings
Accuracy New 85% 85% 85% 86% 90% 86% 88%
Accuracy New 19% 20% 15% 21% 18% 18% 19%Accuracy (%) and FAR (%) of Forecasts of Ceiling and Visibility (Aviation Forecasts)
FAR New 53% 50% 53% 51% 51% 52% 52%
Accuracy (%) of Forecast for Winds and Waves (Marine Forecasts)
New 50% 49% 51% 51% 52% 53% 54%
Performance Goal 5: Implement seasonal to interannual climate forecasts FY 1999 FY 1999 FY 2000 FY 2000 FY 2001 FY 2001 FY 2002 FY 2003
Measure Determine the Accuracyof the Correlationbetween Forecasts of theSouthern OscillationIndex (SOI) and El Niño/La Niña EventsU.S. Temperature--SkillScoreNumber of NewMonitoring or ForecastProducts that BecomeOperational/Year(cumulative)
Target Actual Target Actual Target Actual Target Target 0.85 0.85 0.85 0.84 0.85 0.85 0.85 0.85
20 23.3 20 25 20 20 20 21
New New New New 4 4 8 12
New Climate Observations Introduced
New New New New 120 132 174 275
226 FY 2001 APPR and FY 2003 APP

National Oceanic and Atmospheric Administration
Performance Goal 6: Predict and assess decadel to centennial climate change
Measure
FY 1999
Target
FY 1999
Actual
FY 2000
Target
FY 2000
Actual
FY 2001
Target
FY 2001
Actual FY 2002 Target FY 2003 Target
Assess and New New New New New New Establish Five Reduce Model Carbon New Pilot Uncertainty of Sources and Atmospheric Atmospheric Sinks Profiling Sites and Estimates of U.S. throughout Four New Oceanic Carbon Balance to the United Carbon Tracks ± 50% States Assess and New New New New New New Establish Three Complete a Model Carbon New Global Working Sources and Background Sites Prototype of a Sinks as Part of the Coupled Carbon-Globally Global Flask climate Model
Network Determine Actual Long-term Changes in Temperature and Precipitation throughout the United States
New New New New New New Capture More than 25% of True Contiguous U.S. Precipitation Trend
Capture More than 70% of True Contiguous U.S. Temperature Trend and Capture More than 40% of True Contiguous U.S. Precipitation Trend
Results of 90% of the Research Activities Cited in the 2001 Intergovernm ental Panel on Climate Change’s Third Assessment of Climate Change
New New New New New New 100% Cited N/A 2
2 Data collected and measured only every five years.
Performance Goal 7: Promote safe navigation FY 1999 FY 1999 FY 2000 FY 2000 FY 2001 FY 2001 FY 2002 FY 2003
TargetMeasure Target Actual Target Actual Target Actual Target Reduce the 20.7% 20.7% 24.3% 24.3% 27.8% 31.2% 35.0% 38.3% Hydrographic Survey Backlog (Square Nautical Miles) for Critical Navigation Areas (Cumulative Percentage) Percentage of National Spatial Reference System Completed (Cumulative)
59% 59% 64% 71% 75% 75% 78% 82%
FY 2001 APPR and FY 2003 APP 227

National Oceanic and Atmospheric Administration
Resource Requirements Summary (Dollars in Millions; Funding amounts reflect total obligations.)Information Technology (IT)Full-Time Equivalent (FTE)
Performance Goal 1: Build sustainable fisheries FY 1999 FY 2000 FY 2001 FY 2002 FY 2003 Increase / FY 2003 Enacted Enacted Enacted Enacted Base Decrease Request
Operations, Research, and Facilities
National Ocean Service 9.2 9.1 0.0 9.9 9.9 0.0 9.9 National Marine 291.4 309.1 439.1 380.9 378.6 21.8 400.4
Fisheries Service NOAA Research 35.1 37.1 93.0 41.4 36.1 (24.0) 12.1 Program Support 26.2 21.6 18.7 41.5 43.8 2.0 45.8
Procurement, Acquisition, and 10.11 61.81 - - - - -Construction
National Marine Fisheries Service
- - 62.5 37.2 3.0 12.0 15.0
Program Support - - 3.7 13.8 8.2 45.4 53.6 Other Accounts 32.41 2.91 - - - - -
Discretionary—National - - 2.4 1.4 1.1 0.0 1.1 Marine Fisheries Service
Mandatory—National Marine Fisheries Service
- - 6.9 21.5 9.7 0.0 9.7
Mandatory--Program Support - - 3.5 3.7 8.4 0.0 8.4 Total Funding 404.4 441.6 629.8 551.3 498.8 57.2 556.0 IT Funding2 24.5 13.5 17.9 26.7 N/A N/A 31.6 FTE 2,330 2,205 2,053 2,033 N/A N/A 2,078
Performance Goal 2: Sustain healthy coasts FY 1999 FY 2000 FY 2001 FY 2002 FY 2003 Increase / FY 2003 Enacted Enacted Enacted Enacted Base Decrease Request
Operations, Research, and Facilities
National Ocean Service 152.6 165.0 275.8 280.8 249.5 0.7 250.2 National Marine 17.1 17.3 23.0 25.2 21.8 1.3 23.1
Fisheries Service NOAA Research 63.2 58.4 28.3 82.4 69.9 (38.3) 31.6
National Environmental 6.2 6.2 4.0 4.8 4.8 0.0 4.8 Satellite, Data, and Information Service
Program Support 6.7 7.9 14.9 25.7 23.8 4.8 28.6 Procurement, Acquisition, and 11.11 16.31 - - - - -Construction
National Ocean Service - - 53.9 87.8 8.4 11.6 20.0 NOAA Research - - 14.0 0.0 0.0 0.0 0.0 Program Support - - 3.5 5.2 2.8 (1.0) 1.8
Other Accounts 4.01 7.51 - - - - -Discretionary--National - - 152.9 0.0 0.0 0.0 0.0
Ocean Service Mandatory--National
Ocean Service - - 0.0 10.4 5.6 0.0 5.6
Mandatory--Program Support - - 2.6 2.8 6.2 0.0 6.2 Total Funding 260.9 278.6 572.9 525.1 392.8 (20.9) 371.9 IT Funding2 N/A 2.1 16.2 18.5 N/A N/A 18.4 FTE 890 509 1,047 1,077 N/A N/A 1,057
228 FY 2001 APPR and FY 2003 APP

National Oceanic and Atmospheric Administration
Performance Goal 3: Recover protected species FY 1999 FY 2000 FY 2001 FY 2002 FY 2003 Increase / FY 2003 Enacted Enacted Enacted Enacted Base Decrease Request
Operations, Research, and Facilities
National Ocean Service 0.0 0.30 0.0 3.0 3.0 0.0 3.0 National Marine 74.1 90.2 172.0 173.1 168.7 11.3 180.0
Fisheries Service NESDIS 1.2 0.0 0.0 0.0 0.0 0.0 0.0 NOAA Research 0.3 0.3 0.0 0.4 0.4 0.0 0.4 Program Support 3.2 4.6 8.5 18.7 18.3 1.0 19.3
Procurement, Acquisition, and 0.61 - - - - - -Construction
National Marine Fisheries Service
- - 0.0 0.0 0.0 2.0 2.0
Program Support - - 9.8 8.3 1.8 (0.3) 1.5 Other Accounts - 58.01 - - - - -
Discretionary--National - - 109.8 157.4 150.0 (40.0) 110.0 Marine Fisheries Service
Mandatory--Program Support - - 1.2 1.3 2.9 0.0 2.9 Total Funding 79.4 153.4 301.3 362.2 345.1 (26) 319.1 IT Funding2 24.5 7.2 7.0 9.4 N/A N/A 11.0 FTE 575 519 813 818 N/A N/A 846
Performance Goal 4: Advance short-term warnings and forecasts FY 1999 FY 2000 FY 2001 FY 2002 FY 2003 Increase / FY 2003 Enacted Enacted Enacted Enacted Base Decrease Request
Operations, Research, and Facilities
NOAA Research 56.8 61.6 49.7 50.4 50.2 10.4 57.7 National Weather Service 547.8 587.0 629.0 670.5 709.0 14.4 723.4 NESDIS 54.4 54.0 56.2 73.2 78.3 8.7 87.0 Program Support 43.9 41.2 49.0 51.3 58.4 4.1 64.5
Procurement, Acquisition, and 566.51 517.11 - - - - -Construction
NOAA Research - - 3.0 16.0 0.0 0.0 0.0 National Weather Service - - 63.4 70.7 67.7 7.9 75.6 NESDIS - - 515.0 561.9 562.6 47.2 609.8 Program Support - - 8.5 7.6 7.7 8.7 16.4
Other Accounts - - - - - - -Mandatory – Program Support - - 2.2 2.3 5.1 0.0 5.1
Total Funding 1,269.4 1,260.9 1,376 1,503.9 1,539.0 101.4 1,639.5 IT Funding1 160.9 290.3 241.1 266.6 N/A N/A 275.0 FTE 6,351 5,812 5,997 6,023 N/A N/A 6,092
Performance Goal 5: Implement Seasonal to Interannual Climate Forecasts FY 1999 FY 2000 FY 2001 FY 2002 FY 2003 Increase / FY 2003 Enacted Enacted Enacted Enacted Base Decrease Request
Operations, Research, and Facilities
NOAA Research 63.6 70.5 58.5 83.1 82.6 0.3 78.9 National Weather Service 4.7 4.7 0.4 1.9 1.9 0.0 1.9 NESDIS 40.0 41.6 61.8 63.9 63.8 (4.2) 59.6 Program Support 3.6 4.3 4.0 10.4 10.0 1.6 11.6
Procurement, Acquisition, and 0.61 - - - - - -Construction
Program Support - - 0.8 0.8 0.7 0.0 0.7 Other Accounts - - - - - - -
Mandatory – Program Support - - 1.4 1.5 3.3 0.0 3.3 Total Funding 112.5 121.1 126.9 161.6 162.3 (2.3) 156 IT Funding1 20.4 22.8 35.8 29.3 N/A N/A 28.1 FTE 549 350 323 367 N/A N/A 366
FY 2001 APPR and FY 2003 APP 229

National Oceanic and Atmospheric Administration
Performance Goal 6: Predict and Assess Decadal to Centennial Change FY 1999 FY 2000 FY 2001 FY 2002 FY 2003 Increase / FY 2003 Enacted Enacted Enacted Enacted Base Decrease Request
Operations, Research, and Facilities
NOAA Research 67.9 69.2 97.8 97.4 95.3 25.5 115.4 National Weather Service 8.2 9.7 0.0 0.0 0.0 0.0 0.0 NESDIS 8.2 6.3 3.0 0.5 0.5 0.0 0.5 Program Support 5.1 5.2 3.5 11.9 12.5 4.2 16.7
Procurement, Acquisition, and 0.61 4.91 - - - - -Construction
NOAA Research - - 6.0 11.7 11.3 (0.7) 10.6 NESDIS - - 0.0 0.0 0.0 3.0 3.0 Program Support - - 0.7 0.6 0.6 0.1 0.7
Other Accounts - - - - - - -Mandatory – Program Support - - 0.9 1.0 2.2 0.0 2.2
Total Funding 90.0 95.3 111.9 123.1 122.4 32.1 149.1 IT Funding1 9.6 22.1 18.9 25.0 N/A N/A 26.7 FTE 485 127 370 456 N/A N/A 470
Performance Goal 7: Promote Safe Navigation FY 1999 FY 2000 FY 2001 FY 2002 FY 2003 Increase / FY 2003 Enacted Enacted Enacted Enacted Base Decrease Request
Operations, Research, and Facilities
National Ocean Service 92.2 98.4 114.4 120.2 112.1 10.1 122.2 NOAA Research 0.39 0.39 0.0 0.9 0.9 0.0 0.9 Program Support 4.9 5.7 5.5 21.0 21.6 5.1 26.7
Procurement, Acquisition, and Construction
- - - - - - -
Program Support - - 12.6 26.1 0.9 3.1 4.0 Other Accounts - - - - - - -
Mandatory – Program Support - - 3.5 3.7 8.4 0.0 8.4 Total Funding 97.49 104.49 136.0 171.9 143.9 18.3 162.2 IT Funding1 3.9 9.7 22.8 17.5 N/A N/A 19.0 FTE 878 807 870 811 N/A N/A 878
230 FY 2001 APPR and FY 2003 APP

National Oceanic and Atmospheric Administration
Grand Total FY 1999 FY 2000 FY 2001 FY 2002 FY 2003 Increase / FY 2003 Enacted Enacted Enacted Enacted Base Decrease Request
Operations, Research, and Facilities
National Ocean Service 254.0 266.3 390.2 413.9 374.5 10.8 385.3 National Marine
Fisheries Service 382.6 416.6 634.1 579.2 569.1 34.4 603.5
NOAA Research 287.3 297.5 327.3 356.0 336.0 (39.0) 297.0 National Weather Service 560.7 601.4 629.4 672.4 710.9 14.4 725.3 NESDIS 100.6 101.8 125 142.4 147.4 4.5 151.9 Program Support 93.6 90.5 104.1 180.5 188.4 24.8 213.2
Procurement, Acquisition, and 589.51 600.11 - - - - -Construction
National Ocean Service - - 53.9 87.8 8.4 11.6 20.0 National Marine 62.5 37.2 3.0 14.0 17.0
Fisheries Service NOAA Research 23.0 27.7 11.3 (0.7) 10.6 National Weather Service - - 63.4 70.7 67.7 7.9 75.6 NESDIS - - 515.0 561.9 562.6 50.2 612.8 Program Support - - 39.6 62.4 22.7 56.0 78.7
Other Accounts 36.41 68.41 - - - - -Discretionary - - - - - - -National Marine
Fisheries Service - - 112.2 158.8 151.1 (40.0) 111.1
National Ocean Service - - 152.9 0.0 0.0 0.0 0.0 Mandatory - - - - - - -National Marine
Fisheries Service - - 6.9 21.5 9.7 0.0 9.7
National Ocean Service - - 0.0 10.4 5.6 0.0 5.6 Program Support - - 15.3 16.3 36.5 0.0 36.5
Total Funding 2,304.7 2,442.6 3,254.6 3,399.1 3,204.9 148.9 3,353.7 Direct 2,304.7 2,442.6 3,254.6 3,399.1 3,204.9 148.9 3,353.7 Reimbursable 256.0 290.6 204.0 212.0 217.0 (5.0) 212.0
IT Funding1 243.8 367.7 408.2 452.3 N/A N/A 470.2 FTE 12,058 10,329 11,472 11,513 N/A N/A 11,788
1 For FY 1999 and FY 2000, detailed stewardship portfolio spreads were not available for program support, PAC, and other accounts. 2 IT funding included in total funding.
Notes:NOAA changed its methodology for allocating support costs by Performance Goal to more accurately reflect the distribution ofthe budget across performance goal.Other Accounts/Mandatory/Program Support is a breakout of the CSRS funds.PAC/Program Support includes the distribution of CAMS.The differences between FY 1999 IT dollars and FY 2000, FY 2001, and FY 2002 amounts is a result of several factors: (1) Inprevious years, the amounts accounted for major projects only. We have expanded the definition of IT dollars to include allprojects identified in Exhibit 53, NOAA’s President’s Budget for FY 1999. (2) The FY 1999 amount for performance goal 3,“recover protected species,” was in error. This amount was inadvertently duplicated from performance goal 1, “buildsustainable fisheries.” The appropriate response should have been not applicable. (3) The apparent decrease in dollars forperformance goal 1, “build sustainable fisheries,” is actually a realignment of the stewardship portfolio.
Skill Summary
Marine ecologists, environmental educators, land use planners, toxicologists, economists, hydrologists, electronic technicians, hydrometeorological technicians, atmospheric scientists, computer specialists, instrumentation engineers, instrumentation technicians, physicists, mathematicians, electronic engineers, cartographers, photogrammetrists, geodesists, hydrographers, fishery biologists, fishery economists, oceanographers, engineers, chemists, meteorologists, physical scientists, and computer scientists.
FY 2001 APPR and FY 2003 APP 231
National Oceanic and Atmospheric Administration
IT Requirements
• National Marine Fisheries Service Fishing Information Technology System • Sustaining Healthy Coasts does not rely on any one IT system • National Marine Fisheries Service Fishing Information Technology System • Advanced Weather Interactive Processing System, Next Generation Weather Radar System,
Geostationary Operational Environmental Satellites Ground System, and Automated Surface Observing System
• Satellite Active Archive, NOAA Virtual Data System, National Environmental Data Archive and Access System, and Climate Prediction Centers Climate Computer
• Geophysical Fluid Dynamics Laboratory • Nautical Charting and Hydrographic Surveying System, Physical Oceanographic Real-time
Systems, and Data Processing and Analysis Subsystem for National Water Level Observation Network, and Geodetic Support System
232 FY 2001 APPR and FY 2003 APP

National Oceanic and Atmospheric Administration
Performance Goal 1: Build Sustainable Fisheries
Corresponding Strategic Goal
Strategic Goal 3: Observe and manage the Earth’s environment to promote sustainable growth
Rationale for Performance Goal
Billions of dollars in economic growth, thousands of jobs, and countless commercial and recreational fishing opportunities are wasted as a result of overfishing and overcapitalization in commercial and recreational fisheries. While many fisheries are well managed and produce positive benefits, others are severely depleted or overcapitalized and must be restored and managed to realize their long-term potential. Rebuilding and reducing overcapitalization in existing fisheries will promote the economic and biological sustainability of U.S. fishing resources. Building sustainable fisheries will increase greatly the nation’s wealth and quality of life.
The basis for this suite of performance measures is the sequence of events associated with building or rebuilding fisheries and sustaining them over time. In concept, these events occur in the following order. (1) The first task is to identify if a stock is overfished; the performance measure on stock assessment and reducing the number of unknown stocks addresses this step. (2) Once a stock has been classified as overfished, the National Oceanic and Atmospheric Administration (NOAA) is mandated to create a rebuilding plan by statute; the rebuilding performance measure addresses this outcome. (3) Each rebuilding plan will have a trajectory and timeframe to achieve the rebuilding objective of recovering the stock to sustainable levels; the performance measure describing the number of overfished stocks measures how closely this target and trajectory is being met and other measures for this goal that are important indicator measures of these influences.
Measure 1a: Reduce the Number of Overfished Major Stocks of Fish from 56 to 45 by FY 2007
100 Data Validation and Verification:
80
60
40
20
0
5555 56
Data source: NOAA’s National Marine Fisheries Service(NMFS) report to Congress, Status of Fisheries of the UnitedStatesFrequency: AnnualData storage: NMFS Office of Sustainable FisheriesVerification: Stock assessments and peer reviews (internaland outside the agency)Data limitations: NoneActions to be taken: None2000 2001 2002 2003
FY 1999 FY 2000 FY 2001 FY 2002 FY 2003Target New New New 55 55Actual New 56 N/A1
Met/Not Met 1 Pending release of the Report to Congress, Status of Fisheries of the United States, 2001.
FY 2001 APPR and FY 2003 APP 233

National Oceanic and Atmospheric Administration
Explanation of Measure
The purpose of this measure is to focus on the total number of overfished stocks defined as major stocks for which status is known; major stocks for which status is known numbers 167. A major stock is defined as a stock that yields catches of more than 200 thousand pounds (90.7 metric tons). There are approximately 905 stocks overall (as reported in the Annual Report to Congress), of which more than 600 are either unknown or undefined. The goal for this measure is to decrease the number of overfished major stocks from a FY 2000 baseline of 56 to 45 by 2007.
The term overfishing basically means that the harvest rate is above a prescribed threshold. Overfished means that the biomass of a given fishery’s stock is below a prescribed threshold. Overfished stocks are defined in the fisheries management plan.
NOAA is providing some financial assistance, such as a disaster relief program, to alleviate some of the hardship confronting fishermen during the course of rebuilding fisheries stocks.
Measure 1b: Reduce the Number of Major Stocks with an “Unknown” Stock Status to No More than 98 by FY 2007
200175 Data Validation and Verification:
150 125 100 75 50 25
0
118120120
2000 2001 2002 2003
Target Actual
Data source: NMFS report to Congress, Status of Fisheries ofthe United StatesFrequency: AnnualData storage: NMFS Office of Sustainable FisheriesVerification: Stock assessments and peer reviews (internaland outside the agency)Data limitations: NoneActions to be taken: None
FY 1999 FY 2000 FY 2001 FY 2002 FY 2003Target New New New 120 118Actual New 120 N/A1
Met/Not Met1 Pending release of the Report to Congress, Status of Fisheries in the United States, 2001.
Explanation of Measure
The purpose of this measure is to track the progress of improving knowledge about the status ofmajor stocks as defined in the annual report to Congress. In many cases the current status of stocksunder NOAA fisheries authority remains unknown.
Not all unknown stocks are of equal importance; parameters such as the value and quantity ofcatches or known role in the ecosystem as key predators or prey determine a stock’s level ofimportance. This metric reports on the outcome of investments in staff and data acquisition, such ascharter and research vessel days-at-sea and stock assessment methodological research.It is worth noting that the status of a large number of stocks continues to be classified as eitherunknown or undefined, which means that an overfishing definition is not possible. Of the 905 stocks
234 FY 2001 APPR and FY 2003 APP

National Oceanic and Atmospheric Administration
mentioned in the 2001 report to Congress, the status of more than 600 was either unknown or was classified as undefined. The vast majority of these unknown or undefined stocks are classified as minor stocks. Minor stocks, in fact, accounted for 83% of the stocks whose status were either unknown or undefined, while only 17% of the unknown and undefined stocks were categorized as major. The goal for this measure is to reduce the number of major stocks with an unknown status to no more than 98 by FY 2007.
Measure 1c: Increase the Percentage of Plans to Rebuild Overfished Major Stocks to Sustainable Levels
100 93 96 Data Validation and Verification: 80
94
Per
cen
tage
60
40
Data source: NMFS report to Congress, Status of Fisheries ofthe United StatesFrequency: AnnualData storage: NMFS Office of Sustainable FisheriesVerification: Stock assessments and peer reviews (internaland outside the agency)Data limitations: NoneActions to be taken: None
20
0 2000 2001 2002 2003
Target Actual
FY 1999 FY 2000 FY 2001 FY 2002 FY 2003Target New New New 94% 96%Actual New 93% N/A Met/Not Met
1 Pending release of the Report to Congress, Status of Fisheries in the United States, 2001.
Explanation of Measure
This measure relates directly to the statutory requirements of the Magnuson Stevens Act that require regional councils to develop rebuilding plans for stocks of fish that have been identified as overfished. By maintaining this measure as a percentage, NOAA can measure its performance in putting together an approved rebuilding plan within the 18 month expected timeframe. This measure is also best represented as a percentage because to do otherwise would show an inaccurate negative trend where one does not exist. For example, the target for FY 2002 is to have 94% of rebuilding plans in place for 55 overfished major stocks (55x0.94+52). Eventually, the target is to have 100% rebuilding plans in place by FY 2007, which by then, the number of overfished stocks will be at 45 (45x1.0=45).
Year Overfished Stocks Percent
Total Number of Overfished Stocks with Rebuilding
Plans in Place FY 2002 = 55 x 0.94 = 51 stocks FY 2003 = 55 x 0.96 = 53 stocks FY 2004 = 52 x 0.97 = 50 stocks FY 2005 = 47 x 0.98 = 46 stocks FY 2006 = 46 x 0.99 = 46 stocks FY 2007 = 45 x 45 stocks = 1.00
The Magnuson Stevens Act outlines specific parameters and timeframes for rebuilding. At this point in time, major and minor stocks have been differentiated to highlight the relative priorities and
FY 2001 APPR and FY 2003 APP 235

National Oceanic and Atmospheric Administration
complexities of producing a rebuilding plan and the consequent impact on performance measurement. Measurement of this metric will occur in the annual status of stocks report to Congress.
FY 2001 Program Evaluation for Performance Goal 1: Build Sustainable Fisheries
Virtually every aspect of NMFS fisheries science program is peer reviewed, either internally within NMFS or outside the agency by, for example, the National Academy of Sciences or the National Science Foundation. NMFS also relies on extensive informal networks of university partnerships and laboratories throughout the nation. Moreover, opposing parties’ scientists in the court system often perform reviews by when fisheries management decisions are litigated.
Discontinued Measure
Fewer Overfished Fisheries (Currently 86 of 279 Stocks Are Overfished; by FY 2005, 25%, or 22, of These 86 Stocks Will No Longer Be Overfished)
FY 1999 FY 2000 FY 2001 FY 2002 FY 2003 Target -4% -8% 1% Discontinued DiscontinuedActual -4% -7% 1% Met/Not Met Met Met Met
Data Validation and Verification:
Data source: NMFS report to Congress, Status of Fisheries of the United StatesFrequency: AnnualData storage: NMFS Office of Sustainable FisheriesVerification: Stock assessments and peer reviews (internal and outside the agency).Data limitations: NoneActions to be taken: None
Explanation of Measure
The performance measure to reduce the number of overfished stocks has been modified. As more research is conducted, some stocks of fish that had an unknown status will be identified as either overfished or not overfished. This identification changes the baseline from which changes are measured. To eliminate confusion about changing target levels for particular years because of changes in assumptions and baseline conditions, the measure has been modified. The new measure differentiates the rate of change between major and minor stocks.
However, for purposes of tracking this measure, it is worth noting that of the original 86 overfished fisheries identified in NOAA’s 1997 fisheries report to Congress (the basis for this measure), 13 have been removed from the overfished category and 73 remain. NOAA is on track to meet the goal of a 25% reduction (or 22 of 86) of overfished stocks.
Stocks Having Sufficient Essential Fish Habitat (60% by FY 2005)
FY 1999 FY 2000 FY 2001 FY 2002 FY 2003 Target New 10% 40% Discontinued Discontinued
Met/Not Met Met Actual New 10% Undetermined
236 FY 2001 APPR and FY 2003 APP

National Oceanic and Atmospheric Administration
Data Validation and Verification:
Data source: Regional offices of NOAA/NMFSFrequency: AnnualData storage: Regional offices of NOAA/NMFSVerification: Interagency and internal peer reviewData limitations: NoneActions to be taken: None
Explanation of Measure
After review, NOAA decided to discontinue using this measure because it was not supported by research and not connected to management. Because knowledge about life history needs is incomplete, NOAA cannot determine when a species or stock has sufficient essential fish habitat to support a sustainable and healthy population level. Furthermore, without a baseline determination of a species’ needs for essential fish habitat, there is no way to determine which stocks have sufficient essential fish habitat. Given those realities, measuring percentage progress by fiscal year is unsupportable.
Increase in Employment in Noncapture Fishing and Other Sectors in Fishing Communities (9% by FY 2005)
FY 1999 FY 2000 FY 2001 FY 2002 FY 2003 Target New 1% 2% Discontinued DiscontinuedActual New Undetermined Undetermined Met/Not Met N/A
Data Validation and Verification:
Data source: U.S. Department of Commerce’s Bureau of Economic Analysis (BEA) and NMFSFrequency: AnnualData storage: BEA and NMFSVerification: BEA and/or NMFS have been consulted and may provide the information and verification.Data limitations: BEA statistical data is by county, not by fishing communityActions to be taken: None
Explanation of Measure
Two factors contributed to the removal of this performance measure. First, the measure is not an accurate reflection of the roles and responsibilities of NOAA. This performance measure reported on NOAA’s ability to increase and ensure nonfishing employment within fishing communities. However, in practice NMFS does not have the authority to develop and manage programs that will impact nonfishing employment, except in rare circumstances where fishery disasters have been declared and one-time authorizing legislation identifies targeted communities for relief using one-time appropriations. This is not a primary objective within the NMFS stewardship mission and could only be secondarily affected by a few agency base programs such as loan guarantee programs for aquaculture. Second, data to measure progress for the measure are not available. NMFS, in collaboration with BEA, conducted an analysis of available data to determine its utility for tracking this performance measure. The data were found to be lacking, primarily due to the fact that the commercial fishing industry does not generally participate in state unemployment compensation programs, which are means tracked by Bureau of Labor Statistics programs to measure employment by sector. Moreover, the Bureau of Labor Statistics’ standard industrial classification indices aggregate fisheries data at too high a level to determine any fisheries’ or noncapture fisheries’ effects.
FY 2001 APPR and FY 2003 APP 237

National Oceanic and Atmospheric Administration
Increase in Economic Contribution of Sustainable Aquaculture to Gross Domestic Product (17% by FY 2005)
FY 1999 FY 2000 FY 2001 FY 2002 FY 2003 Target New 2% 4% Discontinued DiscontinuedActual New N/A Undetermined Met/Not Met
Data Validation and Verification:
Data source: NMFS, BEA, and the U.S. Department of Agriculture (USDA)Frequency: AnnualData storage: BEA, NMFS, and USDAVerification: Discussions with BEA have been initiated, and a satellite account to provide aquaculture economicinformation may be established.Data limitations: NMFS data are reported about 18 months after the end of a calendar year. The first USDA aquaculturecensus occurred in 1998 and will be reported only every third year.Actions to be taken: None
Explanation of Measure
At the time this measure was created, the expectation was that sound, research-driven, federal investment in marine aquaculture research would spur private investment in aquaculture production. NOAA’s aquaculture programs focus on research in genetics, feed, disease, culture systems, environmental standards, and production technologies. Although these research programs are exemplary, they do not trigger the private sector investment in production facilities that would result in measurable changes in national gross domestic product. Other fundamental impediments to expansion of aquaculture’s contribution to gross domestic product, such as access to investment capital and cheap labor, are beyond NMFS’s mission. Thus, this performance measure is being discontinued simply because the linkages between NMFS program performance in aquaculture research and aquaculture’s contribution to the nation’s gross domestic product do not exist.
Cross-cutting Activities
Intra-Department of Commerce
NOAA will focus on reducing overfishing and overcapitalization of U.S. fishery resources by improving stock assessment and prediction, improving essential fisheries habitat, and reducing fishing pressure, including downsizing of fishing fleets. The Department of Commerce, enlisting the support of key bureaus such as the Economic Development Administration, the Minority Business Development Agency, and the National Institute of Standards and Technology, will play a key role in mitigating the impact of these critical resource conservation decisions in the transition to economically sustainable communities.
Other Government Agencies
The Department of Commerce will also enlist the support of other federal agencies, such as USDA, the Small Business Administration, and the U.S. Department of Labor, to mitigate the effect of resource conservation decisions.
238 FY 2001 APPR and FY 2003 APP

National Oceanic and Atmospheric Administration
External Factors and Mitigation Strategies
Various external factors may affect NOAA’s ability to reach its targets. These factors include the impact of climate and other natural conditions, such as El Niño, on biological stocks. In addition, the effect of national and/or local economic conditions may affect NOAA’s ability to reach certain targets.
FY 2001 APPR and FY 2003 APP 239

National Oceanic and Atmospheric Administration
Performance Goal 2: Sustain Healthy Coasts
Corresponding Strategic Goal
Strategic Goal 3: Observe and manage the Earth’s environment to promote sustainable growth
Rationale for Performance Goal
The National Oceanic and Atmospheric Administration (NOAA) has three primary objectives to sustain healthy coastal ecosystems and the communities and economies that depend on them. These are to (1) protect, conserve, and restore coastal habitats and their biodiversity; (2) promote clean coastal waters; and (3) foster well-planned and revitalized coastal communities. To meet these objectives, NOAA integrates a broad range of research, assessment, and management activities from four of NOAA’s five line offices: the National Ocean Service (NOS), the Office of Oceanic and Atmospheric Research (OAR), the National Marine Fisheries Service (NMFS), and the National Environmental Satellite, Data, and Information Service. NOAA works with many governmental and nongovernmental partners at local, state, national, and international levels to address the critical challenges facing coastal areas. NOAA measures its performance in meeting these objectives by tracking key outcomes, such as the acres of coastal habitat restored, changes in coastal water quality, number of coastal states with effective nonpoint pollution control programs, and the percentage of U.S. shoreline covered by improved ability to identify and mitigate the impacts of natural hazards.
Measure 2a: Number of Acres of Coastal Habitat Benefited (Cumulative)
300,000 250,000 200,000 150,000 100,000
50,000 0
122,
000
132,
000
1160
00
Data Validation and Verification:
Data source: Primary source is NMFS’s Office of HabitatConservation; NOS provides additional inputFrequency: AnnualData storage: NMFS’s Habitat Office will collectinformation, conduct assessments, and store data.Verification: NMFS’s Habitat Office will collect quality-controlled data to ensure performance data criteria arebeing met.Data limitations: NoneActions to be taken: None
2001 2002 2003
Target Actual
FY 1999 FY 2000 FY 2001 FY 2002 FY 2003Target New New New 122,000 132,000Actual New New 116,000 Met/Not Met
Explanation of Measure
This measure, which tracks “acres benefited,” replaces a discontinued measure that tracked “acres restored.” This measure includes acres benefited by NMFS-sponsored projects funded under the Coastal Wetlands Planning, Protection, and Restoration Act (CWPPRA). For a brief period the measure was changed to “acres restored,” which does not accurately reflect the results of the program. The discontinued measure was recalibrated in FY 2001 and replaced with the more accountable measure of acres benefited. The new baseline includes acres benefited by NMFS-
240 FY 2001 APPR and FY 2003 APP

National Oceanic and Atmospheric Administration
sponsored projects funded under CWPPRA. Acres benefited include those areas next to areas that are restored that experience benefits as a result of the restoration.
Measure 2b: Reduce Introductions and Effects of Invasive Species in a Total of Six Regions within the United States
(This measure has been reworded since the publication of the FY 2000 Annual Program Performance Report and FY 2002 Annual Performance Plan. This measure was previously worded as: “Number of U.S. coastal regions with reduced introductions and impacts on nonindigenous species (total of six regions within the United States).”)
Data Validation and Verification:
Data source: OAR, U.S. Department of the Interior, andstate agenciesFrequency: AnnualData storage: OAR will collect data, conduct assessments,and store dataVerification: Original research data verified through peerreview; OAR will obtain quality-controlled data from othersources to ensure criteria are being met for inclusion inperformance calculations.Data limitations: Reaching these targets depends onactivities of other federal and state agencies withmanagement responsibilities in this area.Actions to be taken: None
4
22
1 1
2 2
0
1
3
2
1
0 1999 2000 2001 2002 2003
Target Actual
FY 1999 FY 2000 FY 2001 FY 2002 FY 2003Target 1 1 2 2 2Actual 0 1 2 Met/Not Met Not Met Met Met
Explanation of Measure
Invasive nuisance species have become a major threat to global biodiversity, second only to habitat degradation and loss. The nation’s coastal habitats and aquatic resources are both directly and indirectly affected by nonindigenous species silently entering our waters through a variety of pathways, including ballast water discharge, live bait, and aquaculture. Many of these invaders displace native species, disrupting the ecological integrity of their ecosystems and threatening the economic and recreational value of these coastal resources. A recent Cornell University assessment estimated that the annual cost of all invasive species to the U.S. economy exceeds $130 billion, which is more than twice the annual cost of damage caused by all natural disasters. This measure takes into account the two components that result in an overall reduction in the number of introductions: (1) a decrease in the number of new nonindigenous species that become established in U.S. coastal regions from other countries, when compared to some base period and (2) a decrease in the spread of new nonindigenous species out of the region where they originally became established. OAR will implement a program to monitor national marine sanctuaries for invasive species, develop rapid-response strategies to prevent and control invasives in national marine sanctuaries and other areas, and continue support of ballast water demonstration projects.
FY 2001 APPR and FY 2003 APP 241

National Oceanic and Atmospheric Administration
Measure 2c: Percentage of U.S. Shoreline and Inland Areas that Have Improved Ability to Reduce Coastal Hazard Impacts
(This measure has been reworded since the publication of the FY 2000 Annual Program Performance Report and FY 2002 Annual Performance Plan. This measure was previously worded as: “Percentage of U.S. shoreline and inland areas with improved ability to identify extent and severity of coastal hazards.”)
Data Validation and Verification:
Data source: NOS, other federal and state agencies Frequency: Annual Data storage: NOS will collect information, conduct assessments, and store data. Verification: All data used in coastal hazard risk assessments are quality controlled; risk assessment models are tested for accuracy and coverage (amount of shoreline covered). Data limitations: This measure tracks development and implementation of coastal hazard risk atlases as an indicator of improved ability to identify the extent and severity of coastal hazards. Reaching these targets will depend on the activities of other federal and state agencies with management responsibilities in this area. Actions to be taken: None
30
1515
5
14
6 65 6
25
Per
cen
tage
20
15
10
5
0 1999 2000 2001 2002 2003
FY 1999 FY 2000 FY 2001 FY 2002 FY 2003Target 5% 14% 6% 15% 15%Actual 5% 6% 6% Met/Not Met Met Not Met Met
Explanation of Measure
This measure tracks improvements in NOAA's ability to estimate the risks of natural hazards in U.S. coastal regions. Activities are underway to develop a coastal risk atlas that will enable communities to evaluate the risk, extent, and severity of natural hazards in coastal areas. The risk atlas will help coastal communities make more effective hazard mitigation decisions to reduce the impacts of hazards to life and property. Currently, many coastal communities make major decisions on land use, infrastructure development, and hazard responses without adequate information about the risks and possible extent of natural hazards in their area. Through the coastal risk atlas, NOS, with other federal and state agencies, will provide a mechanism for coastal communities to evaluate their risks and vulnerabilities to natural hazards for specific U.S. coastal regions and improve their hazard mitigation planning capabilities.
FY 2001 Program Evaluation for Performance Goal 2: Sustain Healthy Coasts
NOAA’s goal to sustain healthy coasts is the product of more than 25 years of experience helping to understand and manage coastal resources so that their ecological and economic productivity can be fully realized and sustained. Evaluation efforts exist at a variety of levels, from peer reviews of proposals and evaluations of individual projects, to internal and external reviews of entire programs and quarterly reviews of NOAA’s overall performance in coastal stewardship areas. Constituent input is an important part of the evaluation process and is solicited regularly through constituent workshops.
242 FY 2001 APPR and FY 2003 APP

National Oceanic and Atmospheric Administration
Discontinued Measures
Number of Acres of Coastal Habitat Restored (Cumulative)
FY 1999 FY 2000 FY 2001 FY 2002 FY 2003 Target 55,000 70,000 Discontinued DiscontinuedActual 43,000 45,000 71,000 Met/Not Met Not Met Met
Data Validation and Verification:
Data source: Primary source is NMFS’s Office of Habitat Conservation. NOS provides additional input.Frequency: AnnualData storage: NMFS’s Habitat Office will collect information, conduct assessments, and store data.Verification: NMFS’s Habitat Office will collect quality-controlled data to ensure criteria are being met by data used tocalculate performance.Data limitations: NoneActions to be taken: None
Explanation of Measure
This measure has been replaced with a measure that tracks the number of acres benefited. The previous target was based on the number of projects anticipated for approval under the CWPPRA project selection system in place in FY 1999. Prior to FY 2000, CWPPRA projects were approved by an interagency review board before detailed engineering design studies were conducted or formalized agreements with affected private landowners were signed. As a result, acreage for approved projects was higher than actual acres restored as projects were delayed or dropped when they were not deemed feasible from engineering or private landowner perspectives. In FY 2000 NOAA changed the project selection protocol to require engineering design studies before project approval, thereby reducing the total acreage approved but increasing the likelihood that the number reported reflects actual coastal habitat restoration, creation, or protection. NMFS has worked with the Sustain Healthy Coast team to recalibrate this performance measure, establish a new baseline for its actions benefiting coastal habitats, and include acres benefited from all relevant programs.
Cross-cutting Activities
Other Government Agencies
NOAA has leveraged its resources through a variety of effective international, interagency, state, local, private sector, and other partnerships to develop world-class coastal stewardship capabilities. These partnerships are essential to effectively integrate coastal science, assessment, monitoring, education, and management activities.
NOAA provides technical and scientific assistance to a variety of partners involved in protection, monitoring, and restoration of coastal resources. For example, NOAA provides critical information to the U.S. Coast Guard to help the Coast Guard respond to approximately 70 serious oil and chemical spills every year. NOAA also works closely with other agencies, Department of Commerce bureaus, states, local governments, and industry on important cross-cutting activities such as reducing the risks and impacts of natural hazards, protecting and restoring essential fish habitats, reducing runoff pollution, forecasting and preventing harmful algal blooms, and exploring the deep ocean and new uses of the ocean’s rich biodiversity.
FY 2001 APPR and FY 2003 APP 243

National Oceanic and Atmospheric Administration
External Factors and Mitigation Strategies
Changes in climate, biological, and other natural conditions may affect NOAA’s ability to carry out activities to sustain healthy coasts. In addition, many of these coastal stewardship activities depend on contributions from multiple partners, particularly states, territories, and other federal agencies. The failure of one or more of these partners to fulfill their cooperative contributions could have very serious consequences on the overall effort to sustain healthy coasts.
244 FY 2001 APPR and FY 2003 APP

National Oceanic and Atmospheric Administration
Performance Goal 3: Recover Protected Species
Corresponding Strategic Goal
Strategic Goal 3: Observe and manage the Earth’s environment to promote sustainable growth
Rationale for Performance Goal
To recover protected species, the National Oceanic and Atmospheric Administration (NOAA) aims to prevent the extinction of protected species and to maintain the status of healthy species. NOAA measures its performance in meeting these objectives by focusing on the agency’s ability to manage protected species through conservation programs and recovery plans and through constant monitoring of and research into the status of species and the stresses that affect their mortality.
The quantitative measures of the probability of extinction for protected species were developed in FY 1999 and FY 2000 to establish the baseline from which program performance (reduction in the probability of extinction) will be measured. These new performance measures have been developed to quantify outcome-oriented performance. The National Marine Fisheries Service (NMFS) recognizes the need for objective procedures to determine the status of protected species based on population analyses that take into account species biology and threats to existence that are the result of both human and natural causes. The Recover Protected Species (RPS) FY 2002 proposal is based in part on measuring our ability to reduce the probability of extinction for at-risk species. RPS performance will be measured by the results of attempts such as reducing incidental and direct takes, increasing species habitat, decreasing negative interactions, and mitigating natural phenomena to reduce the risk of extinction for protected species from detrimental human activities.
Measure 3a: Reduce by 10 (from a FY 2000 Baseline of 27) by FY 2007, the Number of Threatened Species at Risk of Extinction
(This measure has been reworded since the publication of the FY 2000 Annual Program Performance Report and FY 2002 Annual Performance Plan. This measure was previously worded as: “Reduce the probability of extinction of five threatened species or Evolutionarily Significant Units (annual) out of 23 threatened species (by 2005).”)
10
8
6
4
2
0 2001 2002 2003
2 2
5
2
Target Actual
Data Validation and Verification:
Data source: NMFSFrequency: AnnualData storage: NMFS’s Office of Protected ResourcesVerification: Audits and internal peer review withinNOAA and external peer review by regional fisherycouncils, the National Science Foundation, the NationalAcademy of Science, and other organizationsData limitations: NoneActions to be taken: None
FY 1999 FY 2000 FY 2001 FY 2002 FY 2003Target New New 2 2 5
Met/Not Met Met Actual New New 2
FY 2001 APPR and FY 2003 APP 245
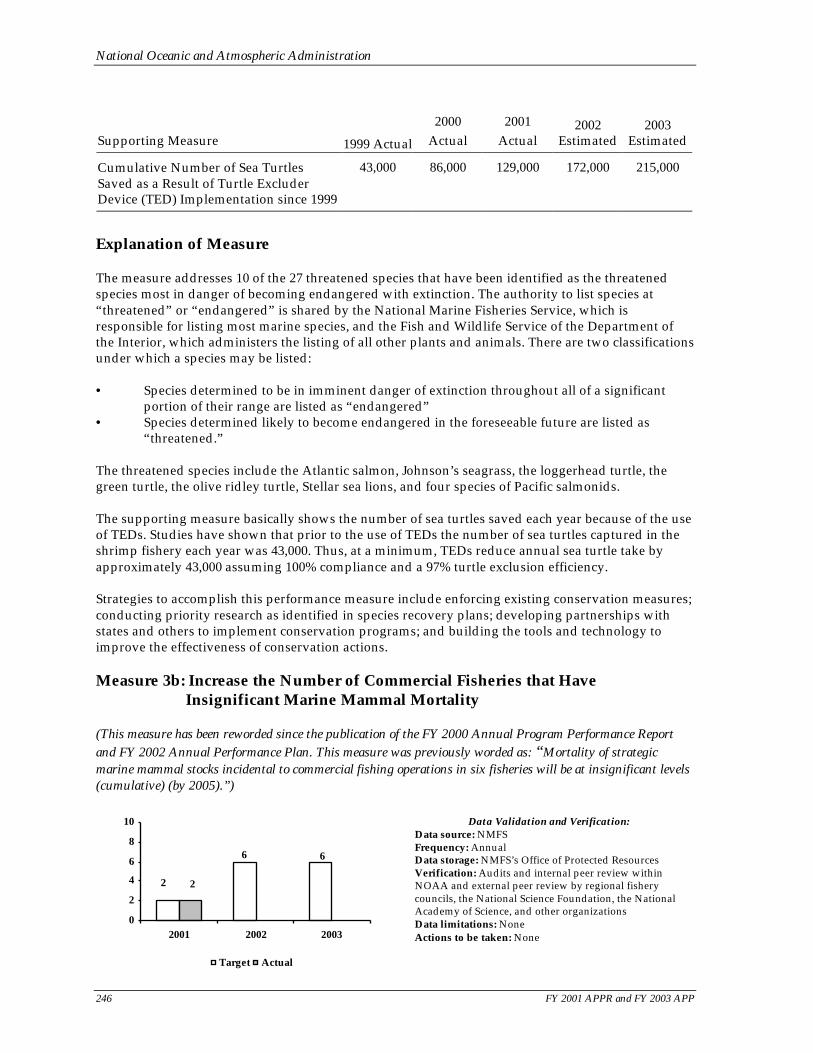
National Oceanic and Atmospheric Administration
2000 2001 2002 2003 Supporting Measure 1999 Actual Actual Actual Estimated Estimated
Cumulative Number of Sea Turtles 43,000 86,000 129,000 172,000 215,000Saved as a Result of Turtle ExcluderDevice (TED) Implementation since 1999
Explanation of Measure
The measure addresses 10 of the 27 threatened species that have been identified as the threatened species most in danger of becoming endangered with extinction. The authority to list species at “threatened” or “endangered” is shared by the National Marine Fisheries Service, which is responsible for listing most marine species, and the Fish and Wildlife Service of the Department of the Interior, which administers the listing of all other plants and animals. There are two classifications under which a species may be listed:
• Species determined to be in imminent danger of extinction throughout all of a significant portion of their range are listed as “endangered”
• Species determined likely to become endangered in the foreseeable future are listed as “threatened.”
The threatened species include the Atlantic salmon, Johnson’s seagrass, the loggerhead turtle, the green turtle, the olive ridley turtle, Stellar sea lions, and four species of Pacific salmonids.
The supporting measure basically shows the number of sea turtles saved each year because of the use of TEDs. Studies have shown that prior to the use of TEDs the number of sea turtles captured in the shrimp fishery each year was 43,000. Thus, at a minimum, TEDs reduce annual sea turtle take by approximately 43,000 assuming 100% compliance and a 97% turtle exclusion efficiency.
Strategies to accomplish this performance measure include enforcing existing conservation measures; conducting priority research as identified in species recovery plans; developing partnerships with states and others to implement conservation programs; and building the tools and technology to improve the effectiveness of conservation actions.
Measure 3b: Increase the Number of Commercial Fisheries that Have Insignificant Marine Mammal Mortality
(This measure has been reworded since the publication of the FY 2000 Annual Program Performance Report and FY 2002 Annual Performance Plan. This measure was previously worded as: “Mortality of strategic marine mammal stocks incidental to commercial fishing operations in six fisheries will be at insignificant levels (cumulative) (by 2005).”)
10 Data Validation and Verification:
8
6
4 2
6 6
2
Data source: NMFSFrequency: AnnualData storage: NMFS’s Office of Protected ResourcesVerification: Audits and internal peer review withinNOAA and external peer review by regional fisherycouncils, the National Science Foundation, the NationalAcademy of Science, and other organizationsData limitations: NoneActions to be taken: None
2
0 2001 2002 2003
Target Actual
246 FY 2001 APPR and FY 2003 APP

National Oceanic and Atmospheric Administration
FY 1999 FY 2000 FY 2001 FY 2002 FY 2003Target New New 2 6 6Actual New New 2 Met/Not Met Met
Explanation of Measure
This measure tracks the number of commercial fisheries where marine mammal deaths are substantial and where these deaths will be reduced to insignificant levels by 2007. By definition, insignificant levels mean that total mortality or rate of death is no more than 10% of the maximum number of marine mammals that could die from human-caused mortality. For this measure, 15 out of 32 fisheries have been targeted.
One of the most significant impacts on marine mammal stocks is death from entanglement and drowning in fishing gear. Certain marine mammal species are particularly vulnerable to interactions with fisheries because of location and type of fishing gear used. The 15 fisheries and marine mammal stocks targeted in this measure are the following. For the Western North Atlantic stock of coastal bottlenose dolphins, the fisheries are the Mid Atlantic coastal gillnet, North Carolina inshore gillnet, Southeast Atlantic gillnet, Southeast Atlantic shark gillnet, Atlantic blue crab trap or pot, Mid Atlantic haul or beach seine, North Carolina long haul seine, North Carolina roe mullet stop net, and Virginia pound net. For the Gulf of Main/Bay of Fundy stock of harbor porpoise, the fishery is the Northeast sink gillnet. For the Atlantic large whale, the fisheries are the Northeast and Mid Atlantic American lobster trap or pot, Northeast sink gillnet, Mid Atlantic coastal gillnet, and Southeast Atlantic shark gillnet. Finally for the Pacific offshore cetaceans, it is the California and Oregon fishery for thresher shark and swordfish. New fishing technologies to reduce gear impacts need to be developed, and strategies to reduce interactions between fishing gear and marine mammals need to be devised. NOAA also needs to educate fishermen about how they can avoid marine mammals while still being able to catch fish.
A successful program to reduce mortality of marine mammal stocks will require research on marine mammal behavior, assessment of marine mammal populations, reduction of interactions in problem fisheries, and monitoring and analysis via the observer program.
Measure 3c: Reduce by 11 (from a FY 2000 Baseline of 29) by FY 2007, the Number of Endangered Species at Risk of Extinction
(This measure has been reworded since the publication of the FY 2000 Annual Program Performance Report and FY 2002 Annual Performance Plan. This measure was previously worded as: “Reduce the probability of extinction of eight endangered species or Evolutionarily Significant Units (cumulative) (by 2005).”)
10
8
6
4
2
0
3
6 6
3
Data Validation and Verification: Data source: NMFS Frequency: Annual Data storage: NMFS’s Office of Protected Resources Verification: Audits and internal peer review within NOAA and external peer review by regional fishery councils, the National Science Foundation, the National Academy of Science, and other organizations Data limitations: None Actions to be taken: None
2001 2002 2003
Target Actual
FY 2001 APPR and FY 2003 APP 247
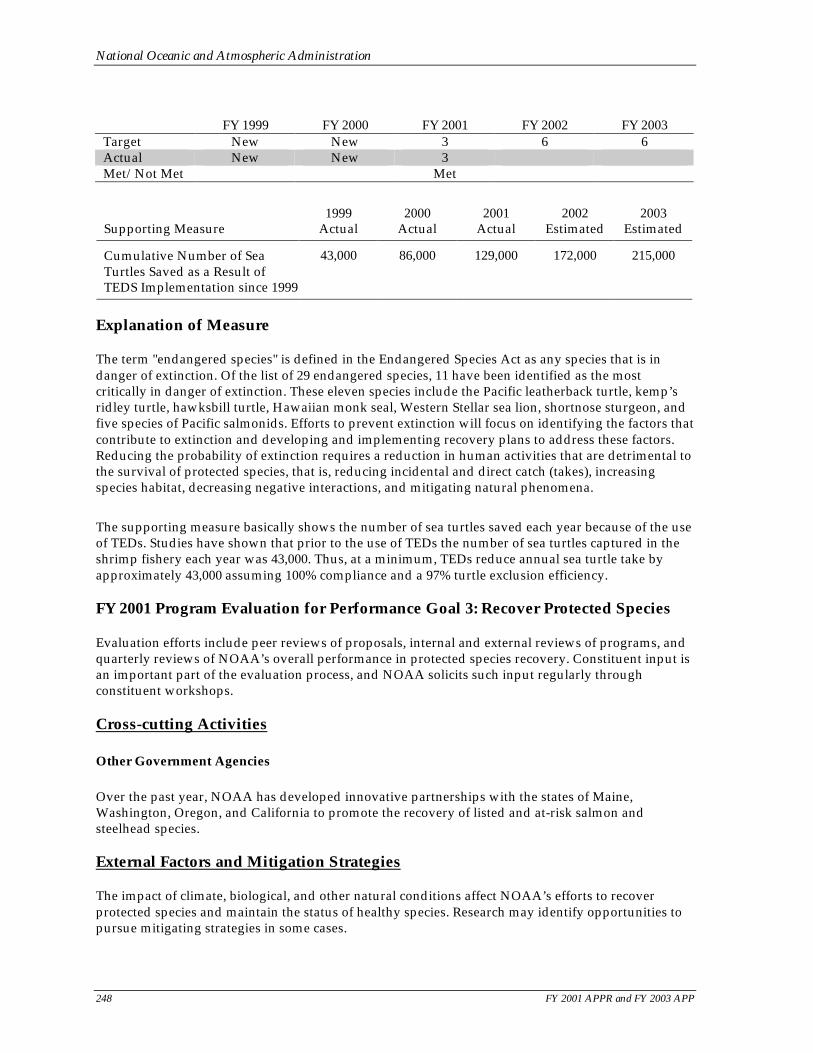
National Oceanic and Atmospheric Administration
FY 1999 FY 2000 FY 2001 FY 2002 FY 2003Target New New 3 6 6Actual New New 3 Met/Not Met Met
1999 2000 2001 2002 2003 Supporting Measure Actual Actual Actual Estimated Estimated
Cumulative Number of Sea 43,000 86,000 129,000 172,000 215,000 Turtles Saved as a Result of TEDS Implementation since 1999
Explanation of Measure
The term "endangered species" is defined in the Endangered Species Act as any species that is in danger of extinction. Of the list of 29 endangered species, 11 have been identified as the most critically in danger of extinction. These eleven species include the Pacific leatherback turtle, kemp’s ridley turtle, hawksbill turtle, Hawaiian monk seal, Western Stellar sea lion, shortnose sturgeon, and five species of Pacific salmonids. Efforts to prevent extinction will focus on identifying the factors that contribute to extinction and developing and implementing recovery plans to address these factors. Reducing the probability of extinction requires a reduction in human activities that are detrimental to the survival of protected species, that is, reducing incidental and direct catch (takes), increasing species habitat, decreasing negative interactions, and mitigating natural phenomena.
The supporting measure basically shows the number of sea turtles saved each year because of the use of TEDs. Studies have shown that prior to the use of TEDs the number of sea turtles captured in the shrimp fishery each year was 43,000. Thus, at a minimum, TEDs reduce annual sea turtle take by approximately 43,000 assuming 100% compliance and a 97% turtle exclusion efficiency.
FY 2001 Program Evaluation for Performance Goal 3: Recover Protected Species
Evaluation efforts include peer reviews of proposals, internal and external reviews of programs, and quarterly reviews of NOAA’s overall performance in protected species recovery. Constituent input is an important part of the evaluation process, and NOAA solicits such input regularly through constituent workshops.
Cross-cutting Activities
Other Government Agencies
Over the past year, NOAA has developed innovative partnerships with the states of Maine, Washington, Oregon, and California to promote the recovery of listed and at-risk salmon and steelhead species.
External Factors and Mitigation Strategies
The impact of climate, biological, and other natural conditions affect NOAA’s efforts to recover protected species and maintain the status of healthy species. Research may identify opportunities to pursue mitigating strategies in some cases.
248 FY 2001 APPR and FY 2003 APP

National Oceanic and Atmospheric Administration
Performance Goal 4: Advance Short-term Warnings and Forecasts
Corresponding Strategic Goal
Strategic Goal 3: Observe and manage the Earth’s environment to promote sustainable growth
Rationale for Performance Goal
Our environment has profound effects on human welfare and economic well-being. Each year hundreds of lives and billions of dollars are lost due to severe storms, floods, and other natural hazards. The National Oceanic and Atmospheric Administration’s (NOAA’s) current ability to predict short-term change is restricted by observations that are incomplete. This limits the ability to improve basic understanding and predictive modeling of weather and other natural phenomena. Although we can do nothing to prevent natural disturbances, we must do everything possible to minimize impact on humans. NOAA must improve its observing systems, develop a better understanding of natural processes, and enhance numerical weather prediction models and dissemination systems.
Measure 4a: Lead Time (Minutes), Accuracy (%), and False Alarm Rate (FAR, %) of Severe Weather Warnings for Tornadoes
20
1111 13 12
11 10
12 10
72 70
15 68 66
10 64 5 62
60 0 58
1999 2000 2001 2002 2003 1999 2000 2001 2002 2003
70 70 68 69 70 70
63
67
Target Actual Target Actual
100
80
60
40
20
0 1999 2000 2001 2002 2003
70 71 72 65 73 73 73 76
Target Actual
FAR
(%)
Lea
d T
ime
(min
)
Acc
ura
cy (%
)
FY 2001 APPR and FY 2003 APP 249

National Oceanic and Atmospheric Administration
FY 1999 FY 2000 FY 2001 FY 2002 FY 2003Lead Time (Minutes)
11 12 13 11 11
Accuracy (%) 70% 70% 68% 69% 70%
Target
FAR (%) 72% 65% 73% 71% 70% Lead Time (Minutes)
12 10 10
Accuracy (%) 70% 63% 67%
Actual
FAR (%) 73% 76% 73% Lead Time (Minutes)
Met Not Met Not Met
Accuracy (%) Met Not Met Not Met
Met/Not Met
FAR (%) Not Met Not Met Met
Data Validation and Verification:
Data source: National Weather Service (NWS) field officesFrequency: MonthlyData storage: NWS headquarters and the Office of Climate, Water, and Weather Services (OCWWS)Verification: Verification is the process of comparing the predicted weather to the actual event. The process begins with thecollection of warnings from every NWS office across the nation. The severe weather event program includes extensivequality control procedures to ensure the highest reliability of each report. The data in each report are entered into adatabase that contains severe weather warnings where the warnings and events are matched and appropriate statistics arecalculated and made available to all echelons of the NWS.Data limitations: There are limitations of scientific verification in assessing data. The fundamental purpose of scientificverification is to objectively assess program performance through the use of standard statistical analysis. However, anumber of factors unique to the atmospheric sciences must be considered to ensure proper interpretation of objectivelyderived statistics. The primary factor to consider is the natural variation of this performance measure related to annualfluctuations in meteorological conditions associated with severe weather.Actions to be taken: Review the storm data from individual events to pinpoint the causes and take corrective actions.
Explanation of Measure
The lead time for a tornado warning is the difference between the time the warning was issued and the time the tornado affected the area for which the warning was issued. The lead times for all tornado occurrences throughout the year are averaged to get this statistic. The accuracy of the warnings is the percentage of times a tornado actually occurred in an area that was covered by a warning. The false alarm rate is the percentage of times a tornado warning was issued but no tornado occurrence was verified. The false alarm rate was added as a reportable measure in FY 2000, although it had been collected and used internally previously. NOAA will continue data collection and verification, and false alarm rates will be reported in future years.
NWS met only one out of the three tornado performance goals for FY 2001. However, the FY 2001 accuracy goals was missed by only one percentage point, which is statistically insignificant and well within standard deviation for this measure. NWS missed the warning lead time goal and is currently reviewing the storm data from individual events to pinpoint the causes and take corrective actions. Final data from this analysis should be available in late February 2003. Tornado lead times have essentially remained steady at 10-11 minutes since the deployment of the Next Generation Weather Radar (NEXRAD) network in mid 1990s. NWS targets for FY 2002 and FY 2003 will remain at 11 minutes and will gradually increase to 13 minutes by FY 2005 after completion of retrofits of the NEXRAD systems, implementation of new training techniques such as a weather event simulators, and realization of the operational benefits of Advanced Weather Interactive Processing System’s five software enhancements.
250 FY 2001 APPR and FY 2003 APP

National Oceanic and Atmospheric Administration
Measure 4b: Lead Time (Minutes) and Accuracy (%) for Severe Weather Warnings for Flash Floods
Lea
d T
ime
(min
)
100
46 45 45 55 54
46 44 43
100 80 80 60 60 40
40 20
20 0
0
87 86 85 86 86 86 85 86
1999 2000 2001 2002 2003 1999 2000 2001 2002 2003
Target Actual Target Actual
FY 1999 FY 2000 FY 2001 FY 2002 FY 2003
Acc
ura
cy (%
)
Lead Time (Minutes)
54 55 45 45 46 Target
Accuracy (%) 85% 86% 86% 86% 87% Lead Time (Minutes)
44 43 46 Actual
Accuracy (%) 85% 86% 86% Lead Time (Minutes)
Not Met Not Met Met Met/Not Met
Accuracy (%) Met Met Met
Data Validation and Verification: Data source: NWS field offices Frequency: Monthly Data storage: NWS headquarters and OCWWS Verification: Verification is the process of comparing the predicted weather to the actual event. The process begins with the collection of warnings from every NWS office across the nation. The severe weather event program includes extensive quality control procedures to ensure the highest reliability of each report. The data in each report are entered into a database that contains severe weather warnings where the warnings and events are matched and appropriate statistics are calculated and made available to all echelons of the NWS. Data limitations: There are limitations of scientific verification in assessing data. The fundamental purpose of scientific verification is to objectively assess program performance through the use of standard statistical analysis. However, a number of factors unique to the atmospheric sciences must be considered to ensure proper interpretation of objectively derived statistics. The primary factor to consider is the natural variation of this performance measure related to annual fluctuations in meteorological conditions associated with severe weather. Actions to be taken: NOAA will continue to collect data while reporting additional measures in the future
Explanation of Measure
The lead time for a flash flood warning is the difference between the time the warning was issued and the time the flash flood affected the area for which the warning was issued. The lead times for all flash flood occurrences throughout the year are averaged to get this statistic. The accuracy of the warnings is measured by the percentage of times a flash flood actually occurred in an area that was covered by a warning. NOAA’s actions include data collection and verification, and new performance measures will be reported in future years. During FY 2001, both goals for flash flood warnings were met. The FY 2001 lead time actual was higher than the target due to a 15% increase in the number of flash flood events (2,600 compared with the 10-year average of 2,215). Performance scores tend to be higher if the number of events is above average in a given year. NWS expects steady improvement in both flash flood lead time and accuracy leading into FY 2003. The steady
FY 2001 APPR and FY 2003 APP 251

National Oceanic and Atmospheric Administration
improvement is linked to the planned implementation of new flash flood decision assistance tools in FY 2002 and NEXRAD retrofits in FY 2003. The NEXRAD retrofits will allow NWS forecasters to run new algorithms for improve rainfall estimates.
Measure 4c: Accuracy of Hurricane Track Forecasts (48 Hours)
Nau
tica
l Mil
es
200
160
120
80
40
0
2002 2003
142 138
Target Actual
FY 1999 FY 2000
Data Validation and Verification:
Data source: NWS/Tropical Prediction Center (TPC) Frequency: Annual Data storage: TPC Verification: Hurricane storm verification is performed for hurricanes, tropical storms, and tropical depressions regardless of whether these systems are over land or water. The TPC issues track and intensity forecast throughout the life of a hurricane. The actual track and intensity are verified through surface and aircraft measurements. NOAA calculates the average accuracy of the TPC track and intensity forecasts for the Atlantic basin at the end of each hurricane season. Data limitations: Verification of actual track and intensity versus forecast is very accurate. However, actual annual scores vary up to 20% in some years due to the type and location of the hurricane events. Some types of systems can be more accurate forecasted than others. For example, hurricanes that begin in the northern sections of the hurricane formation zone tend to be much harder to accurately forecast. Out-year measures depend on a stable funding profile and take into account improved use of the Weather Service Radar (WSR-88D), new satellites, improved forecast models, new and continued research activities of the U.S. Weather Research Program (USWRP), and investments in critical observing systems. Actions to be taken: NOAA will report on the tracking of forecasts at 24-, 48-, and 72-hour intervals.
FY 2001 FY 2002 FY 2003 Target New 142 138Actual New Met/Not Met
Explanation of Measure
Track forecasts have a significant impact on the U.S. economy. The average cost to evacuate the Atlantic coastline of the United States is approximately $1 million dollars per mile. By improving track forecasts NOAA can both save lives and avoid unnecessary economic losses. This goal measures the difference between the projected location and the actual location in nautical miles for a 48-hour forecast. This measure has been reintroduced for the FY 2003 Annual Performance Plan, replacing hurricane landfall warning lead time. Although landfall warnings are critical, only one to two storms make landfall in the United States each year. No storms made landfall during 2000 and 2001. Based on feedback from our key users, including emergency managers, NWS has concluded the track forecast measure provides a better gauge for the performance of our hurricane forecasting operations. Although NWS maintains statistics on 24-, 48-, and 72-hour hurricane track forecasts, the 48-hour measure is the most important time frame for emergency managers and other government officials to make planning decisions related to hurricanes, including coastal evacuations. The FY 2002 and 2003 targets are consistent with the trend for the last 30 years. The track accuracy will improve to
252 FY 2001 APPR and FY 2003 APP

National Oceanic and Atmospheric Administration
128 by 2007 with steady improvements in hurricane models and forecasting techniques, including use of ensemble forecasts, and completion of ongoing research within the USWRP.
Measure 4d: Accuracy (%) of Three-day Forecast of Precipitation
Acc
ura
cy (%
)
50
40
30
20
10
0 2000 2001 2002 2003
19 20 2217 16 19
Target Actual
FY 1999 FY 2000
Data Validation and Verification:
Data source: The Hydrometeorological Prediction Center Frequency: Annual Data storage: World Weather Building Verification: The Hydrometeorological Prediction Center has produced the Quantitative Precipitation Forecast since the early 1960s and has kept verification statistics related to the Quantitative Precipitation Forecast program since that time. All data are examined for accuracy and quality control procedures are applied. Data limitations: The NWS routinely prepares and distributes to internal and external customers predictions of heavy rainfall. The Hydrometeorological Prediction Center has the responsibility to prepare both graphical and text products depicting the areas threatened by heavy precipitation in the contiguous United States. There will be a significant amount of variability, and the improvements may not be achieved exactly as predicted. Out-year measures depend on a stable funding profile and take into account improved use of the WSR-88D, new satellites, improved forecast models, new and continued research activities of the USWRP, investments in critical observing systems, and continued support of the Advanced Weather Interactive Processing System (AWIPS). Actions to be taken: NOAA will implement planned weather model improvements along with ongoing research projects.
FY 2001 FY 2002 FY 2003 Target New 20% 22% 17% 19%Actual New 16% 19% Met/Not Met Not Met Not Met
Explanation of Measure
The measure reflects the ability to accurately forecast a precipitation event three days in advance. NOAA’s actions include data collection and verification. The FY 2001 target for increasing the accuracy of three-day precipitation forecasts was not met. In late 1999, the Hydrometeorological Prediction Center began issuing a three-day prediction of quantitative rainfall. Performance goals were established for this forecast based on the previous 20 years performance of the two-day rainfall forecast. Based on the actual trend data from two-day forecast and the three-day actuals over the last two years, NWS has adjusted the target goals for FY 2002 and FY 2003. The FY 2002 target is lower than the FY 2001 actual due to expected continued drought conditions during FY 2002. These conditions were prevalent during the 2002 winter months when these revised targets were developed. Drought conditions are highly correlated to lower performance scores for precipitation prediction due to the lower frequency of occurrence of heavy precipitation events. FY 2003 targets assume a return to more normal precipitation conditions. Overall the FY 2002 and FY 2003 targets take into account 30-year trend data and reflect the high variability and low frequency of occurrence associated with 24-hour precipitation events of 1 inch or more. In addition, annual differences in atmospheric predictability from year to year justify a more conservative goal in FY 2002. Planned
FY 2001 APPR and FY 2003 APP 253

National Oceanic and Atmospheric Administration
numerical weather model improvements in FY 2003 and ongoing research projects will support a steady upward trend in this measure over the next five years, improving to 27% by FY 2007.
Measure 4e: Lead Time (Hours) and Accuracy (%) of Winter Storm Warnings
25
14131312 1311 9
Lea
d T
ime
(hrs
) 100 20
15
10
5
888685 86 9085 85
Acc
ura
cy (%
) 80
60
40
20 0
1999 2000 2001 2002 2003
Target Actual
0 1999 2000 2001 2002 2003
Target Actual
FY 1999 FY 2000 FY 2001 FY 2002 FY 2003Lead Time (Hours)
12 13 13 14Target
Accuracy (%)
New
85% 86% 86% 88% Lead Time (Hours)
11 9 13Actual
Accuracy (%) 85% 85% 90% Lead Time (Hours)
Not Met MetMet/Not Met
Accuracy (%)
New
Met Met
Data Validation and Verification:
Data source: NWS field officesFrequency: DailyData storage: NWS headquarters and OCWWSVerification: Verification is the process of comparing the predicted weather with the actual event. The process begins withthe collection of forecasts and observations from each NWS office across the nation. The quality-controlled, collated dataare transmitted to the National Centers for Environmental Prediction in Camp Springs, Maryland, where the data arestored as computer files. The data files are retrieved by the NWS headquarters’ Office of Science and Technology.Following additional quality control the data are stored on an Office of Science and Technology workstation and used togenerate semi-annual statistics on forecast accuracy.Data limitations: Documentation for heavy snowfall is printed annually. Due to the relatively few number of cases eachyear, the projections assume a three-year average (current plus two previous years, all equally weighted). Due to the largevolume of data gathered and computed, a document for lead time and accuracy of winter storm warnings cannot befinalized until well into the following fiscal year. Out-year measures depend on a stable funding profile and take intoaccount improved use of the WSR-88D, new satellites, improved forecast models, new and continued research activities ofthe USWRP, investments in critical observing systems, and continued support of AWIPS.Actions to be taken: Introduce high-resolution regional models.
Explanation of Measure
The FY 2001 targets for lead time in hours and accuracy of winter storm warnings for this performance measure were met. The FY 2002 target for accuracy is lower than the FY 2001 actual
254 FY 2001 APPR and FY 2003 APP

National Oceanic and Atmospheric Administration
because of a 30% increase in the number of winter storms in FY 2001. An increase in the number of storms tends to improve performance scores in a given year. This higher level of winter storm activity is not expected during FY 2002 and FY 2003. A winter storm warning is issued when four or more inches of snow or sleet are expected in the next 12 hours, or six or more inches in 24 hours, or one-quarter of an inch or more of ice accretion. This performance indicator measures the accuracy and advance warning lead time of these conditions. Improving the accuracy and advance warnings of winter storms enables the public to take the necessary steps to prepare for disruptive weather conditions. With the introduction of high-resolution regional forecast models and introduction of new operational forecast techniques in FY 2002 and FY 2003, NWS lead times will improve to 15 minutes and 90% accuracy by FY 2005.
Measure 4f: Accuracy (%) and FAR (%) of Forecasts of Ceiling and Visibility (Aviation Forecasts)
191820 21 1819 15
1999 2000 2001 2002 2003
Target Actual
525250 51 5153 53
0
20
40
60
80
100
1999 2000 2001 2002 2003
FAR
(%)
Target Actual
50
Acc
ura
cy (%
) 40
30
20
10
0
FY 1999 FY 2000 FY 2001 FY 2002 FY 2003Accuracy (%) 20% 21% 18% 19%Target
FAR (%) New
50% 51% 52% 52% Accuracy (%) 19 15% 18%Actual
FAR (%) 52% 53% 51% Accuracy (%) Not Met Not MetMet/Not Met
FAR (%) New
Not Met Met
Data Validation and Verification:
Data source: NWS field officesFrequency: DailyData storage: NWS headquarters and OCWWSVerification: Verification is the process of comparing the predicted weather with the actual event. The process begins withthe collection of forecasts and observations from each NWS office across the nation. The quality-controlled, collated dataare transmitted to the National Centers for Environmental Prediction in Camp Springs, Maryland, where the data arestored as computer files. The data files are retrieved by the NWS headquarters’ Office of Science and Technology.Following additional quality control the data are stored on an Office of Science and Technology workstation and used togenerate semi-annual statistics on forecast accuracy.Data limitations: Due to the large volume of data gathered and computed, documentation for this measure cannot befinalized until well into the following fiscal year. Out-year measures depend on a stable funding profile and take intoaccount improved use of the WSR-88D, new satellites, improved forecast models, new and continued research activities ofthe USWRP, investments in critical observing systems, and implementation of AWIPS.Actions to be taken: NOAA will improve and expand its training program and work with the National Aeronautics andSpace Administration and the Federal Aviation Administration to develop new software tools and forecast techniques.
FY 2001 APPR and FY 2003 APP 255

National Oceanic and Atmospheric Administration
Explanation of Measure
In accordance with the NWS strategic plan, this measure was added in FY 2000 to reflect a segment of customers that had not been represented in other performance measures. Visibility and cloud ceiling forecasts are critical for the safety of aircraft operations. NWS met the target false alarm rate and missed the target for accuracy in FY 2001. The out-year targets for this measure have been adjusted in recognition of performance actuals over the last two years. The FY 2003 President’s budget includes a budget initiative to improve aviation weather forecasts. With funding from this initiative, an improved and expanded training program, and collaborative research with the National Aeronautics and Space Administration and the Federal Aviation Administration to develop new software tools and forecast techniques the NWS expects accuracy to gradually improve to 30% and false alarm rates to improve to 46% by FY 2007.
Measure 4g: Accuracy (%) of Forecast for Winds and Waves (Marine Forecasts)
Acc
ura
cy (%
)
100
80
60
40
20
0
54 53 49 51 52 50 51
1999 2000 2001 2002 2003
Target Actual
FY 1999 FY 2000
Data Validation and Verification:
Data source: NWS field offices Frequency: Daily Data storage: The NWS and the National Centers for Environmental Prediction’s Ocean Modeling Branch Verification: Verification is the process of comparing the predicted weather with the actual event. The process begins with the collection of forecasts and observations from each NWS office across the nation. The quality-controlled, collated data are transmitted to the National Centers for Environmental Prediction, where they are stored as computer files. The data files are retrieved by the NWS, and the National Centers for Environmental Protection’s Ocean Modeling Branch. Following additional quality control the data are used to generate quarterly statistics on forecast accuracy. Data limitations: Due to the large volume of data gathered and computed, documentation for the accuracy of forecast for wind and waves cannot be finalized until well into the following fiscal year. Out-year measures depend on a stable funding profile and take into account improved use of the WSR-88D, new satellites, improved forecast models, new and continued research activities of the USWRP, investments in critical observing systems, and implementation of AWIPS. Actions to be taken: NOAA will deploy enhanced versions of AWIPS (Build 5), implement new wave forecast models, and improve communication and dissemination techniques to marine users.
FY 2001 FY 2002 FY 2003 Target New 49% 51% 53% 54%Actual 50% 51% 52% Met/Not Met Met Met
Explanation of Measure
In accordance with the NWS strategic plan, this measure was added in FY 2000 to reflect a segment of customers that had not been represented in other performance measures. This performance indicator measures the accuracy of wind and wave forecasts, which are important for marine commerce. NOAA actions to be taken include data collection and verification, which will be added to forecasts for the Great Lakes. The target for FY 2001 was met. FY 2003 goals have been adjusted in recognition
256 FY 2001 APPR and FY 2003 APP

National Oceanic and Atmospheric Administration
of actual performance over the last three years. NWS expects the accuracy to gradually improve to 55% by 2005 and 58% by 2007. This improvement will be possible as a result of operational deployment of new marine forecast capabilities, including AWIPS Build 5 software, implementation of new wave forecast models in FY 2002, and improved communication and dissemination techniques to marine users.
FY 2001 Program Evaluation for Performance Goal 4: Advance Short-Term Warnings and Forecasts
NOAA’s vision for FY 2005 is to provide significantly improved short-term warning and forecast products and services that enhance public safety and the economic productivity of the nation. While it is difficult to see the improvements on an annual basis because of the scientific nature and seasonal variations of weather events, historical trends have shown that NOAA continues to improve the accuracy and advance warning lead time of severe weather hazards.
NOAA conducts program evaluations at NWS field offices annually. The NWS field offices follow quality control procedures to ensure the highest reliability of gathered data and weather products. The National Academy of Sciences is also involved in program analysis and evaluation processes at a national level.
New Measure
NOAA is considering adding a new performance measure that would track the increase in accuracy of daily temperature forecasts.
Discontinued Measures
Lead Time (Hours) of Warnings for Hurricanes
FY 1999 FY 2000 FY 2001 FY 2002 FY 2003 Target New 20 21 Discontinued DiscontinuedActual 19 N/A1 N/A1
Met/Not Met1 No hurricanes made landfall in the United States in FY 2001.
Data Validation and Verification:
Data source: TPCFrequency: AnnualData storage: TPCVerification: Hurricane storm verification is performed for hurricanes, tropical storms, and tropical depressions, andverification is considered regardless of whether the storm over land or water. The TPC issues warnings when hurricaneconditions are expected within 24 hours along the coast. The location and timing of these warnings are based upon anumber of factors, including the official TPC track forecast. The average errors of the TPC track forecast for the Atlanticbasin are calculated at the end of each hurricane season.Data limitations: There is large variability in the hurricane warning program because of sample sizes and types of stormseach year. There may be years with unusually easy or difficult forecasts. Out-year measures depend on a stable fundingprofile and take into account improved use of the WSR-88D, new satellites, improved forecast models, new and continuedresearch activities of the USWRP, investments in critical observing systems, and continued support of AWIPS.Note: Hurricane season runs from June 1 through November 30.Actions to be taken: None
FY 2001 APPR and FY 2003 APP 257

National Oceanic and Atmospheric Administration
Explanation of Measure
Because no hurricanes struck the United States in 2001, the FY 2001 target for increasing hurricane warning lead time in hours could not be measured. Hurricanes are one of nature’s most destructive storms. NOAA must continue to inform coastal communities of approaching storms to mitigate the impact of these dangerous storms. This performance indicator measures the advance warning time a community has to prepare for hurricane conditions. A hurricane warning is issued when hurricane force winds are predicted to affect a portion of the U.S. coastline. Advance warning is critical for the evacuation of vulnerable areas.
NWS has decided to remove hurricane warning lead times from the Annual Performance Report. Because no hurricanes made landfall on the United States in both 2000 and 2001 this may not be the best measure to gauge the success of NWS hurricane forecasting. In fact, on average over the last ten years, the United States only experienced one to two hurricane landfalls per year. As an alternative, NWS has decided to include hurricane track and intensity forecasts as a new performance measure in FY 2002. This measure will provide a better indication of forecaster performance and is widely accepted by key user groups such as emergency management officials as the most important and useful performance measure. The FY 2002 performance measure for hurricane track and intensity forecast will be based on a 48-hour forecast. Emergency managers and other key government planning officials consider this timeframe to be the key forecasting timeframe for making timely planning decisions including evacuation of coastal communities.
Cross-cutting Activities
Intra-Department of Commerce
NOAA works closely with the National Institute of Standards and Technology and the Economic Development Administration on the Federal Natural Disaster Reduction initiative, which focuses on reducing the costs of natural disasters, saving lives through improved warnings and forecasts, and providing information to improve resiliency to disaster.
Other Government Agencies
NOAA also works closely with other agencies such as the Federal Emergency Management Agency, the Corps of Engineers, the Bureau of Reclamation, the Department of Defense, as well as state and local governments to complement their meteorological services in the interest of national security. NOAA works closely with the U.S. Coast Guard to disseminate marine weather warnings and forecasts and works directly with the Federal Aviation Administration on aviation forecasts and with the National Aeronautics and Space Administration on launch forecasts and solar forecast effects.
Government/Private Sector
Weather and climate services are provided to the public and industry through a unique partnership between NOAA and the private meteorological sector. NOAA provides forecasts and warnings for public safety, and the private sector promotes dissemination of forecasts and tailors basic information for business uses.
External Factors and Mitigation Strategies
A number of factors unique to the atmospheric sciences must be considered when reviewing the performance measures for this goal. The primary factor to consider is the natural variation of this goal related to annual fluctuations in meteorological conditions. Another factor concerns the damage
258 FY 2001 APPR and FY 2003 APP

National Oceanic and Atmospheric Administration
to critical equipment (for example, supercomputer fire and satellite outages) that can affect daily operations for extended periods, even though numerous safety measures and backup procedures are in place.
Although the performance measures for this goal may improve, the impact on society may not be obvious because of factors beyond our control. For example, hurricane warnings may become more accurate, but because of the increase in population along the coastlines, the deaths, injuries, and/or damage estimates may increase.
Improving our understanding of the natural environment requires advanced infrastructure and therefore continual investment in new technology such as supercomputers and environmental satellites.
NOAA relies on its partners in the media, private sector, and the state and local emergency management community to disseminate weather warnings.
FY 2001 APPR and FY 2003 APP 259

National Oceanic and Atmospheric Administration
Performance Goal 5: Implement Seasonal to Interannual Climate Forecasts
Corresponding Strategic Goal
Strategic Goal 3: Observe and manage the Earth’s environment to promote sustainable growth
Rationale for Performance Goal
The National Oceanic and Atmospheric Administration (NOAA) works with academic and international partners to provide one-year lead time forecasts of global climate variability, especially that resulting from El Niño/Southern Oscillation (ENSO), and consequent precipitation and surface temperature distributions. These forecasts increase society’s ability to mitigate economic losses and social disruption resulting from such events.
Measure 5a: Determine the Accuracy of the Correlation between Forecasts of the Southern Oscillation Index (SOI) and El Niño/La Niña Events
(This measure has been reworded since the publication of the FY 2000 Annual Performance Report and FY Annual Performance Plan. This measure was previously worded as: “ENSO (El Niño/Southern Oscillation forecasts—Accuracy (correlation).”)
Data Validation and Verification:
Data source: Forecasts of sea surface temperature in a portion of the Pacific Ocean and observations from buoys, ships, and satellites Frequency: Annual Data storage: The National Weather Service’s (NWS’s) National Centers for Environmental Prediction Verification: NOAA quality controls the incoming data (for example, through error checking and interstation comparison) and compares the satellite data with on site data to help validate data accuracy. Data limitations: This measure assesses the correlation between forecasts of sea surface temperature (based on models) and actual sea surface temperature (based on satellite and on site observations). Improvements in forecasting ability depend upon improved observations, models, and research. Forecasts will likely be more accurate in El Niño years than in non-El Niño years. Actions to be taken: None
FY 2001 FY 2002 FY 2003
0.84
0.85
0.85
0.85
0.85
0.85
1.0
Cor
rela
tion
0.85
0.8
0.6
0.4
0.2
0.0
1999 2000 2001 2002 2003
Target Actual
FY 1999 FY 2000 Target 0.85 0.85 0.85 0.85 0.85Actual 0.85 0.84 0.85 Met/Not Met Met Not Met Met
Explanation of Measure
The atmosphere is tightly linked to ocean temperatures and circulation patterns. The surface air pressure differences observed between Tahiti and Darwin, Australia are strongly linked to El Niño and La Niña. When barometric pressure is higher than usual in the western Pacific near Indonesia,
260 FY 2001 APPR and FY 2003 APP

National Oceanic and Atmospheric Administration
pressure is lower than usual in the subtropical Pacific near Easter Island and Tahiti. This global pressure signal, identified 70 years ago, is known as the Southern Oscillation. Surface barometric pressure at Darwin, Australia and Tahiti are strongly anticorrelated: when one is higher than usual, the other is lower than usual. The difference, Tahiti minus Darwin, suitably normalized, is referred to as the Southern Oscillation Index (SOI) and is frequently used as a convenient, simple, and reasonably accurate tool to monitor the status of El Niño/La Niña.
The term ENSO reflects the attention bias toward the warm phase of the entire climate fluctuation cycle. ENSO is just the warm phase of the irregular fluctuation between warmer than usual and colder than usual ocean temperatures in the Eastern Pacific. The cold phase has recently come to be known as “La Niña.” The El Niño/La Niña cycle does not occur with strict periodicity. Historically, an El Niño usually recurs every three to seven years, as does its cold La Niña counterpart.
Because more attention has been devoted to El Niño and because there is an association between the Southern Oscillation and El Niño (and La Niña) in the ocean, the research community began to refer to the combination as ENSO. This moniker is somewhat asymmetric: El Niño pertains to just one of the two phases of the Southern Oscillation. It would be perhaps more accurate to refer to El Niño as the warm phase of the Southern Oscillation and to La Niña as the cold phase of the Southern Oscillation. The term ENSO is, however, firmly engrained.
This measure specifically assesses the correlation between forecasts of South Pacific sea surface temperatures (based on models) and actual sea surface temperature (based on satellite and on site observations).
The 1997–98 El Niño was the best monitored and most successfully predicted El Niño on record. NOAA provided advanced forecast of El Niño effects, leading to great savings to a variety of economic sectors. ENSO forecasts require a variety of data, such as ocean observations, remote satellite-based observations, and terrestrial measurements. This program is the only federal effort aimed at providing forecasts of climate events and their consequent impact. NOAA will undertake efforts to determine the limits of predictability of atmospheric changes induced by tropical Pacific sea surface temperature changes; to diagnose and model the global response to warm, cold, and neutral states of the ENSO cycle; and to examine the changes in probabilities of extreme events induced by ENSO.
Measure 5b: U.S. Temperature Forecasts (Skill Score)
Sk
ill S
core
50
40
30
20
10
0
1999 2000 2001 2002 2003
21 20 20 20 20 20 23 25
Target Actual
Data Validation and Verification:
Data source: Forecast data, observations from U.S.Weather Forecast Offices, and from a cooperativenetwork maintained by volunteers across the nationFrequency: AnnualData storage: NWS’s National Centers forEnvironmental PredictionVerification: NOAA performs quality assuranceanalysis of the data (for example, error checking,elimination of duplicates, and interstation comparison)both at the national and U.S. Weather Forecast OfficelevelData limitations: Given the difficulty of makingadvance temperature and precipitation forecasts forspecific locations, a skill score of 20 is considered quitegood and means the forecast was correct in almost 50%of the locations forecasted. Forecasts will likely be betterin El Niño years than in non-El Niño years.Actions to be taken: None
FY 2001 APPR and FY 2003 APP 261

National Oceanic and Atmospheric Administration
FY 1999 FY 2000 FY 2001 FY 2002 FY 2003Target 20 20 20 20 21Actual 23 25 20 Met/Not Met Met Met Met
Explanation of Measure
The Heidke Skill Score is one of several accepted standards of forecasting in the scientific community. It is calculated as follows:
Heidke skill score: S = ((c-e)/(t-e)) x 100 where c = number of stations correct and e = number of stations correct by chance = (1/3) x total number of stations in a 3 equal class system and t = number of stations, total
S is approximately equal to one-half of the correlation between forecast and observations.
Accurate measures of temperature are critical to many sectors of the national economy, including agriculture and energy utilities. This measure compares actual observed temperatures with forecasted temperatures from areas around the country. For those areas of the United States where a temperature forecast (warmer than normal, cooler than normal, normal) is made, this score measures how much better the prediction is than the random chance of being correct. Skill score is based on a scale of -50 to +100. If forecasters match a random prediction, the skill score is zero. Anything above zero shows positive skill in forecasting. Given the difficulty of making advance temperature and precipitation forecasts for specific locations, a skill score of 20 is considered quite good and means the forecast was correct in almost 50% of the locations forecasted. Forecasts will likely be better in El Niño years than in non-El Niño years. Temperatures across the United States will be measured using NOAA’s cooperative network maintained by volunteers across the nation. Temperature data will be collected and analyzed by NOAA.
Measure 5c: Number of New Monitoring or Forecast Products that Become Operational per Year (cumulative)
Data Validation and Verification:
Data source: NWS’s Climate Prediction Center andNational Environmental Satellite, Data, and InformationService’s (NESDIS’s) National Climatic Data Center(NCDC)Frequency: AnnualData storage: NCDCVerification: Products are reported to NOAAmanagement at quarterly reviews.Data limitations: The new products are a response toincreasing customer demands for expanded NOAAclimate information and services. New products will besubsequently monitored for use and, in the case offorecast products, current skill and projectedimprovements.Actions to be taken: None
4
8
4
1214
12
10
Pro
du
cts
8
6
4
2
0 2001 2002 2003
Target Actual
FY 1999 FY 2000 FY 2001 FY 2002 FY 2003Target New New 4 8 12Actual New New 4 Met/Not Met Met
262 FY 2001 APPR and FY 2003 APP

National Oceanic and Atmospheric Administration
Explanation of Measure
This performance measure reflects the seasonal to interannual climate team’s commitment to public service by stressing products that are available for public usage rather than data sets. A major motivation for this change was the formation of the new NOAA Climate Observations and Services program. New products will be developed and tested through NOAA research and implemented operationally through the NWS’s Climate Prediction Center or NCDC, as appropriate. As NOAA implements these products, usage will be evaluated through data transfers and external constituent interactions.
Research advances provide the potential for NOAA to significantly expand its range of climate products and services, particularly in areas of high customer demand for information and where climate variability significantly affects national interests. Examples include improved information on and forecasts of extreme climate events, such as droughts and floods, and development of new forecasts on time scales that are not currently included in NOAA’s operational product line but where customer demand and interest is large and growing.
Measure 5d: New Climate Observations Introduced
400 Data Validation and Verification:
Data source: Observations from data buoys, ships,satellites, and so onFrequency: AnnualData storage: Oceanic and Atmospheric Researchlaboratories, NESDIS, and NCDCVerification: NOAA performs quality assuranceanalysis and data processing.Data limitations: Percentages of observing platformsoperational at a given time and analyses of data qualityand errors; observations received in time to beincorporated in operational climate analyses andforecasts.Actions to be taken: None
120
174
275
132
Ob
serv
atio
ns 300
200
100
0
2001 2002 2003
Target Actual
FY 1999 FY 2000 FY 2001 FY 2002 FY 2003Target New New 120 174 275Actual New New 132 Met/Not Met Met
Explanation of Measure
Target met. For FY 2003, the target is 275 based on base funding.
NOAA is undertaking new efforts to better describe the atmosphere—ocean—land system to improve its climate monitoring and prediction capability. As a part of this effort, the Office of Oceanic and Atmospheric Research and NESDIS will expand their existing observation systems, that is, data buoys and new satellites.
The oceans provide the largest source of potential predictability for the climate system as well as the potential to produce large climatic surprises, and yet they are currently critically underobserved for certain variables and in many regions. This measure will continue NOAA’s long-term and sustained effort to improve ocean observational capabilities and to increase the usefulness of observations for this critical part of the Earth’s climate system. NOAA will complete an annual report detailing how
FY 2001 APPR and FY 2003 APP 263

National Oceanic and Atmospheric Administration
these new climate observations increased data density and coverage and how they will be used in climate analysis and prediction.
NOAA’s actions include, as resources permit, expanding its ocean observing systems, focusing on the highest priority variables for climate monitoring and prediction, and addressing critical oceanic data voids. NOAA will also place high priority on improving the assimilation and optimal use of ocean observations in climate models that are used for climate analyses and forecasts. NOAA will also estimate the reduction in analysis error that accompanies increases in data quality, density, and coverage.
FY 2001 Program Evaluation for Performance Goal 5: Implement Seasonal to Interannual Climate Forecasts
A number of NOAA line offices participate in the seasonal to interannual performance goal. The Office of Oceanic and Atmospheric Research conducts periodic reviews of the activities of its Environmental Research Laboratories. NESDIS holds management performance reviews several times a year. NWS conducts reviews of the National Centers for Environmental Prediction. In addition, the National Science Foundation and the National Research Council also evaluate programs. NOAA holds annual constituent workshops where NOAA’s seasonal climate forecast efforts are discussed with the community of seasonal- o interannual climate forecast users and where NOAA solicits input to shape future efforts.
Cross-cutting Activities
Other Government Agencies
NOAA works with a wide variety of partners in the area of climate forecasts, including other federal agencies (for example, the Federal Emergency Management Agency and the U.S. Agency for International Development), state and local agencies (for instance, state departments of environmental protection and emergency preparedness managers), academia, foreign government agencies, and international organizations. In preparing for the 1997–98 El Niño, NOAA worked closely with the Federal Emergency Management Agency and state and local officials, greatly improving public preparedness for the severe weather resulting from El Niño.
External Factors and Mitigation Strategies
A major failure of Earth observing and computing infrastructure would impair NOAA’s ability to produce seasonal to interannual forecasts. NOAA has been looking for backup outside the organization. For example, the Department of the Navy provides backup to the National Centers for Environmental Prediction mainframe computer.
An unanticipated major increase of the customer base for climate-related products may strain NOAA resources. In such an event, NOAA would prioritize its activities to meet the immediate increase in demand while it looks for alternative ways to meet the needs of all its customers.
Improving our understanding of the natural environment requires advanced infrastructure and therefore continual investment in new technology, such as supercomputers and environmental satellites.
264 FY 2001 APPR and FY 2003 APP

National Oceanic and Atmospheric Administration
Performance Goal 6: Predict and Assess Decadal to Centennial Change
Corresponding Strategic Goal
Strategic Goal 3: Observe and manage the Earth’s environment to promote sustainable growth
Rationale for Performance Goal
National Oceanic and Atmospheric Administration (NOAA) scientists provide policymakers with the scientific information and expert assessments necessary to make decisions on long-term global and regional environmental issues. NOAA research, conducted in conjunction with our national and international partners, contributes significantly to the understanding of these issues. Experts in these fields periodically compile, summarize, and evaluate the current state of scientific knowledge and report their findings in assessment documents. NOAA’s research, authors, and review of these documents are essential to ensure the highest quality science is available to support important decisions on long-term climate issues. Additionally the national effort in climate research increasingly focuses on reducing uncertainty in projections of climate change and on building the research, modeling, and observational systems to further this objective. Central to the issue of climate change are descriptions of the greenhouse gases that influence how radiation is absorbed by the planet. Knowledge of how carbon dioxide is stored and released and how this will change in the future is essential. Other greenhouse gases and aerosols with shorter atmospheric lifetimes may offer the chance to influence climate change over a shorter period, as well as provide benefits for other environmental issues.
Measure 6a: Assess and Model Carbon Sources and Sinks Throughout the United States
PerformanceMeasure FY 2002 FY 2003 FY 2004 FY 2005Assess and Establish Five Reduce Improved Model- Reduce Model Carbon New Pilot Uncertainty of data Fusion Uncertainty of Sources and Atmospheric Atmospheric Techniques and Atmospheric Sinks Over the Profiling Sites Estimates of U.S. Reduce Estimates of U.S. United States and Four New Carbon Balance Uncertainty of Carbon Balance
Oceanic Carbon to +/-50% Atmospheric to +/-40% Tracks Transport
Models
Explanation of Measure
The goal is to consistently document the distribution of the concentration of carbon and other greenhouse gases over the United States by FY 2007, which will provide an observational foundation to evaluate climate variability and change over long time periods.
This measure will reduce the uncertainties in climate projections and depends on major advances in understanding and modeling climate forcings (atmospheric concentrations and radiative roles of greenhouse gases and aerosols) and climate feedback mechanisms. In addition, this measure provides the advanced climate modeling community the capability to project future climate under a range of potential scenarios.
FY 2001 APPR and FY 2003 APP 265

National Oceanic and Atmospheric Administration
This measure ensures a long-term climate observing system that provides an observational foundation to evaluate climate variability and change and provides the mechanism to support policy and management decisions related to climate variability and change at national and regional scales.
Measure 6b: Assess and Model Carbon Sources and Sinks Globally
PerformanceMeasure FY 2002 FY 2003 FY 2004 FY 2005Assess and Model Establish Three Complete a Develop Carbon Improve Carbon Sources New Global Working Climate Measurements of and Sinks Background Sites Prototype of a Scenarios for North Atlantic Globally as Part of the Coupled Carbon- Input to and North Pacific
Global Flask climate Model Assessment Ocean Basin Network1 Carbon Dioxide
Fluxes to Within +/-0.1 Petagrams
Carbon/year 1 The Global Flask Network is an observational network of monitoring stations with headquarters in Boulder, Colorado.
Explanation of Measure
By FY 2008 NOAA will provide publicly available, routine inventory of carbon, heat, and salinity in the ocean basins and provide near –real-time, global carbon source and sink maps.
The research community is moving toward monthly mean maps, but it is hampered by data that is not at the appropriate temporal resolution. In addition, carbon models are only partially coupled to computer models that account for a changing ocean, atmosphere, and land.
Preliminary work suggests that feedbacks between the land and ocean and the atmospheric carbon dioxide concentration can be strong and result in release of carbon to the atmosphere from the stored pools on land and in the ocean.
Measure 6c: Determine the Actual Long-term Changes in Temperature and Precipitation Over the United States
PerformanceMeasure FY 2002 FY 2003 FY 2004 FY 2005Determine Actual Long-term Changes in Temperature and Precipitation Over the United States
Capture More Capture More Capture More Capture More than 60% of True than 70% of True than 80% of True than 90% of True Contiguous U.S. Contiguous US Contiguous U.S. Contiguous U.S. Temperature Temperature Temperature Temperature trend and Trend and Trend and Trend and Capture More Capture More Capture More Capture More than 25% of True than 40% of True than 55% of True than 70% of True Contiguous U.S. Contiguous U.S. Contiguous U.S. Contiguous U.S. Precipitation Precipitation Precipitation Precipitation Trend Trend Trend Trend
266 FY 2001 APPR and FY 2003 APP

National Oceanic and Atmospheric Administration
Explanation of Measure
This measure is designed to address the significant shortcomings in past and present observing systems by capturing more than 95% of the true contiguous U.S. national temperature trend and 80% of the true contiguous U.S. national precipitation trend by FY 2006.
Inadequacies in the present observing system increase the level of uncertainty when government and business decisionmakers consider long-range strategic policies and plans. The U.S. Climate Reference Network, a benchmark climate-observing network, will provide the nation with long-term (50 to100 years) high quality climate observations and records with minimal time-dependent biases affecting the interpretation of decadal to centennial climate variability and change. The fully deployed network will ensure that NOAA can measure more than 90% of the variance in monthly trends of temperature and precipitation at the national level. NOAA will deploy instrument suites in a combination of single and nearby paired sites.
Measure 6d: Results of 90% of NOAA Climate Research Activities Cited in the 2001 Intergovernmental Panel on Climate Change’s Third Assessment of Climate Change
FY 1999 FY 2000 FY 2001 FY 2002 FY 2003 Target N/A1 N/A1 90% cited N/A1 N/A1
Actual N/A1 N/A1 100% cited Met/Not Met N/A1 N/A1 Met
1 The Intergovernmental Panel on Climate Change assessments are only published every five years. In off years there are no results to report.
Data Validation and Verification:
Data source: Research from NOAA, the Office of Oceanic and Atmospheric Research, and the Aeronomy laboratoryFrequency: Periodic (approximately every three to five years)Data storage: NOAA’s Aeronomy laboratoryVerification: NOAA collects data using proven, peer-reviewed procedures. In addition, internationally qualified expertspeer review the results as part of the publication process.Data limitations: NoneActions to be taken: None
Explanation of Measure
Intergovernmental Panel on Climate Change assessments provide the scientific, technical, and economic information used to evaluate the effects of human activities and natural variability on climate system and to evaluate strategies to reduce and respond to these effects. These assessments are conducted under the sponsorship of the World Meteorological Organization and the United Nations Environment Program and take several years to produce. They are undertaken every three to five years based on advancements in science. The current assessment was released in January 2001. NOAA climate research results in articles that describe research methods, results, and conclusions. These articles are published in peer-reviewed, scientific journals and become part of the permanent scientific record. These articles are used as the basis for the Intergovernmental Panel on Climate Change assessments. More than 90%of the research on climate performed by NOAA scientists was used (cited) as source material for the current assessment document. This measure was added in the FY 2001 Annual Performance Plan to reflect work NOAA has been doing for several years.
FY 2001 APPR and FY 2003 APP 267

National Oceanic and Atmospheric Administration
FY 2001 Program Evaluation for Performance Goal 6: Predict and Assess Decadal to Centennial Change
A variety of outside reviewers routinely evaluates NOAA’s programs. NOAA’s Science Advisory Board, made up completely of private sector, university, and federal agency scientists, provides input on climate and air quality research. International science agencies, universities, and private sector scientists, as well as the National Research Council and the National Science Foundation review NOAA’s Office of Global Programs, funded through the Office of Oceanic and Atmospheric Research’s Climate and Global Change research line item. NOAA Research Laboratories are reviewed on a regular basis. The Sea Grant Colleges are visited at least every two years by a review panel. Sea Grant is a partnership between the nation’s universities and NOAA that began in 1966, when Congress passed the National Sea Grant College Program Act. Taking full advantage of regional expertise and commitment, Sea Grant pursues a national agenda through a highly interactive network of Sea Grant Colleges and research institutions.
Discontinued Measures
The following measures were discontinued in part because they do not accurately reflect NOAA’s ongoing work NOAA on climate and climate change. Additionally, their nature, which requires reporting in five-year increments, prohibits them from showing any annual trend or progress in reducing the uncertainties in climate projections or meeting any other objectives embodied in NOAA’s climate research initiative.
Document the Turnover of Chlorofluorocarbon (CFC) Source Gases (Whose Atmospheric Abundance Is Expected to Begin Decreasing in 1998) in Order to Verify the Effectiveness of Global Policy Actions
FY 1999 FY 2000 FY 2001 FY 2002 FY 2003 Target 1 N/A1 N/A1 N/A2 N/A1
Actual 1 N/A1 N/A1
Met/Not Met Met N/A1 N/A1
1 CFC assessment documents are produced every three to five years depending on the significance of the measured trends. In intervening years there are no results to report. 2 Whether or not a report is issued in 2002 depends on the significance of the detected trends.
Data Validation and Verification:
Data source: Research from NOAA, the Office of Oceanic and Atmospheric Research, and the Aeronomy laboratoryFrequency: Periodic (approximately every three to five years)Data storage: NOAA Aeronomy laboratoryVerification: NOAA collects data using proven, peer-reviewed procedures. Internationally qualified experts also peer reviewthe results as part of the publication process.Data limitations: NoneActions to be taken: None
Explanation of Measure
CFCs are man-made pollutants that react with the natural environment of the upper atmosphere and cause damage to the Earth’s protective ozone layer. Worldwide concern over the depletion of the ozone layer forced the enactment of global policies to restrict CFC production. Policymakers rely on the community of atmospheric scientists to document if new regulations are decreasing CFCs and restoring the Earth’s ozone layer. Turnover of gases refers to the increase and decrease of specific gases in the atmosphere over time. NOAA activities collect information and produce reports for peer-reviewed publication. Five years is the period generally used to expect reasonable progress in a field
268 FY 2001 APPR and FY 2003 APP

National Oceanic and Atmospheric Administration
so that a new assessment or report can be justified. Those products take two and a half to three years to produce. NOAA, the National Aeronautic and Space Administration, the United Nations’ Environmental Program, and the World Meteorological Organization sponsor the scientific assessments of the state of our understanding of the stratospheric ozone depletion. NOAA undertakes these assessments every three to five years based on scientific advancements. The fourth assessment was published in 1999. The fifth is presently underway and will be completed in the period 2002–04 depending on the significance of the detected trends.
Publish Updated Trend Results of Air Quality Measurements
FY 1999 FY 2000 FY 2001 FY 2002 FY 2003 Target 1 N/A1 1 N/A1 1 Actual 1 N/A1 1 Met/Not Met Met N/A1 Met
1 Updated air quality trend measurements are published every other year. In off years there are no results to report.
Data Validation and Verification:
Data source: Research from NOAA, the Office of Oceanic and Atmospheric Research, and the Aeronomy laboratoryFrequency: BiennialData storage: NOAA’s Air Resources LaboratoryVerification: NOAA collects data using proven, peer-reviewed procedures. Internationally qualified experts also peer reviewthe results as part of the publication process.Data limitations: Collection, analysis, and reporting of the data takes two and a half to five yearsActions to be taken: None
Explanation of Measure
NOAA’s mission includes the responsibility to publish scientific findings in peer-reviewed scientific literature and to communicate results to the public. This performance measure indicates how well long-term climate findings are being reported to a growing community of climate scientists and to an increasingly concerned public constituency. Five years is generally considered an appropriate timeframe in which to expect reasonable and reportable progress. Such products take two and a half to three years to produce. NOAA’s actions include collecting information and producing reports for peer-reviewed publication.
Lead Development of a Peer-reviewed Initial Assessment of Regional Ozone in North America, Including Summarizing Results for Customers
FY 1999 FY 2000 FY 2001 FY 2002 FY 2003 Target 1 N/A1 N/A1 N/A1 N/A1
Actual 1 N/A1 N/A1
Met/Not Met Met N/A1 N/A1
1 It generally takes five years to collect and analyze sufficient data to make significant statements about regional ozone. Data are being collected and analyzed in the years between the release of the reports; therefore, there is no performance measure to report.
Data Validation and Verification:
Data source: Research from NOAA, the Office of Oceanic and Atmospheric Research, and the Aeronomy laboratoryFrequency: Periodic (approximately every three to five years)Data storage: NOAA’s Aeronomy laboratoryVerification: NOAA collects data using proven, peer-reviewed procedures. Internationally qualified experts also peer reviewthe results as part of the publication process.Data limitations: Collection, analysis, and reporting of the data takes two and a half to five yearsActions to be taken: None
FY 2001 APPR and FY 2003 APP 269
National Oceanic and Atmospheric Administration
Explanation of Measure
NOAA’s actions include collecting data and providing assessment of regional ozone and air quality. Regional ozone affects public health by reducing air quality. This measure will provide a baseline assessment of regional ozone in North America and provide vital data to air quality managers and decisionmakers. Five years is generally considered to be a reasonable timeframe in which to expect enough progress in a field to warrant a new assessment or report. Such products take two and a half to three years to produce. The assessments conducted under the North American Research Strategy for Tropospheric Ozone are conducted at intervals of three to five years based on the scientific advancements that have occurred and the perceived requirements for updates to Congress, the Office of Science and Technology Policy, and the Committee on Environment and Natural Resources.
Cross-cutting Activities
Intra-Department of Commerce
In partnership with the Technology Administration and the International Trade Administration within the Department of Commerce, other federal agencies, the private sector, and academia, NOAA is providing the foundation the United States will depend upon to lead new emerging global industries in economically and environmentally sustainable ways.
Government/Private Sector
NOAA depends strongly on universities to help accomplish its science objectives through a network of joint and cooperative institutes and universities.
NOAA also funds academic researchers through competitive, peer-reviewed programs, including the Global Climate Change Program.
External Factors and Mitigation Strategies
The science of climate change crosses generations and has progressed as a result of evolving technology. Our ability to measure performance is contingent upon many external factors, including the advancement of climate change itself. While the time frame of these processes spans decades and even centuries, the reporting periods extend over years.
Improving our understanding of the natural environment requires advanced infrastructure and therefore continual investment in new technology, such as supercomputers and environmental satellites.
270 FY 2001 APPR and FY 2003 APP

National Oceanic and Atmospheric Administration
Performance Goal 7: Promote Safe Navigation
Corresponding Strategic Goal
Strategic Goal 3: Observe and manage the Earth’s environment to promote sustainable growth
Rationale for Performance Goal
The National Oceanic and Atmospheric Administration (NOAA) serves commercial and recreational mariners around the nation by providing these customers with nautical charts, tides and currents data, and geographic positioning data for safe navigation. Geodetic services are vital to the mapping and surveying industry nationwide because they provide integrity to geographic coordinates obtained from Global Positioning Satellite (GPS) system signals for accurate positioning in support of numerous applications, including land surveying, navigation, mapping, and infrastructure development such as 911 emergency response and scientific applications. Shoreline data and real-time tides and currents information also serve the coastal resource management and oil spill and disaster response communities. NOAA continues to explore innovative ways to modernize its services in a cost-efficient manner to meet customer needs.
Measure 7a: Reduce the Hydrographic Survey Backlog (Square Nautical Miles) for Critical Navigation Areas (Cumulative Percentage)
(This measure has been reworded since the publication of the FY 2000 Annual Program Performance Report and FY 2002 Annual Performance Plan. This measure was previously worded as: “Cumulative percentage reduction in the backlog (square nautical miles) of hydrographic surveys for critical areas.”)
60
38.3
35.0
20.7
24.3
27.8
31.2
20.7
24.3
Data Validation and Verification:
Data source: Progress reports on data collected fromhydrographic survey platformsFrequency: AnnualData storage: National Ocean Service will store data andpublish nautical charts.Verification: National Ocean Service will applyestablished verification and validation methods.Data limitations: Progress in reducing the backlog ismeasured against a baseline value of 43,000 squarenautical miles as determined in 1994. Weather can affectscheduled surveys.Actions to be taken: None
50
Per
cen
t 40
30
20
10
0
1999 2000 2001 2002 2003
Target Actual
FY 1999 FY 2000 FY 2001 FY 2002 FY 2003Target 20.7% 24.3% 27.8% 35.0% 38.3%Actual 20.75 24.3% 31.2% Met/Not Met Met Met Met
Explanation of Measure
NOAA conducts hydrographic surveys to determine the depths and configurations of the bottoms of water bodies, especially of those that pertain to navigation. This includes the detection, location, and identification of wrecks, primarily through the use of side scan and multibeam sonar technology and GPS.
FY 2001 APPR and FY 2003 APP 271

National Oceanic and Atmospheric Administration
This information is critically important to the production of both paper and electronic navigational charts for safe and efficient navigation. In addition to the commercial shipping industry, other user communities that benefit include recreational boaters, the commercial fishing industry, port authorities, coastal zone managers, and disaster response planners. Ships traversing our coastal waters rely on charts based on sounding data that are more than 50 years old in many places. In 1994, NOAA identified 43,000 square nautical miles of seafloor in U.S. waters in critical need of resurvey, with more than half of this area in Alaskan waters. Many of these high-priority areas carry heavy commercial traffic, are less than 30 meters deep, and are changing constantly. NOAA’s surveying activities balance in-house resources with contracts and use the latest full bottom coverage sounding technologies to eliminate the remaining critical area backlog of approximately 30,000 square nautical miles in the nation’s ports, harbors, and other coastal areas. NOAA’s hydrographic fleet supporting in-house surveying capabilities consists of the Whiting, the Rude, and the Rainier. The National Ocean Service will coordinate acquisition and processing of hydrographic surveys both in house and through contracts.
The percentage increase reflects an exceptional 2001 field season for hydrographic data collection by NOAA ship Rainier. Because variables such as weather, mechanical failure, and level of surveying difficulty are not constant for NOAA or its contractors, this increase may not be repeated or predicted in a given year. For example, in 2001, the survey areas completed in Alaska by both Rainier and contractors were very deep, allowing for wide-spaced survey lines without difficult shoreline and shallow area investigation, which takes additional time to complete.
Measure 7b: Percentage of National Spatial Reference System (NSRS) Completed (Cumulative %)
(This measure has been reworded since the publication of the FY 2000 Annual Program Performance Report and FY 2002 Annual Performance Plan. This measure was previously worded as: “Cumulative percentage of NSRS completed enough to provide a common geographic framework tied to GPS.”)
Data Validation and Verification:
100 Data source: The National Ocean Service and the National
80
82 78
59 64 75 75
59 71
Geodetic Survey define and manage the NSRS, the foundation for the nation’s spatial data infrastructure.
60 Frequency: Ongoing, annual reporting Data storage: Automated database at National Ocean
40 Service Verification: National Ocean Service will apply
20 standard verification and validation methods. Data limitations: Weather conditions, security,
0 employment, and funding issues can affect field
1999 2000 2001 2002 2003 operations. The National Geodetic Survey also works cooperatively with state organizations; accommodating partners can also impact activities to some extent.
Target Actual Actions to be taken: None
FY 1999 FY 2000 FY 2001 FY 2002 FY 2003
Per
cen
t
Target 59 64 75 78 82Actual 59 71 75 Met/Not Met Met Met Met
272 FY 2001 APPR and FY 2003 APP

National Oceanic and Atmospheric Administration
Explanation of Measure
This measure was added in FY2000 to replace the Physical Oceanographic Real Time System measure, which was discontinued due to lack of funding increases in 1999 and 2000. The NSRS performance measure is effective because it integrates the different components of the geodesy program into a product with more relevance to users rather than measuring individual components of horizontal and vertical positioning.
In order to meet the nation’s navigation and other positioning needs, NOAA is enhancing the NSRS to provide the higher accuracy and accessibility needed for use with the space-based GPS, whose satellites transmit signals that allow determination of position, height, velocity, and time. The NSRS, a system of reference stations and monuments across the nation, provides integrity to geographic coordinates obtained from GPS satellite signals for accurate positioning in support of numerous applications, including land surveying, navigation, mapping, and infrastructure development such as 911 emergency response and scientific applications. New uses for GPS are being found every day, and many of them involve precision heights.
FY 2001 Program Evaluation for Performance Goal 7: Promote Safe Navigation
NOAA’s goal to promote safe navigation is evaluated at a variety of levels, from peer reviews of products, papers, and projects to internal and external reviews of entire programs and quarterly reviews of NOAA’s overall performance in navigation products and services. Constituent input is an important part of the evaluation process and is solicited regularly through constituent workshops.
From 1992 to 1996, a number of National Research Council Marine Board studies examined the nautical charting program and its transition into the digital era. NOAA incorporated study recommendations on areas such as reducing the survey backlog, implementing new digital production techniques, and delivering new electronic chart products to the program. The Hydrographic Services Improvements Act of 1998 provided Congress and NOAA an opportunity to evaluate NOAA’s capabilities for acquisition and dissemination of hydrographic data, develop standards and formats for hydrographic services, and contract for the acquisition of hydrographic data. NOAA now contracts out more than 50% of its annual critical area hydrographic survey requirements while maintaining federal competence and expertise with existing and developing surveying technologies.
In 1998, Congress authorized the height modernization study to evaluate the technical, financial, legal, and economic aspects of modernizing the national height system with GPS. The study demonstrated the significant benefits to the nation in terms of dollars and lives saved associated with GPS technology, and it led to current development of the vertical component of the NSRS. In 1999 NOAA completed an assessment of its tidal currents program to develop guidelines for future current surveys to update U.S. reference stations for the Tidal Current Tables. Finally, the September 1999 Report to Congress that assessed the U.S. Marine Transportation System further articulated the need for coordinated federal leadership to achieve the U.S. Marine Transportation System vision of becoming the world’s most technologically advanced, safe, efficient, globally competitive, and environmentally responsible system for moving goods and people. NOAA’s navigation safety support functions underwent substantial review to identify opportunities for greater integration among federal agencies.
Cross-cutting Activities
Intra-Department of Commerce
In partnership with the Technology Administration and National Telecommunications and Information Administration within the Department of Commerce and other civil agencies from all
FY 2001 APPR and FY 2003 APP 273

National Oceanic and Atmospheric Administration
civil departments, NOAA participates on the Interagency GPS Executive Board, which with the Department of Defense jointly manages the GPS satellite program as a national asset. Now a dual-use system heavily employed by civilian and commercial sectors, GPS is a global information utility that the United States has committed to provide free to the world for use as the international standard for navigation, positioning, and timing.
Other Government Agencies
NOAA works closely with agencies such as the Department of Transportation, the U.S. Coast Guard, and the U.S. Army Corps of Engineers in support of Marine Transportation System goals and objectives to identify and improve navigation services for maritime commerce while preserving navigation and environmental safety. NOAA and the Department of Transportation also cooperate on the development of the Nationwide Differential GPS System, which employs NOAA’s Continuously Operating Reference Stations to enable highly accurate GPS positioning in three dimensions across the nation. This system benefits from a multipurpose cooperative effort among government, academia, and the commercial sector and supports numerous NOAA objectives and activities.
External Factors and Mitigation Strategies
Weather has a significant impact on the promotion of safe navigation activities. Both in-house and contract hydrographic survey schedules can be affected by adverse weather conditions (storms, winds, and high seas) and equipment failure, as can aerial photography flights scheduled for shoreline photogrammetry. Storm damage frequently renders water-level stations inoperable, affecting surveying capabilities and real-time observations of water levels and currents so critical to safe navigation. Natural disasters such as earthquakes and hurricanes can elevate the critical priority of an area because of shoreline changes or obstruction accumulation; man-made impacts such as shifts in shipping patterns, newly regulated shipping lanes, port expansions, or wrecks will also increase NOAA’s designated critical areas. NOAA also receives requests to survey areas not identified as critical. For example, ship groundings frequently prompt requests from the U.S. Coast Guard and others to survey noncritical areas, diverting efforts away from the survey schedule. Finally, in addition to mission activities, NOAA ships and aircraft provide immediate response capabilities for unpredictable events such as recovery and search efforts after the TWA Flight 800 and EgyptAir Flight 990 crashes; damage assessments after major oil spills such as the Exxon Valdez, the Persian Gulf War, and the New Carissa; and severe hurricanes. NOAA mitigates the impacts of weather, disaster events, and equipment malfunction with backup plans for relocating assets to other projects, or by reassessing schedules for other windows of opportunity.
274 FY 2001 APPR and FY 2003 APP