Embed Size (px)
DESCRIPTION
Índice de Innovación de México
Citation preview
NATIONAL INNOVATIONINDEX
3.6”35º
2.1”
1
INDEX
Preface
Contributors
Board of Advisors
1. Rankings
2. Innovation
2.1. Innovation
2.2. National System of Innovation
2.3. Why Measure Innovation?
2.4. How to Measure Innovation?
3. Objectives
4. Methods
5. Innovation in Mexico
5.1. Human Capital and R&D
5.2. Private Sector
5.3. Public Sector
Apendix
Annex I. Ranking of Pillars
Annex II. Innovation Pillars
Annex III. Survey to FIrms and Institutions of RENIECYT
Annex IV. Description of Variables
1
4
5
6
12
12
12
13
15
17
19
21
23
25
26
33
41
43
45
2
PREFACE
Innovation is a driver of a country’s development and economic growth in the long-term. It enables
productivity growth, the generation of employment and the promotion and creation of new indus-
tries. Given the uncertainty in global markets and the economic stagnation of recent years, it is essen-
tial to find new ways to boost the economy; one alternative to overcome the current economic and
financial crisis is to stimulate and enable innovation.
Innovation has also become increasingly important to improve the social welfare of people. By crea-
ting new products and services, innovation plays a key role in addressing more complex problems such
as health, poverty and education, among others.
Despite the importance of innovation, in Mexico there is no way to measure or quantify it at a regio-
nal and local level. Venture Institute, together with its partners, is pleased to present the National Innovation Index (INI, for its Spanish acronym), the first study that describes Mexico’s innovation
level. The INI is the first Mexican study that creates a conceptual framework to assess the multidi-
mensional aspects determining innovation in the country, thus contributing to the understanding
of the national innovation process. The INI is based on international best practices to measure inno-
vation, and classifies 86 cities and 32 states according to their level of innovation.
With this study, Venture Institute -in its commitment to the development of the entrepreneurship and
innovation ecosystem of Mexico- generates valuable information to enable a greater understanding
of how innovation takes place in our country. The INI is a useful tool for individuals, organizations and
companies interested in innovation and in the national innovation system. The index also facilitates
the identification of strengths and weaknesses involved in the innovation process, so that decision
makers can better allocate resources and design policies that encourage innovation.
3
The development of the INI was possible through the support of various partners. We thank the Na-
tional Council for Science and Technology (CONACYT) and the Ministry of Economy who, through
the Sectorial Innovation Fund (FINNOVA), sponsored this initiative. We also thank our strategic part-
ners Micro-MercadosDescifra, one of the most important consulting firms offering geo-referenced
analysis in the country, and IDEA Foundation, a public policy think-tank leader in Mexico, who both
devoted time and resources to the creation of this study . We also make a special mention of the
various partners that during the course of the project made significant contributions, to name a few:
FUNDES México and Endeavor Mexico. Finally, we recognize those companies that were participants
in obtaining the information that is published in this study.
The National Innovation Index is the result of an unprecedented collective effort to characterize inno-
vation at a regional level. It is part of a vision to understand in depth the dynamics of innovation, as
well as provide a tool for measuring and monitoring it. In this sense, Venture Institute seeks feedback
from various stakeholders to further refine the study.
Venture InstituteFirm dedicated to the development of the entrepreneurial and innovation ecosystem of Mexico through
an innovation platform comprising the formation of high-impact entrepreneurs, innovative business
development and project financing with venture capital. Part of its mission is to create and develop
research projects that increase the understanding of entrepreneurship and innovation in Mexico. Venture
Institute is also involved in the design and implementation of academic programs at the undergraduate
and graduate level.
Sectorial Innovation Fund (FINNOVA)Fund created in 2010 by the Ministry of Economy together with CONACYT, in order to drive inno-
vation. The FINNOVA supports scientific research, technological development and innovation.
4
CONTRIBUTORS
The study was developed under the direction of Federico Antoni Loaeza (Managing Partner, Venture Institute).
The study was prepared and coordinated by a team composed of:
-Dimitrio Gómez, Project Leader, Venture Institute
-Julia Naime, Lead Researcher, Venture Institute
-Roberto Wong, External Advisor, Micro-Mercados Descifra
-Anastasiya Prymovich, Associated Researcher, Energy Associate at QRI
-Natalia Villalpando, Associated Researcher, Fundación IDEA
-Pilar Espinosa, Research Analyst, Micro-Mercados Descifra
The following institutions supported the creation of the National Innovation Index:
Technology Partners
Micro Mercados Descifra
Knowledge Partners
Fundación Idea
FUNDES México

5
BOARD OF ADVISORS
The board of advisors was formed with the the goal of obtaining support and guidance throughout
the development of the study. The council is composed of leading academics and highly regarded
professionals in innovation within the country.
Federico Antoni LoaezaManaging Partner of Venture InstituteProfessor of entrepreneurship at ITAM and CENTRO
Co Founderof the Business School CENTRO.
MBA, Stanford University GSB.
Master in Applied Economics, Université Paris
Dauphine.
Fernando Lelo de Larrea H. Managing Partner of Venture InstituteProfessor of entrepreneurshipat ITAM and CENTRO
Co Founder of the Business School Centro.
MBA, Stanford University GSB.
Master in Economics, London School of Economics.
Alberto Saracho Managing Director, C230Executive Director, Fundación IDEA
Master en Public Policy, Harvard University
Daniela Ruiz MassieuProfessor and Coordinator of the Entrepre-neurship Degree, ITAM MBA,Stanford University Graduate School of
Business.
Enrique GoldbargEditorialista, Periódico ReformaConsultant in Innovation for Competitivity,
CONACyT and World Bank
Master in Science, London University
PhD in Pathology, UNAM
Mario de la Cruz SarabiaDirector of Government Affairs and Technolo-gy, Cisco Systems MexicoMinister of Economic Development, Government
of Tabasco (July 1998- May 2010)
MBA, University of Southern California
Rocío AbudManager of Research Projects, FUNDES MéxicoMsC Social Policy, London School of Economics
Rodrigo Canales, PhDAssistant Professor, Yale School of ManagementPhD Global Economics and Management, MIT
Sloan School of Management
Pilar Aguilar, MBAAdministrative Director, Endeavor México MBA, University of Texas at Austin
6
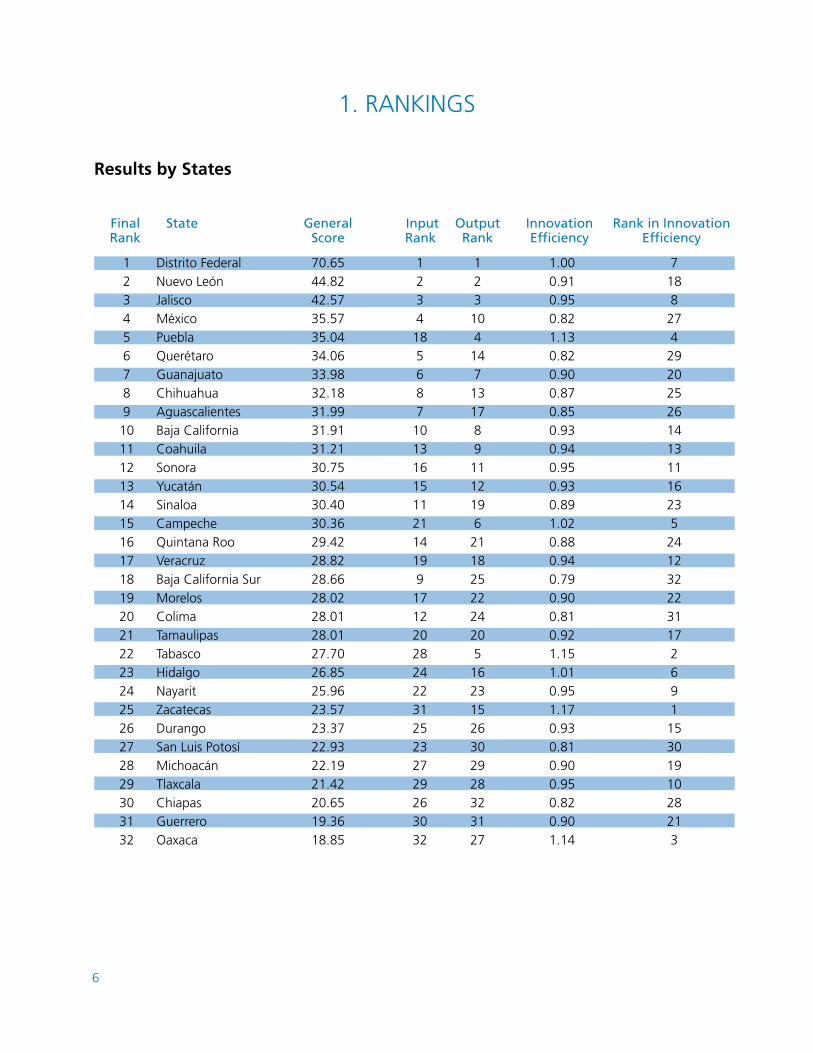
State GeneralScore
InputRank
InnovationEfficiency
Rank in Innovation Efficiency
OutputRank
FinalRank
Distrito FederalNuevo LeónJaliscoMéxicoPueblaQuerétaroGuanajuatoChihuahuaAguascalientesBaja CaliforniaCoahuila SonoraYucatánSinaloaCampecheQuintana RooVeracruz Baja California SurMorelosColimaTamaulipasTabascoHidalgoNayaritZacatecasDurangoSan Luis PotosíMichoacán TlaxcalaChiapasGuerreroOaxaca
1234567891011121314151617181920212223242526272829303132
70.6544.8242.5735.5735.0434.0633.9832.1831.9931.9131.2130.7530.5430.4030.3629.4228.8228.6628.0228.0128.0127.7026.8525.9623.5723.3722.9322.1921.4220.6519.3618.85
1234185687101316151121141991712202824223125232729263032
1231041471317891112196211825222420516231526302928323127
1.000.910.950.821.130.820.900.870.850.930.940.950.930.891.020.880.940.790.900.810.921.151.010.951.170.930.810.900.950.820.901.14
7188274292025261413111623524123222311726911530191028213
Results by States
1. RANKINGS
7
GeneralRank
GeneralRank
General Score
General Score
InputRank
InputRank
InnovationEfficiency
InnovationEfficiency
EfficiencyRank
EfficiencyRank
OutputRank
OutputRank
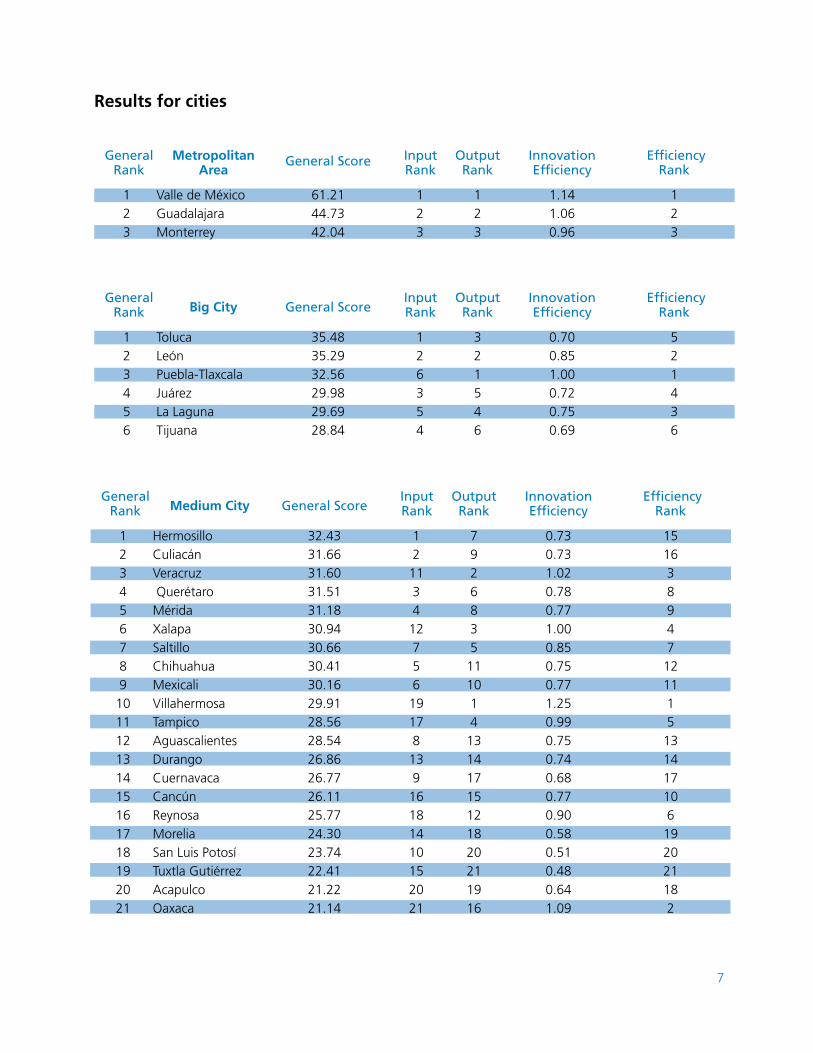
MetropolitanArea
Big City
Valle de México GuadalajaraMonterrey
TolucaLeónPuebla-TlaxcalaJuárezLa LagunaTijuana
123
123456
61.2144.7342.04
35.4835.2932.5629.9829.6928.84
123
126354
123
321546
1.141.060.96
0.700.851.000.720.750.69
123
521436
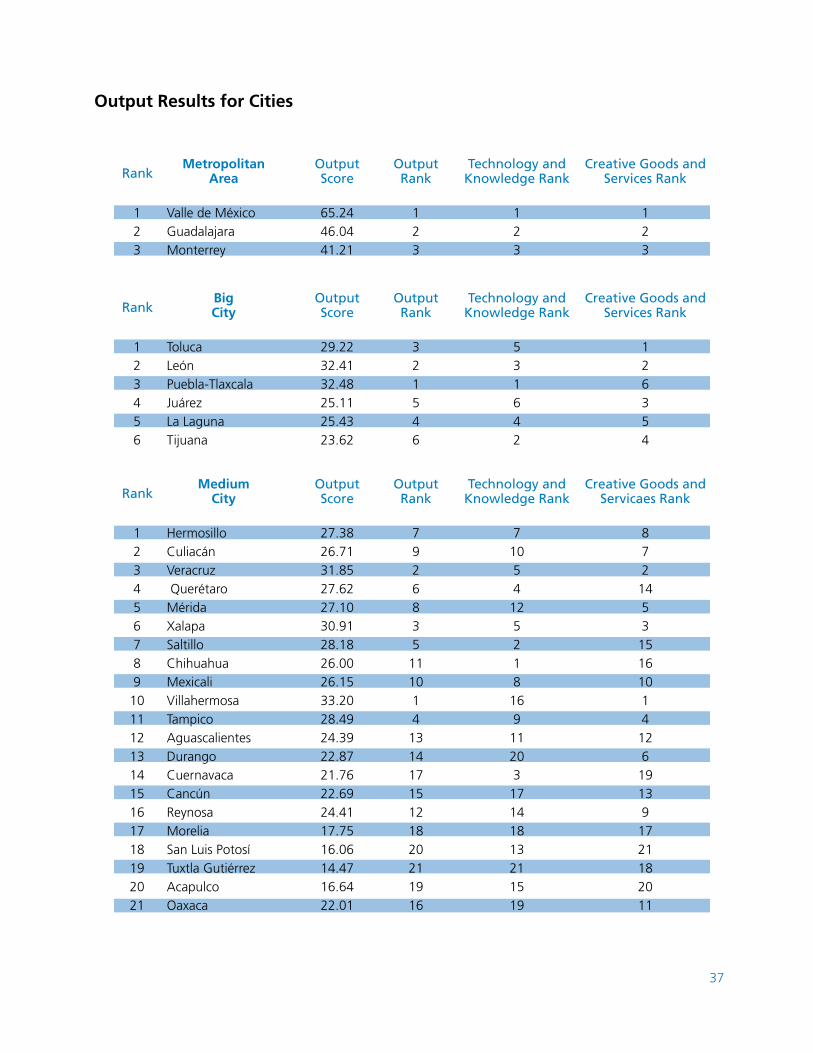
Results for cities
GeneralRank General Score
InputRank
InnovationEfficiency
EfficiencyRank
OutputRankMedium City
123456789101112131415161718192021
32.4331.6631.6031.5131.1830.9430.6630.4130.1629.9128.5628.5426.8626.7726.1125.7724.3023.7422.4121.2221.14
121134127561917813916181410152021
792683511101413141715121820211916
0.730.731.020.780.771.000.850.750.771.250.990.750.740.680.770.900.580.510.480.641.09
151638947121115131417106192021182
HermosilloCuliacánVeracruz QuerétaroMéridaXalapaSaltilloChihuahuaMexicaliVillahermosaTampicoAguascalientesDurangoCuernavacaCancúnReynosaMoreliaSan Luis PotosíTuxtla GutiérrezAcapulcoOaxaca
8
GeneralRank General Score
InputRank
InnovationEfficiency
EfficiencyRank
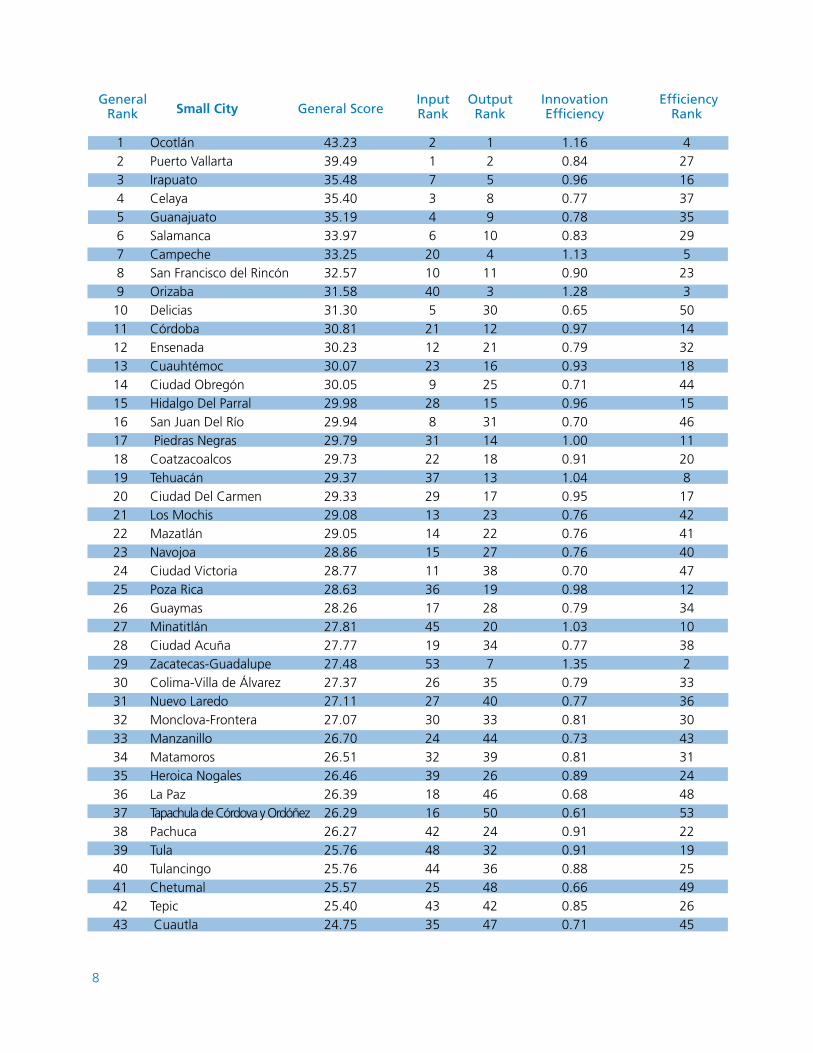
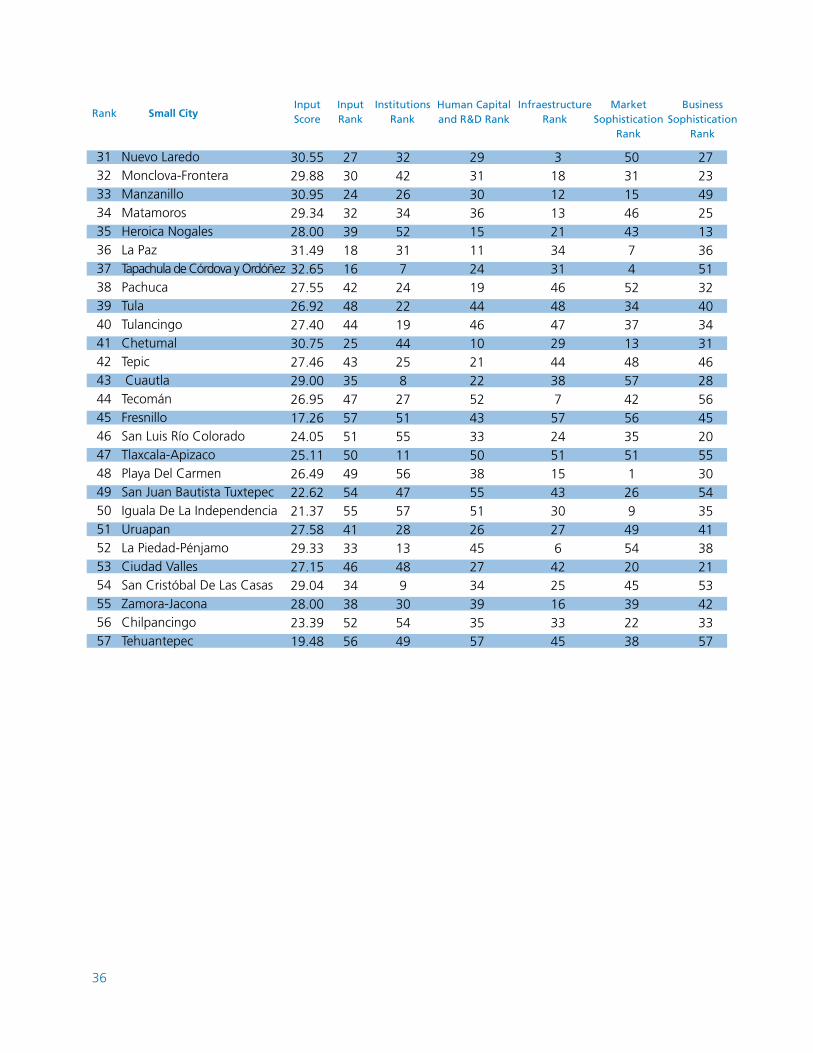
OutputRankSmall City
12345678910111213141516171819202122232425262728293031323334353637383940414243
43.2339.4935.4835.4035.1933.9733.2532.5731.5831.3030.8130.2330.0730.0529.9829.9429.7929.7329.3729.3329.0829.0528.8628.7728.6328.2627.8127.7727.4827.3727.1127.0726.7026.5126.4626.3926.2926.2725.7625.7625.5725.4024.75
21734620104052112239288312237291314151136174519532627302432391816424844254335
125891041133012211625153114181317232227381928203473540334439264650243236484247
1.160.840.960.770.780.831.130.901.280.650.970.790.930.710.960.701.000.911.040.950.760.760.760.700.980.791.030.771.350.790.770.810.730.810.890.680.610.910.910.880.660.850.71
427163735295233501432184415461120817424140471234103823336304331244853221925492645
OcotlánPuerto VallartaIrapuatoCelayaGuanajuatoSalamancaCampecheSan Francisco del RincónOrizabaDeliciasCórdobaEnsenadaCuauhtémocCiudad ObregónHidalgo Del ParralSan Juan Del Río Piedras NegrasCoatzacoalcosTehuacánCiudad Del CarmenLos MochisMazatlánNavojoaCiudad VictoriaPoza RicaGuaymasMinatitlánCiudad AcuñaZacatecas-GuadalupeColima-Villa de ÁlvarezNuevo LaredoMonclova-FronteraManzanilloMatamorosHeroica NogalesLa PazTapachula de Córdova y OrdóñezPachucaTulaTulancingoChetumalTepic Cuautla
9
GeneralRank
General Score InputRank
InnovationEfficiency
EfficiencyRank
OutputRank
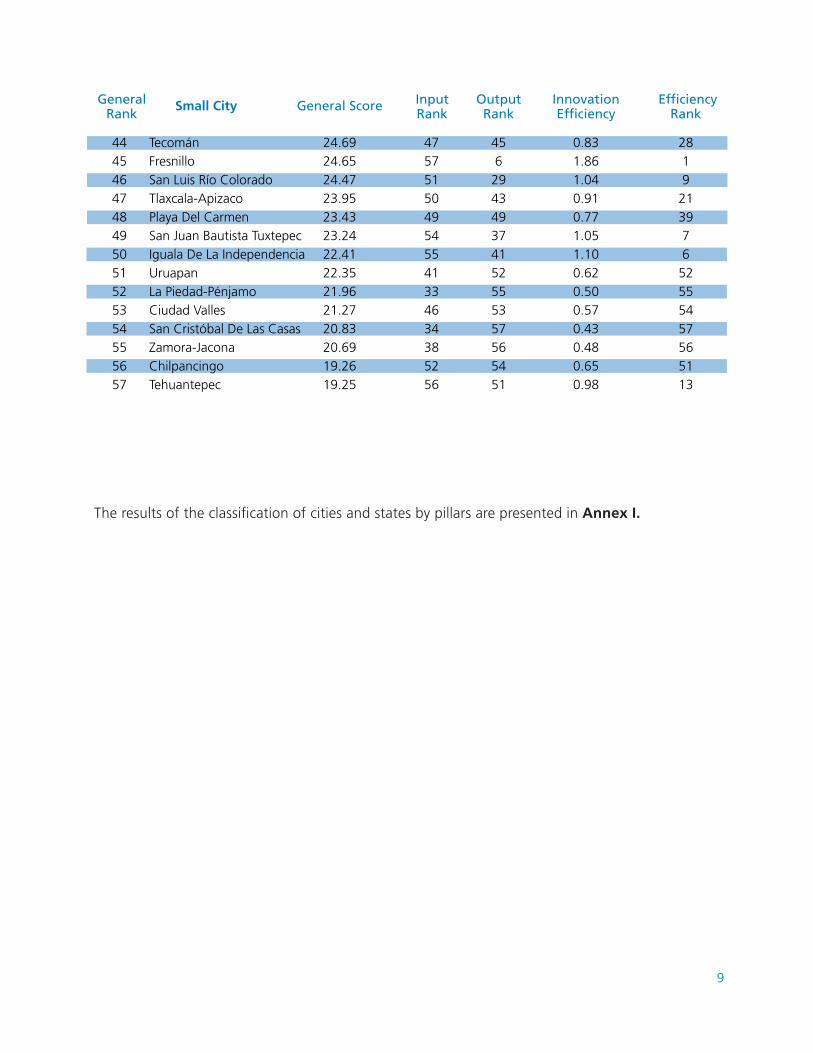
Small City
4445464748495051525354555657
24.6924.6524.4723.9523.4323.2422.4122.3521.9621.2720.8320.6919.2619.25
4757515049545541334634385256
456294349374152555357565451
0.831.861.040.910.771.051.100.620.500.570.430.480.650.98
281921397652555457565113
TecománFresnilloSan Luis Río ColoradoTlaxcala-ApizacoPlaya Del CarmenSan Juan Bautista TuxtepecIguala De La IndependenciaUruapanLa Piedad-PénjamoCiudad VallesSan Cristóbal De Las CasasZamora-JaconaChilpancingoTehuantepec
The results of the classification of cities and states by pillars are presented in Annex I.
10
2. INNOVATION
2.1 What is innovation?
From a broad perspective, innovation may be considered as any change or creation that generates
value. Innovation involves the adoption of new technologies and knowledge that transform the eco-
nomy and productivity of a country, region or firm.
The Oslo Manual of the OECD defines innovation as “the implementation of a new or significantly improved product (good or service), or process, a new marketing method or a new organizational method in business practices, workplace organization or external relations” (OECD, 2005). From this
definition, four types of innovation are distinguished:
• Product innovation: a good or service that is new or significantly enhances the characteris-
tics or intended uses. This includes improvements in the components, materials, incorpora-
ted software, ease of use and other functional features.
• Process innovation: the implementation of a new or significantly improved production or
delivery method. These include changes in techniques, equipment or software.
• Marketing innovation: the implementation of a new marketing method involving signifi-
cant changes in the design or packaging, placement, promotion and pricing of the product.
• Organizational innovation: a new organizational method in business practices, workplace
organization or external relations of the firm.
Depending on its diffusion, the impact of an innovation may be in a business, industry or market level.
This study considers only business innovation, considering that firms are the ones that bring innova-
tion to the market. Therefore, the study does not cover innovation in the industry or economy (e.g.
the emergence of a new market) level.
Business innovation depends on a process in which knowledge and technology originate from various
stakeholders: researchers, academia, entrepreneurs, political and financial institutions. This process
generally consists of 5 stages (Desouza et al 2009.):
11
1. The generation and mobilization of ideas.
The generation of new ideas should be fostered bythe pressure generated by competition and
creativity. The mobilization of ideas between different stakeholders is essential at this stage as
it facilitates their development.
2. Review and selection of ideas.
This step is to consider only the ideas with the greatest potential for value creation and econo-
mic or social growth.
3. Experimentation.
The experiment proves the feasibility of the ideas in a given environment and helps to confirm
that the invention or idea actually solves a problem.
4. Marketing.
Brings innovation to a larger scale and expands and deploys the new product, service , or me-
thod of organization in a market.
5. Difussion and implementation.
This stage is the final acceptance of innovation and implementation of structures and resources
required for production, maintenance and dissemination of innovation.
These five stages do not necessarily follow a linear pattern; they provide a useful conceptual fra-
mework to understand how innovation emerges. In each stage, different actors interfere and, with
their knowledge and experience, contribute to the generation of new products, services, marke-
ting methods and organizational processes. Thus, innovation is seen as a dynamic process in which
knowledge is accumulated through learning and economic and social interactions.
2.2 National System of Innovation
Traditional analysis of innovation focused on inputs, such as total amount spent on research and de-
velopment (R&D) by the government and businesses. This approach perceives innovation as a result
of R&D. However, we have seen that innovation is not generated spontaneously or in linear fashion:
it requires a process that depends on how multiple conditions and agents interact. This has led in
recent years to evaluate innovation within a wider framework that can include the institutional and
economic context in which it is generated.
The innovation performance of a country depends on the trajectory of itsscience and technology po-
licy and the circumstances that define how it is that innovation is generated. Public policies related to
the regulation, taxation, finance, competition and intellectual property can block or facilitate interac-
tions between actors and the flow of information among them. Furthermore, institutional differences
12
in the development and diffusion of new technologies play an important role in the determination of
the growth rate of an economy (Freeman, 1995).
The concept of innovation system describes innovation as a process in which the importance of inte-
ractions between different actors, such as the transmission and dissemination of ideas and knowled-
ge, and the importance of the social, cultural and political context that guides and defines innovation
are emphasized. Definitions of national innovation systems vary, but the fundamental concept lies in
describing the network of innovation agents and how these innovation agents interact.
The systemic focus of innovation has analytical advantages since it emphasizes the importance of the
flow of ideas and knowledge and includes a greater number of actors in the generation of knowle-
dge. This focus also includes the importance of conditions, regulations and policies in which markets
operate; therefore the role of governments to monitor and define the overall context in which inno-
vation takes place is fundamental.
The INI seeks to describe Mexico’s innovation system. It considers a wide variety of variables that
enable itto describe how innovation is developed in the country, in a context specific to the state or
the city. In order to do this, the system evaluates Mexican innovation measuring both the inputs and
outputs of innovation.
2.3 Why measure innovation?
Evaluating and measuring innovation is important, for it is the initial stepping stone to achieve a bet-
ter understanding of how innovation develops within acountry. Measuring innovation provides useful
elements to make betterdecision regardingbusiness strategy and public policy generation, dissemi-
nation, appropriation and the use of new knowledge. For businesses, having information about the
characteristics of innovation and competition in a region may be useful to developbetter strategies for
business growthand development. Furthermore, with a good measurement of innovation, research
institutes and academia can easily identify the impact of knowledge generated and identify the diffi-
culties in the dissemination and application of new knowledge.
Economic models showhow innovation is a key driver of economic growth in the long term. In a clas-
sic economics book, “Theory of Economic Development”, Joseph Schumpeter notes the importance
of innovation in economic growth and the role of “creative destruction” to create radical changes and
increase wealth and productivity. Economists highlight the importance of new ideas and technology
as determinants of economic growth, since they generate solutions to diminishing marginal returns
(Romer 1986), and allow the generation of new industries and organizational models.
13
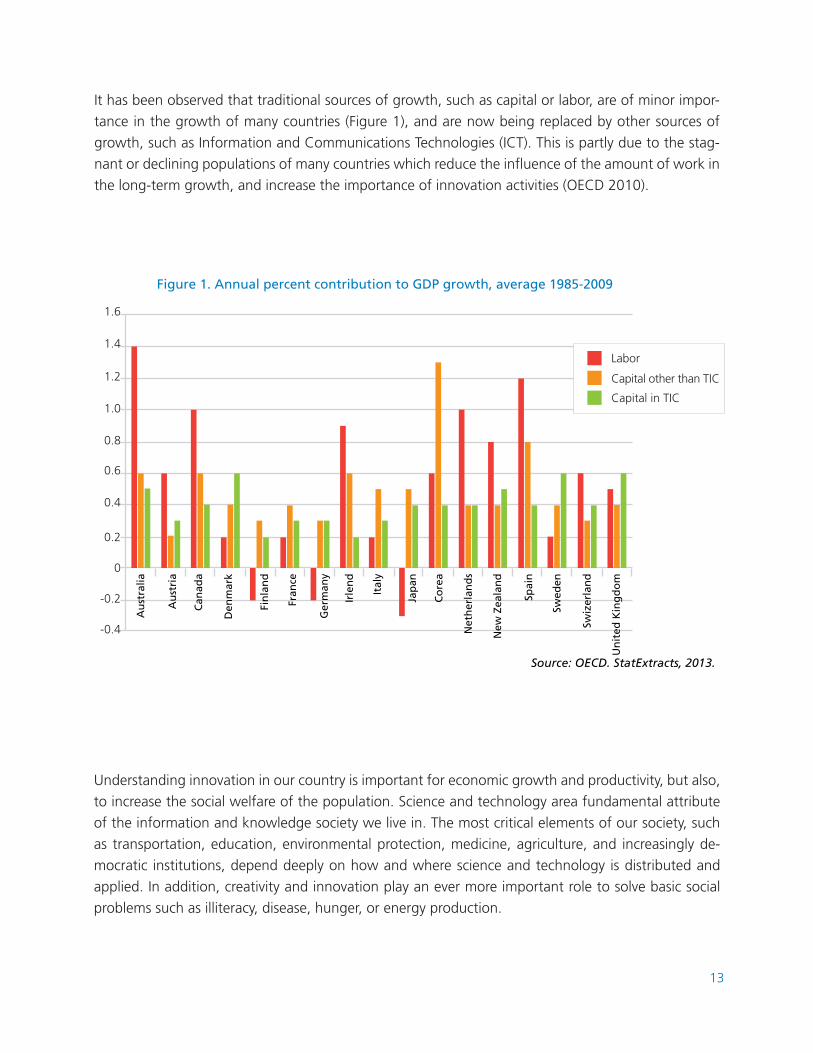
It has been observed that traditional sources of growth, such as capital or labor, are of minor impor-
tance in the growth of many countries (Figure 1), and are now being replaced by other sources of
growth, such as Information and Communications Technologies (ICT). This is partly due to the stag-
nant or declining populations of many countries which reduce the influence of the amount of work in
the long-term growth, and increase the importance of innovation activities (OECD 2010).
-0.4
-0.2
0
0.2
0.4
0.6
0.8
1.0
1.2
1.4
1.6
Figure 1. Annual percent contribution to GDP growth, average 1985-2009
Labor
Capital other than TIC
Capital in TIC
Au
stri
a
Can
ada
Den
mar
k
Fin
lan
d
Fran
ce
Ger
man
y
Irle
nd
Ital
y
Jap
an
Co
rea
Net
her
lan
ds
New
Zea
lan
d
Spai
n
Swed
en
Swiz
erla
nd
Un
ited
Kin
gd
om
Au
stra
lia
Source: OECD. StatExtracts, 2013.
Understanding innovation in our country is important for economic growth and productivity, but also,
to increase the social welfare of the population. Science and technology area fundamental attribute
of the information and knowledge society we live in. The most critical elements of our society, such
as transportation, education, environmental protection, medicine, agriculture, and increasingly de-
mocratic institutions, depend deeply on how and where science and technology is distributed and
applied. In addition, creativity and innovation play an ever more important role to solve basic social
problems such as illiteracy, disease, hunger, or energy production.
14
Currently, Mexican federal policies for economic development are focusing on ways to increase pro-
ductivity and to reduce and democratize the productivity lags between sectors and regions. This im-
plies reducing productivity gaps bringing the less productive regions the inputs they need to improve
their productivity. Innovation can play a key role in removing these productivity gaps between states
and regions, but it is necessary to differentiatethe gaps between them so that they can decrease.
2.4 How to measure innovation?
Innovation is not easy to measure, as it depends on multiple factors and arises in different contexts and
conditions. The traditional methods for measuring a country’s innovation is to measure and qualify the
R&D investment that takes place within firms, or measure the most obvious product, for example the
number of patents. However, these approaches have significant limitations for innovation because they
do not assess the context in which innovation takes place, they do not evaluate the innovation system. An
analysis of innovation systems must consider three general elements: a) the agents engaged in national
innovation systems, b) the legal and institutional framework in which they operate, c) the network and
links between agents (CIDAC, 2012).
The Oslo Manual creates a framework for measuring the factors included in the context in which innova-
tion takes place. With this framework, new indices that evaluated both inputs and outputs of innovation
were developed. Some of these factors are:
• The basic educational system for the general population
• The university system
• The specialized technical training system
• The science and research base
• Innovation policies and other government policies that affect innovation
• Legislative and macroeconomic settings
• Communications infrastructure, including roads and telecommunications.
• Financial Institutions
• Market accessibility
• Industry structure and competitive market.
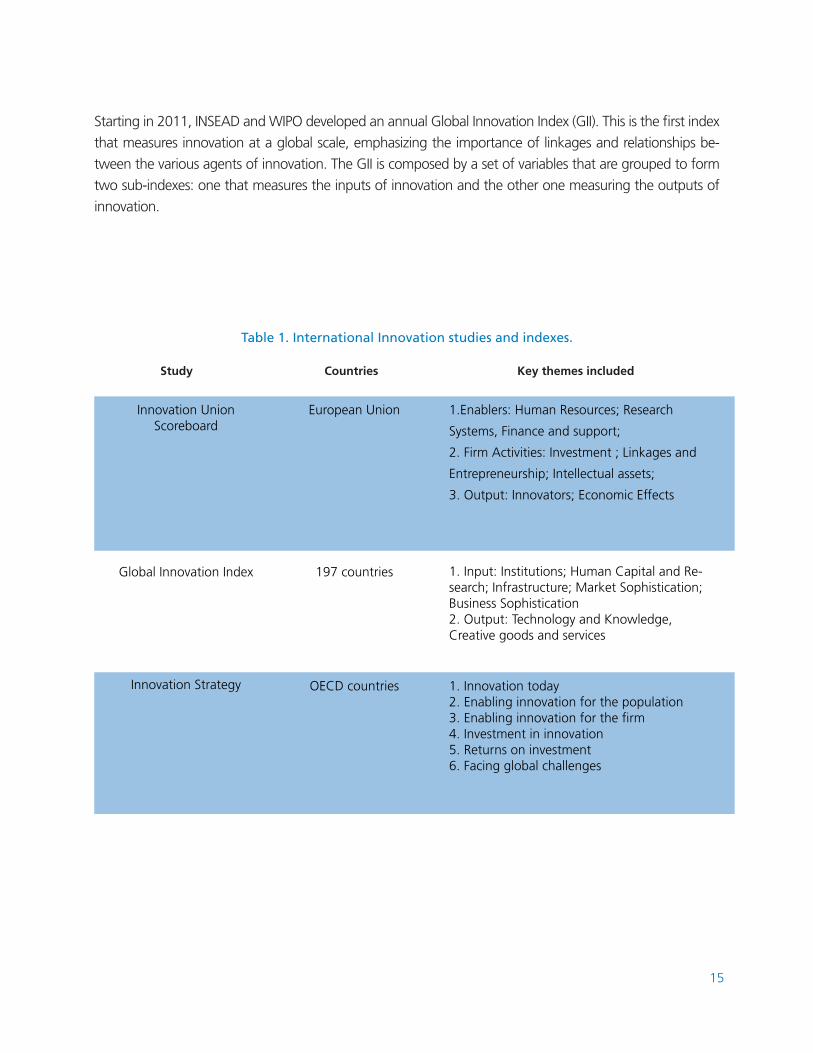
In 2007 the European Union created a study for the measurement of innovation, the Innovation Union
Scoreboard. This study includes a methodological model that divides the analysis into three segments: the
enablers (human resources, research and funding systems), business activities (investments, linkages and bu-
siness assets) and innovation products (innovations and their economic effects). Likewise, in 2010 the OECD
published the Innovation Strategy report, which includes the measurement and evaluation of 100 indicators
grouped in six different subjects. (Table 1)
15
Table 1. International Innovation studies and indexes.
Study
Innovation Union Scoreboard
1.Enablers: Human Resources; Research
Systems, Finance and support;
2. Firm Activities: Investment ; Linkages and
Entrepreneurship; Intellectual assets;
3. Output: Innovators; Economic Effects
1. Input: Institutions; Human Capital and Re-search; Infrastructure; Market Sophistication; Business Sophistication2. Output: Technology and Knowledge, Creative goods and services
1. Innovation today2. Enabling innovation for the population3. Enabling innovation for the firm4. Investment in innovation5. Returns on investment6. Facing global challenges
Global Innovation Index
Innovation Strategy
Countries
European Union
197 countries
OECD countries
Key themes included
Starting in 2011, INSEAD and WIPO developed an annual Global Innovation Index (GII). This is the first index
that measures innovation at a global scale, emphasizing the importance of linkages and relationships be-
tween the various agents of innovation. The GII is composed by a set of variables that are grouped to form
two sub-indexes: one that measures the inputs of innovation and the other one measuring the outputs of
innovation.

16
3. OBJECTIVES
The generation, use and dissemination of knowledge is fundamental to economic growth, develop-
ment and the well being of nations. Today it is widely accepted that innovation is necessary for sus-
tained and long-term growth. Although the evaluation and measurement of innovation is essential
to ensure the effectiveness and relevance of public policies, no clear way to measure innovation has
been developed in Mexico.
To foster and boost innovation in the most effective way, it is imperative to have a good unders-
tanding of the context in which Mexican innovation originates and develops. Aware of the need to
increase our understanding of innovation, the National Innovation Index (INI) was conceived to fill this
information gap.
Based on international standards, the INI creates a way to measure innovation in Mexico that includes
identification and characterization of the key factors that make up the national innovation system.
Altogether, it classifies the 32 states and 86 cities of Mexico according to their innovation levels. The
INI has a special focus on the innovation activities of cities as it is considered that cities have natural
advantages that facilitate the development of innovation: increased information flow, increased flow
of people, increased competitiveness, better infrastructure.
The study focuses on measuring innovation at the enterprise level; therefore it does not cover inno-
vation at sector level or at a broader economic level. The firm is considered the fundamental unit of
innovation as it is the lowest organizational level at which decisions about innovation activities are
made. In particular, the INI only considers the firms that belong to the National Register of Scientific
and Technological Institutions (RENIECYT, for its Spanish acronym, this companies distinguish from
other firms due to theirr innovation activities)
Objective 1: Create a ranking of cities and states according to their innovation levels.
Existing indicators of innovation activities in Mexico are focused on the inputs that generate innova-
tion rather than the outputs. Furthermore, innovation has not been the main subject of study of any
indicator of the country (Table 1). This implies that the indexes created do not reflect the state of the
innovation ecosystem and its context. Even more importantly, there is no index that ranks cities accor-
ding to their level of innovation, since these are the main drivers of innovation activities in the country
and have natural features that allow abetter flow and generation of knowledge.
17
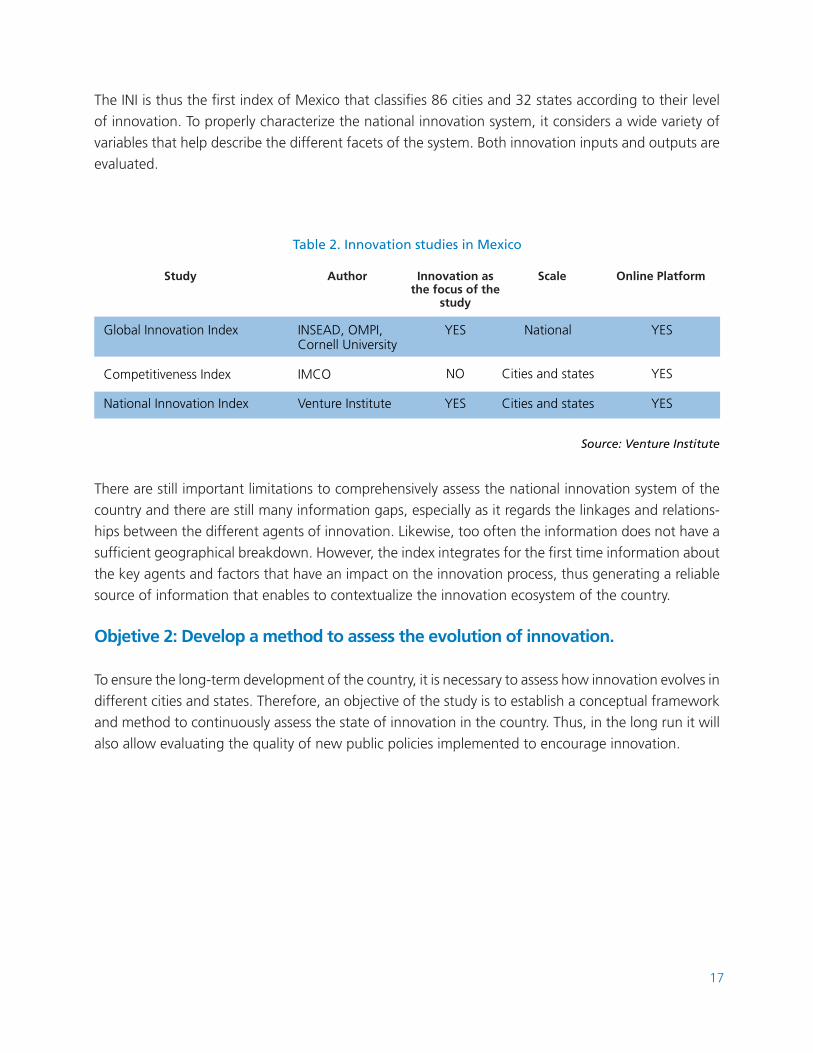
The INI is thus the first index of Mexico that classifies 86 cities and 32 states according to their level
of innovation. To properly characterize the national innovation system, it considers a wide variety of
variables that help describe the different facets of the system. Both innovation inputs and outputs are
evaluated.
There are still important limitations to comprehensively assess the national innovation system of the
country and there are still many information gaps, especially as it regards the linkages and relations-
hips between the different agents of innovation. Likewise, too often the information does not have a
sufficient geographical breakdown. However, the index integrates for the first time information about
the key agents and factors that have an impact on the innovation process, thus generating a reliable
source of information that enables to contextualize the innovation ecosystem of the country.
Objetive 2: Develop a method to assess the evolution of innovation.
To ensure the long-term development of the country, it is necessary to assess how innovation evolves in
different cities and states. Therefore, an objective of the study is to establish a conceptual framework
and method to continuously assess the state of innovation in the country. Thus, in the long run it will
also allow evaluating the quality of new public policies implemented to encourage innovation.
Study
Global Innovation Index YES YESNational
NO YESCities and states
YES YESCities and states
Competitiveness Index
National Innovation Index
Author
INSEAD, OMPI, Cornell University
IMCO
Venture Institute
Innovation as the focus of the
study
Scale Online Platform
Source: Venture Institute
Table 2. Innovation studies in Mexico
18
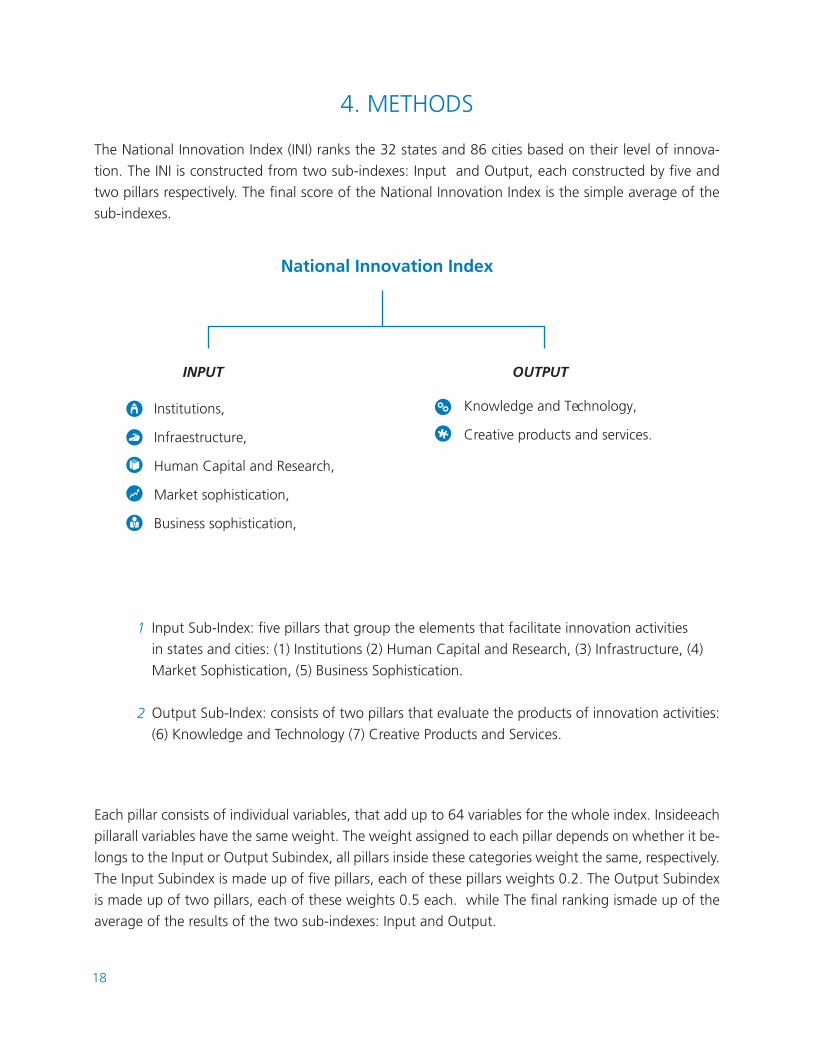
4. METHODS
The National Innovation Index (INI) ranks the 32 states and 86 cities based on their level of innova-
tion. The INI is constructed from two sub-indexes: Input and Output, each constructed by five and
two pillars respectively. The final score of the National Innovation Index is the simple average of the
sub-indexes.
Input Sub-Index: five pillars that group the elements that facilitate innovation activities
in states and cities: (1) Institutions (2) Human Capital and Research, (3) Infrastructure, (4)
Market Sophistication, (5) Business Sophistication.
Output Sub-Index: consists of two pillars that evaluate the products of innovation activities:
(6) Knowledge and Technology (7) Creative Products and Services.
National Innovation Index
1
2
Each pillar consists of individual variables, that add up to 64 variables for the whole index. Insideeach
pillarall variables have the same weight. The weight assigned to each pillar depends on whether it be-
longs to the Input or Output Subindex, all pillars inside these categories weight the same, respectively.
The Input Subindex is made up of five pillars, each of these pillars weights 0.2. The Output Subindex
is made up of two pillars, each of these weights 0.5 each. while The final ranking ismade up of the
average of the results of the two sub-indexes: Input and Output.
INPUT OUTPUT
Institutions,
Infraestructure,
Human Capital and Research,
Market sophistication,
Business sophistication,
Knowledge and Technology,
Creative products and services.
19
Level of urbanization
Metropolitan Areas Guadalajara, Nuevo León, Ciudad de
México
4 to 20
Toluca, León, Torreón, Juárez
Guanajuato, Los Mochis, Cd. Victoria
1 to 4
Less than 0.5
San Luis Potosí, Mérida, Querétaro
0.5 to 1
Big Cities
Small Cities
Medium Cities
Number of cities
3
6
56
21
Population range (millions)
Examples
Source: Micro-Mercados Descifra, 2013.
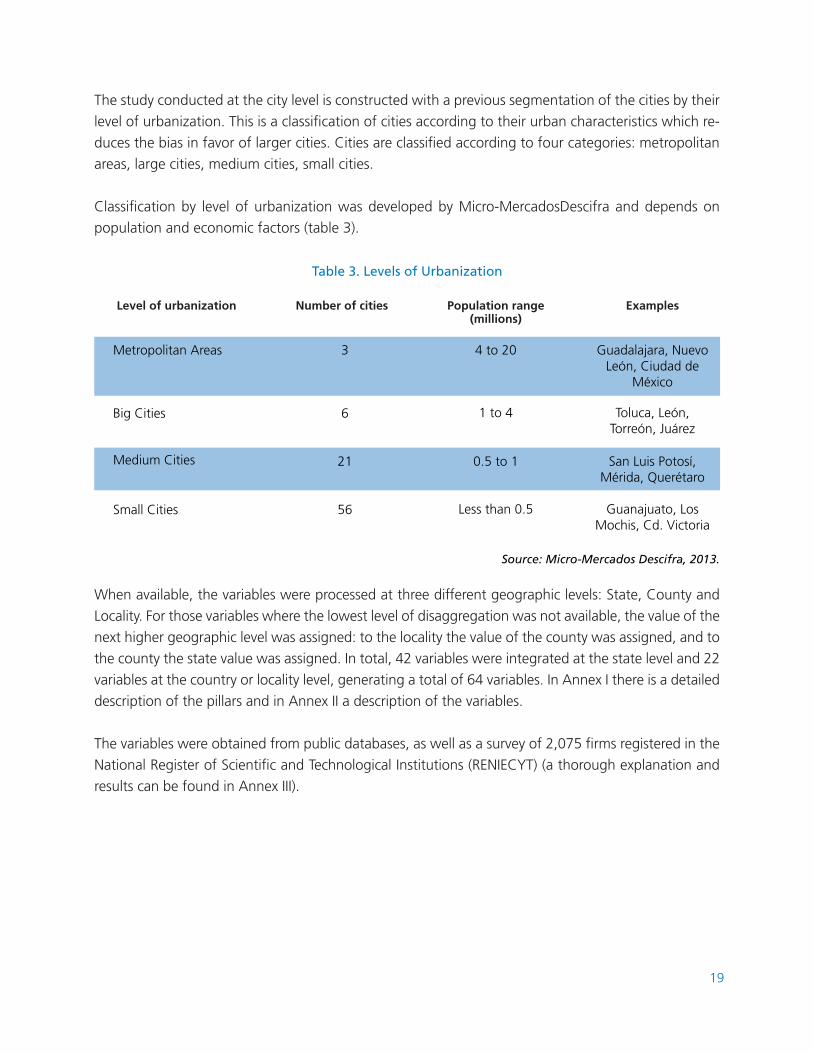
Table 3. Levels of Urbanization
When available, the variables were processed at three different geographic levels: State, County and
Locality. For those variables where the lowest level of disaggregation was not available, the value of the
next higher geographic level was assigned: to the locality the value of the county was assigned, and to
the county the state value was assigned. In total, 42 variables were integrated at the state level and 22
variables at the country or locality level, generating a total of 64 variables. In Annex I there is a detailed
description of the pillars and in Annex II a description of the variables.
The variables were obtained from public databases, as well as a survey of 2,075 firms registered in the
National Register of Scientific and Technological Institutions (RENIECYT) (a thorough explanation and
results can be found in Annex III).
The study conducted at the city level is constructed with a previous segmentation of the cities by their
level of urbanization. This is a classification of cities according to their urban characteristics which re-
duces the bias in favor of larger cities. Cities are classified according to four categories: metropolitan
areas, large cities, medium cities, small cities.
Classification by level of urbanization was developed by Micro-MercadosDescifra and depends on
population and economic factors (table 3).
20
Germany
0
1995 2000 2005 20101990
10
20
30
40
50
60
70
Grece Italy
Japan Korea Mexico
Norway Switzerland United States
Source: OECD.
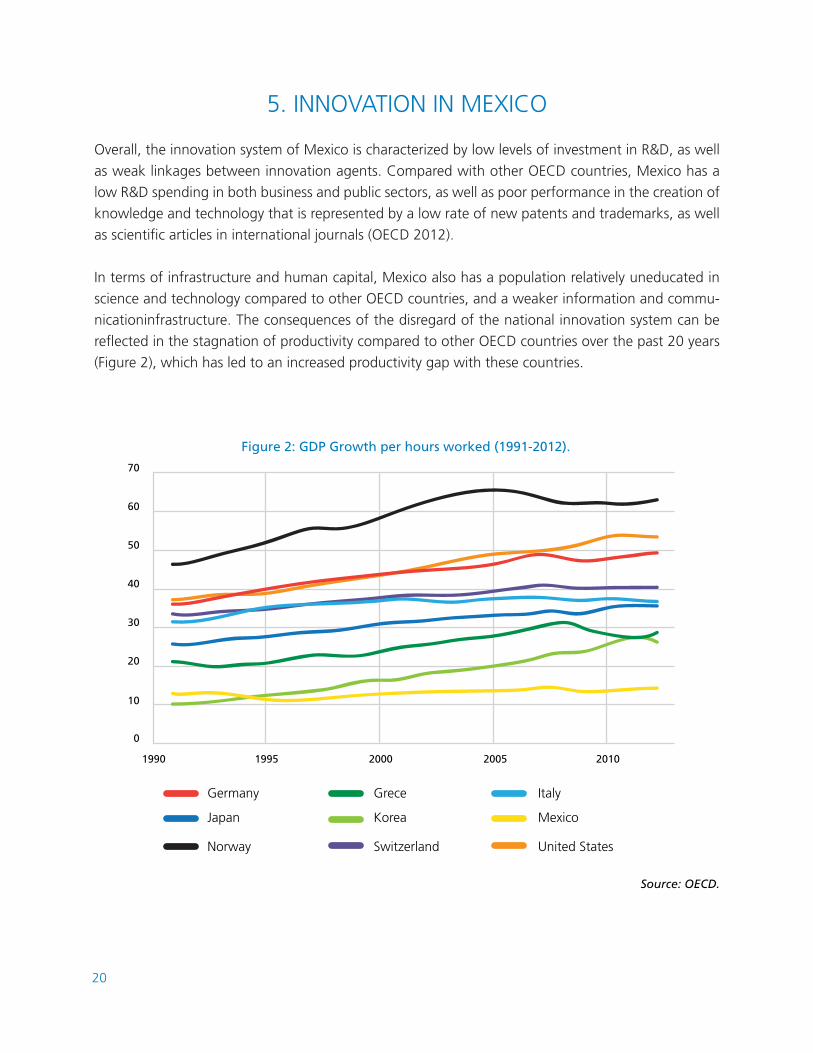
Figure 2: GDP Growth per hours worked (1991-2012).
5. INNOVATION IN MEXICO
Overall, the innovation system of Mexico is characterized by low levels of investment in R&D, as well
as weak linkages between innovation agents. Compared with other OECD countries, Mexico has a
low R&D spending in both business and public sectors, as well as poor performance in the creation of
knowledge and technology that is represented by a low rate of new patents and trademarks, as well
as scientific articles in international journals (OECD 2012).
In terms of infrastructure and human capital, Mexico also has a population relatively uneducated in
science and technology compared to other OECD countries, and a weaker information and commu-
nicationinfrastructure. The consequences of the disregard of the national innovation system can be
reflected in the stagnation of productivity compared to other OECD countries over the past 20 years
(Figure 2), which has led to an increased productivity gap with these countries.
21
However, the outlook for innovation in Mexico remains positive. According to the Global Innovation
Index 2013, Mexico was recognized among the countries that have taken a big leap along with
Uganda, Costa Rica, Bolivia. In 2012, Mexico was ranked # 79, by 2013 the country scaled to # 63,
an improvement of 16 places.
Amongst all 23 countries assessed in Latin America, Mexico is the seventh most innovative country.
Costa Rica and Chile are the leaders in innovation. Globally, Mexico appears to be behind some high
middle-income countries such as China, Costa Rica, Latvia, Colombia, South Africa and Russia. Howe-
ver, Mexico’s score remains higher than that of Brazil, India, Peru and Lebanon. A closer look at the
sub-indexes Input and Output allows to reach the conclusion that Mexico does not invest enough in
innovation - making it # 68 in the Input Subindex, with a score of 40.73.
More specifically, Mexico’s political and regulatory environmentis not supportive. There are low levels
of security and press freedom. On the other hand, paying taxes is not easy, and obtaining credit is
difficult, especially domestic credits to the private sector. Furthermore, net FDI inflows, as well as, ac-
cess and use of information and communication technology are low. As for R&D and human capital,
in Mexico public spending on education is lower than in other countries - such as pupil-teacher ratio
in secondary schools. In addition, enrollment in tertiary education is low and the international flow of
students is particularly low.
Mexico remains low but recovers with its innovative products- rising to #60 with a score of 32.90. The
volumes of high,medium-high- and high-tech manufactured exports allow Mexico to remain stable
thanks to the knowledge and technological products of the country, but it still remains #84 in the
ranking. The production of scientific knowledge is also high. The score of creative goods and services
exports improvethe classification of Mexico in the Ouput Subindex. Therefore, Mexico has potential
human resources that could offer better results in innovation. Investments are needed for education
and business environment to become more sophisticated - making Mexico’s innovation potential
flourish.
Improving regulatory and economic conditions in which the country develops innovation is necessary
to increase productivity and competitiveness in the long run. It is necessary to identify the current sta-
te of the main innovation agents of the country. The following are the general characteristics of the
innovation system of Mexico, taking into account three key players that define the conditions and the
context in which innovation takes place: (1) human capital and research institutions, (2) the business
sector, and (3) the government.
22
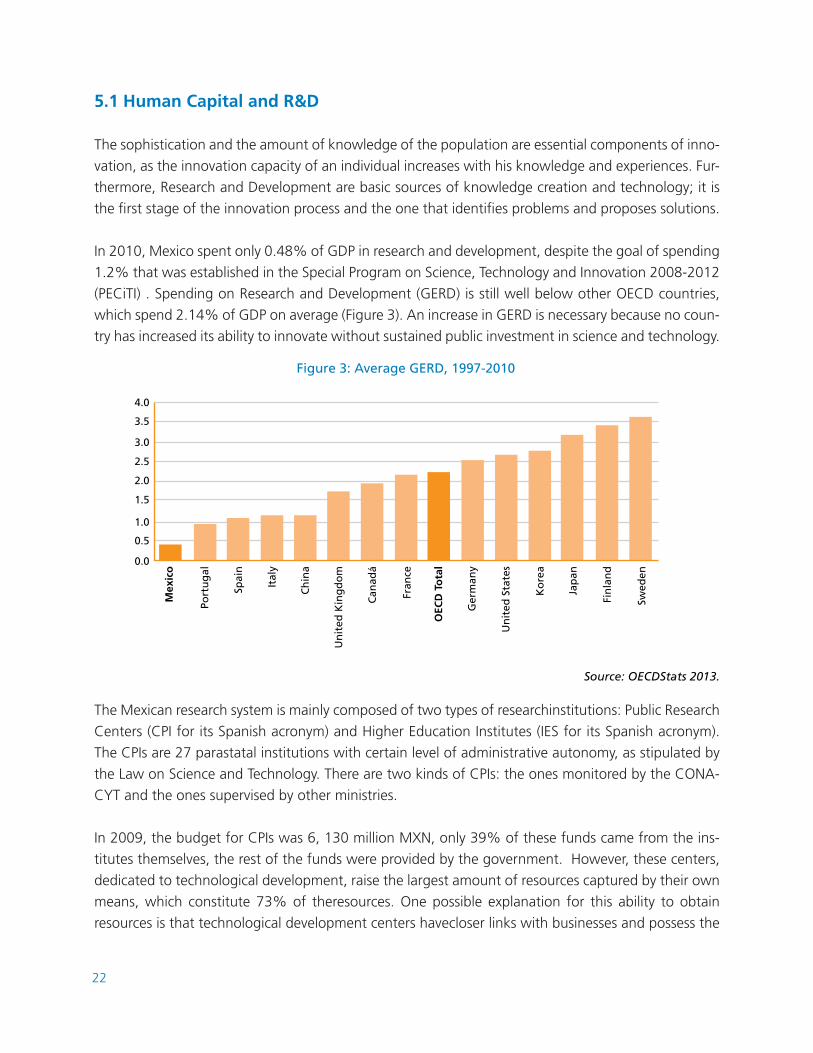
Figure 3: Average GERD, 1997-2010
Port
ug
al
0.0
0.5
1.0
1.5
2.0
2.5
3.0
3.5
4.0
Spai
n
Ital
y
Ch
ina
Un
ited
Kin
gd
om
Can
adá
Fran
ce
OEC
D T
ota
l
Ger
man
y
Un
ited
Sta
tes
Ko
rea
Jap
an
Fin
lan
d
Swed
en
Mex
ico
5.1 Human Capital and R&D
The sophistication and the amount of knowledge of the population are essential components of inno-
vation, as the innovation capacity of an individual increases with his knowledge and experiences. Fur-
thermore, Research and Development are basic sources of knowledge creation and technology; it is
the first stage of the innovation process and the one that identifies problems and proposes solutions.
In 2010, Mexico spent only 0.48% of GDP in research and development, despite the goal of spending
1.2% that was established in the Special Program on Science, Technology and Innovation 2008-2012
(PECiTI) . Spending on Research and Development (GERD) is still well below other OECD countries,
which spend 2.14% of GDP on average (Figure 3). An increase in GERD is necessary because no coun-
try has increased its ability to innovate without sustained public investment in science and technology.
Source: OECDStats 2013.
The Mexican research system is mainly composed of two types of researchinstitutions: Public Research
Centers (CPI for its Spanish acronym) and Higher Education Institutes (IES for its Spanish acronym).
The CPIs are 27 parastatal institutions with certain level of administrative autonomy, as stipulated by
the Law on Science and Technology. There are two kinds of CPIs: the ones monitored by the CONA-
CYT and the ones supervised by other ministries.
In 2009, the budget for CPIs was 6, 130 million MXN, only 39% of these funds came from the ins-
titutes themselves, the rest of the funds were provided by the government. However, these centers,
dedicated to technological development, raise the largest amount of resources captured by their own
means, which constitute 73% of theresources. One possible explanation for this ability to obtain
resources is that technological development centers havecloser links with businesses and possess the
23
largest number of intellectual property rights (CONACYT, 2009). These figures demonstrate the im-
portance of establishing more and better relationships with businesses and intellectual property rights
to secure funding and autonomy of research centers.
The IES contribute to innovation through both teaching and research. In 2005, IES represented 29%
of total research efforts and were the second largest employers of researchers in Mexico. One diffi-
culty faced by these institutions is the centralization of research since nearly half of the production of
knowledge is concentrated in only four institutions, including the National Autonomous University
of Mexico (UNAM), the Center for Research and Advanced Studies of IPN (CINVESTAV), the Metro-
politan Autonomous University (UAM) and the National Polytechnic Institute (IPN), all headquartered
in Mexico city. Also, in terms of the impact of published articles, only three states are highlighted:
Morelos, Michoacán and Distrito Federal (CONACYT). Therefore, it is important to continue efforts to
disseminate the creation and use of knowledge throughout the country.
In terms of human capital for innovation, the key component is the National System of Researchers
(SNI, for its Spanish acronym). The SNI is intended to recognize the work of those engaged in re-
search. Since its inception in 1984, the SNI has improved the performance and relevance of scientific
research, and without it, the excellence of the research activities and the diversity of researchers in
Mexico would not be what they are today. However, the system has disadvantages in terms of inno-
vation because it leans toward assessing individuals by published scientific results (OECD 2012) and
not recognizing other types of innovation. With this, it inhibits the undertaking of long-term projects
and multidisciplinary research with potential for innovation, and acts as a disincentive to establish
partnerships with the private and business sector.
As for the training of researchers and scientists, currently 37.8% of Mexican students are enrolled in
engineering and natural sciences (ANUIES 2010/2011), however the national research system absorbs
only a small percentage of the graduates. It is also important to increase the number of graduate
students in science and technology, as only 16.1% of graduate studies are engaged in these research
areas. On another hand, the facilitation of international mobility of students and researchers is ano-
ther area in which research institutesand academia have an important role to play, since greater flow
of knowledge and technology transfer enable innovation.
24
5.2. Private Sector
Innovation depends not only on science and technology; it is also about the commercialization of new
products and services in various sectors of the economy and/or the creation of new organizational
models to increase and improve production. Thus, businesses are a key component of any innovation
system with good performance. Besides frequentlybeing the creators of new products and services,
businessesfacilitate the implementation and commercialization of new technologies and knowledge.
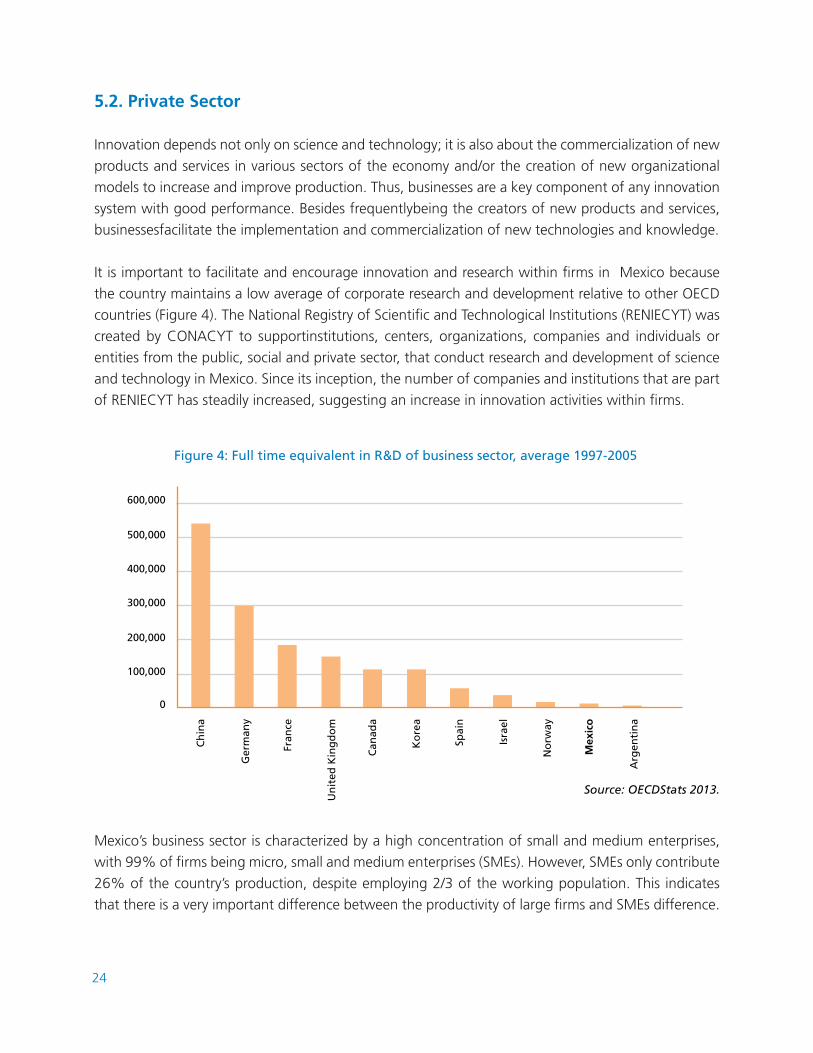
It is important to facilitate and encourage innovation and research within firms in Mexico because
the country maintains a low average of corporate research and development relative to other OECD
countries (Figure 4). The National Registry of Scientific and Technological Institutions (RENIECYT) was
created by CONACYT to supportinstitutions, centers, organizations, companies and individuals or
entities from the public, social and private sector, that conduct research and development of science
and technology in Mexico. Since its inception, the number of companies and institutions that are part
of RENIECYT has steadily increased, suggesting an increase in innovation activities within firms.
Ger
man
y
Fran
ce
Un
ited
Kin
gd
om
Can
ada
Ko
rea
Spai
n
Isra
el
No
rway
Mex
ico
Arg
enti
na
Ch
ina
0
100,000
200,000
300,000
400,000
500,000
600,000
Figure 4: Full time equivalent in R&D of business sector, average 1997-2005
Source: OECDStats 2013.
Mexico’s business sector is characterized by a high concentration of small and medium enterprises,
with 99% of firms being micro, small and medium enterprises (SMEs). However, SMEs only contribute
26% of the country’s production, despite employing 2/3 of the working population. This indicates
that there is a very important difference between the productivity of large firms and SMEs difference.
25
Size of the enterprise
Total
50-100
101-250
251-500
501 o más
Total
15824 3305 12519 21% 100%
6993 1715 5278 25% 52%
4911 830 4080 17% 25%
2113 435 1678 21% 13%
1807 324 1483 18% 10%
DID carry out innovation activities
DID NOT carry out innovation activities
Percent Percent that DID carry out innovation
activities
Source: ESIDET 2009
Table 4. Firm Innovation activities
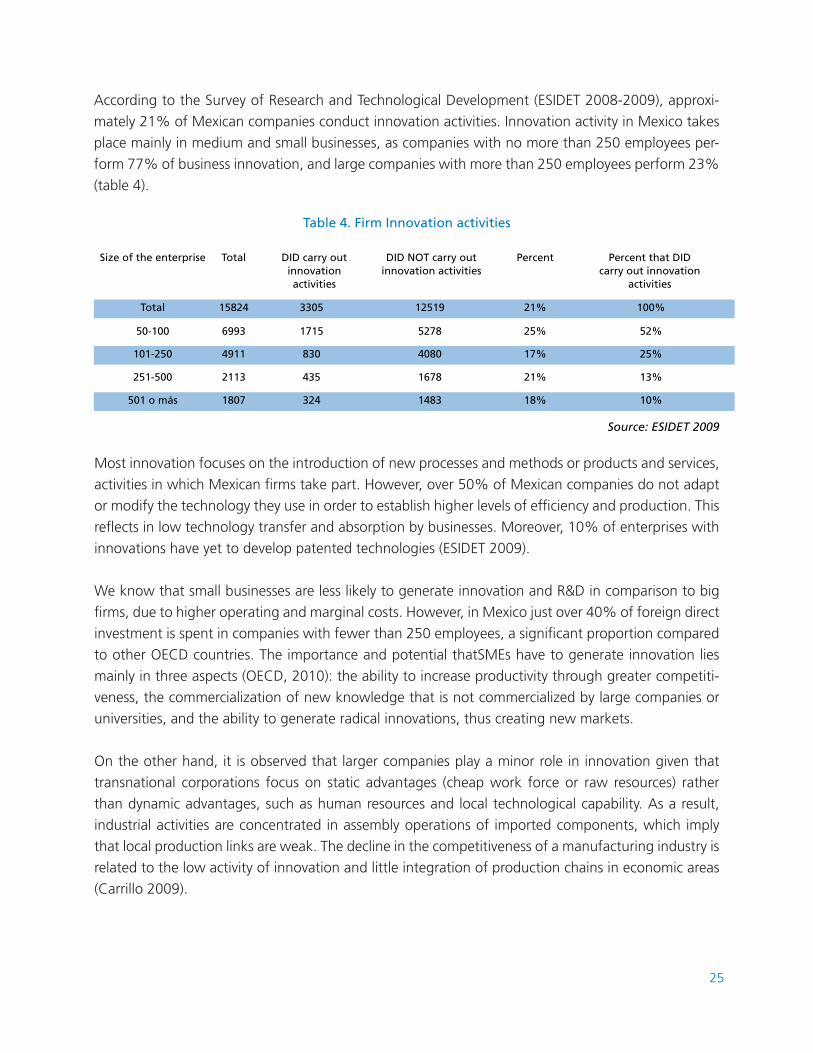
Most innovation focuses on the introduction of new processes and methods or products and services,
activities in which Mexican firms take part. However, over 50% of Mexican companies do not adapt
or modify the technology they use in order to establish higher levels of efficiency and production. This
reflects in low technology transfer and absorption by businesses. Moreover, 10% of enterprises with
innovations have yet to develop patented technologies (ESIDET 2009).
We know that small businesses are less likely to generate innovation and R&D in comparison to big
firms, due to higher operating and marginal costs. However, in Mexico just over 40% of foreign direct
investment is spent in companies with fewer than 250 employees, a significant proportion compared
to other OECD countries. The importance and potential thatSMEs have to generate innovation lies
mainly in three aspects (OECD, 2010): the ability to increase productivity through greater competiti-
veness, the commercialization of new knowledge that is not commercialized by large companies or
universities, and the ability to generate radical innovations, thus creating new markets.
On the other hand, it is observed that larger companies play a minor role in innovation given that
transnational corporations focus on static advantages (cheap work force or raw resources) rather
than dynamic advantages, such as human resources and local technological capability. As a result,
industrial activities are concentrated in assembly operations of imported components, which imply
that local production links are weak. The decline in the competitiveness of a manufacturing industry is
related to the low activity of innovation and little integration of production chains in economic areas
(Carrillo 2009).
According to the Survey of Research and Technological Development (ESIDET 2008-2009), approxi-
mately 21% of Mexican companies conduct innovation activities. Innovation activity in Mexico takes
place mainly in medium and small businesses, as companies with no more than 250 employees per-
form 77% of business innovation, and large companies with more than 250 employees perform 23%
(table 4).
26
5.3 Public Sector
The proper functioning of a national innovation system requires a regulatory structure and legal fra-
mework that enables and encourages linkages between different actors. The role of government is
also essential as it has the ability to facilitate innovation activities through funding or infrastructure
improvement and communication technologies.
In Mexico, government actions on innovation have focused mainly on economic and financial support
for research and development in institutions and firms. Most support programs emerged from the
Special Program of Science and Technology (PECyT), developed in 2000. Here is a list containing the
main programs that support innovation (FCCyT 2011):
• Sector Funds: financed and operated by the federal ministries and CONACYT. The selection
criteria usually corresponds to the priorities of the Secretariat of State sector. Currently, there
are 19 sector funds.
• Mixt Funds: developed in 2001these funds are funded and managedjointly by CONACYT
and 32 state government agencies. These funds were designed to foster innovation and re-
search at aregional level.
• Programs for fostering innovation: programs designed byCONACYT that provide support
for companies investing in research, technology, development of new products, processes or
services. These programs include three modes: INNOVAPYME (Technological innovation for
micro, small and medium enterprises), INNOVATEC (Technological Innovation for large com-
panies), PROINNOVA (Projects that have linkswith two research centers).
• PROSOFT y PROSOFT 2.0: a program designed by the Ministry of Economy that seeks to
create the conditions to increase competitiveness in the information, technology and communi-
cation (ICT) sector. Its function is to support companies in the ICT sector.
• SME Fund: managed by the National Institute of Entrepreneurship (INADEM) of the Ministry
of Economy, this fundsupports companies and entrepreneurs. Despite it not being a fund
focused specifically on innovation, it contains programs for innovation and technological de-
velopment aimed at specific sectors: new entrepreneurs, micro, small and medium firms,GA-
CELA firms, and events.
• AVANCE: A program managed by CONACYT to encourage the creation of businesses based
on the exploitation of scientific and/or technological developments. It also aims to promote
the detection and generation of business opportunities. In addition to having a seed fund, it
has eight operating modes (see table).

27
Table 5. Operating modes of AVANCE Program
Operating modes of AVANCE
New Businesses Test scientific and/or technological developments in pre-commercial stage in order to achieve the inte-gration phase of the business pros-pectus and investment.
Offers complementary investment optionsto established firms, that have received investment from other strategic investors. The pro-ject has to create new lines of business with high added value obtained from scientific and tech-nological developments.
Encourage and boost intellectual protection and property rights of Mexican inventions following the application of scientific knowledge and/or technology.
Facilitate access to preferential credit lines to firms that have de-veloped new products or new bu-siness lines based on scientific and/or technological development, and require direct investment to increa-se and streamline their production capacities.
Entrepreneurs’ Fund CONACYT-NAFIN
Support to NationalPatents
Warranty Fund
Description
Encourages scientific and/or technological de-velopments tested in pilot or pre-commercial scale that can become high-value business or new business lines.
Provides resources and facilitates access to capital with other investors, to develop and strengthen businesses with high added va-lue. Additionally, itprovides technological, financial and legal assistance to strengthen the competitive position in the long term of firms based on the application of scientific knowledge and/or technology.
In this scheme, CONACYT provides financial resources and ability to evaluate the busi-ness from a technological point of view. NA-FIN, is involved in the financial validation of the project, determining the feasibility of the business model.
Designed to give financial support (via reim-bursement) to protect Mexican inventions that are likely to arise as a strategy for the establishment of national and international competitive advantages.
Facilitates access tocredit for domestic firms. CONACYT operates this program together with Nacional Financiera and Banco del Bajío.
Objective
28
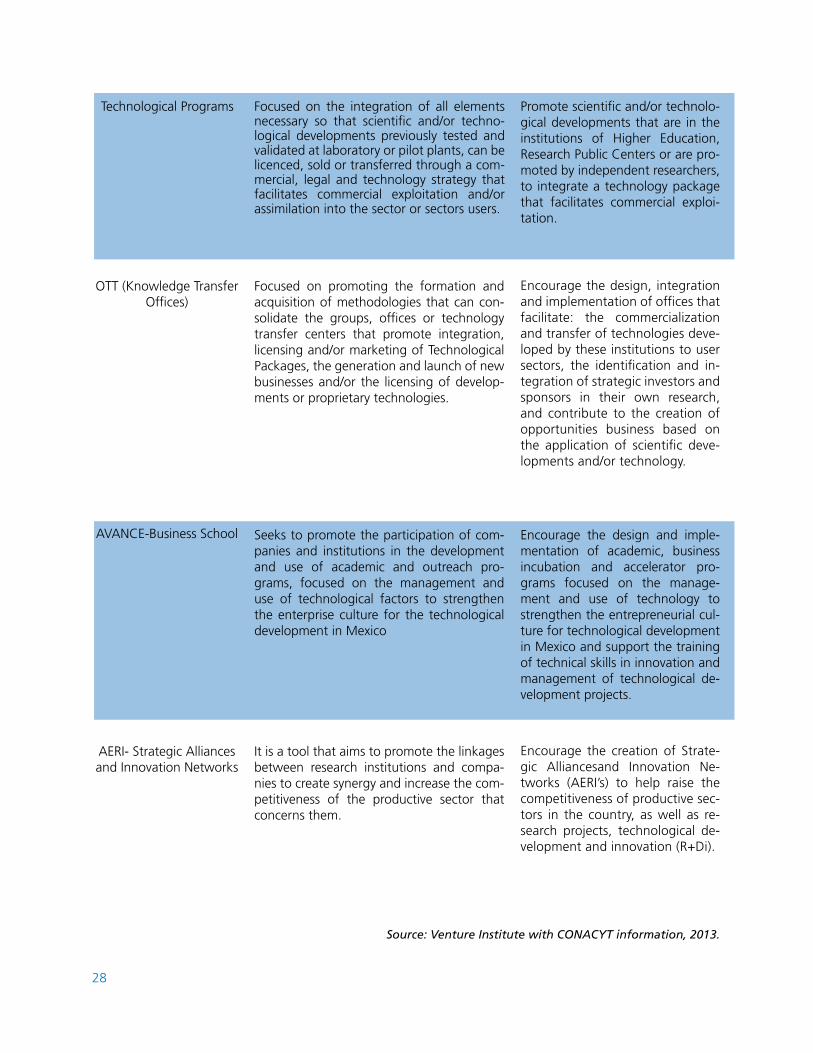
Technological Programs Promote scientific and/or technolo-gical developments that are in the institutions of Higher Education, Research Public Centers or are pro-moted by independent researchers, to integrate a technology package that facilitates commercial exploi-tation.
Encourage the design, integration and implementation of offices that facilitate: the commercialization and transfer of technologies deve-loped by these institutions to user sectors, the identification and in-tegration of strategic investors and sponsors in their own research, and contribute to the creation of opportunities business based on the application of scientific deve-lopments and/or technology.
Encourage the creation of Strate-gic Alliancesand Innovation Ne-tworks (AERI’s) to help raise the competitiveness of productive sec-tors in the country, as well as re-search projects, technological de-velopment and innovation (R+Di).
Encourage the design and imple-mentation of academic, business incubation and accelerator pro-grams focused on the manage-ment and use of technology to strengthen the entrepreneurial cul-ture for technological development in Mexico and support the training of technical skills in innovation and management of technological de-velopment projects.
OTT (Knowledge Transfer Offices)
AERI- Strategic Alliances and Innovation Networks
AVANCE-Business School
Focused on the integration of all elements necessary so that scientific and/or techno-logical developments previously tested and validated at laboratory or pilot plants, can be licenced, sold or transferred through a com-mercial, legal and technology strategy that facilitates commercial exploitation and/or assimilation into the sector or sectors users.
Focused on promoting the formation and acquisition of methodologies that can con-solidate the groups, offices or technology transfer centers that promote integration, licensing and/or marketing of Technological Packages, the generation and launch of new businesses and/or the licensing of develop-ments or proprietary technologies.
It is a tool that aims to promote the linkages between research institutions and compa-nies to create synergy and increase the com-petitiveness of the productive sector that concerns them.
Seeks to promote the participation of com-panies and institutions in the development and use of academic and outreach pro-grams, focused on the management and use of technological factors to strengthen the enterprise culture for the technological development in Mexico
Source: Venture Institute with CONACYT information, 2013.
29
National policies do not provide enough support for the development of technological and regional
innovation clusters, however the allocation of resources with a regional focus is increasing. In 2009,
the fund FORDECYT was created (Institutional Regional Development Fund for Scientific Develop-
ment, Technology and Innovation), with the purpose of fostering regional development and linkages.
Only nine states report having two or more technology parks: Aguascalientes, Baja California, Naya-
rit, Michoacán, Querétaro, Hidalgo, Guanajuato and Jalisco (this state has four parks). From 2008
to2012, six new technology parks were created in the country (CONACyT 2011), but Mexico still faces
an enormous regional technological varaition. As for creating innovation linkages abroad, few su-
pport mechanisms have been developed, highlighting the US-Mexico Foundation for Science (WSCF),
which has programs for business development as TechBA.
The goal of the National Innovation Program is to strengthen the existing links between education,
basic and applied science, technology and innovation. The program is based on six pillars that define
the national strategy to boost innovation.
1. The national and international market: its aim is to strengthen internal and external de-
mand for products, services, and innovative business models created in Mexico.
2. Generating knowledge with strategic guidance: its aim is to increase the availability and
applicability of knowledge aimed at generating innovation.
3. Strengthening innovation: strengthening companies and public entities that require the
generation of innovative ideas and solutions for the market.
4. Financing innovation: aims to promote the quantity of public and private resources to in-
crease funding sources.
5. Human Capital: aims to improve and increase the productive, creative and innovative con-
tributions of individuals.
6. Regulatory and institutional framework: it should lay the foundations for a regulatory and
institutional framework conducive to innovation.
In Mexico, despite a wide variety of financing programs, the policies and support programs to foster
collaboration between firms and public research institutions have been weak. It is important to conti-
nue the efforts of regional technology integration to foster innovation and reduce the regional gaps
in productivity of the country.
30
REFERENCES
• ANUIES, Anuario estadístico 2010/2011. www.anuies.mx
• Carrillo, J. (2009). Developing the US–Mexico Border Region for a Prosperous and Secure Rela-
tionship: Innovative Companies and Policies for Innovation on the US–Mexico Border. Houston:
James A. Baker Ill Institute for Public Policy of Rice University.
• CIDAC (2012). Evaluando la innovación en México. México DF.
• CONACYT, http://www.mexicocyt.org.mx/centros/cifras
• CONACYT, Fondos y Apoyos http://www.CONACYT.gob.mx/FondosyApoyos/Sectoriales/Paginas/
Constituidos.aspx
• CONACyT (2011). Informe General del Estado de la Ciuencia, Tecnología e Innovación. México
pp.137.
• Desouza, C. Dombrowski, Y. Awazu, Peter Baloh, Sridhar Papagari, Sanjeev Jha, Jeffrey Y Kim
(2009). “Crafting organizational innovation processes”. Innovation: Management, Policy & Practice
Vol. 11, No. 1, pp. 6-33.
• ESIDET (2009). Encuesta sobre investigación y Desarrollo Tecnológico, INEGI México.
• FCCyT- Foro Consultivo Científico y Tecnológico, AC (2011), Catálogo de Programas para el Fo-
mento Empresarial y la vinculación .
• Feldman, M. P., & Florida, R. (1994). The geographic sources of innovation technological infras-
tructure and product innovation in the United States. Annals of the Association of American Geo-
graphers, 84(2), 210-229.
• Freeman (1995). “The National System of Innovation in a historical perspective”. Cambridge Jour-
nal of Economics 1995, Vol. 19, 5.24.
• IMCO (2012) Indice de competitividad urbana 2012. México.
• INSEAD & OMPI (2012). Global Innovation Index 2012, Stronger Innovation Linkages for Global
Growth. Ginebra, Suiza.
31
• INSEAD, OMPI & Cornell University (2013). Global Innovation Index 2012, Local Dynamics of Inno-
vation. Ginebra, Suiza.
• OECD (2010). “SMEs and Innovation”. OECD Studies on SMEs and Entrepreneurship. Paris, OECD.
• OECD (2010) Innovación en Mexico
• OECD (2010) The OECD Innovation Strategy: Getting a Head Start on Tomorrow. Paris, OECD.
• OECD (1997) National Innovation Systems. Paris, OECD.
• OECD (2005) Manual de Oslo 3era edición. Paris, OECD.
• OECD (2012), OECD Science, Techonology and Industry Outlook.
• PECiTI (2008). Programa Especial de Ciencia Tecnología e Innovación 2008-2012
México.
• Romer, P. M. (1986). Increasing returns and long-run growth. The Journal of Political Economy,
1002-1037
• Thurik, A. R. (2009). Entreprenomics: entrepreneurship, economic growth and policy. Entrepreneu-
rship, growth and public policy, 219-49.
32
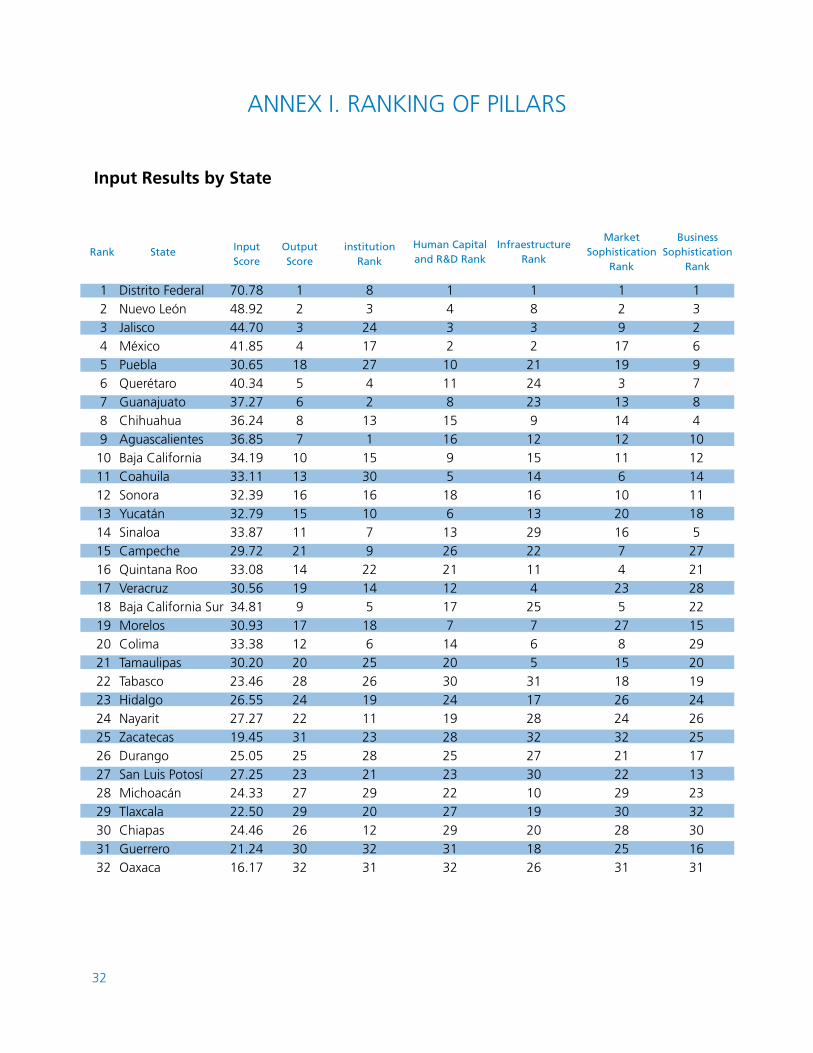
ANNEX I. RANKING OF PILLARS
State institutionRank
OutputScore
InputScore
Human Capital and R&D Rank
Market Sophistication
Rank
BusinessSophistication
Rank
InfraestructureRank
Rank
Distrito FederalNuevo LeónJaliscoMéxicoPueblaQuerétaroGuanajuatoChihuahuaAguascalientesBaja CaliforniaCoahuila SonoraYucatánSinaloaCampecheQuintana RooVeracruz Baja California SurMorelosColimaTamaulipasTabascoHidalgoNayaritZacatecasDurangoSan Luis PotosíMichoacán TlaxcalaChiapasGuerreroOaxaca
1234567891011121314151617181920212223242526272829303132
8324172742131153016107922145186252619112328212920123231
1234185687101316151121141991712202824223125232729263032
70.7848.9244.7041.8530.6540.3437.2736.2436.8534.1933.1132.3932.7933.8729.7233.0830.5634.8130.9333.3830.2023.4626.5527.2719.4525.0527.2524.3322.5024.4621.2416.17
1432101181516951861326211217714203024192825232227293132
1832212423912151416132922114257653117283227301019201826
1291719313141211610201674235278151826243221222930282531
13269784
10121411185
272128221529201924262517132332301631
Input Results by State
33
State Technology and Knowledge Rank
OutputScore
Creative Goods and Services Rank
OutputRank
Rank
Distrito FederalNuevo LeónJaliscoMéxicoPueblaQuerétaroGuanajuatoChihuahuaAguascalientesBaja CaliforniaCoahuila SonoraYucatánSinaloaCampecheQuintana RooVeracruz Baja California SurMorelosColimaTamaulipasTabascoHidalgoNayaritZacatecasDurangoSan Luis PotosíMichoacán TlaxcalaChiapasGuerreroOaxaca
1234567891011121314151617181920212223242526272829303132
1436211571610912171813192629822243021323127151420252328
70.5240.7340.4329.2839.4427.7730.7028.1327.1329.6229.3129.1128.2926.9231.0025.7627.0822.5225.1122.6425.8131.9427.1524.6527.6921.6918.6220.0520.3316.8517.4921.53
1462411192526151722149138167182823122105321323127302920
1231041471317891112196211825222420516231526302928323127
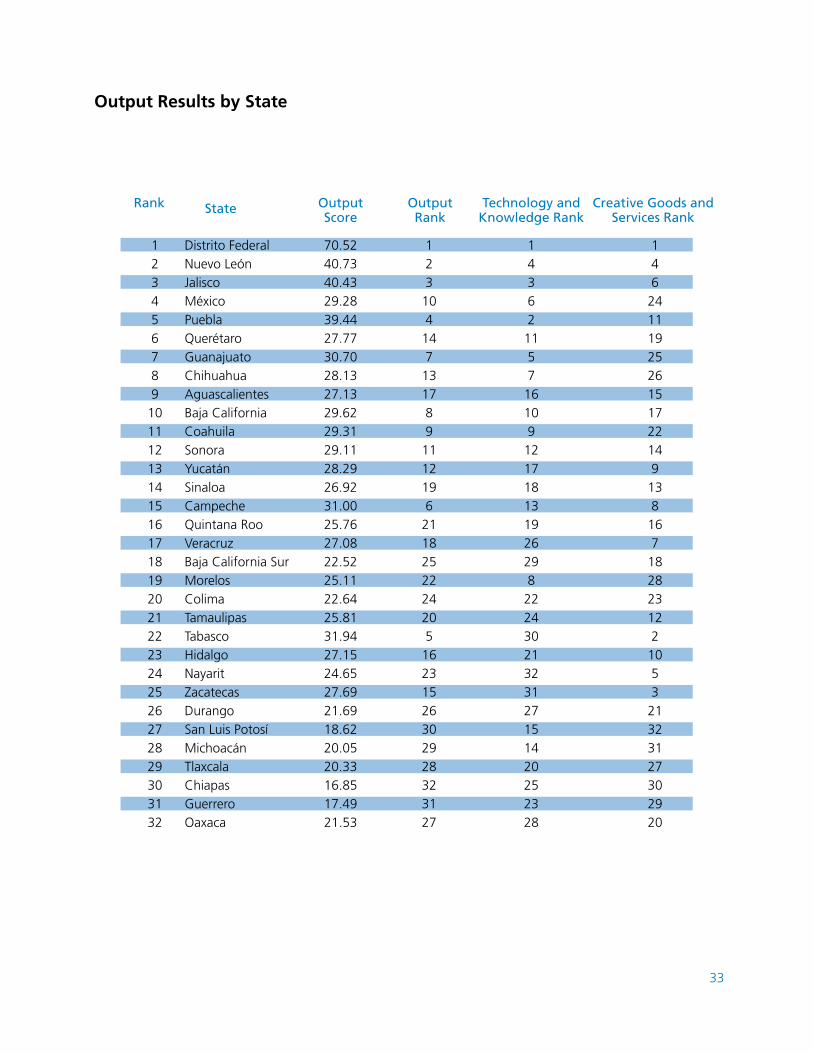
Output Results by State
34
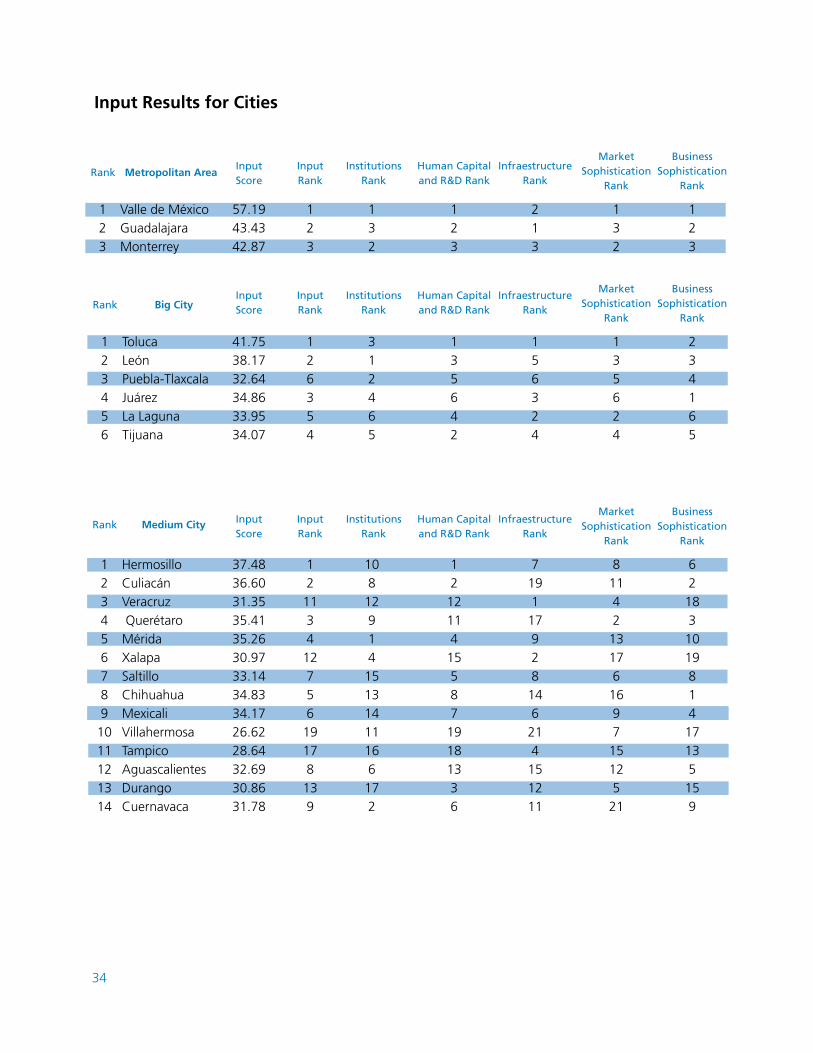
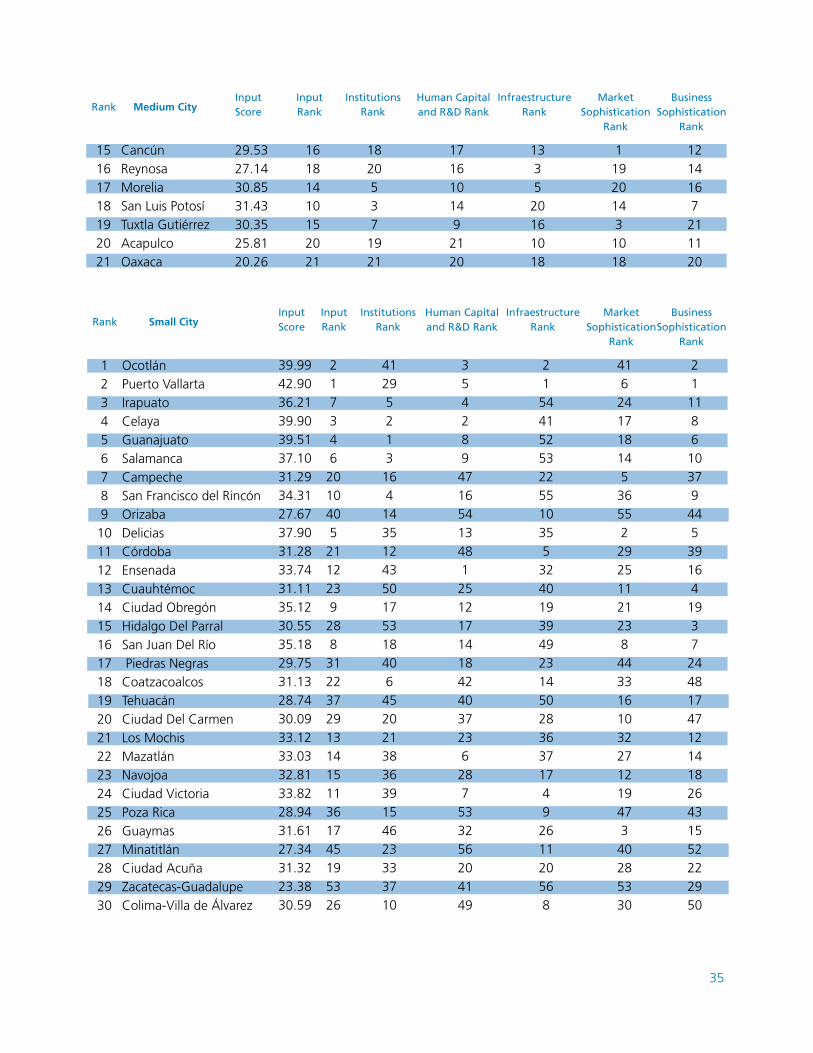
Input Results for Cities
Metropolitan AreaInstitutions
RankInputScore
InputRank
Human Capital and R&D Rank
MarketSophistication
Rank
BusinessSophistication
Rank
InfraestructureRank
Rank
Valle de MéxicoGuadalajaraMonterrey
123
132
57.1943.4342.87
123
123
213
132
123
Big CityRank
TolucaLeónPuebla-TlaxcalaJuárezLa LagunaTijuana
Medium CityRank
HermosilloCuliacánVeracruz QuerétaroMéridaXalapaSaltilloChihuahuaMexicaliVillahermosaTampicoAguascalientesDurangoCuernavaca
1234567891011121314
InstitutionsRank
InstitutionsRank
InputScore
InputScore
InputRank
InputRank
Human Capital and R&D Rank
Human Capital and R&D Rank
MarketSophistication
Rank
MarketSophistication
Rank
BusinessSophistication
Rank
BusinessSophistication
Rank
InfraestructureRank
InfraestructureRank
312465
1081291415131411166172
41.7538.1732.6434.8633.9534.07
37.4836.6031.3535.4135.2630.9733.1434.8334.1726.6228.6432.6930.8631.78
126354
1211341275619178139
135642
12121141558719181336
156324
719117928146214151211
135624
811421317616971512521
234165
62
183
1019814
17135
159
123456
35
Medium CityRank
CancúnReynosaMoreliaSan Luis PotosíTuxtla GutiérrezAcapulcoOaxaca
Small CityRank
OcotlánPuerto VallartaIrapuatoCelayaGuanajuatoSalamancaCampecheSan Francisco del RincónOrizabaDeliciasCórdobaEnsenadaCuauhtémocCiudad ObregónHidalgo Del ParralSan Juan Del Río Piedras NegrasCoatzacoalcosTehuacánCiudad Del CarmenLos MochisMazatlánNavojoaCiudad VictoriaPoza RicaGuaymasMinatitlánCiudad AcuñaZacatecas-GuadalupeColima-Villa de Álvarez
123456789101112131415161718192021222324252627282930
15161718192021
InstitutionsRank
InstitutionsRank
InputScore
InputScore
InputRank
InputRank
Human Capital and R&D Rank
Human Capital and R&D Rank
MarketSophistication
Rank
MarketSophistication
Rank
BusinessSophistication
Rank
BusinessSophistication
Rank
InfraestructureRank
InfraestructureRank
18205371921
412952131641435124350175318406452021383639154623333710
29.5327.1430.8531.4330.3525.8120.26
39.9942.9036.2139.9039.5137.1031.2934.3127.6737.9031.2833.7431.1135.1230.5535.1829.7531.1328.7430.0933.1233.0332.8133.8228.9431.6127.3431.3223.3830.59
16181410152021
217346201040521122392883122372913141511361745195326
1716101492120
354289471654134812512171418424037236287533256204149
133520161018
215441525322551035532401939492314502836371749261120568
119201431018
4162417181453655229251121238443316103227121947340285330
1214167
211120
21
1186
10379
445
39164
1937
2448174712141826431552222950
36
Small CityRank
Nuevo LaredoMonclova-FronteraManzanilloMatamorosHeroica NogalesLa PazTapachula de Córdova y OrdóñezPachucaTulaTulancingoChetumalTepic CuautlaTecománFresnilloSan Luis Río ColoradoTlaxcala-ApizacoPlaya Del CarmenSan Juan Bautista TuxtepecIguala De La IndependenciaUruapanLa Piedad-PénjamoCiudad VallesSan Cristóbal De Las CasasZamora-JaconaChilpancingoTehuantepec
313233343536373839404142434445464748495051525354555657
InstitutionsRank
InputScore
InputRank
Human Capital and R&D Rank
MarketSophistication
Rank
BusinessSophistication
Rank
InfraestructureRank
324226345231724221944258275155115647572813489305449
30.5529.8830.9529.3428.0031.4932.6527.5526.9227.4030.7527.4629.0026.9517.2624.0525.1126.4922.6221.3727.5829.3327.1529.0428.0023.3919.48
273024323918164248442543354757515049545541334634385256
293130361511241944461021225243335038555126452734393557
318121321343146484729443875724511543302764225163345
50311546437452343713485742563551126949542045392238
272349251336513240343146285645205530543541382153423357
37
MetropolitanArea
BigCity
MediumCity
Technology and Knowledge Rank
Technology and Knowledge Rank
Technology and Knowledge Rank
OutputScore
OutputScore
OutputScore
Creative Goods and Services Rank
Creative Goods and Services Rank
Creative Goods and Servicaes Rank
OutputRank
OutputRank
OutputRank
Rank
Rank
Rank
Valle de MéxicoGuadalajaraMonterrey
TolucaLeónPuebla-TlaxcalaJuárezLa LagunaTijuana
HermosilloCuliacánVeracruz QuerétaroMéridaXalapaSaltilloChihuahuaMexicaliVillahermosaTampicoAguascalientesDurangoCuernavacaCancúnReynosaMoreliaSan Luis PotosíTuxtla GutiérrezAcapulcoOaxaca
123
123456
123456789101112131415161718192021
123
531642
710541252181691120317141813211519
65.2446.0441.21
29.2232.4132.4825.1125.4323.62
27.3826.7131.8527.6227.1030.9128.1826.0026.1533.2028.4924.3922.8721.7622.6924.4117.7516.0614.4716.6422.01
123
126354
872145315161014126191391721182011
123
321546
792683511101413141715121820211916
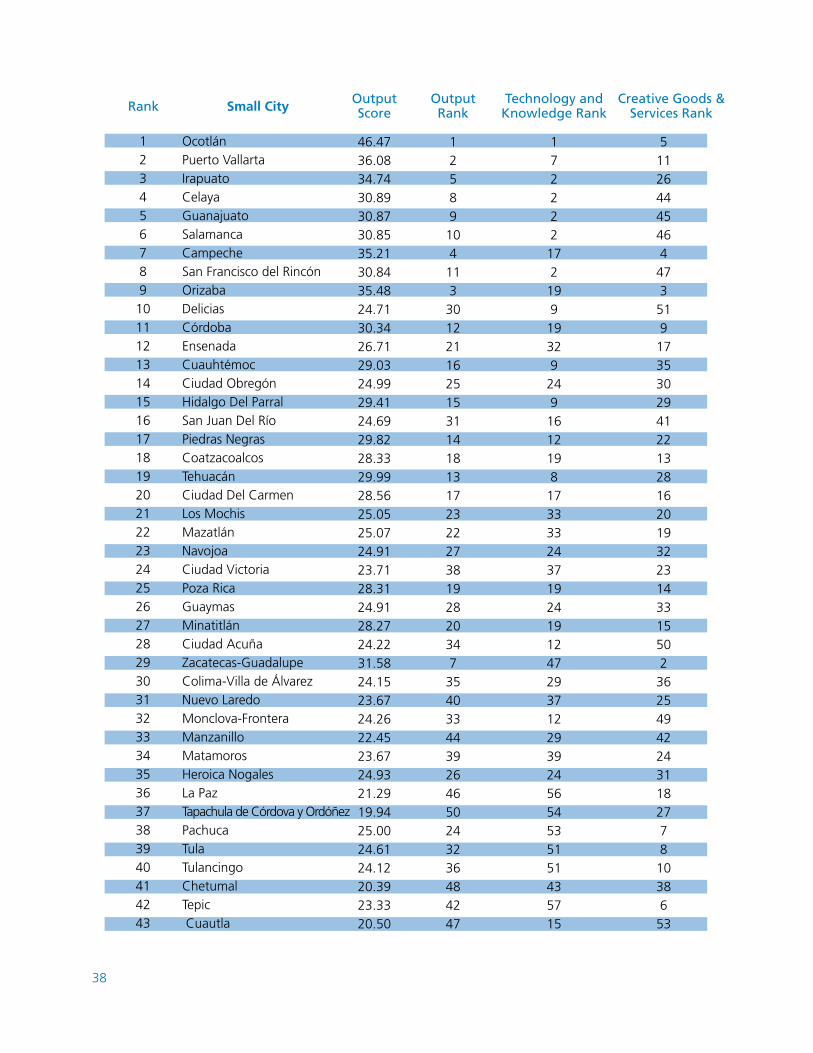
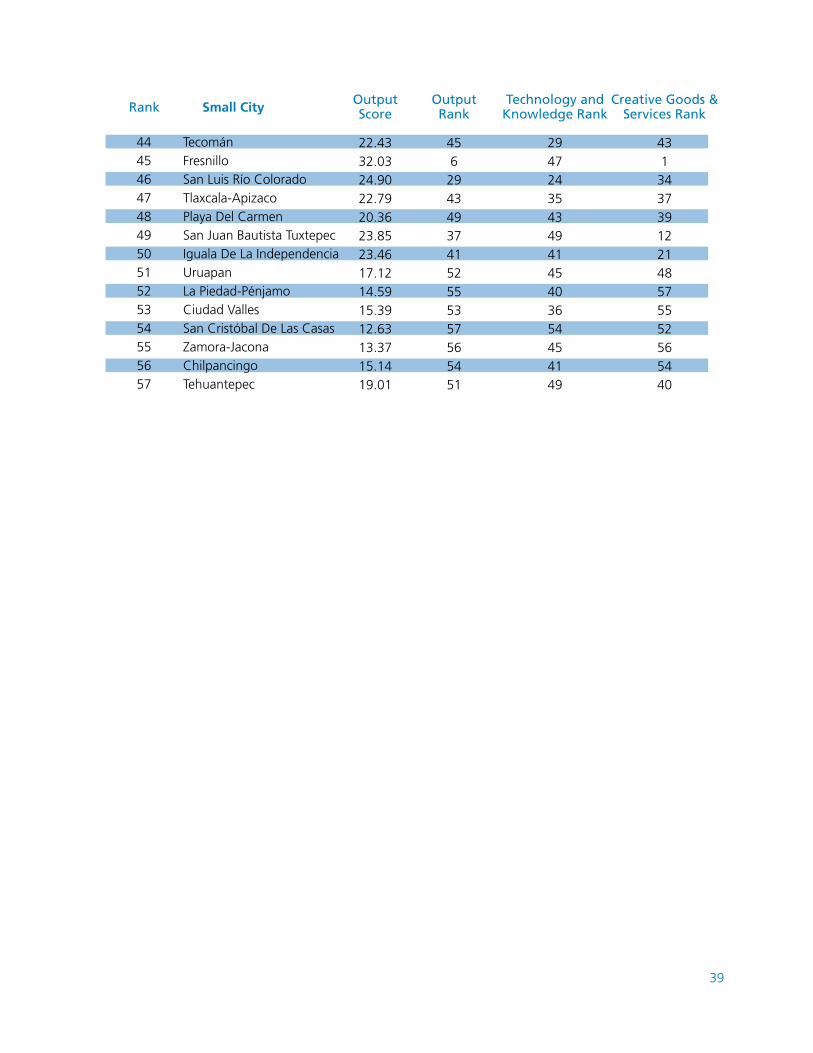
Output Results for Cities
38
Small CityRank
OcotlánPuerto VallartaIrapuatoCelayaGuanajuatoSalamancaCampecheSan Francisco del RincónOrizabaDeliciasCórdobaEnsenadaCuauhtémocCiudad ObregónHidalgo Del ParralSan Juan Del RíoPiedras NegrasCoatzacoalcosTehuacánCiudad Del CarmenLos MochisMazatlánNavojoaCiudad VictoriaPoza RicaGuaymasMinatitlánCiudad AcuñaZacatecas-GuadalupeColima-Villa de ÁlvarezNuevo LaredoMonclova-FronteraManzanilloMatamorosHeroica NogalesLa PazTapachula de Córdova y OrdóñezPachucaTulaTulancingoChetumalTepic Cuautla
12345678910111213141516171819202122232425262728293031323334353637383940414243
Technology and Knowledge Rank
OutputScore
Creative Goods & Services Rank
OutputRank
172222172199193292491612198173333243719241912472937122939245654535151435715
46.4736.0834.7430.8930.8730.8535.2130.8435.4824.7130.3426.7129.0324.9929.4124.6929.8228.3329.9928.5625.0525.0724.9123.7128.3124.9128.2724.2231.5824.1523.6724.2622.4523.6724.9321.2919.9425.0024.6124.1220.3923.3320.50
511264445464473519173530294122132816201932231433155023625494224311827781038653
125891041133012211625153114181317232227381928203473540334439264650243236484247
39
Small CityRank
TecománFresnilloSan Luis Río ColoradoTlaxcala-ApizacoPlaya Del CarmenSan Juan Bautista TuxtepecIguala De La IndependenciaUruapanLa Piedad-PénjamoCiudad VallesSan Cristóbal De Las CasasZamora-JaconaChilpancingoTehuantepec
4445464748495051525354555657
Technology and Knowledge Rank
OutputScore
Creative Goods & Services Rank
OutputRank
2947243543494145403654454149
22.4332.0324.9022.7920.3623.8523.4617.1214.5915.3912.6313.3715.1419.01
431343739122148575552565440
456294349374152555357565451
40
ANNEX II. INNOVATION PILLARS
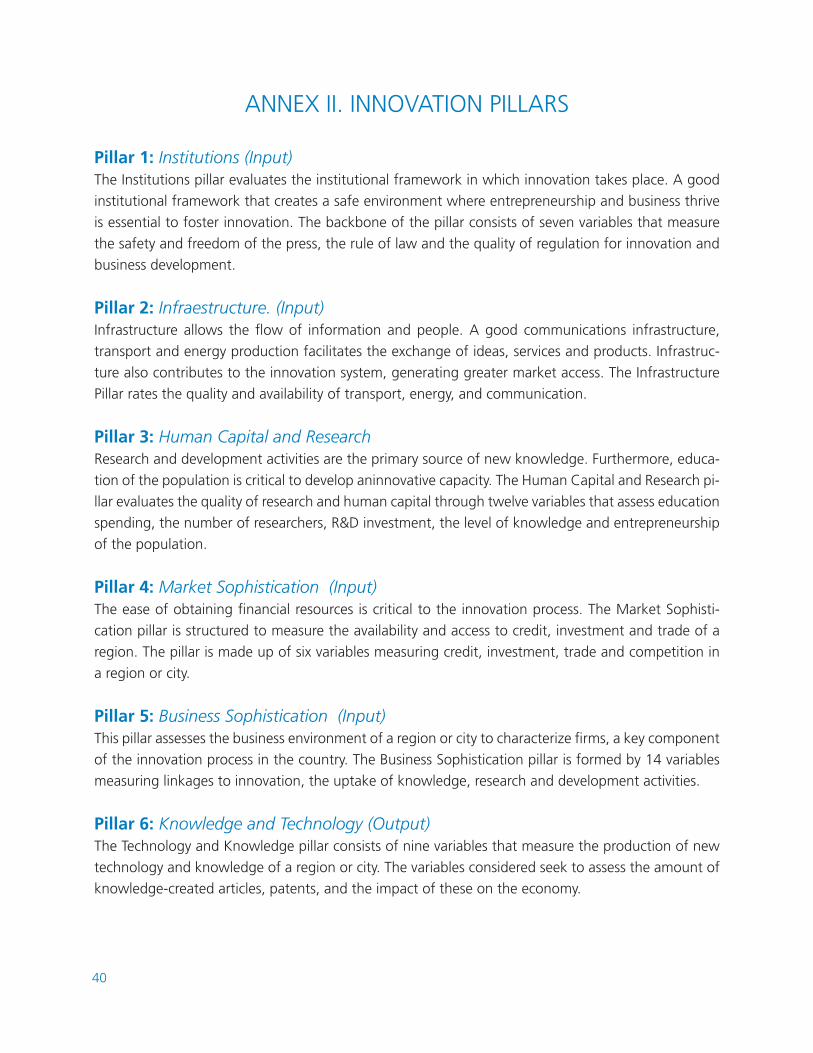
Pillar 1: Institutions (Input)The Institutions pillar evaluates the institutional framework in which innovation takes place. A good
institutional framework that creates a safe environment where entrepreneurship and business thrive
is essential to foster innovation. The backbone of the pillar consists of seven variables that measure
the safety and freedom of the press, the rule of law and the quality of regulation for innovation and
business development.
Pillar 2: Infraestructure. (Input)Infrastructure allows the flow of information and people. A good communications infrastructure,
transport and energy production facilitates the exchange of ideas, services and products. Infrastruc-
ture also contributes to the innovation system, generating greater market access. The Infrastructure
Pillar rates the quality and availability of transport, energy, and communication.
Pillar 3: Human Capital and Research Research and development activities are the primary source of new knowledge. Furthermore, educa-
tion of the population is critical to develop aninnovative capacity. The Human Capital and Research pi-
llar evaluates the quality of research and human capital through twelve variables that assess education
spending, the number of researchers, R&D investment, the level of knowledge and entrepreneurship
of the population.
Pillar 4: Market Sophistication (Input)The ease of obtaining financial resources is critical to the innovation process. The Market Sophisti-
cation pillar is structured to measure the availability and access to credit, investment and trade of a
region. The pillar is made up of six variables measuring credit, investment, trade and competition in
a region or city.
Pillar 5: Business Sophistication (Input)This pillar assesses the business environment of a region or city to characterize firms, a key component
of the innovation process in the country. The Business Sophistication pillar is formed by 14 variables
measuring linkages to innovation, the uptake of knowledge, research and development activities.
Pillar 6: Knowledge and Technology (Output)The Technology and Knowledge pillar consists of nine variables that measure the production of new
technology and knowledge of a region or city. The variables considered seek to assess the amount of
knowledge-created articles, patents, and the impact of these on the economy.
41
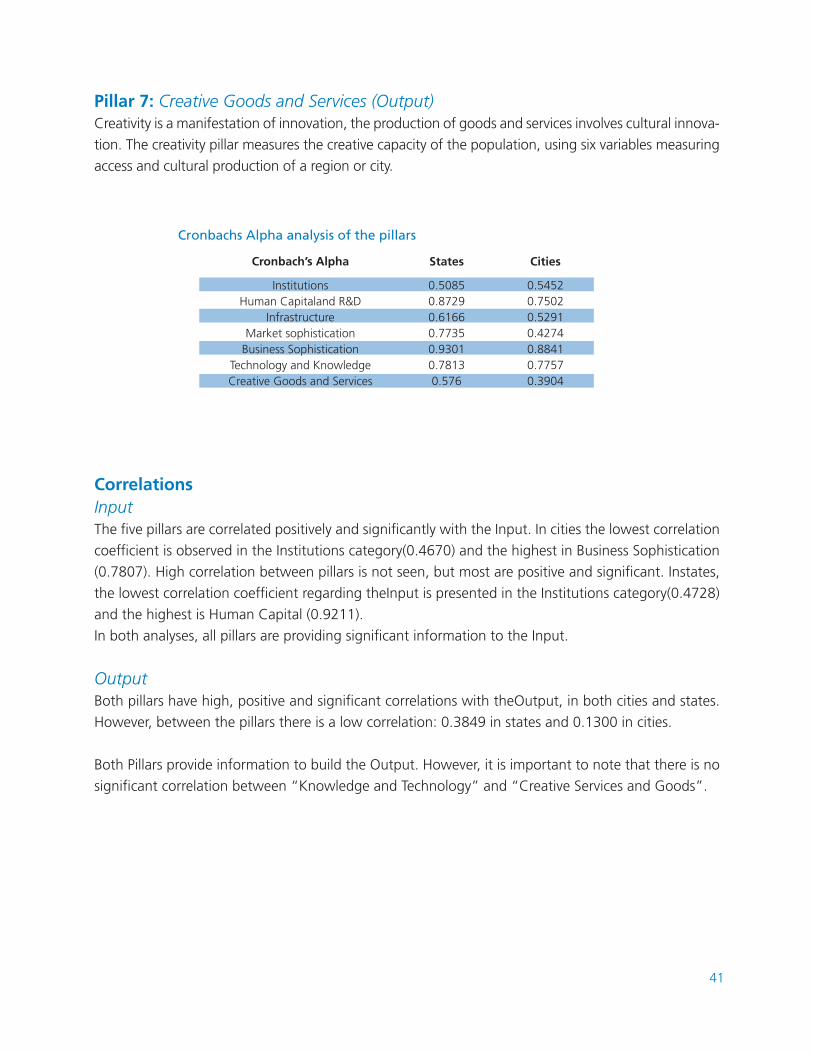
Pillar 7: Creative Goods and Services (Output)Creativity is a manifestation of innovation, the production of goods and services involves cultural innova-
tion. The creativity pillar measures the creative capacity of the population, using six variables measuring
access and cultural production of a region or city.
CorrelationsInputThe five pillars are correlated positively and significantly with the Input. In cities the lowest correlation
coefficient is observed in the Institutions category(0.4670) and the highest in Business Sophistication
(0.7807). High correlation between pillars is not seen, but most are positive and significant. Instates,
the lowest correlation coefficient regarding theInput is presented in the Institutions category(0.4728)
and the highest is Human Capital (0.9211).
In both analyses, all pillars are providing significant information to the Input.
OutputBoth pillars have high, positive and significant correlations with theOutput, in both cities and states.
However, between the pillars there is a low correlation: 0.3849 in states and 0.1300 in cities.
Both Pillars provide information to build the Output. However, it is important to note that there is no
significant correlation between “Knowledge and Technology” and “Creative Services and Goods”.
InstitutionsHuman Capitaland R&D
InfrastructureMarket sophistication
Business SophisticationTechnology and KnowledgeCreative Goods and Services
0.50850.87290.61660.77350.93010.78130.576
0.54520.75020.52910.42740.88410.77570.3904
Cronbach’s Alpha
Cronbachs Alpha analysis of the pillars
States Cities
42
ANNEX III. SURVEY TO FIRMS AND INSTITUTIONS OF RENIECYT
The study considers the firm as the unit of innovation. Therefore, key components in developing the
INI were the variables obtained from a survey made to 2,075 companies that belong to the National
Register of Scientific and Technological Institutions (RENIECYT) of the CONACYT.
Entities forming part of RENIECYT are those that have been identified by the CONACYT for their
research and development activities, as well as for having particular science and technology activi-
ties. Therefore, the understanding of the activity of these organisms is essential to understand how
business innovation takes place in the country. The survey focused on the determination of the ability
of firms to innovate and the nature of their innovation activities. The questions were aligned in three
main topics:
(1) Public policies that encourage and foster innovation.Innovation takes place in a context where governments intervene and design policies. Questions
about the perception of firms about the importance of government in fostering innovation were
made, particularly on the approach that the government should prioritize. Questions about particular
barriers and external factors that drive innovation, the competition in the market and the sources of
funding for innovation were also addressed. This approach will generate valuable information on the
efficiency and effectiveness of government activities.
(2) Key to innovation linkages: Linkages between firmsanddiverse stakeholders are key in innovation systems; however, they are
often the most difficult qualities to measure due to insufficient data. Therefore, a focus of the survey
was to obtain indicators of the degree of liaison and cooperation between firms and institutions.
Questions regarding the relationship of domestic companies with foreign companies,the academy, su-
ppliers and customers, were included. This approach allows identifying and addressing organizational
structures and practices that promote the transfer and development of knowledge.
(3) Entrepreneurship in the innovation of the firm.Entrepreneurship is an important part of the innovation process. The relationship between innovation
and entrepreneurship may seem dual because more innovation entails more entrepreneurship but en-
trepreneurship is also a requirement for innovation. The survey allowed to assess the degree of entre-
preneurial activity within firms and describes the relationship between entrepreneurship and innovation.
The survey created information about the characteristics of innovation of RENIECYT firms and insti-
tutions. In total, 2,075 interviews were completed and state representativeness was obtained. Of the
agencies surveyed, 35% were micro, 41% small firms, 9% medium firms and 12% large companies.
43
From this survey, marketing innovation was the least popular, while innovation in products and ser-
vices was dominant in the four types of companies. Additionally, customers are the main source of
inspiration for companies except for small businesses whose greater inspiration are other companies.
Furthermore, it was found that innovation activities are mainly financed withcompany equity, since
the financing of government funds are focused on small and medium-sized enterprises. This relates
directly with the main obstacle for innovation, which is the lack of financing sources. However for
large companies some of the main obstacle are also related with economic risks and high costs of
generating innovation.
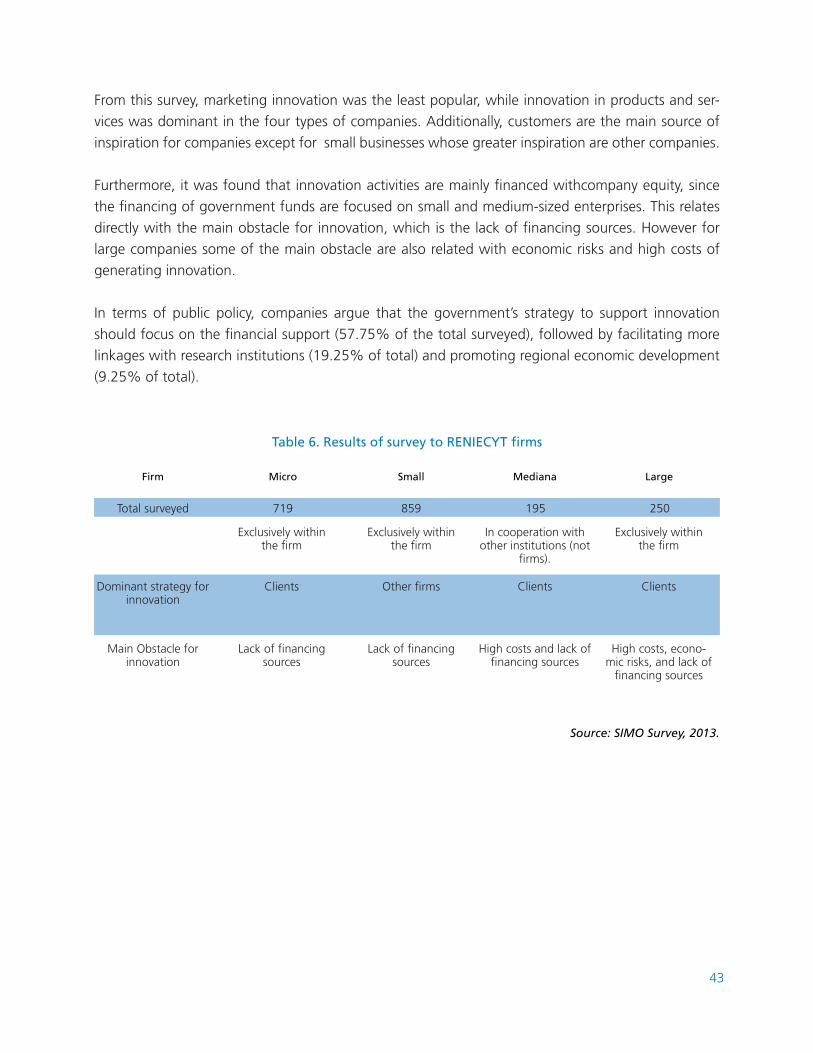
In terms of public policy, companies argue that the government’s strategy to support innovation
should focus on the financial support (57.75% of the total surveyed), followed by facilitating more
linkages with research institutions (19.25% of total) and promoting regional economic development
(9.25% of total).
Firm
Total surveyed
Dominant strategy for innovation
Main Obstacle for innovation
Micro
719 859 195 250
Exclusively within the firm
Clients
Lack of financing sources
Exclusively within the firm
Other firms
Lack of financing sources
In cooperation with other institutions (not
firms).
Clients
High costs and lack of financing sources
Exclusively within the firm
Clients
High costs, econo-mic risks, and lack of
financing sources
Small Mediana Large
Source: SIMO Survey, 2013.
Table 6. Results of survey to RENIECYT firms
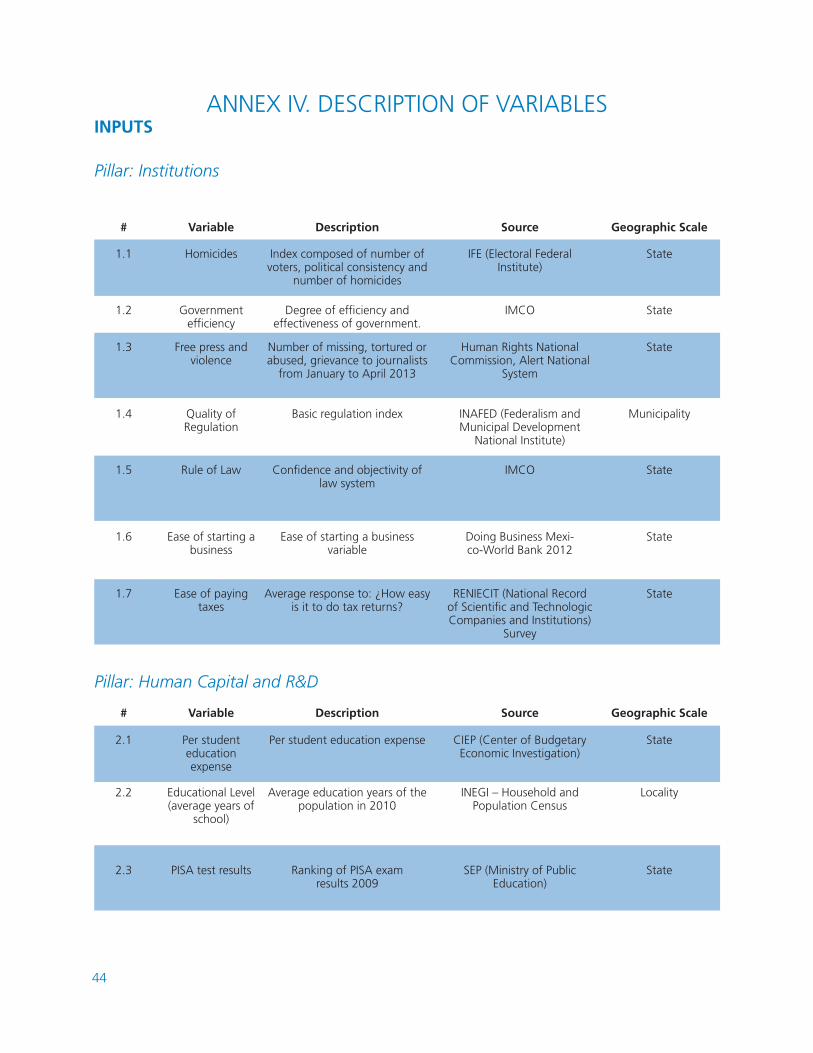
44
ANNEX IV. DESCRIPTION OF VARIABLESINPUTS
Pillar: Institutions
#
1.1
1.3
1.5
1.7
1.2
1.4
1.6
Variable
Homicides
Free press and violence
Rule of Law
Ease of paying taxes
Government efficiency
Quality of Regulation
Ease of starting a business
Description
Index composed of number of voters, political consistency and
number of homicides
Number of missing, tortured or abused, grievance to journalists
from January to April 2013
Confidence and objectivity of law system
Average response to: ¿How easy is it to do tax returns?
Degree of efficiency and effectiveness of government.
Basic regulation index
Ease of starting a business variable
Source
IFE (Electoral Federal Institute)
Human Rights National Commission, Alert National
System
IMCO
RENIECIT (National Record of Scientific and Technologic Companies and Institutions)
Survey
IMCO
INAFED (Federalism and Municipal Development
National Institute)
Doing Business Mexi-co-World Bank 2012
Geographic Scale
State
State
State
State
State
Municipality
State
2.1
2.2
2.3
Per student education expense
Educational Level (average years of
school)
PISA test results
Per student education expense
Average education years of the population in 2010
Ranking of PISA exam results 2009
CIEP (Center of Budgetary Economic Investigation)
INEGI – Household and Population Census
SEP (Ministry of Public Education)
State
Locality
State
Pillar: Human Capital and R&D
# Variable Description Source Geographic Scale
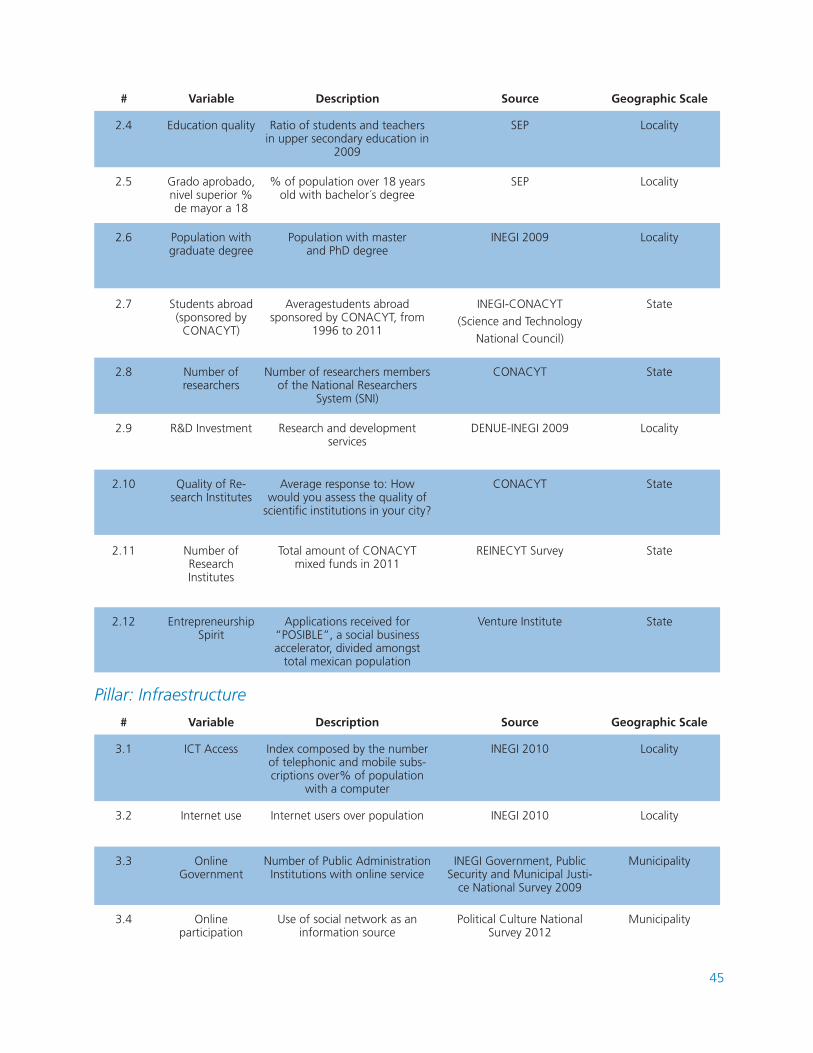
45
Pillar: Infraestructure
#
2.4
3.1
2.8
2.6
3.3
2.10
2.12
2.5
3.2
2.9
2.7
3.4
2.11
Variable
Education quality
ICT Access
Number of researchers
Population with graduate degree
Online Government
Quality of Re-search Institutes
Entrepreneurship Spirit
Grado aprobado, nivel superior % de mayor a 18
Internet use
R&D Investment
Students abroad (sponsored by
CONACYT)
Online participation
Number of Research Institutes
Description
Ratio of students and teachers in upper secondary education in
2009
Index composed by the number of telephonic and mobile subs-criptions over% of population
with a computer
Number of researchers members of the National Researchers
System (SNI)
Population with master and PhD degree
Number of Public Administration Institutions with online service
Average response to: How would you assess the quality of
scientific institutions in your city?
Applications received for “POSIBLE”, a social business accelerator, divided amongst
total mexican population
% of population over 18 years old with bachelor´s degree
Internet users over population
Research and development services
Averagestudents abroad sponsored by CONACYT, from
1996 to 2011
Use of social network as an information source
Total amount of CONACYT mixed funds in 2011
Source
SEP
INEGI 2010
CONACYT
INEGI 2009
INEGI Government, Public Security and Municipal Justi-
ce National Survey 2009
CONACYT
Venture Institute
SEP
INEGI 2010
DENUE-INEGI 2009
INEGI-CONACYT(Science and Technology
National Council)
Political Culture National Survey 2012
REINECYT Survey
Geographic Scale
Locality
Locality
State
Locality
Municipality
State
State
Locality
Locality
Locality
State
Municipality
State
# Variable Description Source Geographic Scale
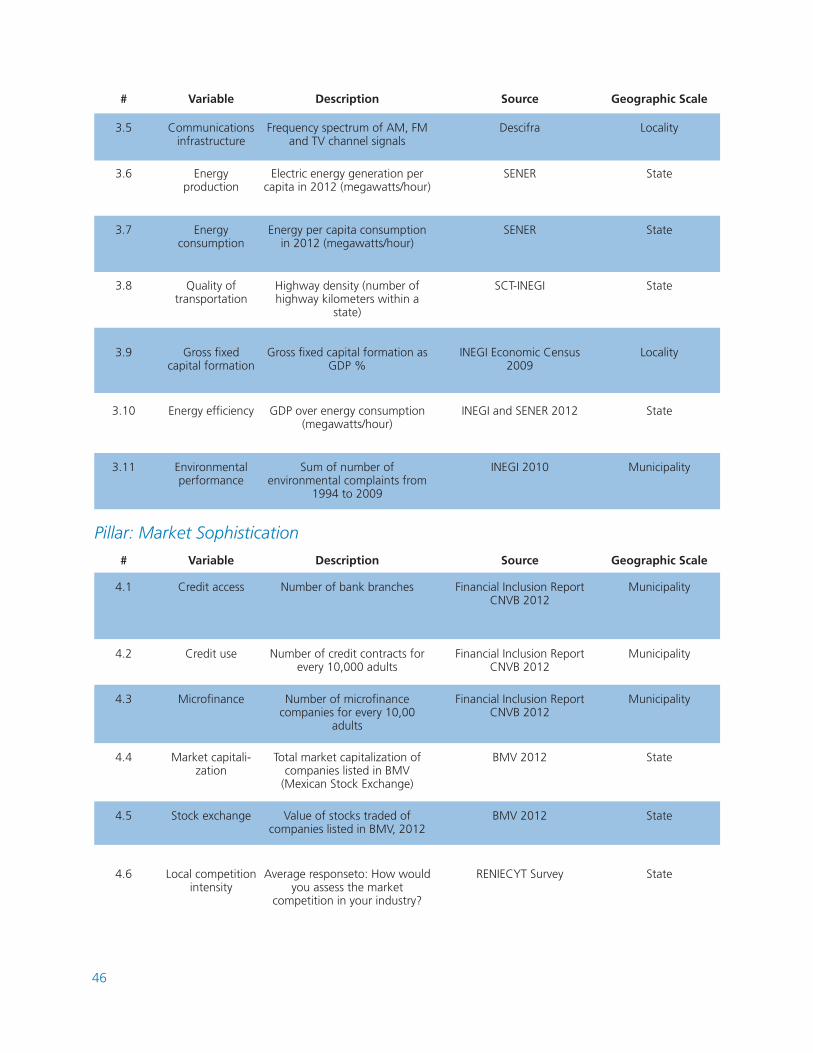
46
#
3.6
3.10
3.8
3.7
3.11
3.9
Variable
Energy production
Energy efficiency
Quality of transportation
Energy consumption
Environmental performance
Gross fixed capital formation
Description
Electric energy generation per capita in 2012 (megawatts/hour)
GDP over energy consumption (megawatts/hour)
Highway density (number of highway kilometers within a
state)
Energy per capita consumption in 2012 (megawatts/hour)
Sum of number of environmental complaints from
1994 to 2009
Gross fixed capital formation as GDP %
Source
SENER
INEGI and SENER 2012
SCT-INEGI
SENER
INEGI 2010
INEGI Economic Census 2009
Geographic Scale
State
State
State
State
Municipality
Locality
Pillar: Market Sophistication
#
4.1
4.5
4.6
4.3
4.2
4.4
Variable
Credit access
Stock exchange
Local competition intensity
Microfinance
Credit use
Market capitali-zation
Description
Number of bank branches
Value of stocks traded of companies listed in BMV, 2012
Average responseto: How would you assess the market
competition in your industry?
Number of microfinance companies for every 10,00
adults
Number of credit contracts for every 10,000 adults
Total market capitalization of companies listed in BMV
(Mexican Stock Exchange)
Source
Financial Inclusion Report CNVB 2012
BMV 2012
RENIECYT Survey
Financial Inclusion Report CNVB 2012
Financial Inclusion Report CNVB 2012
BMV 2012
Geographic Scale
Municipality
State
State
Municipality
Municipality
State
3.5 Communications infrastructure
Frequency spectrum of AM, FM and TV channel signals
Descifra Locality
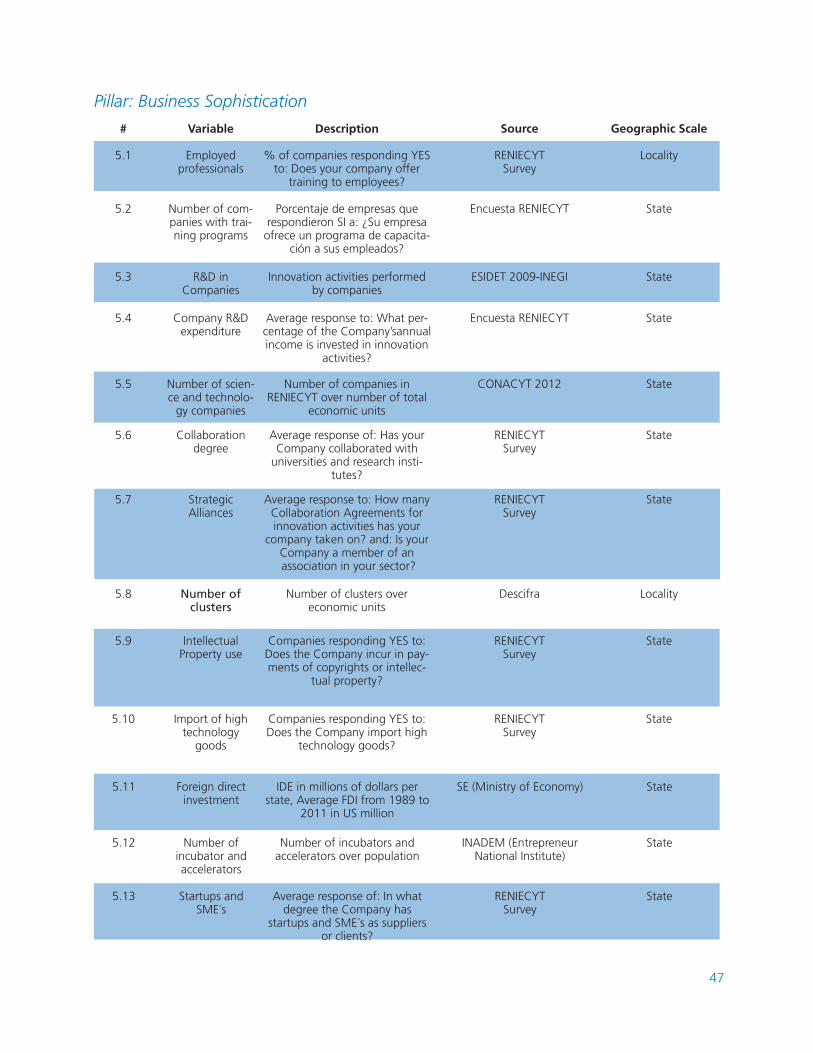
47
Pillar: Business Sophistication
#
5.1
5.5
5.10
5.3
5.8
5.2
5.7
5.4
5.9
5.6
Variable
Employed professionals
Number of scien-ce and technolo-
gy companies
Import of high technology
goods
R&D in Companies
Number of clusters
Number of com-panies with trai-ning programs
Strategic Alliances
Company R&D expenditure
Intellectual Property use
Collaboration degree
Description
% of companies responding YES to: Does your company offer
training to employees?
Number of companies in RENIECYT over number of total
economic units
Companies responding YES to: Does the Company import high
technology goods?
Innovation activities performed by companies
Number of clusters over economic units
Porcentaje de empresas que respondieron SI a: ¿Su empresa
ofrece un programa de capacita-ción a sus empleados?
Average response to: How many Collaboration Agreements for innovation activities has your
company taken on? and: Is your Company a member of an association in your sector?
Average response to: What per-centage of the Company’sannual income is invested in innovation
activities?
Companies responding YES to: Does the Company incur in pay-ments of copyrights or intellec-
tual property?
Average response of: Has your Company collaborated with
universities and research insti-tutes?
Source
RENIECYTSurvey
CONACYT 2012
RENIECYTSurvey
ESIDET 2009-INEGI
Descifra
Encuesta RENIECYT
RENIECYTSurvey
Encuesta RENIECYT
RENIECYTSurvey
RENIECYTSurvey
Geographic Scale
Locality
State
State
State
Locality
State
State
State
State
State
5.11
5.13
5.12
Foreign direct investment
Startups and SME´s
Number of incubator and accelerators
IDE in millions of dollars per state, Average FDI from 1989 to
2011 in US million
Average response of: In what degree the Company has
startups and SME´s as suppliers or clients?
Number of incubators and accelerators over population
SE (Ministry of Economy)
RENIECYTSurvey
INADEM (Entrepreneur National Institute)
State
State
State
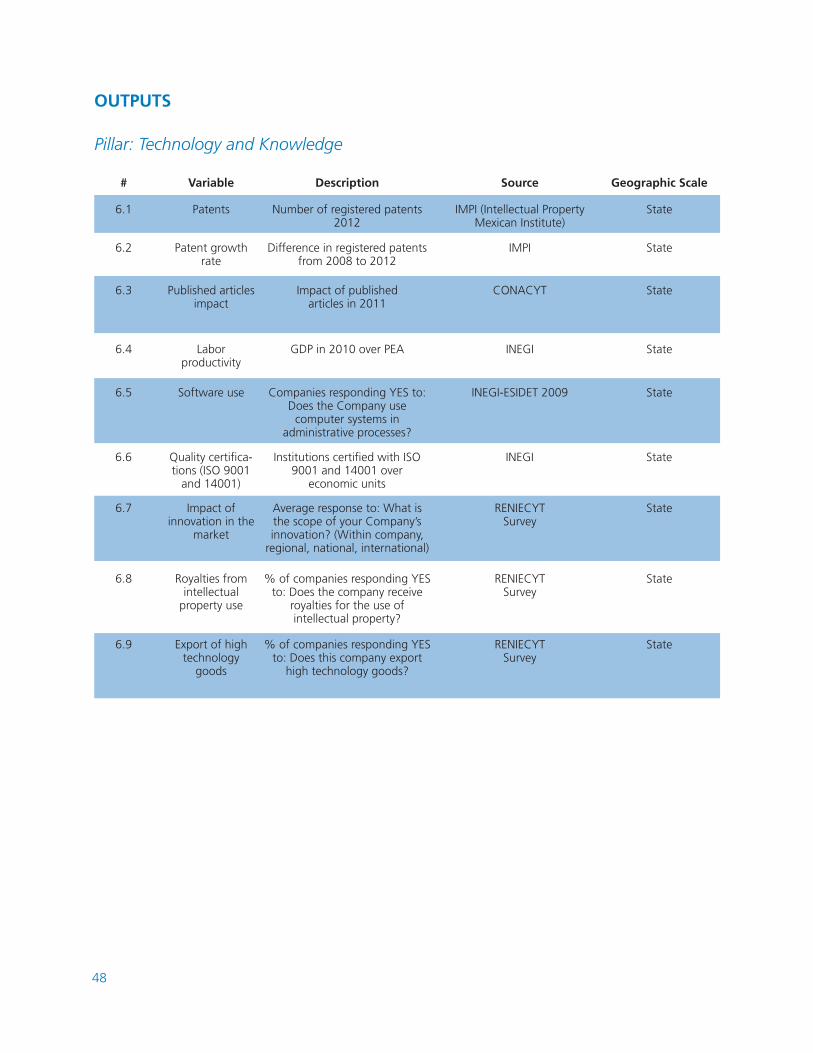
48
OUTPUTS
Pillar: Technology and Knowledge
#
6.1
6.3
6.5
6.2
6.4
Variable
Patents
Published articles impact
Software use
Patent growth rate
Labor productivity
Description
Number of registered patents 2012
Impact of published articles in 2011
Companies responding YES to: Does the Company use
computer systems in administrative processes?
Difference in registered patents from 2008 to 2012
GDP in 2010 over PEA
Source
IMPI (Intellectual Property Mexican Institute)
CONACYT
INEGI-ESIDET 2009
IMPI
INEGI
Geographic Scale
State
State
State
State
State
6.6 Quality certifica-tions (ISO 9001
and 14001)
Institutions certified with ISO 9001 and 14001 over
economic units
INEGI State
6.8
6.9
Royalties from intellectual
property use
Export of high technology
goods
% of companies responding YES to: Does the company receive
royalties for the use of intellectual property?
% of companies responding YES to: Does this company export
high technology goods?
RENIECYTSurvey
RENIECYTSurvey
State
State
6.7 Impact of innovation in the
market
Average response to: What is the scope of your Company’s innovation? (Within company,
regional, national, international)
RENIECYTSurvey
State
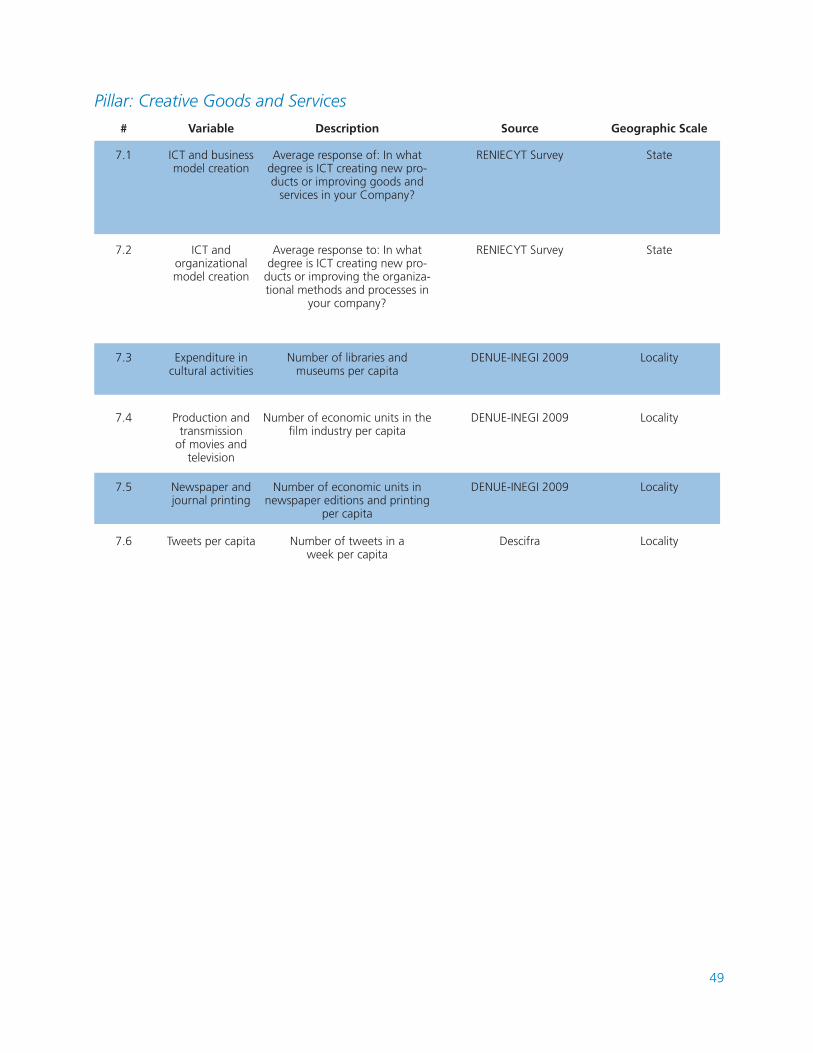
49
Pillar: Creative Goods and Services
#
7.1
7.5
7.3
7.2
7.4
7.6
Variable
ICT and business model creation
Newspaper and journal printing
Expenditure in cultural activities
ICT and organizational model creation
Production and transmission
of movies and television
Tweets per capita
Description
Average response of: In what degree is ICT creating new pro-ducts or improving goods and
services in your Company?
Number of economic units in newspaper editions and printing
per capita
Number of libraries and museums per capita
Average response to: In what degree is ICT creating new pro-
ducts or improving the organiza-tional methods and processes in
your company?
Number of economic units in the film industry per capita
Number of tweets in a week per capita
Source
RENIECYT Survey
DENUE-INEGI 2009
DENUE-INEGI 2009
RENIECYT Survey
DENUE-INEGI 2009
Descifra
Geographic Scale
State
Locality
Locality
State
Locality
Locality