Embed Size (px)
Citation preview
168
Chapter 8
National Income and Environmental Accounting
chaPter 8 focus QuestIons
• Dotraditionalnationalincomeaccountingmeasuresfailtoaccountfortheenvironment?• Howcantraditionalmeasuresbeadjustedtobetterreflecttheimportanceofnaturalcapitaland
environmental quality?• Whatisthepotentialforalternative“green”measuresofnationalwelfare?
8.1 greenIng the natIonal Income accounts
Taking natural capital and environmental quality seriously affects the way that we evaluate measures of national income and well-being. Can we say that a coun-try with a higher per capita income is necessarily better off than a similar country with a lower per capita national income? The overall well-being of a country is dependent on many factors other than income levels, including health, education levels, social cohesion, and political participation. But most important from the point of view of environmental analysis, a country’s well-being is also a function of natural capital levels and environmental quality.
Standard measures of gross national product (GNP) or gross domestic product (GDP) are commonly used to measure a country’s level of economic activity and progress in development, with gDP being the most frequently used measure.a (See Appendix 8.1 for an introduction to national income accounting.) Macroeconomic analyses and international comparisons are based on these measures, and they are widely recognized as important standards of economic progress.
Many analysts have pointed out that these measures can give a highly mislead-ing impression of economic and human development. To be fair, gDP was never intended to be an accurate measure of a country’s well-being. But politicians and economists often place disproportionate importance on gDP and act as if maximiz-
a The difference between gNP and gDP concerns whether foreign earnings are included. gNP includes the earnings of a country’s citizens and corporations regardless of where they are located in the world. gDP includes all earnings within a country’s borders, even the earnings of foreign citizens and corporations. gDP is the measure more commonly used when comparing international statistics.
natural capitalthe available endowment of land and resources including air, water, soil, forests, fisheries, minerals, and ecological life-support systems.
gross national product (GNP)the total market value of all final goods and services produced by citizens of a particular country in a year, regardless of where such production takes place.
gross domestic product (GDP)the total market value of all final goods and services produced within a national border in a year.
national inCome and environmental aCCounting 169
ing it is the primary objective of public policy. But maximizing gDP can conflict with other goals such as promoting social equity or protecting the environment.
While gDP accurately reflects the production of marketed goods and services, it fails to provide a broader measure of social welfare. Some of the common critiques of standard accounting measures such as gDP include:
• Volunteerworkisnotaccountedfor. Standard measures do not count the benefits of volunteer work, even though such work can contribute to social well-being as much as paid work.
• Householdproductionisnotincluded. While standard accounting measures include the paid labor from such market household activities as housekeep-ing and gardening, these services are not counted when they are unpaid.
• Noconsiderationismadeforchangesinleisuretime. A country’s gDP rises if, ceteris paribus, total work hours increase.b However, no accounting is made for the loss of leisure time.
• Defensive expenditures areincluded. one example is expenditures on police protection. If police expenditures are increased to counter a rise in crime levels, the increased spending raises gDP, but no consideration is made for the negative impacts of higher crime rates.
• Thedistributionofincomeisnotconsidered. Two countries with the same gDP per capita may have significantly different income distributions and, consequently, different levels of overall well-being.
• Non-economic contributors to well-being are excluded. gDP does not consider the health of a country’s citizens, education levels, political par-ticipation, or other social and political factors that may significantly affect well-being levels.
In our study of environmental issues, we must add another major criticism of standard accounting measures—they fail to account for environmental degrada-tion and resource depletion. This issue can be important especially in developing countries, which depend heavily on natural resources. If a country cuts down its forests, depletes its soil fertility, and pollutes its water supplies, this surely makes the country poorer in some very real sense. But national income accounts merely record the market value of the timber, agricultural produce, and industrial output as positive contributions to gDP. This may lead policy makers to view the coun-try’s development in an unrealistically rosy light—at least until the effects of the environmental damage become apparent, which in some cases may be decades.
If we are measuring social welfare with, so to speak, the wrong ruler, we may obtain policy prescriptions that could actually make a country worse off, rather than better off. Economic growth alone does not necessarily represent true eco-nomic development and may even lower human well-being if it is accompanied by growing inequity and environmental degradation. The attempt to define better measures of development has led to new proposals to adjust or replace traditional accounting measures in order to take into account resource and environmental factors. In this chapter, we discuss the estimation and application of several of these alternatives.
bCeteris paribus, a Latin phrase that means “other things equal,” is used by economists to make clear what assumptions are used as the basis of an analysis.
defensive expenditures (approach)a pollution valuation methodology based on the expenditures households take to avoid or mitigate their exposure to a pollutant.
170 Part three, ChaPter 8
Efforts to develop “greener” accounting measures are relatively new. Interest in inclusion of the environment in national accounting began in the 1970s and 1980s, when several European countries began to estimate physical accounts for natural resources such as forests, water, and land resources.1 In 1993 the United Nations published a comprehensive handbook on environmental accounting, which was revised in 2003 and further systematized in 2012.2 The 2003 System of Environ-mental and Economic Accounts (commonly referred to as SEEA-2003) describes four basic approaches to environmental accounting:3
1. Measuringtherelationshipsbetweentheenvironmentandtheeconomyinbothdirections.c This approach seeks to quantify the ways various economic sectors are dependent upon natural resources as well as the way the environ-ment is affected by different economic activities. for example, one might seek to estimate how much air pollution results when different industrial sectors increase their production levels. These accounts combine monetary data with information on the flow of materials, pollution, and energy in an economy. A key motivation for this approach is to determine how closely economic activity is linked to material inputs and pollution outputs.
2. Measuring environmental economic activities. This approach measures expenditures on environmental protection and the impact of economic poli-cies, such as taxes and subsidies, to reduce environmental damages.
3. Environmentalassetaccounts. This approach collects data on the levels of various types of natural capital, such as forests, minerals, and groundwater. As we discuss later in this chapter, these accounts (also called natural re-source or satellite accounts) can be kept in either physical units or monetary terms.
4. Adjustingexistingaccountingmeasures toaccount fornatural capitaldegradation. This approach seeks to monetize the damages associated with the depletion of natural resources and environmental quality degradation, as well as identify defensive expenditures made in response to, or in order to avoid, environmental damages. This approach essentially takes existing national accounting measures and makes a monetary deduction to represent environmental damages.
Note that these approaches are not necessarily mutually exclusive—we could theoretically implement all of them simultaneously. While many countries have adopted one or more of these accounts to some extent, no country has fully imple-mented the SEEA-2003 provisions. In this chapter, we focus mainly on the last two of these approaches. In addition, we consider proposals for entirely new national welfare measures that seek to provide a fundamentally different perspective on measuring national welfare.
Before we delve into specific measures, it is important to note that there is no universally accepted approach to environmental accounting. While various mea-sures have been developed and implemented, there is no uniform standard for alternative national accounting. We consider the future of environmental account-ing at the end of the chapter.
cThis approach is referred to as “physical flow accounts” or “hybrid accounts.”
System of environmental and economic Accounts (SeeA)a guidebook developed by the United Nations to provide standards for incorporating natural capital and environmental quality into national accounting systems.
satellite accountsaccounts that estimate the supply of natural capital in physical, rather than monetary, terms; used to supplement traditional national income accounting.
national inCome and environmental aCCounting 171
8.2 envIronmentally adjusted net domestIc Product
Perhaps the most basic approach to green accounting is to start with traditional mea-sures and make adjustments that reflect environmental concerns (the fourth approach previously described in the SEEA-2003). In current national income accounting, it is commonly recognized that some of each year’s economic production is offset by the depreciation of manufactured, or fixed, capital, such as buildings and machinery.d In other words, while economic activity provides society with the benefits of new goods and services, each year the value of previously produced assets declines, and this loss of benefits should be accounted for. Thus standard national accounting methods produce estimates of net domestic product (NDP), which starts with gDP and then deducts the annual depreciation value of existing fixed capital:
NDP = GDP – Dm
where Dm is the depreciation of fixed capital. In 2011 the gDP of the United States was $15.1 trillion. But the depreciation of fixed capital that year totaled $1.9 trillion.e Thus the NDP of the United States in 2011 was about $13.2 trillion.
Taking this logic a step further, we realize that each year the value of natural capital may also depreciate as a result of resource extraction or environmental degradation. In some cases, the value of natural capital could increase as well if en-vironmental quality improves. The net annual change in the value of natural capital in a country can simply be added or subtracted from NDP to obtain what has been called environmentally adjusted NDP (EDP). So we would obtain EDP as:
EDP = GDP – Dm – Dn
where Dn is the depreciation of natural capital. This measure requires estimating natural capital depreciation in monetary terms, rather than physical units such as biomass volume or habitat area. The methods discussed in Chapter 6 can theoreti-cally be used to estimate such values, but obviously estimating all types of natural capital depreciation in monetary terms is a daunting task that would require many assumptions. Thus the estimates of EDP that have been produced focus on only a few categories of natural capital depreciation.
one of the earliest attempts at green accounting estimated EDP for Indonesia over a fourteen-year period, 1971–1984.4 This pioneering analysis deducted the value of depreciation for three categories of natural capital: oil, forests, and soil. The values of gDP and EDP over this time period are displayed in figure 8.1.f
While the data in figure 8.1 are somewhat older, the results present several impor-tant points that will continue to be relevant as we proceed through this chapter:
dDepreciation is simply a measure of the loss of capital value through wear and tear. for accounting purposes, it can be calculated using a “straight-line” formula according to which, for example, a new machine is estimated to lose 10 percent of its original value each year over a ten-year period, or using more complex valuation methods.
eEstimates of fixed capital depreciation are obtained from tax records. Businesses are not taxed on the value of their fixed capital depreciation—thus they have a strong incentive to claim this deduction.
fThe analysis actually refers to EDP as NDP, which they called “adjusted net domestic product.” But to avoid confusion with the more common usage of the term “net domestic product”—only deducting for fixed capital depreciation—we call their environ-mentally adjusted values EDP.
green accountinggeneral term applied to efforts to incorporate natural resources and environmental quality into national accounting techniques.
net domestic product (NDP)gross domestic product minus the value of depreciation of produced, or human-made, capital.
environmentally adjusted net domestic product (eDP)a national accounting measure that deducts a monetary value from net domestic product to account for natural capital depreciation.
natural capital depreciationa deduction in national accounting for loss of natural capital, such as a reduction in the supply of timber, wildlife habitat, or mineral resources.
172 Part three, ChaPter 8
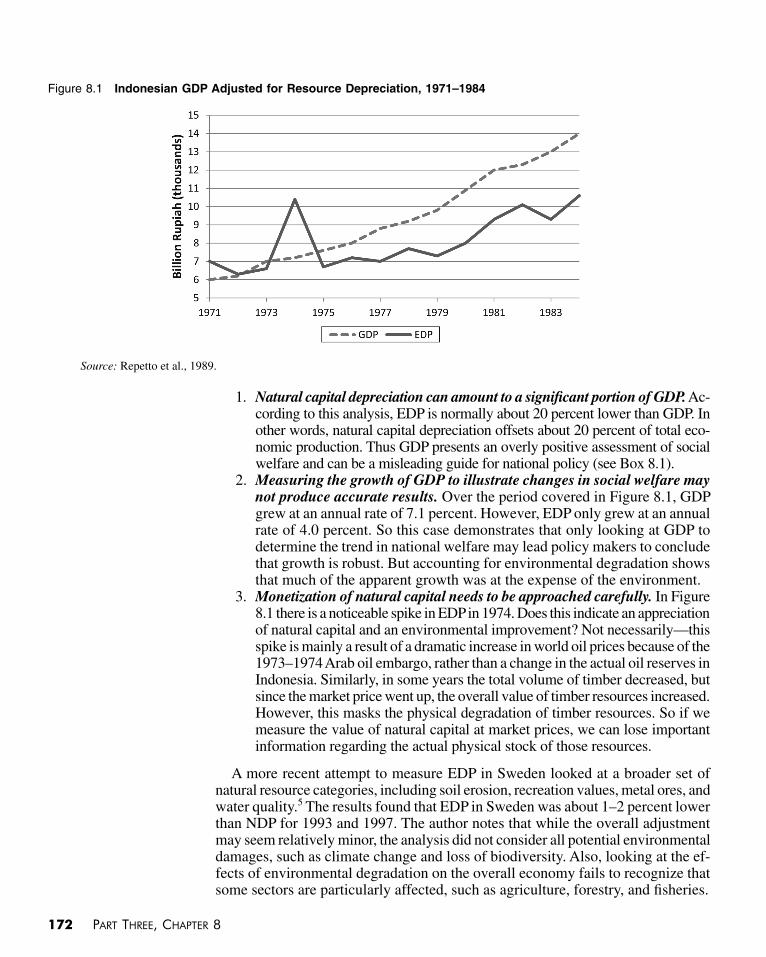
1. NaturalcapitaldepreciationcanamounttoasignificantportionofGDP. Ac-cording to this analysis, EDP is normally about 20 percent lower than gDP. In other words, natural capital depreciation offsets about 20 percent of total eco-nomic production. Thus gDP presents an overly positive assessment of social welfare and can be a misleading guide for national policy (see Box 8.1).
2. MeasuringthegrowthofGDPtoillustratechangesinsocialwelfaremaynotproduceaccurateresults. over the period covered in figure 8.1, gDP grew at an annual rate of 7.1 percent. However, EDP only grew at an annual rate of 4.0 percent. So this case demonstrates that only looking at gDP to determine the trend in national welfare may lead policy makers to conclude that growth is robust. But accounting for environmental degradation shows that much of the apparent growth was at the expense of the environment.
3. Monetizationofnaturalcapitalneedstobeapproachedcarefully. In figure 8.1 there is a noticeable spike in EDP in 1974. Does this indicate an appreciation of natural capital and an environmental improvement? Not necessarily—this spike is mainly a result of a dramatic increase in world oil prices because of the 1973–1974 Arab oil embargo, rather than a change in the actual oil reserves in Indonesia. Similarly, in some years the total volume of timber decreased, but since the market price went up, the overall value of timber resources increased. However, this masks the physical degradation of timber resources. So if we measure the value of natural capital at market prices, we can lose important information regarding the actual physical stock of those resources.
A more recent attempt to measure EDP in Sweden looked at a broader set of natural resource categories, including soil erosion, recreation values, metal ores, and water quality.5 The results found that EDP in Sweden was about 1–2 percent lower than NDP for 1993 and 1997. The author notes that while the overall adjustment may seem relatively minor, the analysis did not consider all potential environmental damages, such as climate change and loss of biodiversity. Also, looking at the ef-fects of environmental degradation on the overall economy fails to recognize that some sectors are particularly affected, such as agriculture, forestry, and fisheries.
Figure 8.1 indonesian GDP Adjusted for resource Depreciation, 1971–1984
Source: Repetto et al., 1989.
national inCome and environmental aCCounting 173
Another study estimated the value of changes in forest resources in India in 2003.6 Based on timber and firewood market prices, the results indicated that while the overall stock of timber decreased, EDP was actually slightly higher than NDP. Again, this illustrates the potential distortionary effect of looking only at adjustments in monetary terms without looking in more detail at the actual physical environment.
8.3 adjusted net savIng
In addition to gDP, traditional national accounting methods also estimate sav-ing and investment rates. These accounts provide some insight into how much a country is saving for its future. Starting with gross savings, including savings by governments, businesses, and individuals, net domestic saving is obtained after adjustments for borrowing and fixed capital depreciation. Thus net domestic sav-ing can be positive or negative. for example, in 2010 the United States had a net domestic saving rate that was negative: –1.1 percent of national income.
Box 8.1 iNCorreCT ACCoUNTiNG LeADS To iNCorreCT PoLiCieS
If economists accept conventional estimates of the gross domestic product (GDP), then their policy recommendations are likely to be wrong in the case of natural resource dependent economies. Output estimates may be exaggerated by 20 percent or more, and true estimates of capital forma-tion may turn out to be null or negative. Factor productivity estimates are thrown into question when neither the products nor the inputs are measured correctly. Capital/output ratios will be incorrect if they ignore rapid liquidation of natural capital. Sophisticated macroeconomic models based on such data will give highly questionable results for guiding long-term development.
International trade will tend to align domestic with international prices. But international prices are often distorted by agricultural subsidies, political and military interventions, and the failure to internalize externalities. As a result, natural resources are likely to be sold below full environmental cost.
The impact of natural capital depletion will be especially large in estimates of national saving and investment. Estimates of “adjusted net saving” by the World Bank indicate that many countries’ net saving and capital formation may in fact be negative, a clear indicator of unsustainability.
The exportation of natural capital also distorts exchange rates and creates a bias against non–resource-exporting sectors, including manufacturing. Methods used to estimate exchange rate overvaluation will not be reliable when proceeds from the unsustainable export of natural assets finance an import surplus. In this case, an apparent stability of the domestic price level will be illusory, masking significant damage to non–resource-exporting sectors that must compete with artificially cheap imports. In the balance of payments accounts, a trade deficit may be concealed or appear to be a surplus, since the proceeds of natural capital exports are recorded incorrectly in the current account.
“Greening the national accounts is more important for economic than for environmental policy . . . especially for those countries whose natural resources are rapidly eroding, and the erosion is counted misleadingly in GDP as value added. Once the accounts are greened, macroeconomic policies need to be re-examined.”
Source: El Serafy, 2013.
net domestic savings (NDS)a national accounting measure equal to gross domestic savings less manufactured capital depreciation.
174 Part three, ChaPter 8
We can propose that how a country manages its natural resources and environ-mental quality also provides information about whether it is saving for the future or causing depletion that may make future generations worse off. As in the calculation of EDP, we can adjust net domestic saving to incorporate a country’s management of its natural resources. The World Bank has developed such a measure, called adjusted net saving (ANS).g Unlike standard measures of national saving, ANS
takes the broader view that natural and human capital are assets upon which the productivity and therefore the well-being of a nation rest. Since depletion of a non-renewable resource (or over-exploitation of a renewable one) decreases the value of that resource stock as an asset, such activity represents a disinvestment in future productivity and well-being.7
An ANS analysis, particularly appropriate for developing countries, may show that what appears to be a development “success story” can conceal serious natural capital depletion and in some cases even a negative adjusted net saving rate.
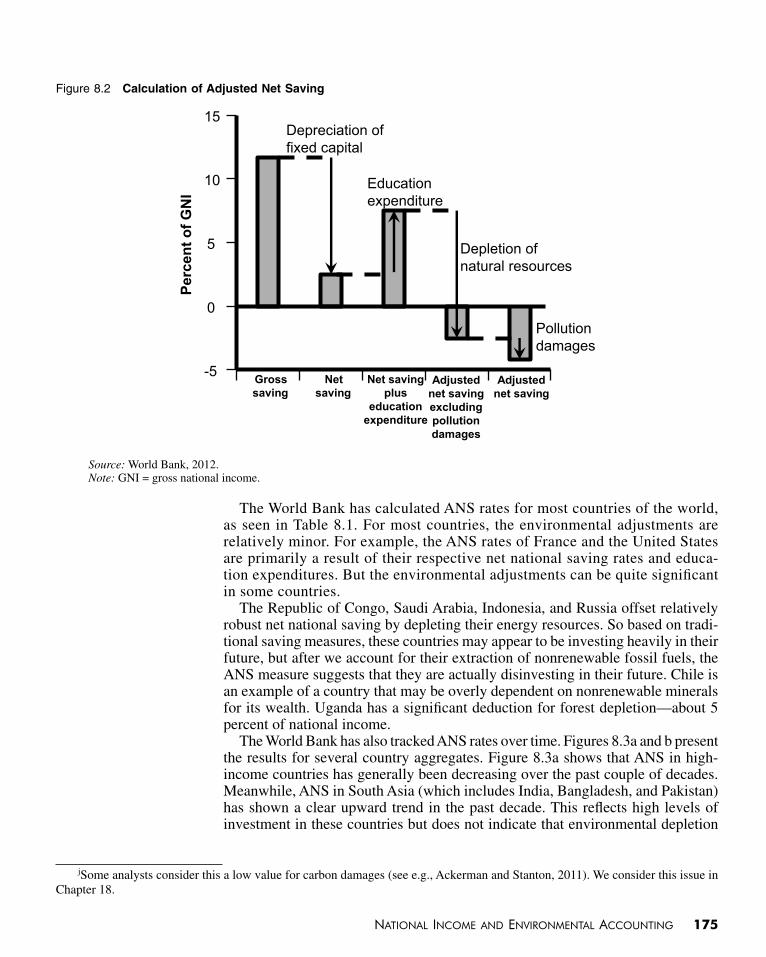
ANS is normally calculated as a percentage of national income, although it could also be expressed in monetary units. The calculation of ANS is summarized in figure 8.2. ANS is obtained using the following steps:h
• Startwithgrossnationalsaving.• Makeadeductiontoaccountforthedepreciationoffixedcapitaltoobtain
net national saving.• Adjustforeducationexpenditures. Unlike standard measures, ANS consid-
ers expenditures on education to be investments in the future of a society.i So expenditures on education are added to net national saving to reflect investment in human capital.
• Adjustforenergyresourcedepletion. A deduction is made for the depletion of nonrenewable fossil fuels—oil, coal, and natural gas. The deduction is calculated as the total market value of the resource minus its extraction cost.
• Adjustformetalandmineraldepletion. A deduction is made for the extrac-tion of nonrenewable mineral resources, including copper, gold, lead, nickel, phosphate, and several other resources. The deduction is again calculated as the total market value of each mineral minus its extraction cost.
• Adjust for net forest depletion. Unsustainable depletion of a country’s forest resources is considered a disinvestment in the future. As forests are renewable resources, it is possible that a country could actually increase its forest resources. Thus net forest depletion is calculated as the annual value of extraction for commercial uses such as timber and fuelwood, combined with an estimate of the net change in forest area.
• Adjustforcarbondioxidedamages. Carbon dioxide emissions represent a disinvestment in a country’s future as they contribute to damage from climate change. A country’s annual emissions are multiplied by an assumed damage of $20 per ton of carbon.j
gAdjusted net savings is also called genuine savings.hIn addition to the steps presented in the text, some calculations of ANS also include a deduction for particulate matter emissions.igross saving already includes fixed capital education expenditures, such as spending on buildings and buses. However, teacher sala-
ries are not included nor is spending on books and other educational supplies. ANS adds in these nonfixed capital expenditures.
adjusted net saving (ANS)a national accounting measure developed by the World Bank which aims to measure how much a country is actually saving for it future.
national inCome and environmental aCCounting 175
The World Bank has calculated ANS rates for most countries of the world, as seen in Table 8.1. for most countries, the environmental adjustments are relatively minor. for example, the ANS rates of france and the United States are primarily a result of their respective net national saving rates and educa-tion expenditures. But the environmental adjustments can be quite significant in some countries.
The Republic of Congo, Saudi Arabia, Indonesia, and Russia offset relatively robust net national saving by depleting their energy resources. So based on tradi-tional saving measures, these countries may appear to be investing heavily in their future, but after we account for their extraction of nonrenewable fossil fuels, the ANS measure suggests that they are actually disinvesting in their future. Chile is an example of a country that may be overly dependent on nonrenewable minerals for its wealth. Uganda has a significant deduction for forest depletion—about 5 percent of national income.
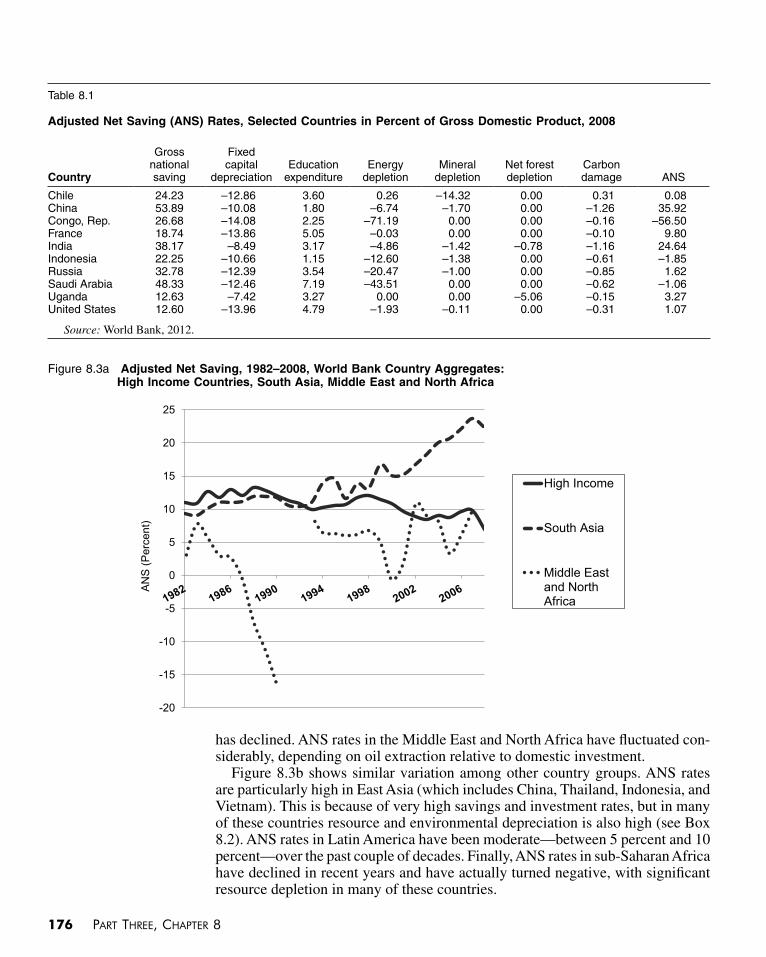
The World Bank has also tracked ANS rates over time. figures 8.3a and b present the results for several country aggregates. figure 8.3a shows that ANS in high-income countries has generally been decreasing over the past couple of decades. Meanwhile, ANS in South Asia (which includes India, Bangladesh, and Pakistan) has shown a clear upward trend in the past decade. This reflects high levels of investment in these countries but does not indicate that environmental depletion
Figure 8.2 Calculation of Adjusted Net Saving
Source: World Bank, 2012.Note: gNI = gross national income.
jSome analysts consider this a low value for carbon damages (see e.g., Ackerman and Stanton, 2011). We consider this issue in Chapter 18.
176 Part three, ChaPter 8
has declined. ANS rates in the Middle East and North Africa have fluctuated con-siderably, depending on oil extraction relative to domestic investment.
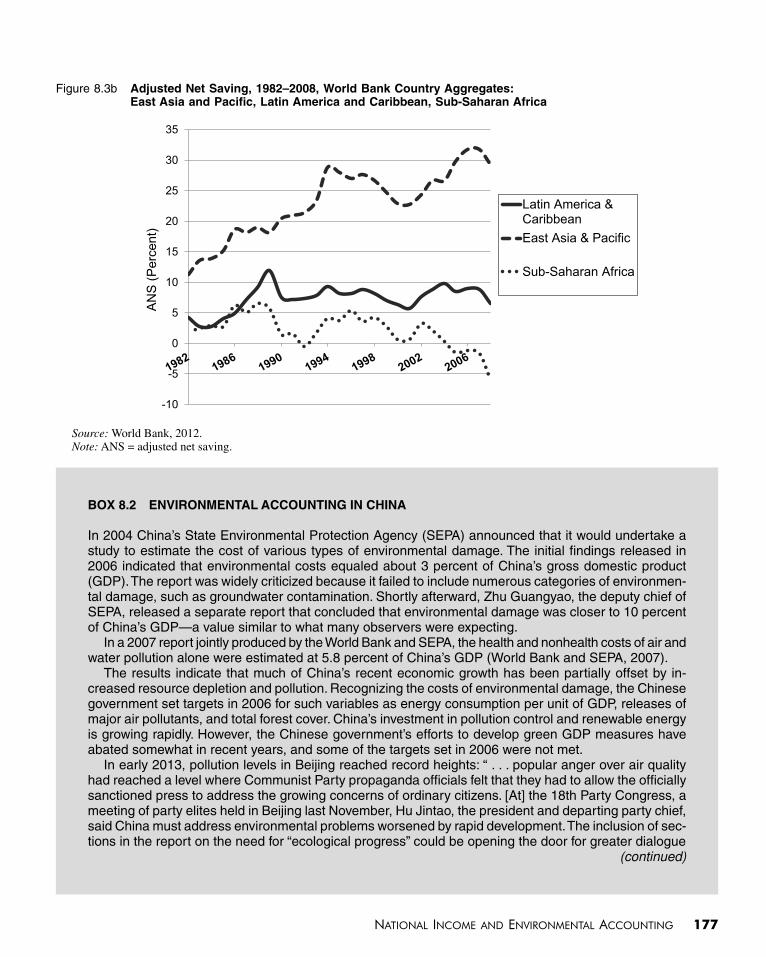
figure 8.3b shows similar variation among other country groups. ANS rates are particularly high in East Asia (which includes China, Thailand, Indonesia, and vietnam). This is because of very high savings and investment rates, but in many of these countries resource and environmental depreciation is also high (see Box 8.2). ANS rates in Latin America have been moderate—between 5 percent and 10 percent—over the past couple of decades. finally, ANS rates in sub-Saharan Africa have declined in recent years and have actually turned negative, with significant resource depletion in many of these countries.
Table 8.1
Adjusted Net Saving (ANS) rates, Selected Countries in Percent of Gross Domestic Product, 2008
Country
Gross national saving
Fixed capital
depreciationEducation
expenditureEnergy
depletionMineral
depletionNet forest depletion
Carbon damage ANS
Chile 24.23 –12.86 3.60 0.26 –14.32 0.00 0.31 0.08China 53.89 –10.08 1.80 –6.74 –1.70 0.00 –1.26 35.92Congo, Rep. 26.68 –14.08 2.25 –71.19 0.00 0.00 –0.16 –56.50France 18.74 –13.86 5.05 –0.03 0.00 0.00 –0.10 9.80India 38.17 –8.49 3.17 –4.86 –1.42 –0.78 –1.16 24.64Indonesia 22.25 –10.66 1.15 –12.60 –1.38 0.00 –0.61 –1.85Russia 32.78 –12.39 3.54 –20.47 –1.00 0.00 –0.85 1.62Saudi Arabia 48.33 –12.46 7.19 –43.51 0.00 0.00 –0.62 –1.06Uganda 12.63 –7.42 3.27 0.00 0.00 –5.06 –0.15 3.27United States 12.60 –13.96 4.79 –1.93 –0.11 0.00 –0.31 1.07
Source: World Bank, 2012.
Figure 8.3a Adjusted Net Saving, 1982–2008, world Bank Country Aggregates: high income Countries, South Asia, Middle east and North Africa
national inCome and environmental aCCounting 177
Figure 8.3b Adjusted Net Saving, 1982–2008, world Bank Country Aggregates: east Asia and Pacific, Latin America and Caribbean, Sub-Saharan Africa
Source: World Bank, 2012.Note: ANS = adjusted net saving.
Box 8.2 eNViroNMeNTAL ACCoUNTiNG iN ChiNA
In 2004 China’s State Environmental Protection Agency (SEPA) announced that it would undertake a study to estimate the cost of various types of environmental damage. The initial findings released in 2006 indicated that environmental costs equaled about 3 percent of China’s gross domestic product (GDP). The report was widely criticized because it failed to include numerous categories of environmen-tal damage, such as groundwater contamination. Shortly afterward, Zhu Guangyao, the deputy chief of SEPA, released a separate report that concluded that environmental damage was closer to 10 percent of China’s GDP—a value similar to what many observers were expecting.
In a 2007 report jointly produced by the World Bank and SEPA, the health and nonhealth costs of air and water pollution alone were estimated at 5.8 percent of China’s GDP (World Bank and SEPA, 2007).
The results indicate that much of China’s recent economic growth has been partially offset by in-creased resource depletion and pollution. Recognizing the costs of environmental damage, the Chinese government set targets in 2006 for such variables as energy consumption per unit of GDP, releases of major air pollutants, and total forest cover. China’s investment in pollution control and renewable energy is growing rapidly. However, the Chinese government’s efforts to develop green GDP measures have abated somewhat in recent years, and some of the targets set in 2006 were not met.
In early 2013, pollution levels in Beijing reached record heights: “ . . . popular anger over air quality had reached a level where Communist Party propaganda officials felt that they had to allow the officially sanctioned press to address the growing concerns of ordinary citizens. [At] the 18th Party Congress, a meeting of party elites held in Beijing last November, Hu Jintao, the president and departing party chief, said China must address environmental problems worsened by rapid development. The inclusion of sec-tions in the report on the need for “ecological progress” could be opening the door for greater dialogue
(continued)
178 Part three, ChaPter 8
8.4 the genuIne Progress IndIcator
EDP and ANS adjust traditional national accounting measures to account for natural capital depreciation and environmental damage. But as with gDP, neither of these alternatives purport to measure social welfare. So another approach to greening the national accounts is to think about how to create a measure of social welfare if one were starting from scratch. Perhaps the most ambitious attempt to date to design a replacement to gDP is the genuine progress indicator (GPI).k
one critique of gDP is that it includes all economic activity as a positive contribution to welfare. for example, all expenditures by the U.S. government Superfund for cleaning up toxic waste sites are contributions to gDP. The medi-cal costs of treating diseases caused by air or water pollution are similarly added to gDP. If coastal homeowners or businesses whose property is damaged by an oil spill sue for damages, the legal expenditures involved as well as the cleanup costs also contribute to gDP. By this logic, the more pollution damage and result-ing cleanup expense a country makes, the better off it is. Clearly this is irrational. Thus the gPI differentiates
between economic activity that diminishes both natural and social capital and activity that enhances such capital. [The gPI is] designed to measure sustainable economic welfare rather than economic activity alone. In particular, if gPI is stable or increasing in a given year the implication is that stocks of natural and social capital on which all goods and services flows depend will be at least as great for the next generation while if gPI is falling it implies that the economic system is eroding those stocks and limiting the next generation’s prospects.8
Like the previous measures discussed in this chapter, the gPI is measured in monetary units. The starting point of the gPI is personal consumption, based on the rationale that it is consumption that directly contributes to current welfare.
In the United States, about 70 percent of gDP consists of personal consumption (the remainder is government consumption, investment, and net exports). The gPI then adds to personal consumption several goods and services that are considered to increase social welfare, some of which are not counted in gDP. The next step in
BOx 8.2 (continued)
on such issues under the watch of xi Jinping, the new party chief, and his colleagues on the Politburo Standing Committee” (“China Lets Media Report on Air Pollution Crisis,” New York Times, January 14, 2013).
Past policies and decisions have been made in the absence of concrete knowledge of the environmental impacts and costs. [New], quantitative information based on Chinese research under Chinese condi-tions [can] reduce this information gap. At the same time . . . substantially more information is needed in order to understand the health and non-health consequences of pollution, particularly in the water sector. (World Bank and SEPA, 2007, p. xix)
kAn earlier version of the gPI was called the Index of Sustainable Economic Welfare (ISEW).
genuine progress indicator (GPi)a national accounting measure that includes the monetary value of goods and services that contribute to well-being, such as volunteer work and higher education, and deducts impacts that detract from well-being, such as the loss of leisure time, pollution, and commuting.
national inCome and environmental aCCounting 179
calculating gPI is to deduct factors that are considered to decrease social welfare. Some of these deductions account for defensive expenditures—these are expenses associated with cleaning up pollution or attempting to repair or compensate for other environmental or social damage. In standard accounting, all such expendi-tures simply add to gDP.
The various steps in calculating the gPI are:l
• Weighing consumption by income inequality. Personal consumption is adjusted to reflect the degree of income inequality in a society.
• Addinthevalueofhouseholdlaborandparenting. gDP includes only paid household and parenting work, such as house-cleaning and day-care services. The gPI estimates the market value of unpaid household labor and parenting.
• Addinthevalueofhighereducation. This component of the gPI reflects the external benefit society receives from well-educated citizens—a positive externality estimated at $16,000 annually for each educated individual.
• Addinthevalueofvolunteerwork. gDP excludes the value of volunteer work, even though society clearly derives benefits from these services. The value of volunteer work hours is estimated using a market wage rate.
• Addintheservicevalueofconsumerdurables. This category is meant to capture the annual benefits consumers obtain from long-lasting goods such as motor vehicles, appliances, and furniture.
• Addintheservicevaluefromhighwaysandstreets. The gPI excludes most government spending, such as military expenditures, because it considers them responses to various threats to living standards rather than enhance-ments to consumer welfare. However, the ability to use public highways and streets is assumed to provide consumers with direct benefits.
• Subtractthecostofcrime. As crime detracts from social welfare, the gPI counts costs associated with crime as a deduction—unlike gDP, which would count these costs as positive additions. The cost of crime includes the costs of prisons and defensive expenditures such as buying locks and alarms.
• Subtractthelossofleisuretime. gDP may increase simply because people work longer hours. However, the associated loss of leisure time is not consid-ered in gDP. Based on estimates of total working hours, the gPI calculates the reduction of leisure time since 1969.
• Subtract thecostofunderemployment. Underemployed people includes those who have become discouraged and given up looking for a job, people working part-time who would prefer a full-time job, and people who are willing but unable to work because of circumstances such as an inability to afford child care.
• Subtractthecostofconsumerdurables. As discussed above, the gPI counts the annual service value of consumer durables. To avoid double counting, the annual expenditures on durable goods are subtracted.
• Subtractthecostofcommutingandautoaccidents. While gDP counts the costs of commuting as positive contributions, the gPI considers commuting
lThese steps describe the calculation of the gPI for the United States. The gPI has been estimated for other countries, and for some U.S. states, using similar methods and data.
180 Part three, ChaPter 8
costs and lost time as deductions, as well as deaths and injuries from auto accidents.
• Subtractthecostofhouseholdenvironmentaldefensiveexpenditures. The cost of such products as air filters and water purifications systems do not increase welfare but simply serve to compensate for existing pollution.
• Subtractthecostsofpollution(air,water,andnoise).Relying on studies using the valuation methodologies discussed in Chapter 6, the gPI estimates the economic damage from each type of pollution.
• Subtractthevalueoflostwetlands,farmlands,andforests. The gPI sub-tracts for losses of natural capital including reductions in ecosystem services, lost recreation opportunities, and declining nonuse values.
• Subtractthecostsofdepletingnonrenewableenergysources.While gDP counts the market value of extracted nonrenewable energy sources as posi-tive contributions, it fails to consider that a diminishing stock of resources imposes a cost on future generations. The gPI attempts to estimate this implied cost.
• Subtractthedamagesfromcarbondioxideemissionsandozonedeple-tion. As we discuss in Chapter 18, numerous economists have attempted to estimate the damage associated with carbon emissions. The gPI multiples an estimate of the marginal damage from a ton of Co2 by the cumulative tons emitted. Even though production of CfCs in the United States has been virtually phased out as a result of the 1987 Montreal Protocol (see Chapter 16), ozone damage continues as a result of past emissions.
• Adjustfornetcapitalinvestmentandforeignborrowing. Net investment (gross investment minus depreciation) is assumed to increase social welfare, while net depreciation or foreign borrowing is assumed to decrease social welfare.
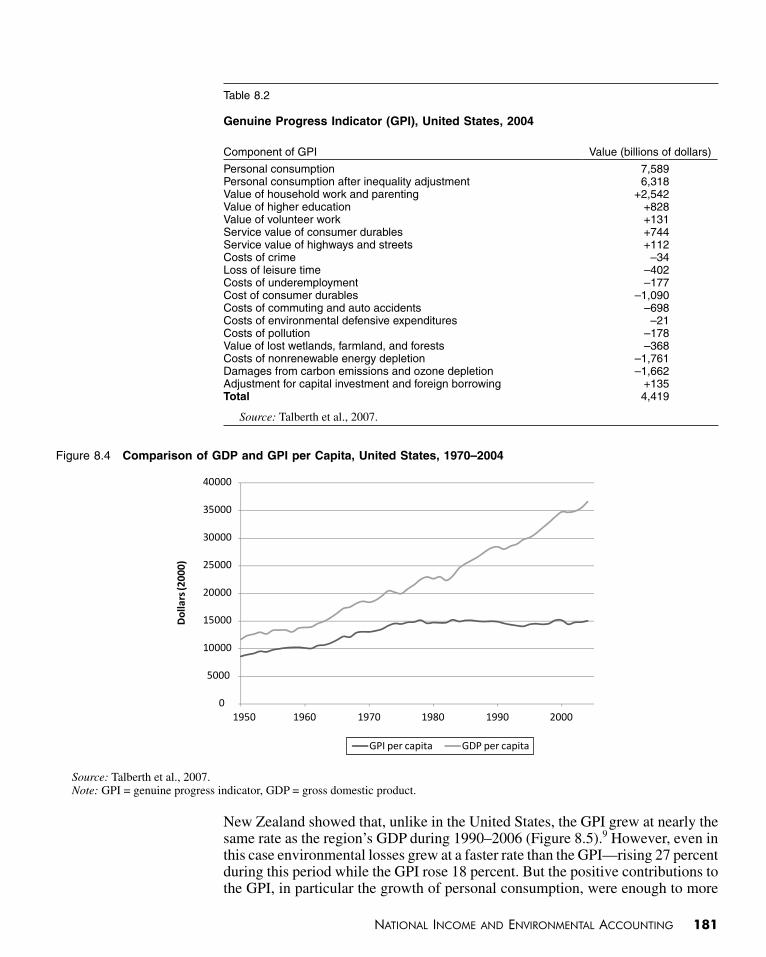
As we might expect with all these adjustments, the gPI differs significantly from gDP in magnitude and trends. The detailed results for U.S. gPI in 2004 are listed in Table 8.2. The largest positive adjustments to inequality-adjusted personal consumption are the value of household work and parenting and the benefits of higher education. But the additions are more than offset by the various deduc-tions, most important are the deductions for nonrenewable energy depletion and carbon emissions. Thus the gPI is significantly less than personal consumption, with the implication that the various adjustments result in an overall reduction in social welfare.
Comparing the relative trends in gDP and the gPI, we see in figure 8.4 that gDP per capita steadily increase from 1950 to 2004. While the gPI grew along with gDP until about the mid-1970s, since that time the gPI has remained rela-tively constant. This implies that the gains in economic production have been ap-proximately offset by negative factors such as the loss of leisure time, pollution, and the depletion of natural capital. Relying on the gPI, instead of gDP, would obviously present significantly different policy recommendations, focusing more on reducing environmental damages, preserving natural capital, and developing renewable energy resources.
gPI estimates have been developed for countries other than the United States, including germany, Australia, China, and India. The gPI has also been applied at the subnational level. for example, a 2009 analysis of the Auckland region in
net investment and disinvestmentthe process of adding to, or subtracting from, productive capital over time, calculated by subtracting depreciation from gross, or total, investment.
national inCome and environmental aCCounting 181
Table 8.2
Genuine Progress indicator (GPi), United States, 2004
Component of GPI Value (billions of dollars)
Personal consumption 7,589Personal consumption after inequality adjustment 6,318Value of household work and parenting +2,542Value of higher education +828Value of volunteer work +131Service value of consumer durables +744Service value of highways and streets +112Costs of crime –34Loss of leisure time –402Costs of underemployment –177Cost of consumer durables –1,090Costs of commuting and auto accidents –698Costs of environmental defensive expenditures –21Costs of pollution –178Value of lost wetlands, farmland, and forests –368Costs of nonrenewable energy depletion –1,761Damages from carbon emissions and ozone depletion –1,662Adjustment for capital investment and foreign borrowing +135Total 4,419
Source: Talberth et al., 2007.
Figure 8.4 Comparison of GDP and GPi per Capita, United States, 1970–2004
Source: Talberth et al., 2007.Note: gPI = genuine progress indicator, gDP = gross domestic product.
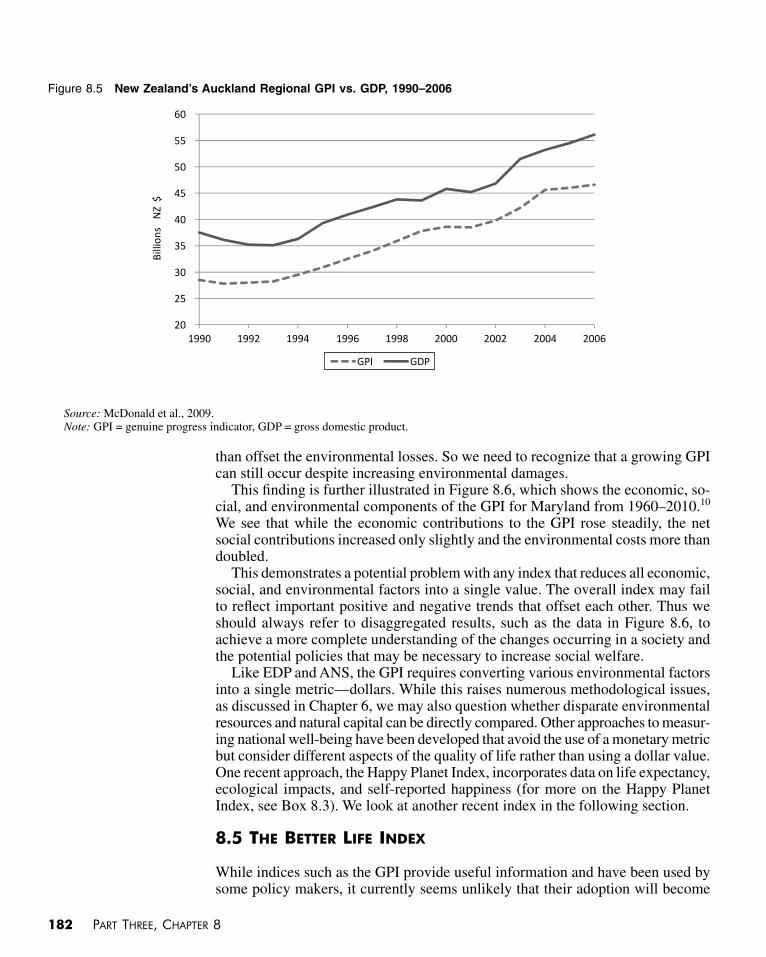
New Zealand showed that, unlike in the United States, the gPI grew at nearly the same rate as the region’s gDP during 1990–2006 (figure 8.5).9 However, even in this case environmental losses grew at a faster rate than the gPI—rising 27 percent during this period while the gPI rose 18 percent. But the positive contributions to the gPI, in particular the growth of personal consumption, were enough to more
182 Part three, ChaPter 8
than offset the environmental losses. So we need to recognize that a growing gPI can still occur despite increasing environmental damages.
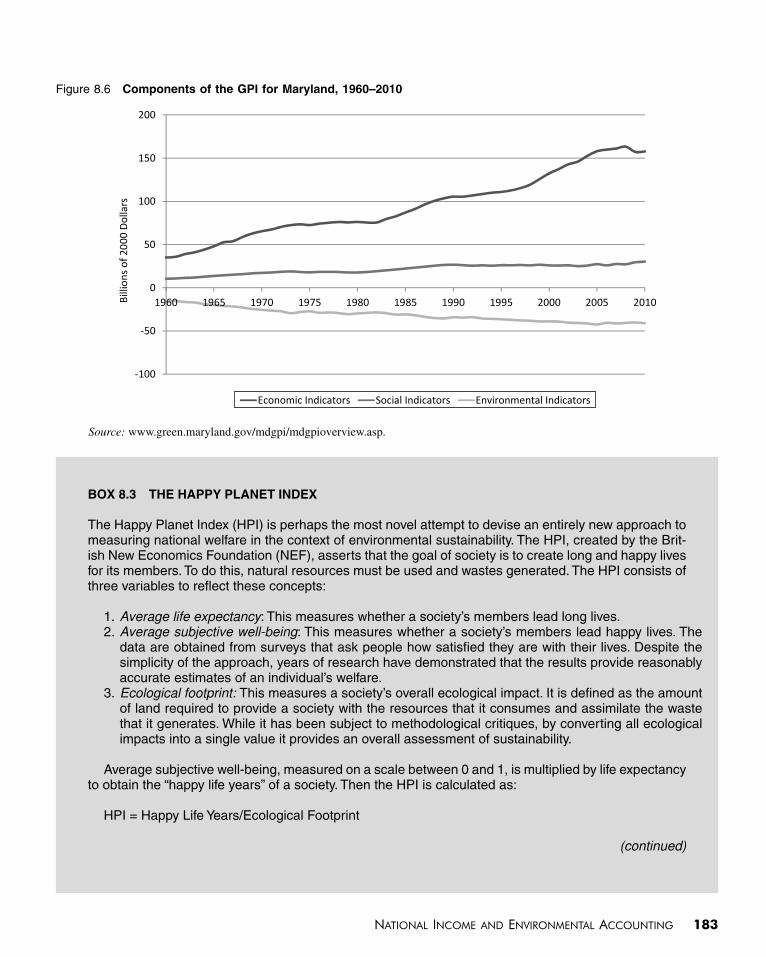
This finding is further illustrated in figure 8.6, which shows the economic, so-cial, and environmental components of the gPI for Maryland from 1960–2010.10 We see that while the economic contributions to the gPI rose steadily, the net social contributions increased only slightly and the environmental costs more than doubled.
This demonstrates a potential problem with any index that reduces all economic, social, and environmental factors into a single value. The overall index may fail to reflect important positive and negative trends that offset each other. Thus we should always refer to disaggregated results, such as the data in figure 8.6, to achieve a more complete understanding of the changes occurring in a society and the potential policies that may be necessary to increase social welfare.
Like EDP and ANS, the gPI requires converting various environmental factors into a single metric—dollars. While this raises numerous methodological issues, as discussed in Chapter 6, we may also question whether disparate environmental resources and natural capital can be directly compared. other approaches to measur-ing national well-being have been developed that avoid the use of a monetary metric but consider different aspects of the quality of life rather than using a dollar value. one recent approach, the Happy Planet Index, incorporates data on life expectancy, ecological impacts, and self-reported happiness (for more on the Happy Planet Index, see Box 8.3). We look at another recent index in the following section.
8.5 the better lIfe Index
While indices such as the gPI provide useful information and have been used by some policy makers, it currently seems unlikely that their adoption will become
Figure 8.5 New Zealand’s Auckland regional GPi vs. GDP, 1990–2006
Source: McDonald et al., 2009.Note: gPI = genuine progress indicator, gDP = gross domestic product.
national inCome and environmental aCCounting 183
Figure 8.6 Components of the GPi for Maryland, 1960–2010
Source: www.green.maryland.gov/mdgpi/mdgpioverview.asp.
Box 8.3 The hAPPy PLANeT iNDex
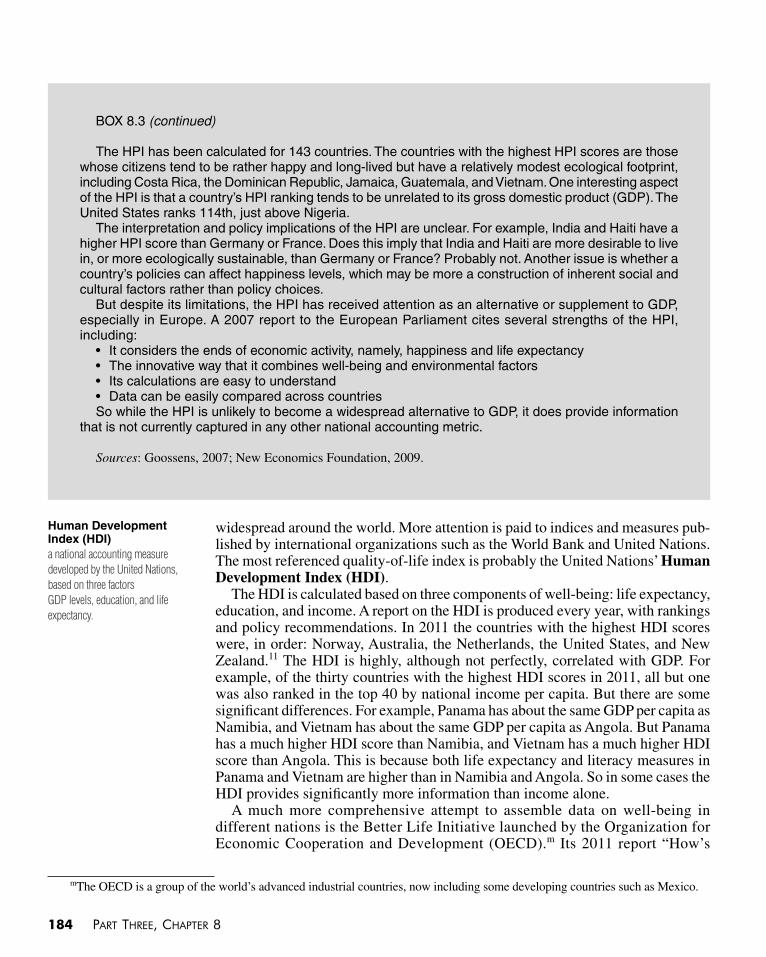
The Happy Planet Index (HPI) is perhaps the most novel attempt to devise an entirely new approach to measuring national welfare in the context of environmental sustainability. The HPI, created by the Brit-ish New Economics Foundation (NEF), asserts that the goal of society is to create long and happy lives for its members. To do this, natural resources must be used and wastes generated. The HPI consists of three variables to reflect these concepts:
1. Average life expectancy: This measures whether a society’s members lead long lives.2. Average subjective well-being: This measures whether a society’s members lead happy lives. The
data are obtained from surveys that ask people how satisfied they are with their lives. Despite the simplicity of the approach, years of research have demonstrated that the results provide reasonably accurate estimates of an individual’s welfare.
3. Ecological footprint: This measures a society’s overall ecological impact. It is defined as the amount of land required to provide a society with the resources that it consumes and assimilate the waste that it generates. While it has been subject to methodological critiques, by converting all ecological impacts into a single value it provides an overall assessment of sustainability.
Average subjective well-being, measured on a scale between 0 and 1, is multiplied by life expectancy to obtain the “happy life years” of a society. Then the HPI is calculated as:
HPI = Happy Life Years/Ecological Footprint
(continued)
184 Part three, ChaPter 8
widespread around the world. More attention is paid to indices and measures pub-lished by international organizations such as the World Bank and United Nations. The most referenced quality-of-life index is probably the United Nations’ Human Development Index (HDI).
The HDI is calculated based on three components of well-being: life expectancy, education, and income. A report on the HDI is produced every year, with rankings and policy recommendations. In 2011 the countries with the highest HDI scores were, in order: Norway, Australia, the Netherlands, the United States, and New Zealand.11 The HDI is highly, although not perfectly, correlated with gDP. for example, of the thirty countries with the highest HDI scores in 2011, all but one was also ranked in the top 40 by national income per capita. But there are some significant differences. for example, Panama has about the same gDP per capita as Namibia, and vietnam has about the same gDP per capita as Angola. But Panama has a much higher HDI score than Namibia, and vietnam has a much higher HDI score than Angola. This is because both life expectancy and literacy measures in Panama and vietnam are higher than in Namibia and Angola. So in some cases the HDI provides significantly more information than income alone.
A much more comprehensive attempt to assemble data on well-being in different nations is the Better Life Initiative launched by the organization for Economic Cooperation and Development (oECD).m Its 2011 report “How’s
BOx 8.3 (continued)
The HPI has been calculated for 143 countries. The countries with the highest HPI scores are those whose citizens tend to be rather happy and long-lived but have a relatively modest ecological footprint, including Costa Rica, the Dominican Republic, Jamaica, Guatemala, and Vietnam. One interesting aspect of the HPI is that a country’s HPI ranking tends to be unrelated to its gross domestic product (GDP). The United States ranks 114th, just above Nigeria.
The interpretation and policy implications of the HPI are unclear. For example, India and Haiti have a higher HPI score than Germany or France. Does this imply that India and Haiti are more desirable to live in, or more ecologically sustainable, than Germany or France? Probably not. Another issue is whether a country’s policies can affect happiness levels, which may be more a construction of inherent social and cultural factors rather than policy choices.
But despite its limitations, the HPI has received attention as an alternative or supplement to GDP, especially in Europe. A 2007 report to the European Parliament cites several strengths of the HPI, including:
• Itconsiderstheendsofeconomicactivity,namely,happinessandlifeexpectancy• Theinnovativewaythatitcombineswell-beingandenvironmentalfactors• Itscalculationsareeasytounderstand• DatacanbeeasilycomparedacrosscountriesSo while the HPI is unlikely to become a widespread alternative to GDP, it does provide information
that is not currently captured in any other national accounting metric.
Sources: goossens, 2007; New Economics foundation, 2009.
mThe oECD is a group of the world’s advanced industrial countries, now including some developing countries such as Mexico.
human Development index (hDi)a national accounting measure developed by the United Nations, based on three factorsGDP levels, education, and life expectancy.
national inCome and environmental aCCounting 185
Life?” describes the construction of the Better Life Index (BLI).12 The re-port recognizes that well-being is a complex function of numerous variables. While material living conditions are important for well-being, so are quality of life and environmental sustainability. further, the distribution of well-being across a society is important. The report argues that we need “better policies for better lives”:
Better policies need to be based on sound evidence and a broad focus: Not only on people’s income and financial conditions, but also on their health, their competen-cies, on the quality of the environment, where they live and work, their overall life satisfaction. Not only on the total amount of the goods and services, but also on equality and the conditions of those at the bottom of the ladder. Not only on the conditions “here and now” but also those in other parts of the world and those that are likely to prevail in the future. In summary, we need to focus on well-being and progress.13
The BLI considers well-being a function of eleven dimensions:
1. Income,Wealth, and Inequality: The two main variables used for this dimension are disposable household income and net financial wealth.n The BLI also considers the degree of inequality in income and wealth.
2.JobsandEarnings: The three main variables comprising this dimension are the unemployment rate, the long-term unemployment rate, and average earnings per employee.
3. HousingConditions: Sufficient housing is important to provide security, privacy, and stability.
4. HealthStatus: The BLI includes life expectancy and a subjective evaluation of one’s overall health status.
5. WorkandLifeBalance: The BLI measures the proportion of employees working long (fifty or more) hours per week, the time available for leisure and personal care, and the employment rate for women with school-age children.
6. EducationandSkills:This is measured as the percentage of the adult (25–64 years old) population that has a secondary (i.e., high school) degree and students’ cognitive skills based on standardized tests.
7.SocialConnections: This dimension is measured by people’s responses to a standardized question asking whether they have friends or relatives that they can count on in times of need.
8.CivicEngagementandGovernance: This dimension is based on data on voter turnout and a composite index that measures citizen input in policy making.
9. EnvironmentalQuality: The main variable used to measure environmental quality is air pollution levels, specifically particulate matter. Secondary en-vironmental variables include an estimate of the degree to which diseases are caused by environmental factors, people’s subjective satisfaction with their local environment, and access to green space.
10. PersonalSecurity:This dimension focuses on threats to one’s safety. It is measured using homicide and assault rates.
nIn addition to the main variables discussed here, most of the dimensions also consider secondary variables. for example, the dimension of income and wealth also includes data on household consumption and subjective evaluation of material well-being.
Better Life index (BLi)an index developed by the OECD to measure national welfare using 11 well-being dimensions.
186 Part three, ChaPter 8
11. SubjectiveWell-Being: This dimension measures people’s overall satisfac-tion with their lives as well as reported negative feelings.
The results for each dimension are standardized across countries, resulting in a score from 0 to 10. While the BLI includes many components, it is de-signed to produce an overall well-being index. But how do we assign weight to the various components? one basic approach is to simply weigh each of the eleven dimensions equally. But it seems likely that some dimensions contribute to well-being more than others. The BLI report makes no specific recommen-dations on weighing the different dimensions. An interesting feature of the BLI is that a Web site allows users to select their own weights for each of the dimensions. The oECD is collecting users’ input and will use this informa-tion to gain a better understanding of the factors that are most important for measuring well-being.
The BLI has been measured for the thirty-four oECD member countries, as well as Brazil and Russia, with plans to expand it to China, India, Indonesia, and South Africa. Even for the oECD members, some results have to be estimated because of a lack of consistent data. Improving the standardization of data collection and reporting is one of the objectives of the Better Life Initiative.
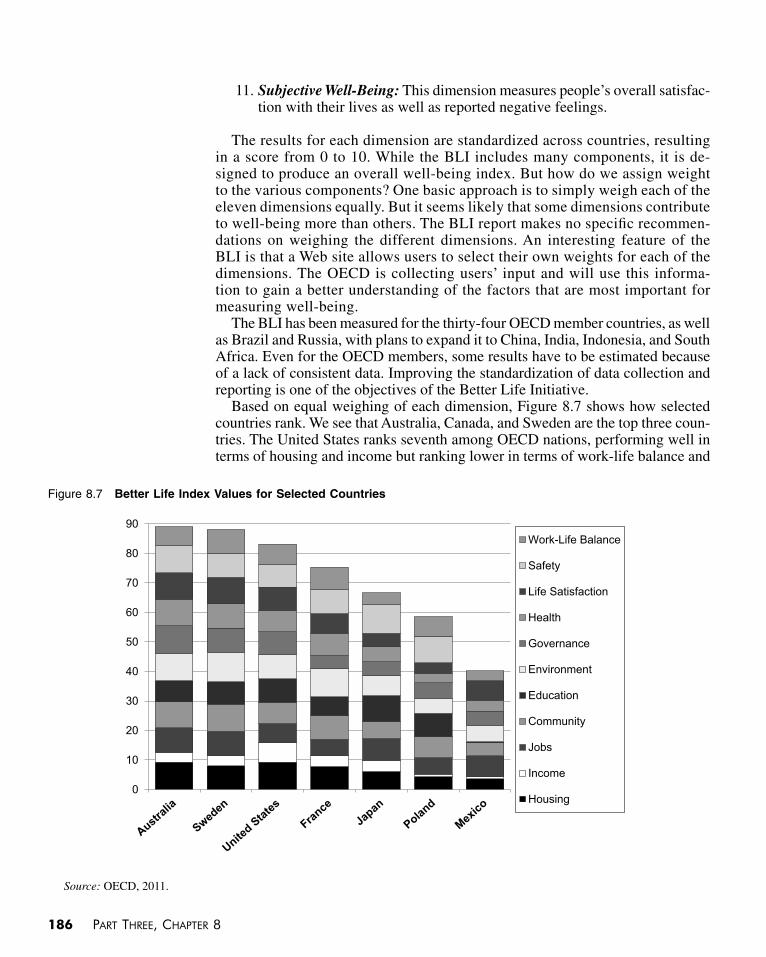
Based on equal weighing of each dimension, figure 8.7 shows how selected countries rank. We see that Australia, Canada, and Sweden are the top three coun-tries. The United States ranks seventh among oECD nations, performing well in terms of housing and income but ranking lower in terms of work-life balance and
Figure 8.7 Better Life index Values for Selected Countries
Source: oECD, 2011.
national inCome and environmental aCCounting 187
health. Realize that the equal weighing of each dimension reduces the importance of income levels relative to most other national accounting approaches, such as the gPI and EDP. As far as environmental rankings, the lowest pollution is found in Sweden and the United Kingdom, and the highest pollution, among the countries evaluated, in Chile, Turkey, and greece.
The BLI thus provides a comprehensive view of the many factors that influence well-being. Income is not presented as the starting point but as one component of many. BLI indicators can be used to design policies that improve well-being. one of the criteria used to choose the BLI variables is policy relevance. Several of the dimensions, such as education, housing, and environmental quality, can be directly improved with effective policies, although the linkage between other dimensions (such as subjective well-being) and policies needs further study. While the main focus of BLI is not on environmental and natural resource is-sues, its measures of environmental quality could be expanded or given greater weight in future.
BLI calculations also indicate data collection needs in various countries. The de-velopment of a consistent statistical agenda would improve the validity of the results across oECD countries and provide a basis for extending the results to other countries. At least one country, Bhutan, has created its own measure, gross national happiness (GNH), which measures some of the same dimensions as BLI (see Box 8.4).
Box 8.4 BhUTAN’S GroSS NATioNAL hAPPiNeSS
Perhaps no country has advocated the need to devise alternatives to the gross national product (GNP) as much as the small Himalayan country of Bhutan. In 1972, King H.M. Jigme Singye Wangchuck introduced the concept of gross national happiness (GNh) to provide an alternative development philosophy to simply maximizing economic growth. He sought to achieve progress toward GNH by focusing on four policy objectives: equitable economic development, environmental preservation, cultural resilience, and good governance (Braun, 2009).
While initially it was just a guiding concept, in recent years the Centre for Bhutan Studies (CBS) has sought to operationalize GNH (CBS, 2011). The Centre has defined GNH as encompassing nine domains:
• Psychologicalwell-being• Standardofliving• Goodgovernance• Health• Education• Communityvitality• Culturaldiversityandresilience• Timeuse• Ecologicaldiversityandresilience
In 2010 the Centre conducted an extensive survey of over 7,000 Bhutanese households to assess the country’s GNH. Each domain was addressed by asking several questions. For example, for the ecological
(continued)
gross national happiness (GNh)the concept, originating in Bhutan, where a society and its policies should seek to improve the welfare of its citizens, as opposed to maximizing GDP.
188 Part three, ChaPter 8
8.6 envIronmental asset accounts
An important issue to consider when evaluating any “green” national accounting approach is how its results can be used to assess the environmental sustainability of a society. As discussed in Chapter 7, we can define different levels of sustain-ability, which we identified as “weak” and “strong” sustainability. (Recall that these terms refer to different definitions, and do not imply that one is preferable to the other.) How well do the indicators introduced so far in this chapter reflect sustainability?
Any index that monetizes various environmental factors and combines the results with traditional monetary aggregates, such as gDP, implicitly assumes a degree of substitutability among natural capital and economic production. for example, the gPI could remain constant if an increase in pollution damage is offset by an increase in personal consumption. Thus the gPI, along with other aggregate in-dices like EDP and ANS, can be considered appropriate metrics to address weak sustainability but not stronger forms of sustainability.14
If we are interested instead in achieving strong sustainability, we need to concern ourselves with the preservation of natural capital. A further distinction emphasized by some analysts is between “strong sustainability” and “very strong sustainability.” Strong sustainability seeks to maintain the overall level of natural capital but allows the substitutability of different types of natural capital, at least for noncritical resources. very strong sustainability seeks to maintain the levels of various types of natural capital, allowing for substitutability only within each category of natural capital.
The indicators discussed so far in this chapter are not necessarily designed to provide information on stronger forms of sustainability. Still, a few of them do
BOx 8.4 (continued)
domain respondents were asked questions such as how concerned they were about air pollution, water pollution, waste disposal, flooding, and soil erosion. Based on “sufficiency” thresholds set by the CBS, the responses determine whether each household is sufficient in each of the nine domains. The results indicate that 41 percent of Bhutanese households have sufficiency in at least six domains and are thus considered happy. Bhutanese have the most sufficiency in health and then in ecology and psychologi-cal well-being. Sufficiency is greater in urban areas, among the young, and among those with a formal education.
Bhutan, unlike most other countries, appears to not only be implementing an alternative to GDP but also using these results to guide future policies in a democratic manner.
Gross National Happiness seems to promote democracy in that it facilitates the process of citizens voicing their opinions on various dimensions of their lives to the Bhutanese government. The GNH survey and the index that the CBS constructs from it open a channel of communication between the government and society at large. People’s voices on an array of domains reflected in the GNH index are the practical guiding forces for policy making in Bhutan.
Source: Braun, 2009, p. 35.
weak sustainabilitythe view that natural capital depletion is justified as long as it is compensated for with increases in human-made capital; assumes that human-made capital can substitute for most types of natural capital.
strong sustainabilitythe view that natural and human-made capital are generally not substitutable and, therefore, natural capital levels should be maintained.
national inCome and environmental aCCounting 189
provide some insight into strong sustainability objectives. The environmental com-ponents of the gPI, for instance, provide information on natural capital depletion, although not the overall level of natural capital.
An alternative approach is to maintain national accounts that track the levels of different types of natural capital. The SEEA-2003 provides guidance on the maintenance of environmental asset accounts or (natural resource accounts), in both physical and monetary terms. These accounts are based on defining various natural capital categories, such as timber resources, mineral resources, agricultural land, and groundwater. The accounts may have different degrees of aggregation. for example, the account for mineral resources might include a separate account for each mineral or be disaggregated even further based on mineral quality, degree of accessibility, or location. The units would vary for different accounts based on the resource in question. So mineral accounts might be measured in tons, forest accounts in hectares of forest cover or board-feet of timber, groundwater accounts in acre-feet of water, and so on.
The two main strengths of environmental asset accounts in physical units are:
1. They provide a detailed picture of a country’s natural capital levels and trends over time. A particular focus can be on ensuring that levels of critical natural capital are maintained.
2. They provide a means for assessing very strong sustainability. Since each category of natural capital is quantified in a separate account, policy makers can determine whether the levels of each are being maintained.
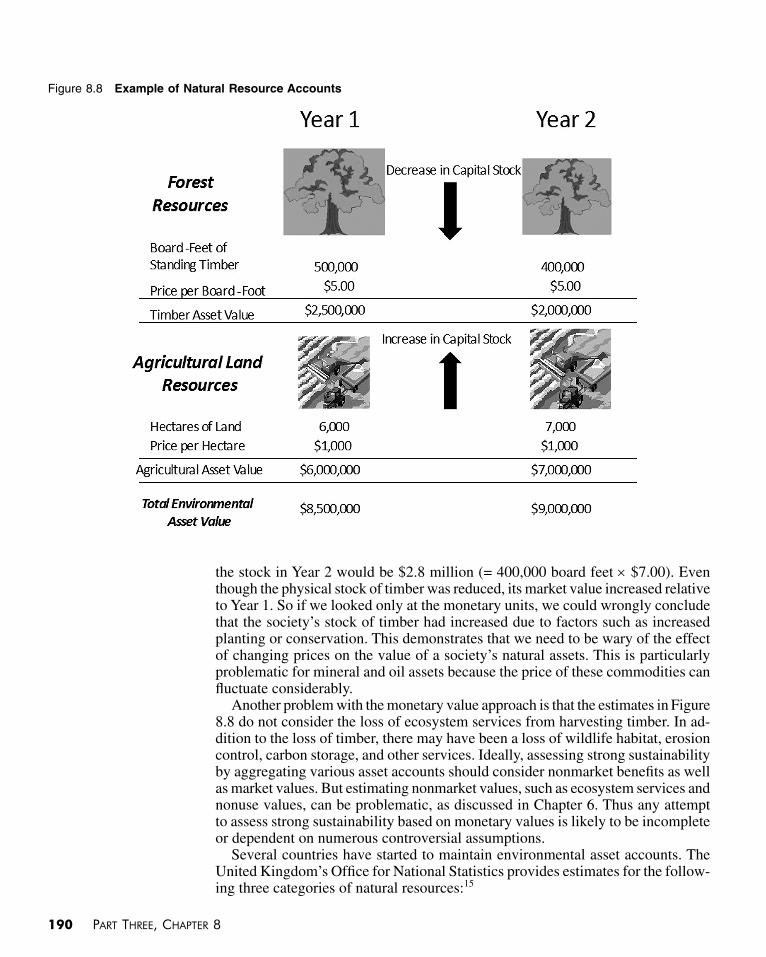
Environmental asset accounts can also be expressed in monetary units. In most cases, this simply involves multiplying a physical unit estimate by the market price per unit. for example, if a society has a standing timber stock of 500,000 board-feet of lumber and the market price is $5.00 per board-foot, then the asset value of their timber is $2.5 million. Environmental asset accounts in monetary terms offer the benefit of comparability, both among different types of natural capital and to traditional economic aggregates such as gDP. Unlike accounts in physi-cal units, environmental asset accounts in monetary units can be used to give an overall measure of sustainability because gains and losses in different categories can be compared.
This is illustrated in figure 8.8. for simplicity, assume there are only two natural resource assets in a society: timber and agricultural land. In Year 1 the society has a stock of 500,000 board-feet of timber and 6,000 hectares of agri-cultural land. At the market prices indicated in figure 8.8, the total value of the environmental assets in the society is $8.5 million in Year 1. In the next year, the society harvests some of its timber stock but brings some additional land into agricultural production, as shown in the figure. If we kept asset accounts only in physical units (i.e., in this example, board-feet of timber and hectares of land), we would not be able to assess whether this society has maintained its overall level of natural capital. But figure 8.8 indicates that the value of its natural assets has actually increased by $500,000, indicating that the overall value of natural capital is being sustained.
Comparing different assets in monetary units has both advantages and disadvan-tages. Suppose that the price of timber increased in Year 2 to $7.00 per board-foot. Even though the stock of timber was reduced by 100,000 board-feet, the value of
environmental asset accounts or (natural resource accounts)national accounts that track the level of natural resources and environmental impacts in specific categories, maintained in either physical or monetary units.
aggregationin reference to environmental asset accounts, the degree to which different types of natural capital are combined.
critical natural capitalelements of natural capital for which there are no good human-made substitutes, such as basic water supplies and breathable air.
190 Part three, ChaPter 8
the stock in Year 2 would be $2.8 million (= 400,000 board feet × $7.00). Even though the physical stock of timber was reduced, its market value increased relative to Year 1. So if we looked only at the monetary units, we could wrongly conclude that the society’s stock of timber had increased due to factors such as increased planting or conservation. This demonstrates that we need to be wary of the effect of changing prices on the value of a society’s natural assets. This is particularly problematic for mineral and oil assets because the price of these commodities can fluctuate considerably.
Another problem with the monetary value approach is that the estimates in figure 8.8 do not consider the loss of ecosystem services from harvesting timber. In ad-dition to the loss of timber, there may have been a loss of wildlife habitat, erosion control, carbon storage, and other services. Ideally, assessing strong sustainability by aggregating various asset accounts should consider nonmarket benefits as well as market values. But estimating nonmarket values, such as ecosystem services and nonuse values, can be problematic, as discussed in Chapter 6. Thus any attempt to assess strong sustainability based on monetary values is likely to be incomplete or dependent on numerous controversial assumptions.
Several countries have started to maintain environmental asset accounts. The United Kingdom’s office for National Statistics provides estimates for the follow-ing three categories of natural resources:15
Figure 8.8 example of Natural resource Accounts
national inCome and environmental aCCounting 191
• Oilandgasreserves—theseaccountsaremaintainedinbothphysicalandmonetary units.
• Forestaccount—thisaccountincludesthetotalareaunderforestcover,aswell as an estimate of the market value of standing timber. The report men-tions other benefits of forests, including recreation and wildlife habitat, but it makes no attempt to quantify these benefits.
• Landaccount—thisaccountmaintainsthetotalareaofnineteencategoriesof habitat including woodlands, grasslands, marsh, open water, and built-up areas. Data over time track changes, with some habitats increasing over time and others decreasing.
other countries that have prepared environmental asset accounts include Australia, Canada, Denmark, and Norway. Perhaps the most extensive system of environmental accounts, measured in physical units, are maintained by Sweden (see Box 8.5).
Compared to the other indicators discussed in this chapter, environmental asset accounts provide a means for assessing “strong” and “very strong” sustainability.
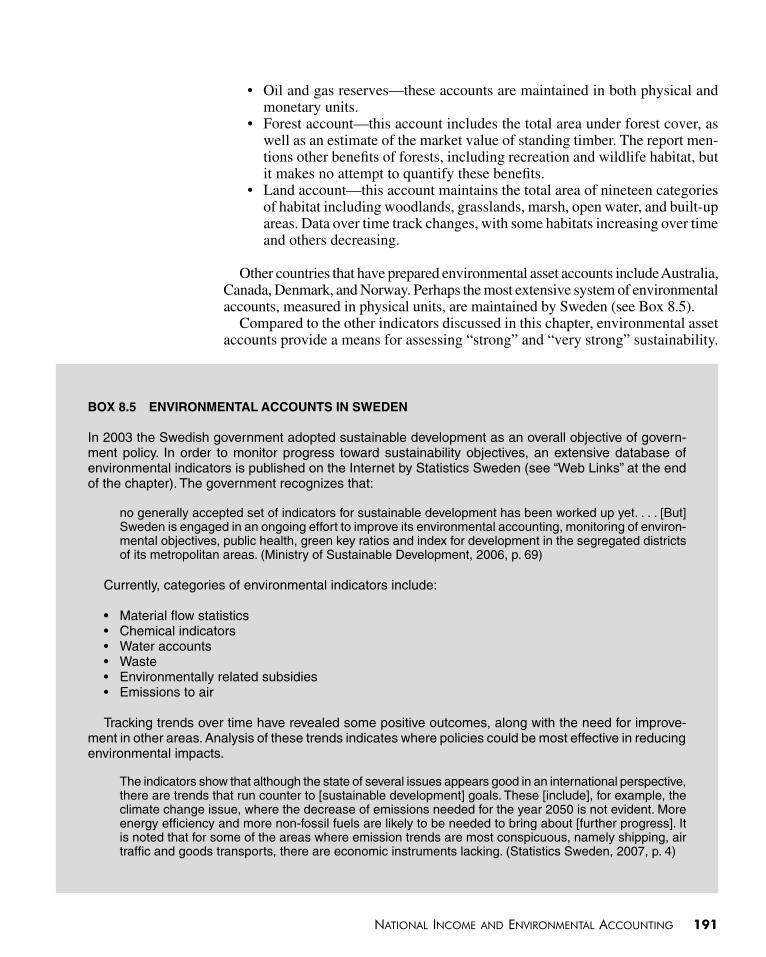
Box 8.5 eNViroNMeNTAL ACCoUNTS iN SweDeN
In 2003 the Swedish government adopted sustainable development as an overall objective of govern-ment policy. In order to monitor progress toward sustainability objectives, an extensive database of environmental indicators is published on the Internet by Statistics Sweden (see “Web Links” at the end of the chapter). The government recognizes that:
no generally accepted set of indicators for sustainable development has been worked up yet. . . . [But] Sweden is engaged in an ongoing effort to improve its environmental accounting, monitoring of environ-mental objectives, public health, green key ratios and index for development in the segregated districts of its metropolitan areas. (Ministry of Sustainable Development, 2006, p. 69)
Currently, categories of environmental indicators include:
• Materialflowstatistics• Chemicalindicators• Wateraccounts• Waste• Environmentallyrelatedsubsidies• Emissionstoair
Tracking trends over time have revealed some positive outcomes, along with the need for improve-ment in other areas. Analysis of these trends indicates where policies could be most effective in reducing environmental impacts.
The indicators show that although the state of several issues appears good in an international perspective, there are trends that run counter to [sustainable development] goals. These [include], for example, the climate change issue, where the decrease of emissions needed for the year 2050 is not evident. More energy efficiency and more non-fossil fuels are likely to be needed to bring about [further progress]. It is noted that for some of the areas where emission trends are most conspicuous, namely shipping, air traffic and goods transports, there are economic instruments lacking. (Statistics Sweden, 2007, p. 4)
192 Part three, ChaPter 8
If we maintain these accounts solely in physical units, we can assess very strong sustainability. If we convert physical units to monetary values, we can assess strong sustainability, but only to the extent that we can accurately value different types of natural resources and environmental services in monetary terms.
8.7 the future of alternatIve IndIcators
As we have seen in this chapter, numerous proposals have been made to address the deficiencies of traditional national accounting approaches in order to account for the environment or to better reflect social welfare, the ultimate goal of economic analysis. Most of these indicators provide some guidance on sustainability objec-tives as well. However, their implementation has been limited.
The current state of environmental information around the world is, by most accounts, unacceptable. Environmental statistics are scattered among too many organizations. They are not coherent with one another, let alone with other types of statistics. They are incomplete and not consistent over time. This situation greatly restricts national and international capacity to develop and monitor progress toward environmental policy goals.16
While the SEEA-2003 provides guidance on various ways to approach envi-ronmental accounting, it indicates no particular preference for one approach over another. Instead it provides a menu of options from which a given country can choose to implement some but not others. We remain a long way away from a universally accepted approach to environmental accounting that is adopted by the majority of countries.
Recognizing the limitations of gDP and the need to develop indicators that incorporate social and environmental factors, in 2008 french president Nicolas Sarkozy created the Commission on the Measurement of Economic Performance and Social Progress. The commission was chaired by Nobel Prize–winning econo-mist Joseph Stiglitz and the chair adviser was another Nobel laureate economist, Amartya Sen. other members of the commission included numerous prominent economists. The goals of the commission were:
to identify the limits of gDP as an indicator of economic performance and social prog-ress, to consider additional information required for the production of a more relevant picture, to discuss how to present this information in the most appropriate way, and to check the feasibility of measurement tools proposed by the Commission.17
In September 2009 the commission produced a nearly 300-page report. The commission noted that policies promoting economic growth, as measured by gDP, may be unsuccessful in increasing well-being because they fail to account for other factors, such as environmental degradation:
traffic jams may increase gDP as a result of the increased use of gasoline, but obvi-ously not the quality of life. Moreover, if citizens are concerned about the quality of air, and air pollution is increasing, then statistical measures which ignore air pollution will provide an inaccurate estimate of what is happening to citizens’ well-being. or a tendency to measure gradual change may be inadequate to capture risks of abrupt alterations in the environment such as climate change.18
environmental servicesecosystem services such as nutrient cycling, water purification, and soil stabilization; these services benefit humans and support economic production.
national inCome and environmental aCCounting 193
The commission concluded that it is necessary to shift from an emphasis on measuring economic production to measuring well-being. It also distinguished between current well-being and sustainability. Whether current well-being can be sustained depends on the levels of capital (natural, physical, human, and social) passed on to future generations.
The commission hoped that its report would spur additional research on the topic of alternative indicators and encourage countries to investigate which indicators could provide the best information for measuring well-being and sustainability. Several countries have already taken action.19 In the UK, the office of National Sta-tistics was directed to conduct a survey asking people which indicators they thought should be used to measure well-being. In germany a commission on “growth, Prosperity, and Quality of Life” was established. other countries attempting to reform national accounting include Canada, South Korea, Italy, and Australia. In the United States, the “State of the USA Project” has been funded by the National Academy of Sciences to develop a Key National Indicator System that:
will assemble the highest quality quantitative measures and related data, and will be presented on the Web in a simple and straightforward way so that interested people can assess whether progress is being made, where it is being made, by whom and compared to what.20
Perhaps the most comprehensive attempt to date to respond to the commission’s recommendations has been the Better Life Index discussed above. The oECD report on the Better Life Index notes that
The work of the Commission has been critical in giving impetus to our path-finding work on measuring progress and to a range of initiatives around the world aimed at developing better indicators of peoples’ lives.21
The research agenda now appears focused on developing a range of indicators that are most relevant to measuring well-being and sustainability. Some envi-ronmental variables are rather obvious, such as measuring air pollution levels and carbon emissions. But the measurement of a broader range of environmental impacts, such as biodiversity and ecosystem services, requires further research. It also remains to be seen whether each country will rely on its own chosen set of indicators or whether a particular menu of indicators will become universally accepted. Another important objective is to develop consistent methods for mea-suring different variables, such as measuring carbon emissions and administering surveys to collect subjective data.
Improvement of data collection and international agreement on relevant indices may lead to better measures of “green” national income accounts and better ways to measure progress in terms of well-being and sustainability rather than simply marketed economic production. But measuring well-being and sustainability is only a first step toward determining and implementing polices to promote social and environmental progress. The chapters that follow examine the implications of environmental analysis and policy for a range of different areas, including population, agriculture, renewable and nonrenewable resources, pollution control, and climate change, concluding by returning to the overall issue of sustainable development.
194 Part three, ChaPter 8
summary
Standard measures of national income such as gross domestic product (gDP) fail to capture im-portant environmental and social factors. This can result in misleading measurements of national well-being, potentially ignoring important environmental problems. A variety of methods can be used to correct gDP measures or to provide alternatives.
Estimates of natural capital depreciation measure the depletion of natural resources such as oil, timber, minerals, and agricultural soils, in monetary units. figures for these losses are sub-tracted from the standard measures of national income and investment. The results for many de-veloping countries indicate a substantial impact of natural resource depletion and environmental degradation.
for developed countries, expenditures on pollution control and cleanup, as well as the cumulative impacts of long-lived pollutants, are significant factors. It is also possible to estimate the value of environmental services such as water purification, nutrient recycling, flood control, and provision of wildlife habitat. Systematic calculation of such factors can give a measure of social progress that often differs significantly from gDP.
The application of modified national income accounting has wide-ranging policy implications. Countries for which a large proportion of export earnings come from resource exports may be over-estimating their economic progress. Natural resources may be sold below their true costs, leading to a net loss for the country despite an apparent trade surplus.
Social as well as environmental conditions affect calculations of national income. Questions of human development, including educational expenditures and measures of equity, are often inter-related with issues of environmental degradation. Despite the evident importance of these factors, there is no consensus on how to include them in national accounts. An alternative approach is to maintain natural resource accounts, measuring social and environmental indicators separately from gDP. International institutions have moved toward more extensive reporting of such data, creating a basis for more accurate assessments of true national well-being.
key terms and concePts
adjusted net saving (ANS)aggregationBetter Life Index (BLI)critical natural capitaldefensive expendituresenvironmental asset accountsenvironmental servicesenvironmentally adjusted net domestic
product (EDP)genuine progress indicator (gPI)green accountinggross domestic product (gDP)gross National Happiness (gNH)
gross national product (gNP)
Human Development Index (HDI)natural capitalnatural capital depreciationnatural resource accountsnet domestic product (NDP)
net domestic savings (NDS)
net investment and disinvestmentsatellite accountsstrong sustainabilitySystem of Environmental and Economic
Accounts (SEEA)
weak sustainability
national inCome and environmental aCCounting 195
dIscussIon QuestIons
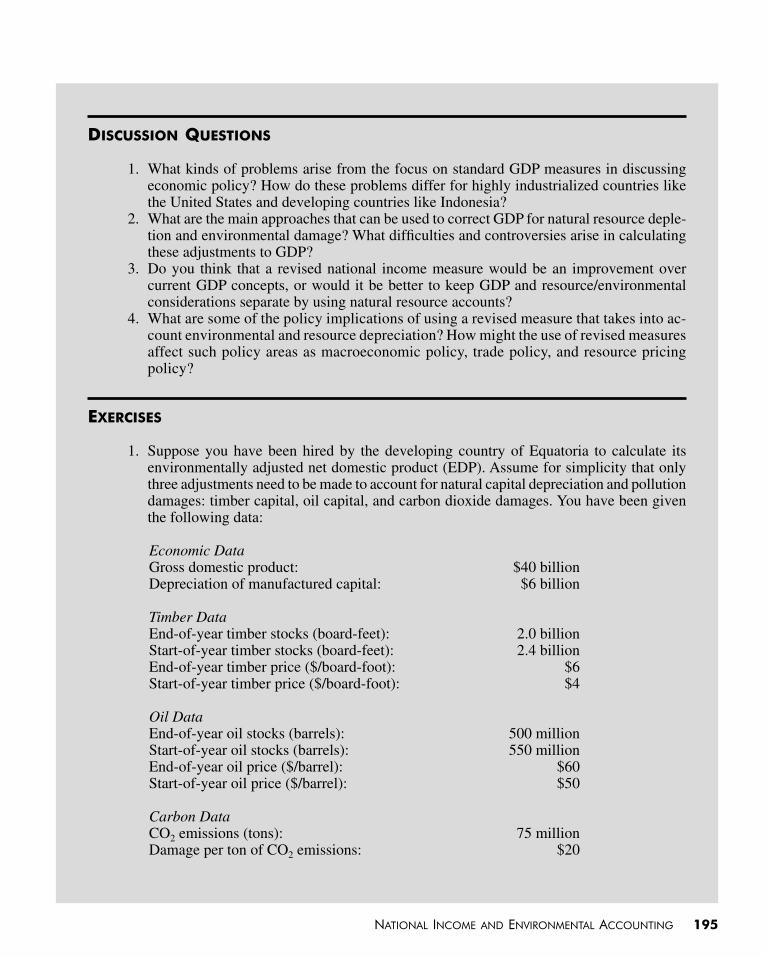
1. What kinds of problems arise from the focus on standard gDP measures in discussing economic policy? How do these problems differ for highly industrialized countries like the United States and developing countries like Indonesia?
2. What are the main approaches that can be used to correct gDP for natural resource deple-tion and environmental damage? What difficulties and controversies arise in calculating these adjustments to gDP?
3. Do you think that a revised national income measure would be an improvement over current gDP concepts, or would it be better to keep gDP and resource/environmental considerations separate by using natural resource accounts?
4. What are some of the policy implications of using a revised measure that takes into ac-count environmental and resource depreciation? How might the use of revised measures affect such policy areas as macroeconomic policy, trade policy, and resource pricing policy?
exercIses
1. Suppose you have been hired by the developing country of Equatoria to calculate its environmentally adjusted net domestic product (EDP). Assume for simplicity that only three adjustments need to be made to account for natural capital depreciation and pollution damages: timber capital, oil capital, and carbon dioxide damages. You have been given the following data:
Economic Datagross domestic product: $40 billionDepreciation of manufactured capital: $6 billion
Timber DataEnd-of-year timber stocks (board-feet): 2.0 billionStart-of-year timber stocks (board-feet): 2.4 billionEnd-of-year timber price ($/board-foot): $6Start-of-year timber price ($/board-foot): $4
Oil DataEnd-of-year oil stocks (barrels): 500 millionStart-of-year oil stocks (barrels): 550 millionEnd-of-year oil price ($/barrel): $60Start-of-year oil price ($/barrel): $50
Carbon DataCo2 emissions (tons): 75 millionDamage per ton of Co2 emissions: $20
196 Part three, ChaPter 8
for timber and oil, you will need to calculate the value of depreciation, or appreciation, as the change in the total market value of the resource during the year, where total market value is the physical quantity times the resource price. What is the EDP for Equatoria? Would you recommend that Equatoria use EDP to measure its progress toward sustain-ability objectives? Why or why not? Would you make any other recommendations to policy makers in Equatoria?
notes
1. for a history of environmental accounting, see Hecht, 2007. 2. European Commission et al., 2012; United Nations et al., 2003. 3. Smith, 2007. 4. Repetto et al., 1989. 5. Skånberg, 2001. 6. gundimeda et al., 2007. 7. Bolt et al., 2002, p. 4. 8. Talberth et al., 2007, pp. 1–2. 9. McDonald et al., 2009. 10. Posner and Costanza, 2011. 11. United Nations, 2011. 12. oECD, 2011. 13. Ibid., p. 3. 14. Dietz and Neumayer, 2006. 15. office for National Statistics, 2011. 16. Smith, 2007, p. 598. 17. Stiglitz et al., 2009. 18. Ibid., p. 8. 19. Press, 2011. 20. www.stateoftheusa.org/about/mission/. 21. oECD, 2011, p. 3.
references
Ackerman, frank, and Elizabeth Stanton. 2011. “The Social Cost of Carbon.” Environmental Forum 28(6) (November/December): 38–41.
Bolt, Katharine, Mampite Matete, and Michael Clemens. 2002. Manual for Calculating Adjusted Net Savings, Environ-ment Department, World Bank.
Braun, Alejandro Adler. 2009. “gross National Happiness in Bhutan: A Living Example of an Alternative Approach to Progress.” Wharton International Research Experience, September 24.
Centre for Bhutan Studies (CBS). 2011. www.grossnationalhappiness.com. Dietz, Simon, and Eric Neumayer. 2006. “Weak and Strong Sustainability in the SEEA: Concepts and Measurement.”
Ecological Economics 61(4): 617–626.El Serafy, Salah.1997. “green Accounting and Economic Policy,” Ecological Economics 21(3): 217–229.El Serafy, Salah. 2013. Macroeconomics and the Environment: Essays on Green Accounting. Cheltenham, UK: Edward
Elgar.European Commission, food and Agriculture organization, International Monetary fund, organization for Economic
Cooperation and Development, United Nations, and World Bank. 2012. System of Environmental-Economic Account-ing: Central Framework.
national inCome and environmental aCCounting 197
goossens, Yanne. 2007. “Alternative Progress Indicators to gross Domestic Product (gDP) as a Means Towards Sustainable De-velopment.” Policy Department, Economic and Scientific Policy, European Parliament, Report IP/A/ENvI/ST/2007–10.
gundimeda, Haripriya, Pavan Sukhdev, Rajiv K. Sinha, and Sanjeev Sanyal. 2007. “Natural Resource Accounting for Indian States—Illustrating the Case of forest Resources.” Ecological Economics 61(4): 635–649.
Harris, Jonathan M., Timothy A. Wise, Kevin P. gallagher, and Neva R. goodwin, eds. 2001. A Survey of Sustainable Development: Social and Economic Dimensions. Washington, DC: Island Press.
Hecht, Joy E. 2007. “National Environmental Accounting: A Practical Introduction.” International Review of Environ-mental and Resource Economics 1(1): 3–66.
McDonald, garry, vicky forgie, Yanjiao Zhang, Robbie Andrew, and Nicola Smith. 2009. A Genuine Progress Indicator for the Auckland Region. Auckland Regional Council and New Zealand Centre for Ecological Economics.
Ministry of Sustainable Development (Sweden). 2006. “Strategic Challenges: A further Elaboration of the Swedish Strategy for Sustainable Development.” government Communication 2005/06:126.
New Economics foundation. 2009. “The (Un)Happy Planet Index 2.0.” www.neweconomics.org.office for National Statistics. 2011. UK Environmental Accounts 2011. Statistical Bulletin, June 29.organization for Economic Cooperation and Development (oECD). 2011. “How’s Life? Measuring Well-Being.” Paris.Posner, Stephen M., and Robert Costanza. 2011. “A Summary of ISEW and gPI Studies at Multiple Scales and New
Estimates for Baltimore City, County, and the State of Maryland.” Ecological Economics 70:1972–1980. www.green.maryland.gov/mdgpi/mdgpioverview.asp.
Press, Eyal. 2011. “The Sarkozy-Stiglitz Commission’s Quest to get Beyond gDP.” The Nation, May 2.Repetto, Robert, et al. 1989. Accounts Overdue: Natural Resource Depreciation in Costa Rica. Washington, DC: World
Resources Institute.Skånberg, Kristian. 2001. “Constructing a Partially Environmentally Adjusted Net Domestic Product for Sweden 1993
and 1997.” National Institute of Economic Research, Stockholm, Sweden.Smith, Robert. 2007. “Development of the SEEA 2003 and Its Implementation.” Ecological Economics 61(4): 592–599.Statistics Sweden. 2007. “Sustainable Development Indicators Based on Environmental Accounts.”Stiglitz, Joseph E., Amartya Sen, and Jean-Paul fitoussi. 2009. Report by the Commission on the Measurement of Eco-
nomic Performance and Social Progress. www.stiglitz-sen-fitoussi.fr/en/index.htm.Talberth, John, Clifford Cobb, and Noah Slattery. 2007. The Genuine Progress Indicator 2006: A Tool for Sustainable
Development. Redefining Progress.United Nations. 2011. Human Development Report 2011. Sustainability and Equity: A Better future for All, United
Nations Development Programme, New York.United Nations, European Commission, International Monetary fund, oECD, and World Bank. 2003. Integrated Envi-
ronmental and Economic Accounting 2003.World Bank. 2012. Adjusted Net Saving website, http://go.worldbank.org/3AWKN2ZoY0. World Bank and State Environmental Protection Agency (World Bank and SEPA), People’s Republic of China. 2007.
“Cost of Pollution in China,” Rural Development, Natural Resources and Environment Management Unit, East Asia and Pacific Region, World Bank, Washington, DC.
web sItes
1. www.beyond-gdp.eu/index.html. The Web site for “Beyond gDP,” an initiative to develop national indicators that incorporate environmental and social concerns. The project is sponsored by the European Union, the Club of Rome, the WWf, and the oECD.
2. http://go.worldbank.org/3AWKN2ZOY0/. The World Bank’s Adjusted Net Saving Web site, which includes detailed data at the country level.
3. www.green.maryland.gov/mdgpi/index.asp. The Web site for the state of Maryland’s calculation of its genuine Progress Indicator.
4. www.oecdbetterlifeindex.org. The Web site for the oECD’s Better Life Index. Note that you can adjust the weights applied to each dimension to create your own version of the BLI.
5. www.mir.scb.se/Eng_Default.htm. The Web site for environmental accounts in Sweden.
198 Part three, ChaPter 8
aPPendIx 8.1: basIc natIonal Income accountIng
In this chapter we have discussed several modifications and alternatives to traditional national income accounting. Standard accounting measures, such as gross national product (GNP) and gross domestic product (GDP), are widely accepted estimates of the health of a national economy. However, these measures have numerous technical and conceptual limitations. Some background knowledge of how they are calculated and interpreted is useful for understanding the arguments for adjusting or replacing these measures. If you have not taken an introductory macroeconomics course or need to re-fresh your knowledge, this appendix will help you work through the concepts presented in the chapter.
National income accounting was first developed in the United States in the 1930s to provide policy makers with information on the overall level of eco-nomic activity in the country. National income accounting was not designed to estimate the welfare of society—only the aggregate level of economic production. Also, at the time the accounts were being designed, environmental degradation was not an important issue.
for many years, the official measure of national economic activity in the United States was the gross national product, defined as the final market value of all new goods and services produced by the citizens of the country over a period of time (typically one year). gNP includes goods and services produced by U.S. citizens and corporations in foreign countries but not goods and ser-vices produced within U.S. borders by foreign citizens and corporations.
In the early 1990s the United States switched to gross domestic product as its official measure to conform with international standards developed by the United Nations. gDP measures the value of goods and services produced within the national boundaries of a country regardless of the producer’s na-tionality. Thus gDP excludes production by U.S. citizens and corporations in foreign countries. In practice, there is normally little quantitative difference between gNP and gDP. In 2011 the values differed only by about 1 percent in the United States.
It is important to note that gNP and gDP measure only the final value of goods and services. Intermediate values are excluded to avoid double counting. for example, consider some of the steps involved in producing this textbook. first, a lumber company harvested wood and sold the wood to a paper mill. Then, the paper mill produced paper and sold it to a printing company. The printing company then printed the text under contract with the publisher. The publisher then sold the book to a retail store for final sale to you. If we add up the prices paid by the paper mill, printing company, publisher, retail store, and you, we end up with a value much higher than the price you paid for the book. The greater the number of intermediate production steps taken to produce an item, the higher the sum of all the prices paid. So all the intermediate steps are not counted, and only the final price you paid is included in gNP.
gross national product (GNP)the total market value of all final goods and services produced by citizens of a particular country in a year, regardless of where such production takes place.
gross domestic product (GDP)the total market value of all final goods and services produced within a national border in a year.
national inCome and environmental aCCounting 199
Since it may be difficult in practice to distinguish intermediate from final goods, the accounting method generally used to compute gNP/gDP is the value-added method, in which the extra value added at each step of the pro-duction process is counted. In the textbook example, the value added for the paper mill is the value of its output minus the cost of inputs purchased from the lumber company. The sum of the values added at all stages of production is equal to the value of the final good.
gNP and gDP only count the production of new goods. If you purchased this book secondhand from a store or other student, then it would not be in-cluded in the national account. The sale of used products does not contribute to current economic production.
Calculating the Value of Gross Domestic Product
As you might imagine, calculating the total value of all goods and services produced in a national economy is not a simple task. Economists use a va-riety of data sources to estimate aggregate production including data from tax returns, surveys of businesses and households, and government records. An estimate of gDP can be obtained in three ways: the product approach, the spending approach, and the income approach. The product approach simply adds up the dollar value of all final goods and services produced in the economy. The spending approach adds up the expenditures of consumers, businesses, governments, and institutions for final goods and services. The income approach adds up the earnings of everyone in the economy, including wages, profits, investment income, and rental income.
In a simplified closed economy with no depreciation or inventories and where all business earnings are paid out as income, all three approaches should produce the same value.o In other words, if an economy produces $7 billion worth of goods and services we can conclude that $7 billion was spent to purchase these goods and services and $7 billion in income was earned to make these purchases. of course, the real economy is more complex and the different approaches may produce different values. for example, not ev-erything produced in a year may be sold during that year. Economists have devised adjustment methods, so the different approaches should produce the same values, but even so there remain statistical discrepancies arising from the complexity of the data or missing information.
The national accounts divide the economy into four sectors: businesses, households and institutions, governments, and the foreign sector. Using the product approach, we add up the final goods and services produced by all businesses, households and institutions, and governments. As you might guess, using the product approach we discover that the business sector produces most of the marketed final goods and service in the economy (75 percent in 2011 for the U.S. economy). Household production, as defined in the national accounts, includes rental values and paid work in households such as maid services, child care, and gardeners. However, similar household work that
oBy a closed economy we mean one without any imports or exports.
value-added methodthe additional value of a good or service from each step in the production process.
product, spending, and income approaches to calculating GDPdifferent approaches for calculating GDP; in theory each approach should produce the same value.
200 Part three, ChaPter 8
is not marketed, such as people cooking their own meals or cleaning their own homes, is not included in gDP. This is one common criticism of gDP. for example, essentially the same service is produced whether members of a household clean their own home or hire someone to do it, but only in the latter case is the value of the service included in gDP.
Using the spending approach, we need to consider the foreign sector in calculating gDP. We add demands by foreigners for goods produced in the United States (exports) and subtract demand by U.S. residents and institutions for foreign goods (imports). Spending by businesses on machinery, buildings, and other goods is called gross investment. governments also purchase goods and services and make investments. Using the spending approach, we find that households and institutions purchase most of the final goods and services produced in the economy (about 71 percent). The spending approach can be summarized by the equation:
Y = C + I + G + (X – M)
where Y represents gDP, C is consumer expenditures, I is business investment, G is government spending on goods and services, and (X–M) is net exports (exports minus imports).
Calculating gDP using the income approach, we only include income re-ceived for production that occurs within the national boundaries. The income approach includes corporate profits and rental income as well as wages and salaries. Most of the U.S. national income, about 55 percent in 2011, is paid to workers as wages and salaries.
Adjusting for Depreciation, Population Growth, and Inflation
one reason gDP is not the best measure of national income is that a portion of investment in capital equipment, such as factories and machinery, simply replaces worn-out capital. Since capital that wears out or becomes obsolete decreases national wealth, the depreciation of this capital should be counted as a deduction from gDP. gross investment minus depreciation is called net investment. If we deduct capital depreciation from gDP we get a measure called net domestic product (NDP). The depreciation of fixed capital amounts to about 10–15 percent of gDP in the United States.
of course, politicians and economists hope that the economy expands over time and gDP increases. But an increase in gDP does not necessarily indicate greater wealth for a country’s citizens. gDP could increase simply because the country has a higher population. We can account for population growth (or decline) in national accounting by calculating GDP per capita, equal to gDP divided by population. Data on gDP per capita also allows us to compare economic production across different countries. for example, U.S. gDP is
gross investmenttotal investment in produced, or manufactured, capital.
depreciationthe reduction in value of a capital stock over time due to wearing out or exploitation.
net investment and disinvestmentthe process of adding to, or subtracting from, productive capital over time, calculated by subtracting depreciation from gross, or total, investment.
net domestic product (NDP)gross domestic product minus the value of depreciation of produced, or human-made, capital.
GDP per capita GDP divided by population.
national inCome and environmental aCCounting 201
much greater than Swedish gDP, but when we adjust for population size we find that gDP per capita is higher in Sweden than in the United States.
The other factor we need to control for when comparing gDP values across time is inflation. Remember that gDP is based on market prices and it could grow simply because market prices have risen. So when compar-ing gDP data from different years, we need to use constant dollars. for
202 Part three, ChaPter 8
has a higher gDP per capita than the United States, but when we adjust for PPP, gDP per capita is higher in the United States than in Sweden because of the relatively high prices in Sweden.
of course, gDP per capita varies widely by country. In 2011 the World Bank classified 36 countries as “low income,” with a per capita gross national income (gNI, a measure similar to gDP) of less than $1,025 annually. A total of about 800 million people in 2011 lived in countries classified as low income, mainly in Africa. There were 108 middle-income countries—those with a gNI per capita between $1,025 and $12,475. These countries include the majority of the world’s population, about 5 billion people, in countries such as China, India, Brazil, Mexico, Russia, and Indonesia. finally, there were 70 high-income countries with a per capita gNI above $12,475. These countries, including the United States, Japan, Australia, and those in Western Europe, had a total population of about a billion people in 2011.
National income accounting data illustrate the varying economic condi-tions of people in different countries. We can use the data to compare rates of economic development and to determine income inequality between countries. But we need to be careful about interpreting national accounting data. gDP measures only the aggregate level of economic production; it does not mea-sure social welfare. If gDP per capita rises only because people are working longer hours, we cannot conclude that they are happier. Also, gDP per capita could increase only because the wealthy members of society are becoming wealthier. gDP data tell us nothing about the level of economic inequality in a country. This and other known problems with gDP make it important to be aware of its limits as a measure of well-being—even before we consider the environmental and resource issues discussed in this chapter.
key terms and concePts for aPPendIx 8.1
constant dollarsdepreciationgross domestic product (gDP)gross domestic product (gDP)
per capitagross investmentgross national product (gNP)
product, spending, and income approach-es to calculating gDP
net investmentnet domestic product (NDP)purchasing power parity (PPP)real gDPvalue-added method