Embed Size (px)
Citation preview

1 Time and Money: Using Federal Data to Measure the Value of Performing Arts Activities
National Endowment for the Arts
NEA Research Note #102
April 2011
Time and Money: Using Federal Data to Measure the Value of Performing Arts Activities
Abstract
This Note examines large datasets from
multiple federal sources including the U.S.
Economic Census, the Bureau of Economic
Analysis (BEA), and the Bureau of Labor
Statistics (BLS), to arrive at monetary and
non-monetary value measurements of the
nation’s performing arts sector. The first
section reports the total number, staff, and
budget size of performing arts organizations.
The second part addresses U.S. consumer
spending on performing arts admissions and
other cultural events.
Part Three takes a different approach. It
represents the NEA’s first-ever analysis of
Americans’ daily time spent doing arts and
cultural activities, including performing arts
attendance. This section relies on previously
unpublished data from the BLS’ American
Time Use Survey. The Note concludes by
reviewing several possible measures of arts
and cultural value that extend beyond mining
federal databases.
1. The U.S. performing arts industry is
supported by nearly 8,840
organizations with a total of 127,648
paid workers. These organizations
generate nearly $13.6 billion in
annual revenues, according to the
most recent estimates.
Key Findings

2 Time and Money: Using Federal Data to Measure the Value of Performing Arts Activities
The not-for-profit sector alone
accounted for 45 percent of these
organizations (about 4,000) and 58
percent of their paid workers. Total
annual revenue and expenses of
not-for-profit performing arts
groups were $5.6 billion and $5.2
billion, respectively.
“Theater and opera” companies
accounted for just over half of the
total revenue and total expenses of
all not-for-profit performing arts
groups. They also provided over
half (38,130) of this sector’s paid
employees.
Contributed income, including
individual donations, made up 41
percent ($2.3 billion) of the total
revenue of not-for-profit
performing arts groups.
Admission fees made up 35
percent ($2 billion) of total
revenue.
These estimates draw on results
from the 2007 Economic Census,
which enumerates establishments
with payrolls.1 An alternative data
source, one not restricted to
establishments with paid workers,
yields a count of nearly 7,000 not-
for-profit performing arts groups
with annual budgets of $75,000 or
greater. These organizations
generated $8.9 billion in annual
revenue and $8.2 billion in
expenses.
(Sources: U.S. Census Bureau’s
Economic Census for 2007; U.S.
Internal Revenue Service Form
990 filings for 2007, via the Urban
Institute’s National Center for
Charitable Statistics)

3 Time and Money: Using Federal Data to Measure the Value of Performing Arts Activities
2. Americans recently spent an annual
total of $14.5 billion on performing
arts admissions.
In comparison, Americans recently
spent $20.7 billion on sports
admissions and $10.4 billion on
movie box-office tickets.
The average U.S. household spent
$139 annually on arts and crafts, a
category that includes toys and
(non-video) games. This amount
was roughly comparable to that
spent on sports and exercise
equipment ($130).
(Sources: U.S. Department of
Commerce’s Bureau of Economic
Analysis, National Income and
Product Accounts data for 2009;
U.S. Department of Labor’s
Bureau of Labor Statistics,
Consumer Expenditure Survey for
2009)
3. On any given day, 1.5 million
Americans attend arts
performances, usually with family
or friends.
In common with sports-goers,
performing arts attendees are more
likely than museum- or movie-
goers to bring a friend along.
Most museum-goers spend 2.4
hours on this particular activity.
Visits peak during lunch hour.
2.6 million Americans do arts and
crafts activities on any given day.
Thirty percent do these activities
with other family members—and
19 percent, with children.
On an average day, more than
500,000 people write for personal
interest, generally for 1.5 hours.
(Source: U.S. Department of
Labor’s Bureau of Labor
Statistics, American Time Use
Survey annual averages for 2003-
2009 and 2005-2009)

4 Time and Money: Using Federal Data to Measure the Value of Performing Arts Activities
Part I. Value Expressed by Numbers and Budgets of Performing Arts Organizations
A good place to begin estimating the value of
the performing arts sector is through data
collected by the Economic Census, which the
U.S. Census Bureau conducts every five
years. The most recent census enumerated
8,838 performing arts establishments in
2007.2 These establishments employed
127,659 workers and generated $13.6 billion
in revenue.3
For the performing arts industry, the
Economic Census reports tallies of both for-
profit (taxable) and not-for-profit (tax-
exempt) organizations.
Of the 8,838 performing arts establishments
in 2007, for example, nearly 5,000 were
taxable. The for-profit performing arts
employed roughly 54,000 workers and
generated $8 billion in revenue.4
As the table below shows, most taxable
performing arts organizations are “other
music groups” (such as jazz, rock, and
country bands) and theaters. Together, other
music groups and theaters make up 86
percent of the taxable performing arts.
For-Profit Performing Arts Groups, 2007
Performing arts companies 4,899Theaters 1,205Dinner theaters 166Opera companies 10Dance companies 118Symphony orchestras 46
and chamber groupsOther music groups 3,007Other performing arts companies 347
Source: Economic Census, U.S. Census Bureau, U.S. Department of Commerce
Theaters, combined with dinner theaters and
opera companies, employ the majority of
workers in the for-profit performing arts
industry—more than 31,000 in 2007.5 These
establishments also generated the most
revenue ($3.8 billion). Other music groups,
alternatively, employed fewer than half that
number (just under 14,000), but reported
annual revenues totaling $3.2 billion.

5 Time and Money: Using Federal Data to Measure the Value of Performing Arts Activities
For-Profit Performing Arts Groups, 2007
Revenue ($1,000)
Annual payroll
($1,000)
Number of paid
employeesPerforming arts companies 8,001,509 1,971,822 53,728
Theater companies, dinner theaters, 3,840,676 961,903 31,044and opera companies
Dance companies 64,510 19,230 844Symphony orchestras
and chamber groups 30,945 9,593 464Other music groups 3,165,966 740,541 13,562Other performing arts companies 930,357 250,148 8,278
Source: 2007 Economic Census, U.S. Census Bureau, U.S. Department of Commerce
Nearly all revenue generated by for-profit
performing arts establishments flows from
“operating” sources, mainly admissions and
contract fees. Musical theater and opera
accounted for the largest share of ticket sales
(51 percent), while popular music concerts
(e.g., jazz, rock, country) commanded the
largest percentage of contract fees (68
percent).
7.8%
50.8%19.3%
1.0%
21.0%
For-Profit Performing Arts Companies: Share of Admissions by Source, 2007
Non-musical theater
Musical theater and opera
Symphony and classical music concerts
Popular music concerts
Dance performances
Other performing arts
Musical theaterand operaPopular music
concerts
Other performing arts1
1 Includes circuses, magic shows, and ice -skating performances.Source: 2007 Economic Census, U.S. Census Bureau

6 Time and Money: Using Federal Data to Measure the Value of Performing Arts Activities
Not-For-Profit Performing Arts
The 2007 Economic Census counted 3,939
tax-exempt performing arts establishments.
As with the for-profit performing arts, theaters
accounted for the largest share of tax-exempt
companies—52 percent in 2007. With nearly
800 establishments, symphony orchestras and
chamber groups made up 20 percent of the
not-for-profit performing arts industry.
Not-For-Profit Performing Arts Groups, 2007
Performing arts companies 3,939Theaters 2,042Opera companies 154Dance companies 407Symphony orchestras 799
and chamber groupsOther music groups 646Other performing arts companies 45
Source: Economic Census, U.S. Census Bureau, U.S. Department of Commerce
Budgets of Not-For-Profit Performing Arts
Companies
As the chart below shows, the majority of tax-
exempt performing arts groups fall into a
budget category of $100,000 to $249,999.
More than half of all not-for-profit establish-
ments reported budgets ranging from
$100,000 to just under $1 million.6

7 Time and Money: Using Federal Data to Measure the Value of Performing Arts Activities
Tax Forms as an Alternative Data Source
Data obtained from filings of the U.S. Internal Revenue Service Form 990 offer an alternative
measure of the number of tax-exempt performing arts organizations and their budgets.
For the time period examined in this Note, the IRS required tax-exempt organizations with
annual gross receipts of at least $25,000 to file the Form 990 (or Form 990EZ).i The IRS
collects these forms regardless of whether the entity has employees on payroll. Thus, Form 990
filings can and do capture organizations run solely by volunteers.
The U.S. Economic Census, on the other hand, requires census forms only of “business
establishments” with paid employees. This difference between the IRS’ and Economic Census’
data-collection methodologies is largely responsible for varying counts of tax-exempt
organizations.
In an attempt to reconcile the estimates—or, at any rate, to bring them closer together—
researchers often set a budgetary threshold for examining IRS data on not-for-profit
organizations. With the threshold set at $75,000, for example, the Form 990 data show more
than 6,900 tax-exempt performing arts organizations in filing year 2008. Together, they
brought in total revenues of $8.9 billion, and they spent a total of $8.2 billion that year.ii
i In 2010, the filing threshold requirement was increased to tax-exempt entities with at least $50,000 in gross
receipts.
ii The IRS Form 990 estimates reported here were obtained from data provided by the National Center for
Charitable Statistics at the Urban Institute.

8 Time and Money: Using Federal Data to Measure the Value of Performing Arts Activities
1.4%
3.5%
5.5%
11.6%
23.6%
17.7%
15.1%
11.3%
4.6%
2.7%
2.9%
Less than $10,000
$10,000 to $24,999
$25,000 to $49,999
$50,000 to $99,999
$100,000 to $249,999
$250,000 to $499,999
$500,000 to $999,999
$1,000,000 to $2,499,999
$2,500,000 to $4,999,999
$5,000,000 to $9,999,999
$10,000,000 or more
Not-For-Profit Performing Arts Organizations: Percentage of All Organizations by Budget Size, 2007
Source: 2007 Economic Census, U.S. Census Bureau
In total, tax-exempt performing arts groups
garnered revenues of $5.6 billion and spent
$5.2 billion in 2007. The not-for-profit
performing arts industry generated $2 billion
in annual payroll, and employed nearly 74,000
workers.
Theaters and opera companies (combined)
generated $3 billion in revenue, a figure that
amounts to 55 percent of all not-for-profit
performing arts revenue in 2007. Theaters
and opera companies also employed the
largest share of workers—38,000, or 52
percent of all workers in the tax-exempt
performing arts industry.

9 Time and Money: Using Federal Data to Measure the Value of Performing Arts Activities
Not-For-Profit Performing Arts Groups, 2007
Revenue ($1,000)
Expenses ($1,000)
Annual payroll
($1,000)
Number of paid
employees
Performing arts companies $5,572,271 $5,201,187 $2,007,965 73,920Theater and opera companies $3,049,317 $2,879,697 $1,033,333 38,130Dance companies $532,396 $479,473 $196,006 7,770Symphony orchestras $1,715,102 $1,585,481 $695,345 23,848
and chamber groupsOther music groups $237,142 $220,584 $69,996 3,623Other performing arts companies $38,314 $35,952 $13,285 549
Source: 2007 Economic Census, U.S. Census Bureau, U.S. Department of Commerce
34.7%
3.6%7.9%
0.3%
4.0%
20.7%
8.1%
5.6%
2.3%12.7%
Not-For-Profit Performing Arts Companies: Share of Revenue by Source, 2007
Admissions
Contract fees
Other operating receipts
NEA contributions
Other government contributions
Individual contributions
Foundation contributions
Business contributions
Other contributions
Other incomeSource: 2007 EconomicCensus, U.S. Census Bureau
Admissions
Individualcontributions
NEA contributions

10 Time and Money: Using Federal Data to Measure the Value of Performing Arts Activities
Revenue by Source
The Economic Census shows that earned
income, such as admissions, contract fees, and
membership services, accounted for 46
percent of total revenue. Contributed income
(i.e., giving from individuals, businesses,
foundations, and government agencies) make
up 41 percent of all revenues.7
The largest component of earned revenue is
admissions (34.7 percent of all revenue),
while the largest share of contributed income
flows from individuals (20.7 percent of all
revenue).
Government contributions (including grants
from the NEA, other federal agencies, and
state and local government sources) and
“other” contributions, such as those stemming
from guilds or unions, make up the smallest
shares of revenue—4.3 percent and 2.3
percent, respectively.
This section has focused on understanding the
total direct value of the performing arts sector
as represented by organizational counts and
budgets. Measurements of earned and
contributed income in particular can be used
as proxies of the perceived value of this sector
to individuals, businesses, foundations, and
public agencies. In the next two sections of
this Note, we will take direct measurements of
the value of the performing arts to U.S.
consumers.
Part Two: Value Expressed by Consumer Spending on Performing Arts Admissions and Other Cultural Events
The most direct economic measure of the
performing arts’ value to individuals is
provided by examining amounts spent on
tickets to art performances. The U.S.
Department of Commerce’s Bureau of
Economic Analysis (BEA) measures, as part
of its National Income and Product Accounts,
detailed consumer spending on arts and
entertainment admissions and a variety of
recreational items.

11 Time and Money: Using Federal Data to Measure the Value of Performing Arts Activities
In 2009, the most recent year for which
estimates were available, Americans spent
$14.5 billion on tickets to performing arts
events—$4 billion more than they spent on
tickets to movie theaters, but $6 billion less
than spending on sports admissions. U.S.
consumers spent $6 billion on admissions to
museums and libraries.
$5 $10 $15 $20
Museums and libraries
Movie theaters
Performing arts
Sporting events
Billions
Consumer Spending on Admissions, 2009
Source: Bureau of Economic Analysis, U.S. Department of Commerce
The BEA also reports that consumers spent
$3.9 billion on photography equipment, $5.6
billion on musical instruments, and $33.8
billion on books.8 Consumer spending on
video and audio equipment is among the
largest of BEA’s tallies of recreational
spending—$107 billion in 2009.
In addition to the BEA’s estimates of
aggregate consumer spending from the
national accounts, the U.S. Department of
Labor’s Bureau of Labor Statistics (BLS)
reports annual consumer spending through its
Consumer Expenditure Survey. In some
cases, the CES does not provide the detailed

12 Time and Money: Using Federal Data to Measure the Value of Performing Arts Activities
spending categories available from the
national accounts. The CES does, however,
report average household spending. In 2009,
for example, U.S. households spent an
average of $120 on admissions to movies,
theaters, and amusement parks.9 They spent
nearly $51 on tickets to sporting events.
Average Household Spending on Selected Leisure and Entertainment Items, 2009Consumer Expenditure Survey
Average household
spending CV1
All entertainment $2,692.66 $2.38Admissions to movies, theaters, and amusement parks $120.38 $3.88Admissions to sporting events $50.86 $7.92Video game hardware and software $53.32 $10.89Musical instruments $23.30 $18.39Toys, games, and arts and crafts $139.07 $4.77Sports, recreation, and exercise equipment $129.98 $8.17Photographic equipment, supplies, and services $59.08 $8.29
All reading $109.60 $2.64Books2
$47.28 $3.75Newspaper and magazines3 $43.30 $2.97
Source: Bureau of Labor Statistics, U.S. Department of Labor
1 The coefficient of variation (CV) is calculated by dividing the standard deviat ion by the
estimate for average household spending. For example, spending on admissions to movies,
theaters, and amusement parks ranges from $116.50 to $124.26, per the $3.88 CV.2 Excludes purchases of books through book clubs.3 Purchased through subscriptions; non-subscription purchases of
newspapers and magazines totaled $14.97 in 2009.

13 Time and Money: Using Federal Data to Measure the Value of Performing Arts Activities
Part Three: Value Expressed by Time Spent on Performing Arts Attendance and Other Cultural Activities
While spending estimates are reliable
economic indicators of how Americans value
performing arts events, a more
comprehensive understanding of consumer
preferences should draw on non-monetary
measures. Chief among these is the NEA’s
Survey of Public Participation in the Arts
(SPPA), which has been conducted
periodically since 1982. The Arts
Endowment has used the SPPA to report on a
wide variety of arts participation topics,
including the influence of media and
technology, how age affects arts
participation, and the frequency of
“informal” arts participation in urban and
rural areas.10
In addition to the SPPA, a relatively new
federal data source has begun to provide an
alternative view of arts participation.
Sponsored by the Bureau of Labor Statistics,
and launched in 2003, the American Time
Use Survey (ATUS) tracks how individuals
age 15 and older spend their time. Unlike the
SPPA, which covers activities over a 12-
month period, the ATUS captures activities
on an average day.
The ATUS aggregates arts and leisure
activities to a greater extent than the SPPA.
For example, the SPPA can be used to
estimate the number of people who attended
live opera or created photographs in a given
year. However, activities captured by the
ATUS are grouped into larger categories
such as “attend the performing arts” or “did
arts and crafts hobbies.” This is because
participation in many art forms is infrequent
when measured on a daily basis. ATUS must
combine arts and leisure activities in order to
gain reliable estimates.
Although less detailed in the type of activity
reported, the ATUS measures factors related
to arts participation that cannot be glimpsed
through the SPPA. In addition to how much
time Americans spend on the arts, the ATUS
also reveals the time of day that selected arts
activities are most likely to take place,
whether the activities were done alone or
with others, and where those activities
occurred.11

14 Time and Money: Using Federal Data to Measure the Value of Performing Arts Activities
Attendance
The ATUS shows that on any given day 1.5
million people (age 15 and older) attend the
performing arts.12 And, like many of the arts
and leisure activities tracked by the survey,
performing arts attendance is considerably
higher on weekend days or holidays—2.3
million people (almost 1 percent of the
population) go to the performing arts on
weekends and holidays.
Moreover, performing arts attendees typically
spend from 2.6 to 2.8 hours (2 hours and 48
minutes) at live performing arts events.13
On an average day, museums draw more than
500,000 people. And on an average weekend
day or holiday, this figure climbs to 885,000
people. The survey shows that most visitors
spend 2.4 hours (2 hours and 24 minutes) at
museums.
“Other arts and entertainment” is a broad
attendance category that includes poetry
readings, festivals, historic sites, circuses, and
amusement parks.14 These varied activities,
combined, attract 2 million people on any
given day and 2.3 million individuals on an
average weekend day or holiday. Participants
typically spend 2.7 to 2.6 hours attending
“other arts and entertainments.”
What about time spent on other cultural
events? Of a typical day, movie theaters draw
3.4 million moviegoers (5.9 million on
weekends and holidays). Most moviegoers
spend 2.2 hours watching movies at theaters.
On any given day, 2.7 million individuals
attend sporting events; on weekends and
holidays, sporting events typically attract 3.9
million individuals. Attendees generally
spend 2.8 to 3.2 (3 hours and 12 minutes) at
sporting events.

15 Time and Money: Using Federal Data to Measure the Value of Performing Arts Activities
Arts and Crafts and Other Selected Cultural
Activities
In addition to reporting daily time spent on
cultural event attendance, the American Time
Use Survey captures selected types of
personal arts engagement. On an average day,
2.6 million people engage in arts and crafts, a
category that includes not only artistic
painting, sculpting, and photography, but also
creating scrapbooks, holiday costumes and
decorations, and jewelry. Individuals who
engage in arts and crafts typically spend 2.5
hours on these activities.
Approximately 6 million individuals listen to
or play music on any given day. This
category includes playing music (or listening
to someone else playing music), listening to
records or CDs, composing music, tuning a
musical instrument, and singing karaoke or
carols. (It does not include listening to the
radio.) Most people who play or listen to
music do so for about an hour-and-a-half.
On an average day, more than half a million
people write for personal interest, including
stories, lyrics, or diary entries. Most write for
an hour and 30 minutes.
TV-viewing is the most popular leisure
activity. On any given day, approximately
190 million people (80 percent of the
population age 15 and older) watch TV for 3
to 4 hours, on average. By contrast, 25
percent of the population (nearly 60 million
people) read for personal interest.
On a daily basis, about 23 million people use
computers for leisure activities such as surfing
Time Spent Attending Performing Arts and Other EventsAverages for 2005-2009
Total number Share of Average Total number Share of Averageof persons total2 hours of persons total2 hours
(in thousands) (in thousands)Attend:
Performing arts 1,511 0.6% 2.6 2,304 1.0% 2.8Museums 532 0.2% 2.4 885 0.4% 2.4Other arts/entertainment3 2,037 0.9% 2.7 2,326 1.0% 2.6Movies 3,384 1.4% 2.2 5,859 2.5% 2.2Sporting events 2,694 1.1% 2.8 3,915 1.7% 3.2
Source: American Time Use Survey, Bureau of Labor Statistics, U.S. Department of Labor
1 Includes weekdays and weekends.2 Share of U.S. population, 15 years and older.3 Includes poetry readings, festivals, historic sites, circuses, and amusement parks.
On an average day1 On an average weekend or holiday

16 Time and Money: Using Federal Data to Measure the Value of Performing Arts Activities
the Internet, participating in chat rooms, or
downloading music or photographs.15 People
who use computers for leisure usually spend
an hour-and-a-half doing these activities. On
any given day, approximately 40 million
people play sports or exercise, usually for
about 1 hour and 40 minutes (longer on
weekends and holidays).
Time Spent On Selected Leisure ActivitiesAverages for 2005-2009
Total number Share of Average Total number Share of Averageof persons total2 hours of persons total2 hours
(in thousands) (in thousands)
Arts and crafts3 2,606 1.1% 2.5 2,735 1.2% 2.1
Listening to/playing music4 5,605 2.4% 1.4 6,097 2.6% 1.6
Read for personal interest 59,469 25.3% 1.4 59,614 25.5% 1.6Write for personal interest 557 0.2% 1.6 598 0.3% 1.6
Volunteer 16,156 6.9% 2.1 16,458 7.0% 2.4
Watch TV and movies5 189,055 80.3% 3.3 191,075 81.6% 3.9Use computer for leisure6 23,170 9.8% 1.5 22,257 9.5% 1.6
Play sports or exercise 42,001 17.8% 1.7 39,711 17.0% 2.4
Source: American Time Use Survey, Bureau of Labor Statistics, U.S. Department of Labor
1 Includes weekdays and weekends.2 Share of U.S. population, 15 years and older.2 Includes artistic painting, photography, pottery, jewelry-making, sculpture, and creating holiday decorations.3 Includes playing a musical instrument, listening to someone play a musical instrument,
and listening to recordings; the category excludes radio listening.4 Excludes religious television.5 Excludes computer games and e-mails.
On an average day1 On an average weekend or holiday
17 Time and Money: Using Federal Data to Measure the Value of Performing Arts Activities
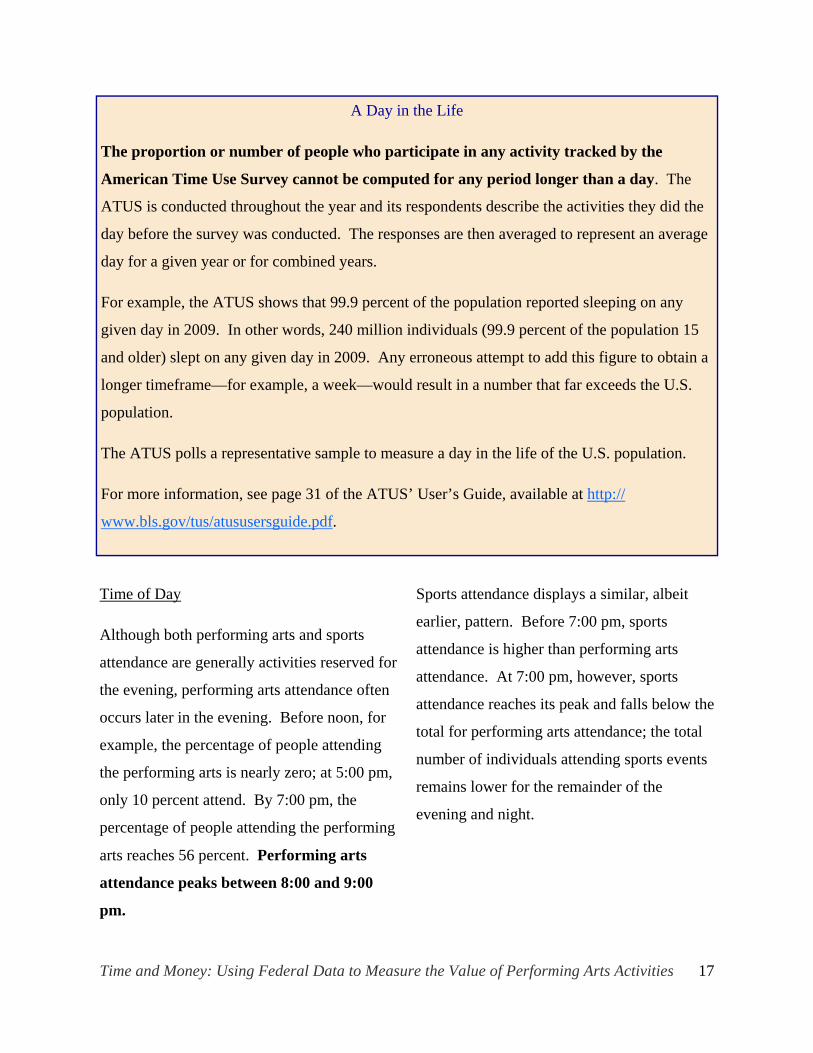
A Day in the Life
The proportion or number of people who participate in any activity tracked by the
American Time Use Survey cannot be computed for any period longer than a day. The
ATUS is conducted throughout the year and its respondents describe the activities they did the
day before the survey was conducted. The responses are then averaged to represent an average
day for a given year or for combined years.
For example, the ATUS shows that 99.9 percent of the population reported sleeping on any
given day in 2009. In other words, 240 million individuals (99.9 percent of the population 15
and older) slept on any given day in 2009. Any erroneous attempt to add this figure to obtain a
longer timeframe—for example, a week—would result in a number that far exceeds the U.S.
population.
The ATUS polls a representative sample to measure a day in the life of the U.S. population.
For more information, see page 31 of the ATUS’ User’s Guide, available at http://
www.bls.gov/tus/atususersguide.pdf.
Time of Day
Although both performing arts and sports
attendance are generally activities reserved for
the evening, performing arts attendance often
occurs later in the evening. Before noon, for
example, the percentage of people attending
the performing arts is nearly zero; at 5:00 pm,
only 10 percent attend. By 7:00 pm, the
percentage of people attending the performing
arts reaches 56 percent. Performing arts
attendance peaks between 8:00 and 9:00
pm.
Sports attendance displays a similar, albeit
earlier, pattern. Before 7:00 pm, sports
attendance is higher than performing arts
attendance. At 7:00 pm, however, sports
attendance reaches its peak and falls below the
total for performing arts attendance; the total
number of individuals attending sports events
remains lower for the remainder of the
evening and night.

18 Time and Money: Using Federal Data to Measure the Value of Performing Arts Activities
Museum attendance, on the other hand, is
decidedly a late-morning and early-afternoon
activity. At 10:00 am, for example, 34
percent of participants are visiting museums.
Museum attendance peaks between noon
and 1:00 pm.
0%
10%
20%
30%
40%
50%
60%
70%
Percentage of People Attending Performing Arts Events, Museums, and Sports, by Time of Day
Performing arts Museums Sports
Source: American Time Use Survey, Averages for 2003-2009, Bureau of Labor Statistics, U.S. Department of Labor

19 Time and Money: Using Federal Data to Measure the Value of Performing Arts Activities
The percentage of people engaging in arts and
crafts hobbies rises throughout the morning
and early afternoon. This activity reaches its
first peak between 2:00 and 3:00 pm, and then
falls throughout the afternoon. A trough in
the percentage of people doing arts and crafts
occurs between 5:00 and 6:00 pm. This
activity rises again through 7:00 pm, but then
drops strongly as the evening wears on.
Reading and writing for personal interest are
more likely to occur in the evening. Both
activities peak between 9:00 and 10:00 pm.
After that time period, the percentage of
individuals reading declines. Writing,
however, displays a distinctive spike at 11:00
pm, suggesting that people who produce
stories, poems, letters, and other personal
writings are the arts’ proverbial night owls.
0%
5%
10%
15%
20%
25%
30%
Percentage of People Doing Arts and Crafts and Reading and Writing for Personal Interest by Time of Day
Arts and crafts Reading for personal interest Writing for personal interest
Source: American Time Use Survey, Averages for 2003-2009, Bureau of Labor Statistics, U.S. Department of Labor

20 Time and Money: Using Federal Data to Measure the Value of Performing Arts Activities
The Social Aspect to Arts and Leisure
The ATUS also tracks information about who
was with respondents when they did their
various daily activities. The survey shows
that individuals attending arts and sporting
events, as well as those visiting museums, are
usually accompanied by spouses, family
members, children, or friends.
As the table below reports, less than 7 percent
of individuals attend the performing arts
alone. Rather, most performing arts
attendees are accompanied by family
members (54 percent) and friends (41
percent). In fact, performing arts and sports
attendees are more likely to attend with
friends than are individuals visiting museums,
or than individuals going to other
entertainments or movie theaters.16
Although performing arts and sports attendees
are similar in that many attend their respective
events with family and friends, performing
arts attendees are more likely than sports-
goers to attend with their spouses—37
percent versus 27 percent.17
Museum-goers and individuals attending other
arts and entertainments are more likely to
attend with family members and children.
Approximately 70 percent of both attendees
are accompanied by family members. Almost
45 percent of museum-goers visit museums
with children; the same is true for other arts
and entertainment attendees—nearly 45
percent are accompanied by children.
Perhaps not surprisingly, most arts and crafts
activities are done alone. Even so, almost 30
percent of arts and crafts hobbyists do these
activities with family members and almost 19
percent create crafts with children. Similarly,
71 percent of reading for personal interest is
done alone. Yet 34 percent read for personal
interest in the presence of family members.
Writing for personal interest and using
computers for leisure are activities largely
done alone.

21 Time and Money: Using Federal Data to Measure the Value of Performing Arts Activities
With certain exceptions, such as sleeping or working, the ATUS collects information on people
accompanying the respondent during his or her activities. The “with whom” categories of the
ATUS are not mutually exclusive. If, for example, a respondent visited a museum with his or
her spouse, the activity is counted not only as visiting with a spouse, but also with a family
member, because spouse is part of the survey definition of family (related through marriage,
blood, or adoption). Similarly, a respondent visiting a museum with his or her child is counted
as visiting with children and with family. There are multiple records in the ATUS for activities
with multiple people present.
Percentage of People Engaged in Arts and Leisure Activities, by Whom They Were With When They Did the ActivityAverages for 2003-2009
Alone With spouse or partner
With family With children
With friends
With co-workers
With roommate
With neighbors or
acquaintancesAttend:
Performing arts 6.5% 37.2% 54.2% 17.6% 40.8% 1.6% 0.7% 1.3%Museums 4.7% 46.3% 71.2% 44.6% 18.8% 0.4% 0.0% 0.2%Other arts/entertainment 8.2% 44.0% 69.5% 45.7% 23.2% 1.3% 0.8% 1.9%Movies 6.7% 34.2% 54.0% 27.2% 31.3% 0.2% 0.5% 0.5%Sporting events 8.5% 26.9% 54.2% 33.7% 33.0% 1.9% 0.1% 2.6%
Arts and crafts 67.0% 15.8% 29.5% 18.7% 5.3% 0.4% 0.1% 0.8%
Read for personal interest 71.1% 28.7% 34.3% 6.6% 0.8% 1.6% 0.3% 0.1%Write for personal interest 88.9% 6.0% 11.2% 6.9% 1.0% 0.0% 0.0% 0.0%
Watch TV and movies 53.3% 42.2% 58.3% 23.1% 4.7% 0.3% 1.0% 0.1%Use computer for leisure 77.1% 11.4% 22.2% 9.3% 2.4% 0.6% 0.3% 0.1%
Play sports or exercise 51.7% 14.8% 27.6% 16.1% 17.4% 2.8% 0.4% 2.1%
Source: American Time Use Survey, Bureau of Labor Statistics, U.S. Department of Labor

22 Time and Money: Using Federal Data to Measure the Value of Performing Arts Activities
Locations
ATUS respondents also report where
activities take place. On any given day, for
example, 85 percent of individuals who
engage in arts and crafts hobbies do so in their
homes. Writing for personal interest also
occurs, for the most part, at home.
Tabulations of the ATUS, however, do not
include locations such as theaters, museums,
or sports arenas. Consequently, the locations
of many arts and entertainment events are
grouped into a reporting category the BLS
labels “other.” On an average day, for
instance, the ATUS reports nearly all museum
-going (95 percent) at “other” locations.
These other places are no doubt museums, a
location category not reported by the ATUS.
Although 65 percent of performing arts
attendees are reported as attending in “other”
locations (many of which are probably
theaters or performing arts centers), a
significant share attends the performing arts at
alternative settings. On any given day, for
example, 8 percent of performing arts
attendees take in performances in bars and
restaurants. Almost 10 percent of
attendees list places of worship as venues,
and 9 percent report schools.
Given that “other arts and entertainment”
includes attendance at festivals, amusement
parks, and firework displays, it is perhaps not
surprising that 35 percent of people attending
these activities report attending at outdoor
locations away from home.

23 Time and Money: Using Federal Data to Measure the Value of Performing Arts Activities
Proportion of Americans Attending the
Performing Arts, by Location
Bars and restaurants (7.7 percent)
Outdoors away from home (8.1 percent)
Places of worship (9.7 percent)
Schools (9.2 percent)
Other locations (64.3 percent)
Proportion of Americans Attending “Other
Arts and Entertainment,” by Location
Outdoors away from home (35.6
percent)
Schools (3.6 percent)
Other locations (51.4 percent)
Location of Arts Attendance
Final Thoughts on Assigning Value to the Arts
This Note has drawn from readily available
federal government data sources to assign
value to the performing arts. The U.S.
Economic Census, for example, provides
basic tallies of the number of performing arts
organizations and the size and composition of
their budgets.
The consumer spending estimates from the
BEA are direct gauges of “revealed
preferences”—consumers reveal the value
they place on the arts through the amounts
they spend on admissions to performing arts
events.
Estimates from the American Time Use
Survey, alternatively, go beyond monetary
measures and revealed preferences to capture
quality-of-life measures. The finding that 41
percent of performing arts attendees go to
performances with friends is an implicit
measure of the arts’ tendency to foster social
interaction.
Yet there remain additional measures—
monetary and non-monetary—that have the
potential to contribute to an even deeper
understanding of the arts’ value. On the
monetary side, “value added” measures the
contribution to the U.S. economy of selected
cultural industries. Happiness and life-
satisfaction surveys, on the other hand, are
quality-of-life measures that go beyond purely
monetary measures of cultural production.

24 Time and Money: Using Federal Data to Measure the Value of Performing Arts Activities
“Value Added”
Value added refers to an industry’s
contribution to the U.S. economy through its
labor and capital, and is estimated by using a
method similar to that used to calculate the
nation’s gross domestic product (GDP).
To prevent multiple counting, “value added”
excludes intermediary costs, which were
counted in the value added by the industries
producing those goods. For example, outlays
for toe shoes are excluded from the value
added by dance companies because the shoes
were produced using the labor and capital of
shoe manufacturers (and the manufacturers of
the shoe materials such as satin and paper).
Energy costs are also excluded from value
added.
In its annual estimates of value added, the
BEA combines results for the performing arts,
sports, and museums.18 In 2009, for example,
those cultural industries contributed $70.9
billion to the U.S. economy. The motion
picture and sound recording industry added
$59.8 billion to the U.S. GDP, and publishing
(including software) contributed $147.7
billion. A forthcoming Research Note from
the NEA will examine value added by cultural
industries.
Happiness and Life Satisfaction Surveys
Like time-use studies, happiness and life
satisfaction surveys can also be used to inform
a greater understanding of arts and culture
where spending measures provide only partial
information.
Metrics of happiness and satisfaction have
recently gained standing in the fields of
economics and domestic policy. In 2008, for
example, French president Nicholas Sarkozy
asked two Nobel laureates in economics,
Joseph Stiglitz and Amartya Sen, to create a
commission that would identify the limits of
GDP as an indicator of economic performance
and to determine additional information
needed to produce more relevant indicators of
social progress.19
In their 2009 Report by the Commission on
the Measurement of Economic Performance
and Social Progress, Stiglitz and Sen note that
only a few years ago the idea of measuring
subjective well-being appeared
“incongruous.” However, the esteemed
authors argue that studies of happiness and
satisfaction should now be considered as
important quality of life indicators.

25 Time and Money: Using Federal Data to Measure the Value of Performing Arts Activities
In 2010, Great Britain’s Office of National
Statistics went a step further by initiating
plans to add subjective well-being questions
to its national household survey.20
Brookings Institution economist Carol
Graham also contends that the study of
happiness is well suited to informing areas
where spending measures (i.e., revealed
preferences) provide limited information. If
the ticket-spending data discussed above show
only one side of the arts’ value, then perhaps
subjective well-being studies, such as
happiness surveys, are applicable to the arts.
A valid happiness survey, it should be noted,
requires polling soon after an activity of
interest occurs. Because it questions
respondents’ arts participation over a 12-
month period, the NEA’s SPPA may not be
the best tool for measuring links between arts
participation and happiness: too much time
may have elapsed between the respondents’
arts participation and their sense of happiness.
Daily time-use surveys, on the other hand,
may serve as better instruments for linking
activities with happiness. A 2007 study
conducted by Alan Krueger, in partnership
with the National Institute on Aging, is one
example. Among the findings was an average
happiness score of 5.33 (on a scale of 0 to 6)
among respondents who listened to music. By
comparison, respondents doing homework
reported an average happiness score of 2.71.21
Still, on a daily basis, many forms of arts
participation occur infrequently. Current time-
use surveys may not be able to poll enough
people to reliably link happiness and arts
participation.22 It may well be that broader,
“life satisfaction” surveys, which require
respondents to reflect upon long periods of
time, are better vehicles to study subjective
well-being in relation to the arts.

26 Time and Money: Using Federal Data to Measure the Value of Performing Arts Activities
Other Models, Other Measurers
There are a number of additional tools that may be used to assign value to the arts. The
following list briefly explains some techniques, and provides relevant examples.
Economic Impact Studies
Economic impact studies can be designed to measure increases in short-run local income
resulting from arts activities and cultural institutions. For example, an economic impact study
of the 2008 American Folk Festival estimated that festival attendees from outside the Bangor,
Maine, area (where the festival is held) spent a total of $2.2 million dollars on admissions to the
festival and related spending such as outlays for hotels, restaurants, and shopping. Among
methodological challenges facing these studies is the ability to isolate new spending from
spending that would have occurred in the absence of an arts event or activity.
Silva, B., Mann, M., & Daniel, H. (2009). Economic Impact of the 2008 American Folk
Festival in Bangor, Maine. Proceedings of the 2009 Northeastern Recreation Research
Symposium. Retrieved from http://www.nrs.fs.fed.us/pubs/gtr/gtr-nrs-p-66papers/34-silva-p-
66.pdf.
Studies Linking the Arts to Community Growth and Development
Studies designed to measure the relationship between a community’s arts and cultural
organizations and economic development offer another method of ascribing value to the arts.
A series of studies in Philadelphia found that neighborhoods with clusters of cultural
organizations were four times more likely to see neighborhood populations grow and poverty
rates decline.
Stern, M. & Seifert, S. (2007). Cultivating “Natural” Cultural Districts. Retrieved from
http://www.trfund.com/resource/downloads/creativity/NaturalCulturalDistricts.pdf.

27 Time and Money: Using Federal Data to Measure the Value of Performing Arts Activities
Other Models, Other Measures
(continued)
Contingent Valuation
Contingent valuation surveys poll respondents about their willingness to pay for an amenity.
These surveys are designed to measure that part of an amenity’s consumption value not
captured by economic impact studies. A study published in 2002, for example, reported that
the average Kentucky resident indicated a willingness to pay almost $27 to prevent a decline in
arts performances and exhibits.
Thompson, E., Berger, M., Blomquist, G., & Allen, S. (2002). “Valuing the Arts: A Contingent
Valuation Approach.” Journal of Cultural Economics, 26, pp. 87-113. Retrieved from http://
digitalcommons.unl.edu/cgi/viewcontent.cgi?article=1048&context=cbafacpub.
Hedonic Housing Price Models
The consumption value of the arts may also be estimated through hedonic housing price
models, which relate housing prices to proximity to amenities such as theaters or art museums.
In the Lowertown area of St. Paul, Minneapolis, residential housing values were found to have
increased by $13,827 within three miles of the Tilsner Artist Cooperative.
Gadwa, A., Markusen, A., & Walton, N. (2010). How Artists Space Matters: Impacts and
Insights from Three Case Studies drawn from Artspace Project’s Earliest Developments.
Retrieved from http://www.metrisarts.com/images/stories/pdf/howartistspacematters.pdf.

28 Time and Money: Using Federal Data to Measure the Value of Performing Arts Activities
Technical Notes
Conducted once every five years, the U.S.
Census Bureau’s Economic Census
enumerates business establishments with
payrolls. Using the North American
Industrial Classification System (NAICS),
Economic Census results are used to report
counts of business establishments and
information on business receipts, expenses,
and payrolls.
Performing arts establishments (NAICS 7111)
are part of the larger Arts, Entertainment, and
Recreation Sector (NAICS 71).
For more detailed information, please see the
2007 Economic Census User Guide, available
at http://www.census.gov/econ/census07/pdf/
econ_user_guide.pdf.
This Note also draws on the Bureau of
Economic Analysis’ estimates of personal
consumption expenditures on admissions to
the performing arts, sporting events, and
movie theaters, as well as consumer outlays
for other leisure and entertainment items.
Annual estimates for most of these consumer
expenditure categories are based on the
Census Bureau’s Service Annual Survey.
“Benchmark” estimates, alternatively, are
derived from the Bureau’s Economic Census.
For an in-depth explanation of the BEA’s
consumer expenditure calculations, see
Chapter 5 of the BEA’s NIPA Handbook,
available at http://www.bea.gov/national/pdf/
NIPAch5consumerspending.pdf.
Supplemental consumer spending is provided
by the Bureau of Labor Statistics’ Consumer
Expenditure Survey. The CES consists of
both a diary survey, which is designed to
produce data on frequently purchased items
such as food, and the interview survey, where
respondents report their spending to
interviewers. Most of the CES spending
categories reported in this Note, including
admissions to movies, theaters, sporting
events, etc., and spending on books and
newspapers and magazines, were based on the
interview component of the CES. However,
outlays for video game hardware and
software, as well as for toys, games, and arts
and crafts, were estimated via the diary
component.
Detailed information can be obtained from the
BLS’ Consumer Expenditure website at http://
www.bls.gov/cex/home.htm.
The Bureau of Labor Statistics also sponsors
the American Time Use Survey, which
provides estimates of how, where, and with
whom respondents aged 15 and older spend
29 Time and Money: Using Federal Data to Measure the Value of Performing Arts Activities
their time. The ATUS is conducted as a
detailed account of the respondents’ activities,
starting at 4 a.m. the previous day, and ending
at 4 a.m. on the interview day. For each
activity reported, the interviewer asks how
long the activity lasted. For most activities,
the interviewer also asks who was in the room
or who accompanied the respondent during
the activity and where the activity took place.
One limitation of the ATUS is that, with the
exception of childcare, information on
secondary activities (activities that are done at
the same time as the primary activity, e.g.,
listening to music while working) is not
systematically collected.
The survey’s User Guide, available at http://
www.bls.gov/tus/atususersguide.pdf, provides
a comprehensive narrative on the ATUS.
For Further Reading
Frazis, H., & Stewart, J. (2003). Where Does
the Time Go? Concepts and Measurement in
the American Time Use Survey. In Berndt,
E., & Hulten, C. (Eds.) Hard-to-Measure
Goods and Services: Essays in Honor of Zvi
Griliches. University of Chicago Press.
Retrieved from http://www.nber.org/chapters/
c0874.pdf.
Stiglitz, J., Sen, A., & Fitoussi, J. (2009).
Report by the Commission on the
Measurement of Economic Performance and
Social Progress. Retrieved from http://
www.stiglitz-sen-fitoussi.fr/documents/
rapport_anglais.pdf.
Graham, C. (2010). The Challenges of
Incorporating Empowerment in the HDI:
Some Lessons from Happiness and Economics
and Quality of Life Research. United Nations
Development Program. Retrieved from http://
www.brookings.edu/
reports/2010/07_economics_happiness_graha
m.aspx.
Kahneman, A., Krueger, A., Schkade, D.,
Schwartz, N., & Stone, A. (2004). Toward
National Well-Being Accounts. AEA Papers
and Proceedings. Retrieved from http://
www.krueger.princeton.edu/Toward%20Well-
Being.pdf.

30 Time and Money: Using Federal Data to Measure the Value of Performing Arts Activities
The NEA Office of Research & Analysis would like to thank Bureau of Labor Statistics
economists Rachel Krantz-Kent and Marianne Reifschneider for their invaluable guidance to
the NEA in preparing this Note.
Produced by Bonnie Nichols
Director, Sunil Iyengar
Senior Program Analyst, Sarah Sullivan
Office of Research & Analysis
National Endowment for the Arts
1100 Pennsylvania Avenue, NW
Washington, D.C. 20506
(202) 682-5424

31 Time and Money: Using Federal Data to Measure the Value of Performing Arts Activities
Endnotes
1All of these industry counts exclude self-employed workers. The most recent data available (2008) report nearly 56,000 “non-employer establishments” in the U.S. performing arts indus-try. Most of these establishments represent self-employed workers.
2An establishment is a single physical location where business is conducted or where services or industrial operations are performed. A company may have one or many establishments. 3 The Economic Census enumerates only those employees on payroll. 4 The Economic Census does not report expenses for for-profit establishments. The number of paid employees (both full and part-time) excludes self-employed workers. 5 To protect the confidentiality of taxable opera companies and dinner theaters, the Economic Census combines theaters, dinner theaters, and opera companies in its tallies of revenue and paid employees in the for-profit performing arts. 6 This analysis excludes 346 tax-exempt performing arts establishments that were not in busi-ness throughout 2007. 7 The remaining 13 percent of total revenue derives from sources such as investment income and gains from the sale of assets. 8 This figures excludes textbooks and books purchased for work. 9 This spending category includes single and season tickets to movies, plays, operas, or con-certs, as well as admissions to museums, amusement parks, zoos, and state parks. 10 For a complete list of NEA research publications, please see the Research section of the agency’s website: http://www.nea.gov/research/index.html. 11 The BLS routinely tabulates ATUS estimates for 5-year periods, such as the 2005-2009 esti-mates included in this Note. Also shown in this Note are ATUS tables produced by the BLS at the request of the NEA’s Office of Research & Analysis. These special ATUS tabulations re-flect the 2003-2009 period. 12 The performing arts, as captured by the ATUS, includes plays, musicals, comedy club per-formances, opera, ballet and dance, concerts, and performances at “jazz bars.” 13 Fractional hours can be converted to minutes by using the BLS’ conversion chart available at http://www.bls.gov/tus/Conversion_chart.pdf.

32 Time and Money: Using Federal Data to Measure the Value of Performing Arts Activities
14 Additional activities included in “other arts and entertainments” include flower shows, auto shows, parades, firework displays, fairs, carnivals, and guided nature walks. 15 Using computers for leisure excludes sending or reading personal e-mails. 16 The difference between the share attending the performing arts with friends (40.8 percent) and the share attending sports with friends (33 percent) is statistically insignificant. 17 The difference in rates is statistically significant. 18 More detailed industry breakouts that isolate the performing arts from sports and museums are done on a five-year, “benchmark” basis. 19 Jean-Paul Fitoussi was the coordinator of the Commission on the Measurement of Economic Performance and Social Progress. 20 Please see Stratton, A. (November 14, 2010). Happiness Index to Gauge Britain’s National Mood. guardian.co.uk. Retrieved from http://www.guardian.co.uk/lifeandstyle/2010/nov/14/happiness-index-britain-national-mood. 21See Krueger, A. (2007). Are We Having More Fun Yet? Categorizing and Evaluating Changes in Time Allocation. Brookings Panel on Economic Activity. Retrieved from http://www.brookings.edu/es/commentary/journals/bpea_macro/forum/200709krueger.pdf. 22 Using ATUS data requires multi-year results to obtain a large enough sample size to examine arts participation. Therefore, any prospective study using the ATUS may require multi-year surveys and substantial investment of both time and money.