Embed Size (px)
Citation preview

© 2010 Mortgage Bankers Association (MBA). All rights reserved, except as explicitly granted.
Data are from a proprietary paid subscription service of MBA and are provided to the media as a courtesy, solely for use as background reference. No part of the data may be reproduced, stored in a retrieval system, transmitted or redistributed in any form or by any means, including electronic, mechanical, photocopying, recording or otherwise. Permission is granted to news media to reproduce limited data in text articles. Data may not be reproduced in tabular or graphical form without MBA’s prior written consent.
Q409
NATIONALDELINQUENCY
SURVEYFROM THE MORTGAGE BANKERS ASSOCIATION
Data as of December 31, 2009
2 National Delinquency Survey from the Mortgage Bankers Association • Fourth Quarter 2009 © Mortgage Bankers Association February 2010. All Rights Reserved.
National Delinquency Survey ResultsFourth Quarter 2009
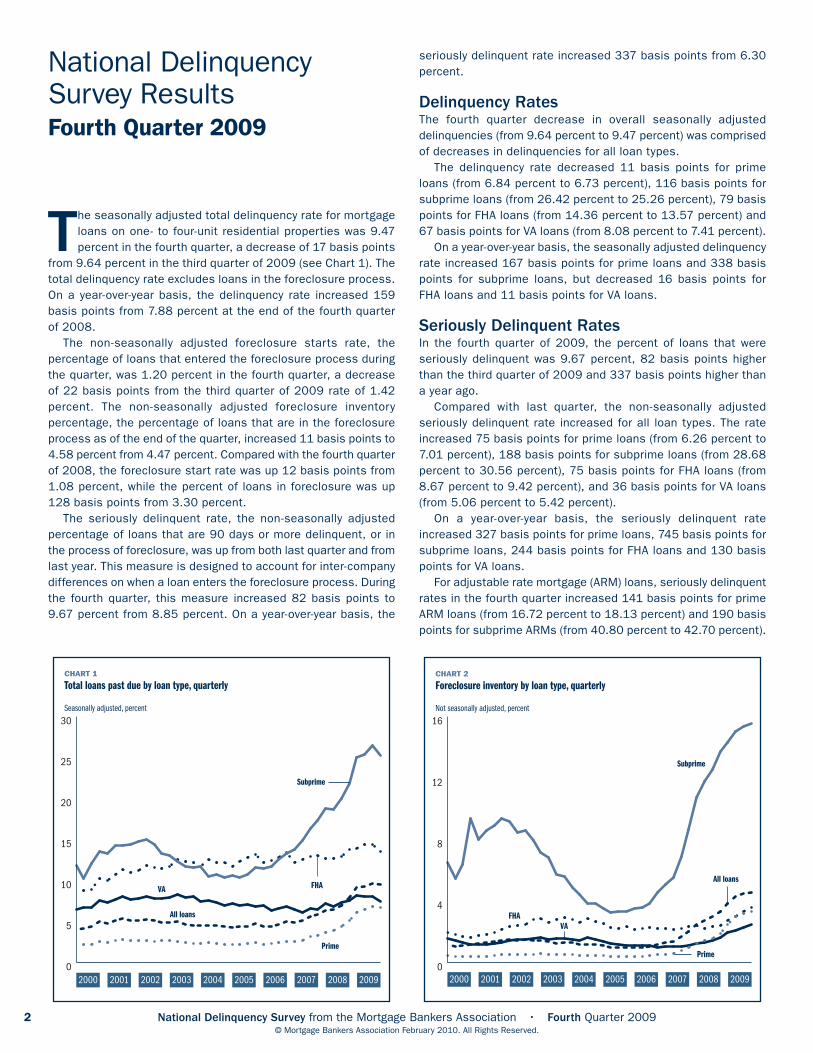
The seasonally adjusted total delinquency rate for mortgage loans on one- to four-unit residential properties was 9.47 percent in the fourth quarter, a decrease of 17 basis points
from 9.64 percent in the third quarter of 2009 (see Chart 1). The total delinquency rate excludes loans in the foreclosure process. On a year-over-year basis, the delinquency rate increased 159 basis points from 7.88 percent at the end of the fourth quarter of 2008. The non-seasonally adjusted foreclosure starts rate, the percentage of loans that entered the foreclosure process during the quarter, was 1.20 percent in the fourth quarter, a decrease of 22 basis points from the third quarter of 2009 rate of 1.42 percent. The non-seasonally adjusted foreclosure inventory percentage, the percentage of loans that are in the foreclosure process as of the end of the quarter, increased 11 basis points to 4.58 percent from 4.47 percent. Compared with the fourth quarter of 2008, the foreclosure start rate was up 12 basis points from 1.08 percent, while the percent of loans in foreclosure was up 128 basis points from 3.30 percent. The seriously delinquent rate, the non-seasonally adjusted percentage of loans that are 90 days or more delinquent, or in the process of foreclosure, was up from both last quarter and from last year. This measure is designed to account for inter-company differences on when a loan enters the foreclosure process. During the fourth quarter, this measure increased 82 basis points to 9.67 percent from 8.85 percent. On a year-over-year basis, the
seriously delinquent rate increased 337 basis points from 6.30 percent.
Delinquency RatesThe fourth quarter decrease in overall seasonally adjusted delinquencies (from 9.64 percent to 9.47 percent) was comprised of decreases in delinquencies for all loan types. The delinquency rate decreased 11 basis points for prime loans (from 6.84 percent to 6.73 percent), 116 basis points for subprime loans (from 26.42 percent to 25.26 percent), 79 basis points for FHA loans (from 14.36 percent to 13.57 percent) and 67 basis points for VA loans (from 8.08 percent to 7.41 percent). On a year-over-year basis, the seasonally adjusted delinquency rate increased 167 basis points for prime loans and 338 basis points for subprime loans, but decreased 16 basis points for FHA loans and 11 basis points for VA loans.
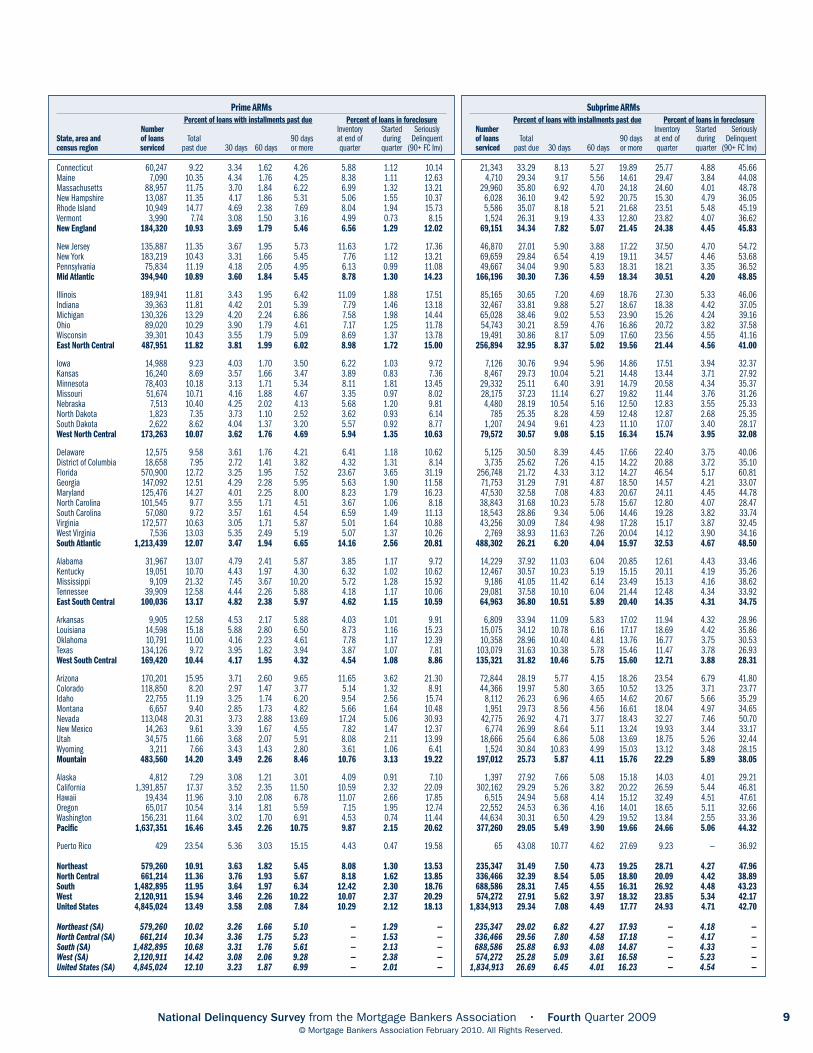
Seriously Delinquent RatesIn the fourth quarter of 2009, the percent of loans that were seriously delinquent was 9.67 percent, 82 basis points higher than the third quarter of 2009 and 337 basis points higher than a year ago. Compared with last quarter, the non-seasonally adjusted seriously delinquent rate increased for all loan types. The rate increased 75 basis points for prime loans (from 6.26 percent to 7.01 percent), 188 basis points for subprime loans (from 28.68 percent to 30.56 percent), 75 basis points for FHA loans (from 8.67 percent to 9.42 percent), and 36 basis points for VA loans (from 5.06 percent to 5.42 percent). On a year-over-year basis, the seriously delinquent rate increased 327 basis points for prime loans, 745 basis points for subprime loans, 244 basis points for FHA loans and 130 basis points for VA loans. For adjustable rate mortgage (ARM) loans, seriously delinquent rates in the fourth quarter increased 141 basis points for prime ARM loans (from 16.72 percent to 18.13 percent) and 190 basis points for subprime ARMs (from 40.80 percent to 42.70 percent).
Total loans past due by loan type, quarterly
Seasonally adjusted, percent
CHART 1
0
5
10
15
20
25
30
FHA
Subprime
VA
All loans
Prime
2000 2001 2002 2003 2004 2005 2006 2007 20092008
Foreclosure inventory by loan type, quarterly
Not seasonally adjusted, percent
CHART 2
0
4
8
12
16
FHA
Subprime
VA
All loans
Prime
2000 2001 2002 2003 2004 2005 2006 2007 20092008
National Delinquency Survey from the Mortgage Bankers Association • Fourth Quarter 2009 3 © Mortgage Bankers Association February 2010. All Rights Reserved.
Foreclosure starts by loan type, quarterly
Not seasonally adjusted, percent
CHART 3
0
1
2
3
4
5
FHA
Subprime
All loans
VA
Prime
2000 2001 2002 2003 2004 2005 2006 2007 20092008
Seriously delinquent rate for U.S. by product type, quarterly
Not seasonally adjusted, percent
CHART 4
0
15
30
45
Prime ARM
SubprimeARM
SubprimeFRM
PrimeFRM
2000 2001 2002 2003 2004 2005 2006 2007 20092008
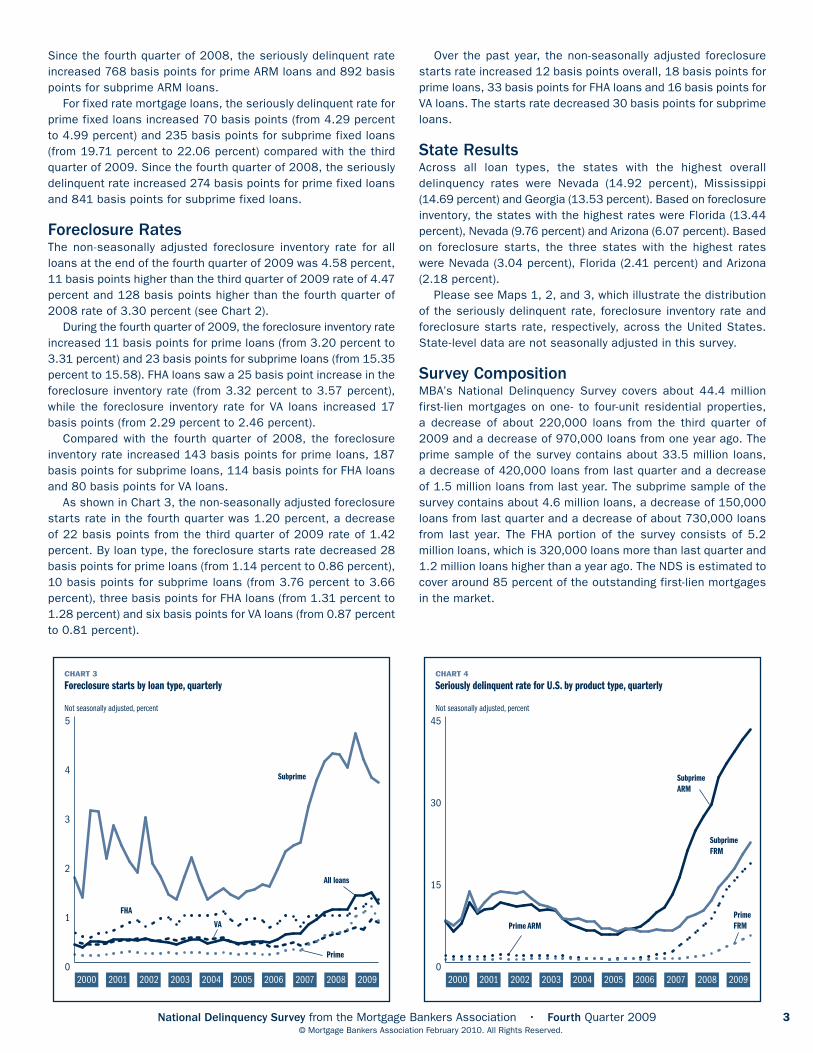
Since the fourth quarter of 2008, the seriously delinquent rate increased 768 basis points for prime ARM loans and 892 basis points for subprime ARM loans. For fixed rate mortgage loans, the seriously delinquent rate for prime fixed loans increased 70 basis points (from 4.29 percent to 4.99 percent) and 235 basis points for subprime fixed loans (from 19.71 percent to 22.06 percent) compared with the third quarter of 2009. Since the fourth quarter of 2008, the seriously delinquent rate increased 274 basis points for prime fixed loans and 841 basis points for subprime fixed loans.
Foreclosure RatesThe non-seasonally adjusted foreclosure inventory rate for all loans at the end of the fourth quarter of 2009 was 4.58 percent, 11 basis points higher than the third quarter of 2009 rate of 4.47 percent and 128 basis points higher than the fourth quarter of 2008 rate of 3.30 percent (see Chart 2). During the fourth quarter of 2009, the foreclosure inventory rate increased 11 basis points for prime loans (from 3.20 percent to 3.31 percent) and 23 basis points for subprime loans (from 15.35 percent to 15.58). FHA loans saw a 25 basis point increase in the foreclosure inventory rate (from 3.32 percent to 3.57 percent), while the foreclosure inventory rate for VA loans increased 17 basis points (from 2.29 percent to 2.46 percent). Compared with the fourth quarter of 2008, the foreclosure inventory rate increased 143 basis points for prime loans, 187 basis points for subprime loans, 114 basis points for FHA loans and 80 basis points for VA loans. As shown in Chart 3, the non-seasonally adjusted foreclosure starts rate in the fourth quarter was 1.20 percent, a decrease of 22 basis points from the third quarter of 2009 rate of 1.42 percent. By loan type, the foreclosure starts rate decreased 28 basis points for prime loans (from 1.14 percent to 0.86 percent), 10 basis points for subprime loans (from 3.76 percent to 3.66 percent), three basis points for FHA loans (from 1.31 percent to 1.28 percent) and six basis points for VA loans (from 0.87 percent to 0.81 percent).
Over the past year, the non-seasonally adjusted foreclosure starts rate increased 12 basis points overall, 18 basis points for prime loans, 33 basis points for FHA loans and 16 basis points for VA loans. The starts rate decreased 30 basis points for subprime loans.
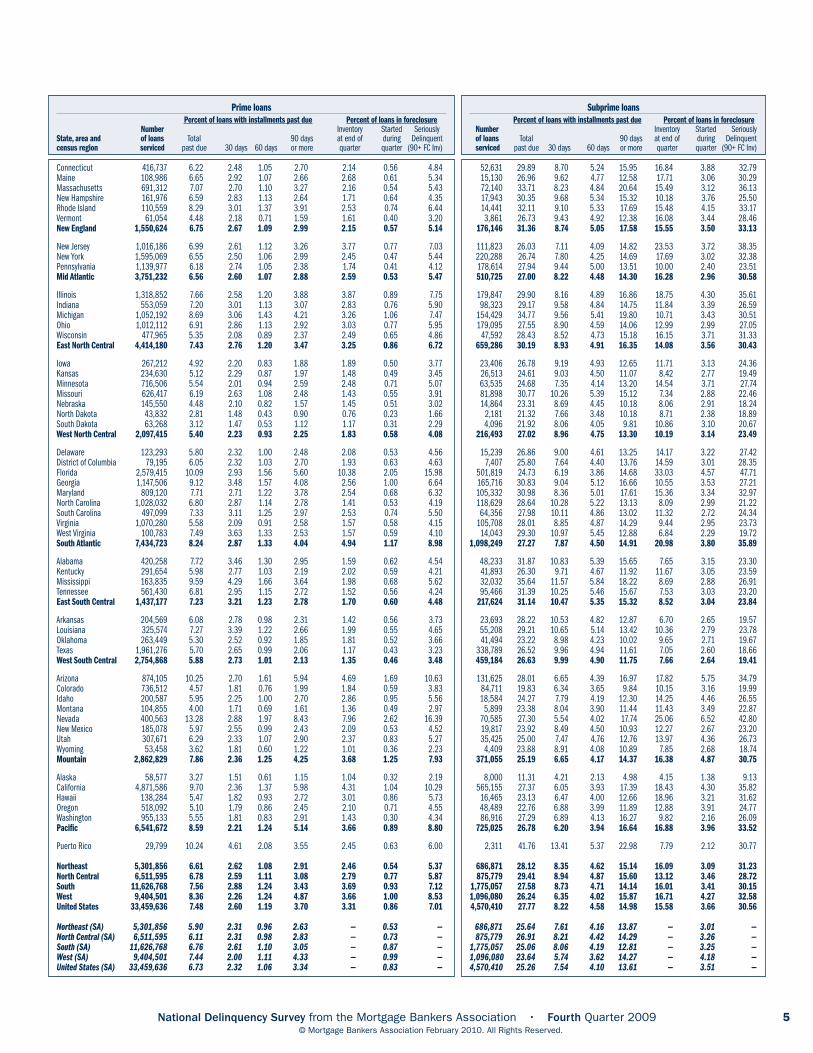
State ResultsAcross all loan types, the states with the highest overall delinquency rates were Nevada (14.92 percent), Mississippi (14.69 percent) and Georgia (13.53 percent). Based on foreclosure inventory, the states with the highest rates were Florida (13.44 percent), Nevada (9.76 percent) and Arizona (6.07 percent). Based on foreclosure starts, the three states with the highest rates were Nevada (3.04 percent), Florida (2.41 percent) and Arizona (2.18 percent). Please see Maps 1, 2, and 3, which illustrate the distribution of the seriously delinquent rate, foreclosure inventory rate and foreclosure starts rate, respectively, across the United States. State-level data are not seasonally adjusted in this survey.
Survey CompositionMBA’s National Delinquency Survey covers about 44.4 million first-lien mortgages on one- to four-unit residential properties, a decrease of about 220,000 loans from the third quarter of 2009 and a decrease of 970,000 loans from one year ago. The prime sample of the survey contains about 33.5 million loans, a decrease of 420,000 loans from last quarter and a decrease of 1.5 million loans from last year. The subprime sample of the survey contains about 4.6 million loans, a decrease of 150,000 loans from last quarter and a decrease of about 730,000 loans from last year. The FHA portion of the survey consists of 5.2 million loans, which is 320,000 loans more than last quarter and 1.2 million loans higher than a year ago. The NDS is estimated to cover around 85 percent of the outstanding first-lien mortgages in the market.

4 National Delinquency Survey from the Mortgage Bankers Association • Fourth Quarter 2009 © Mortgage Bankers Association February 2010. All Rights Reserved.
National Delinquency Survey, Fourth Quarter 2009
Connecticut 521,251 9.36 3.44 1.63 4.29 3.77 0.95 8.06Maine 139,689 9.44 3.94 1.60 3.90 4.41 0.92 8.31Massachusetts 816,574 9.73 3.35 1.49 4.89 3.39 0.79 8.28New Hampshire 196,279 9.03 3.58 1.57 3.87 2.51 0.94 6.38Rhode Island 137,316 11.09 3.82 1.85 5.41 3.97 1.15 9.38Vermont 69,230 6.09 2.76 1.04 2.29 2.49 0.61 4.78New England 1,880,339 9.50 3.45 1.56 4.49 3.49 0.88 7.98
New Jersey 1,263,930 9.58 3.42 1.57 4.59 5.82 1.13 10.41New York 2,022,602 9.51 3.43 1.55 4.52 4.21 0.79 8.73Pennsylvania 1,552,186 9.72 4.08 1.73 3.92 2.81 0.69 6.73Mid Atlantic 4,838,718 9.59 3.63 1.61 4.35 4.18 0.85 8.53
Illinois 1,713,377 11.08 3.66 1.81 5.61 5.62 1.35 11.23Indiana 836,668 11.73 4.62 1.95 5.17 4.34 1.28 9.51Michigan 1,378,069 12.99 4.28 2.14 6.57 4.56 1.50 11.13Ohio 1,467,588 11.02 4.25 1.87 4.91 4.72 1.21 9.63Wisconsin 596,893 7.96 2.90 1.35 3.70 3.78 0.97 7.48East North Central 5,992,595 11.29 4.01 1.88 5.41 4.79 1.30 10.20
Iowa 343,833 7.31 3.09 1.31 2.91 2.79 0.75 5.70Kansas 329,362 7.86 3.42 1.39 3.05 2.28 0.77 5.33Minnesota 884,656 7.31 2.60 1.24 3.47 3.43 0.96 6.90Missouri 858,761 9.72 3.91 1.73 4.08 2.10 0.85 6.18Nebraska 208,679 6.64 2.99 1.26 2.39 2.00 0.74 4.39North Dakota 59,266 4.00 2.00 0.67 1.33 1.13 0.37 2.46South Dakota 80,453 4.72 2.11 0.83 1.78 1.76 0.50 3.54West North Central 2,765,010 7.93 3.17 1.40 3.36 2.59 0.83 5.95
Delaware 161,542 9.02 3.51 1.60 3.92 3.42 0.86 7.34District of Columbia 95,217 8.02 2.95 1.39 3.68 2.91 0.81 6.59Florida 3,433,574 12.66 3.67 2.01 6.99 13.44 2.41 20.43Georgia 1,654,728 13.53 4.89 2.36 6.28 3.57 1.36 9.85Maryland 1,061,819 10.87 3.73 1.79 5.36 3.86 0.99 9.22North Carolina 1,401,014 10.19 4.15 1.78 4.26 2.16 0.81 6.42South Carolina 657,692 10.46 4.28 1.82 4.36 3.40 0.95 7.76Virginia 1,411,468 8.08 3.05 1.39 3.64 2.13 0.77 5.77West Virginia 133,454 10.71 4.88 1.97 3.86 2.21 0.81 6.07South Atlantic 10,010,508 11.35 3.90 1.90 5.55 6.55 1.47 12.10
Alabama 595,620 11.45 4.85 1.99 4.61 2.18 0.89 6.79Kentucky 430,995 9.76 4.26 1.75 3.75 3.28 0.97 7.03Mississippi 250,978 14.69 5.98 2.58 6.13 2.97 1.05 9.10Tennessee 854,273 11.31 4.55 1.98 4.77 2.34 0.94 7.11East South Central 2,131,866 11.43 4.74 2.01 4.68 2.56 0.95 7.24
Arkansas 308,617 9.35 4.19 1.61 3.56 2.01 0.82 5.57Louisiana 472,302 11.48 4.95 2.03 4.50 3.19 0.91 7.69Oklahoma 423,993 8.62 3.91 1.57 3.14 2.84 0.86 5.98Texas 3,084,633 10.30 4.43 1.90 3.97 2.00 0.78 5.97West South Central 4,289,545 10.20 4.42 1.86 3.92 2.22 0.81 6.14
Arizona 1,158,133 12.55 3.41 2.01 7.13 6.07 2.18 13.20Colorado 999,493 6.91 2.64 1.21 3.06 2.81 0.92 5.87Idaho 263,741 7.99 3.09 1.39 3.51 3.66 1.25 7.17Montana 134,450 5.56 2.39 1.00 2.16 1.84 0.65 4.00Nevada 543,596 14.92 3.41 2.24 9.28 9.76 3.04 19.04New Mexico 252,965 8.27 3.54 1.45 3.29 2.99 0.76 6.28Utah 435,432 8.64 3.20 1.54 3.90 3.30 1.19 7.20Wyoming 70,400 5.84 2.67 1.04 2.13 1.55 0.58 3.68Mountain 3,858,210 10.02 3.12 1.65 5.25 4.84 1.62 10.09
Alaska 94,115 4.75 2.21 0.91 1.63 1.37 0.46 3.00California 5,778,503 11.34 2.78 1.63 6.93 5.56 1.34 12.49Hawaii 165,970 7.34 2.37 1.26 3.71 4.54 1.09 8.25Oregon 627,956 6.88 2.40 1.18 3.31 2.98 0.99 6.29Washington 1,187,110 7.65 2.44 1.17 4.04 2.10 0.49 6.14Pacific 7,853,654 10.27 2.68 1.51 6.07 4.76 1.17 10.83
Puerto Rico 35,754 13.52 5.43 2.42 5.66 3.26 0.78 8.92
Northeast 6,719,057 9.57 3.58 1.60 4.39 3.99 0.86 8.38North Central 8,757,605 10.23 3.74 1.72 4.76 4.10 1.15 8.86South 16,431,919 11.06 4.15 1.90 5.01 4.90 1.23 9.91West 11,711,864 10.19 2.83 1.55 5.80 4.78 1.32 10.58United States 44,426,246 10.44 3.63 1.73 5.09 4.58 1.20 9.67
Northeast (SA) 6,719,057 8.65 3.19 1.42 4.03 — 0.82 —North Central (SA) 8,757,605 9.31 3.39 1.55 4.37 — 1.09 —South (SA) 16,431,919 10.02 3.83 1.68 4.52 — 1.15 —West (SA) 11,711,864 9.21 2.55 1.40 5.27 — 1.31 —United States (SA) 44,426,246 9.47 3.31 1.54 4.62 — 1.14 —
All loans Percent of loans with installments past due Percent of loans in foreclosure Number Inventory Started SeriouslyState, area and of loans Total 90 days at end of during Delinquentcensus region serviced past due 30 days 60 days or more quarter quarter (90+ FC Inv)
National Delinquency Survey from the Mortgage Bankers Association • Fourth Quarter 2009 5 © Mortgage Bankers Association February 2010. All Rights Reserved.
Connecticut 416,737 6.22 2.48 1.05 2.70 2.14 0.56 4.84Maine 108,986 6.65 2.92 1.07 2.66 2.68 0.61 5.34Massachusetts 691,312 7.07 2.70 1.10 3.27 2.16 0.54 5.43New Hampshire 161,976 6.59 2.83 1.13 2.64 1.71 0.64 4.35Rhode Island 110,559 8.29 3.01 1.37 3.91 2.53 0.74 6.44Vermont 61,054 4.48 2.18 0.71 1.59 1.61 0.40 3.20New England 1,550,624 6.75 2.67 1.09 2.99 2.15 0.57 5.14
New Jersey 1,016,186 6.99 2.61 1.12 3.26 3.77 0.77 7.03New York 1,595,069 6.55 2.50 1.06 2.99 2.45 0.47 5.44Pennsylvania 1,139,977 6.18 2.74 1.05 2.38 1.74 0.41 4.12Mid Atlantic 3,751,232 6.56 2.60 1.07 2.88 2.59 0.53 5.47
Illinois 1,318,852 7.66 2.58 1.20 3.88 3.87 0.89 7.75Indiana 553,059 7.20 3.01 1.13 3.07 2.83 0.76 5.90Michigan 1,052,192 8.69 3.06 1.43 4.21 3.26 1.06 7.47Ohio 1,012,112 6.91 2.86 1.13 2.92 3.03 0.77 5.95Wisconsin 477,965 5.35 2.08 0.89 2.37 2.49 0.65 4.86East North Central 4,414,180 7.43 2.76 1.20 3.47 3.25 0.86 6.72
Iowa 267,212 4.92 2.20 0.83 1.88 1.89 0.50 3.77Kansas 234,630 5.12 2.29 0.87 1.97 1.48 0.49 3.45Minnesota 716,506 5.54 2.01 0.94 2.59 2.48 0.71 5.07Missouri 626,417 6.19 2.63 1.08 2.48 1.43 0.55 3.91Nebraska 145,550 4.48 2.10 0.82 1.57 1.45 0.51 3.02North Dakota 43,832 2.81 1.48 0.43 0.90 0.76 0.23 1.66South Dakota 63,268 3.12 1.47 0.53 1.12 1.17 0.31 2.29West North Central 2,097,415 5.40 2.23 0.93 2.25 1.83 0.58 4.08
Delaware 123,293 5.80 2.32 1.00 2.48 2.08 0.53 4.56District of Columbia 79,195 6.05 2.32 1.03 2.70 1.93 0.63 4.63Florida 2,579,415 10.09 2.93 1.56 5.60 10.38 2.05 15.98Georgia 1,147,506 9.12 3.48 1.57 4.08 2.56 1.00 6.64Maryland 809,120 7.71 2.71 1.22 3.78 2.54 0.68 6.32North Carolina 1,028,032 6.80 2.87 1.14 2.78 1.41 0.53 4.19South Carolina 497,099 7.33 3.11 1.25 2.97 2.53 0.74 5.50Virginia 1,070,280 5.58 2.09 0.91 2.58 1.57 0.58 4.15West Virginia 100,783 7.49 3.63 1.33 2.53 1.57 0.59 4.10South Atlantic 7,434,723 8.24 2.87 1.33 4.04 4.94 1.17 8.98
Alabama 420,258 7.72 3.46 1.30 2.95 1.59 0.62 4.54Kentucky 291,654 5.98 2.77 1.03 2.19 2.02 0.59 4.21Mississippi 163,835 9.59 4.29 1.66 3.64 1.98 0.68 5.62Tennessee 561,430 6.81 2.95 1.15 2.72 1.52 0.56 4.24East South Central 1,437,177 7.23 3.21 1.23 2.78 1.70 0.60 4.48
Arkansas 204,569 6.08 2.78 0.98 2.31 1.42 0.56 3.73Louisiana 325,574 7.27 3.39 1.22 2.66 1.99 0.55 4.65Oklahoma 263,449 5.30 2.52 0.92 1.85 1.81 0.52 3.66Texas 1,961,276 5.70 2.65 0.99 2.06 1.17 0.43 3.23West South Central 2,754,868 5.88 2.73 1.01 2.13 1.35 0.46 3.48
Arizona 874,105 10.25 2.70 1.61 5.94 4.69 1.69 10.63Colorado 736,512 4.57 1.81 0.76 1.99 1.84 0.59 3.83Idaho 200,587 5.95 2.25 1.00 2.70 2.86 0.95 5.56Montana 104,855 4.00 1.71 0.69 1.61 1.36 0.49 2.97Nevada 400,563 13.28 2.88 1.97 8.43 7.96 2.62 16.39New Mexico 185,078 5.97 2.55 0.99 2.43 2.09 0.53 4.52Utah 307,671 6.29 2.33 1.07 2.90 2.37 0.83 5.27Wyoming 53,458 3.62 1.81 0.60 1.22 1.01 0.36 2.23Mountain 2,862,829 7.86 2.36 1.25 4.25 3.68 1.25 7.93
Alaska 58,577 3.27 1.51 0.61 1.15 1.04 0.32 2.19California 4,871,586 9.70 2.36 1.37 5.98 4.31 1.04 10.29Hawaii 138,284 5.47 1.82 0.93 2.72 3.01 0.86 5.73Oregon 518,092 5.10 1.79 0.86 2.45 2.10 0.71 4.55Washington 955,133 5.55 1.81 0.83 2.91 1.43 0.30 4.34Pacific 6,541,672 8.59 2.21 1.24 5.14 3.66 0.89 8.80
Puerto Rico 29,799 10.24 4.61 2.08 3.55 2.45 0.63 6.00
Northeast 5,301,856 6.61 2.62 1.08 2.91 2.46 0.54 5.37North Central 6,511,595 6.78 2.59 1.11 3.08 2.79 0.77 5.87South 11,626,768 7.56 2.88 1.24 3.43 3.69 0.93 7.12West 9,404,501 8.36 2.26 1.24 4.87 3.66 1.00 8.53United States 33,459,636 7.48 2.60 1.19 3.70 3.31 0.86 7.01
Northeast (SA) 5,301,856 5.90 2.31 0.96 2.63 — 0.53 —North Central (SA) 6,511,595 6.11 2.31 0.98 2.83 — 0.73 —South (SA) 11,626,768 6.76 2.61 1.10 3.05 — 0.87 —West (SA) 9,404,501 7.44 2.00 1.11 4.33 — 0.99 —United States (SA) 33,459,636 6.73 2.32 1.06 3.34 — 0.83 —
Prime loans Percent of loans with installments past due Percent of loans in foreclosure Number Inventory Started SeriouslyState, area and of loans Total 90 days at end of during Delinquentcensus region serviced past due 30 days 60 days or more quarter quarter (90+ FC Inv)
52,631 29.89 8.70 5.24 15.95 16.84 3.88 32.79 15,130 26.96 9.62 4.77 12.58 17.71 3.06 30.29 72,140 33.71 8.23 4.84 20.64 15.49 3.12 36.13 17,943 30.35 9.68 5.34 15.32 10.18 3.76 25.50 14,441 32.11 9.10 5.33 17.69 15.48 4.15 33.17 3,861 26.73 9.43 4.92 12.38 16.08 3.44 28.46 176,146 31.36 8.74 5.05 17.58 15.55 3.50 33.13
111,823 26.03 7.11 4.09 14.82 23.53 3.72 38.35 220,288 26.74 7.80 4.25 14.69 17.69 3.02 32.38 178,614 27.94 9.44 5.00 13.51 10.00 2.40 23.51 510,725 27.00 8.22 4.48 14.30 16.28 2.96 30.58
179,847 29.90 8.16 4.89 16.86 18.75 4.30 35.61 98,323 29.17 9.58 4.84 14.75 11.84 3.39 26.59 154,429 34.77 9.56 5.41 19.80 10.71 3.43 30.51 179,095 27.55 8.90 4.59 14.06 12.99 2.99 27.05 47,592 28.43 8.52 4.73 15.18 16.15 3.71 31.33 659,286 30.19 8.93 4.91 16.35 14.08 3.56 30.43
23,406 26.78 9.19 4.93 12.65 11.71 3.13 24.36 26,513 24.61 9.03 4.50 11.07 8.42 2.77 19.49 63,535 24.68 7.35 4.14 13.20 14.54 3.71 27.74 81,898 30.77 10.26 5.39 15.12 7.34 2.88 22.46 14,864 23.31 8.69 4.45 10.18 8.06 2.91 18.24 2,181 21.32 7.66 3.48 10.18 8.71 2.38 18.89 4,096 21.92 8.06 4.05 9.81 10.86 3.10 20.67 216,493 27.02 8.96 4.75 13.30 10.19 3.14 23.49
15,239 26.86 9.00 4.61 13.25 14.17 3.22 27.42 7,407 25.80 7.64 4.40 13.76 14.59 3.01 28.35 501,819 24.73 6.19 3.86 14.68 33.03 4.57 47.71 165,716 30.83 9.04 5.12 16.66 10.55 3.53 27.21 105,332 30.98 8.36 5.01 17.61 15.36 3.34 32.97 118,629 28.64 10.28 5.22 13.13 8.09 2.99 21.22 64,356 27.98 10.11 4.86 13.02 11.32 2.72 24.34 105,708 28.01 8.85 4.87 14.29 9.44 2.95 23.73 14,043 29.30 10.97 5.45 12.88 6.84 2.29 19.72 1,098,249 27.27 7.87 4.50 14.91 20.98 3.80 35.89
48,233 31.87 10.83 5.39 15.65 7.65 3.15 23.30 41,893 26.30 9.71 4.67 11.92 11.67 3.05 23.59 32,032 35.64 11.57 5.84 18.22 8.69 2.88 26.91 95,466 31.39 10.25 5.46 15.67 7.53 3.03 23.20 217,624 31.14 10.47 5.35 15.32 8.52 3.04 23.84
23,693 28.22 10.53 4.82 12.87 6.70 2.65 19.57 55,208 29.21 10.65 5.14 13.42 10.36 2.79 23.78 41,494 23.22 8.98 4.23 10.02 9.65 2.71 19.67 338,789 26.52 9.96 4.94 11.61 7.05 2.60 18.66 459,184 26.63 9.99 4.90 11.75 7.66 2.64 19.41
131,625 28.01 6.65 4.39 16.97 17.82 5.75 34.79 84,711 19.83 6.34 3.65 9.84 10.15 3.16 19.99 18,584 24.27 7.79 4.19 12.30 14.25 4.46 26.55 5,899 23.38 8.04 3.90 11.44 11.43 3.49 22.87 70,585 27.30 5.54 4.02 17.74 25.06 6.52 42.80 19,817 23.92 8.49 4.50 10.93 12.27 2.67 23.20 35,425 25.00 7.47 4.76 12.76 13.97 4.36 26.73 4,409 23.88 8.91 4.08 10.89 7.85 2.68 18.74 371,055 25.19 6.65 4.17 14.37 16.38 4.87 30.75
8,000 11.31 4.21 2.13 4.98 4.15 1.38 9.13 565,155 27.37 6.05 3.93 17.39 18.43 4.30 35.82 16,465 23.13 6.47 4.00 12.66 18.96 3.21 31.62 48,489 22.76 6.88 3.99 11.89 12.88 3.91 24.77 86,916 27.29 6.89 4.13 16.27 9.82 2.16 26.09 725,025 26.78 6.20 3.94 16.64 16.88 3.96 33.52
2,311 41.76 13.41 5.37 22.98 7.79 2.12 30.77
686,871 28.12 8.35 4.62 15.14 16.09 3.09 31.23 875,779 29.41 8.94 4.87 15.60 13.12 3.46 28.72 1,775,057 27.58 8.73 4.71 14.14 16.01 3.41 30.15 1,096,080 26.24 6.35 4.02 15.87 16.71 4.27 32.58 4,570,410 27.77 8.22 4.58 14.98 15.58 3.66 30.56
686,871 25.64 7.61 4.16 13.87 — 3.01 — 875,779 26.91 8.21 4.42 14.29 — 3.26 — 1,775,057 25.06 8.06 4.19 12.81 — 3.25 — 1,096,080 23.64 5.74 3.62 14.27 — 4.18 — 4,570,410 25.26 7.54 4.10 13.61 — 3.51 —
Subprime loans Percent of loans with installments past due Percent of loans in foreclosure
Number Inventory Started Seriouslyof loans Total 90 days at end of during Delinquentserviced past due 30 days 60 days or more quarter quarter (90+ FC Inv)

6 National Delinquency Survey from the Mortgage Bankers Association • Fourth Quarter 2009 © Mortgage Bankers Association February 2010. All Rights Reserved.
National Delinquency Survey, Fourth Quarter 2009
Connecticut 47,880 14.10 5.98 2.76 5.36 3.68 1.20 9.04Maine 11,888 13.09 6.10 2.53 4.46 3.67 1.10 8.13Massachusetts 48,007 12.01 5.23 2.07 4.71 2.90 0.93 7.61New Hampshire 13,184 9.97 4.48 1.88 3.61 1.94 0.83 5.55Rhode Island 11,111 12.22 5.21 2.19 4.82 3.62 1.45 8.44Vermont 3,350 11.40 5.55 2.24 3.61 2.72 0.93 6.33New England 135,420 12.65 5.50 2.35 4.79 3.20 1.07 7.99
New Jersey 125,606 15.76 6.50 2.92 6.34 6.69 1.75 13.03New York 186,162 14.51 6.16 2.60 5.76 3.56 0.86 9.32Pennsylvania 204,090 13.64 6.72 2.65 4.27 2.54 0.74 6.81Mid Atlantic 515,858 14.47 6.46 2.70 5.31 3.92 1.03 9.23
Illinois 188,680 17.20 6.82 3.11 7.27 5.55 1.78 12.82Indiana 163,348 16.58 7.05 2.97 6.56 4.93 1.76 11.49Michigan 155,251 20.42 7.23 3.68 9.51 7.21 2.47 16.72Ohio 238,662 16.11 6.57 2.98 6.57 5.61 1.75 12.18Wisconsin 59,300 12.56 4.94 2.34 5.28 4.30 1.34 9.58East North Central 805,241 17.03 6.73 3.10 7.20 5.67 1.87 12.87
Iowa 45,404 11.39 5.10 2.24 4.05 3.51 0.95 7.56Kansas 53,751 11.77 5.59 2.18 4.00 2.77 1.01 6.77Minnesota 92,140 9.14 3.84 1.59 3.71 3.29 1.00 7.00Missouri 127,030 13.92 6.19 2.64 5.09 2.08 1.06 7.17Nebraska 36,250 8.84 4.29 1.78 2.77 1.79 0.77 4.56North Dakota 10,329 5.27 2.89 1.05 1.33 1.10 0.59 2.43South Dakota 9,146 8.05 4.00 1.43 2.61 1.73 0.56 4.34West North Central 374,050 11.25 5.06 2.11 4.08 2.59 0.97 6.67
Delaware 18,187 15.74 6.79 3.08 5.87 3.51 1.10 9.38District of Columbia 7,927 11.25 4.93 2.17 4.15 1.83 0.69 5.98Florida 266,514 16.19 6.14 3.00 7.04 8.74 2.19 15.78Georgia 270,984 22.42 8.37 4.14 9.91 3.96 1.70 13.87Maryland 119,435 15.40 6.58 2.92 5.89 3.12 1.15 9.01North Carolina 170,987 18.55 7.70 3.33 7.53 2.84 1.11 10.37South Carolina 69,360 17.17 7.38 3.12 6.67 2.76 0.87 9.43Virginia 155,620 12.67 5.72 2.49 4.46 1.48 0.75 5.94West Virginia 14,250 15.62 7.71 3.19 4.73 2.13 0.95 6.86South Atlantic 1,093,264 17.53 7.03 3.26 7.24 4.38 1.45 11.62
Alabama 95,393 18.46 8.09 3.50 6.88 2.19 1.04 9.07Kentucky 78,237 15.17 6.88 2.91 5.39 3.49 1.28 8.88Mississippi 44,769 19.29 8.45 3.72 7.13 2.66 1.13 9.79Tennessee 158,986 15.65 6.91 2.89 5.85 2.26 1.06 8.11East South Central 377,385 16.70 7.38 3.15 6.17 2.55 1.11 8.72
Arkansas 63,552 13.30 6.43 2.48 4.39 2.28 1.02 6.67Louisiana 74,518 17.20 7.68 3.30 6.21 3.26 1.15 9.47Oklahoma 92,102 12.00 5.73 2.30 3.97 2.83 1.03 6.80Texas 616,749 16.57 7.20 3.19 6.19 2.05 0.94 8.24West South Central 846,921 15.88 7.02 3.05 5.82 2.26 0.97 8.08
Arizona 119,324 13.75 5.09 2.55 6.11 4.07 2.07 10.18Colorado 141,057 11.42 4.64 2.03 4.75 3.49 1.34 8.24Idaho 36,271 11.24 5.31 2.16 3.77 2.99 1.39 6.76Montana 18,366 8.71 4.30 1.86 2.55 1.51 0.67 4.06Nevada 57,543 13.03 4.52 2.15 6.36 5.17 2.11 11.53New Mexico 34,799 12.40 6.00 2.34 4.07 2.83 0.98 6.90Utah 82,833 10.65 4.66 1.95 4.05 2.35 1.18 6.40Wyoming 9,231 9.87 4.56 2.01 3.29 1.67 0.80 4.96Mountain 499,424 11.96 4.86 2.18 4.92 3.44 1.52 8.36
Alaska 15,974 7.21 3.79 1.48 1.93 1.22 0.50 3.15California 296,653 8.54 3.58 1.57 3.39 2.07 0.88 5.46Hawaii 6,444 8.69 3.60 1.57 3.52 1.58 0.53 5.10Oregon 48,804 9.90 4.18 1.77 3.95 2.52 1.07 6.47Washington 102,009 11.00 4.37 1.89 4.75 2.06 0.89 6.81Pacific 469,884 9.17 3.82 1.66 3.69 2.08 0.88 5.77
Puerto Rico 3,464 23.07 7.27 3.46 12.33 7.22 1.13 19.55
Northeast 651,278 14.09 6.26 2.62 5.20 3.77 1.04 8.97North Central 1,179,291 15.20 6.20 2.78 6.21 4.69 1.58 10.90South 2,317,570 16.79 7.08 3.16 6.55 3.31 1.22 9.86West 969,308 10.61 4.36 1.93 4.32 2.78 1.21 7.10United States 5,168,134 14.82 6.22 2.75 5.85 3.57 1.28 9.42
Northeast (SA) 651,278 12.69 5.65 2.33 4.72 — 1.09 —North Central (SA) 1,179,291 13.72 5.61 2.47 5.64 — 1.54 —South (SA) 2,317,570 15.26 6.60 2.79 5.86 — 1.21 —West (SA) 969,308 9.95 4.18 1.76 4.01 — 1.24 —United States (SA) 5,168,134 13.57 5.80 2.46 5.30 — 1.27 —
FHA loans Percent of loans with installments past due Percent of loans in foreclosure Number Inventory Started SeriouslyState, area and of loans Total 90 days at end of during Delinquentcensus region serviced past due 30 days 60 days or more quarter quarter (90+ FC Inv)
4,003 8.59 4.02 1.47 3.10 2.77 0.75 5.87 3,685 8.44 4.02 1.47 2.96 3.45 0.73 6.41 5,115 9.46 4.50 1.58 3.38 2.83 0.78 6.21 3,176 8.88 4.03 1.48 3.37 2.20 0.79 5.57 1,205 5.39 2.66 1.00 1.74 2.07 0.75 3.81 965 6.84 3.21 1.76 1.87 2.80 1.14 4.67 18,149 8.55 4.02 1.49 3.04 2.78 0.78 5.82
10,315 10.60 4.88 2.00 3.72 4.92 1.10 8.64 21,083 8.97 4.26 1.78 2.94 2.83 0.64 5.77 29,505 9.41 4.83 1.68 2.89 2.51 0.61 5.40 60,903 9.46 4.64 1.77 3.05 3.03 0.70 6.08
25,998 10.08 4.50 1.96 3.62 3.96 1.26 7.58 21,938 11.70 5.02 2.03 4.65 4.60 1.39 9.25 16,197 13.37 5.36 2.67 5.34 5.06 1.99 10.40 37,719 10.69 4.64 1.92 4.13 5.09 1.17 9.22 12,036 7.93 3.34 1.50 3.08 3.85 1.12 6.93 113,888 10.84 4.65 2.01 4.18 4.60 1.35 8.78
7,811 7.05 3.34 1.32 2.39 3.00 0.74 5.39 14,468 7.12 3.47 1.23 2.42 2.06 0.62 4.48 12,475 7.26 3.25 1.43 2.58 2.47 0.82 5.05 23,416 8.03 3.68 1.58 2.77 1.67 0.71 4.44 12,015 5.54 2.84 1.04 1.66 1.77 0.66 3.43 2,924 4.55 2.46 0.85 1.23 1.09 0.24 2.32 3,943 4.82 1.85 0.96 2.00 1.72 0.58 3.72 77,052 6.95 3.26 1.32 2.37 2.00 0.68 4.37
4,823 9.70 4.02 1.80 3.88 3.46 1.02 7.34 688 5.81 2.33 0.87 2.62 2.03 0.44 4.65 85,826 8.47 3.47 1.53 3.47 5.33 1.26 8.80 70,522 10.46 4.73 1.84 3.90 2.10 0.86 6.00 27,932 7.32 3.58 1.32 2.42 1.99 0.60 4.41 83,366 8.66 3.95 1.57 3.14 1.60 0.62 4.74 26,877 8.94 4.01 1.69 3.24 2.36 0.71 5.60 79,860 6.37 3.00 1.19 2.17 1.26 0.50 3.43 4,378 9.14 4.71 1.76 2.67 2.19 0.69 4.86 384,272 8.41 3.77 1.53 3.11 2.56 0.79 5.67
31,736 8.73 4.31 1.49 2.94 1.56 0.69 4.50 19,211 8.95 4.36 1.72 2.86 3.28 1.01 6.14 10,342 10.69 4.80 2.04 3.86 2.31 0.87 6.17 38,391 9.07 4.13 1.69 3.25 1.70 0.68 4.95 99,680 9.11 4.30 1.67 3.14 2.02 0.77 5.16
16,803 7.74 3.91 1.39 2.44 1.55 0.66 3.99 17,002 9.40 4.37 1.78 3.25 2.63 0.82 5.88 26,948 7.06 3.44 1.34 2.27 2.38 0.70 4.65 167,819 8.28 3.97 1.55 2.75 1.38 0.61 4.13 228,572 8.18 3.94 1.53 2.71 1.61 0.64 4.32
33,079 7.39 3.15 1.38 2.86 3.08 1.34 5.94 37,213 6.72 2.96 1.25 2.51 2.74 0.89 5.25 8,299 6.76 3.25 1.18 2.33 2.16 0.82 4.49 5,330 5.59 3.11 1.03 1.44 1.67 0.53 3.11 14,905 7.70 3.17 1.40 3.13 3.44 1.40 6.57 13,271 6.22 3.38 1.03 1.81 2.06 0.57 3.87 9,503 6.25 2.96 1.13 2.17 1.87 0.86 4.04 3,302 6.45 3.12 1.39 1.94 1.48 0.73 3.42 124,902 6.87 3.11 1.26 2.50 2.66 1.01 5.16
11,564 4.30 2.15 0.81 1.33 1.26 0.49 2.59 45,109 6.03 2.80 0.98 2.25 1.89 0.82 4.14 4,777 5.15 2.30 1.07 1.78 3.39 1.09 5.17 12,571 7.27 3.17 1.22 2.88 2.80 0.91 5.68 43,052 6.73 2.83 1.12 2.78 1.50 0.50 4.28 117,073 6.22 2.77 1.05 2.40 1.84 0.69 4.24
180 10.00 3.89 0.56 5.56 3.89 0.56 9.45
79,052 9.25 4.50 1.71 3.05 2.97 0.72 6.02 190,940 9.27 4.09 1.73 3.45 3.55 1.08 7.00 712,524 8.43 3.90 1.55 2.99 2.18 0.74 5.17 241,975 6.55 2.94 1.16 2.45 2.26 0.86 4.71 1,228,066 8.24 3.77 1.51 2.96 2.46 0.81 5.42
79,052 8.24 4.01 1.46 2.77 — 0.68 — 190,940 8.32 3.67 1.52 3.12 — 1.01 — 712,524 7.59 3.59 1.34 2.66 — 0.68 — 241,975 5.89 2.61 1.03 2.25 — 0.81 — 1,228,066 7.41 3.44 1.31 2.66 — 0.76 —
VA loans Percent of loans with installments past due Percent of loans in foreclosure
Number Inventory Started Seriouslyof loans Total 90 days at end of during Delinquentserviced past due 30 days 60 days or more quarter quarter (90+ FC Inv)

National Delinquency Survey from the Mortgage Bankers Association • Fourth Quarter 2009 7 © Mortgage Bankers Association February 2010. All Rights Reserved.
Connecticut 351,891 5.54 2.25 0.89 2.40 1.50 0.46 3.90Maine 101,243 5.89 2.65 0.86 2.38 2.22 0.51 4.60Massachusetts 585,735 6.26 2.48 0.95 2.83 1.42 0.41 4.25New Hampshire 147,635 5.71 2.52 0.97 2.23 1.38 0.52 3.61Rhode Island 96,891 7.29 2.74 1.20 3.35 1.86 0.58 5.21Vermont 55,380 3.93 1.94 0.61 1.38 1.35 0.30 2.73New England 1,338,775 5.96 2.43 0.93 2.59 1.53 0.45 4.12
New Jersey 873,568 6.25 2.43 0.99 2.84 2.53 0.61 5.37New York 1,403,644 5.99 2.38 0.96 2.65 1.74 0.39 4.39Pennsylvania 1,032,294 5.64 2.51 0.93 2.20 1.41 0.37 3.61Mid Atlantic 3,309,506 5.95 2.43 0.96 2.56 1.85 0.44 4.41
Illinois 1,119,649 6.88 2.41 1.06 3.41 2.63 0.71 6.04Indiana 505,752 6.61 2.85 1.01 2.75 2.39 0.69 5.14Michigan 872,171 7.57 2.80 1.25 3.53 2.61 0.95 6.14Ohio 893,198 6.49 2.76 1.06 2.68 2.60 0.72 5.28Wisconsin 421,036 4.73 1.85 0.77 2.10 1.94 0.57 4.04East North Central 3,811,806 6.67 2.58 1.07 3.03 2.51 0.75 5.54
Iowa 249,530 4.47 2.02 0.74 1.71 1.58 0.46 3.29Kansas 214,966 4.64 2.11 0.77 1.77 1.27 0.41 3.04Minnesota 635,390 4.90 1.86 0.81 2.24 1.78 0.57 4.02Missouri 564,853 5.54 2.40 0.96 2.18 1.24 0.50 3.42Nebraska 135,710 3.46 1.83 0.52 1.11 1.15 0.44 2.26North Dakota 38,891 1.98 1.08 0.26 0.65 0.53 0.13 1.18South Dakota 59,699 2.50 1.19 0.39 0.91 0.83 0.20 1.74West North Central 1,899,039 4.77 2.03 0.79 1.94 1.43 0.48 3.37
Delaware 109,922 5.16 2.13 0.85 2.18 1.52 0.43 3.70District of Columbia 60,014 5.29 2.13 0.86 2.29 1.13 0.39 3.42Florida 1,982,987 9.27 2.82 1.44 5.00 6.62 1.62 11.62Georgia 987,350 8.53 3.32 1.45 3.76 2.10 0.87 5.86Maryland 675,182 6.40 2.43 1.00 2.97 1.48 0.47 4.45North Carolina 918,838 6.32 2.71 1.04 2.57 1.15 0.46 3.72South Carolina 428,531 6.82 2.98 1.15 2.69 2.00 0.63 4.69Virginia 891,518 4.55 1.88 0.74 1.92 0.89 0.37 2.81West Virginia 91,578 6.56 3.34 1.13 2.09 1.21 0.46 3.30South Atlantic 6,145,920 7.39 2.71 1.19 3.49 3.13 0.90 6.62
Alabama 381,956 7.13 3.31 1.15 2.68 1.41 0.55 4.09Kentucky 264,626 5.24 2.45 0.89 1.90 1.65 0.50 3.55Mississippi 137,095 8.91 4.20 1.52 3.19 1.89 0.67 5.08Tennessee 512,968 6.22 2.82 1.01 2.39 1.29 0.50 3.68East South Central 1,296,645 6.57 3.03 1.08 2.46 1.46 0.53 3.92
Arkansas 186,222 5.54 2.60 0.87 2.07 1.22 0.51 3.29Louisiana 287,165 6.73 3.22 1.11 2.40 1.69 0.50 4.09Oklahoma 221,523 5.11 2.48 0.86 1.77 1.57 0.48 3.34Texas 1,773,456 5.36 2.56 0.90 1.90 0.98 0.39 2.88West South Central 2,468,366 5.51 2.63 0.92 1.96 1.14 0.42 3.10
Arizona 689,016 8.73 2.43 1.36 4.94 3.01 1.24 7.95Colorado 601,092 3.79 1.57 0.61 1.62 1.20 0.45 2.82Idaho 165,039 5.10 2.04 0.79 2.26 2.05 0.75 4.31Montana 95,398 3.30 1.48 0.49 1.33 1.04 0.35 2.37Nevada 283,867 10.41 2.54 1.60 6.27 4.31 1.67 10.58New Mexico 166,166 5.41 2.37 0.91 2.14 1.59 0.43 3.73Utah 268,452 5.45 2.08 0.88 2.49 1.65 0.68 4.14Wyoming 48,814 2.86 1.56 0.44 0.85 0.72 0.27 1.57Mountain 2,317,844 6.43 2.09 1.01 3.33 2.24 0.87 5.57
Alaska 52,624 2.64 1.24 0.49 0.91 0.74 0.25 1.65California 3,403,874 6.53 1.87 0.97 3.69 1.74 0.52 5.43Hawaii 117,214 4.17 1.47 0.71 1.98 1.66 0.56 3.64Oregon 446,427 4.23 1.57 0.71 1.96 1.37 0.52 3.33Washington 779,263 4.25 1.52 0.65 2.08 0.81 0.21 2.89Pacific 4,799,402 5.85 1.77 0.88 3.20 1.54 0.47 4.74
Puerto Rico 8,218 13.56 5.11 2.13 6.32 1.74 0.54 8.06
Northeast 4,648,281 5.95 2.43 0.95 2.57 1.76 0.44 4.33North Central 5,710,845 6.04 2.39 0.97 2.67 2.15 0.66 4.82South 9,910,931 6.81 2.73 1.11 2.97 2.42 0.73 5.39West 7,117,246 6.04 1.87 0.92 3.24 1.77 0.60 5.01United States 27,396,312 6.31 2.39 1.01 2.91 2.08 0.63 4.99
Northeast (SA) 4,648,281 5.31 2.13 0.82 2.36 — 0.43 —North Central (SA) 5,710,845 5.40 2.11 0.86 2.44 — 0.61 —South (SA) 9,910,931 6.07 2.48 0.97 2.61 — 0.66 —West (SA) 7,117,246 5.39 1.64 0.83 2.93 — 0.58 —United States (SA) 27,396,312 5.60 2.14 0.88 2.59 — 0.57 —
Prime FRMs Percent of loans with installments past due Percent of loans in foreclosure Number Inventory Started SeriouslyState, area and of loans Total 90 days at end of during Delinquentcensus region serviced past due 30 days 60 days or more quarter quarter (90+ FC Inv)
31,288 27.57 9.09 5.23 13.26 10.74 3.19 24.00 10,420 24.75 9.72 3.98 11.05 12.39 2.29 23.44 42,180 32.22 9.15 4.94 18.12 9.02 2.47 27.14 11,915 25.70 9.81 4.41 11.47 7.59 2.52 19.06 8,855 29.80 9.68 5.40 14.73 10.41 3.31 25.14 2,337 26.10 9.07 4.92 12.11 11.00 3.00 23.11 106,995 29.07 9.30 4.91 14.86 9.85 2.75 24.71
64,953 25.31 7.99 4.24 13.08 13.45 3.01 26.53 150,629 25.31 8.38 4.28 12.65 9.88 2.35 22.53 128,947 25.58 9.25 4.67 11.65 6.84 2.03 18.49 344,529 25.41 8.63 4.42 12.36 9.41 2.35 21.77
94,682 29.23 9.02 5.06 15.14 11.07 3.36 26.21 65,856 26.87 9.42 4.63 12.82 8.61 2.88 21.43 89,401 32.09 9.95 5.32 16.82 7.40 2.51 24.22 124,352 26.38 9.04 4.51 12.83 9.58 2.63 22.41 28,101 26.75 8.76 4.49 13.50 11.00 3.12 24.50 402,392 28.42 9.28 4.84 14.31 9.39 2.85 23.70
16,279 23.79 8.44 4.12 11.23 9.18 2.77 20.41 18,046 20.49 7.38 3.64 9.47 6.07 2.32 15.54 31,037 24.97 8.24 4.36 12.37 9.29 3.04 21.66 53,723 27.38 9.80 4.93 12.65 5.18 2.42 17.83 10,384 20.74 7.89 3.68 9.18 6.00 2.25 15.18 1,375 18.62 7.05 2.84 8.73 5.75 1.02 14.48 2,889 17.20 6.16 3.12 7.93 8.24 2.73 16.17 133,733 24.63 8.69 4.37 11.57 6.88 2.57 18.45
10,114 23.38 9.30 3.99 10.09 10.00 2.94 20.09 3,672 25.95 8.03 4.66 13.26 8.06 2.15 21.32 245,071 27.87 8.13 4.64 15.10 18.87 3.93 33.97 93,963 30.48 9.91 5.31 15.25 7.48 3.01 22.73 57,802 29.67 9.41 5.16 15.10 8.15 2.44 23.25 79,786 27.15 10.30 4.95 11.90 5.80 2.47 17.70 45,813 27.12 10.42 4.77 11.92 8.09 2.27 20.01 62,452 26.57 9.56 4.80 12.21 5.48 2.31 17.69 11,274 24.00 8.90 3.98 11.12 4.15 1.37 15.27 609,947 28.00 9.16 4.84 14.00 11.72 3.09 25.72
34,004 28.88 10.74 4.67 13.47 5.06 2.33 18.53 29,426 24.49 9.49 4.45 10.55 8.09 2.56 18.64 21,944 34.16 11.82 5.85 16.49 6.12 2.37 22.61 66,385 28.29 10.32 4.82 13.15 5.37 2.45 18.52 151,759 28.53 10.47 4.86 13.20 5.93 2.43 19.13
16,884 25.91 10.30 4.42 11.19 4.59 1.98 15.78 40,133 26.63 10.60 4.45 11.58 7.22 2.18 18.80 31,136 19.20 7.47 3.64 8.09 6.58 2.03 14.67 235,710 24.29 9.78 4.58 9.93 5.12 1.96 15.05 323,863 24.17 9.69 4.46 10.02 5.49 1.99 15.51
58,781 27.79 7.74 4.67 15.37 10.72 4.45 26.09 40,345 19.50 6.93 3.47 9.10 6.39 2.37 15.49 10,472 22.76 8.42 3.84 10.49 8.17 2.98 18.66 3,948 17.12 6.18 2.96 7.98 7.65 2.48 15.63 27,810 27.30 6.43 4.20 16.67 13.98 5.07 30.65 13,043 22.32 8.42 4.17 9.73 8.29 1.86 18.02 16,759 22.99 7.27 3.99 11.73 8.64 3.37 20.37 2,372 21.21 7.88 3.58 9.74 5.02 1.85 14.76 173,530 24.27 7.35 4.11 12.81 9.55 3.60 22.36
6,603 7.56 3.30 1.44 2.82 1.91 0.76 4.73 262,993 25.16 6.97 4.06 14.14 9.05 2.98 23.19 9,950 21.83 6.90 3.88 11.05 10.00 2.32 21.05 25,937 21.21 7.33 3.84 10.05 7.85 2.86 17.90 42,282 24.10 7.31 3.96 12.83 5.57 1.75 18.40 347,765 24.31 6.96 3.98 13.37 8.43 2.76 21.80
1,859 45.88 14.58 6.02 25.28 7.69 — 32.97
451,524 26.28 8.79 4.54 12.95 9.52 2.45 22.47 536,125 27.48 9.13 4.72 13.62 8.76 2.78 22.38 1,085,569 26.93 9.50 4.73 12.70 9.06 2.67 21.76 521,295 24.30 7.09 4.02 13.18 8.80 3.04 21.98 2,596,506 26.42 8.82 4.55 13.04 9.02 2.73 22.06
451,524 23.82 7.94 4.07 11.82 — 2.43 — 536,125 24.92 8.17 4.24 12.51 — 2.68 — 1,085,569 24.34 8.64 4.17 11.53 — 2.49 — 521,295 22.08 6.27 3.55 12.27 — 2.96 — 2,596,506 23.83 7.95 4.01 11.87 — 2.61 —
Subprime FRMs Percent of loans with installments past due Percent of loans in foreclosure
Number Inventory Started Seriouslyof loans Total 90 days at end of during Delinquentserviced past due 30 days 60 days or more quarter quarter (90+ FC Inv)

8 National Delinquency Survey from the Mortgage Bankers Association • Fourth Quarter 2009 © Mortgage Bankers Association February 2010. All Rights Reserved.
National Delinquency Survey, Fourth Quarter 2009
Connecticut 45,242 12.10 5.40 2.19 4.51 3.31 0.93 7.82Maine 11,383 9.33 4.93 1.64 2.76 1.55 0.02 4.31Massachusetts 45,449 11.46 5.05 1.85 4.56 2.53 0.76 7.09New Hampshire 11,444 7.10 3.64 1.04 2.42 1.16 0.27 3.58Rhode Island 10,367 10.00 4.22 1.73 4.05 2.93 0.95 6.98Vermont 2,768 4.01 1.52 0.14 2.35 1.08 0.33 3.43New England 126,653 10.82 4.89 1.83 4.10 2.60 0.71 6.70
New Jersey 120,641 15.50 6.43 2.90 6.16 6.42 1.66 12.58New York 181,084 14.06 5.92 2.55 5.58 3.44 0.65 9.02Pennsylvania 175,160 13.08 6.19 2.54 4.35 2.61 0.73 6.96Mid Atlantic 476,885 14.06 6.15 2.64 5.28 3.89 0.93 9.17
Illinois 177,807 17.03 6.72 3.07 7.25 5.35 1.71 12.60Indiana 155,807 16.28 6.90 2.91 6.47 4.85 1.70 11.32Michigan 147,945 19.95 7.09 3.59 9.27 7.03 2.43 16.30Ohio 227,837 15.90 6.47 2.91 6.52 5.56 1.73 12.08Wisconsin 57,917 11.41 4.40 2.18 4.83 3.94 1.03 8.77East North Central 767,313 16.68 6.58 3.02 7.08 5.53 1.80 12.61
Iowa 44,132 9.63 4.72 1.89 3.01 2.89 0.72 5.90Kansas 51,565 10.78 5.34 1.57 3.88 2.26 0.27 6.14Minnesota 85,416 8.93 3.78 1.52 3.63 3.11 0.92 6.74Missouri 122,397 13.56 6.03 2.54 4.99 1.96 0.90 6.95Nebraska 35,061 7.28 3.46 1.20 2.61 1.38 0.48 3.99North Dakota 5,001 0.62 0.52 0.00 0.10 0.06 0.04 0.16South Dakota 8,705 3.87 1.93 0.77 1.17 0.15 0.00 1.32West North Central 352,277 10.49 4.78 1.86 3.85 2.27 0.71 6.12
Delaware 16,776 14.02 6.12 2.63 5.28 3.21 0.23 8.49District of Columbia 7,187 9.59 4.27 1.60 3.72 1.38 0.31 5.10Florida 256,065 16.15 6.09 2.96 7.10 8.76 2.16 15.86Georgia 251,640 22.12 8.28 4.08 9.76 3.86 1.64 13.62Maryland 111,603 15.19 6.49 2.86 5.84 3.00 1.00 8.84North Carolina 161,192 18.10 7.66 3.20 7.25 2.69 1.03 9.94South Carolina 62,704 16.33 6.66 3.02 6.66 2.45 0.74 9.11Virginia 147,705 12.49 5.63 2.43 4.42 1.40 0.69 5.82West Virginia 12,305 14.53 7.35 2.72 4.46 1.89 0.76 6.35South Atlantic 1,027,177 17.20 6.89 3.17 7.14 4.31 1.37 11.45
Alabama 92,709 18.00 7.91 3.34 6.75 2.07 0.92 8.82Kentucky 62,485 13.63 6.24 2.49 4.90 3.37 1.18 8.27Mississippi 39,879 18.24 8.03 3.38 6.83 2.43 0.78 9.26Tennessee 153,856 14.84 6.76 2.39 5.69 2.19 1.02 7.88East South Central 348,929 15.85 7.12 2.78 5.96 2.40 1.00 8.36
Arkansas 59,946 10.65 5.16 1.50 3.99 1.21 0.40 5.20Louisiana 66,666 15.35 6.58 2.68 6.09 3.01 1.00 9.10Oklahoma 82,319 10.02 4.68 1.65 3.69 2.74 0.64 6.43Texas 603,996 16.40 7.12 3.12 6.16 2.00 0.91 8.16West South Central 812,927 15.25 6.69 2.82 5.74 2.10 0.85 7.84
Arizona 114,253 13.50 4.96 2.47 6.06 3.96 2.02 10.02Colorado 117,383 11.04 4.47 1.91 4.66 3.31 1.27 7.97Idaho 26,693 11.13 4.98 1.93 4.22 3.17 1.35 7.39Montana 13,803 5.45 2.80 0.44 2.20 0.70 0.30 2.90Nevada 55,373 12.37 4.28 1.87 6.22 5.04 2.07 11.26New Mexico 33,262 10.15 5.10 1.64 3.42 2.44 0.81 5.86Utah 70,613 10.51 4.41 1.97 4.13 2.35 1.06 6.48Wyoming 7,725 4.71 2.85 0.75 1.11 0.00 0.00 1.11Mountain 439,105 11.41 4.56 1.98 4.88 3.33 1.45 8.21
Alaska 11,973 6.29 3.26 1.23 1.80 0.71 0.28 2.51California 278,958 8.12 3.43 1.47 3.21 1.82 0.77 5.03Hawaii 5,838 3.94 1.90 0.05 1.99 1.03 0.27 3.02Oregon 46,776 8.93 3.79 1.54 3.60 2.15 0.91 5.75Washington 95,015 10.61 4.20 1.79 4.62 1.88 0.79 6.50Pacific 438,560 8.64 3.61 1.52 3.51 1.83 0.77 5.34
Puerto Rico 0 — — — — — — —
Northeast 603,538 13.38 5.89 2.47 5.03 3.62 0.89 8.65North Central 1,119,590 14.73 6.01 2.65 6.07 4.50 1.46 10.57South 2,189,033 16.26 6.85 2.98 6.43 3.19 1.12 9.62West 877,665 10.03 4.09 1.75 4.19 2.58 1.11 6.77United States 4,789,826 14.40 6.03 2.61 5.76 3.44 1.17 9.20
Northeast (SA) 603,538 11.90 5.18 2.10 4.61 — 0.83 —North Central (SA) 1,119,590 13.24 5.39 2.34 5.51 — 1.35 —South (SA) 2,189,033 14.58 6.29 2.56 5.72 — 1.01 —West (SA) 877,665 9.04 3.65 1.56 3.83 — 1.04 —United States (SA) 4,789,826 12.94 5.50 2.27 5.18 — 1.08 —
FHA FRMs Percent of loans with installments past due Percent of loans in foreclosure Number Inventory Started SeriouslyState, area and of loans Total 90 days at end of during Delinquentcensus region serviced past due 30 days 60 days or more quarter quarter (90+ FC Inv)
1,232 14.12 6.57 3.00 4.55 4.46 1.54 9.01 282 14.54 6.03 3.90 4.61 4.26 1.06 8.87 1,887 16.85 7.53 2.76 6.57 6.36 1.54 12.93 333 13.51 6.31 2.70 4.50 3.00 0.60 7.50 478 15.69 6.69 2.93 6.07 7.53 1.26 13.60 97 16.49 11.34 1.03 4.12 7.22 2.06 11.34 4,309 15.53 7.06 2.88 5.59 5.57 1.42 11.16
4,206 14.22 6.06 2.64 5.52 6.59 1.19 12.11 4,249 16.69 7.65 3.13 5.91 5.22 1.32 11.13 4,106 16.32 8.16 2.85 5.31 3.90 0.73 9.21 12,561 15.74 7.28 2.87 5.58 5.25 1.08 10.83
9,742 18.70 7.70 3.33 7.68 7.63 2.18 15.31 5,472 19.28 8.11 3.47 7.69 6.87 2.10 14.56 5,510 27.57 9.09 4.74 13.74 9.40 3.38 23.14 7,325 20.90 8.35 3.59 8.96 7.75 2.09 16.71 1,146 13.61 4.62 3.49 5.50 5.93 1.31 11.43 29,195 20.84 8.08 3.69 9.06 7.79 2.33 16.85
915 9.84 4.04 1.64 4.15 4.37 1.09 8.52 1,005 13.53 5.67 3.08 4.78 2.39 0.40 7.17 5,776 9.33 3.90 1.54 3.90 5.45 1.59 9.35 3,041 17.00 8.16 2.89 5.95 2.50 0.79 8.45 488 9.63 4.10 2.66 2.87 3.07 1.23 5.94 127 2.36 1.57 0.00 0.79 0.79 0.79 1.58 97 12.37 5.15 4.12 3.09 1.03 0.00 4.12 11,449 11.74 5.19 2.10 4.45 4.12 1.20 8.57
574 14.46 6.45 3.14 4.88 3.31 0.70 8.19 446 14.57 5.16 2.47 6.95 1.79 0.45 8.74 7,002 15.98 6.80 3.20 5.98 8.37 1.81 14.35 11,350 26.37 9.90 4.74 11.73 5.79 2.30 17.52 7,104 15.58 7.28 2.65 5.66 3.20 1.20 8.86 8,249 21.46 7.98 4.12 9.36 4.42 1.43 13.78 1,915 21.57 9.66 3.08 8.83 5.59 1.51 14.42 7,423 13.24 6.28 2.61 4.35 1.79 0.94 6.14 310 26.45 11.29 6.45 8.71 7.10 3.23 15.81 44,373 19.41 7.94 3.59 7.89 4.79 1.59 12.68
1,953 23.35 10.09 4.05 9.22 3.69 1.28 12.91 1,581 13.98 7.02 2.40 4.55 5.44 1.52 9.99 568 25.35 11.62 4.75 8.98 5.63 1.94 14.61 4,242 19.28 8.20 3.72 7.36 3.23 1.49 10.59 8,344 19.64 8.65 3.62 7.37 3.92 1.47 11.29
645 13.18 6.67 3.10 3.41 3.10 1.55 6.51 702 26.07 10.40 4.99 10.68 5.98 1.28 16.66 918 11.87 6.32 1.74 3.81 2.72 0.87 6.53 8,678 18.15 8.62 3.57 5.96 2.41 0.88 8.37 10,943 17.84 8.43 3.48 5.93 2.70 0.94 8.63
3,675 17.71 7.21 3.76 6.75 5.06 2.39 11.81 8,610 14.00 5.19 2.23 6.57 5.87 2.06 12.44 741 14.04 6.48 3.37 4.18 4.18 1.75 8.36 287 8.71 4.18 1.05 3.48 2.09 0.70 5.57 1,432 15.57 5.31 3.14 7.12 8.17 3.07 15.29 746 11.26 5.50 2.14 3.62 3.89 0.94 7.51 2,275 13.71 5.27 2.55 5.89 3.34 1.49 9.23 102 9.80 5.88 1.96 1.96 0.00 0.00 1.96 17,868 14.63 5.68 2.68 6.27 5.32 2.04 11.59
354 9.60 5.08 1.98 2.54 1.69 0.85 4.23 9,400 10.67 4.98 1.88 3.81 2.60 1.07 6.41 289 4.15 1.73 0.35 2.08 3.11 2.08 5.19 1,717 12.41 5.47 2.10 4.83 3.96 1.69 8.79 5,176 13.52 5.45 2.07 6.01 4.23 1.80 10.24 16,936 11.58 5.12 1.94 4.53 3.22 1.37 7.75
0 — — — — — — —
16,870 15.68 7.23 2.87 5.58 5.33 1.17 10.91 40,644 18.27 7.27 3.24 7.76 6.75 2.01 14.51 63,660 19.17 8.11 3.57 7.49 4.32 1.46 11.81 34,804 13.15 5.41 2.32 5.42 4.30 1.72 9.72 155,978 17.22 7.19 3.13 6.89 5.06 1.63 11.95
16,870 13.99 6.36 2.50 5.13 — 1.13 — 40,644 16.57 6.61 2.86 7.10 — 1.96 — 63,660 17.19 7.33 3.13 6.74 — 1.33 — 34,804 11.80 4.70 2.05 5.05 — 1.66 — 155,978 15.45 6.43 2.74 6.28 — 1.56 —
FHA ARMs Percent of loans with installments past due Percent of loans in foreclosure
Number Inventory Started Seriouslyof loans Total 90 days at end of during Delinquentserviced past due 30 days 60 days or more quarter quarter (90+ FC Inv)
National Delinquency Survey from the Mortgage Bankers Association • Fourth Quarter 2009 9 © Mortgage Bankers Association February 2010. All Rights Reserved.
Connecticut 60,247 9.22 3.34 1.62 4.26 5.88 1.12 10.14Maine 7,090 10.35 4.34 1.76 4.25 8.38 1.11 12.63Massachusetts 88,957 11.75 3.70 1.84 6.22 6.99 1.32 13.21New Hampshire 13,087 11.35 4.17 1.86 5.31 5.06 1.55 10.37Rhode Island 10,949 14.77 4.69 2.38 7.69 8.04 1.94 15.73Vermont 3,990 7.74 3.08 1.50 3.16 4.99 0.73 8.15New England 184,320 10.93 3.69 1.79 5.46 6.56 1.29 12.02
New Jersey 135,887 11.35 3.67 1.95 5.73 11.63 1.72 17.36New York 183,219 10.43 3.31 1.66 5.45 7.76 1.12 13.21Pennsylvania 75,834 11.19 4.18 2.05 4.95 6.13 0.99 11.08Mid Atlantic 394,940 10.89 3.60 1.84 5.45 8.78 1.30 14.23
Illinois 189,941 11.81 3.43 1.95 6.42 11.09 1.88 17.51Indiana 39,363 11.81 4.42 2.01 5.39 7.79 1.46 13.18Michigan 130,326 13.29 4.20 2.24 6.86 7.58 1.98 14.44Ohio 89,020 10.29 3.90 1.79 4.61 7.17 1.25 11.78Wisconsin 39,301 10.43 3.55 1.79 5.09 8.69 1.37 13.78East North Central 487,951 11.82 3.81 1.99 6.02 8.98 1.72 15.00
Iowa 14,988 9.23 4.03 1.70 3.50 6.22 1.03 9.72Kansas 16,240 8.69 3.57 1.66 3.47 3.89 0.83 7.36Minnesota 78,403 10.18 3.13 1.71 5.34 8.11 1.81 13.45Missouri 51,674 10.71 4.16 1.88 4.67 3.35 0.97 8.02Nebraska 7,513 10.40 4.25 2.02 4.13 5.68 1.20 9.81North Dakota 1,823 7.35 3.73 1.10 2.52 3.62 0.93 6.14South Dakota 2,622 8.62 4.04 1.37 3.20 5.57 0.92 8.77West North Central 173,263 10.07 3.62 1.76 4.69 5.94 1.35 10.63
Delaware 12,575 9.58 3.61 1.76 4.21 6.41 1.18 10.62District of Columbia 18,658 7.95 2.72 1.41 3.82 4.32 1.31 8.14Florida 570,900 12.72 3.25 1.95 7.52 23.67 3.65 31.19Georgia 147,092 12.51 4.29 2.28 5.95 5.63 1.90 11.58Maryland 125,476 14.27 4.01 2.25 8.00 8.23 1.79 16.23North Carolina 101,545 9.77 3.55 1.71 4.51 3.67 1.06 8.18South Carolina 57,080 9.72 3.57 1.61 4.54 6.59 1.49 11.13Virginia 172,577 10.63 3.05 1.71 5.87 5.01 1.64 10.88West Virginia 7,536 13.03 5.35 2.49 5.19 5.07 1.37 10.26South Atlantic 1,213,439 12.07 3.47 1.94 6.65 14.16 2.56 20.81
Alabama 31,967 13.07 4.79 2.41 5.87 3.85 1.17 9.72Kentucky 19,051 10.70 4.43 1.97 4.30 6.32 1.02 10.62Mississippi 9,109 21.32 7.45 3.67 10.20 5.72 1.28 15.92Tennessee 39,909 12.58 4.44 2.26 5.88 4.18 1.17 10.06East South Central 100,036 13.17 4.82 2.38 5.97 4.62 1.15 10.59
Arkansas 9,905 12.58 4.53 2.17 5.88 4.03 1.01 9.91Louisiana 14,598 15.18 5.88 2.80 6.50 8.73 1.16 15.23Oklahoma 10,791 11.00 4.16 2.23 4.61 7.78 1.17 12.39Texas 134,126 9.72 3.95 1.82 3.94 3.87 1.07 7.81West South Central 169,420 10.44 4.17 1.95 4.32 4.54 1.08 8.86
Arizona 170,201 15.95 3.71 2.60 9.65 11.65 3.62 21.30Colorado 118,850 8.20 2.97 1.47 3.77 5.14 1.32 8.91Idaho 22,755 11.19 3.25 1.74 6.20 9.54 2.56 15.74Montana 6,657 9.40 2.85 1.73 4.82 5.66 1.64 10.48Nevada 113,048 20.31 3.73 2.88 13.69 17.24 5.06 30.93New Mexico 14,263 9.61 3.39 1.67 4.55 7.82 1.47 12.37Utah 34,575 11.66 3.68 2.07 5.91 8.08 2.11 13.99Wyoming 3,211 7.66 3.43 1.43 2.80 3.61 1.06 6.41Mountain 483,560 14.20 3.49 2.26 8.46 10.76 3.13 19.22
Alaska 4,812 7.29 3.08 1.21 3.01 4.09 0.91 7.10California 1,391,857 17.37 3.52 2.35 11.50 10.59 2.32 22.09Hawaii 19,434 11.96 3.10 2.08 6.78 11.07 2.66 17.85Oregon 65,017 10.54 3.14 1.81 5.59 7.15 1.95 12.74Washington 156,231 11.64 3.02 1.70 6.91 4.53 0.74 11.44Pacific 1,637,351 16.46 3.45 2.26 10.75 9.87 2.15 20.62
Puerto Rico 429 23.54 5.36 3.03 15.15 4.43 0.47 19.58
Northeast 579,260 10.91 3.63 1.82 5.45 8.08 1.30 13.53North Central 661,214 11.36 3.76 1.93 5.67 8.18 1.62 13.85South 1,482,895 11.95 3.64 1.97 6.34 12.42 2.30 18.76West 2,120,911 15.94 3.46 2.26 10.22 10.07 2.37 20.29United States 4,845,024 13.49 3.58 2.08 7.84 10.29 2.12 18.13
Northeast (SA) 579,260 10.02 3.26 1.66 5.10 — 1.29 —North Central (SA) 661,214 10.34 3.36 1.75 5.23 — 1.53 —South (SA) 1,482,895 10.68 3.31 1.76 5.61 — 2.13 —West (SA) 2,120,911 14.42 3.08 2.06 9.28 — 2.38 —United States (SA) 4,845,024 12.10 3.23 1.87 6.99 — 2.01 —
Prime ARMs Percent of loans with installments past due Percent of loans in foreclosure Number Inventory Started SeriouslyState, area and of loans Total 90 days at end of during Delinquentcensus region serviced past due 30 days 60 days or more quarter quarter (90+ FC Inv)
21,343 33.29 8.13 5.27 19.89 25.77 4.88 45.66 4,710 29.34 9.17 5.56 14.61 29.47 3.84 44.08 29,960 35.80 6.92 4.70 24.18 24.60 4.01 48.78 6,028 36.10 9.42 5.92 20.75 15.30 4.79 36.05 5,586 35.07 8.18 5.21 21.68 23.51 5.48 45.19 1,524 26.31 9.19 4.33 12.80 23.82 4.07 36.62 69,151 34.34 7.82 5.07 21.45 24.38 4.45 45.83
46,870 27.01 5.90 3.88 17.22 37.50 4.70 54.72 69,659 29.84 6.54 4.19 19.11 34.57 4.46 53.68 49,667 34.04 9.90 5.83 18.31 18.21 3.35 36.52 166,196 30.30 7.36 4.59 18.34 30.51 4.20 48.85
85,165 30.65 7.20 4.69 18.76 27.30 5.33 46.06 32,467 33.81 9.88 5.27 18.67 18.38 4.42 37.05 65,028 38.46 9.02 5.53 23.90 15.26 4.24 39.16 54,743 30.21 8.59 4.76 16.86 20.72 3.82 37.58 19,491 30.86 8.17 5.09 17.60 23.56 4.55 41.16 256,894 32.95 8.37 5.02 19.56 21.44 4.56 41.00
7,126 30.76 9.94 5.96 14.86 17.51 3.94 32.37 8,467 29.73 10.04 5.21 14.48 13.44 3.71 27.92 29,332 25.11 6.40 3.91 14.79 20.58 4.34 35.37 28,175 37.23 11.14 6.27 19.82 11.44 3.76 31.26 4,480 28.19 10.54 5.16 12.50 12.83 3.55 25.33 785 25.35 8.28 4.59 12.48 12.87 2.68 25.35 1,207 24.94 9.61 4.23 11.10 17.07 3.40 28.17 79,572 30.57 9.08 5.15 16.34 15.74 3.95 32.08
5,125 30.50 8.39 4.45 17.66 22.40 3.75 40.06 3,735 25.62 7.26 4.15 14.22 20.88 3.72 35.10 256,748 21.72 4.33 3.12 14.27 46.54 5.17 60.81 71,753 31.29 7.91 4.87 18.50 14.57 4.21 33.07 47,530 32.58 7.08 4.83 20.67 24.11 4.45 44.78 38,843 31.68 10.23 5.78 15.67 12.80 4.07 28.47 18,543 28.86 9.34 5.06 14.46 19.28 3.82 33.74 43,256 30.09 7.84 4.98 17.28 15.17 3.87 32.45 2,769 38.93 11.63 7.26 20.04 14.12 3.90 34.16 488,302 26.21 6.20 4.04 15.97 32.53 4.67 48.50
14,229 37.92 11.03 6.04 20.85 12.61 4.43 33.46 12,467 30.57 10.23 5.19 15.15 20.11 4.19 35.26 9,186 41.05 11.42 6.14 23.49 15.13 4.16 38.62 29,081 37.58 10.10 6.04 21.44 12.48 4.34 33.92 64,963 36.80 10.51 5.89 20.40 14.35 4.31 34.75
6,809 33.94 11.09 5.83 17.02 11.94 4.32 28.96 15,075 34.12 10.78 6.16 17.17 18.69 4.42 35.86 10,358 28.96 10.40 4.81 13.76 16.77 3.75 30.53 103,079 31.63 10.38 5.78 15.46 11.47 3.78 26.93 135,321 31.82 10.46 5.75 15.60 12.71 3.88 28.31
72,844 28.19 5.77 4.15 18.26 23.54 6.79 41.80 44,366 19.97 5.80 3.65 10.52 13.25 3.71 23.77 8,112 26.23 6.96 4.65 14.62 20.67 5.66 35.29 1,951 29.73 8.56 4.56 16.61 18.04 4.97 34.65 42,775 26.92 4.71 3.77 18.43 32.27 7.46 50.70 6,774 26.99 8.64 5.11 13.24 19.93 3.44 33.17 18,666 25.64 6.86 5.08 13.69 18.75 5.26 32.44 1,524 30.84 10.83 4.99 15.03 13.12 3.48 28.15 197,012 25.73 5.87 4.11 15.76 22.29 5.89 38.05
1,397 27.92 7.66 5.08 15.18 14.03 4.01 29.21 302,162 29.29 5.26 3.82 20.22 26.59 5.44 46.81 6,515 24.94 5.68 4.14 15.12 32.49 4.51 47.61 22,552 24.53 6.36 4.16 14.01 18.65 5.11 32.66 44,634 30.31 6.50 4.29 19.52 13.84 2.55 33.36 377,260 29.05 5.49 3.90 19.66 24.66 5.06 44.32
65 43.08 10.77 4.62 27.69 9.23 — 36.92
235,347 31.49 7.50 4.73 19.25 28.71 4.27 47.96 336,466 32.39 8.54 5.05 18.80 20.09 4.42 38.89 688,586 28.31 7.45 4.55 16.31 26.92 4.48 43.23 574,272 27.91 5.62 3.97 18.32 23.85 5.34 42.17 1,834,913 29.34 7.08 4.49 17.77 24.93 4.71 42.70
235,347 29.02 6.82 4.27 17.93 — 4.18 — 336,466 29.56 7.80 4.58 17.18 — 4.17 — 688,586 25.88 6.93 4.08 14.87 — 4.33 — 574,272 25.28 5.09 3.61 16.58 — 5.23 — 1,834,913 26.69 6.45 4.01 16.23 — 4.54 —
Subprime ARMs Percent of loans with installments past due Percent of loans in foreclosure
Number Inventory Started Seriouslyof loans Total 90 days at end of during Delinquentserviced past due 30 days 60 days or more quarter quarter (90+ FC Inv)

10 National Delinquency Survey from the Mortgage Bankers Association • Fourth Quarter 2009 © Mortgage Bankers Association February 2010. All Rights Reserved.
Historical National Delinquency Survey Data
Prime FRM loansa,b Prime ARM loansa,b Subprime FRM loansa,b,c
Percent Percent Percent Installments past due Foreclosures Installments past due Foreclosures Installments past due Foreclosures Total Inventory Started Seriously Total Inventory Started Seriously Total Inventory Started Seriously
End of Past 30 60 90 days at end of during Delinquent Past 30 60 90 days at end of during Delinquent Past 30 60 90 days at end of during Delinquentquarter Due days days or more quarter quarter (90+ & FC Inv) Due days days or more quarter quarter (90+ & FC Inv) Due days days or more quarter quarter (90+ & FC Inv)
20051st 2.02 1.46 0.31 0.25 0.42 0.16 0.66 2.06 1.53 0.33 0.21 0.50 0.18 0.70 9.10 4.67 1.55 2.87 3.47 1.12 6.242nd 2.02 1.45 0.32 0.25 0.38 0.15 0.62 2.19 1.62 0.35 0.22 0.43 0.17 0.63 9.06 4.70 1.37 2.99 3.24 1.03 6.213rd 2.11 1.56 0.30 0.26 0.37 0.15 0.63 2.30 1.68 0.37 0.25 0.43 0.18 0.67 8.79 4.92 1.47 2.40 3.22 1.12 5.724th 2.21 1.49 0.35 0.37 0.38 0.16 0.78 2.54 1.76 0.44 0.34 0.47 0.21 0.84 9.70 5.06 1.60 3.04 3.14 1.04 6.25
20061st 2.00 1.34 0.31 0.35 0.34 0.14 0.68 2.30 1.54 0.40 0.36 0.49 0.22 0.82 9.61 4.92 1.60 3.08 3.18 1.10 6.002nd 2.00 1.38 0.32 0.30 0.34 0.13 0.63 2.70 1.82 0.49 0.39 0.56 0.25 0.92 9.23 5.00 1.53 2.70 3.05 0.92 5.723rd 2.10 1.49 0.33 0.28 0.36 0.13 0.65 3.06 2.05 0.57 0.44 0.70 0.29 1.14 9.59 5.29 1.66 2.65 3.00 1.02 5.654th 2.27 1.64 0.34 0.29 0.39 0.18 0.69 3.39 2.30 0.63 0.47 0.92 0.45 1.45 10.09 5.57 1.73 2.78 3.19 1.20 6.04
20071st 2.19 1.56 0.34 0.29 0.38 0.17 0.66 3.69 2.35 0.72 0.61 1.09 0.53 1.66 10.25 5.51 1.91 2.84 3.29 1.21 5.892nd 2.25 1.59 0.38 0.28 0.41 0.16 0.67 4.15 2.52 0.83 0.80 1.29 0.58 2.02 10.99 5.99 2.05 2.95 2.85 1.19 5.843rd 2.54 1.78 0.42 0.34 0.48 0.21 0.83 5.14 2.99 1.08 1.07 2.04 0.97 3.12 12.36 6.62 2.33 3.42 3.12 1.43 6.614th 2.56 1.72 0.44 0.40 0.55 0.24 0.99 5.51 2.89 1.20 1.41 2.59 1.17 4.22 13.99 7.17 2.54 4.29 3.77 1.64 8.18
20081st 2.82 1.85 0.53 0.44 0.67 0.29 1.11 6.78 3.19 1.48 2.11 3.45 1.56 5.43 15.38 7.92 2.98 4.48 4.46 1.80 8.732nd 3.07 1.90 0.57 0.60 0.76 0.34 1.30 7.49 3.24 1.56 2.70 4.33 1.82 6.78 16.02 8.05 3.14 4.84 4.88 2.07 9.603rd 3.35 1.93 0.64 0.78 0.86 0.34 1.65 8.20 3.32 1.64 3.24 4.83 1.77 8.09 18.00 8.44 3.65 5.91 5.42 2.23 11.284th 3.92 2.07 0.76 1.09 1.05 0.41 2.25 9.69 3.55 2.01 4.14 5.71 1.84 10.45 19.43 8.51 4.07 6.86 6.22 2.32 13.65
20091st 4.68 2.30 0.93 1.45 1.46 0.61 2.88 12.04 3.73 2.29 6.01 7.55 2.51 13.33 22.73 9.31 4.64 8.78 6.98 2.74 15.382nd 5.23 2.35 0.96 1.92 1.80 0.67 3.52 12.21 3.79 2.12 6.30 9.24 2.74 15.08 23.60 9.19 4.60 9.80 7.80 2.83 17.133rd 5.67 2.35 0.97 2.36 1.95 0.71 4.29 12.37 3.51 2.02 6.84 10.09 3.45 16.72 24.57 8.66 4.54 11.36 8.41 2.67 19.714th 5.60 2.14 0.88 2.59 2.08 0.63 4.99 12.10 3.23 1.87 6.99 10.29 2.12 18.13 23.83 7.95 4.01 11.87 9.02 2.73 22.06
All loansa,c Prime loansa Subprime loansa,c
Percent Percent Percent Installments past due Foreclosures Installments past due Foreclosures Installments past due Foreclosures Total Inventory Started Seriously Total Inventory Started Seriously Total Inventory Started Seriously
End of Past 30 60 90 days at end of during Delinquent Past 30 60 90 days at end of during Delinquent Past 30 60 90 days at end of during Delinquentquarter Due days days or more quarter quarter (90+ & FC Inv) Due days days or more quarter quarter (90+ & FC Inv) Due days days or more quarter quarter (90+ & FC Inv)
20051st 4.31 2.70 0.74 0.87 1.08 0.42 1.89 2.17 1.55 0.34 0.28 0.46 0.19 0.73 10.62 6.07 1.95 2.61 3.49 1.39 5.962nd 4.34 2.74 0.76 0.85 1.00 0.38 1.83 2.20 1.57 0.35 0.28 0.42 0.17 0.69 10.33 5.95 1.86 2.52 3.29 1.30 5.813rd 4.44 2.85 0.76 0.83 0.97 0.41 1.82 2.34 1.69 0.35 0.30 0.41 0.18 0.71 10.76 6.46 2.02 2.28 3.31 1.45 5.684th 4.70 2.85 0.83 1.02 0.99 0.42 2.08 2.47 1.66 0.40 0.41 0.42 0.18 0.86 11.63 6.53 2.16 2.94 3.33 1.49 6.32
20061st 4.41 2.62 0.78 1.01 0.98 0.42 1.93 2.25 1.50 0.36 0.39 0.40 0.17 0.77 11.50 6.46 2.22 2.82 3.50 1.58 6.222nd 4.39 2.69 0.79 0.91 0.99 0.40 1.89 2.29 1.55 0.38 0.36 0.41 0.16 0.75 11.70 6.76 2.29 2.65 3.56 1.55 6.243rd 4.67 2.87 0.86 0.94 1.05 0.47 2.00 2.44 1.69 0.41 0.34 0.44 0.19 0.79 12.56 7.01 2.59 2.96 3.86 1.89 6.784th 4.95 3.08 0.90 0.96 1.19 0.57 2.21 2.57 1.82 0.42 0.33 0.50 0.24 0.86 13.33 7.47 2.73 3.13 4.53 2.26 7.78
20071st 4.84 2.93 0.93 0.98 1.28 0.59 2.23 2.58 1.78 0.43 0.36 0.54 0.26 0.89 13.77 7.42 3.00 3.35 5.10 2.38 8.332nd 5.12 3.02 1.00 1.11 1.40 0.59 2.47 2.73 1.83 0.48 0.42 0.59 0.25 0.98 14.82 7.77 3.21 3.83 5.52 2.45 9.273rd 5.59 3.25 1.09 1.26 1.69 0.78 2.95 3.12 2.05 0.56 0.51 0.79 0.36 1.31 16.31 8.16 3.53 4.62 6.89 3.18 11.384th 5.82 3.20 1.15 1.48 2.04 0.88 3.62 3.24 1.99 0.61 0.65 0.96 0.43 1.67 17.31 8.22 3.67 5.42 8.65 3.71 14.44
20081st 6.35 3.41 1.31 1.63 2.47 1.01 4.03 3.71 2.19 0.73 0.79 1.22 0.55 1.99 18.79 8.83 4.12 5.84 10.74 4.08 16.422nd 6.41 3.30 1.28 1.83 2.75 1.08 4.50 3.93 2.16 0.76 1.01 1.42 0.61 2.35 18.67 8.49 4.00 6.19 11.81 4.26 17.853rd 6.99 3.39 1.40 2.20 2.97 1.07 5.17 4.34 2.23 0.84 1.27 1.58 0.61 2.87 20.03 8.56 4.25 7.22 12.55 4.23 19.564th 7.88 3.53 1.60 2.75 3.30 1.08 6.30 5.06 2.36 1.00 1.70 1.88 0.68 3.74 21.88 8.54 4.67 8.66 13.71 3.96 23.11
20091st 9.12 3.77 1.82 3.53 3.85 1.37 7.24 6.06 2.62 1.17 2.28 2.49 0.94 4.70 24.95 9.03 5.08 10.84 14.34 4.65 24.882nd 9.24 3.68 1.68 3.88 4.30 1.36 7.97 6.41 2.61 1.15 2.65 3.00 1.01 5.44 25.35 8.68 4.68 12.00 15.05 4.13 26.523rd 9.64 3.57 1.67 4.41 4.47 1.42 8.85 6.84 2.56 1.15 3.14 3.20 1.14 6.26 26.42 8.14 4.57 13.70 15.35 3.76 28.684th 9.47 3.31 1.54 4.62 4.58 1.20 9.67 6.73 2.32 1.06 3.34 3.31 0.86 7.01 25.26 7.54 4.10 13.61 15.58 3.66 30.56
a. Except for the Foreclosure Starts, Foreclosure Inventory and Seriously Delinquent measures, data are adjusted on an annual basis (coinciding with the first quarter results) using Census Bureau’s X-12-ARIMA seasonal adjustment program.
b. FRM and ARM data are reported by a smaller sample of companies. Consequently, the weighted sum of FRM and ARM delinquency rates does not necessarily equal the overall delinquency rate.
c. Results prior to the second quarter of 2005 have been restated basedon changes in sample composition.
NDS NotesA loan is considered 30 days delinquent if the December 1 installment has not been paid as of December 31. A loan is 60 days delinquent if the November 1 installment is unpaid as of December 31, and so forth.
Foreclosures started during quarter includes loans placed in the process of foreclosure during the fourt quarter of 2009, deeds in lieu of foreclosure and loans assigned to FHA, VA, other insurers or investors. Foreclosure inventory end of quarter includes all loans in the process of foreclosure on December 31. Both foreclosure categories are excluded from total installments past due.
The four census regions of the country contain the following subregions: Northeast equals New England and Mid Atlantic; North Central equals
East North Central and West North Central; South equals South Atlantic, East South Central and West South Central; West equals Mountain and Pacific. National totals include loans in Puerto Rico and loans of firms not providing state-by-state data.
This survey includes about 44 million mortgage loans on one-to-four unit residential properties. These loans are serviced by about 120 reporters, including mortgage bankers, commercial banks, savings banks, savings and loan associations and life insurance companies.
Totals may not equal parts due to rounding. All national measures are seasonally adjusted except for foreclosure starts, foreclosure inventory and seriously delinquent percentages. State level delinquency and foreclosure measures are not seasonally adjusted.

National Delinquency Survey from the Mortgage Bankers Association • Fourth Quarter 2009 11 © Mortgage Bankers Association February 2010. All Rights Reserved.
Receive the NDS every quarter. Become a subscriber today.National Delinquency Survey from the Mortgage Bankers Association
Annual Subscription Fee: $250 for MBA members / $450 for nonmembers
Single-Issue Order Fee: $75 for MBA members / $175 for nonmembers
To purchase historical delinquency, foreclosure rates or other information and analysis on the latest trends and statistics in mortgage finance, visit our Web site at: www.mortgagebankers.org/research.
Call (800) 348-8653 to subscribeor order.
National Delinquency Survey © February 2010 Mortgage Bankers Association • 1331 L Street, NW, Washington, DC 20005, (202) 557-2700. Delinquency survey data are provided by MBA solely for use as a reference.
No part of the Survey may be reproduced, stored in a retrieval system, transmitted or redistributed in any form or by any means, electronic, mechanical, photocopying, recording or otherwise, without MBA’s prior written consent.
Subprime ARM loansa,b,c FHA loansa,c VA loansa,c
Percent Percent Percent Installments past due Foreclosures Installments past due Foreclosures Installments past due Foreclosures Total Inventory Started Seriously Total Inventory Started Seriously Total Inventory Started Seriously
End of Past 30 60 90 days at end of during Delinquent Past 30 60 90 days at end of during Delinquent Past 30 60 90 days at end of during Delinquentquarter Due days days or more quarter quarter (90+ & FC Inv) Due days days or more quarter quarter (90+ & FC Inv) Due days days or more quarter quarter (90+ & FC Inv)
20051st 10.25 6.07 2.01 2.17 3.28 1.44 5.23 11.73 6.76 2.13 2.83 2.56 0.88 5.15 7.16 4.23 1.26 1.66 1.38 0.42 2.872nd 10.04 6.03 2.00 2.01 3.16 1.45 5.13 12.37 7.09 2.39 2.89 2.29 0.75 5.07 6.91 4.15 1.24 1.52 1.25 0.37 2.753rd 10.55 6.59 2.13 1.82 3.23 1.57 5.15 12.75 7.34 2.37 3.04 2.25 0.88 5.40 7.12 4.34 1.22 1.56 1.19 0.38 2.824th 11.61 6.74 2.35 2.53 3.36 1.61 6.07 13.18 7.17 2.47 3.55 2.34 0.90 6.13 6.81 3.94 1.21 1.67 1.13 0.36 2.93
20061st 12.02 6.73 2.47 2.82 3.73 1.84 6.28 12.23 6.47 2.18 3.59 2.18 0.85 5.48 6.93 3.93 1.22 1.78 1.14 0.40 2.742nd 12.24 6.99 2.62 2.63 3.88 1.87 6.52 12.45 6.86 2.26 3.34 2.20 0.71 5.40 6.35 3.79 1.11 1.45 1.10 0.32 2.533rd 13.22 7.37 2.92 2.93 4.68 2.23 7.72 12.80 7.16 2.36 3.28 2.28 0.79 5.66 6.58 3.94 1.16 1.48 1.12 0.32 2.644th 14.44 7.93 3.13 3.38 5.62 2.95 9.16 13.46 7.70 2.46 3.30 2.19 0.96 5.78 6.82 4.14 1.19 1.50 1.01 0.36 2.65
20071st 15.75 8.11 3.59 4.05 6.46 3.13 10.13 12.15 6.63 2.18 3.34 2.19 0.93 5.26 6.49 3.78 1.19 1.52 1.05 0.41 2.452nd 16.95 8.54 3.97 4.44 8.02 3.56 12.40 12.58 7.03 2.40 3.16 2.15 0.74 5.18 6.15 3.66 1.12 1.37 1.02 0.34 2.353rd 18.81 9.18 4.47 5.16 10.38 4.78 15.63 12.92 7.22 2.48 3.22 2.22 0.94 5.54 6.58 3.88 1.17 1.53 1.03 0.39 2.564th 20.02 8.80 4.58 6.64 13.43 5.66 20.43 13.05 7.20 2.50 3.35 2.34 0.95 6.00 6.49 3.76 1.19 1.54 1.12 0.43 2.83
20081st 22.07 9.53 5.25 7.29 17.09 6.32 24.11 12.72 6.96 2.43 3.33 2.40 0.96 5.59 7.22 4.07 1.41 1.74 1.24 0.51 2.882nd 21.03 8.68 4.80 7.55 19.41 6.63 26.77 12.63 6.76 2.43 3.45 2.24 0.95 5.43 6.82 3.79 1.26 1.77 1.33 0.57 3.003rd 21.31 8.30 4.79 8.22 20.65 6.47 28.84 12.92 6.64 2.58 3.70 2.32 0.95 6.05 7.28 3.91 1.40 1.98 1.46 0.59 3.454th 24.22 8.19 5.19 10.84 22.18 5.73 33.78 13.73 6.88 2.74 4.11 2.43 0.95 6.98 7.52 3.89 1.42 2.21 1.66 0.65 4.12
20091st 27.58 8.58 5.55 13.45 23.32 6.91 36.46 13.84 6.41 2.69 4.73 2.76 1.10 7.37 8.21 4.01 1.58 2.62 1.93 0.72 4.422nd 27.36 7.84 4.70 14.83 24.40 5.52 38.65 14.42 6.47 2.71 5.24 2.98 1.15 7.78 8.06 3.81 1.43 2.82 2.07 0.68 4.693rd 28.23 7.14 4.49 16.60 24.70 4.92 40.80 14.36 6.34 2.70 5.32 3.32 1.31 8.67 8.08 3.88 1.45 2.75 2.29 0.87 5.064th 26.69 6.45 4.01 16.23 24.93 4.71 42.70 13.57 5.80 2.46 5.30 3.57 1.28 9.42 7.41 3.44 1.31 2.66 2.46 0.81 5.42
FHA FRM loansa,b,c FHA ARM loansa,b,c
Percent Percent Installments past due Foreclosures Installments past due Foreclosures Total Inventory Started Seriously Total Inventory Started Seriously
End of Past 30 60 90 days at end of during Delinquent Past 30 60 90 days at end of during Delinquentquarter Due days days or more quarter quarter (90+ & FC Inv) Due days days or more quarter quarter (90+ & FC Inv)
20051st 11.49 6.58 2.07 2.84 2.34 0.78 4.80 11.57 6.85 2.12 2.60 2.06 0.81 4.372nd 11.56 6.74 2.17 2.66 2.15 0.67 4.75 11.64 6.92 2.21 2.52 1.96 0.68 4.443rd 11.91 6.93 2.16 2.82 2.07 0.76 5.01 12.10 7.05 2.27 2.78 1.99 0.84 4.874th 12.02 6.59 2.14 3.30 2.12 0.77 5.71 12.78 7.21 2.37 3.20 2.20 0.94 5.61
20061st 11.92 6.23 2.01 3.68 1.89 0.63 5.08 12.88 7.05 2.30 3.54 2.14 0.88 5.292nd 11.60 6.45 2.05 3.10 1.98 0.52 5.01 12.44 6.82 2.39 3.22 2.24 0.72 5.413rd 12.01 6.82 2.13 3.06 2.05 0.55 5.24 13.58 7.61 2.51 3.45 2.50 0.81 6.084th 12.24 7.02 2.19 3.04 1.92 0.71 5.30 14.37 7.95 2.68 3.74 2.54 1.16 6.62
20071st 11.64 6.39 2.07 3.18 1.85 0.67 4.78 14.18 7.44 2.67 4.08 2.73 1.06 6.532nd 11.73 6.63 2.14 2.97 1.91 0.66 4.76 14.70 7.82 2.84 4.04 3.02 1.12 6.953rd 12.24 6.91 2.31 3.02 2.02 0.81 5.08 15.32 8.27 2.99 4.06 3.30 1.49 7.434th 12.04 6.75 2.26 3.03 2.13 0.82 5.48 15.41 7.85 3.01 4.55 3.81 1.50 8.72
20081st 12.28 6.91 2.36 3.01 2.18 0.82 5.09 16.37 8.37 3.26 4.75 4.07 1.54 8.622nd 11.73 6.42 2.18 3.13 2.03 0.81 4.95 15.62 7.95 2.99 4.68 4.07 1.63 8.563rd 12.27 6.44 2.37 3.45 2.12 0.82 5.57 15.56 7.53 3.02 5.01 4.01 1.57 9.014th 12.94 6.47 2.51 3.96 2.23 0.82 6.59 15.80 7.27 3.15 5.38 4.03 1.35 9.88
20091st 13.54 6.39 2.61 4.54 2.54 0.95 6.90 17.36 7.88 3.45 6.02 4.50 1.60 10.362nd 13.62 6.16 2.50 4.96 2.78 1.01 7.38 18.04 7.91 3.31 6.82 4.98 1.62 11.413rd 13.90 6.18 2.52 5.21 3.17 1.19 8.38 17.68 7.64 3.22 6.82 5.09 1.76 11.834th 12.94 5.50 2.27 5.18 3.44 1.17 9.20 15.45 6.43 2.74 6.28 5.06 1.63 11.95
Cautionary Note on Seasonally Adjusted DataSeasonally adjusted results should be viewed with a degree of caution because the statistical models behind the adjustments were estimated based on a much more benign environment. Since the current levels of delinquencies and foreclosures are far outside the range of most of the values used to build the models, the seasonally adjusted numbers may considerably overestimate or even underestimate the true long-term trends.

MAP 1: Seriously Delinquent Rate by State for Q4, 2009
Source: MBA’s NationalDeliquency Survey
US Average: 9.67%
Seriously Delinquent RateGreater than 13.02%
9.68% – 13.02%
0 – 9.67%
MAP 3: Foreclosure Starts Rate by State for Q4, 2009
Source: MBA’s NationalDeliquency Survey
Foreclosure Starts RateGreater than 1.67%
1.21% – 1.67%
0 – 1.20%
US Average: 1.20%
MAP 2: Foreclosure Inventory Rate by State for Q4, 2009
US Average: 4.58%
Source: MBA’s NationalDeliquency Survey
Foreclosure Inventory RateGreater than 6.63%
4.59% – 6.63%
0 – 4.58%
National Delinquency Survey from the Mortgage Bankers Association • Fourth Quarter 2009 © Mortgage Bankers Association February 2010. All Rights Reserved.