Embed Size (px)
Citation preview
National Dairy Development
Board
Dairying In PunjabA Statistical Profile 2014
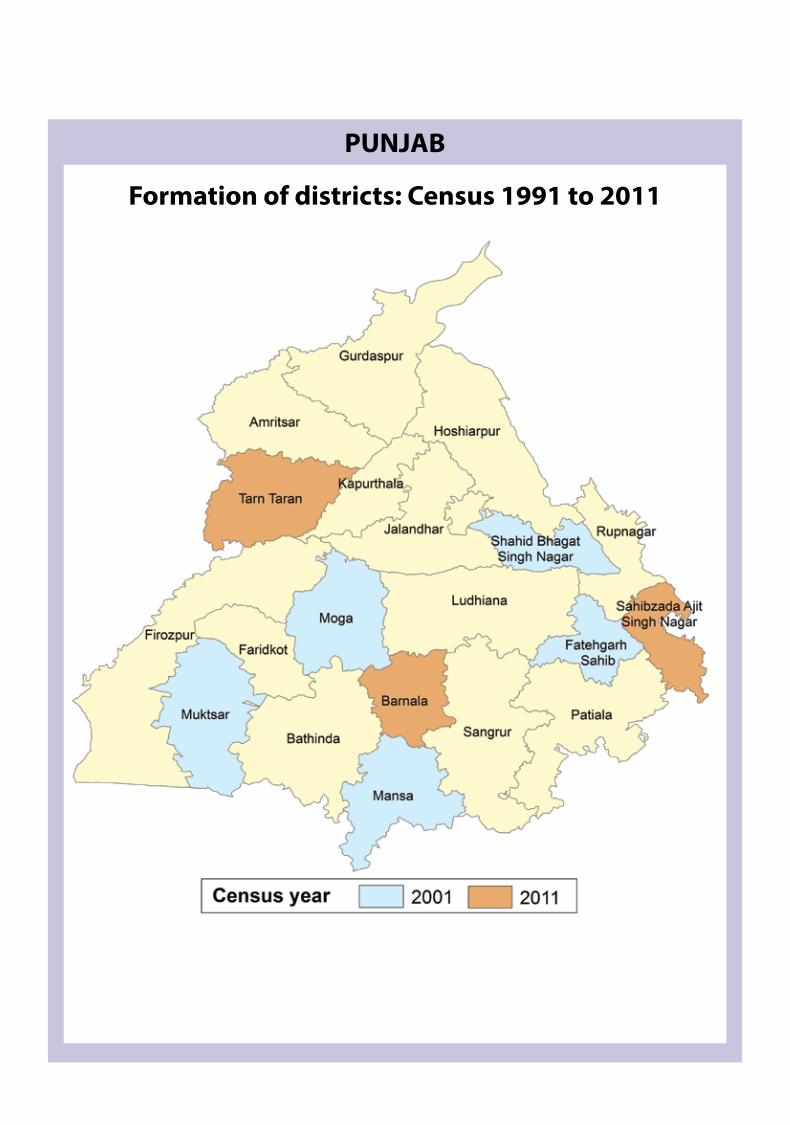
Formation of districts: Census 1991 to 2011
PUNJAB
Dairying in Punjab A Statistical Profile 2014
In this compilation of the statistical profile of the dairy sector in various States, the main landmarks or
highlights are: Trends in human demographics, animal population and production; Inputs for enhancement
of productivity such as breeding, health and nutrition; and Government expenditure, along with supporting
resources.
This review includes statistical tables on selected parameters for each State taken as a whole, along with time-
series data for districts wherever available. Since spatial presentation of data can yield insights not immediately
comprehensible from tables, thematic maps for selected parameters (with data both at a point of time as well
as changes over a period of time) have also been included.
The objective of this publication is to provide a detailed presentation of various parameters, underlying factors,
and their inter-linkages so as to enable effective planning and implementation of development interventions. We
also hope that a wide range of readers, students, researchers, veterinarians, planners, scientists, administrators,
policy makers and academics, as well as other development practitioners and professionals in government
and non-governmental organisations, will find this publication useful for their studies and projects.
Although a wealth of information is available on many aspects of dairying from different sources, it is not only
scattered but also there are inconsistencies on the same aspect in data maintained by different agencies. While
limited data could mean being less informed, extensive information could mean an overload and defeat the
very purpose of organising it. This review, therefore aims at balancing the most comprehensive information with
the most relevant. We sincerely thank government and non-government agencies for providing information.
While extreme care has been taken in juxtaposing data, some errors cannot be ruled out.
This publication “Dairying in Punjab – A Statistical Profile 2014” is amongst a series of similar publications for
different states being brought out by National Dairy Development Board (NDDB).
Dilip rathManaging Director, NDDB
October 2014Anand, Gujarat
Foreword
Dairying in Punjab A Statistical Profile 2014
Indexi. gEnEraL STaTiSTiCSi.1. Punjab at a glance I.1.1: General Statistics: Punjab State vs. India . . . . . . . . . . . . . . . . . . . . . . . . . . . . . . . . . . . . . . . . . . . . . . . . . . . . . . . . . . . . . . .2 I.1.2: Formation of Districts in Punjab . . . . . . . . . . . . . . . . . . . . . . . . . . . . . . . . . . . . . . . . . . . . . . . . . . . . . . . . . . . . . . . . . . . . . . .4i.2. Social Statistics: Human Population I.2.1: Human Population by Residence and Sex – 2001 . . . . . . . . . . . . . . . . . . . . . . . . . . . . . . . . . . . . . . . . . . . . . . . . . . . . . . .5 I.2.2: Human Population by Residence and Sex – 2011 . . . . . . . . . . . . . . . . . . . . . . . . . . . . . . . . . . . . . . . . . . . . . . . . . . . . . . .7 I.2.3: District-wise SC and ST Population – 2001 and 2011 . . . . . . . . . . . . . . . . . . . . . . . . . . . . . . . . . . . . . . . . . . . . . . . . . . . .9 I.2.4: Rural Households, Electricity and Tap Water Supply - 2001 & 2011 . . . . . . . . . . . . . . . . . . . . . . . . . . . . . . . . . . . . 11i.3. State Economy I.3.1: Net State Domestic Product (NSDP) and Per Capita Income . . . . . . . . . . . . . . . . . . . . . . . . . . . . . . . . . . . . . . . . . . . 13 I.3.2: Value of Output: Agriculture and Livestock . . . . . . . . . . . . . . . . . . . . . . . . . . . . . . . . . . . . . . . . . . . . . . . . . . . . . . . . . . 15 I.3.3: Budget Provision of different schemes run by Animal Husbandry Department, Punjab . . . . . . . . . . . . . . . . 16 I.3.4: Rashtriya Krishi Vikas Yojana (Animal Husbandry Department) . . . . . . . . . . . . . . . . . . . . . . . . . . . . . . . . . . . . . . . . 16
ii. LiVESTOCK CEnSuSii.1. animal Population II.1.1: Summary of Livestock Census (1992 to 2012) - Punjab . . . . . . . . . . . . . . . . . . . . . . . . . . . . . . . . . . . . . . . . . . . . . . . . 18 II.1.2: District-wise Total Bovine Population . . . . . . . . . . . . . . . . . . . . . . . . . . . . . . . . . . . . . . . . . . . . . . . . . . . . . . . . . . . . . . . . 19 II.1.3: District-wise Female Population . . . . . . . . . . . . . . . . . . . . . . . . . . . . . . . . . . . . . . . . . . . . . . . . . . . . . . . . . . . . . . . . . . . . . 20 II.1.4: District-wise Breedable Population . . . . . . . . . . . . . . . . . . . . . . . . . . . . . . . . . . . . . . . . . . . . . . . . . . . . . . . . . . . . . . . . . . 21 II.1.5: District-wise In-milk Population . . . . . . . . . . . . . . . . . . . . . . . . . . . . . . . . . . . . . . . . . . . . . . . . . . . . . . . . . . . . . . . . . . . . . 23 II.1.6: District-wise Milch Population . . . . . . . . . . . . . . . . . . . . . . . . . . . . . . . . . . . . . . . . . . . . . . . . . . . . . . . . . . . . . . . . . . . . . . . 24 II.1.7: District-wise Male Population . . . . . . . . . . . . . . . . . . . . . . . . . . . . . . . . . . . . . . . . . . . . . . . . . . . . . . . . . . . . . . . . . . . . . . . 25ii.2. Sex ratio in Dairy animals II.2.1: District-wise Male-Female Ratio. . . . . . . . . . . . . . . . . . . . . . . . . . . . . . . . . . . . . . . . . . . . . . . . . . . . . . . . . . . . . . . . . . . . . . 26ii.3. Wet-Dry ratio of Dairy animals II.3.1: District-wise Wet-Dry Ratio . . . . . . . . . . . . . . . . . . . . . . . . . . . . . . . . . . . . . . . . . . . . . . . . . . . . . . . . . . . . . . . . . . . . . . . . . . 27ii.4. Livestock Density II.4.1: District-wise Density of Total Livestock and Bovine . . . . . . . . . . . . . . . . . . . . . . . . . . . . . . . . . . . . . . . . . . . . . . . . . . . 29 II.4.2: District-wise Density of Poultry and Small Ruminants . . . . . . . . . . . . . . . . . . . . . . . . . . . . . . . . . . . . . . . . . . . . . . . . 30ii.5. breed-wise Population II.5.1: District and Breed-wise Indigenous Cattle Population – 2007 . . . . . . . . . . . . . . . . . . . . . . . . . . . . . . . . . . . . . . . . . 31 II.5.2: District-wise Male, Female and Milch Animals of Indigenous Breeds – 2007. . . . . . . . . . . . . . . . . . . . . . . . . . . . 32 II.5.3: District-wise Exotic and Crossbred Cattle Population – 2007 . . . . . . . . . . . . . . . . . . . . . . . . . . . . . . . . . . . . . . . . . . 33 II.5.4: District-wise Male, Female and Milch Animals of Jersey and Holstein Friesian Crossbreds – 2007 . . . . . . . 35 II.5.5: District-wise Male, Female and Milch Animals of Exotic and Other Crossbreds – 2007 . . . . . . . . . . . . . . . . . . 36 II.5.6: District and Breed-wise Buffalo Population – 2007 . . . . . . . . . . . . . . . . . . . . . . . . . . . . . . . . . . . . . . . . . . . . . . . . . . . . 37 II.5.7: District-wise Male, Female and Milch Animals of Murrah and Nili Ravi Breeds – 2007 . . . . . . . . . . . . . . . . . . . 38
iii. CaTTLE anD buFFaLO brEEDSiii.1. Distribution of native breeds of Punjab III.1.1: Distribution of Cattle Breeds of Punjab . . . . . . . . . . . . . . . . . . . . . . . . . . . . . . . . . . . . . . . . . . . . . . . . . . . . . . . . . . . . . . . 40 III.1.2: Distribution of Buffalo Breeds of Punjab . . . . . . . . . . . . . . . . . . . . . . . . . . . . . . . . . . . . . . . . . . . . . . . . . . . . . . . . . . . . . 43iii.2. Performance of breeds III.2.1: Performance of Cattle and Buffalo Breeds . . . . . . . . . . . . . . . . . . . . . . . . . . . . . . . . . . . . . . . . . . . . . . . . . . . . . . . . . . . . 45
iV. MiLK PrODuCTiOniV.1. integrated Sample Survey (iSS) Figures: animal Population IV.1.1: Year-wise In-milk Bovine Population, Milk Yield and Milk Production . . . . . . . . . . . . . . . . . . . . . . . . . . . . . . . . . . 48 IV.1.2: Year and District-wise In-milk Bovine Population . . . . . . . . . . . . . . . . . . . . . . . . . . . . . . . . . . . . . . . . . . . . . . . . . . . . . 49 IV.1.3: Year and District-wise In-milk Indigenous Cattle Population . . . . . . . . . . . . . . . . . . . . . . . . . . . . . . . . . . . . . . . . . . 51 IV.1.4: Year and District-wise In-milk Crossbred Cattle Population . . . . . . . . . . . . . . . . . . . . . . . . . . . . . . . . . . . . . . . . . . . . 53 IV.1.5: Year and District-wise In-milk Buffalo Population . . . . . . . . . . . . . . . . . . . . . . . . . . . . . . . . . . . . . . . . . . . . . . . . . . . . . 55iV.2. iSS Figures: Milk yield IV.2.1: Year and District-wise Bovine Milk Yield . . . . . . . . . . . . . . . . . . . . . . . . . . . . . . . . . . . . . . . . . . . . . . . . . . . . . . . . . . . . . . 57 IV.2.2: Year and District-wise Indigenous Cattle Milk Yield . . . . . . . . . . . . . . . . . . . . . . . . . . . . . . . . . . . . . . . . . . . . . . . . . . . 59 IV.2.3: Year and District-wise Crossbred Cattle Milk Yield. . . . . . . . . . . . . . . . . . . . . . . . . . . . . . . . . . . . . . . . . . . . . . . . . . . . . 61 IV.2.4: Year and District-wise Buffalo Milk Yield . . . . . . . . . . . . . . . . . . . . . . . . . . . . . . . . . . . . . . . . . . . . . . . . . . . . . . . . . . . . . . 63
Dairying in Punjab A Statistical Profile 2014
iV.3. iSS Figures: Milk Production IV.3.1: Year and District-wise Bovine Milk Production . . . . . . . . . . . . . . . . . . . . . . . . . . . . . . . . . . . . . . . . . . . . . . . . . . . . . . . . 67 IV.3.2: Year and District-wise Indigenous Cattle Milk Production . . . . . . . . . . . . . . . . . . . . . . . . . . . . . . . . . . . . . . . . . . . . . 69 IV.3.3: Year and District-wise Crossbred Cattle Milk Production . . . . . . . . . . . . . . . . . . . . . . . . . . . . . . . . . . . . . . . . . . . . . . 71 IV.3.4: Year and District-wise Buffalo Milk Production . . . . . . . . . . . . . . . . . . . . . . . . . . . . . . . . . . . . . . . . . . . . . . . . . . . . . . . 73 IV.3.5: Year and District-wise Milk Production Density . . . . . . . . . . . . . . . . . . . . . . . . . . . . . . . . . . . . . . . . . . . . . . . . . . . . . . . 75iV.4. iSS Figures: Milk availability IV.4.1: Year and District-wise Per Capita Milk Availability. . . . . . . . . . . . . . . . . . . . . . . . . . . . . . . . . . . . . . . . . . . . . . . . . . . . . 77iV.5. iSS Figures: Milk utilisation IV.5.1: Milk Utilisation Pattern in Households (2000-01 to 2012-13) . . . . . . . . . . . . . . . . . . . . . . . . . . . . . . . . . . . . . . . . . . 79 V. VETErinary inFraSTruCTurE anD SErViCE DELiVEry SySTEMV.1. Veterinary infrastructure V.1.1: Year and District-wise Veterinary Institutes . . . . . . . . . . . . . . . . . . . . . . . . . . . . . . . . . . . . . . . . . . . . . . . . . . . . . . . . . . . 82 V.1.2: District-wise AI Centres – Government Agencies . . . . . . . . . . . . . . . . . . . . . . . . . . . . . . . . . . . . . . . . . . . . . . . . . . . . . 83 V.1.3: Milk Union-wise AI Centres – Cooperatives . . . . . . . . . . . . . . . . . . . . . . . . . . . . . . . . . . . . . . . . . . . . . . . . . . . . . . . . . . . 84V.2. Service Delivery System - ais V.2.1: District-wise AI Performed by Government Agencies – Cattle . . . . . . . . . . . . . . . . . . . . . . . . . . . . . . . . . . . . . . . . . 85 V.2.2: District-wise AI Performed by Government Agencies – Buffaloes . . . . . . . . . . . . . . . . . . . . . . . . . . . . . . . . . . . . . . 86 V.2.3: District-wise AI Performed by Government Agencies – Bovine . . . . . . . . . . . . . . . . . . . . . . . . . . . . . . . . . . . . . . . . 87 V.2.4: Milk Union-wise AI Performed by Cooperatives – Cattle . . . . . . . . . . . . . . . . . . . . . . . . . . . . . . . . . . . . . . . . . . . . . . 89 V.2.5: Milk Union-wise AI Performed by Cooperatives – Buffaloes . . . . . . . . . . . . . . . . . . . . . . . . . . . . . . . . . . . . . . . . . . . 89 V.2.6: Milk Union-wise AI Performed by Cooperatives – Bovine . . . . . . . . . . . . . . . . . . . . . . . . . . . . . . . . . . . . . . . . . . . . . 89V.3. Service Delivery System - animal Health V.3.1: District-wise Vaccination Performed for Foot-and-Mouth Disease . . . . . . . . . . . . . . . . . . . . . . . . . . . . . . . . . . . . . 90 V.3.2: District-wise Vaccination Preformed for Haemorrhagic Septicaemia . . . . . . . . . . . . . . . . . . . . . . . . . . . . . . . . . . 91 V.3.3: District-wise Vaccination Preformed for Black Quarter . . . . . . . . . . . . . . . . . . . . . . . . . . . . . . . . . . . . . . . . . . . . . . . . 92 V.3.4: District-wise Bovine Vaccination . . . . . . . . . . . . . . . . . . . . . . . . . . . . . . . . . . . . . . . . . . . . . . . . . . . . . . . . . . . . . . . . . . . . . 93 V.3.5: District-wise Bovine Treated . . . . . . . . . . . . . . . . . . . . . . . . . . . . . . . . . . . . . . . . . . . . . . . . . . . . . . . . . . . . . . . . . . . . . . . . . 95 V.3.6: District-wise Bovine Castration . . . . . . . . . . . . . . . . . . . . . . . . . . . . . . . . . . . . . . . . . . . . . . . . . . . . . . . . . . . . . . . . . . . . . . 96
Vi: FEED rESOurCESVi.1. Feed resources - Fodder VI.1.1: Area under Fodder Crops and Gross Sown Area . . . . . . . . . . . . . . . . . . . . . . . . . . . . . . . . . . . . . . . . . . . . . . . . . . . . . . 99Vi.2. Feed resources - availability vs. requirement VI.2.1: District-wise Dry Matter (DM) Availability, Requirement and Balance . . . . . . . . . . . . . . . . . . . . . . . . . . . . . . . . . 101 VI.2.2: District-wise Crude Protein (CP) Availability, Requirement and Balance . . . . . . . . . . . . . . . . . . . . . . . . . . . . . . . 103 VI.2.3: District-wise Total Digestive Nutrient (TDN) Availability, Requirement and Balance . . . . . . . . . . . . . . . . . . . 105 VI.2.4: Availability, Requirement and Surplus/Deficit of Feed Nutrients . . . . . . . . . . . . . . . . . . . . . . . . . . . . . . . . . . . . . . 107Vi.3. Feed resources - Consumption VI.3.1: Feed and Fodder Consumption . . . . . . . . . . . . . . . . . . . . . . . . . . . . . . . . . . . . . . . . . . . . . . . . . . . . . . . . . . . . . . . . . . . . . 109
Vii: agriCuLTurEVii.1. agro-Climatic Zones VII.1.1: Details of Agro-climatic Zones . . . . . . . . . . . . . . . . . . . . . . . . . . . . . . . . . . . . . . . . . . . . . . . . . . . . . . . . . . . . . . . . . . . . . . 112Vii.2. Land use Pattern VII.2.1: District-wise Land Use Pattern . . . . . . . . . . . . . . . . . . . . . . . . . . . . . . . . . . . . . . . . . . . . . . . . . . . . . . . . . . . . . . . . . . . . . . 113Vii.3. area and Production VII.3.1: District-wise Area and Production of Cereals and Pulses . . . . . . . . . . . . . . . . . . . . . . . . . . . . . . . . . . . . . . . . . . . . . 115 VII.3.2: District-wise Area and Production of Food Grains and Oilseeds . . . . . . . . . . . . . . . . . . . . . . . . . . . . . . . . . . . . . . 117 VII.3.3: District-wise Area and Production of Sugarcane and Cotton . . . . . . . . . . . . . . . . . . . . . . . . . . . . . . . . . . . . . . . . . 119Vii.4. Land Holding VII.4.1: Operational Holdings in Punjab . . . . . . . . . . . . . . . . . . . . . . . . . . . . . . . . . . . . . . . . . . . . . . . . . . . . . . . . . . . . . . . . . . . . 120 VII.4.2: Net Irrigated Area under Different Sources of Irrigation . . . . . . . . . . . . . . . . . . . . . . . . . . . . . . . . . . . . . . . . . . . . . 120Vii.5. rainfall VII.5.1: District- wise Average Annual Rainfall . . . . . . . . . . . . . . . . . . . . . . . . . . . . . . . . . . . . . . . . . . . . . . . . . . . . . . . . . . . . . . 121Vii.6. ground Water Status VII.6.1: Distribution of Blocks According to Ground Water Status . . . . . . . . . . . . . . . . . . . . . . . . . . . . . . . . . . . . . . . . . . . . 122
gLOSSary . . . . . . . . . . . . . . . . . . . . . . . . . . . . . . . . . . . . . . . . . . . . . . . . . . . . . . . . . . . . . . . . . . . . . . . . . . . . . . . . . . . . . . . . . . . . . . . . . . . . . . 125
Part I : General Statistics
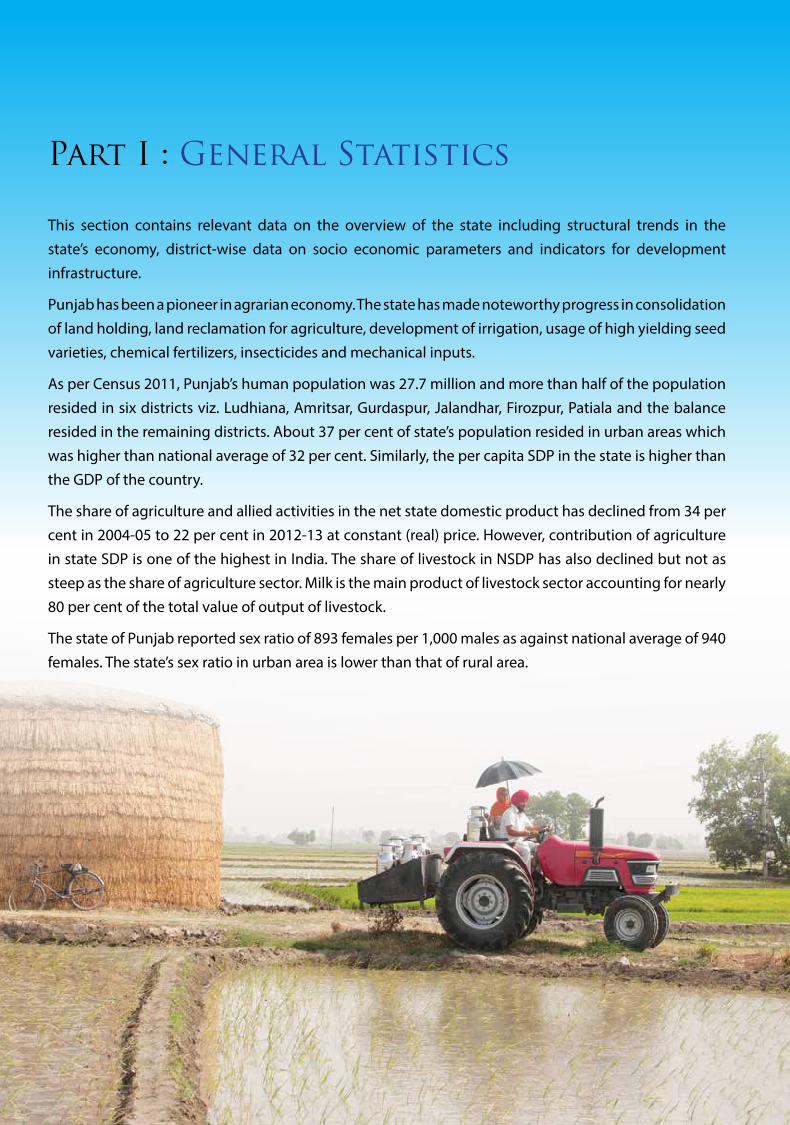
This section contains relevant data on the overview of the state including structural trends in the state’s economy, district-wise data on socio economic parameters and indicators for development infrastructure.
Punjab has been a pioneer in agrarian economy. The state has made noteworthy progress in consolidation of land holding, land reclamation for agriculture, development of irrigation, usage of high yielding seed varieties, chemical fertilizers, insecticides and mechanical inputs.
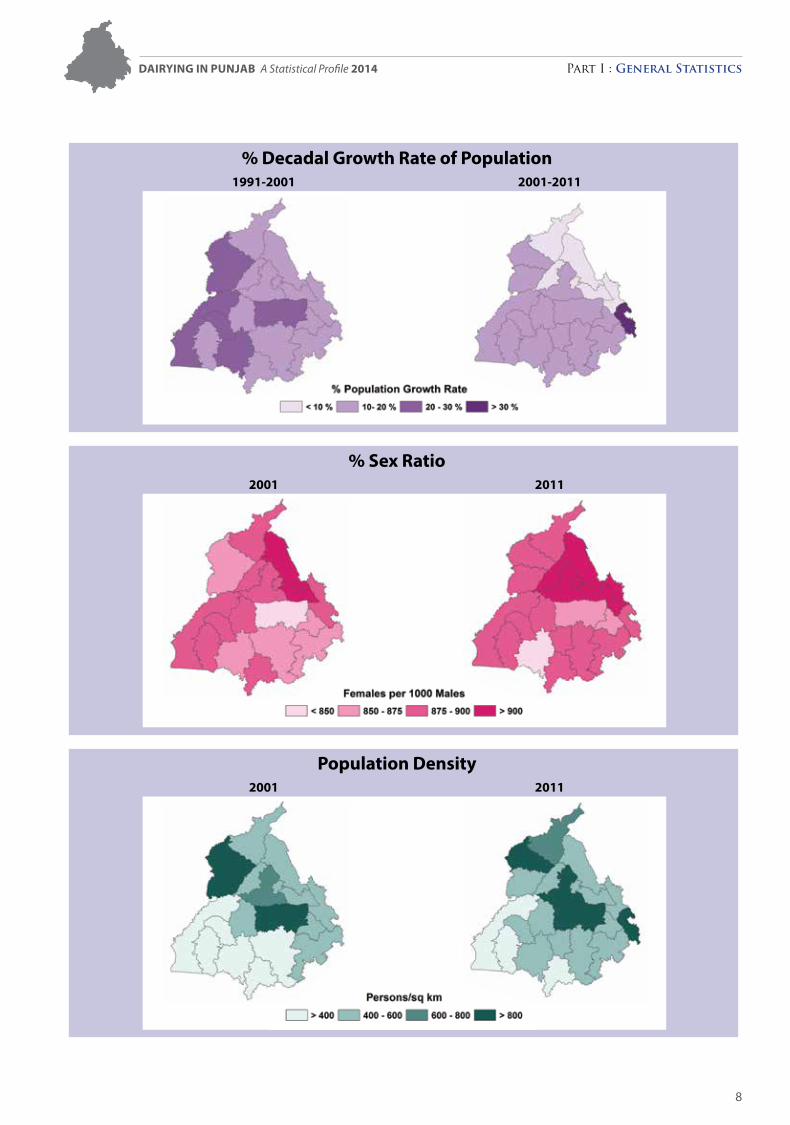
As per Census 2011, Punjab’s human population was 27.7 million and more than half of the population resided in six districts viz. Ludhiana, Amritsar, Gurdaspur, Jalandhar, Firozpur, Patiala and the balance resided in the remaining districts. About 37 per cent of state’s population resided in urban areas which was higher than national average of 32 per cent. Similarly, the per capita SDP in the state is higher than the GDP of the country.
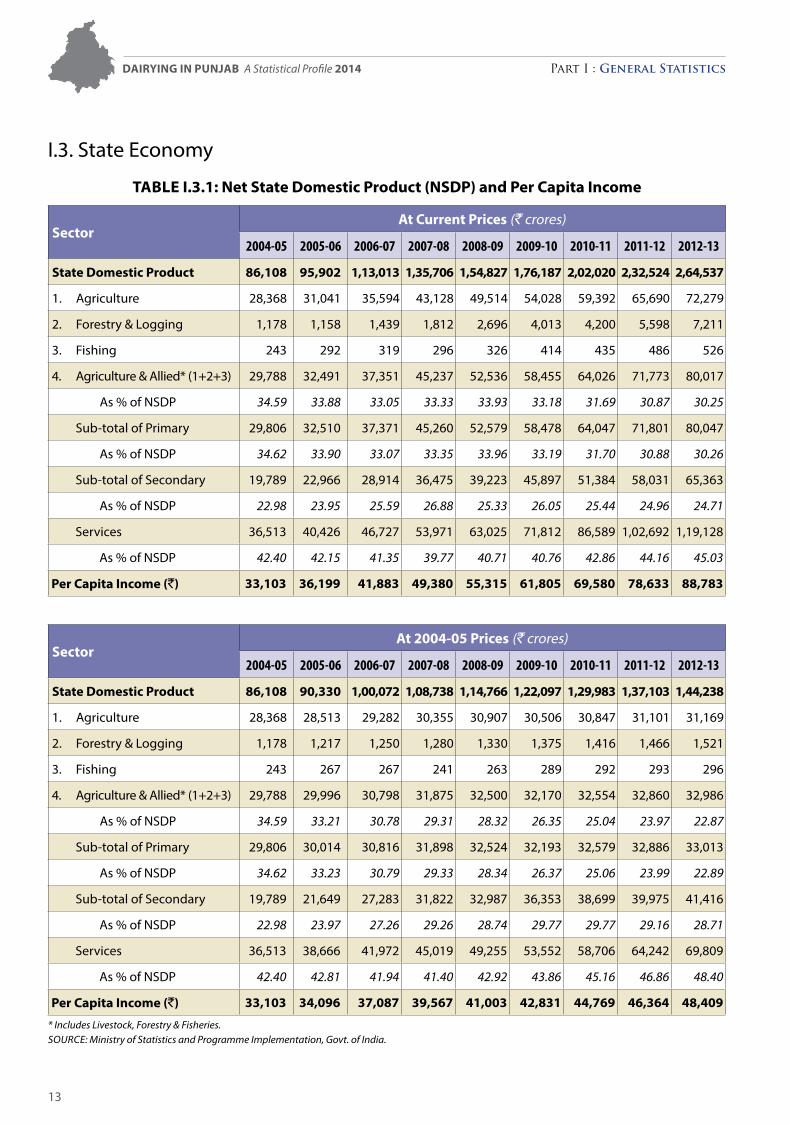
The share of agriculture and allied activities in the net state domestic product has declined from 34 per cent in 2004-05 to 22 per cent in 2012-13 at constant (real) price. However, contribution of agriculture in state SDP is one of the highest in India. The share of livestock in NSDP has also declined but not as steep as the share of agriculture sector. Milk is the main product of livestock sector accounting for nearly 80 per cent of the total value of output of livestock.
The state of Punjab reported sex ratio of 893 females per 1,000 males as against national average of 940 females. The state’s sex ratio in urban area is lower than that of rural area.
2
Dairying in Punjab A Statistical Profile 2014 Part I : General Statistics
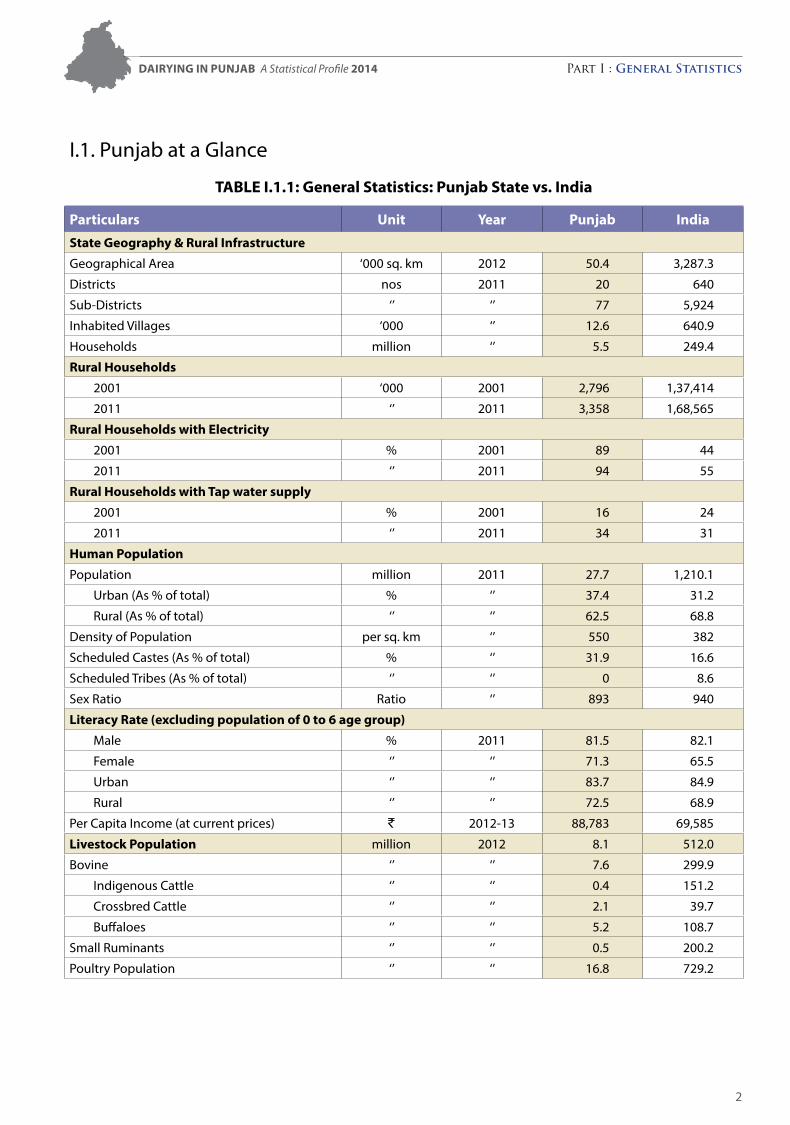
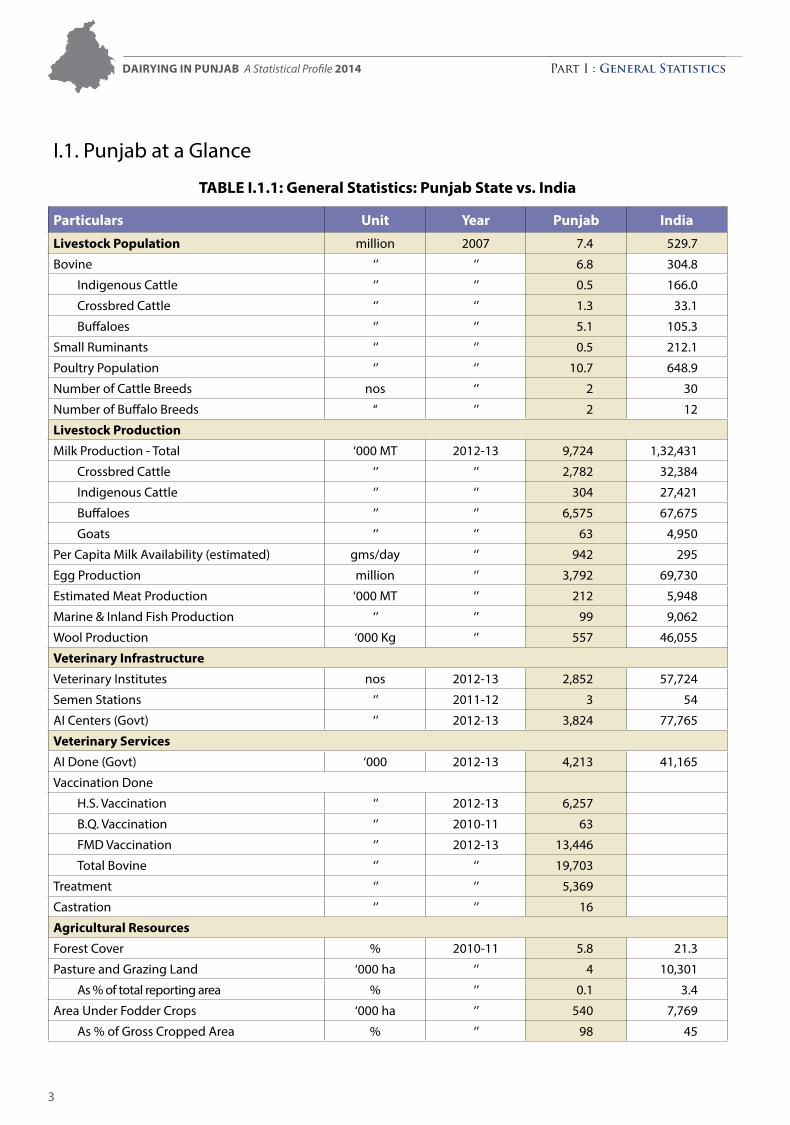
I.1. Punjab at a Glance
TabLE i.1.1: general Statistics: Punjab State vs. india
Particulars unit year Punjab india
State geography & rural infrastructure
Geographical Area ‘000 sq. km 2012 50.4 3,287.3
Districts nos 2011 20 640
Sub-Districts ‘’ ‘’ 77 5,924
Inhabited Villages ‘000 ‘’ 12.6 640.9
Households million ‘’ 5.5 249.4
rural Households
2001 ‘000 2001 2,796 1,37,414
2011 ‘’ 2011 3,358 1,68,565
rural Households with Electricity
2001 % 2001 89 44
2011 ‘’ 2011 94 55
rural Households with Tap water supply
2001 % 2001 16 24
2011 ‘’ 2011 34 31
Human Population
Population million 2011 27.7 1,210.1
Urban (As % of total) % ‘’ 37.4 31.2
Rural (As % of total) ‘’ ‘’ 62.5 68.8
Density of Population per sq. km ‘’ 550 382
Scheduled Castes (As % of total) % ‘’ 31.9 16.6
Scheduled Tribes (As % of total) ‘’ ‘’ 0 8.6
Sex Ratio Ratio ‘’ 893 940
Literacy rate (excluding population of 0 to 6 age group)
Male % 2011 81.5 82.1
Female ‘’ ‘’ 71.3 65.5
Urban ‘’ ‘’ 83.7 84.9
Rural ‘’ ‘’ 72.5 68.9
Per Capita Income (at current prices) ` 2012-13 88,783 69,585
Livestock Population million 2012 8.1 512.0
Bovine ‘’ ‘’ 7.6 299.9
Indigenous Cattle ‘’ ‘’ 0.4 151.2
Crossbred Cattle ‘’ ‘’ 2.1 39.7
Buffaloes ‘’ ‘’ 5.2 108.7
Small Ruminants ‘’ ‘’ 0.5 200.2
Poultry Population ‘’ ‘’ 16.8 729.2
Dairying in Punjab A Statistical Profile 2014 Part I : General Statistics
3
I.1. Punjab at a Glance
TabLE i.1.1: general Statistics: Punjab State vs. india
Particulars unit year Punjab india
Livestock Population million 2007 7.4 529.7
Bovine ‘’ ‘’ 6.8 304.8
Indigenous Cattle ‘’ ‘’ 0.5 166.0
Crossbred Cattle ‘’ ‘’ 1.3 33.1
Buffaloes ‘’ ‘’ 5.1 105.3
Small Ruminants ‘’ ‘’ 0.5 212.1
Poultry Population ‘’ ‘’ 10.7 648.9
Number of Cattle Breeds nos ‘’ 2 30
Number of Buffalo Breeds “ ‘’ 2 12
Livestock Production
Milk Production - Total ‘000 MT 2012-13 9,724 1,32,431
Crossbred Cattle ‘’ ‘’ 2,782 32,384
Indigenous Cattle ‘’ ‘’ 304 27,421
Buffaloes ‘’ ‘’ 6,575 67,675
Goats ‘’ ‘’ 63 4,950
Per Capita Milk Availability (estimated) gms/day ‘’ 942 295
Egg Production million ‘’ 3,792 69,730
Estimated Meat Production ‘000 MT ‘’ 212 5,948
Marine & Inland Fish Production ‘’ ‘’ 99 9,062
Wool Production ‘000 Kg ‘’ 557 46,055
Veterinary infrastructure
Veterinary Institutes nos 2012-13 2,852 57,724
Semen Stations ‘’ 2011-12 3 54
AI Centers (Govt) ‘’ 2012-13 3,824 77,765
Veterinary Services
AI Done (Govt) ‘000 2012-13 4,213 41,165
Vaccination Done
H.S. Vaccination ‘’ 2012-13 6,257
B.Q. Vaccination ‘’ 2010-11 63
FMD Vaccination ‘’ 2012-13 13,446
Total Bovine ‘’ ‘’ 19,703
Treatment ‘’ ‘’ 5,369
Castration ‘’ ‘’ 16
agricultural resources
Forest Cover % 2010-11 5.8 21.3
Pasture and Grazing Land ‘000 ha ‘’ 4 10,301
As % of total reporting area % ‘’ 0.1 3.4
Area Under Fodder Crops ‘000 ha ‘’ 540 7,769
As % of Gross Cropped Area % ‘’ 98 45
Dairying in Punjab A Statistical Profile 2014 Part I : General Statistics
4
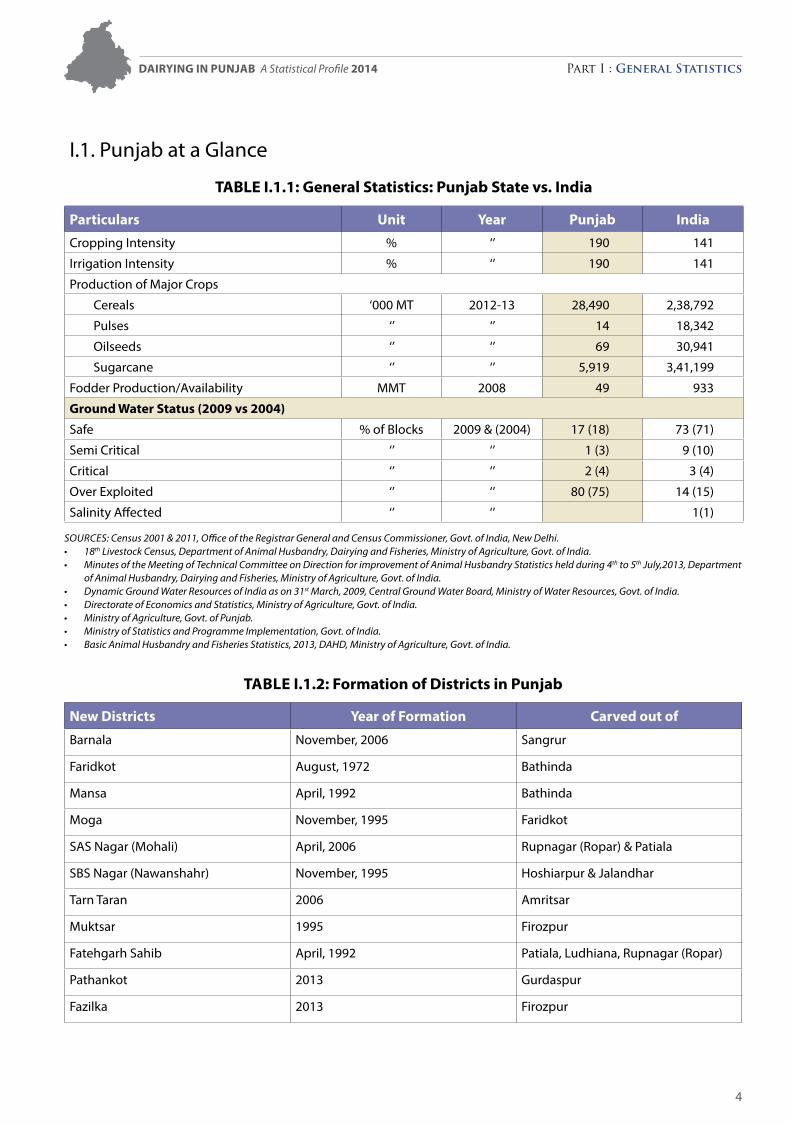
I.1. Punjab at a Glance
TabLE i.1.1: general Statistics: Punjab State vs. india
Particulars unit year Punjab india
Cropping Intensity % ‘’ 190 141
Irrigation Intensity % ‘’ 190 141
Production of Major Crops
Cereals ‘000 MT 2012-13 28,490 2,38,792
Pulses ‘’ ‘’ 14 18,342
Oilseeds ‘’ ‘’ 69 30,941
Sugarcane ‘’ ‘’ 5,919 3,41,199
Fodder Production/Availability MMT 2008 49 933
ground Water Status (2009 vs 2004)
Safe % of Blocks 2009 & (2004) 17 (18) 73 (71)
Semi Critical ‘’ ‘’ 1 (3) 9 (10)
Critical ‘’ ‘’ 2 (4) 3 (4)
Over Exploited ‘’ ‘’ 80 (75) 14 (15)
Salinity Affected ‘’ ‘’ 1(1)
SourceS: census 2001 & 2011, office of the registrar General and census commissioner, Govt. of India, New Delhi.• 18th Livestock census, Department of Animal Husbandry, Dairying and Fisheries, Ministry of Agriculture, Govt. of India.• MinutesoftheMeetingofTechnicalCommitteeonDirectionforimprovementofAnimalHusbandryStatisticsheldduring4th to 5th July,2013, Department
of Animal Husbandry, Dairying and Fisheries, Ministry of Agriculture, Govt. of India.• DynamicGroundWaterResourcesofIndiaason31stMarch,2009,CentralGroundWaterBoard,MinistryofWaterResources,Govt.ofIndia.• DirectorateofEconomicsandStatistics,MinistryofAgriculture,Govt.ofIndia.• MinistryofAgriculture,Govt.ofPunjab.• MinistryofStatisticsandProgrammeImplementation,Govt.ofIndia.• BasicAnimalHusbandryandFisheriesStatistics,2013,DAHD,MinistryofAgriculture,Govt.ofIndia.
TabLE i.1.2: Formation of Districts in Punjab
new Districts year of Formation Carved out of
Barnala November, 2006 Sangrur
Faridkot August, 1972 Bathinda
Mansa April, 1992 Bathinda
Moga November, 1995 Faridkot
SAS Nagar (Mohali) April, 2006 Rupnagar (Ropar) & Patiala
SBS Nagar (Nawanshahr) November, 1995 Hoshiarpur & Jalandhar
Tarn Taran 2006 Amritsar
Muktsar 1995 Firozpur
Fatehgarh Sahib April, 1992 Patiala, Ludhiana, Rupnagar (Ropar)
Pathankot 2013 Gurdaspur
Fazilka 2013 Firozpur
Dairying in Punjab A Statistical Profile 2014 Part I : General Statistics
5
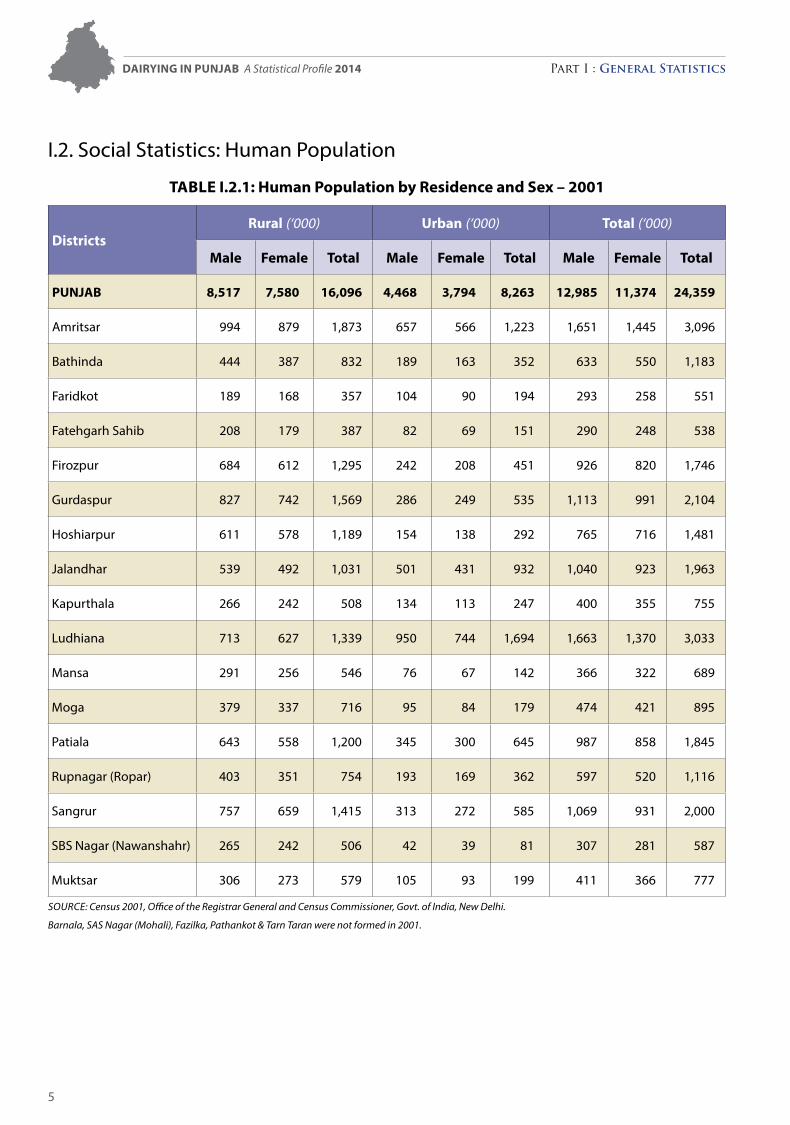
I.2. Social Statistics: Human Population
TabLE i.2.1: Human Population by residence and Sex – 2001
Districtsrural (‘000) urban (‘000) Total (‘000)
Male Female Total Male Female Total Male Female Total
Punjab 8,517 7,580 16,096 4,468 3,794 8,263 12,985 11,374 24,359
Amritsar 994 879 1,873 657 566 1,223 1,651 1,445 3,096
Bathinda 444 387 832 189 163 352 633 550 1,183
Faridkot 189 168 357 104 90 194 293 258 551
Fatehgarh Sahib 208 179 387 82 69 151 290 248 538
Firozpur 684 612 1,295 242 208 451 926 820 1,746
Gurdaspur 827 742 1,569 286 249 535 1,113 991 2,104
Hoshiarpur 611 578 1,189 154 138 292 765 716 1,481
Jalandhar 539 492 1,031 501 431 932 1,040 923 1,963
Kapurthala 266 242 508 134 113 247 400 355 755
Ludhiana 713 627 1,339 950 744 1,694 1,663 1,370 3,033
Mansa 291 256 546 76 67 142 366 322 689
Moga 379 337 716 95 84 179 474 421 895
Patiala 643 558 1,200 345 300 645 987 858 1,845
Rupnagar (Ropar) 403 351 754 193 169 362 597 520 1,116
Sangrur 757 659 1,415 313 272 585 1,069 931 2,000
SBS Nagar (Nawanshahr) 265 242 506 42 39 81 307 281 587
Muktsar 306 273 579 105 93 199 411 366 777
Source: census 2001, office of the registrar General and census commissioner, Govt. of India, New Delhi.
Barnala,SASNagar(Mohali),Fazilka,Pathankot&TarnTaranwerenotformedin2001.
Dairying in Punjab A Statistical Profile 2014 Part I : General Statistics
6
Dairying in Punjab A Statistical Profile 2014 Part I : General Statistics
7
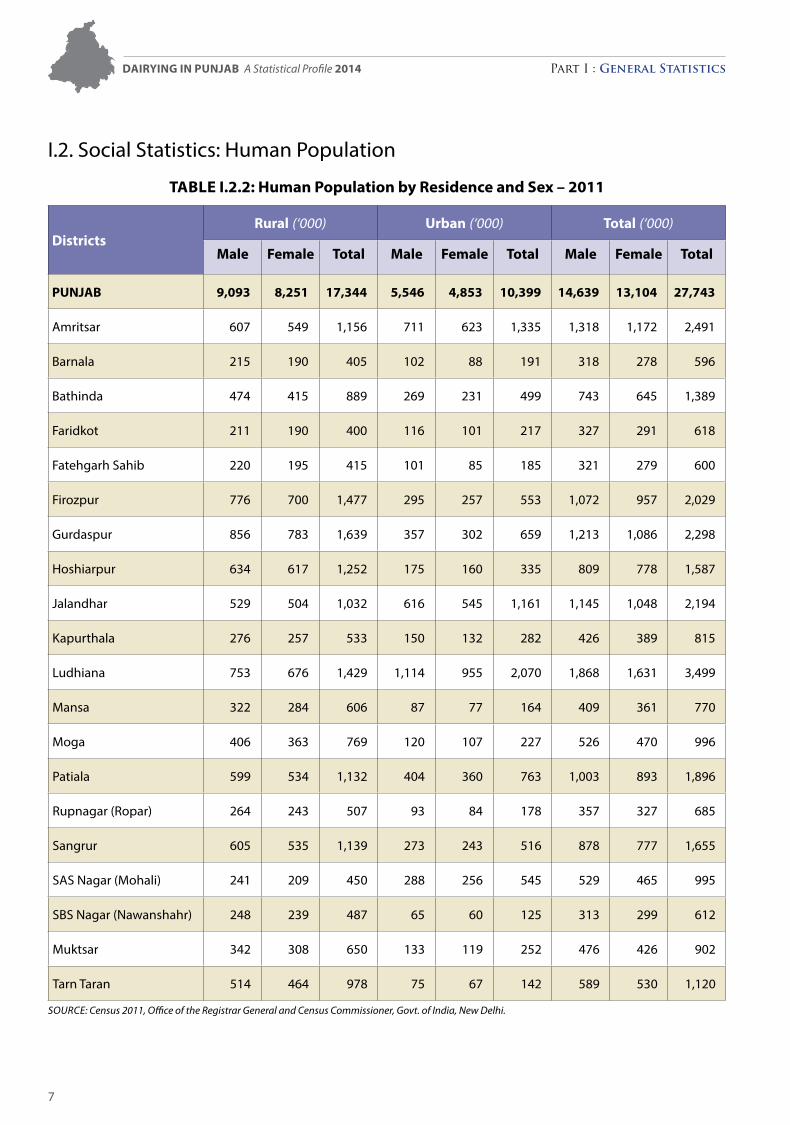
I.2. Social Statistics: Human Population
TabLE i.2.2: Human Population by residence and Sex – 2011
Districtsrural (‘000) urban (‘000) Total (‘000)
Male Female Total Male Female Total Male Female Total
Punjab 9,093 8,251 17,344 5,546 4,853 10,399 14,639 13,104 27,743
Amritsar 607 549 1,156 711 623 1,335 1,318 1,172 2,491
Barnala 215 190 405 102 88 191 318 278 596
Bathinda 474 415 889 269 231 499 743 645 1,389
Faridkot 211 190 400 116 101 217 327 291 618
Fatehgarh Sahib 220 195 415 101 85 185 321 279 600
Firozpur 776 700 1,477 295 257 553 1,072 957 2,029
Gurdaspur 856 783 1,639 357 302 659 1,213 1,086 2,298
Hoshiarpur 634 617 1,252 175 160 335 809 778 1,587
Jalandhar 529 504 1,032 616 545 1,161 1,145 1,048 2,194
Kapurthala 276 257 533 150 132 282 426 389 815
Ludhiana 753 676 1,429 1,114 955 2,070 1,868 1,631 3,499
Mansa 322 284 606 87 77 164 409 361 770
Moga 406 363 769 120 107 227 526 470 996
Patiala 599 534 1,132 404 360 763 1,003 893 1,896
Rupnagar (Ropar) 264 243 507 93 84 178 357 327 685
Sangrur 605 535 1,139 273 243 516 878 777 1,655
SAS Nagar (Mohali) 241 209 450 288 256 545 529 465 995
SBS Nagar (Nawanshahr) 248 239 487 65 60 125 313 299 612
Muktsar 342 308 650 133 119 252 476 426 902
Tarn Taran 514 464 978 75 67 142 589 530 1,120
Source: census 2011, office of the registrar General and census commissioner, Govt. of India, New Delhi.
Dairying in Punjab A Statistical Profile 2014 Part I : General Statistics
8
% Decadal growth rate of Population 1991-2001 2001-2011
% Sex ratio 2001 2011
Population Density 2001 2011
Dairying in Punjab A Statistical Profile 2014 Part I : General Statistics
9
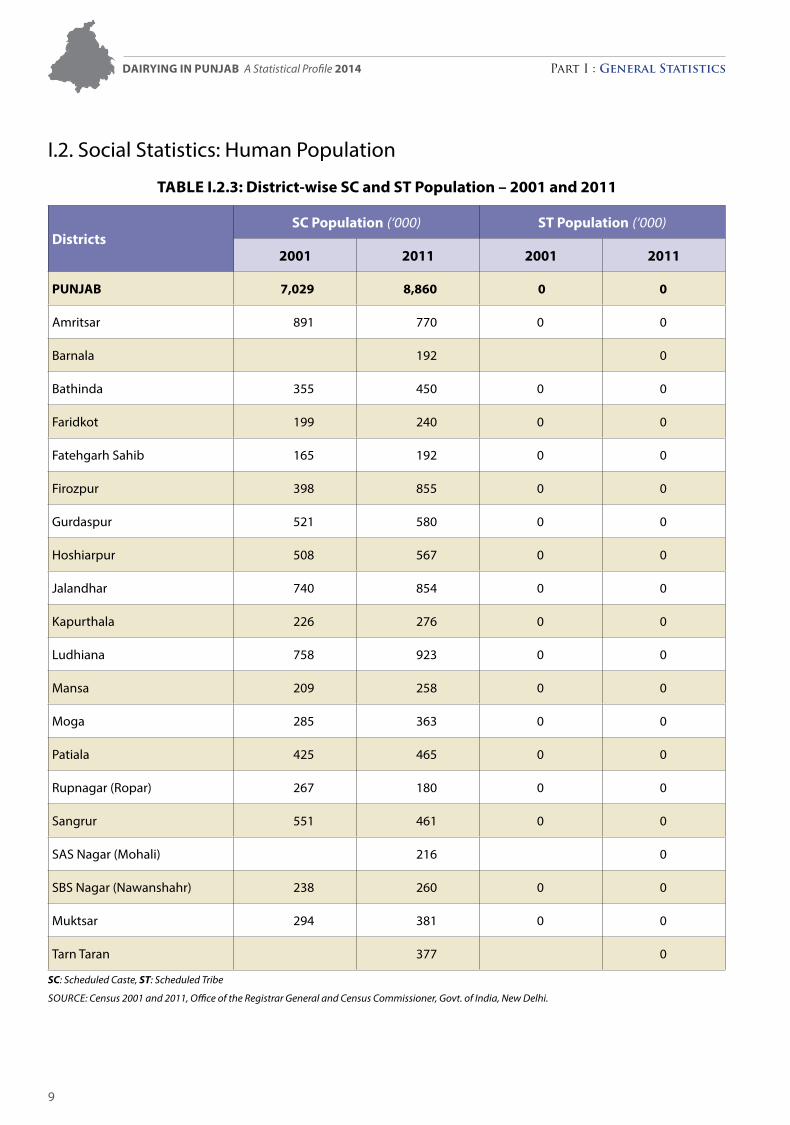
I.2. Social Statistics: Human Population
TabLE i.2.3: District-wise SC and ST Population – 2001 and 2011
DistrictsSC Population (‘000) ST Population (‘000)
2001 2011 2001 2011
Punjab 7,029 8,860 0 0
Amritsar 891 770 0 0
Barnala 192 0
Bathinda 355 450 0 0
Faridkot 199 240 0 0
Fatehgarh Sahib 165 192 0 0
Firozpur 398 855 0 0
Gurdaspur 521 580 0 0
Hoshiarpur 508 567 0 0
Jalandhar 740 854 0 0
Kapurthala 226 276 0 0
Ludhiana 758 923 0 0
Mansa 209 258 0 0
Moga 285 363 0 0
Patiala 425 465 0 0
Rupnagar (Ropar) 267 180 0 0
Sangrur 551 461 0 0
SAS Nagar (Mohali) 216 0
SBS Nagar (Nawanshahr) 238 260 0 0
Muktsar 294 381 0 0
Tarn Taran 377 0
SC: Scheduled caste, ST:ScheduledTribe
Source: census 2001 and 2011, office of the registrar General and census commissioner, Govt. of India, New Delhi.
Dairying in Punjab A Statistical Profile 2014 Part I : General Statistics
10
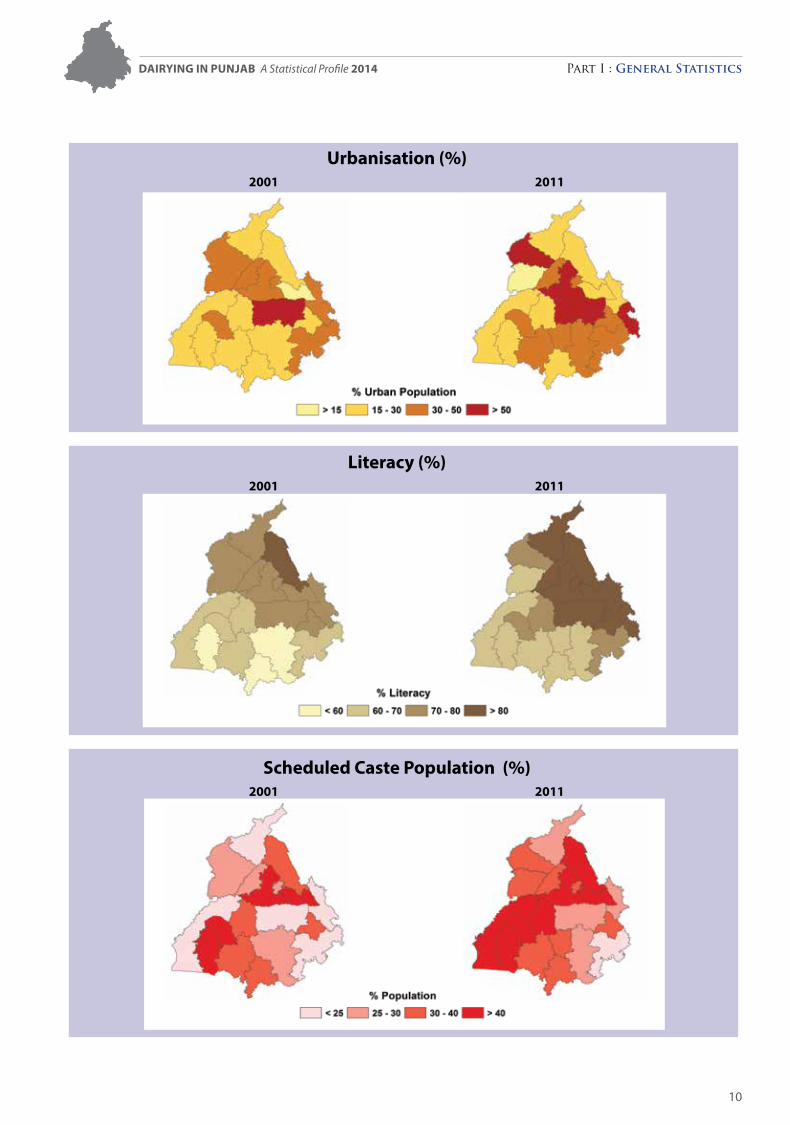
urbanisation (%) 2001 2011
Literacy (%) 2001 2011
Scheduled Caste Population (%) 2001 2011
Dairying in Punjab A Statistical Profile 2014 Part I : General Statistics
11
I.2. Social Statistics: Human Population
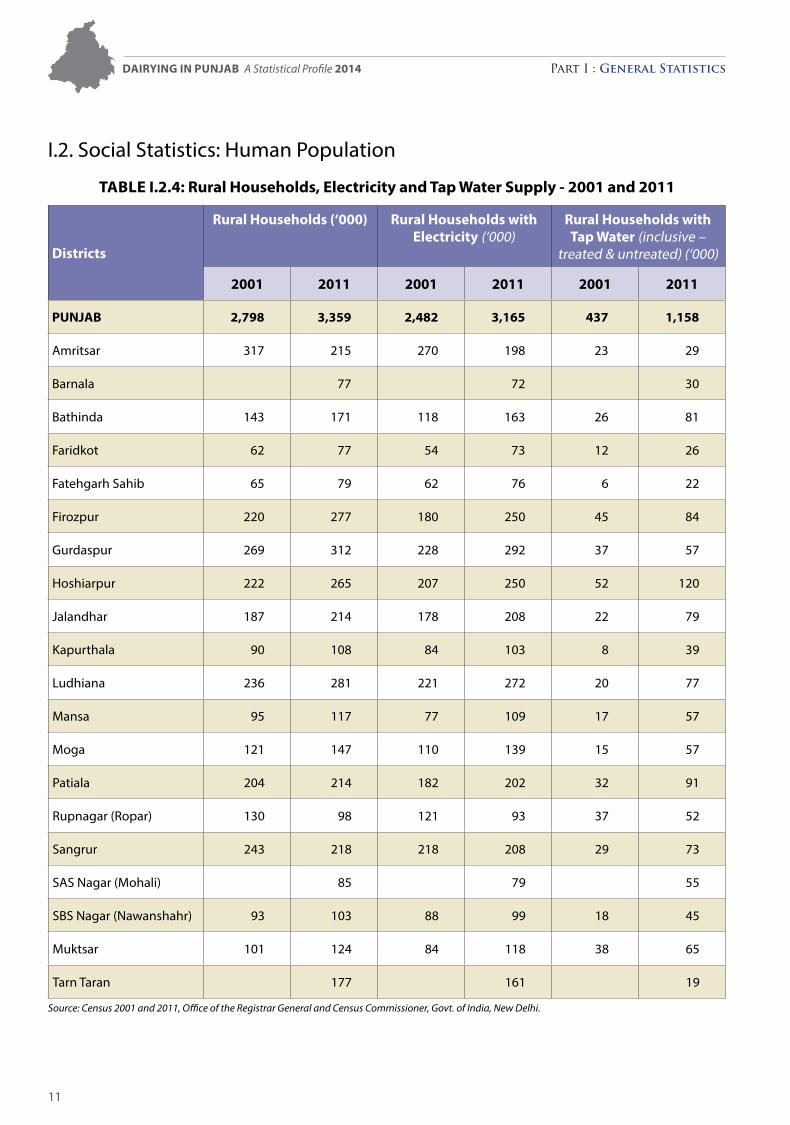
TabLE i.2.4: rural Households, Electricity and Tap Water Supply - 2001 and 2011
Districts
rural Households (‘000) rural Households with Electricity (‘000)
rural Households with Tap Water (inclusive –
treated & untreated) (‘000)
2001 2011 2001 2011 2001 2011
Punjab 2,798 3,359 2,482 3,165 437 1,158
Amritsar 317 215 270 198 23 29
Barnala 77 72 30
Bathinda 143 171 118 163 26 81
Faridkot 62 77 54 73 12 26
Fatehgarh Sahib 65 79 62 76 6 22
Firozpur 220 277 180 250 45 84
Gurdaspur 269 312 228 292 37 57
Hoshiarpur 222 265 207 250 52 120
Jalandhar 187 214 178 208 22 79
Kapurthala 90 108 84 103 8 39
Ludhiana 236 281 221 272 20 77
Mansa 95 117 77 109 17 57
Moga 121 147 110 139 15 57
Patiala 204 214 182 202 32 91
Rupnagar (Ropar) 130 98 121 93 37 52
Sangrur 243 218 218 208 29 73
SAS Nagar (Mohali) 85 79 55
SBS Nagar (Nawanshahr) 93 103 88 99 18 45
Muktsar 101 124 84 118 38 65
Tarn Taran 177 161 19
Source: census 2001 and 2011, office of the registrar General and census commissioner, Govt. of India, New Delhi.
Dairying in Punjab A Statistical Profile 2014 Part I : General Statistics
12
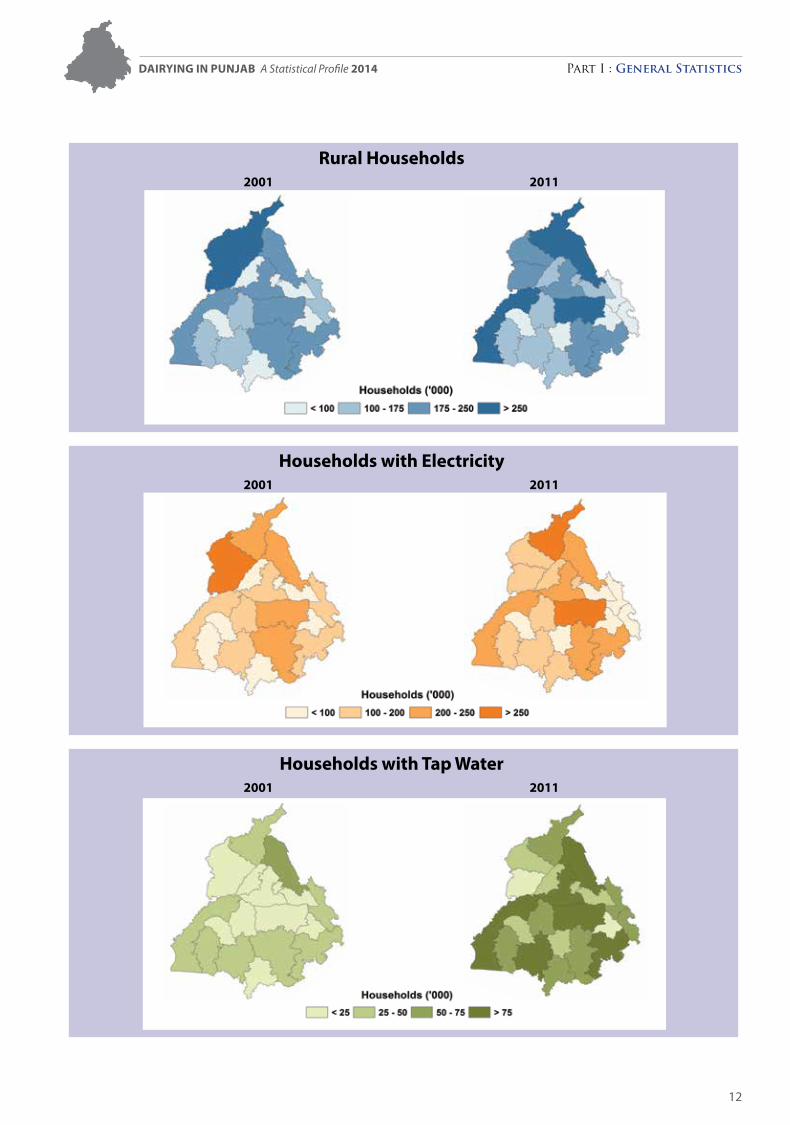
rural Households 2001 2011
Households with Electricity 2001 2011
Households with Tap Water 2001 2011
Dairying in Punjab A Statistical Profile 2014 Part I : General Statistics
13
I.3. State Economy
TabLE i.3.1: net State Domestic Product (nSDP) and Per Capita income
Sectorat Current Prices (` crores)
2004-05 2005-06 2006-07 2007-08 2008-09 2009-10 2010-11 2011-12 2012-13
State Domestic Product 86,108 95,902 1,13,013 1,35,706 1,54,827 1,76,187 2,02,020 2,32,524 2,64,537
1. Agriculture 28,368 31,041 35,594 43,128 49,514 54,028 59,392 65,690 72,279
2. Forestry & Logging 1,178 1,158 1,439 1,812 2,696 4,013 4,200 5,598 7,211
3. Fishing 243 292 319 296 326 414 435 486 526
4. Agriculture & Allied* (1+2+3) 29,788 32,491 37,351 45,237 52,536 58,455 64,026 71,773 80,017
As % of NSDP 34.59 33.88 33.05 33.33 33.93 33.18 31.69 30.87 30.25
Sub-total of Primary 29,806 32,510 37,371 45,260 52,579 58,478 64,047 71,801 80,047
As % of NSDP 34.62 33.90 33.07 33.35 33.96 33.19 31.70 30.88 30.26
Sub-total of Secondary 19,789 22,966 28,914 36,475 39,223 45,897 51,384 58,031 65,363
As % of NSDP 22.98 23.95 25.59 26.88 25.33 26.05 25.44 24.96 24.71
Services 36,513 40,426 46,727 53,971 63,025 71,812 86,589 1,02,692 1,19,128
As % of NSDP 42.40 42.15 41.35 39.77 40.71 40.76 42.86 44.16 45.03
Per Capita income (`) 33,103 36,199 41,883 49,380 55,315 61,805 69,580 78,633 88,783
Sectorat 2004-05 Prices (` crores)
2004-05 2005-06 2006-07 2007-08 2008-09 2009-10 2010-11 2011-12 2012-13
State Domestic Product 86,108 90,330 1,00,072 1,08,738 1,14,766 1,22,097 1,29,983 1,37,103 1,44,238
1. Agriculture 28,368 28,513 29,282 30,355 30,907 30,506 30,847 31,101 31,169
2. Forestry & Logging 1,178 1,217 1,250 1,280 1,330 1,375 1,416 1,466 1,521
3. Fishing 243 267 267 241 263 289 292 293 296
4. Agriculture & Allied* (1+2+3) 29,788 29,996 30,798 31,875 32,500 32,170 32,554 32,860 32,986
As % of NSDP 34.59 33.21 30.78 29.31 28.32 26.35 25.04 23.97 22.87
Sub-total of Primary 29,806 30,014 30,816 31,898 32,524 32,193 32,579 32,886 33,013
As % of NSDP 34.62 33.23 30.79 29.33 28.34 26.37 25.06 23.99 22.89
Sub-total of Secondary 19,789 21,649 27,283 31,822 32,987 36,353 38,699 39,975 41,416
As % of NSDP 22.98 23.97 27.26 29.26 28.74 29.77 29.77 29.16 28.71
Services 36,513 38,666 41,972 45,019 49,255 53,552 58,706 64,242 69,809
As % of NSDP 42.40 42.81 41.94 41.40 42.92 43.86 45.16 46.86 48.40
Per Capita income (`) 33,103 34,096 37,087 39,567 41,003 42,831 44,769 46,364 48,409
* Includes Livestock, Forestry & Fisheries.Source: Ministry of Statistics and Programme Implementation, Govt. of India.
Dairying in Punjab A Statistical Profile 2014 Part I : General Statistics
14
Dairying in Punjab A Statistical Profile 2014 Part I : General Statistics
15
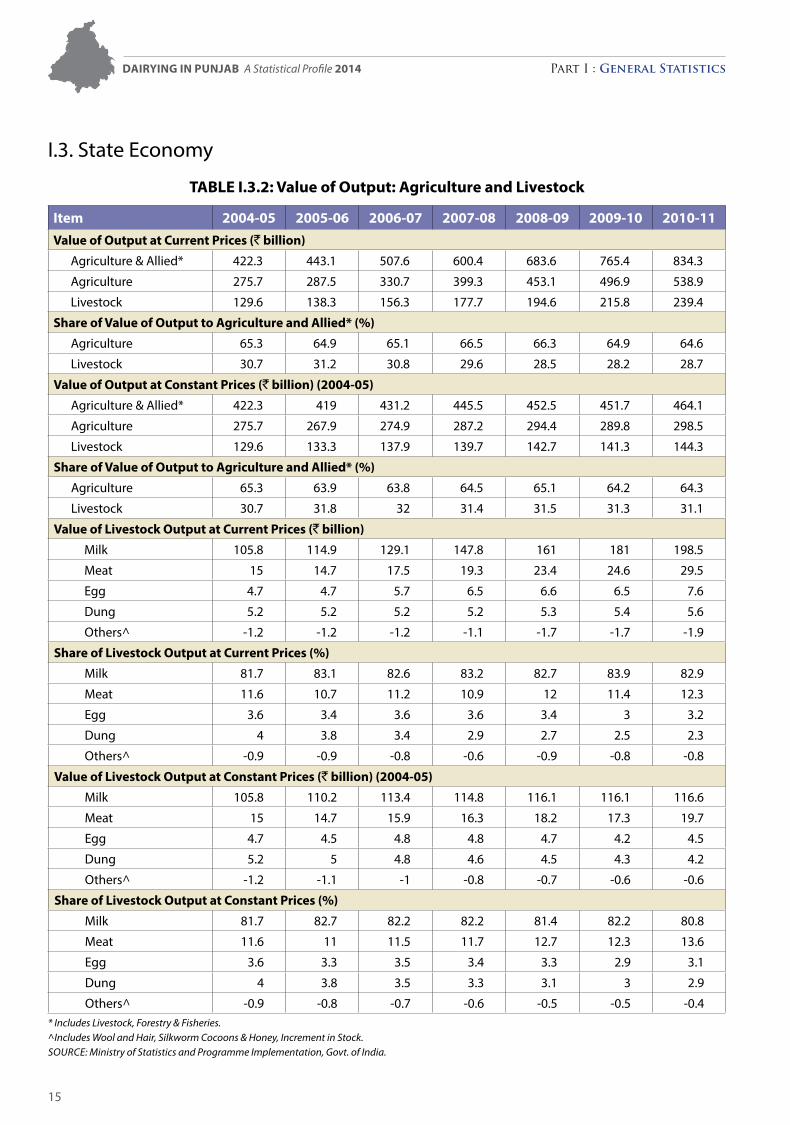
I.3. State Economy
TabLE i.3.2: Value of Output: agriculture and Livestock
item 2004-05 2005-06 2006-07 2007-08 2008-09 2009-10 2010-11Value of Output at Current Prices (` billion)
Agriculture & Allied* 422.3 443.1 507.6 600.4 683.6 765.4 834.3
Agriculture 275.7 287.5 330.7 399.3 453.1 496.9 538.9
Livestock 129.6 138.3 156.3 177.7 194.6 215.8 239.4
Share of Value of Output to agriculture and allied* (%)
Agriculture 65.3 64.9 65.1 66.5 66.3 64.9 64.6
Livestock 30.7 31.2 30.8 29.6 28.5 28.2 28.7
Value of Output at Constant Prices (` billion) (2004-05)
Agriculture & Allied* 422.3 419 431.2 445.5 452.5 451.7 464.1
Agriculture 275.7 267.9 274.9 287.2 294.4 289.8 298.5
Livestock 129.6 133.3 137.9 139.7 142.7 141.3 144.3
Share of Value of Output to agriculture and allied* (%)
Agriculture 65.3 63.9 63.8 64.5 65.1 64.2 64.3
Livestock 30.7 31.8 32 31.4 31.5 31.3 31.1
Value of Livestock Output at Current Prices (` billion)
Milk 105.8 114.9 129.1 147.8 161 181 198.5
Meat 15 14.7 17.5 19.3 23.4 24.6 29.5
Egg 4.7 4.7 5.7 6.5 6.6 6.5 7.6
Dung 5.2 5.2 5.2 5.2 5.3 5.4 5.6
Others^ -1.2 -1.2 -1.2 -1.1 -1.7 -1.7 -1.9
Share of Livestock Output at Current Prices (%)
Milk 81.7 83.1 82.6 83.2 82.7 83.9 82.9
Meat 11.6 10.7 11.2 10.9 12 11.4 12.3
Egg 3.6 3.4 3.6 3.6 3.4 3 3.2
Dung 4 3.8 3.4 2.9 2.7 2.5 2.3
Others^ -0.9 -0.9 -0.8 -0.6 -0.9 -0.8 -0.8
Value of Livestock Output at Constant Prices (` billion) (2004-05)
Milk 105.8 110.2 113.4 114.8 116.1 116.1 116.6
Meat 15 14.7 15.9 16.3 18.2 17.3 19.7
Egg 4.7 4.5 4.8 4.8 4.7 4.2 4.5
Dung 5.2 5 4.8 4.6 4.5 4.3 4.2
Others^ -1.2 -1.1 -1 -0.8 -0.7 -0.6 -0.6
Share of Livestock Output at Constant Prices (%)
Milk 81.7 82.7 82.2 82.2 81.4 82.2 80.8
Meat 11.6 11 11.5 11.7 12.7 12.3 13.6
Egg 3.6 3.3 3.5 3.4 3.3 2.9 3.1
Dung 4 3.8 3.5 3.3 3.1 3 2.9
Others^ -0.9 -0.8 -0.7 -0.6 -0.5 -0.5 -0.4* Includes Livestock, Forestry & Fisheries.^IncludesWoolandHair,SilkwormCocoons&Honey,IncrementinStock.Source: Ministry of Statistics and Programme Implementation, Govt. of India.
Dairying in Punjab A Statistical Profile 2014 Part I : General Statistics
16
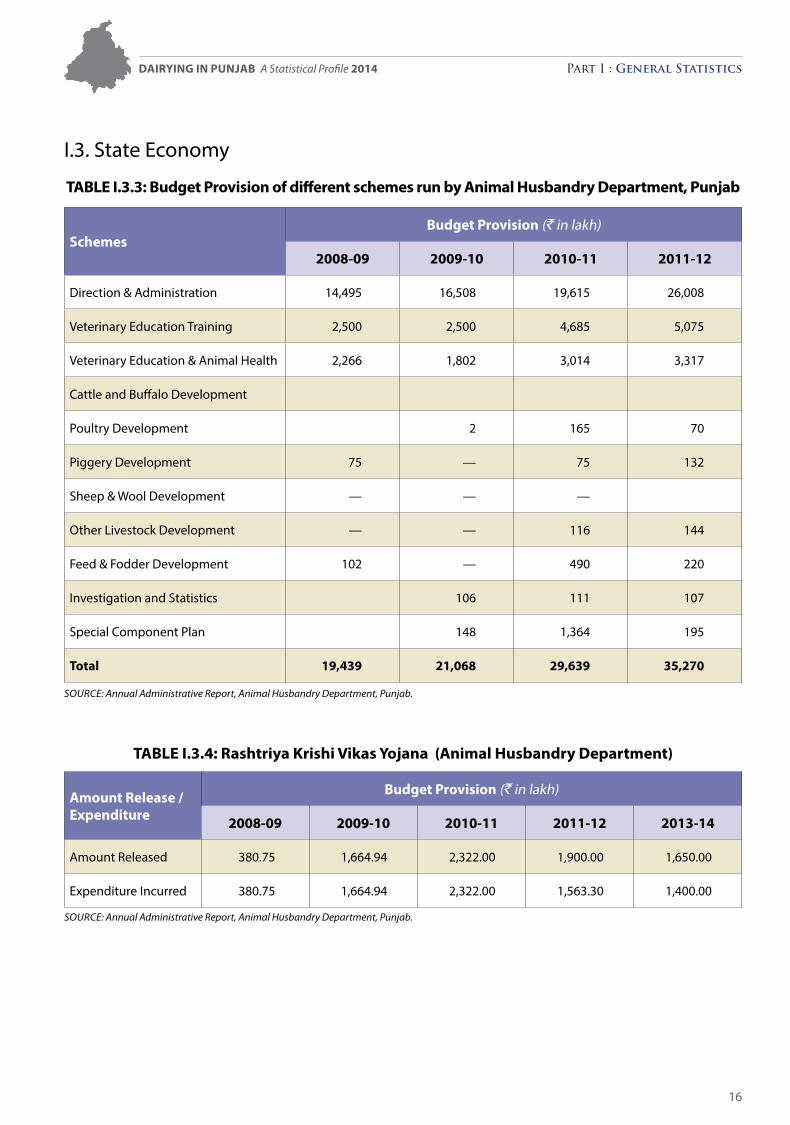
I.3. State Economy
TabLE i.3.3: budget Provision of different schemes run by animal Husbandry Department, Punjab
Schemesbudget Provision (` in lakh)
2008-09 2009-10 2010-11 2011-12
Direction & Administration 14,495 16,508 19,615 26,008
Veterinary Education Training 2,500 2,500 4,685 5,075
Veterinary Education & Animal Health 2,266 1,802 3,014 3,317
Cattle and Buffalo Development
Poultry Development 2 165 70
Piggery Development 75 — 75 132
Sheep & Wool Development — — —
Other Livestock Development — — 116 144
Feed & Fodder Development 102 — 490 220
Investigation and Statistics 106 111 107
Special Component Plan 148 1,364 195
Total 19,439 21,068 29,639 35,270
Source:AnnualAdministrativeReport,AnimalHusbandryDepartment,Punjab.
TabLE i.3.4: rashtriya Krishi Vikas yojana (animal Husbandry Department)
amount release / Expenditure
budget Provision (` in lakh)
2008-09 2009-10 2010-11 2011-12 2013-14
Amount Released 380.75 1,664.94 2,322.00 1,900.00 1,650.00
Expenditure Incurred 380.75 1,664.94 2,322.00 1,563.30 1,400.00
Source:AnnualAdministrativeReport,AnimalHusbandryDepartment,Punjab.
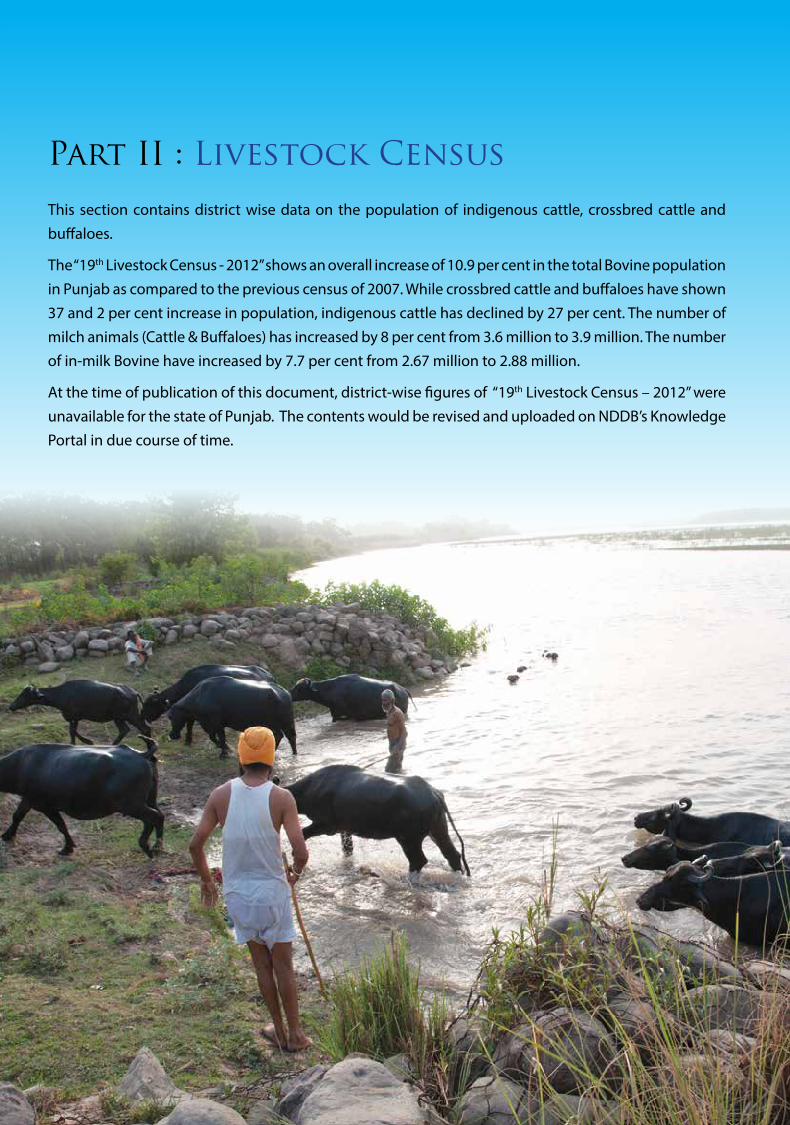
Part II : Livestock Census
This section contains district wise data on the population of indigenous cattle, crossbred cattle and buffaloes.
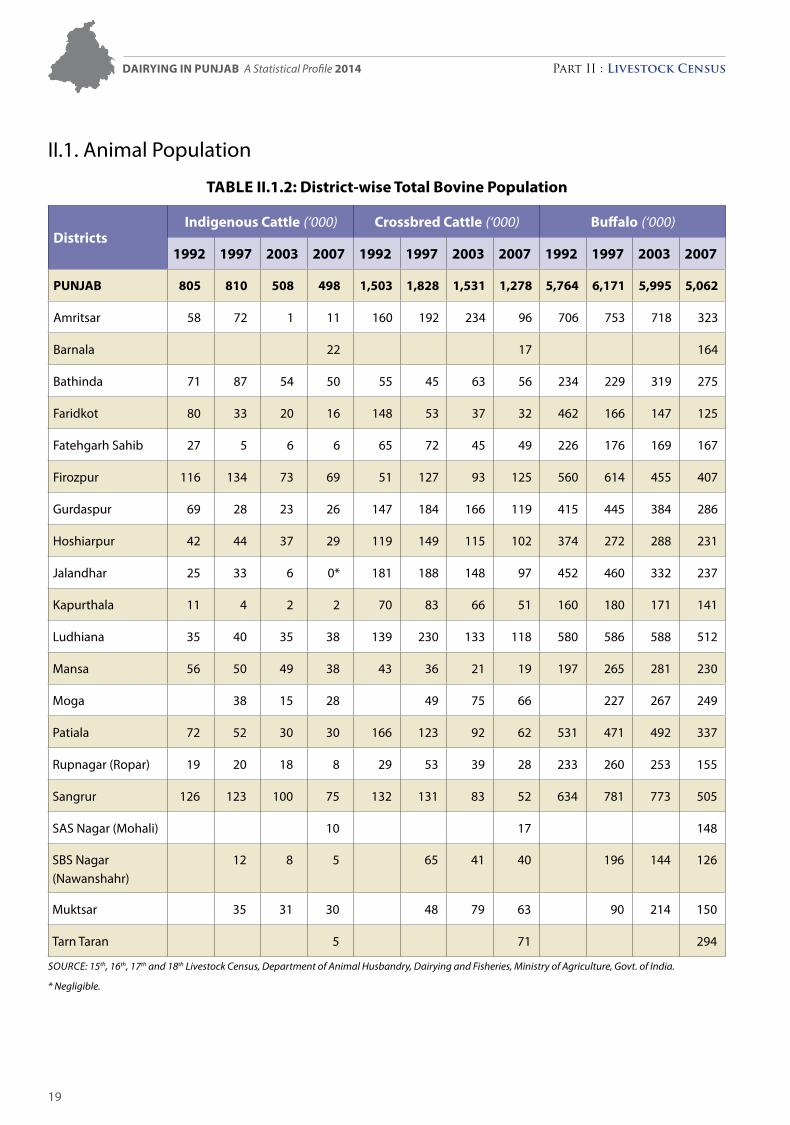
The “19th Livestock Census - 2012” shows an overall increase of 10.9 per cent in the total Bovine population in Punjab as compared to the previous census of 2007. While crossbred cattle and buffaloes have shown 37 and 2 per cent increase in population, indigenous cattle has declined by 27 per cent. The number of milch animals (Cattle & Buffaloes) has increased by 8 per cent from 3.6 million to 3.9 million. The number of in-milk Bovine have increased by 7.7 per cent from 2.67 million to 2.88 million.
At the time of publication of this document, district-wise figures of “19th Livestock Census – 2012” were unavailable for the state of Punjab. The contents would be revised and uploaded on NDDB’s Knowledge Portal in due course of time.
Dairying in Punjab A Statistical Profile 2014 Part II : Livestock Census
18
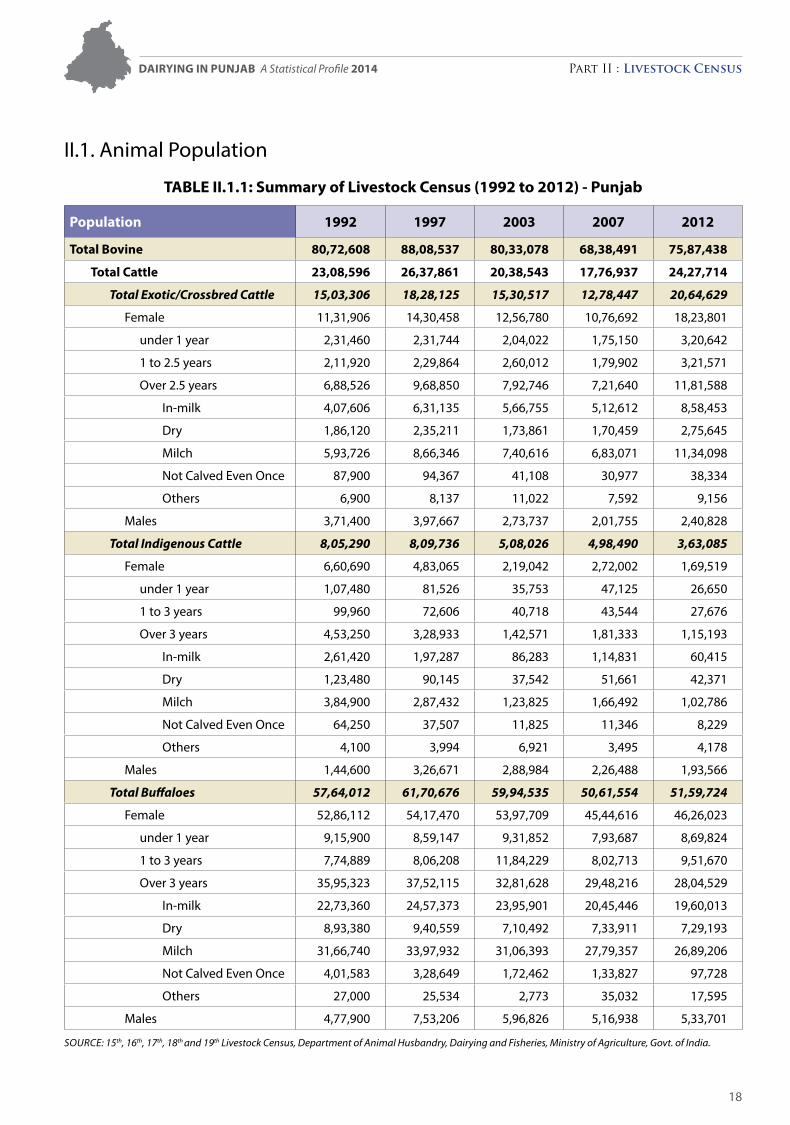
II.1. Animal Population
TabLE ii.1.1: Summary of Livestock Census (1992 to 2012) - Punjab
Population 1992 1997 2003 2007 2012
Total bovine 80,72,608 88,08,537 80,33,078 68,38,491 75,87,438
Total Cattle 23,08,596 26,37,861 20,38,543 17,76,937 24,27,714
Total Exotic/Crossbred Cattle 15,03,306 18,28,125 15,30,517 12,78,447 20,64,629
Female 11,31,906 14,30,458 12,56,780 10,76,692 18,23,801
under 1 year 2,31,460 2,31,744 2,04,022 1,75,150 3,20,642
1 to 2.5 years 2,11,920 2,29,864 2,60,012 1,79,902 3,21,571
Over 2.5 years 6,88,526 9,68,850 7,92,746 7,21,640 11,81,588
In-milk 4,07,606 6,31,135 5,66,755 5,12,612 8,58,453
Dry 1,86,120 2,35,211 1,73,861 1,70,459 2,75,645
Milch 5,93,726 8,66,346 7,40,616 6,83,071 11,34,098
Not Calved Even Once 87,900 94,367 41,108 30,977 38,334
Others 6,900 8,137 11,022 7,592 9,156
Males 3,71,400 3,97,667 2,73,737 2,01,755 2,40,828
Total Indigenous Cattle 8,05,290 8,09,736 5,08,026 4,98,490 3,63,085
Female 6,60,690 4,83,065 2,19,042 2,72,002 1,69,519
under 1 year 1,07,480 81,526 35,753 47,125 26,650
1 to 3 years 99,960 72,606 40,718 43,544 27,676
Over 3 years 4,53,250 3,28,933 1,42,571 1,81,333 1,15,193
In-milk 2,61,420 1,97,287 86,283 1,14,831 60,415
Dry 1,23,480 90,145 37,542 51,661 42,371
Milch 3,84,900 2,87,432 1,23,825 1,66,492 1,02,786
Not Calved Even Once 64,250 37,507 11,825 11,346 8,229
Others 4,100 3,994 6,921 3,495 4,178
Males 1,44,600 3,26,671 2,88,984 2,26,488 1,93,566
Total Buffaloes 57,64,012 61,70,676 59,94,535 50,61,554 51,59,724
Female 52,86,112 54,17,470 53,97,709 45,44,616 46,26,023
under 1 year 9,15,900 8,59,147 9,31,852 7,93,687 8,69,824
1 to 3 years 7,74,889 8,06,208 11,84,229 8,02,713 9,51,670
Over 3 years 35,95,323 37,52,115 32,81,628 29,48,216 28,04,529
In-milk 22,73,360 24,57,373 23,95,901 20,45,446 19,60,013
Dry 8,93,380 9,40,559 7,10,492 7,33,911 7,29,193
Milch 31,66,740 33,97,932 31,06,393 27,79,357 26,89,206
Not Calved Even Once 4,01,583 3,28,649 1,72,462 1,33,827 97,728
Others 27,000 25,534 2,773 35,032 17,595
Males 4,77,900 7,53,206 5,96,826 5,16,938 5,33,701
Source: 15th, 16th,17th,18th and 19th Livestock census, Department of Animal Husbandry, Dairying and Fisheries, Ministry of Agriculture, Govt. of India.
Dairying in Punjab A Statistical Profile 2014 Part II : Livestock Census
19
II.1. Animal Population
TabLE ii.1.2: District-wise Total bovine Population
Districtsindigenous Cattle (‘000) Crossbred Cattle (‘000) buffalo (‘000)
1992 1997 2003 2007 1992 1997 2003 2007 1992 1997 2003 2007
Punjab 805 810 508 498 1,503 1,828 1,531 1,278 5,764 6,171 5,995 5,062
Amritsar 58 72 1 11 160 192 234 96 706 753 718 323
Barnala 22 17 164
Bathinda 71 87 54 50 55 45 63 56 234 229 319 275
Faridkot 80 33 20 16 148 53 37 32 462 166 147 125
Fatehgarh Sahib 27 5 6 6 65 72 45 49 226 176 169 167
Firozpur 116 134 73 69 51 127 93 125 560 614 455 407
Gurdaspur 69 28 23 26 147 184 166 119 415 445 384 286
Hoshiarpur 42 44 37 29 119 149 115 102 374 272 288 231
Jalandhar 25 33 6 0* 181 188 148 97 452 460 332 237
Kapurthala 11 4 2 2 70 83 66 51 160 180 171 141
Ludhiana 35 40 35 38 139 230 133 118 580 586 588 512
Mansa 56 50 49 38 43 36 21 19 197 265 281 230
Moga 38 15 28 49 75 66 227 267 249
Patiala 72 52 30 30 166 123 92 62 531 471 492 337
Rupnagar (Ropar) 19 20 18 8 29 53 39 28 233 260 253 155
Sangrur 126 123 100 75 132 131 83 52 634 781 773 505
SAS Nagar (Mohali) 10 17 148
SBS Nagar (Nawanshahr)
12 8 5 65 41 40 196 144 126
Muktsar 35 31 30 48 79 63 90 214 150
Tarn Taran 5 71 294
Source: 15th, 16th,17thand18th Livestock census, Department of Animal Husbandry, Dairying and Fisheries, Ministry of Agriculture, Govt. of India.
* Negligible.
Dairying in Punjab A Statistical Profile 2014 Part II : Livestock Census
20
II.1. Animal Population
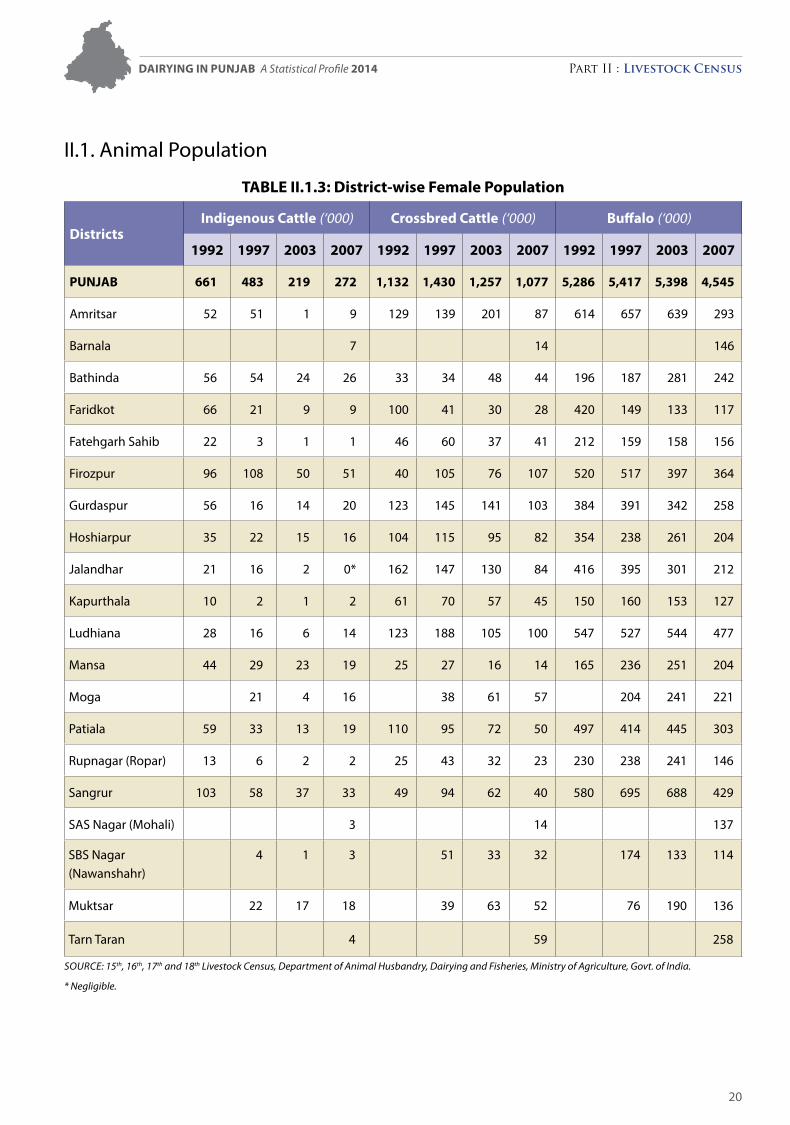
TabLE ii.1.3: District-wise Female Population
Districtsindigenous Cattle (‘000) Crossbred Cattle (‘000) buffalo (‘000)
1992 1997 2003 2007 1992 1997 2003 2007 1992 1997 2003 2007
Punjab 661 483 219 272 1,132 1,430 1,257 1,077 5,286 5,417 5,398 4,545
Amritsar 52 51 1 9 129 139 201 87 614 657 639 293
Barnala 7 14 146
Bathinda 56 54 24 26 33 34 48 44 196 187 281 242
Faridkot 66 21 9 9 100 41 30 28 420 149 133 117
Fatehgarh Sahib 22 3 1 1 46 60 37 41 212 159 158 156
Firozpur 96 108 50 51 40 105 76 107 520 517 397 364
Gurdaspur 56 16 14 20 123 145 141 103 384 391 342 258
Hoshiarpur 35 22 15 16 104 115 95 82 354 238 261 204
Jalandhar 21 16 2 0* 162 147 130 84 416 395 301 212
Kapurthala 10 2 1 2 61 70 57 45 150 160 153 127
Ludhiana 28 16 6 14 123 188 105 100 547 527 544 477
Mansa 44 29 23 19 25 27 16 14 165 236 251 204
Moga 21 4 16 38 61 57 204 241 221
Patiala 59 33 13 19 110 95 72 50 497 414 445 303
Rupnagar (Ropar) 13 6 2 2 25 43 32 23 230 238 241 146
Sangrur 103 58 37 33 49 94 62 40 580 695 688 429
SAS Nagar (Mohali) 3 14 137
SBS Nagar (Nawanshahr)
4 1 3 51 33 32 174 133 114
Muktsar 22 17 18 39 63 52 76 190 136
Tarn Taran 4 59 258
Source: 15th, 16th,17thand18th Livestock census, Department of Animal Husbandry, Dairying and Fisheries, Ministry of Agriculture, Govt. of India.
* Negligible.
Dairying in Punjab A Statistical Profile 2014 Part II : Livestock Census
21
II.1. Animal Population
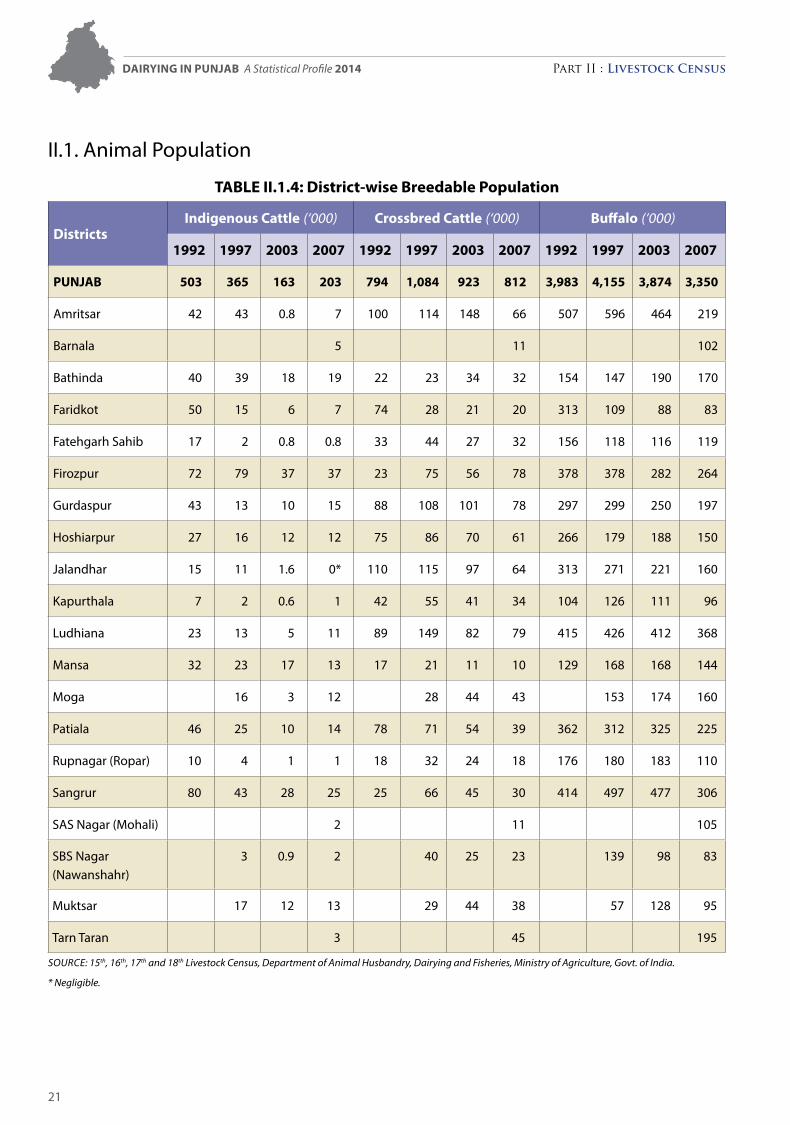
TabLE ii.1.4: District-wise breedable Population
Districtsindigenous Cattle (‘000) Crossbred Cattle (‘000) buffalo (‘000)
1992 1997 2003 2007 1992 1997 2003 2007 1992 1997 2003 2007
Punjab 503 365 163 203 794 1,084 923 812 3,983 4,155 3,874 3,350
Amritsar 42 43 0.8 7 100 114 148 66 507 596 464 219
Barnala 5 11 102
Bathinda 40 39 18 19 22 23 34 32 154 147 190 170
Faridkot 50 15 6 7 74 28 21 20 313 109 88 83
Fatehgarh Sahib 17 2 0.8 0.8 33 44 27 32 156 118 116 119
Firozpur 72 79 37 37 23 75 56 78 378 378 282 264
Gurdaspur 43 13 10 15 88 108 101 78 297 299 250 197
Hoshiarpur 27 16 12 12 75 86 70 61 266 179 188 150
Jalandhar 15 11 1.6 0* 110 115 97 64 313 271 221 160
Kapurthala 7 2 0.6 1 42 55 41 34 104 126 111 96
Ludhiana 23 13 5 11 89 149 82 79 415 426 412 368
Mansa 32 23 17 13 17 21 11 10 129 168 168 144
Moga 16 3 12 28 44 43 153 174 160
Patiala 46 25 10 14 78 71 54 39 362 312 325 225
Rupnagar (Ropar) 10 4 1 1 18 32 24 18 176 180 183 110
Sangrur 80 43 28 25 25 66 45 30 414 497 477 306
SAS Nagar (Mohali) 2 11 105
SBS Nagar (Nawanshahr)
3 0.9 2 40 25 23 139 98 83
Muktsar 17 12 13 29 44 38 57 128 95
Tarn Taran 3 45 195
Source: 15th, 16th,17thand18th Livestock census, Department of Animal Husbandry, Dairying and Fisheries, Ministry of Agriculture, Govt. of India.
* Negligible.
Dairying in Punjab A Statistical Profile 2014 Part II : Livestock Census
22
Dairying in Punjab A Statistical Profile 2014 Part II : Livestock Census
23
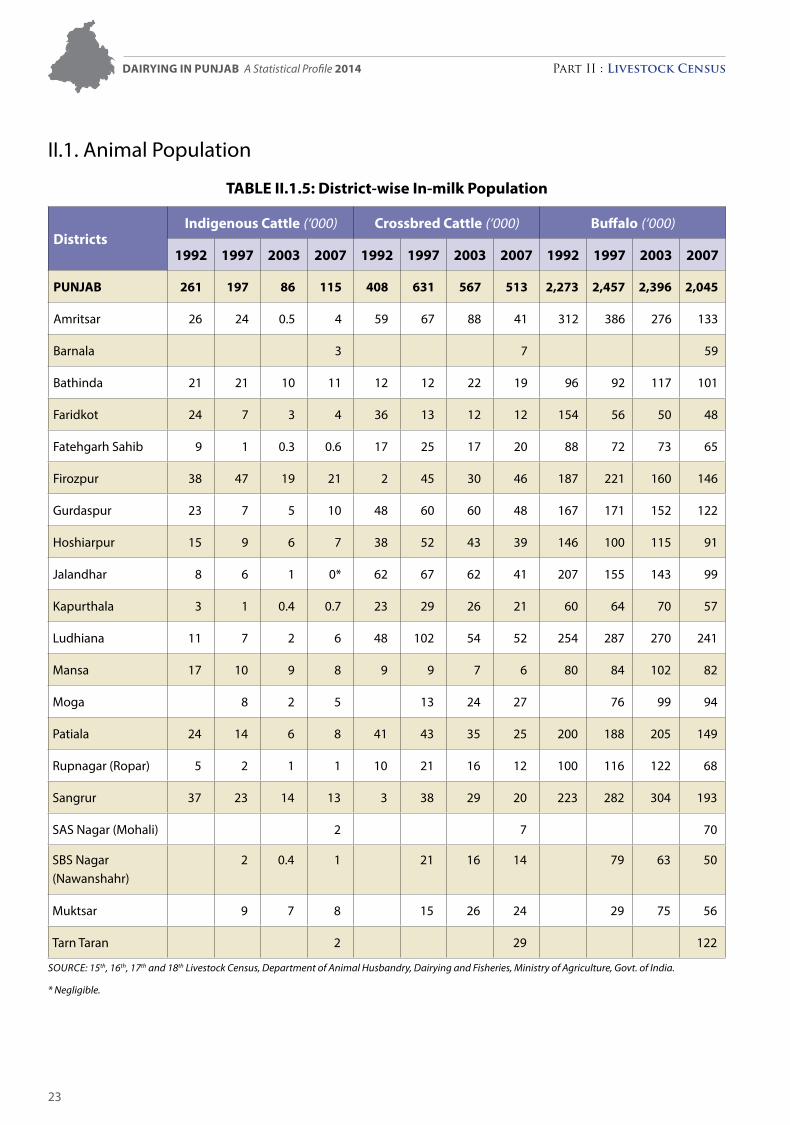
II.1. Animal Population
TabLE ii.1.5: District-wise in-milk Population
Districtsindigenous Cattle (‘000) Crossbred Cattle (‘000) buffalo (‘000)
1992 1997 2003 2007 1992 1997 2003 2007 1992 1997 2003 2007
Punjab 261 197 86 115 408 631 567 513 2,273 2,457 2,396 2,045
Amritsar 26 24 0.5 4 59 67 88 41 312 386 276 133
Barnala 3 7 59
Bathinda 21 21 10 11 12 12 22 19 96 92 117 101
Faridkot 24 7 3 4 36 13 12 12 154 56 50 48
Fatehgarh Sahib 9 1 0.3 0.6 17 25 17 20 88 72 73 65
Firozpur 38 47 19 21 2 45 30 46 187 221 160 146
Gurdaspur 23 7 5 10 48 60 60 48 167 171 152 122
Hoshiarpur 15 9 6 7 38 52 43 39 146 100 115 91
Jalandhar 8 6 1 0* 62 67 62 41 207 155 143 99
Kapurthala 3 1 0.4 0.7 23 29 26 21 60 64 70 57
Ludhiana 11 7 2 6 48 102 54 52 254 287 270 241
Mansa 17 10 9 8 9 9 7 6 80 84 102 82
Moga 8 2 5 13 24 27 76 99 94
Patiala 24 14 6 8 41 43 35 25 200 188 205 149
Rupnagar (Ropar) 5 2 1 1 10 21 16 12 100 116 122 68
Sangrur 37 23 14 13 3 38 29 20 223 282 304 193
SAS Nagar (Mohali) 2 7 70
SBS Nagar (Nawanshahr)
2 0.4 1 21 16 14 79 63 50
Muktsar 9 7 8 15 26 24 29 75 56
Tarn Taran 2 29 122
Source: 15th, 16th,17thand18th Livestock census, Department of Animal Husbandry, Dairying and Fisheries, Ministry of Agriculture, Govt. of India.
* Negligible.
Dairying in Punjab A Statistical Profile 2014 Part II : Livestock Census
24
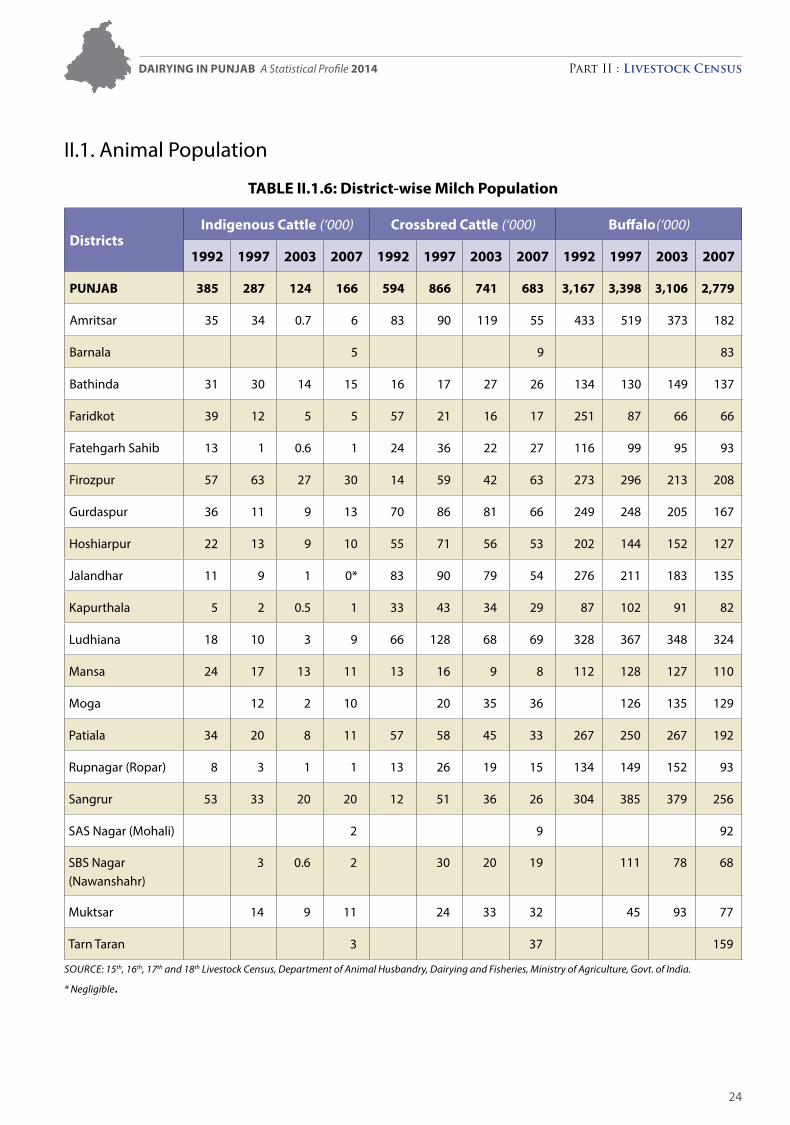
II.1. Animal Population
TabLE ii.1.6: District-wise Milch Population
Districtsindigenous Cattle (‘000) Crossbred Cattle (‘000) buffalo(‘000)
1992 1997 2003 2007 1992 1997 2003 2007 1992 1997 2003 2007
Punjab 385 287 124 166 594 866 741 683 3,167 3,398 3,106 2,779
Amritsar 35 34 0.7 6 83 90 119 55 433 519 373 182
Barnala 5 9 83
Bathinda 31 30 14 15 16 17 27 26 134 130 149 137
Faridkot 39 12 5 5 57 21 16 17 251 87 66 66
Fatehgarh Sahib 13 1 0.6 1 24 36 22 27 116 99 95 93
Firozpur 57 63 27 30 14 59 42 63 273 296 213 208
Gurdaspur 36 11 9 13 70 86 81 66 249 248 205 167
Hoshiarpur 22 13 9 10 55 71 56 53 202 144 152 127
Jalandhar 11 9 1 0* 83 90 79 54 276 211 183 135
Kapurthala 5 2 0.5 1 33 43 34 29 87 102 91 82
Ludhiana 18 10 3 9 66 128 68 69 328 367 348 324
Mansa 24 17 13 11 13 16 9 8 112 128 127 110
Moga 12 2 10 20 35 36 126 135 129
Patiala 34 20 8 11 57 58 45 33 267 250 267 192
Rupnagar (Ropar) 8 3 1 1 13 26 19 15 134 149 152 93
Sangrur 53 33 20 20 12 51 36 26 304 385 379 256
SAS Nagar (Mohali) 2 9 92
SBS Nagar (Nawanshahr)
3 0.6 2 30 20 19 111 78 68
Muktsar 14 9 11 24 33 32 45 93 77
Tarn Taran 3 37 159
Source: 15th, 16th,17thand18th Livestock census, Department of Animal Husbandry, Dairying and Fisheries, Ministry of Agriculture, Govt. of India.
* Negligible.
Dairying in Punjab A Statistical Profile 2014 Part II : Livestock Census
25
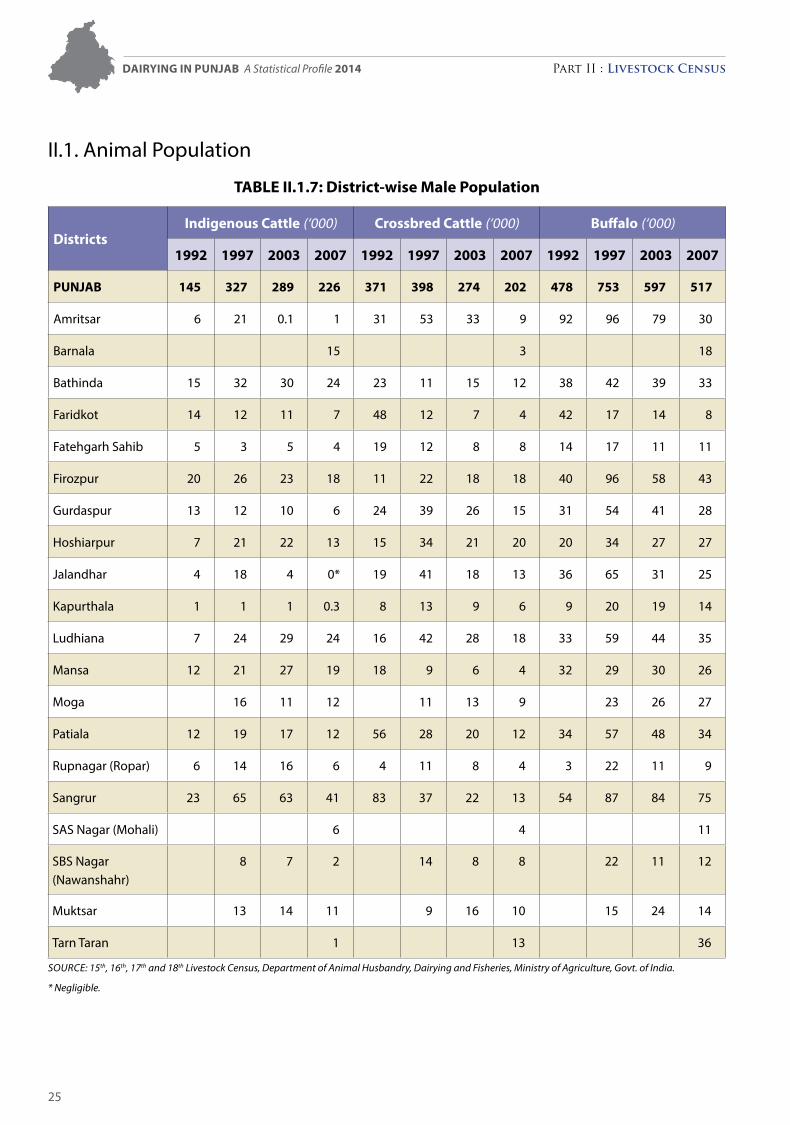
II.1. Animal Population
TabLE ii.1.7: District-wise Male Population
Districtsindigenous Cattle (‘000) Crossbred Cattle (‘000) buffalo (‘000)
1992 1997 2003 2007 1992 1997 2003 2007 1992 1997 2003 2007
Punjab 145 327 289 226 371 398 274 202 478 753 597 517
Amritsar 6 21 0.1 1 31 53 33 9 92 96 79 30
Barnala 15 3 18
Bathinda 15 32 30 24 23 11 15 12 38 42 39 33
Faridkot 14 12 11 7 48 12 7 4 42 17 14 8
Fatehgarh Sahib 5 3 5 4 19 12 8 8 14 17 11 11
Firozpur 20 26 23 18 11 22 18 18 40 96 58 43
Gurdaspur 13 12 10 6 24 39 26 15 31 54 41 28
Hoshiarpur 7 21 22 13 15 34 21 20 20 34 27 27
Jalandhar 4 18 4 0* 19 41 18 13 36 65 31 25
Kapurthala 1 1 1 0.3 8 13 9 6 9 20 19 14
Ludhiana 7 24 29 24 16 42 28 18 33 59 44 35
Mansa 12 21 27 19 18 9 6 4 32 29 30 26
Moga 16 11 12 11 13 9 23 26 27
Patiala 12 19 17 12 56 28 20 12 34 57 48 34
Rupnagar (Ropar) 6 14 16 6 4 11 8 4 3 22 11 9
Sangrur 23 65 63 41 83 37 22 13 54 87 84 75
SAS Nagar (Mohali) 6 4 11
SBS Nagar (Nawanshahr)
8 7 2 14 8 8 22 11 12
Muktsar 13 14 11 9 16 10 15 24 14
Tarn Taran 1 13 36
Source: 15th, 16th,17thand18th Livestock census, Department of Animal Husbandry, Dairying and Fisheries, Ministry of Agriculture, Govt. of India.
* Negligible.
Dairying in Punjab A Statistical Profile 2014 Part II : Livestock Census
26
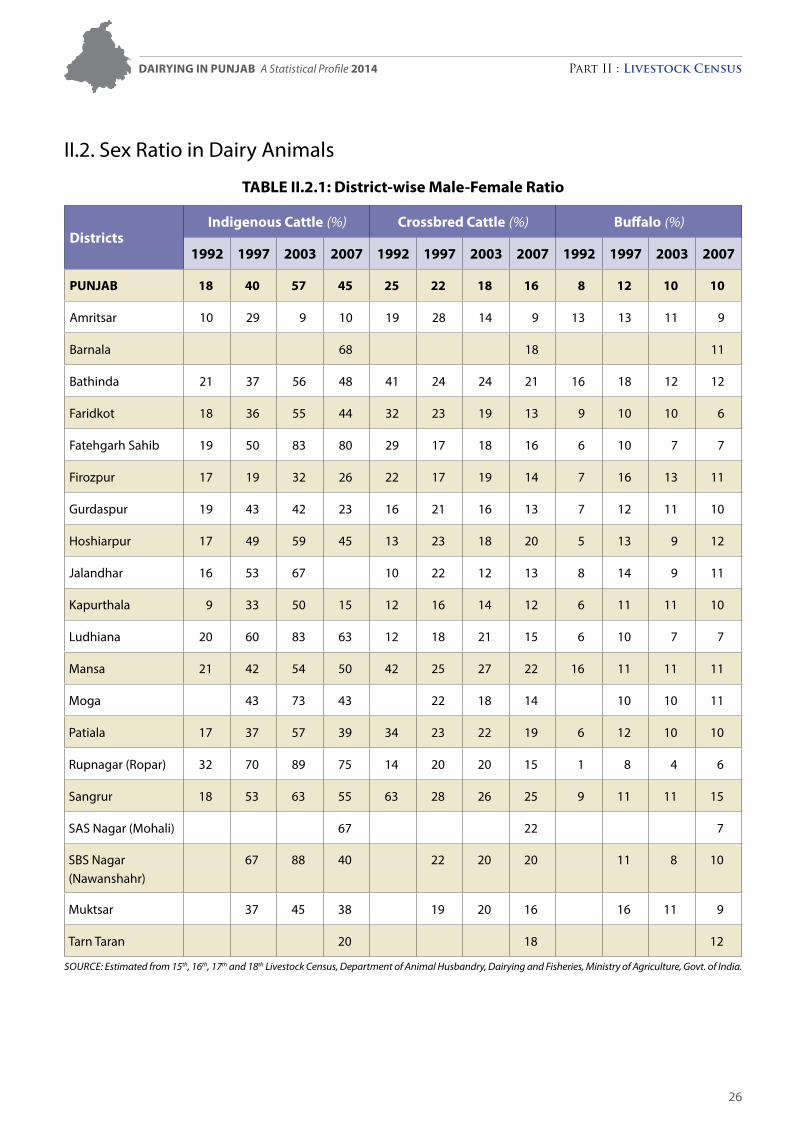
II.2. Sex Ratio in Dairy Animals
TabLE ii.2.1: District-wise Male-Female ratio
Districtsindigenous Cattle (%) Crossbred Cattle (%) buffalo (%)
1992 1997 2003 2007 1992 1997 2003 2007 1992 1997 2003 2007
Punjab 18 40 57 45 25 22 18 16 8 12 10 10
Amritsar 10 29 9 10 19 28 14 9 13 13 11 9
Barnala 68 18 11
Bathinda 21 37 56 48 41 24 24 21 16 18 12 12
Faridkot 18 36 55 44 32 23 19 13 9 10 10 6
Fatehgarh Sahib 19 50 83 80 29 17 18 16 6 10 7 7
Firozpur 17 19 32 26 22 17 19 14 7 16 13 11
Gurdaspur 19 43 42 23 16 21 16 13 7 12 11 10
Hoshiarpur 17 49 59 45 13 23 18 20 5 13 9 12
Jalandhar 16 53 67 10 22 12 13 8 14 9 11
Kapurthala 9 33 50 15 12 16 14 12 6 11 11 10
Ludhiana 20 60 83 63 12 18 21 15 6 10 7 7
Mansa 21 42 54 50 42 25 27 22 16 11 11 11
Moga 43 73 43 22 18 14 10 10 11
Patiala 17 37 57 39 34 23 22 19 6 12 10 10
Rupnagar (Ropar) 32 70 89 75 14 20 20 15 1 8 4 6
Sangrur 18 53 63 55 63 28 26 25 9 11 11 15
SAS Nagar (Mohali) 67 22 7
SBS Nagar (Nawanshahr)
67 88 40 22 20 20 11 8 10
Muktsar 37 45 38 19 20 16 16 11 9
Tarn Taran 20 18 12
Source: estimated from 15th, 16th,17thand18th Livestock census, Department of Animal Husbandry, Dairying and Fisheries, Ministry of Agriculture, Govt. of India.
Dairying in Punjab A Statistical Profile 2014 Part II : Livestock Census
27
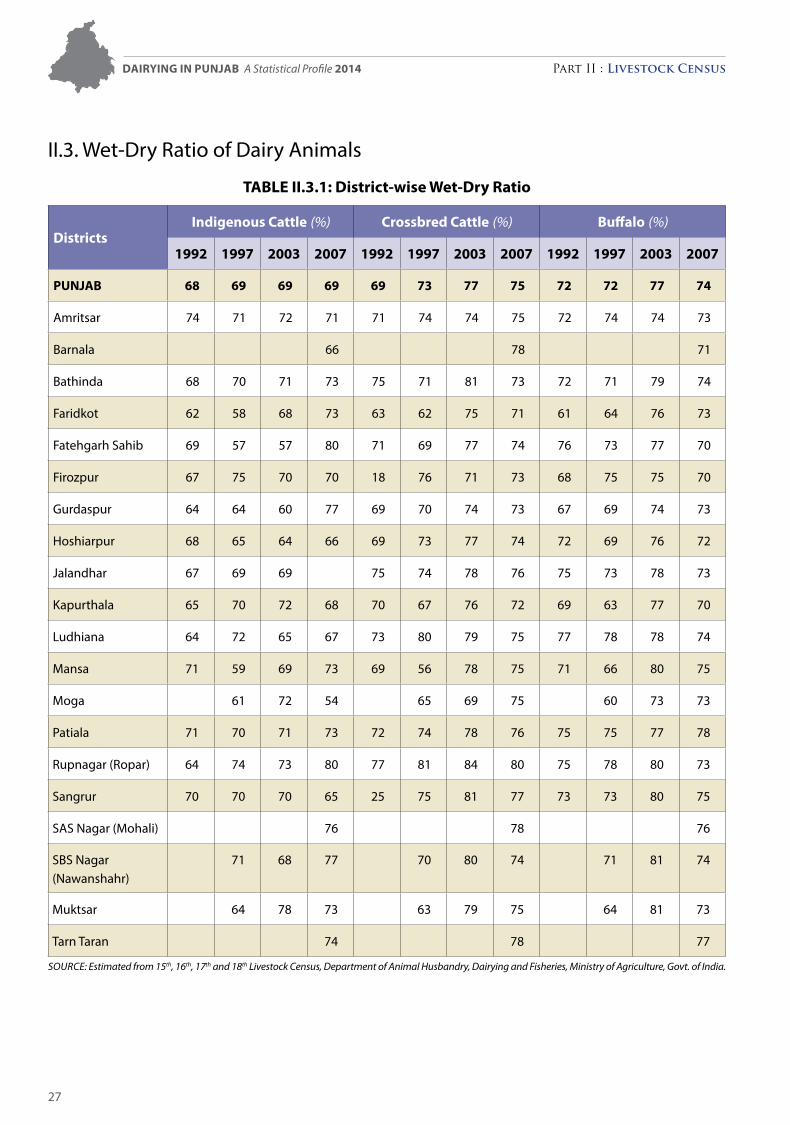
II.3. Wet-Dry Ratio of Dairy Animals
TabLE ii.3.1: District-wise Wet-Dry ratio
Districtsindigenous Cattle (%) Crossbred Cattle (%) buffalo (%)
1992 1997 2003 2007 1992 1997 2003 2007 1992 1997 2003 2007
Punjab 68 69 69 69 69 73 77 75 72 72 77 74
Amritsar 74 71 72 71 71 74 74 75 72 74 74 73
Barnala 66 78 71
Bathinda 68 70 71 73 75 71 81 73 72 71 79 74
Faridkot 62 58 68 73 63 62 75 71 61 64 76 73
Fatehgarh Sahib 69 57 57 80 71 69 77 74 76 73 77 70
Firozpur 67 75 70 70 18 76 71 73 68 75 75 70
Gurdaspur 64 64 60 77 69 70 74 73 67 69 74 73
Hoshiarpur 68 65 64 66 69 73 77 74 72 69 76 72
Jalandhar 67 69 69 75 74 78 76 75 73 78 73
Kapurthala 65 70 72 68 70 67 76 72 69 63 77 70
Ludhiana 64 72 65 67 73 80 79 75 77 78 78 74
Mansa 71 59 69 73 69 56 78 75 71 66 80 75
Moga 61 72 54 65 69 75 60 73 73
Patiala 71 70 71 73 72 74 78 76 75 75 77 78
Rupnagar (Ropar) 64 74 73 80 77 81 84 80 75 78 80 73
Sangrur 70 70 70 65 25 75 81 77 73 73 80 75
SAS Nagar (Mohali) 76 78 76
SBS Nagar (Nawanshahr)
71 68 77 70 80 74 71 81 74
Muktsar 64 78 73 63 79 75 64 81 73
Tarn Taran 74 78 77
Source: estimated from 15th, 16th,17thand18th Livestock census, Department of Animal Husbandry, Dairying and Fisheries, Ministry of Agriculture, Govt. of India.
Dairying in Punjab A Statistical Profile 2014 Part II : Livestock Census
28
Dairying in Punjab A Statistical Profile 2014 Part II : Livestock Census
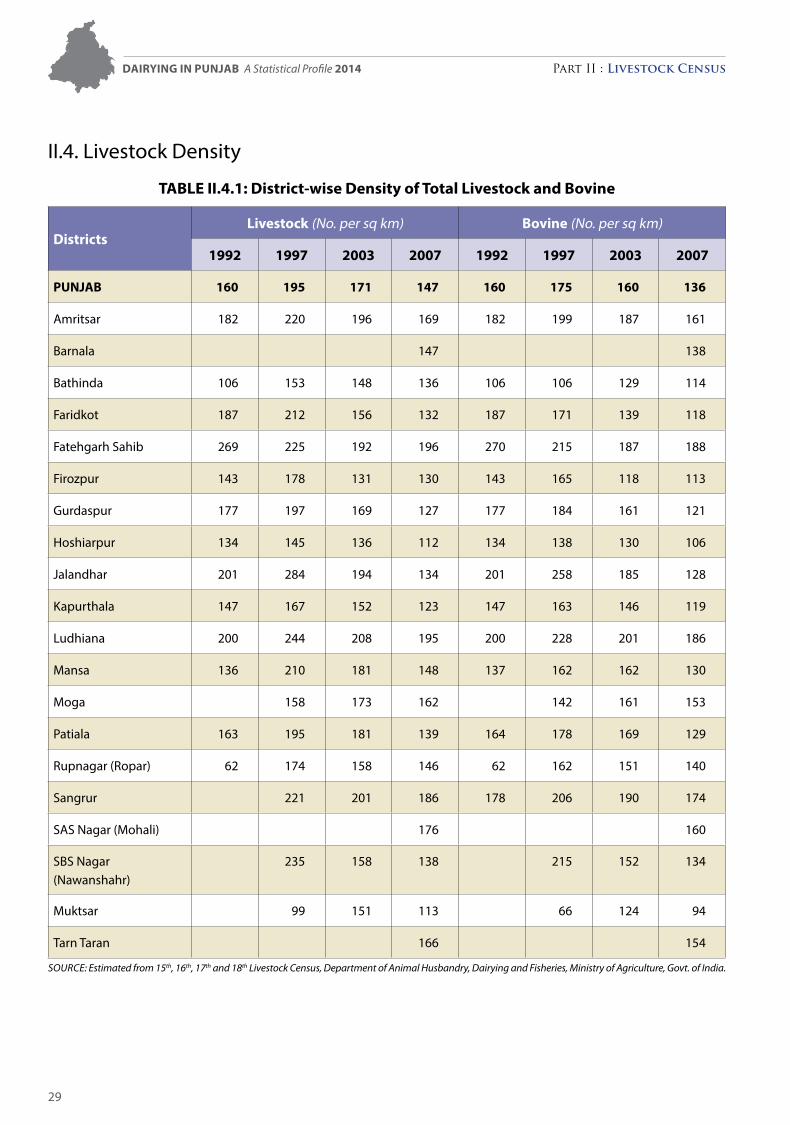
29
II.4. Livestock Density
TabLE ii.4.1: District-wise Density of Total Livestock and bovine
DistrictsLivestock (No. per sq km) bovine (No. per sq km)
1992 1997 2003 2007 1992 1997 2003 2007
Punjab 160 195 171 147 160 175 160 136
Amritsar 182 220 196 169 182 199 187 161
Barnala 147 138
Bathinda 106 153 148 136 106 106 129 114
Faridkot 187 212 156 132 187 171 139 118
Fatehgarh Sahib 269 225 192 196 270 215 187 188
Firozpur 143 178 131 130 143 165 118 113
Gurdaspur 177 197 169 127 177 184 161 121
Hoshiarpur 134 145 136 112 134 138 130 106
Jalandhar 201 284 194 134 201 258 185 128
Kapurthala 147 167 152 123 147 163 146 119
Ludhiana 200 244 208 195 200 228 201 186
Mansa 136 210 181 148 137 162 162 130
Moga 158 173 162 142 161 153
Patiala 163 195 181 139 164 178 169 129
Rupnagar (Ropar) 62 174 158 146 62 162 151 140
Sangrur 221 201 186 178 206 190 174
SAS Nagar (Mohali) 176 160
SBS Nagar (Nawanshahr)
235 158 138 215 152 134
Muktsar 99 151 113 66 124 94
Tarn Taran 166 154
Source: estimated from 15th, 16th,17thand18th Livestock census, Department of Animal Husbandry, Dairying and Fisheries, Ministry of Agriculture, Govt. of India.
Dairying in Punjab A Statistical Profile 2014 Part II : Livestock Census
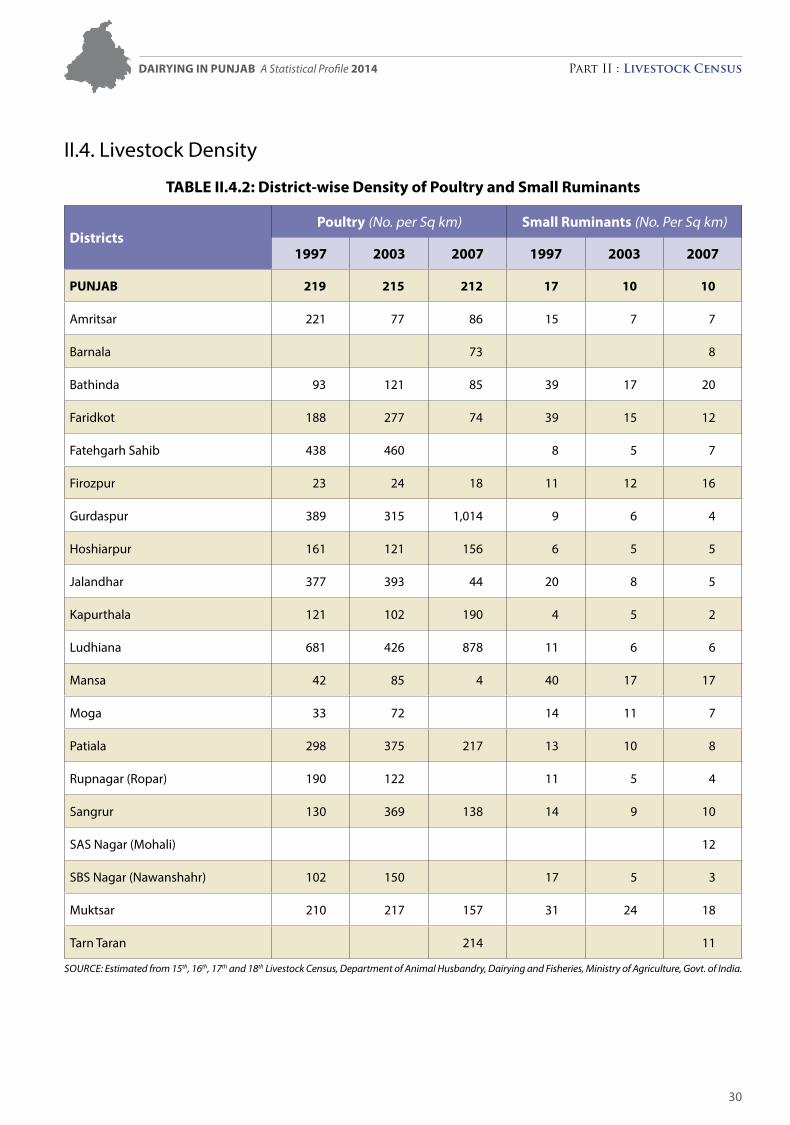
30
II.4. Livestock Density
TabLE ii.4.2: District-wise Density of Poultry and Small ruminants
DistrictsPoultry (No. per Sq km) Small ruminants (No. Per Sq km)
1997 2003 2007 1997 2003 2007
Punjab 219 215 212 17 10 10
Amritsar 221 77 86 15 7 7
Barnala 73 8
Bathinda 93 121 85 39 17 20
Faridkot 188 277 74 39 15 12
Fatehgarh Sahib 438 460 8 5 7
Firozpur 23 24 18 11 12 16
Gurdaspur 389 315 1,014 9 6 4
Hoshiarpur 161 121 156 6 5 5
Jalandhar 377 393 44 20 8 5
Kapurthala 121 102 190 4 5 2
Ludhiana 681 426 878 11 6 6
Mansa 42 85 4 40 17 17
Moga 33 72 14 11 7
Patiala 298 375 217 13 10 8
Rupnagar (Ropar) 190 122 11 5 4
Sangrur 130 369 138 14 9 10
SAS Nagar (Mohali) 12
SBS Nagar (Nawanshahr) 102 150 17 5 3
Muktsar 210 217 157 31 24 18
Tarn Taran 214 11
Source: estimated from 15th, 16th,17thand18th Livestock census, Department of Animal Husbandry, Dairying and Fisheries, Ministry of Agriculture, Govt. of India.
Dairying in Punjab A Statistical Profile 2014 Part II : Livestock Census
31
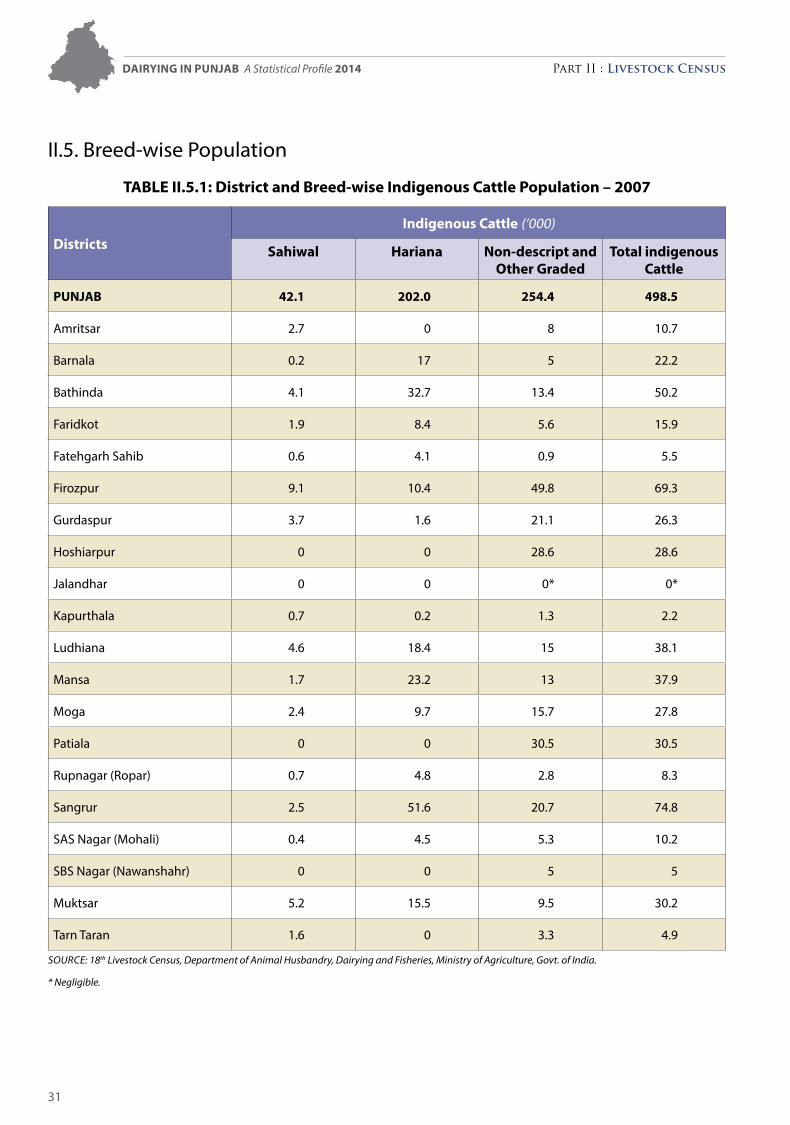
II.5. Breed-wise Population
TabLE ii.5.1: District and breed-wise indigenous Cattle Population – 2007
Districtsindigenous Cattle (‘000)
Sahiwal Hariana non-descript and Other graded
Total indigenous Cattle
Punjab 42.1 202.0 254.4 498.5
Amritsar 2.7 0 8 10.7
Barnala 0.2 17 5 22.2
Bathinda 4.1 32.7 13.4 50.2
Faridkot 1.9 8.4 5.6 15.9
Fatehgarh Sahib 0.6 4.1 0.9 5.5
Firozpur 9.1 10.4 49.8 69.3
Gurdaspur 3.7 1.6 21.1 26.3
Hoshiarpur 0 0 28.6 28.6
Jalandhar 0 0 0* 0*
Kapurthala 0.7 0.2 1.3 2.2
Ludhiana 4.6 18.4 15 38.1
Mansa 1.7 23.2 13 37.9
Moga 2.4 9.7 15.7 27.8
Patiala 0 0 30.5 30.5
Rupnagar (Ropar) 0.7 4.8 2.8 8.3
Sangrur 2.5 51.6 20.7 74.8
SAS Nagar (Mohali) 0.4 4.5 5.3 10.2
SBS Nagar (Nawanshahr) 0 0 5 5
Muktsar 5.2 15.5 9.5 30.2
Tarn Taran 1.6 0 3.3 4.9
Source: 18th Livestock census, Department of Animal Husbandry, Dairying and Fisheries, Ministry of Agriculture, Govt. of India.
* Negligible.
Dairying in Punjab A Statistical Profile 2014 Part II : Livestock Census
32
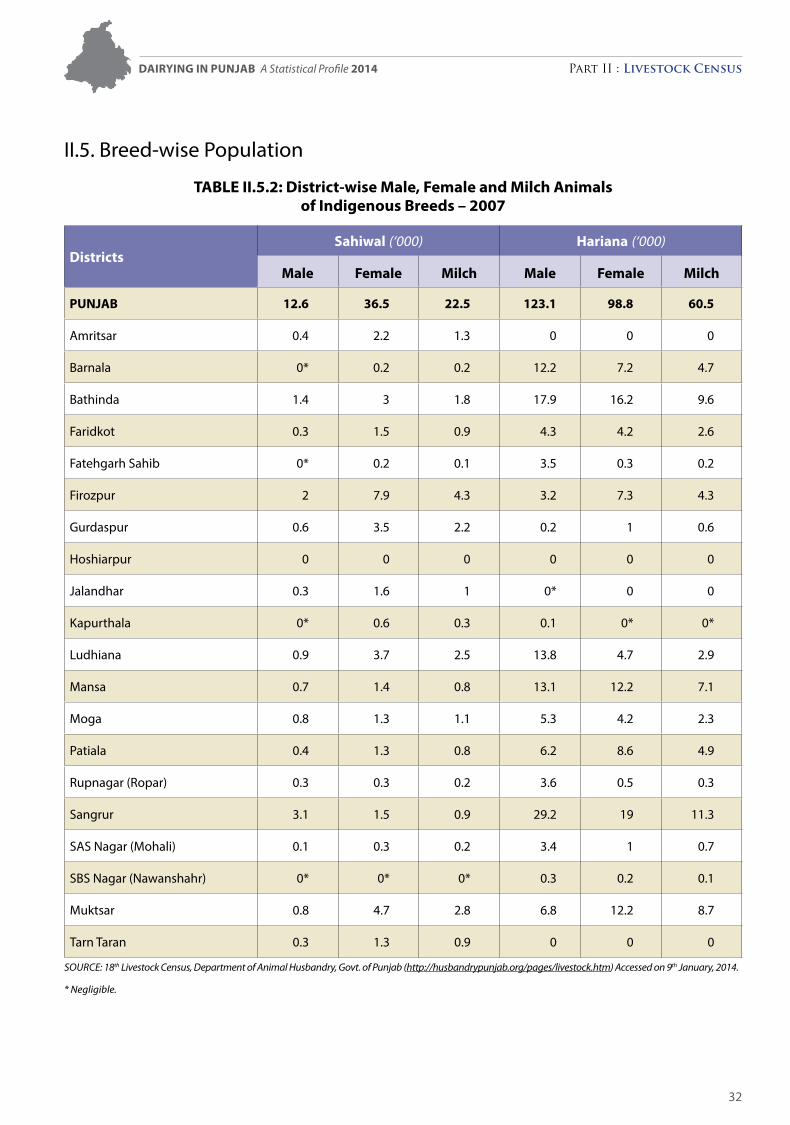
II.5. Breed-wise Population
TabLE ii.5.2: District-wise Male, Female and Milch animals of indigenous breeds – 2007
Districts Sahiwal (‘000) Hariana (‘000)
Male Female Milch Male Female Milch
Punjab 12.6 36.5 22.5 123.1 98.8 60.5
Amritsar 0.4 2.2 1.3 0 0 0
Barnala 0* 0.2 0.2 12.2 7.2 4.7
Bathinda 1.4 3 1.8 17.9 16.2 9.6
Faridkot 0.3 1.5 0.9 4.3 4.2 2.6
Fatehgarh Sahib 0* 0.2 0.1 3.5 0.3 0.2
Firozpur 2 7.9 4.3 3.2 7.3 4.3
Gurdaspur 0.6 3.5 2.2 0.2 1 0.6
Hoshiarpur 0 0 0 0 0 0
Jalandhar 0.3 1.6 1 0* 0 0
Kapurthala 0* 0.6 0.3 0.1 0* 0*
Ludhiana 0.9 3.7 2.5 13.8 4.7 2.9
Mansa 0.7 1.4 0.8 13.1 12.2 7.1
Moga 0.8 1.3 1.1 5.3 4.2 2.3
Patiala 0.4 1.3 0.8 6.2 8.6 4.9
Rupnagar (Ropar) 0.3 0.3 0.2 3.6 0.5 0.3
Sangrur 3.1 1.5 0.9 29.2 19 11.3
SAS Nagar (Mohali) 0.1 0.3 0.2 3.4 1 0.7
SBS Nagar (Nawanshahr) 0* 0* 0* 0.3 0.2 0.1
Muktsar 0.8 4.7 2.8 6.8 12.2 8.7
Tarn Taran 0.3 1.3 0.9 0 0 0
Source: 18thLivestockCensus,DepartmentofAnimalHusbandry,Govt.ofPunjab(http://husbandrypunjab.org/pages/livestock.htm) Accessed on 9thJanuary,2014.
* Negligible.
Dairying in Punjab A Statistical Profile 2014 Part II : Livestock Census
33
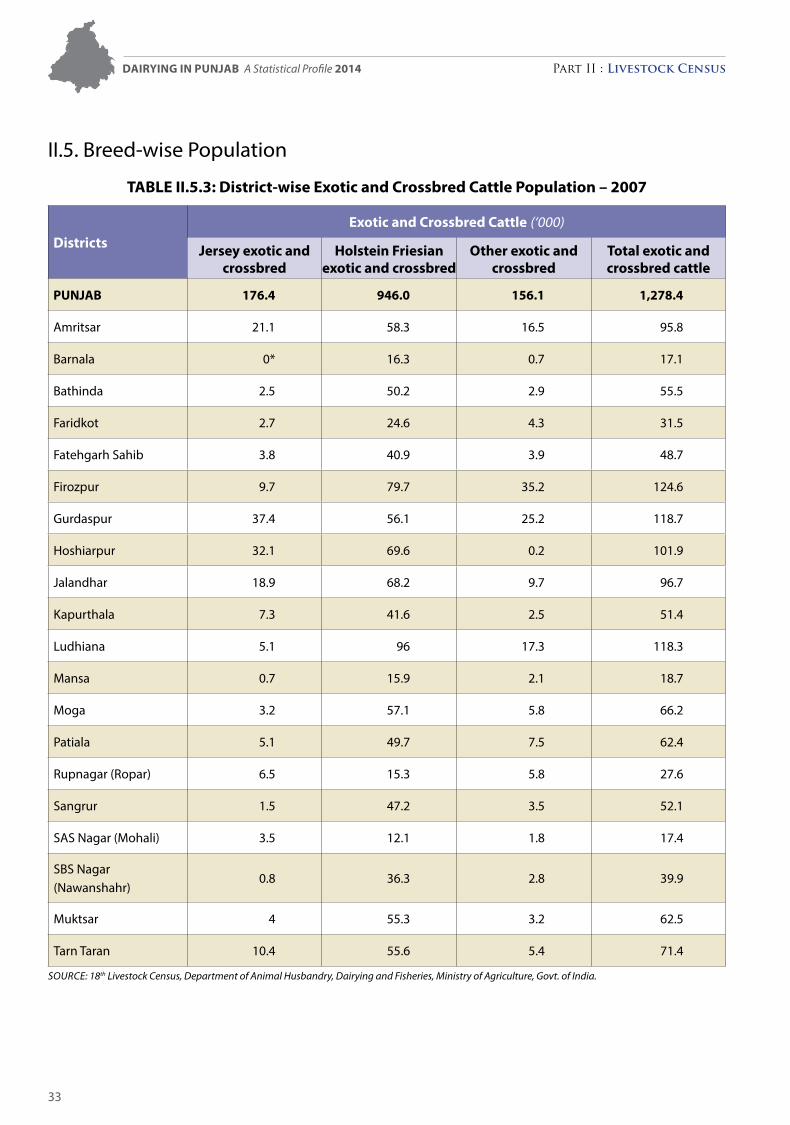
II.5. Breed-wise Population
TabLE ii.5.3: District-wise Exotic and Crossbred Cattle Population – 2007
DistrictsExotic and Crossbred Cattle (‘000)
jersey exotic and crossbred
Holstein Friesian exotic and crossbred
Other exotic and crossbred
Total exotic and crossbred cattle
Punjab 176.4 946.0 156.1 1,278.4
Amritsar 21.1 58.3 16.5 95.8
Barnala 0* 16.3 0.7 17.1
Bathinda 2.5 50.2 2.9 55.5
Faridkot 2.7 24.6 4.3 31.5
Fatehgarh Sahib 3.8 40.9 3.9 48.7
Firozpur 9.7 79.7 35.2 124.6
Gurdaspur 37.4 56.1 25.2 118.7
Hoshiarpur 32.1 69.6 0.2 101.9
Jalandhar 18.9 68.2 9.7 96.7
Kapurthala 7.3 41.6 2.5 51.4
Ludhiana 5.1 96 17.3 118.3
Mansa 0.7 15.9 2.1 18.7
Moga 3.2 57.1 5.8 66.2
Patiala 5.1 49.7 7.5 62.4
Rupnagar (Ropar) 6.5 15.3 5.8 27.6
Sangrur 1.5 47.2 3.5 52.1
SAS Nagar (Mohali) 3.5 12.1 1.8 17.4
SBS Nagar (Nawanshahr)
0.8 36.3 2.8 39.9
Muktsar 4 55.3 3.2 62.5
Tarn Taran 10.4 55.6 5.4 71.4
Source: 18th Livestock census, Department of Animal Husbandry, Dairying and Fisheries, Ministry of Agriculture, Govt. of India.
Dairying in Punjab A Statistical Profile 2014 Part II : Livestock Census
34
Dairying in Punjab A Statistical Profile 2014 Part II : Livestock Census
35
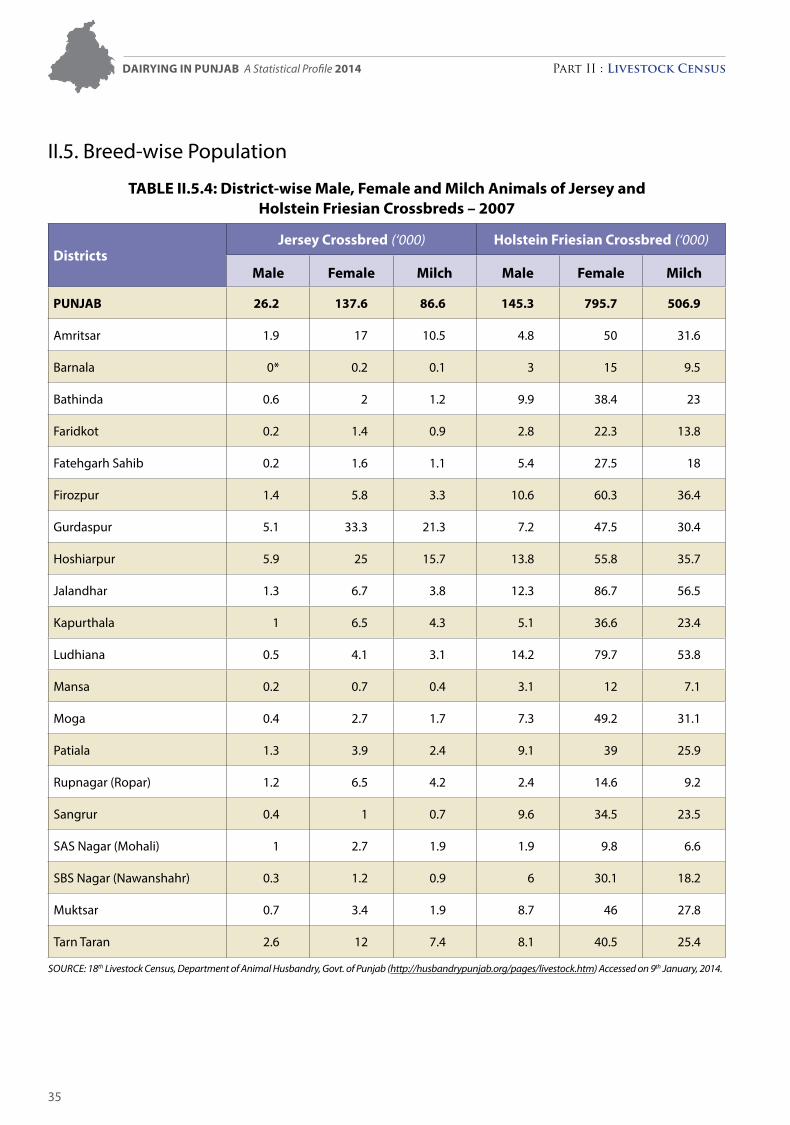
II.5. Breed-wise Population
TabLE ii.5.4: District-wise Male, Female and Milch animals of jersey and Holstein Friesian Crossbreds – 2007
Districtsjersey Crossbred (‘000) Holstein Friesian Crossbred (‘000)
Male Female Milch Male Female Milch
Punjab 26.2 137.6 86.6 145.3 795.7 506.9
Amritsar 1.9 17 10.5 4.8 50 31.6
Barnala 0* 0.2 0.1 3 15 9.5
Bathinda 0.6 2 1.2 9.9 38.4 23
Faridkot 0.2 1.4 0.9 2.8 22.3 13.8
Fatehgarh Sahib 0.2 1.6 1.1 5.4 27.5 18
Firozpur 1.4 5.8 3.3 10.6 60.3 36.4
Gurdaspur 5.1 33.3 21.3 7.2 47.5 30.4
Hoshiarpur 5.9 25 15.7 13.8 55.8 35.7
Jalandhar 1.3 6.7 3.8 12.3 86.7 56.5
Kapurthala 1 6.5 4.3 5.1 36.6 23.4
Ludhiana 0.5 4.1 3.1 14.2 79.7 53.8
Mansa 0.2 0.7 0.4 3.1 12 7.1
Moga 0.4 2.7 1.7 7.3 49.2 31.1
Patiala 1.3 3.9 2.4 9.1 39 25.9
Rupnagar (Ropar) 1.2 6.5 4.2 2.4 14.6 9.2
Sangrur 0.4 1 0.7 9.6 34.5 23.5
SAS Nagar (Mohali) 1 2.7 1.9 1.9 9.8 6.6
SBS Nagar (Nawanshahr) 0.3 1.2 0.9 6 30.1 18.2
Muktsar 0.7 3.4 1.9 8.7 46 27.8
Tarn Taran 2.6 12 7.4 8.1 40.5 25.4
Source: 18thLivestockCensus,DepartmentofAnimalHusbandry,Govt.ofPunjab(http://husbandrypunjab.org/pages/livestock.htm) Accessed on 9thJanuary,2014.
Dairying in Punjab A Statistical Profile 2014 Part II : Livestock Census
36
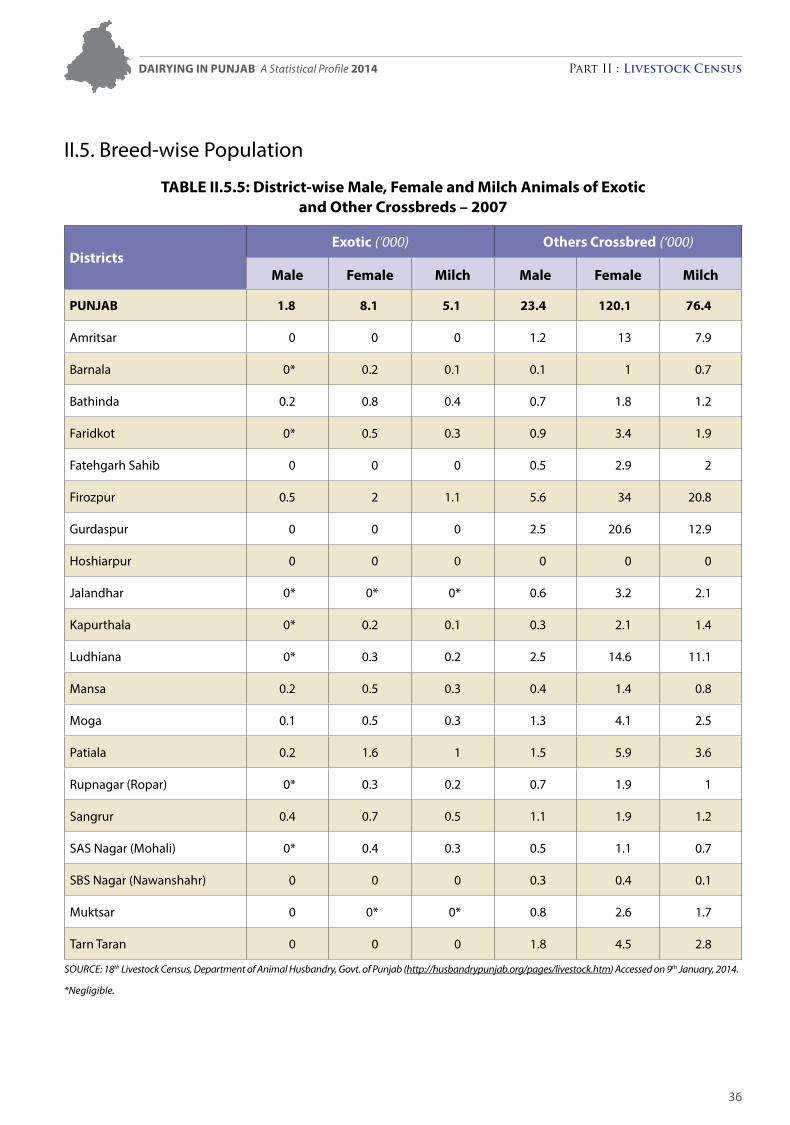
II.5. Breed-wise Population
TabLE ii.5.5: District-wise Male, Female and Milch animals of Exotic and Other Crossbreds – 2007
DistrictsExotic (‘000) Others Crossbred (‘000)
Male Female Milch Male Female Milch
Punjab 1.8 8.1 5.1 23.4 120.1 76.4
Amritsar 0 0 0 1.2 13 7.9
Barnala 0* 0.2 0.1 0.1 1 0.7
Bathinda 0.2 0.8 0.4 0.7 1.8 1.2
Faridkot 0* 0.5 0.3 0.9 3.4 1.9
Fatehgarh Sahib 0 0 0 0.5 2.9 2
Firozpur 0.5 2 1.1 5.6 34 20.8
Gurdaspur 0 0 0 2.5 20.6 12.9
Hoshiarpur 0 0 0 0 0 0
Jalandhar 0* 0* 0* 0.6 3.2 2.1
Kapurthala 0* 0.2 0.1 0.3 2.1 1.4
Ludhiana 0* 0.3 0.2 2.5 14.6 11.1
Mansa 0.2 0.5 0.3 0.4 1.4 0.8
Moga 0.1 0.5 0.3 1.3 4.1 2.5
Patiala 0.2 1.6 1 1.5 5.9 3.6
Rupnagar (Ropar) 0* 0.3 0.2 0.7 1.9 1
Sangrur 0.4 0.7 0.5 1.1 1.9 1.2
SAS Nagar (Mohali) 0* 0.4 0.3 0.5 1.1 0.7
SBS Nagar (Nawanshahr) 0 0 0 0.3 0.4 0.1
Muktsar 0 0* 0* 0.8 2.6 1.7
Tarn Taran 0 0 0 1.8 4.5 2.8
Source: 18thLivestockCensus,DepartmentofAnimalHusbandry,Govt.ofPunjab(http://husbandrypunjab.org/pages/livestock.htm) Accessed on 9thJanuary,2014.
*Negligible.
Dairying in Punjab A Statistical Profile 2014 Part II : Livestock Census
37
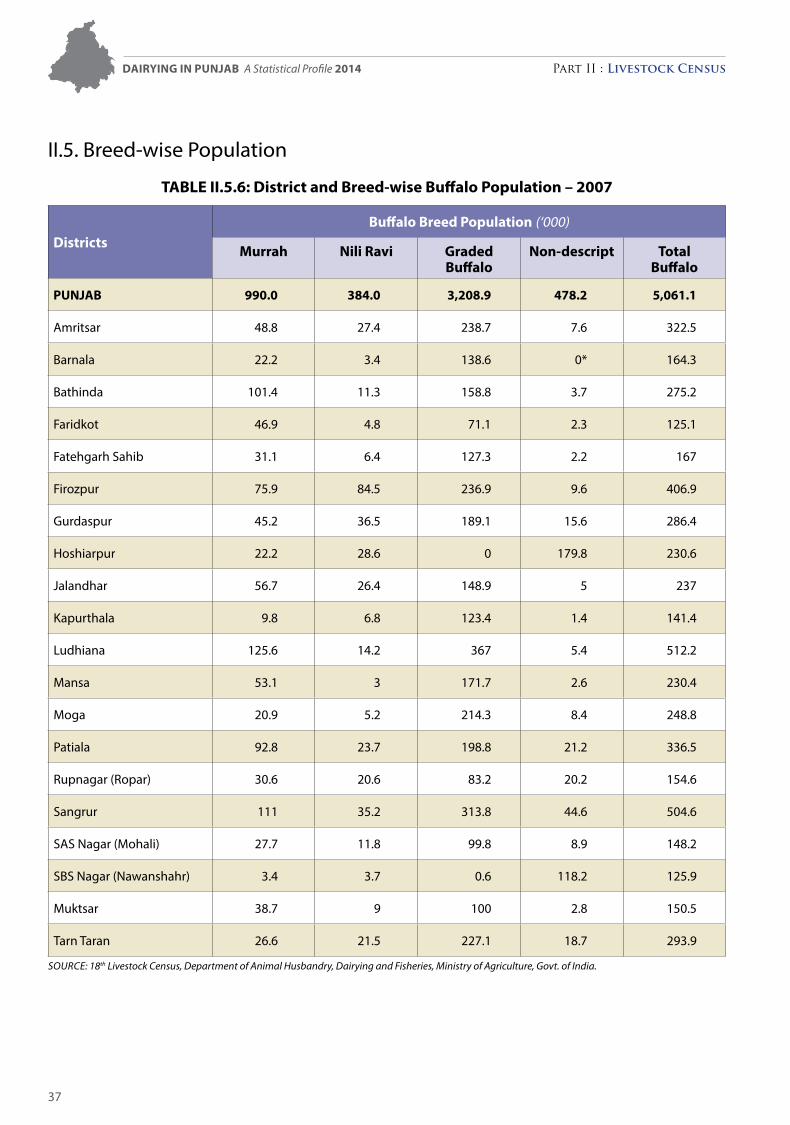
II.5. Breed-wise Population
TabLE ii.5.6: District and breed-wise buffalo Population – 2007
Districtsbuffalo breed Population (‘000)
Murrah nili ravi graded buffalo
non-descript Total buffalo
Punjab 990.0 384.0 3,208.9 478.2 5,061.1
Amritsar 48.8 27.4 238.7 7.6 322.5
Barnala 22.2 3.4 138.6 0* 164.3
Bathinda 101.4 11.3 158.8 3.7 275.2
Faridkot 46.9 4.8 71.1 2.3 125.1
Fatehgarh Sahib 31.1 6.4 127.3 2.2 167
Firozpur 75.9 84.5 236.9 9.6 406.9
Gurdaspur 45.2 36.5 189.1 15.6 286.4
Hoshiarpur 22.2 28.6 0 179.8 230.6
Jalandhar 56.7 26.4 148.9 5 237
Kapurthala 9.8 6.8 123.4 1.4 141.4
Ludhiana 125.6 14.2 367 5.4 512.2
Mansa 53.1 3 171.7 2.6 230.4
Moga 20.9 5.2 214.3 8.4 248.8
Patiala 92.8 23.7 198.8 21.2 336.5
Rupnagar (Ropar) 30.6 20.6 83.2 20.2 154.6
Sangrur 111 35.2 313.8 44.6 504.6
SAS Nagar (Mohali) 27.7 11.8 99.8 8.9 148.2
SBS Nagar (Nawanshahr) 3.4 3.7 0.6 118.2 125.9
Muktsar 38.7 9 100 2.8 150.5
Tarn Taran 26.6 21.5 227.1 18.7 293.9
Source: 18th Livestock census, Department of Animal Husbandry, Dairying and Fisheries, Ministry of Agriculture, Govt. of India.
Dairying in Punjab A Statistical Profile 2014 Part II : Livestock Census
38
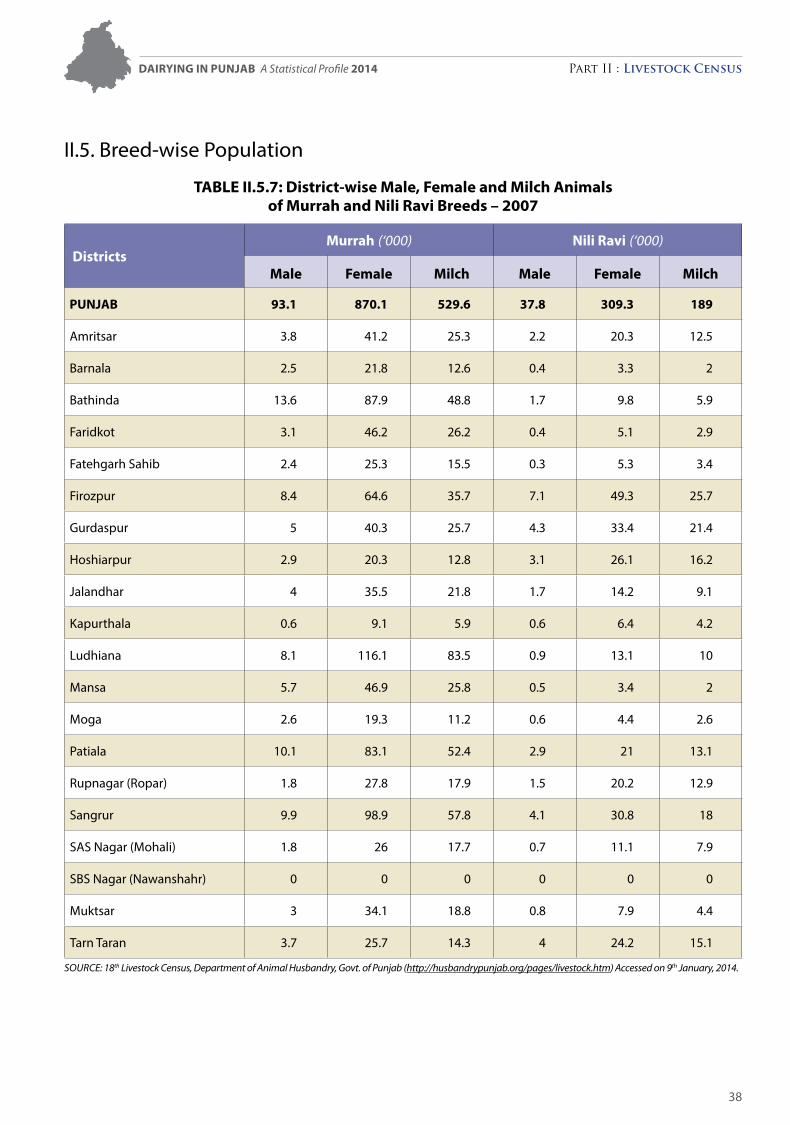
II.5. Breed-wise Population
TabLE ii.5.7: District-wise Male, Female and Milch animals of Murrah and nili ravi breeds – 2007
DistrictsMurrah (‘000) nili ravi (‘000)
Male Female Milch Male Female Milch
Punjab 93.1 870.1 529.6 37.8 309.3 189
Amritsar 3.8 41.2 25.3 2.2 20.3 12.5
Barnala 2.5 21.8 12.6 0.4 3.3 2
Bathinda 13.6 87.9 48.8 1.7 9.8 5.9
Faridkot 3.1 46.2 26.2 0.4 5.1 2.9
Fatehgarh Sahib 2.4 25.3 15.5 0.3 5.3 3.4
Firozpur 8.4 64.6 35.7 7.1 49.3 25.7
Gurdaspur 5 40.3 25.7 4.3 33.4 21.4
Hoshiarpur 2.9 20.3 12.8 3.1 26.1 16.2
Jalandhar 4 35.5 21.8 1.7 14.2 9.1
Kapurthala 0.6 9.1 5.9 0.6 6.4 4.2
Ludhiana 8.1 116.1 83.5 0.9 13.1 10
Mansa 5.7 46.9 25.8 0.5 3.4 2
Moga 2.6 19.3 11.2 0.6 4.4 2.6
Patiala 10.1 83.1 52.4 2.9 21 13.1
Rupnagar (Ropar) 1.8 27.8 17.9 1.5 20.2 12.9
Sangrur 9.9 98.9 57.8 4.1 30.8 18
SAS Nagar (Mohali) 1.8 26 17.7 0.7 11.1 7.9
SBS Nagar (Nawanshahr) 0 0 0 0 0 0
Muktsar 3 34.1 18.8 0.8 7.9 4.4
Tarn Taran 3.7 25.7 14.3 4 24.2 15.1
Source: 18thLivestockCensus,DepartmentofAnimalHusbandry,Govt.ofPunjab(http://husbandrypunjab.org/pages/livestock.htm) Accessed on 9thJanuary,2014.
39
Part III : Cattle and buffalo breeds
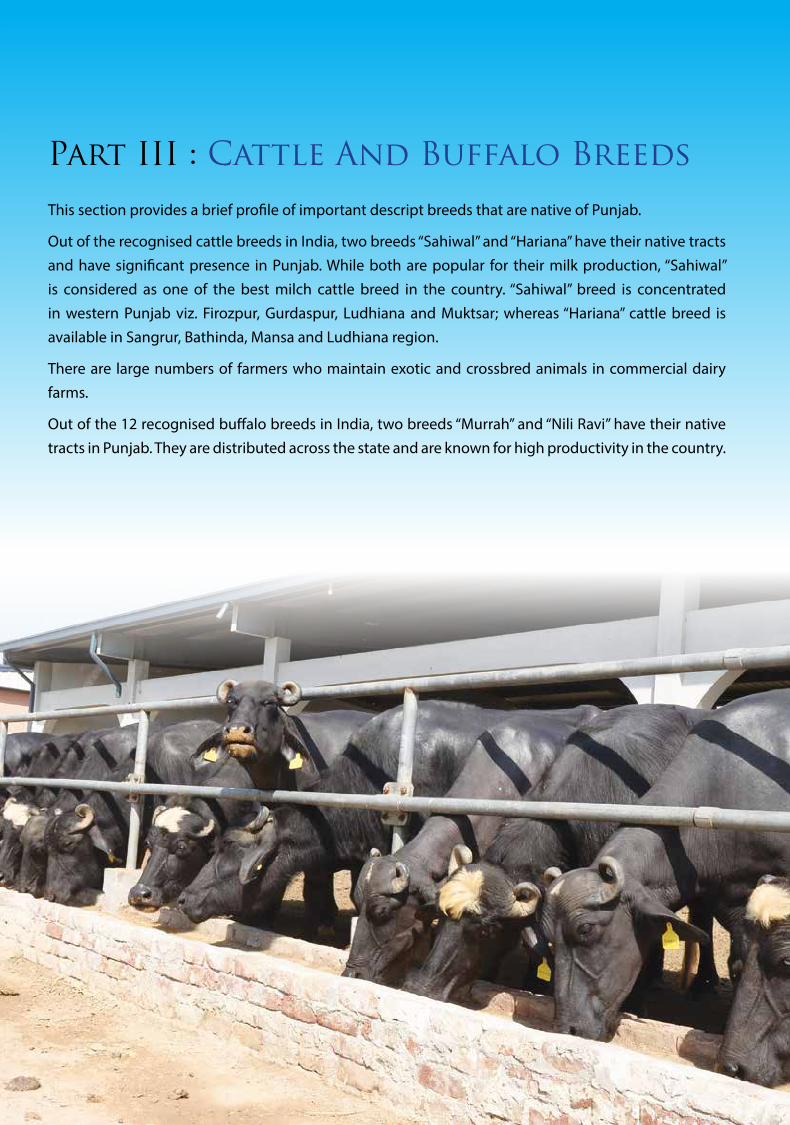
This section provides a brief profile of important descript breeds that are native of Punjab.
Out of the recognised cattle breeds in India, two breeds “Sahiwal” and “Hariana” have their native tracts and have significant presence in Punjab. While both are popular for their milk production, “Sahiwal” is considered as one of the best milch cattle breed in the country. “Sahiwal” breed is concentrated in western Punjab viz. Firozpur, Gurdaspur, Ludhiana and Muktsar; whereas “Hariana” cattle breed is available in Sangrur, Bathinda, Mansa and Ludhiana region.
There are large numbers of farmers who maintain exotic and crossbred animals in commercial dairy farms.
Out of the 12 recognised buffalo breeds in India, two breeds “Murrah” and “Nili Ravi” have their native tracts in Punjab. They are distributed across the state and are known for high productivity in the country.
01
40
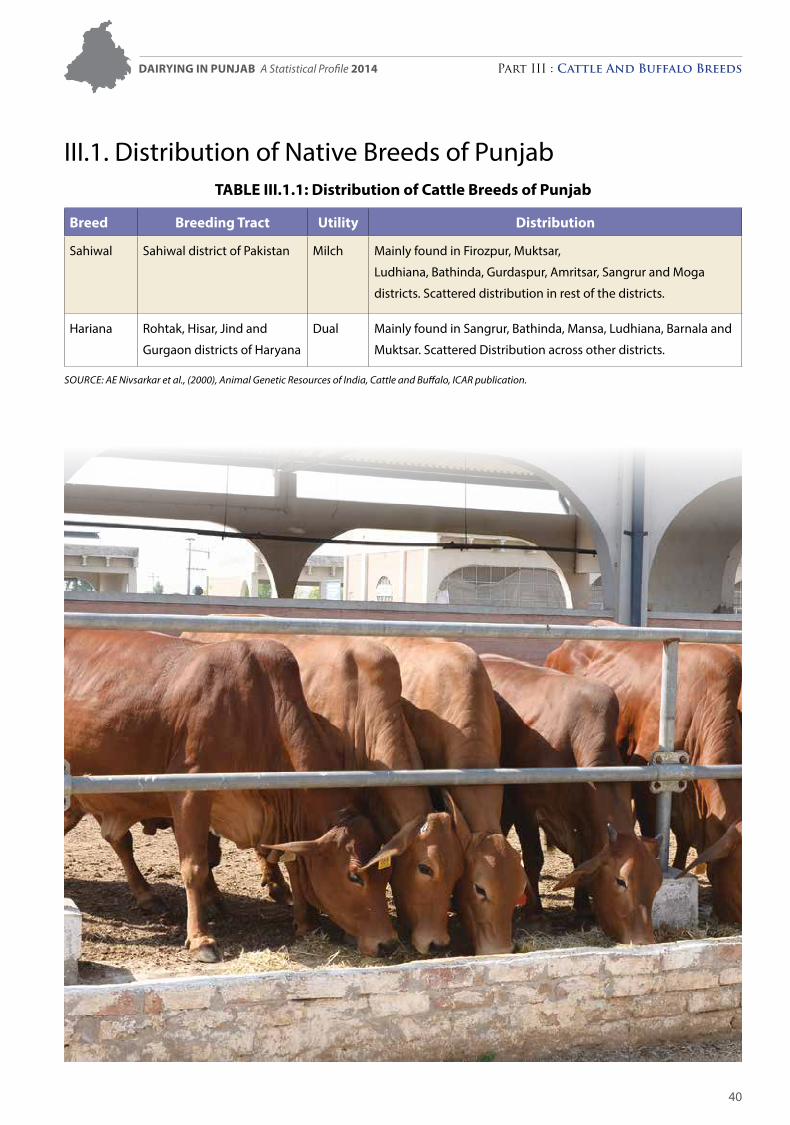
III.1. Distribution of Native Breeds of PunjabTABLE III.1.1: Distribution of Cattle Breeds of Punjab
Breed Breeding Tract Utility Distribution
Sahiwal Sahiwal district of Pakistan Milch Mainly found in Firozpur, Muktsar,
Ludhiana, Bathinda, Gurdaspur, Amritsar, Sangrur and Moga
districts. Scattered distribution in rest of the districts.
Hariana Rohtak, Hisar, Jind and
Gurgaon districts of Haryana
Dual Mainly found in Sangrur, Bathinda, Mansa, Ludhiana, Barnala and
Muktsar. Scattered Distribution across other districts.
Source: Ae Nivsarkar et al., (2000), Animal Genetic resources of India, cattle and Buffalo, IcAr publication.
DAIryIng In PUnjAB A Statistical Profile 2014 Part III : Cattle and buffalo breeds
41
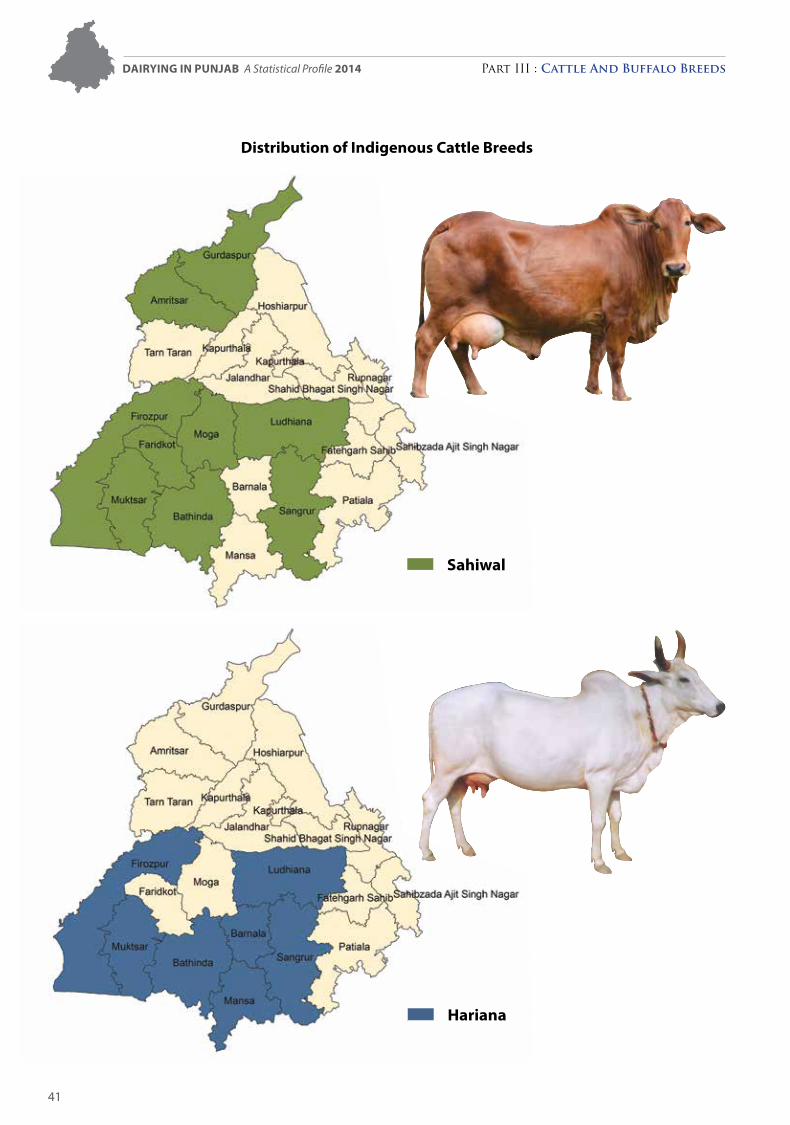
Distribution of Indigenous Cattle Breeds
Sahiwal
Hariana
DAIryIng In PUnjAB A Statistical Profile 2014 Part III : Cattle and buffalo breeds
42
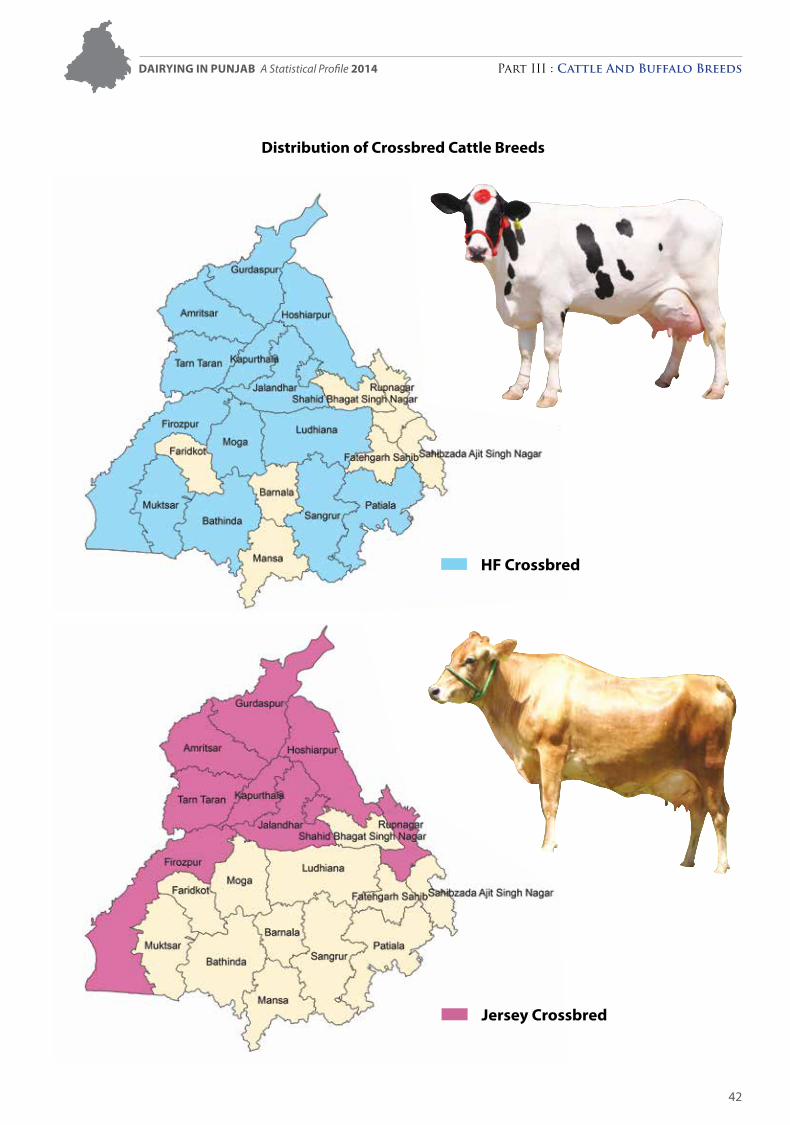
Distribution of Crossbred Cattle Breeds
HF Crossbred
jersey Crossbred
DAIryIng In PUnjAB A Statistical Profile 2014 Part III : Cattle and buffalo breeds
43
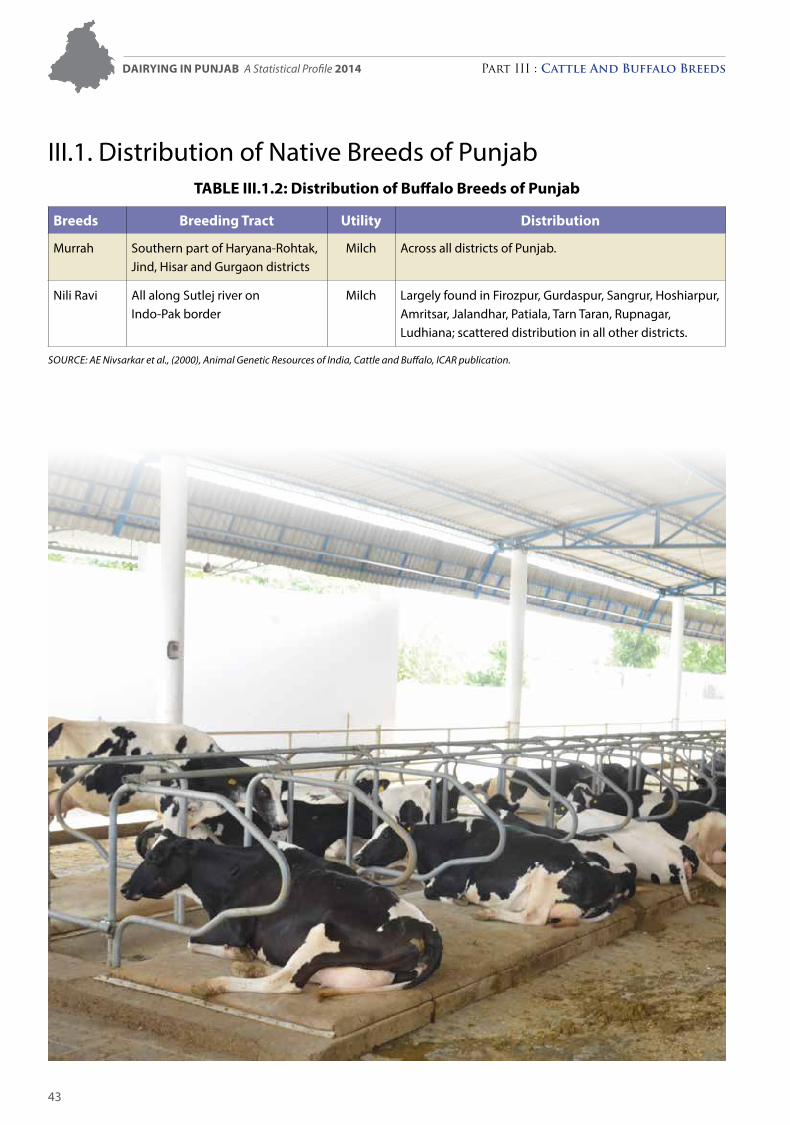
III.1. Distribution of Native Breeds of PunjabTABLE III.1.2: Distribution of Buffalo Breeds of Punjab
Breeds Breeding Tract Utility Distribution
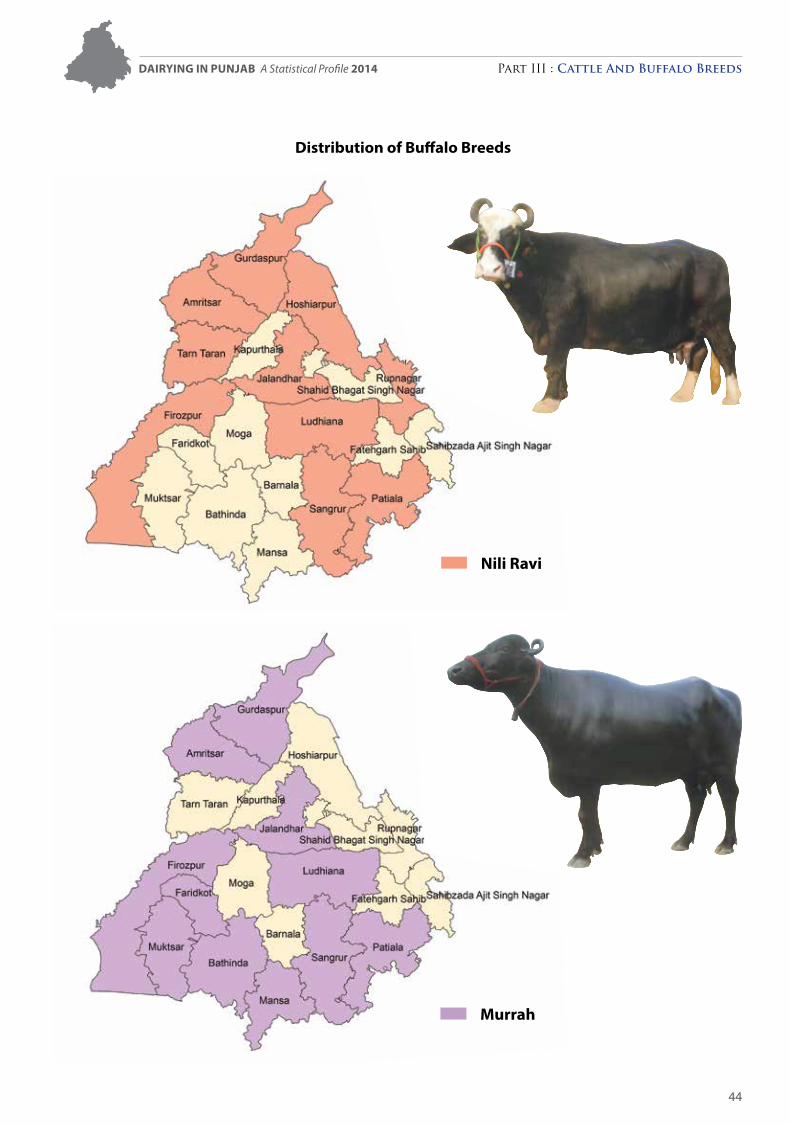
Murrah Southern part of Haryana-Rohtak, Jind, Hisar and Gurgaon districts
Milch Across all districts of Punjab.
Nili Ravi All along Sutlej river on Indo-Pak border
Milch Largely found in Firozpur, Gurdaspur, Sangrur, Hoshiarpur, Amritsar, Jalandhar, Patiala, Tarn Taran, Rupnagar, Ludhiana; scattered distribution in all other districts.
Source: Ae Nivsarkar et al., (2000), Animal Genetic resources of India, cattle and Buffalo, IcAr publication.
DAIryIng In PUnjAB A Statistical Profile 2014 Part III : Cattle and buffalo breeds
44
Distribution of Buffalo Breeds
nili ravi
Murrah
DAIryIng In PUnjAB A Statistical Profile 2014 Part III : Cattle and buffalo breeds
45
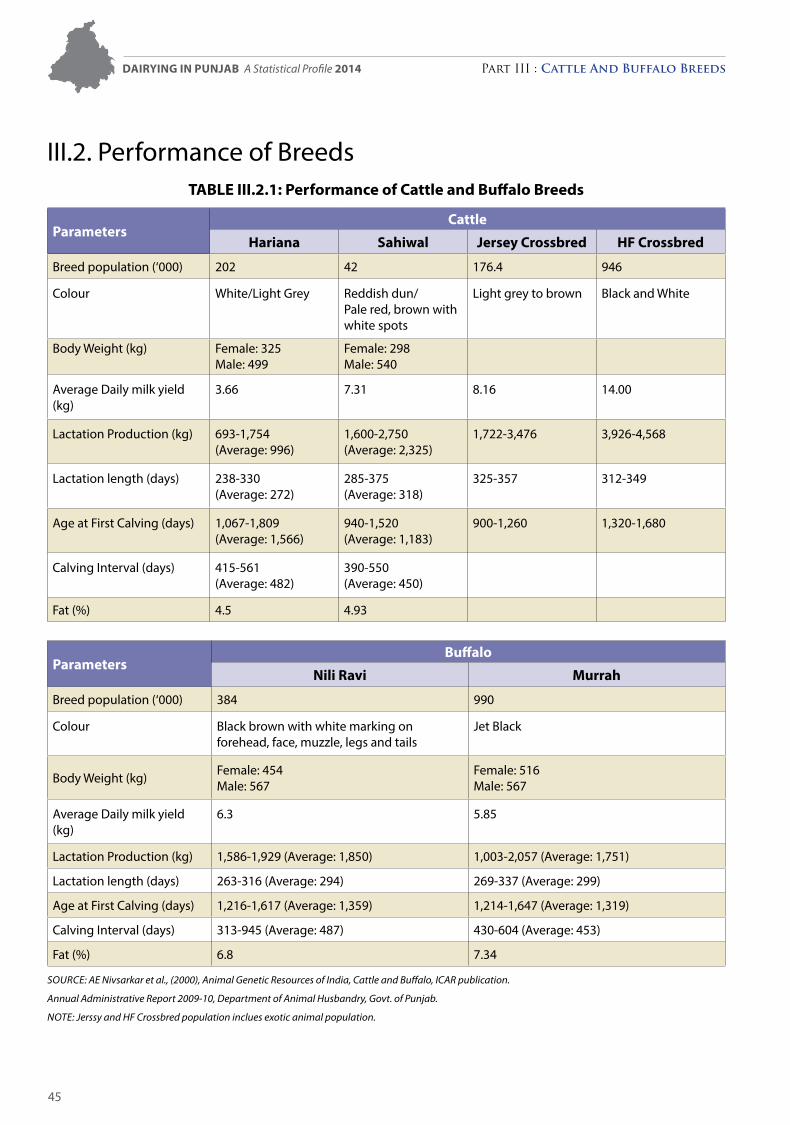
III.2. Performance of BreedsTABLE III.2.1: Performance of Cattle and Buffalo Breeds
Parameters Cattle
Hariana Sahiwal jersey Crossbred HF Crossbred
Breed population (‘000) 202 42 176.4 946
Colour White/Light Grey Reddish dun/Pale red, brown with white spots
Light grey to brown Black and White
Body Weight (kg) Female: 325 Male: 499
Female: 298 Male: 540
Average Daily milk yield (kg)
3.66 7.31 8.16 14.00
Lactation Production (kg) 693-1,754 (Average: 996)
1,600-2,750 (Average: 2,325)
1,722-3,476 3,926-4,568
Lactation length (days) 238-330 (Average: 272)
285-375 (Average: 318)
325-357 312-349
Age at First Calving (days) 1,067-1,809 (Average: 1,566)
940-1,520 (Average: 1,183)
900-1,260 1,320-1,680
Calving Interval (days) 415-561 (Average: 482)
390-550 (Average: 450)
Fat (%) 4.5 4.93
Parameters Buffalo
nili ravi Murrah
Breed population (‘000) 384 990
Colour Black brown with white marking on forehead, face, muzzle, legs and tails
Jet Black
Body Weight (kg) Female: 454 Male: 567
Female: 516 Male: 567
Average Daily milk yield (kg)
6.3 5.85
Lactation Production (kg) 1,586-1,929 (Average: 1,850) 1,003-2,057 (Average: 1,751)
Lactation length (days) 263-316 (Average: 294) 269-337 (Average: 299)
Age at First Calving (days) 1,216-1,617 (Average: 1,359) 1,214-1,647 (Average: 1,319)
Calving Interval (days) 313-945 (Average: 487) 430-604 (Average: 453)
Fat (%) 6.8 7.34
Source: Ae Nivsarkar et al., (2000), Animal Genetic resources of India, cattle and Buffalo, IcAr publication.
Annual Administrative report 2009-10, Department of Animal Husbandry, Govt. of Punjab.
Note: Jerssy and HF crossbred population inclues exotic animal population.
DAIryIng In PUnjAB A Statistical Profile 2014 Part III : Cattle and buffalo breeds
46
DAIryIng In PUnjAB A Statistical Profile 2014 Part III : Cattle and buffalo breeds
Part IV : Milk Production
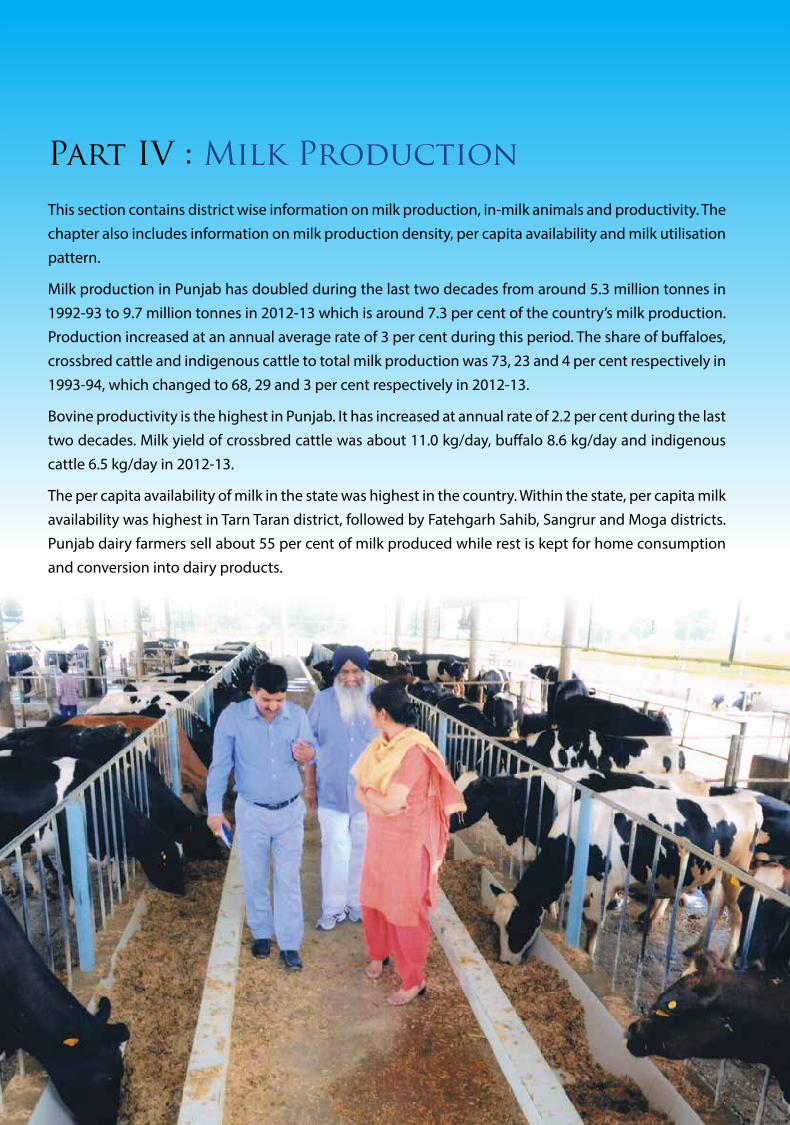
This section contains district wise information on milk production, in-milk animals and productivity. The chapter also includes information on milk production density, per capita availability and milk utilisation pattern.
Milk production in Punjab has doubled during the last two decades from around 5.3 million tonnes in 1992-93 to 9.7 million tonnes in 2012-13 which is around 7.3 per cent of the country’s milk production. Production increased at an annual average rate of 3 per cent during this period. The share of buffaloes, crossbred cattle and indigenous cattle to total milk production was 73, 23 and 4 per cent respectively in 1993-94, which changed to 68, 29 and 3 per cent respectively in 2012-13.
Bovine productivity is the highest in Punjab. It has increased at annual rate of 2.2 per cent during the last two decades. Milk yield of crossbred cattle was about 11.0 kg/day, buffalo 8.6 kg/day and indigenous cattle 6.5 kg/day in 2012-13.
The per capita availability of milk in the state was highest in the country. Within the state, per capita milk availability was highest in Tarn Taran district, followed by Fatehgarh Sahib, Sangrur and Moga districts. Punjab dairy farmers sell about 55 per cent of milk produced while rest is kept for home consumption and conversion into dairy products.
Dairying in Punjab A Statistical Profile 2014 Part IV : Milk Production
48
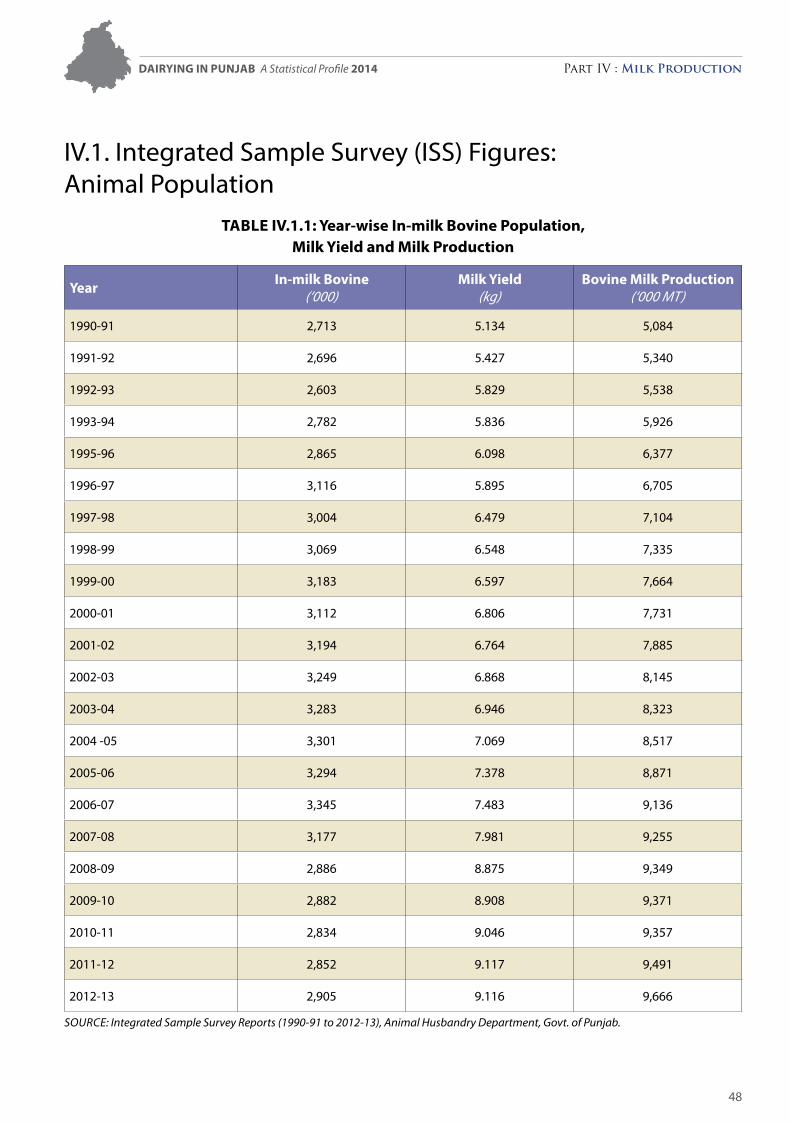
IV.1. Integrated Sample Survey (ISS) Figures: Animal Population
Table IV.1.1: Year-wise In-milk bovine Population, Milk Yield and Milk Production
Year In-milk bovine (‘000)
Milk Yield (kg)
bovine Milk Production (‘000 MT)
1990-91 2,713 5.134 5,084
1991-92 2,696 5.427 5,340
1992-93 2,603 5.829 5,538
1993-94 2,782 5.836 5,926
1995-96 2,865 6.098 6,377
1996-97 3,116 5.895 6,705
1997-98 3,004 6.479 7,104
1998-99 3,069 6.548 7,335
1999-00 3,183 6.597 7,664
2000-01 3,112 6.806 7,731
2001-02 3,194 6.764 7,885
2002-03 3,249 6.868 8,145
2003-04 3,283 6.946 8,323
2004 -05 3,301 7.069 8,517
2005-06 3,294 7.378 8,871
2006-07 3,345 7.483 9,136
2007-08 3,177 7.981 9,255
2008-09 2,886 8.875 9,349
2009-10 2,882 8.908 9,371
2010-11 2,834 9.046 9,357
2011-12 2,852 9.117 9,491
2012-13 2,905 9.116 9,666
Source: Integrated Sample Survey reports (1990-91 to 2012-13), Animal Husbandry Department, Govt. of Punjab.
Dairying in Punjab A Statistical Profile 2014 Part IV : Milk Production
49
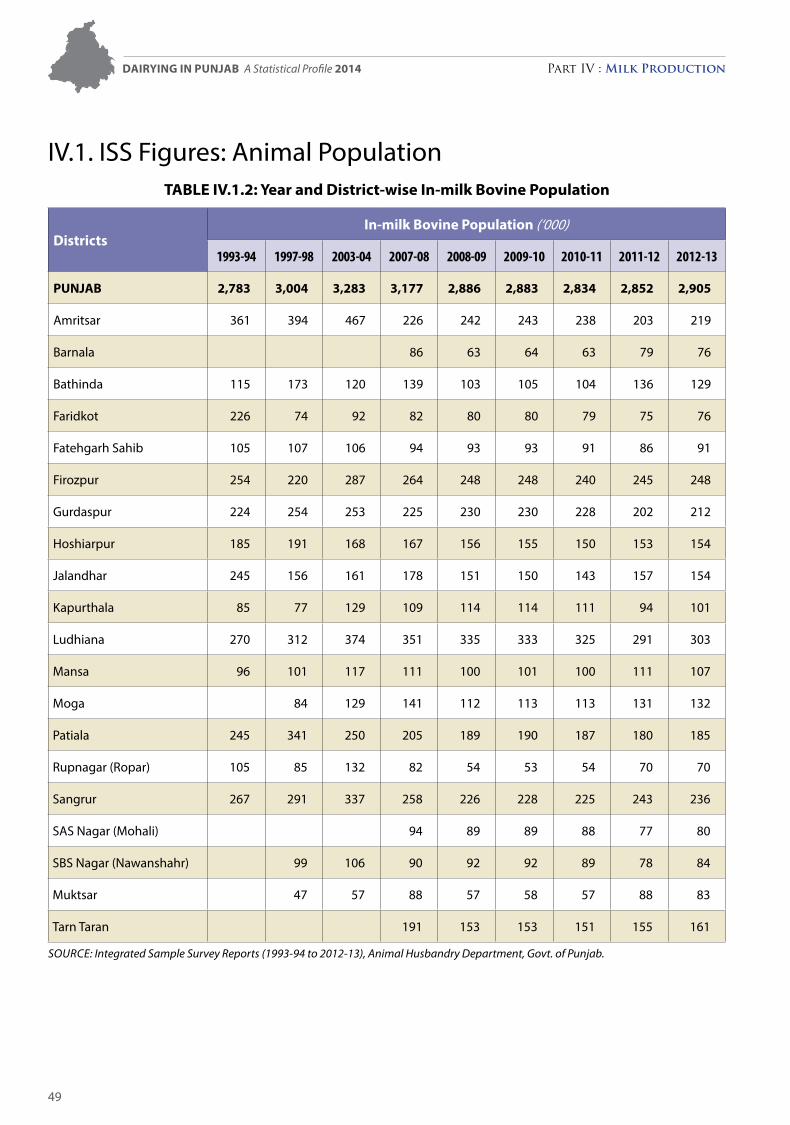
IV.1. ISS Figures: Animal PopulationTable IV.1.2: Year and District-wise In-milk bovine Population
DistrictsIn-milk bovine Population (‘000)
1993-94 1997-98 2003-04 2007-08 2008-09 2009-10 2010-11 2011-12 2012-13
PUNJab 2,783 3,004 3,283 3,177 2,886 2,883 2,834 2,852 2,905
Amritsar 361 394 467 226 242 243 238 203 219
Barnala 86 63 64 63 79 76
Bathinda 115 173 120 139 103 105 104 136 129
Faridkot 226 74 92 82 80 80 79 75 76
Fatehgarh Sahib 105 107 106 94 93 93 91 86 91
Firozpur 254 220 287 264 248 248 240 245 248
Gurdaspur 224 254 253 225 230 230 228 202 212
Hoshiarpur 185 191 168 167 156 155 150 153 154
Jalandhar 245 156 161 178 151 150 143 157 154
Kapurthala 85 77 129 109 114 114 111 94 101
Ludhiana 270 312 374 351 335 333 325 291 303
Mansa 96 101 117 111 100 101 100 111 107
Moga 84 129 141 112 113 113 131 132
Patiala 245 341 250 205 189 190 187 180 185
Rupnagar (Ropar) 105 85 132 82 54 53 54 70 70
Sangrur 267 291 337 258 226 228 225 243 236
SAS Nagar (Mohali) 94 89 89 88 77 80
SBS Nagar (Nawanshahr) 99 106 90 92 92 89 78 84
Muktsar 47 57 88 57 58 57 88 83
Tarn Taran 191 153 153 151 155 161
Source: Integrated Sample Survey reports (1993-94 to 2012-13), Animal Husbandry Department, Govt. of Punjab.
Dairying in Punjab A Statistical Profile 2014 Part IV : Milk Production
50
Dairying in Punjab A Statistical Profile 2014 Part IV : Milk Production
51
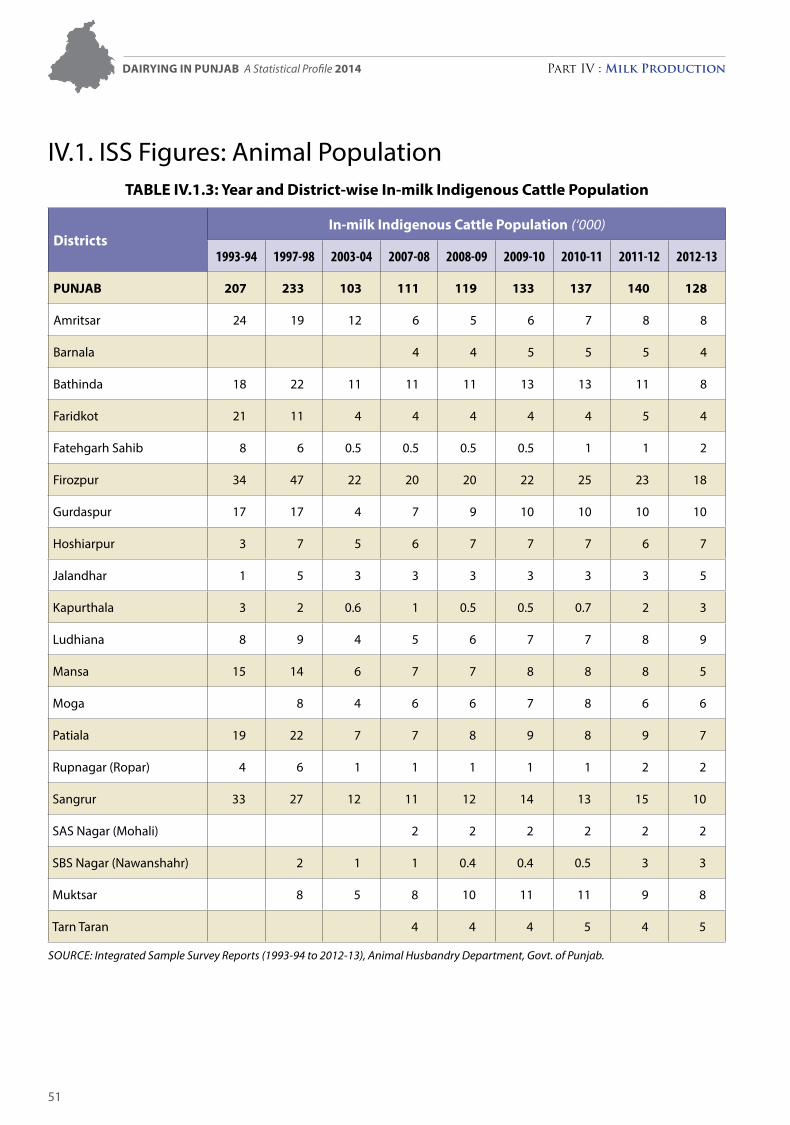
IV.1. ISS Figures: Animal Population Table IV.1.3: Year and District-wise In-milk Indigenous Cattle Population
DistrictsIn-milk Indigenous Cattle Population (‘000)
1993-94 1997-98 2003-04 2007-08 2008-09 2009-10 2010-11 2011-12 2012-13
PUNJab 207 233 103 111 119 133 137 140 128
Amritsar 24 19 12 6 5 6 7 8 8
Barnala 4 4 5 5 5 4
Bathinda 18 22 11 11 11 13 13 11 8
Faridkot 21 11 4 4 4 4 4 5 4
Fatehgarh Sahib 8 6 0.5 0.5 0.5 0.5 1 1 2
Firozpur 34 47 22 20 20 22 25 23 18
Gurdaspur 17 17 4 7 9 10 10 10 10
Hoshiarpur 3 7 5 6 7 7 7 6 7
Jalandhar 1 5 3 3 3 3 3 3 5
Kapurthala 3 2 0.6 1 0.5 0.5 0.7 2 3
Ludhiana 8 9 4 5 6 7 7 8 9
Mansa 15 14 6 7 7 8 8 8 5
Moga 8 4 6 6 7 8 6 6
Patiala 19 22 7 7 8 9 8 9 7
Rupnagar (Ropar) 4 6 1 1 1 1 1 2 2
Sangrur 33 27 12 11 12 14 13 15 10
SAS Nagar (Mohali) 2 2 2 2 2 2
SBS Nagar (Nawanshahr) 2 1 1 0.4 0.4 0.5 3 3
Muktsar 8 5 8 10 11 11 9 8
Tarn Taran 4 4 4 5 4 5
Source: Integrated Sample Survey reports (1993-94 to 2012-13), Animal Husbandry Department, Govt. of Punjab.
Dairying in Punjab A Statistical Profile 2014 Part IV : Milk Production
52
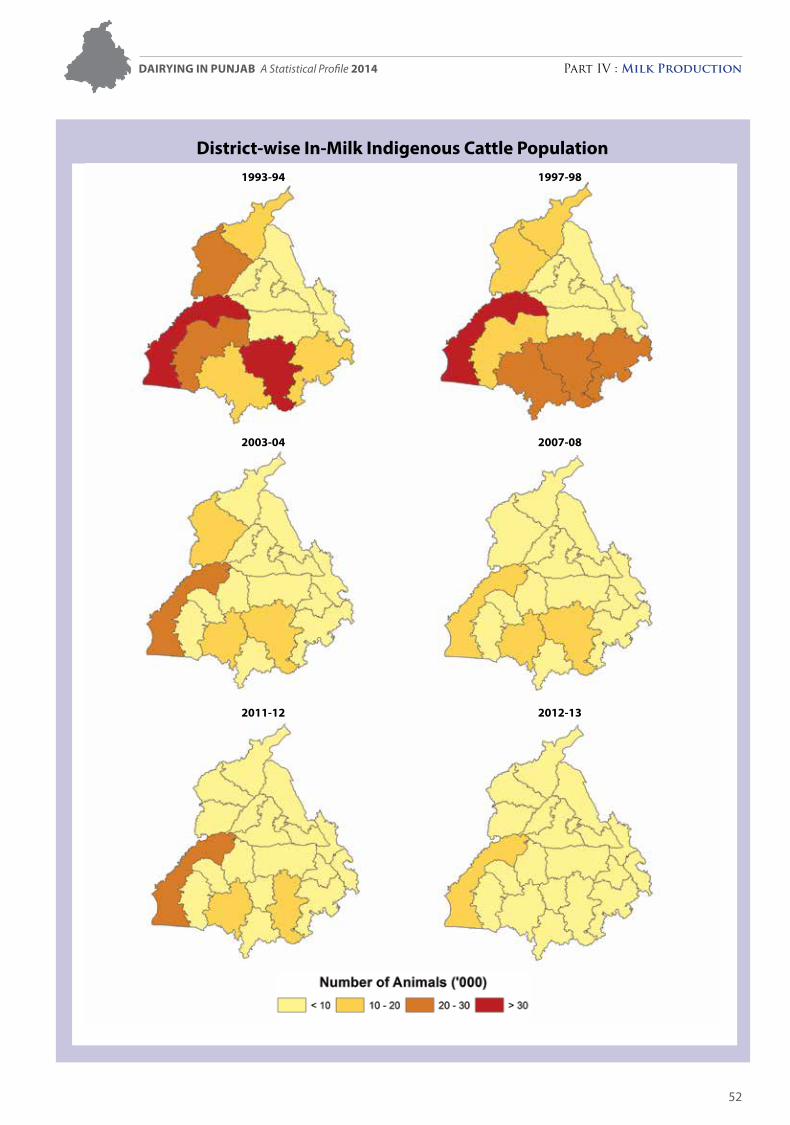
1993-94 1997-98
2003-04 2007-08
2011-12 2012-13
District-wise In-Milk Indigenous Cattle Population
Dairying in Punjab A Statistical Profile 2014 Part IV : Milk Production
53
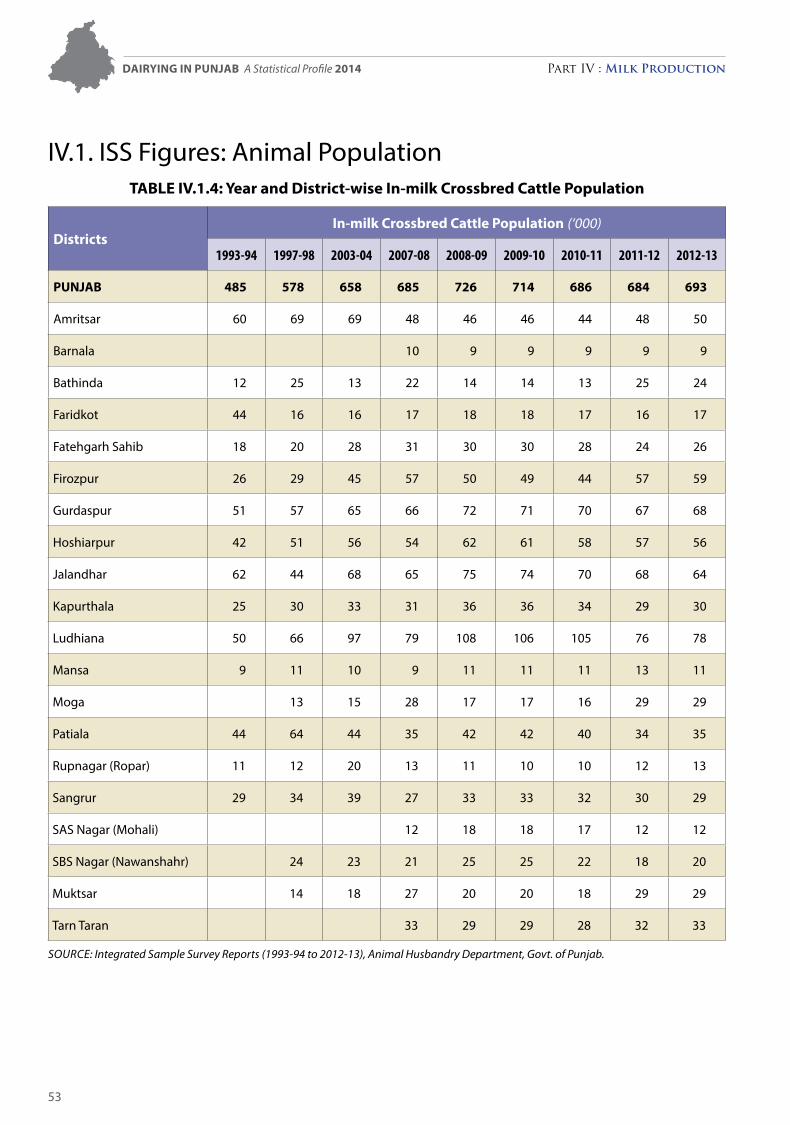
IV.1. ISS Figures: Animal PopulationTable IV.1.4: Year and District-wise In-milk Crossbred Cattle Population
DistrictsIn-milk Crossbred Cattle Population (‘000)
1993-94 1997-98 2003-04 2007-08 2008-09 2009-10 2010-11 2011-12 2012-13
PUNJab 485 578 658 685 726 714 686 684 693
Amritsar 60 69 69 48 46 46 44 48 50
Barnala 10 9 9 9 9 9
Bathinda 12 25 13 22 14 14 13 25 24
Faridkot 44 16 16 17 18 18 17 16 17
Fatehgarh Sahib 18 20 28 31 30 30 28 24 26
Firozpur 26 29 45 57 50 49 44 57 59
Gurdaspur 51 57 65 66 72 71 70 67 68
Hoshiarpur 42 51 56 54 62 61 58 57 56
Jalandhar 62 44 68 65 75 74 70 68 64
Kapurthala 25 30 33 31 36 36 34 29 30
Ludhiana 50 66 97 79 108 106 105 76 78
Mansa 9 11 10 9 11 11 11 13 11
Moga 13 15 28 17 17 16 29 29
Patiala 44 64 44 35 42 42 40 34 35
Rupnagar (Ropar) 11 12 20 13 11 10 10 12 13
Sangrur 29 34 39 27 33 33 32 30 29
SAS Nagar (Mohali) 12 18 18 17 12 12
SBS Nagar (Nawanshahr) 24 23 21 25 25 22 18 20
Muktsar 14 18 27 20 20 18 29 29
Tarn Taran 33 29 29 28 32 33
Source: Integrated Sample Survey reports (1993-94 to 2012-13), Animal Husbandry Department, Govt. of Punjab.
Dairying in Punjab A Statistical Profile 2014 Part IV : Milk Production
54
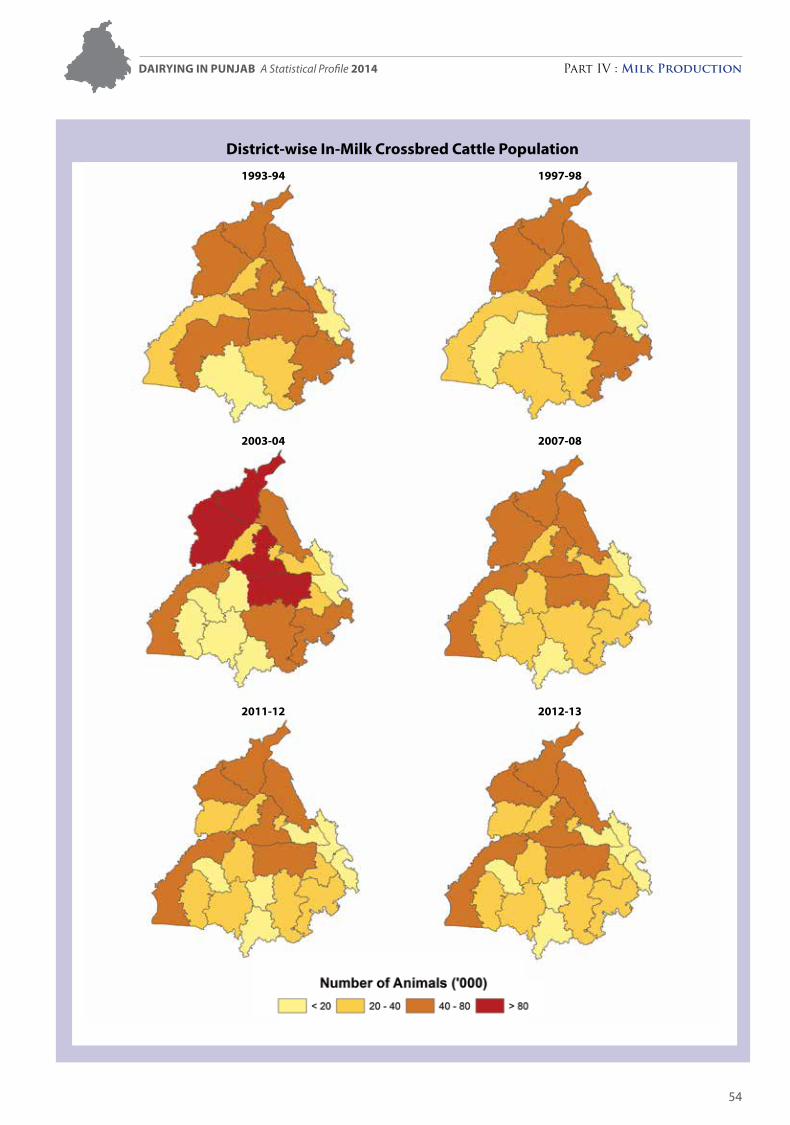
1993-94 1997-98
2003-04 2007-08
2011-12 2012-13
District-wise In-Milk Crossbred Cattle Population
Dairying in Punjab A Statistical Profile 2014 Part IV : Milk Production
55
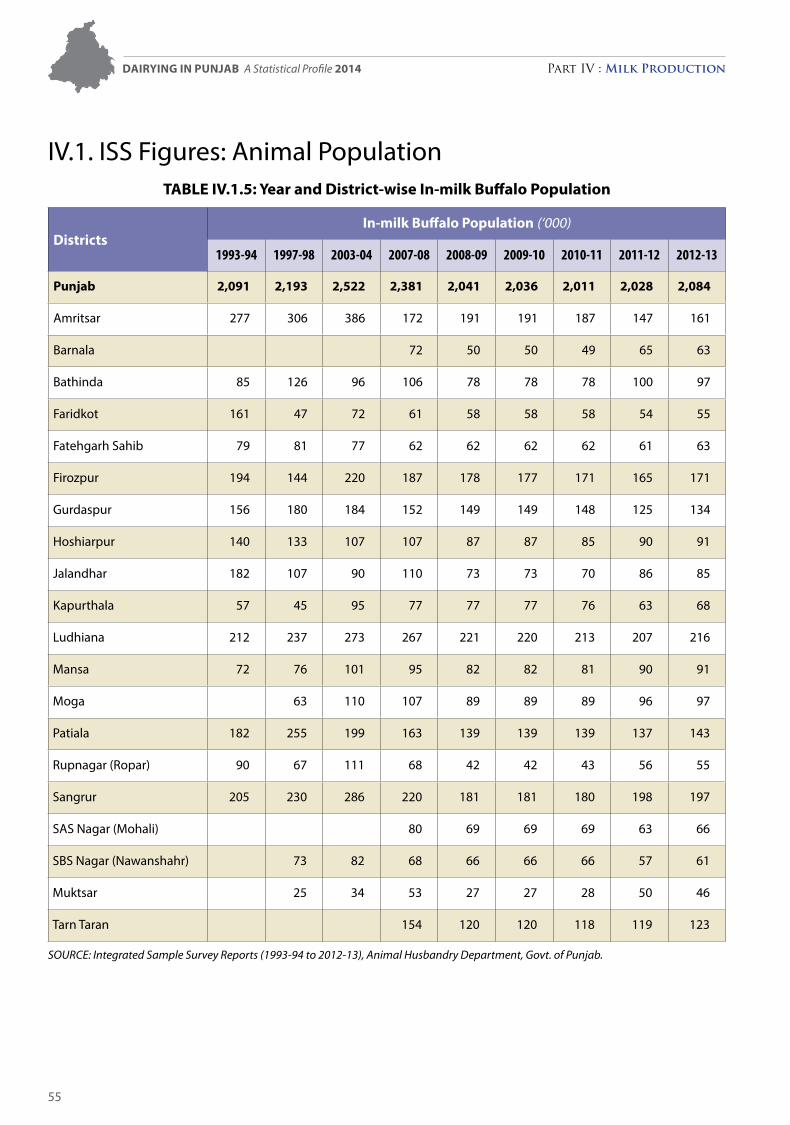
IV.1. ISS Figures: Animal Population Table IV.1.5: Year and District-wise In-milk buffalo Population
DistrictsIn-milk buffalo Population (‘000)
1993-94 1997-98 2003-04 2007-08 2008-09 2009-10 2010-11 2011-12 2012-13
Punjab 2,091 2,193 2,522 2,381 2,041 2,036 2,011 2,028 2,084
Amritsar 277 306 386 172 191 191 187 147 161
Barnala 72 50 50 49 65 63
Bathinda 85 126 96 106 78 78 78 100 97
Faridkot 161 47 72 61 58 58 58 54 55
Fatehgarh Sahib 79 81 77 62 62 62 62 61 63
Firozpur 194 144 220 187 178 177 171 165 171
Gurdaspur 156 180 184 152 149 149 148 125 134
Hoshiarpur 140 133 107 107 87 87 85 90 91
Jalandhar 182 107 90 110 73 73 70 86 85
Kapurthala 57 45 95 77 77 77 76 63 68
Ludhiana 212 237 273 267 221 220 213 207 216
Mansa 72 76 101 95 82 82 81 90 91
Moga 63 110 107 89 89 89 96 97
Patiala 182 255 199 163 139 139 139 137 143
Rupnagar (Ropar) 90 67 111 68 42 42 43 56 55
Sangrur 205 230 286 220 181 181 180 198 197
SAS Nagar (Mohali) 80 69 69 69 63 66
SBS Nagar (Nawanshahr) 73 82 68 66 66 66 57 61
Muktsar 25 34 53 27 27 28 50 46
Tarn Taran 154 120 120 118 119 123
Source: Integrated Sample Survey reports (1993-94 to 2012-13), Animal Husbandry Department, Govt. of Punjab.
Dairying in Punjab A Statistical Profile 2014 Part IV : Milk Production
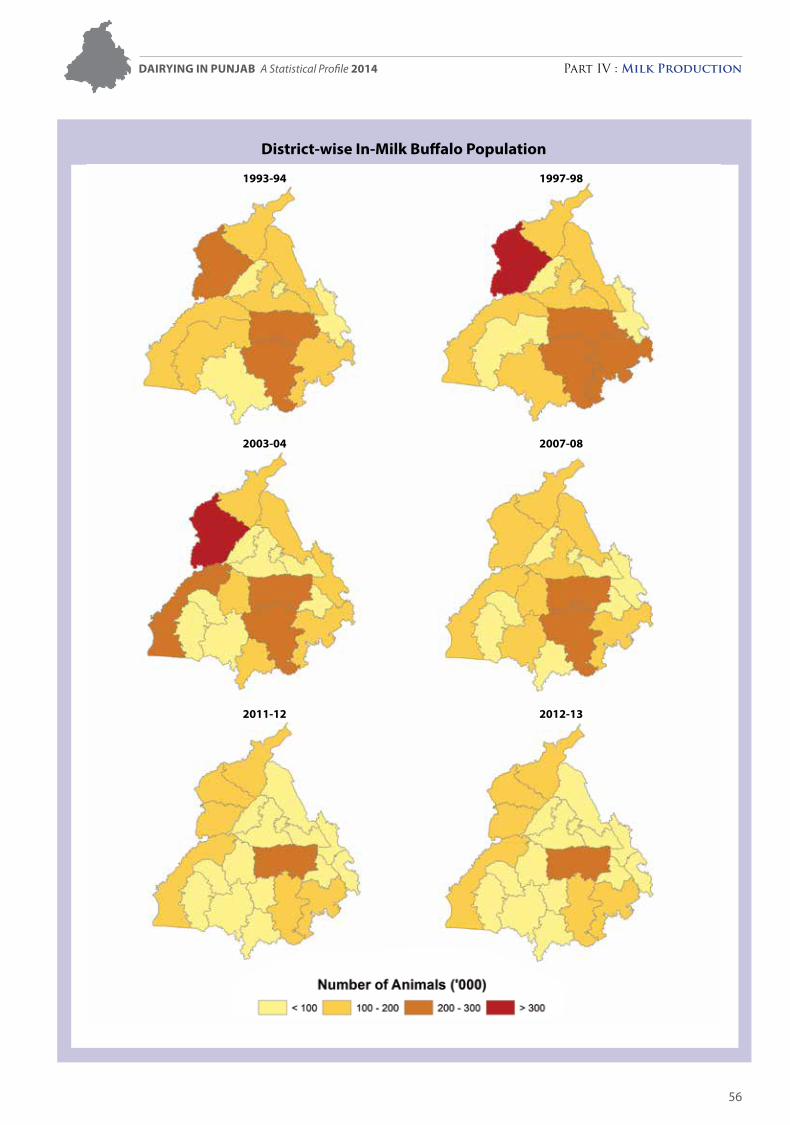
56
1993-94 1997-98
2003-04 2007-08
2011-12 2012-13
District-wise In-Milk buffalo Population
Dairying in Punjab A Statistical Profile 2014 Part IV : Milk Production
57
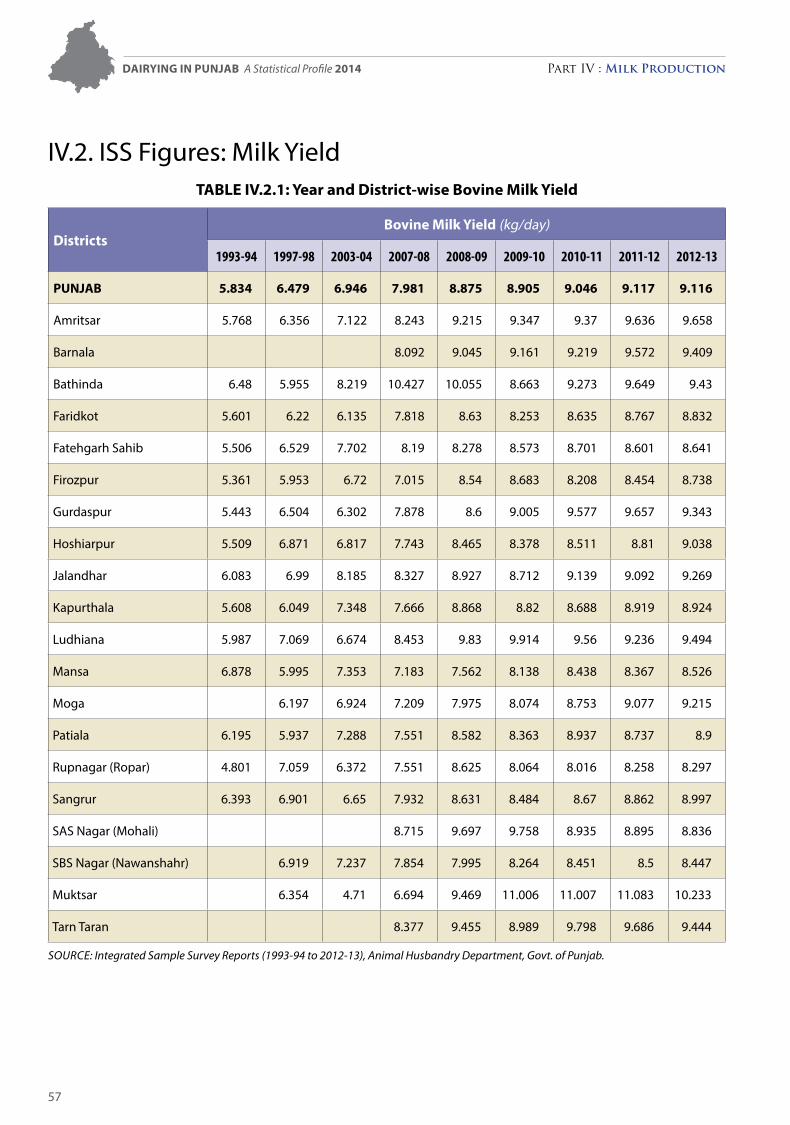
IV.2. ISS Figures: Milk Yield Table IV.2.1: Year and District-wise bovine Milk Yield
Districtsbovine Milk Yield (kg/day)
1993-94 1997-98 2003-04 2007-08 2008-09 2009-10 2010-11 2011-12 2012-13
PUNJab 5.834 6.479 6.946 7.981 8.875 8.905 9.046 9.117 9.116
Amritsar 5.768 6.356 7.122 8.243 9.215 9.347 9.37 9.636 9.658
Barnala 8.092 9.045 9.161 9.219 9.572 9.409
Bathinda 6.48 5.955 8.219 10.427 10.055 8.663 9.273 9.649 9.43
Faridkot 5.601 6.22 6.135 7.818 8.63 8.253 8.635 8.767 8.832
Fatehgarh Sahib 5.506 6.529 7.702 8.19 8.278 8.573 8.701 8.601 8.641
Firozpur 5.361 5.953 6.72 7.015 8.54 8.683 8.208 8.454 8.738
Gurdaspur 5.443 6.504 6.302 7.878 8.6 9.005 9.577 9.657 9.343
Hoshiarpur 5.509 6.871 6.817 7.743 8.465 8.378 8.511 8.81 9.038
Jalandhar 6.083 6.99 8.185 8.327 8.927 8.712 9.139 9.092 9.269
Kapurthala 5.608 6.049 7.348 7.666 8.868 8.82 8.688 8.919 8.924
Ludhiana 5.987 7.069 6.674 8.453 9.83 9.914 9.56 9.236 9.494
Mansa 6.878 5.995 7.353 7.183 7.562 8.138 8.438 8.367 8.526
Moga 6.197 6.924 7.209 7.975 8.074 8.753 9.077 9.215
Patiala 6.195 5.937 7.288 7.551 8.582 8.363 8.937 8.737 8.9
Rupnagar (Ropar) 4.801 7.059 6.372 7.551 8.625 8.064 8.016 8.258 8.297
Sangrur 6.393 6.901 6.65 7.932 8.631 8.484 8.67 8.862 8.997
SAS Nagar (Mohali) 8.715 9.697 9.758 8.935 8.895 8.836
SBS Nagar (Nawanshahr) 6.919 7.237 7.854 7.995 8.264 8.451 8.5 8.447
Muktsar 6.354 4.71 6.694 9.469 11.006 11.007 11.083 10.233
Tarn Taran 8.377 9.455 8.989 9.798 9.686 9.444
Source: Integrated Sample Survey reports (1993-94 to 2012-13), Animal Husbandry Department, Govt. of Punjab.
Dairying in Punjab A Statistical Profile 2014 Part IV : Milk Production
58
Dairying in Punjab A Statistical Profile 2014 Part IV : Milk Production
59
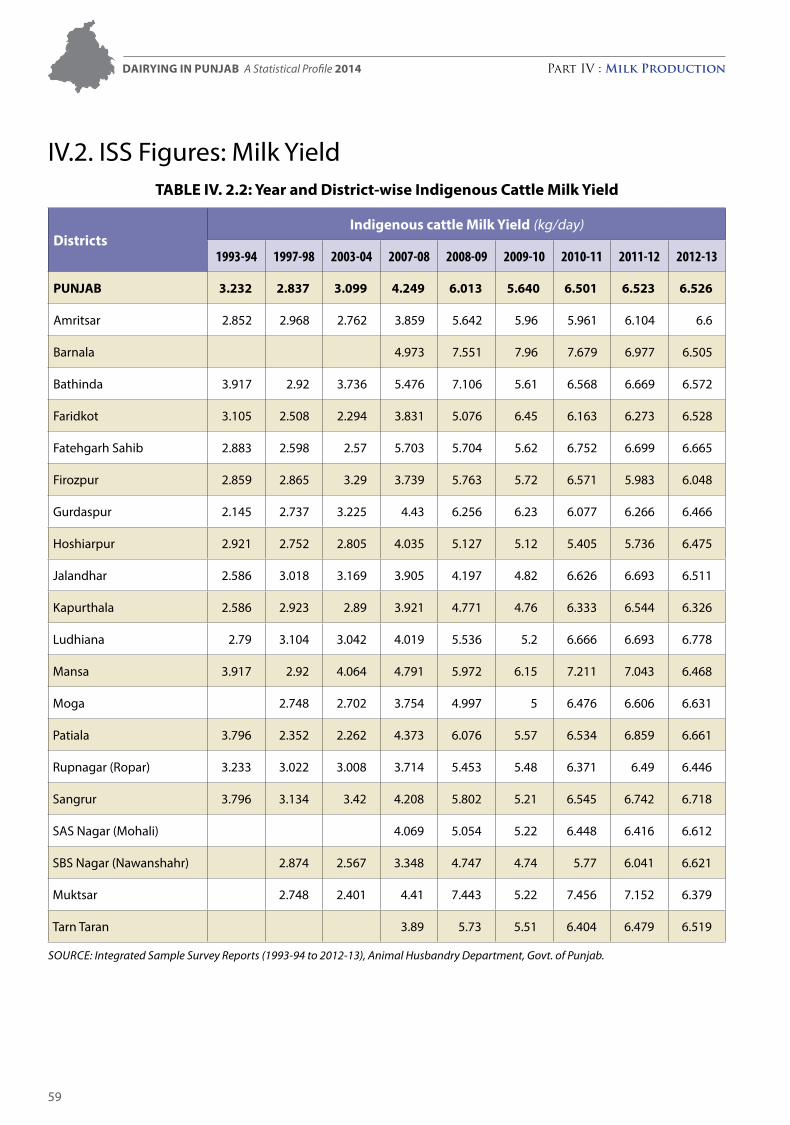
IV.2. ISS Figures: Milk YieldTable IV. 2.2: Year and District-wise Indigenous Cattle Milk Yield
DistrictsIndigenous cattle Milk Yield (kg/day)
1993-94 1997-98 2003-04 2007-08 2008-09 2009-10 2010-11 2011-12 2012-13
PUNJab 3.232 2.837 3.099 4.249 6.013 5.640 6.501 6.523 6.526
Amritsar 2.852 2.968 2.762 3.859 5.642 5.96 5.961 6.104 6.6
Barnala 4.973 7.551 7.96 7.679 6.977 6.505
Bathinda 3.917 2.92 3.736 5.476 7.106 5.61 6.568 6.669 6.572
Faridkot 3.105 2.508 2.294 3.831 5.076 6.45 6.163 6.273 6.528
Fatehgarh Sahib 2.883 2.598 2.57 5.703 5.704 5.62 6.752 6.699 6.665
Firozpur 2.859 2.865 3.29 3.739 5.763 5.72 6.571 5.983 6.048
Gurdaspur 2.145 2.737 3.225 4.43 6.256 6.23 6.077 6.266 6.466
Hoshiarpur 2.921 2.752 2.805 4.035 5.127 5.12 5.405 5.736 6.475
Jalandhar 2.586 3.018 3.169 3.905 4.197 4.82 6.626 6.693 6.511
Kapurthala 2.586 2.923 2.89 3.921 4.771 4.76 6.333 6.544 6.326
Ludhiana 2.79 3.104 3.042 4.019 5.536 5.2 6.666 6.693 6.778
Mansa 3.917 2.92 4.064 4.791 5.972 6.15 7.211 7.043 6.468
Moga 2.748 2.702 3.754 4.997 5 6.476 6.606 6.631
Patiala 3.796 2.352 2.262 4.373 6.076 5.57 6.534 6.859 6.661
Rupnagar (Ropar) 3.233 3.022 3.008 3.714 5.453 5.48 6.371 6.49 6.446
Sangrur 3.796 3.134 3.42 4.208 5.802 5.21 6.545 6.742 6.718
SAS Nagar (Mohali) 4.069 5.054 5.22 6.448 6.416 6.612
SBS Nagar (Nawanshahr) 2.874 2.567 3.348 4.747 4.74 5.77 6.041 6.621
Muktsar 2.748 2.401 4.41 7.443 5.22 7.456 7.152 6.379
Tarn Taran 3.89 5.73 5.51 6.404 6.479 6.519
Source: Integrated Sample Survey reports (1993-94 to 2012-13), Animal Husbandry Department, Govt. of Punjab.
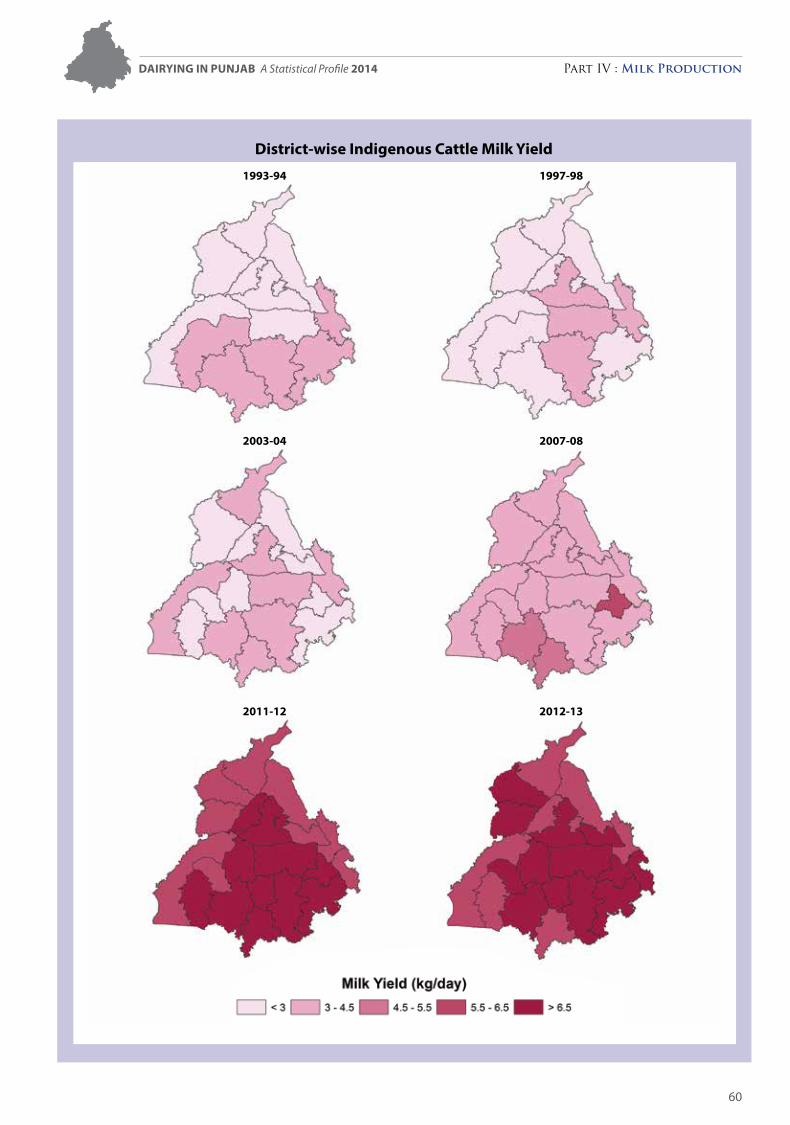
Dairying in Punjab A Statistical Profile 2014 Part IV : Milk Production
60
1993-94 1997-98
2003-04 2007-08
2011-12 2012-13
District-wise Indigenous Cattle Milk Yield
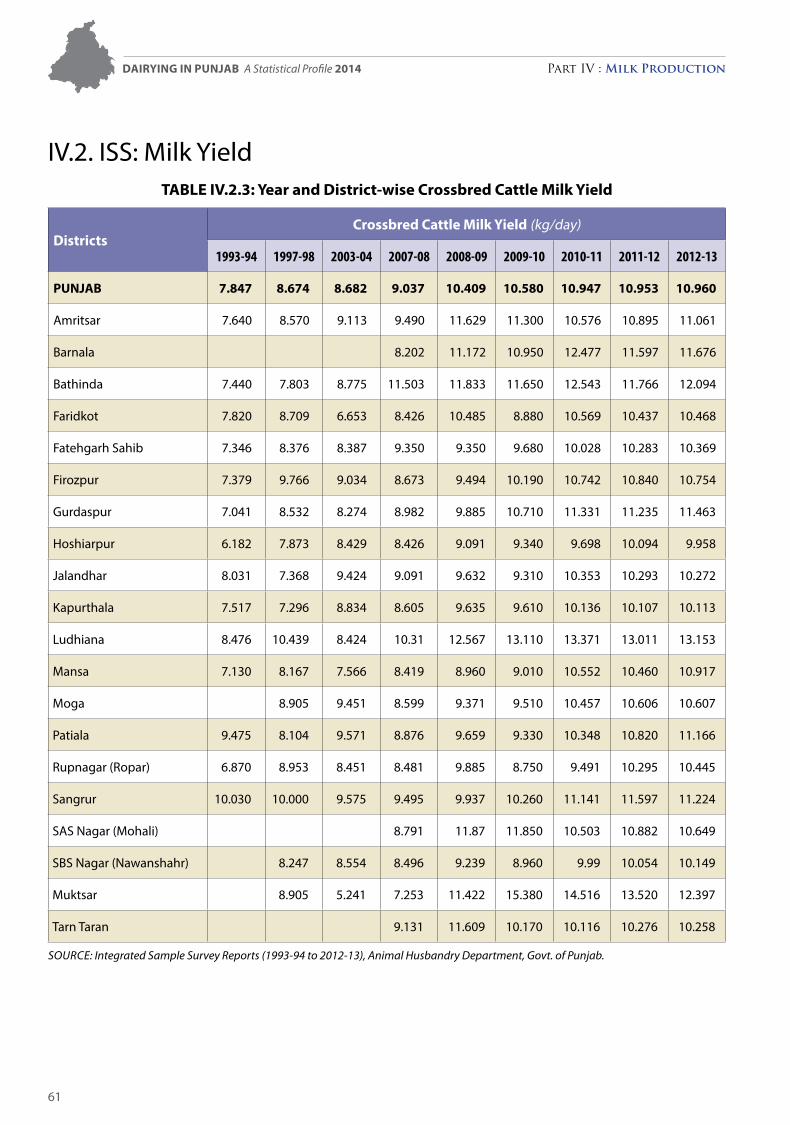
Dairying in Punjab A Statistical Profile 2014 Part IV : Milk Production
61
IV.2. ISS: Milk Yield Table IV.2.3: Year and District-wise Crossbred Cattle Milk Yield
DistrictsCrossbred Cattle Milk Yield (kg/day)
1993-94 1997-98 2003-04 2007-08 2008-09 2009-10 2010-11 2011-12 2012-13
PUNJab 7.847 8.674 8.682 9.037 10.409 10.580 10.947 10.953 10.960
Amritsar 7.640 8.570 9.113 9.490 11.629 11.300 10.576 10.895 11.061
Barnala 8.202 11.172 10.950 12.477 11.597 11.676
Bathinda 7.440 7.803 8.775 11.503 11.833 11.650 12.543 11.766 12.094
Faridkot 7.820 8.709 6.653 8.426 10.485 8.880 10.569 10.437 10.468
Fatehgarh Sahib 7.346 8.376 8.387 9.350 9.350 9.680 10.028 10.283 10.369
Firozpur 7.379 9.766 9.034 8.673 9.494 10.190 10.742 10.840 10.754
Gurdaspur 7.041 8.532 8.274 8.982 9.885 10.710 11.331 11.235 11.463
Hoshiarpur 6.182 7.873 8.429 8.426 9.091 9.340 9.698 10.094 9.958
Jalandhar 8.031 7.368 9.424 9.091 9.632 9.310 10.353 10.293 10.272
Kapurthala 7.517 7.296 8.834 8.605 9.635 9.610 10.136 10.107 10.113
Ludhiana 8.476 10.439 8.424 10.31 12.567 13.110 13.371 13.011 13.153
Mansa 7.130 8.167 7.566 8.419 8.960 9.010 10.552 10.460 10.917
Moga 8.905 9.451 8.599 9.371 9.510 10.457 10.606 10.607
Patiala 9.475 8.104 9.571 8.876 9.659 9.330 10.348 10.820 11.166
Rupnagar (Ropar) 6.870 8.953 8.451 8.481 9.885 8.750 9.491 10.295 10.445
Sangrur 10.030 10.000 9.575 9.495 9.937 10.260 11.141 11.597 11.224
SAS Nagar (Mohali) 8.791 11.87 11.850 10.503 10.882 10.649
SBS Nagar (Nawanshahr) 8.247 8.554 8.496 9.239 8.960 9.99 10.054 10.149
Muktsar 8.905 5.241 7.253 11.422 15.380 14.516 13.520 12.397
Tarn Taran 9.131 11.609 10.170 10.116 10.276 10.258
Source: Integrated Sample Survey reports (1993-94 to 2012-13), Animal Husbandry Department, Govt. of Punjab.
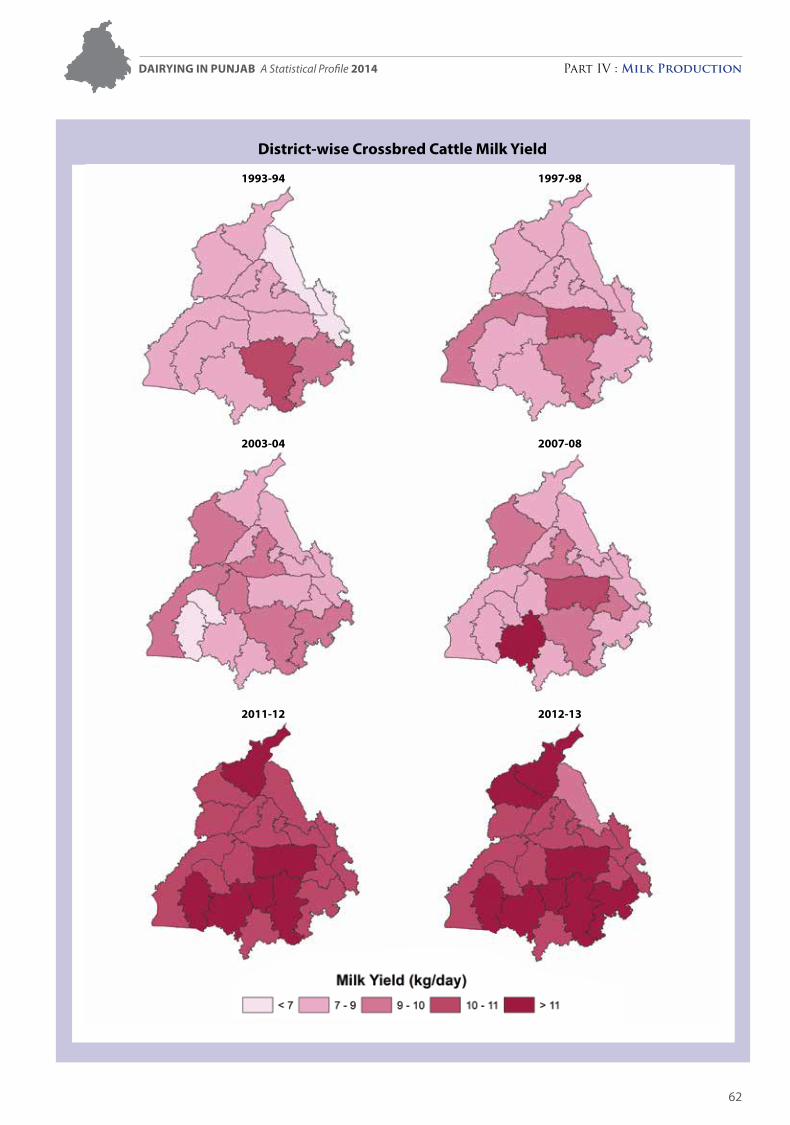
Dairying in Punjab A Statistical Profile 2014 Part IV : Milk Production
62
1993-94 1997-98
2003-04 2007-08
2011-12 2012-13
District-wise Crossbred Cattle Milk Yield
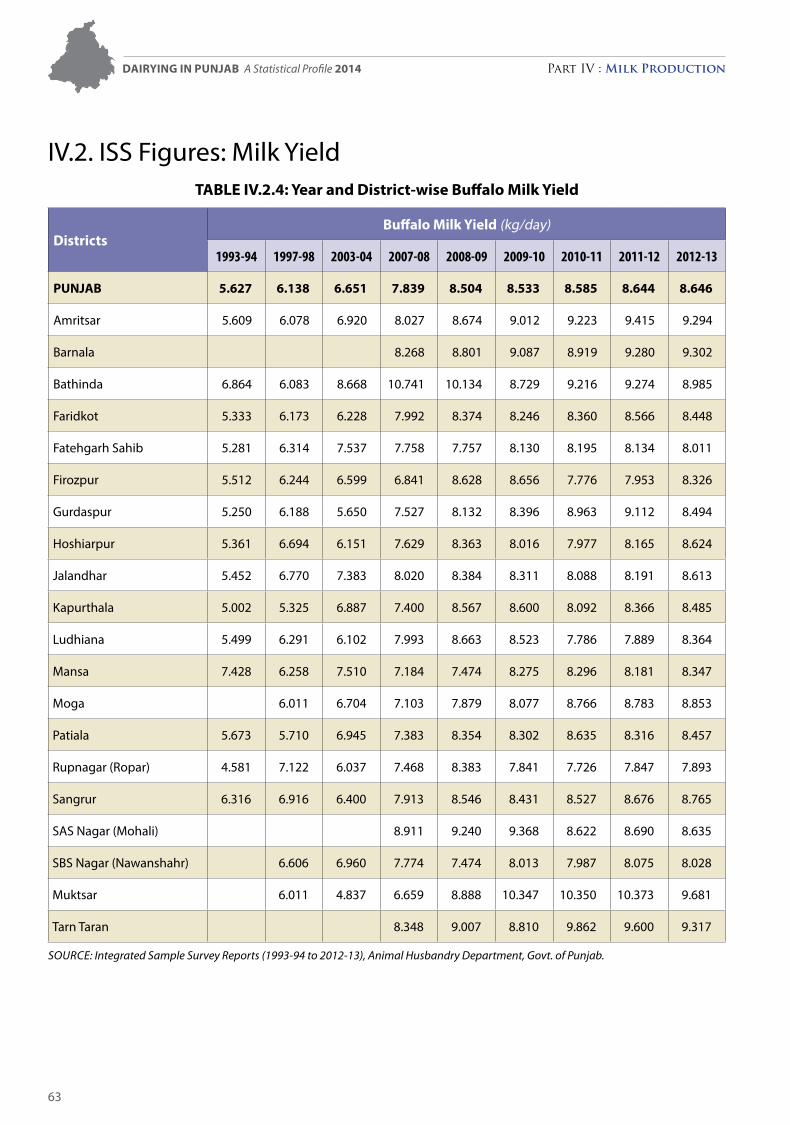
Dairying in Punjab A Statistical Profile 2014 Part IV : Milk Production
63
IV.2. ISS Figures: Milk Yield Table IV.2.4: Year and District-wise buffalo Milk Yield
Districtsbuffalo Milk Yield (kg/day)
1993-94 1997-98 2003-04 2007-08 2008-09 2009-10 2010-11 2011-12 2012-13
PUNJab 5.627 6.138 6.651 7.839 8.504 8.533 8.585 8.644 8.646
Amritsar 5.609 6.078 6.920 8.027 8.674 9.012 9.223 9.415 9.294
Barnala 8.268 8.801 9.087 8.919 9.280 9.302
Bathinda 6.864 6.083 8.668 10.741 10.134 8.729 9.216 9.274 8.985
Faridkot 5.333 6.173 6.228 7.992 8.374 8.246 8.360 8.566 8.448
Fatehgarh Sahib 5.281 6.314 7.537 7.758 7.757 8.130 8.195 8.134 8.011
Firozpur 5.512 6.244 6.599 6.841 8.628 8.656 7.776 7.953 8.326
Gurdaspur 5.250 6.188 5.650 7.527 8.132 8.396 8.963 9.112 8.494
Hoshiarpur 5.361 6.694 6.151 7.629 8.363 8.016 7.977 8.165 8.624
Jalandhar 5.452 6.770 7.383 8.020 8.384 8.311 8.088 8.191 8.613
Kapurthala 5.002 5.325 6.887 7.400 8.567 8.600 8.092 8.366 8.485
Ludhiana 5.499 6.291 6.102 7.993 8.663 8.523 7.786 7.889 8.364
Mansa 7.428 6.258 7.510 7.184 7.474 8.275 8.296 8.181 8.347
Moga 6.011 6.704 7.103 7.879 8.077 8.766 8.783 8.853
Patiala 5.673 5.710 6.945 7.383 8.354 8.302 8.635 8.316 8.457
Rupnagar (Ropar) 4.581 7.122 6.037 7.468 8.383 7.841 7.726 7.847 7.893
Sangrur 6.316 6.916 6.400 7.913 8.546 8.431 8.527 8.676 8.765
SAS Nagar (Mohali) 8.911 9.240 9.368 8.622 8.690 8.635
SBS Nagar (Nawanshahr) 6.606 6.960 7.774 7.474 8.013 7.987 8.075 8.028
Muktsar 6.011 4.837 6.659 8.888 10.347 10.350 10.373 9.681
Tarn Taran 8.348 9.007 8.810 9.862 9.600 9.317
Source: Integrated Sample Survey reports (1993-94 to 2012-13), Animal Husbandry Department, Govt. of Punjab.
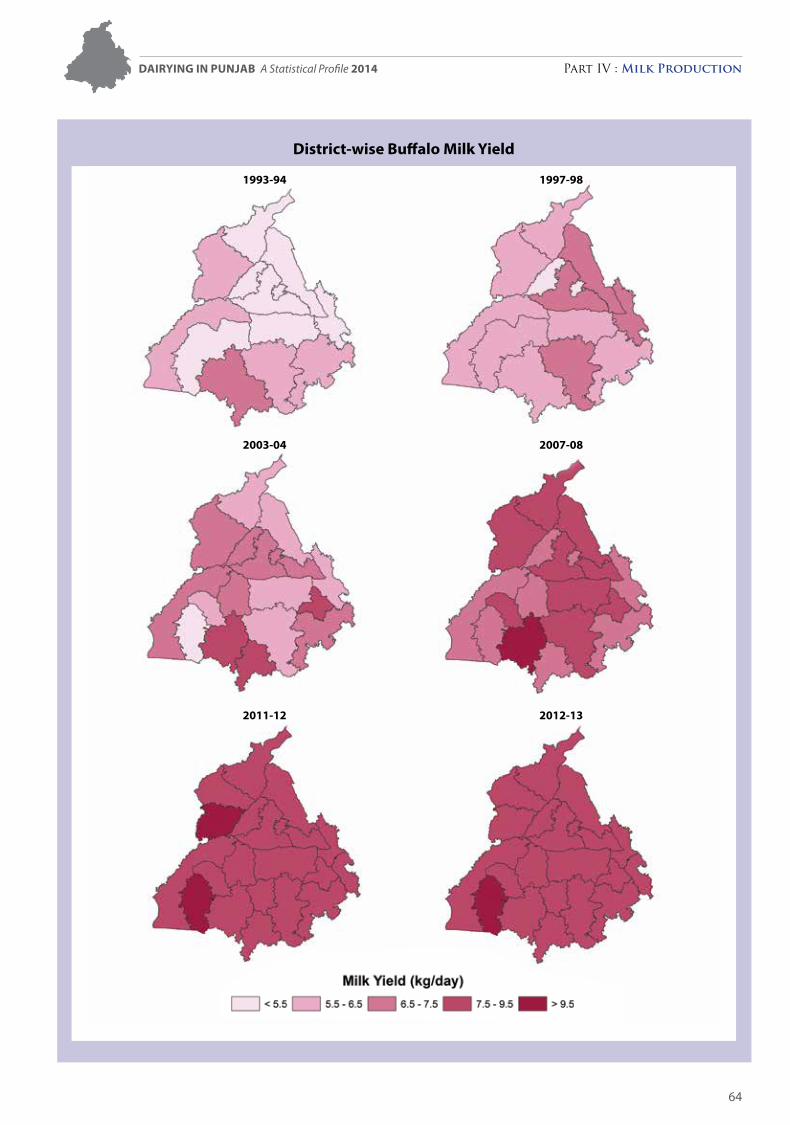
Dairying in Punjab A Statistical Profile 2014 Part IV : Milk Production
64
1993-94 1997-98
2003-04 2007-08
2011-12 2012-13
District-wise buffalo Milk Yield
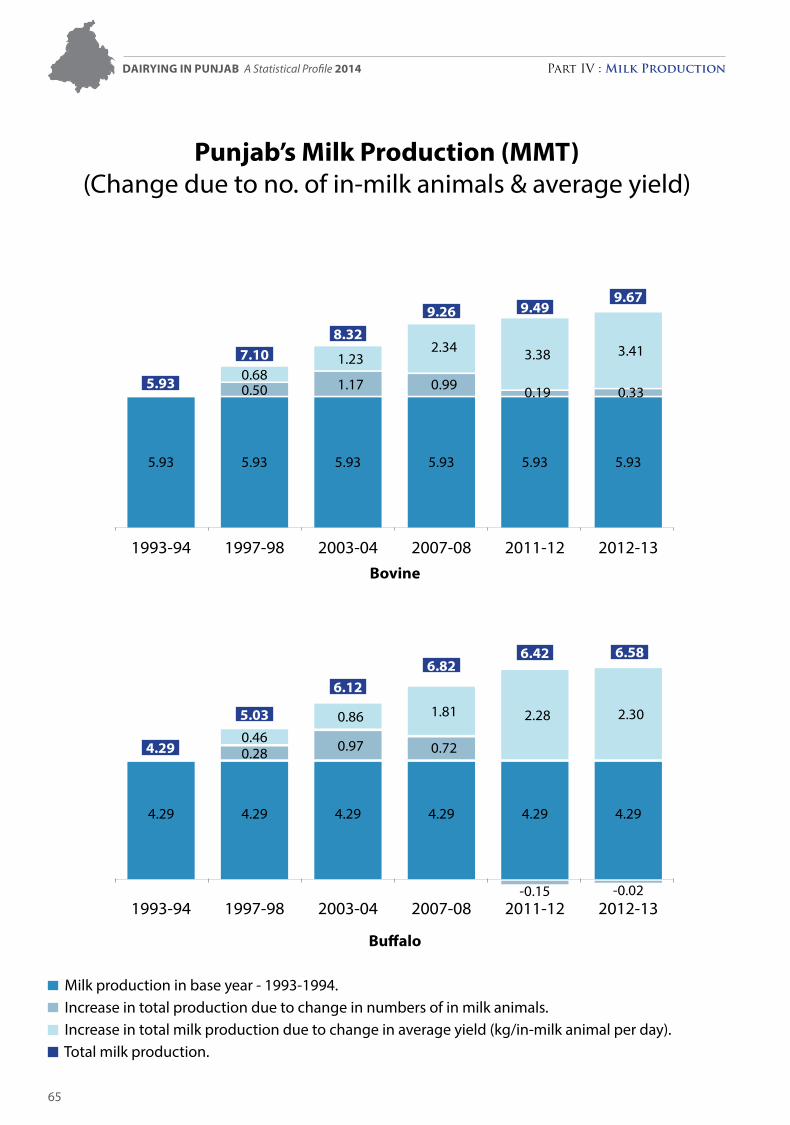
Dairying in Punjab A Statistical Profile 2014 Part IV : Milk Production
65
Punjab’s Milk Production (MMT) (Change due to no. of in-milk animals & average yield)
1993-94 1997-98 2003-04 2007-08 2011-12 2012-13
5.93
9.67
5.93
9.49
5.93
9.26
5.93
8.32
5.93
7.10
1.17 0.99 0.19 0.33
3.413.382.341.23
0.680.50
5.93
5.93
bovine
Milk production in base year - 1993-1994. Increase in total production due to change in numbers of in milk animals. Increase in total milk production due to change in average yield (kg/in-milk animal per day). Total milk production.
6.58
buffalo
1993-94 1997-98 2003-04 2007-08 2011-12 2012-13
4.294.29
6.42
4.29
6.82
4.29
6.12
4.29
5.03
0.97 0.72
-0.15 -0.02
2.302.281.810.860.460.28
4.29
4.29
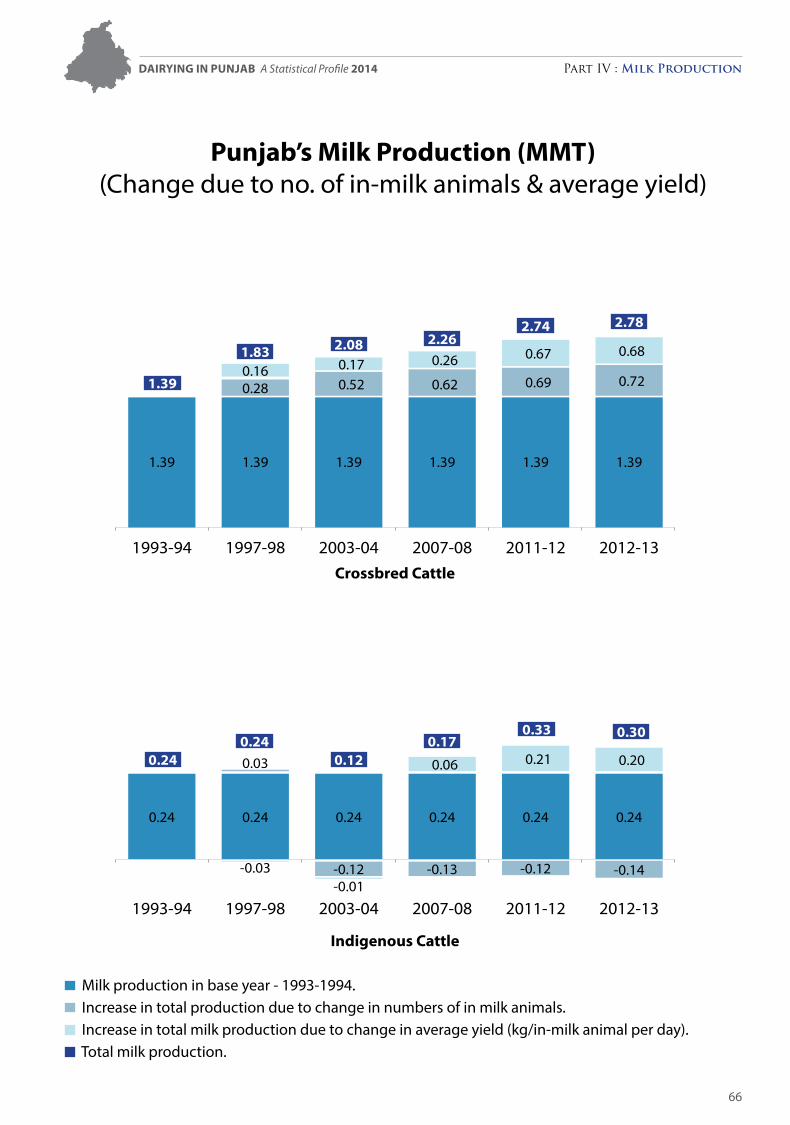
Dairying in Punjab A Statistical Profile 2014 Part IV : Milk Production
66
Punjab’s Milk Production (MMT) (Change due to no. of in-milk animals & average yield)
1993-94 1997-98 2003-04 2007-08 2011-12 2012-13
1.39
2.78
1.39
2.74
1.39
2.26
1.39
2.08
1.39
1.83
0.52 0.62 0.69 0.72
0.67 0.680.260.170.16
0.28
1.39
1.39
Crossbred Cattle
1993-94 1997-98 2003-04 2007-08 2011-12 2012-13
0.24
0.30
0.24
0.33
0.24
0.17
0.24
0.12
0.24
0.24
-0.01-0.12 -0.14
0.200.210.06
-0.12 -0.13
0.03
-0.03
0.24
0.24
Indigenous Cattle
Milk production in base year - 1993-1994. Increase in total production due to change in numbers of in milk animals. Increase in total milk production due to change in average yield (kg/in-milk animal per day). Total milk production.
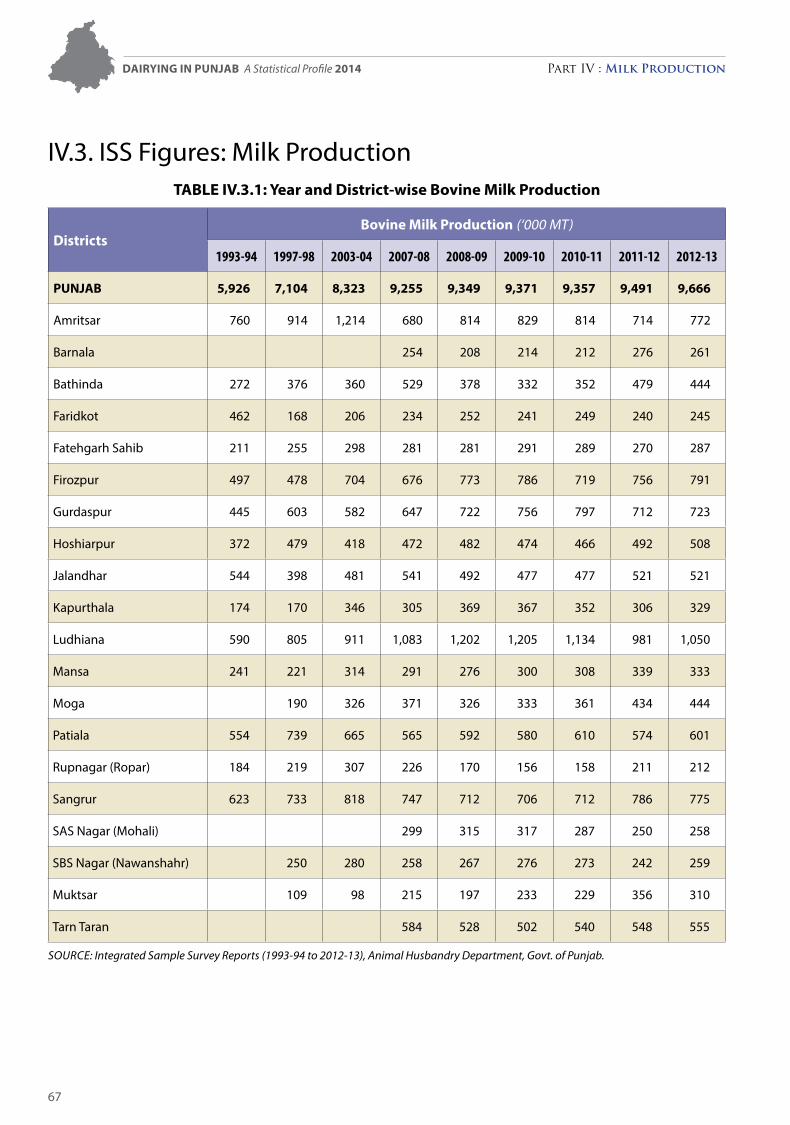
Dairying in Punjab A Statistical Profile 2014 Part IV : Milk Production
67
IV.3. ISS Figures: Milk ProductionTable IV.3.1: Year and District-wise bovine Milk Production
Districtsbovine Milk Production (‘000 MT)
1993-94 1997-98 2003-04 2007-08 2008-09 2009-10 2010-11 2011-12 2012-13
PUNJab 5,926 7,104 8,323 9,255 9,349 9,371 9,357 9,491 9,666
Amritsar 760 914 1,214 680 814 829 814 714 772
Barnala 254 208 214 212 276 261
Bathinda 272 376 360 529 378 332 352 479 444
Faridkot 462 168 206 234 252 241 249 240 245
Fatehgarh Sahib 211 255 298 281 281 291 289 270 287
Firozpur 497 478 704 676 773 786 719 756 791
Gurdaspur 445 603 582 647 722 756 797 712 723
Hoshiarpur 372 479 418 472 482 474 466 492 508
Jalandhar 544 398 481 541 492 477 477 521 521
Kapurthala 174 170 346 305 369 367 352 306 329
Ludhiana 590 805 911 1,083 1,202 1,205 1,134 981 1,050
Mansa 241 221 314 291 276 300 308 339 333
Moga 190 326 371 326 333 361 434 444
Patiala 554 739 665 565 592 580 610 574 601
Rupnagar (Ropar) 184 219 307 226 170 156 158 211 212
Sangrur 623 733 818 747 712 706 712 786 775
SAS Nagar (Mohali) 299 315 317 287 250 258
SBS Nagar (Nawanshahr) 250 280 258 267 276 273 242 259
Muktsar 109 98 215 197 233 229 356 310
Tarn Taran 584 528 502 540 548 555
Source: Integrated Sample Survey reports (1993-94 to 2012-13), Animal Husbandry Department, Govt. of Punjab.
Dairying in Punjab A Statistical Profile 2014 Part IV : Milk Production
68
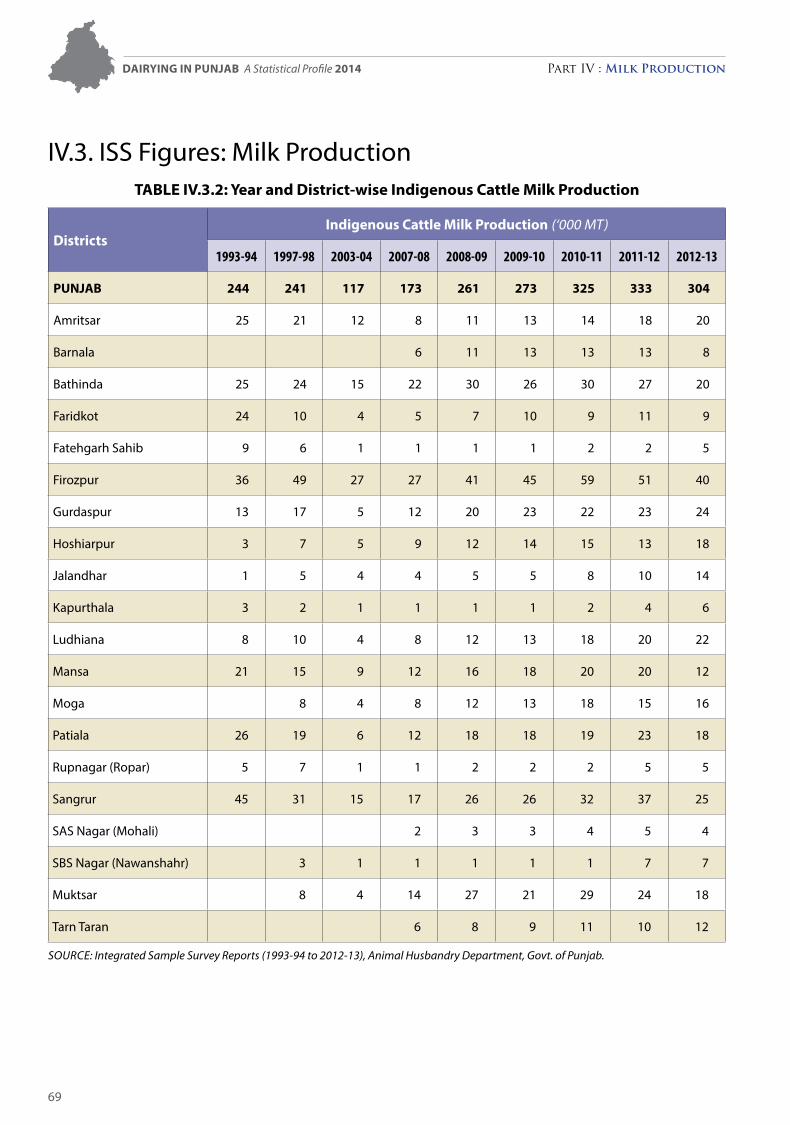
Dairying in Punjab A Statistical Profile 2014 Part IV : Milk Production
69
IV.3. ISS Figures: Milk Production Table IV.3.2: Year and District-wise Indigenous Cattle Milk Production
DistrictsIndigenous Cattle Milk Production (‘000 MT)
1993-94 1997-98 2003-04 2007-08 2008-09 2009-10 2010-11 2011-12 2012-13
PUNJab 244 241 117 173 261 273 325 333 304
Amritsar 25 21 12 8 11 13 14 18 20
Barnala 6 11 13 13 13 8
Bathinda 25 24 15 22 30 26 30 27 20
Faridkot 24 10 4 5 7 10 9 11 9
Fatehgarh Sahib 9 6 1 1 1 1 2 2 5
Firozpur 36 49 27 27 41 45 59 51 40
Gurdaspur 13 17 5 12 20 23 22 23 24
Hoshiarpur 3 7 5 9 12 14 15 13 18
Jalandhar 1 5 4 4 5 5 8 10 14
Kapurthala 3 2 1 1 1 1 2 4 6
Ludhiana 8 10 4 8 12 13 18 20 22
Mansa 21 15 9 12 16 18 20 20 12
Moga 8 4 8 12 13 18 15 16
Patiala 26 19 6 12 18 18 19 23 18
Rupnagar (Ropar) 5 7 1 1 2 2 2 5 5
Sangrur 45 31 15 17 26 26 32 37 25
SAS Nagar (Mohali) 2 3 3 4 5 4
SBS Nagar (Nawanshahr) 3 1 1 1 1 1 7 7
Muktsar 8 4 14 27 21 29 24 18
Tarn Taran 6 8 9 11 10 12
Source: Integrated Sample Survey reports (1993-94 to 2012-13), Animal Husbandry Department, Govt. of Punjab.
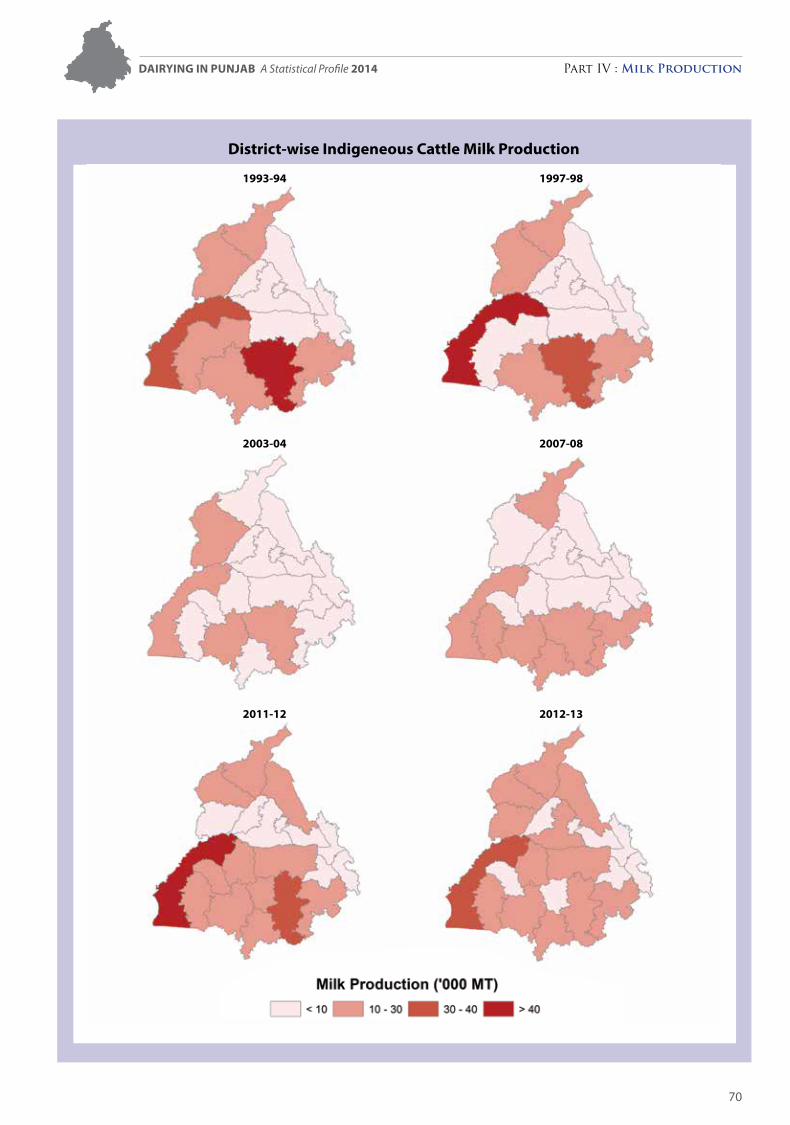
Dairying in Punjab A Statistical Profile 2014 Part IV : Milk Production
70
1993-94 1997-98
2003-04 2007-08
2011-12 2012-13
District-wise Indigeneous Cattle Milk Production

Dairying in Punjab A Statistical Profile 2014 Part IV : Milk Production
71
IV.3. ISS Figures: Milk ProductionTable IV.3.3: Year and District-wise Crossbred Cattle Milk Production
DistrictsCrossbred Cattle Milk Production (‘000 MT)
1993-94 1997-98 2003-04 2007-08 2008-09 2009-10 2010-11 2011-12 2012-13
PUNJab 1,388 1,829 2,084 2,262 2,756 2,758 2,735 2,741 2,784
Amritsar 167 215 228 167 197 188 169 191 204
Barnala 29 37 36 40 41 39
Bathinda 33 71 41 91 60 59 61 112 105
Faridkot 125 52 39 52 68 57 65 61 65
Fatehgarh Sahib 50 61 85 104 104 106 103 86 97
Firozpur 71 102 148 182 172 181 174 226 232
Gurdaspur 132 179 197 216 260 277 291 273 282
Hoshiarpur 96 147 172 165 205 207 202 211 203
Jalandhar 181 130 234 216 264 251 262 252 240
Kapurthala 68 81 105 96 127 124 124 108 111
Ludhiana 156 250 300 296 493 507 511 363 369
Mansa 24 32 27 29 36 35 43 48 45
Moga 44 53 87 58 58 59 109 114
Patiala 152 189 154 113 149 141 151 135 142
Rupnagar (Ropar) 28 38 62 40 38 33 36 45 50
Sangrur 106 122 135 95 121 123 119 121 120
SAS Nagar (Mohali) 38 79 78 66 46 46
SBS Nagar (Nawanshahr) 72 71 65 85 81 79 66 73
Muktsar 45 34 72 82 109 93 143 130
Tarn Taran 109 124 107 103 120 126
Source: Integrated Sample Survey reports (1993-94 to 2012-13), Animal Husbandry Department, Govt. of Punjab.
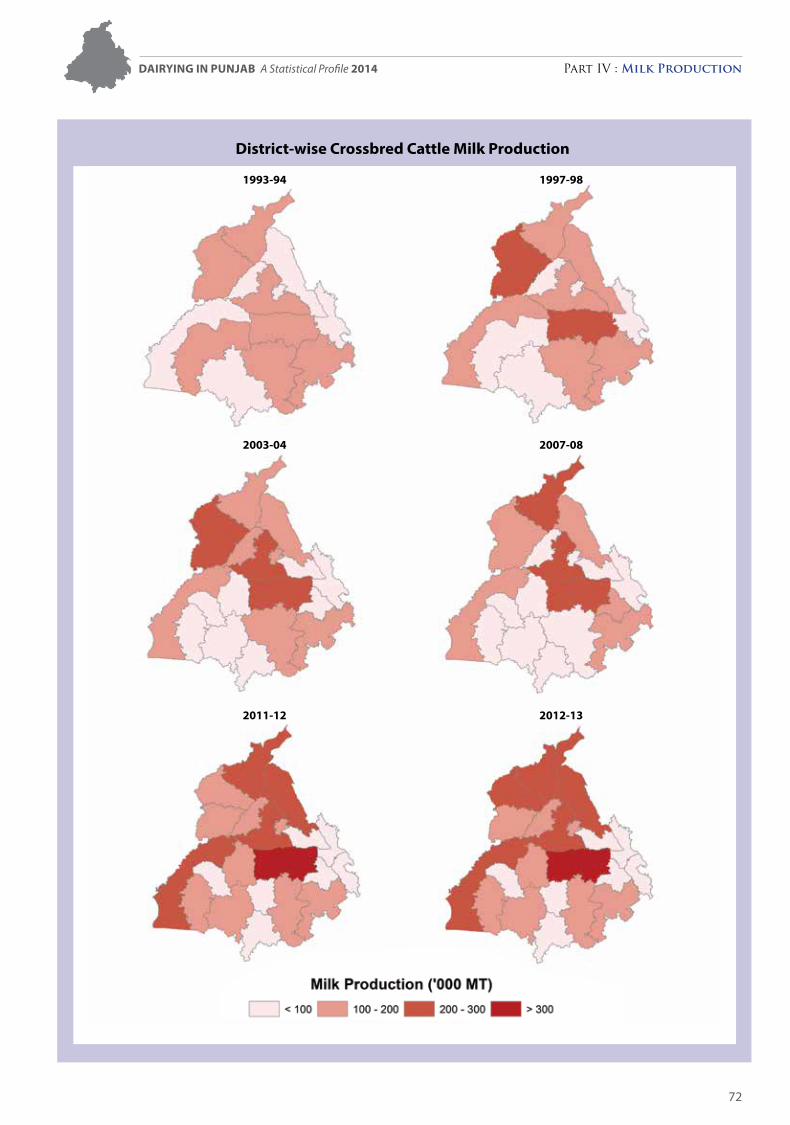
Dairying in Punjab A Statistical Profile 2014 Part IV : Milk Production
72
1993-94 1997-98
2003-04 2007-08
2011-12 2012-13
District-wise Crossbred Cattle Milk Production

Dairying in Punjab A Statistical Profile 2014 Part IV : Milk Production
73
IV.3. ISS Figures: Milk Production Table IV.3.4: Year and District-wise buffalo Milk Production
Districtsbuffalo Milk Production (‘000 MT)
1993-94 1997-98 2003-04 2007-08 2008-09 2009-10 2010-11 2011-12 2012-13
Punjab 4,294 5,034 6,122 6,820 6,332 6,340 6,297 6,417 6,578
Amritsar 568 678 974 505 606 628 631 505 548
Barnala 219 160 165 159 222 214
Bathinda 214 281 304 416 288 247 261 340 319
Faridkot 313 106 163 177 177 174 175 168 171
Fatehgarh Sahib 152 188 212 176 176 184 184 182 185
Firozpur 390 327 529 467 560 560 486 479 519
Gurdaspur 300 407 380 419 442 456 484 416 417
Hoshiarpur 273 325 241 298 265 253 249 268 287
Jalandhar 362 263 243 321 223 221 207 259 267
Kapurthala 103 87 240 208 241 242 226 194 212
Ludhiana 426 545 607 779 697 685 605 598 659
Mansa 196 174 278 250 224 247 245 271 276
Moga 138 269 276 256 262 284 310 314
Patiala 376 531 505 440 425 421 440 416 441
Rupnagar (Ropar) 151 174 244 185 130 121 120 161 157
Sangrur 472 580 668 635 565 557 561 628 630
SAS Nagar (Mohali) 259 233 236 217 199 208
SBS Nagar (Nawanshahr) 175 208 192 181 194 193 169 179
Muktsar 56 60 129 88 103 107 189 162
Tarn Taran 469 396 386 425 418 417
Source: Integrated Sample Survey reports (1993-94 to 2012-13), Animal Husbandry Department, Govt. of Punjab.
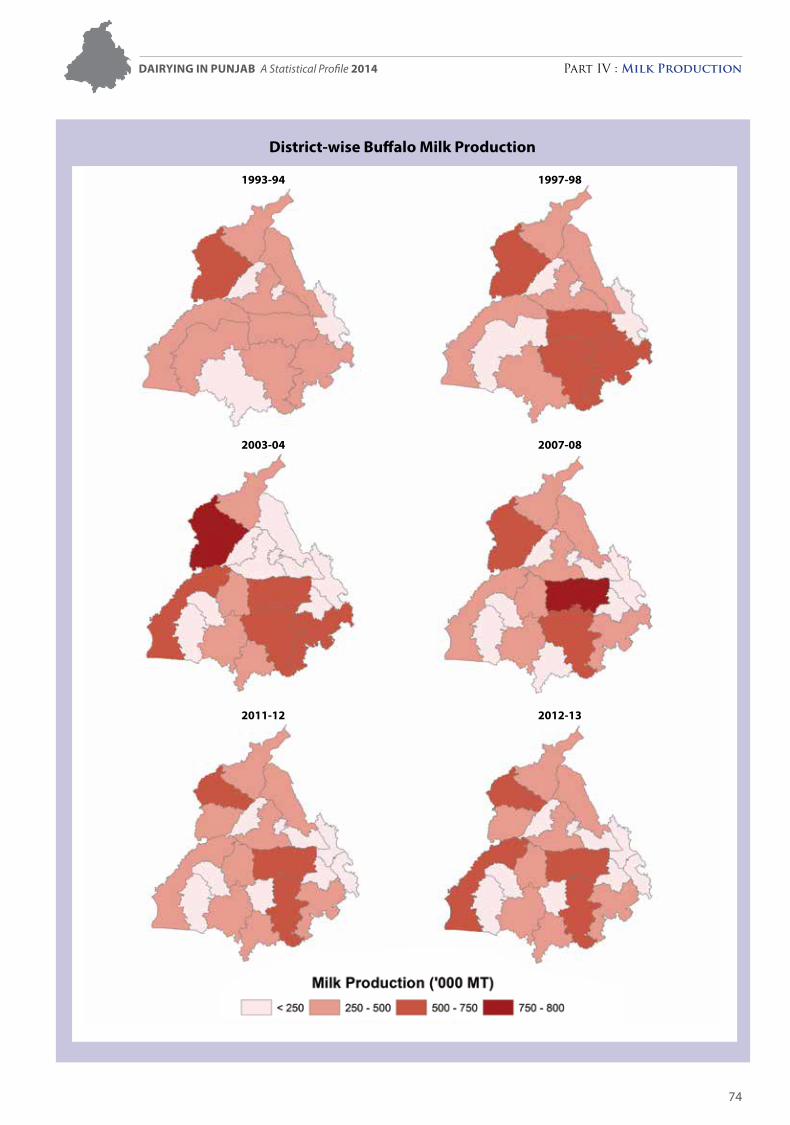
Dairying in Punjab A Statistical Profile 2014 Part IV : Milk Production
74
1993-94 1997-98
2003-04 2007-08
2011-12 2012-13
District-wise buffalo Milk Production
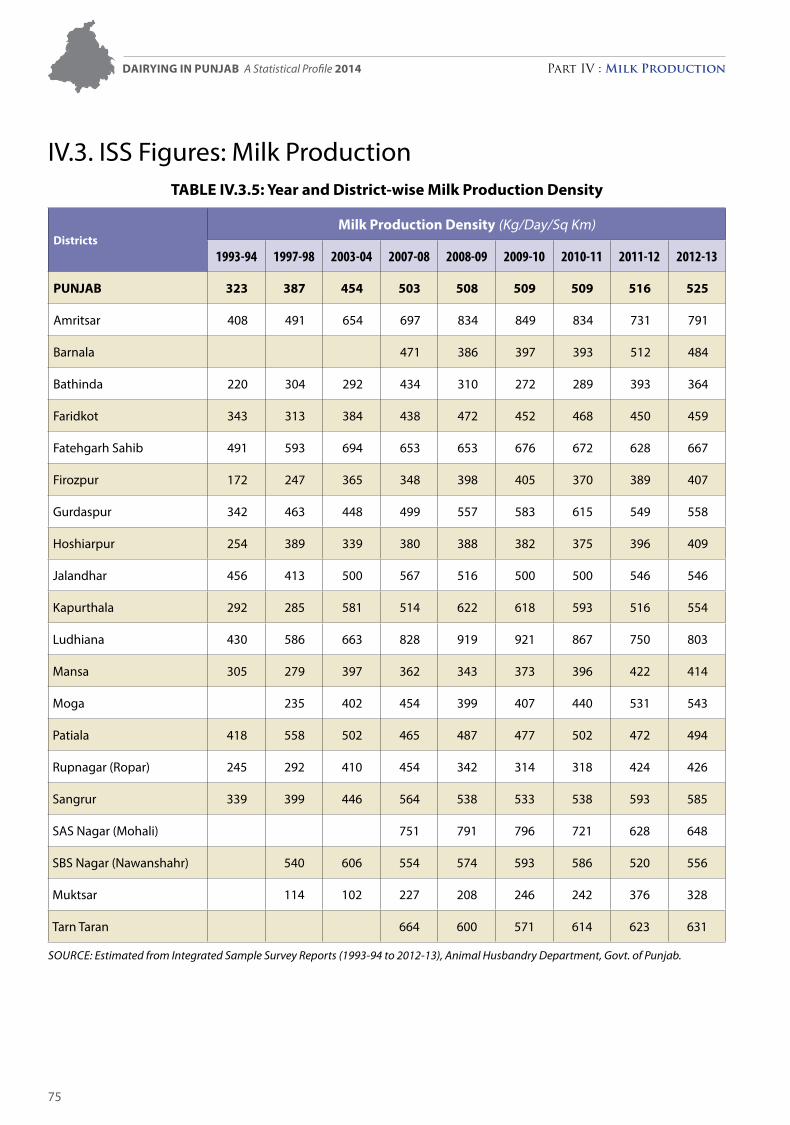
Dairying in Punjab A Statistical Profile 2014 Part IV : Milk Production
75
IV.3. ISS Figures: Milk Production Table IV.3.5: Year and District-wise Milk Production Density
DistrictsMilk Production Density (Kg/Day/Sq Km)
1993-94 1997-98 2003-04 2007-08 2008-09 2009-10 2010-11 2011-12 2012-13
PUNJab 323 387 454 503 508 509 509 516 525
Amritsar 408 491 654 697 834 849 834 731 791
Barnala 471 386 397 393 512 484
Bathinda 220 304 292 434 310 272 289 393 364
Faridkot 343 313 384 438 472 452 468 450 459
Fatehgarh Sahib 491 593 694 653 653 676 672 628 667
Firozpur 172 247 365 348 398 405 370 389 407
Gurdaspur 342 463 448 499 557 583 615 549 558
Hoshiarpur 254 389 339 380 388 382 375 396 409
Jalandhar 456 413 500 567 516 500 500 546 546
Kapurthala 292 285 581 514 622 618 593 516 554
Ludhiana 430 586 663 828 919 921 867 750 803
Mansa 305 279 397 362 343 373 396 422 414
Moga 235 402 454 399 407 440 531 543
Patiala 418 558 502 465 487 477 502 472 494
Rupnagar (Ropar) 245 292 410 454 342 314 318 424 426
Sangrur 339 399 446 564 538 533 538 593 585
SAS Nagar (Mohali) 751 791 796 721 628 648
SBS Nagar (Nawanshahr) 540 606 554 574 593 586 520 556
Muktsar 114 102 227 208 246 242 376 328
Tarn Taran 664 600 571 614 623 631
Source: estimated from Integrated Sample Survey reports (1993-94 to 2012-13), Animal Husbandry Department, Govt. of Punjab.
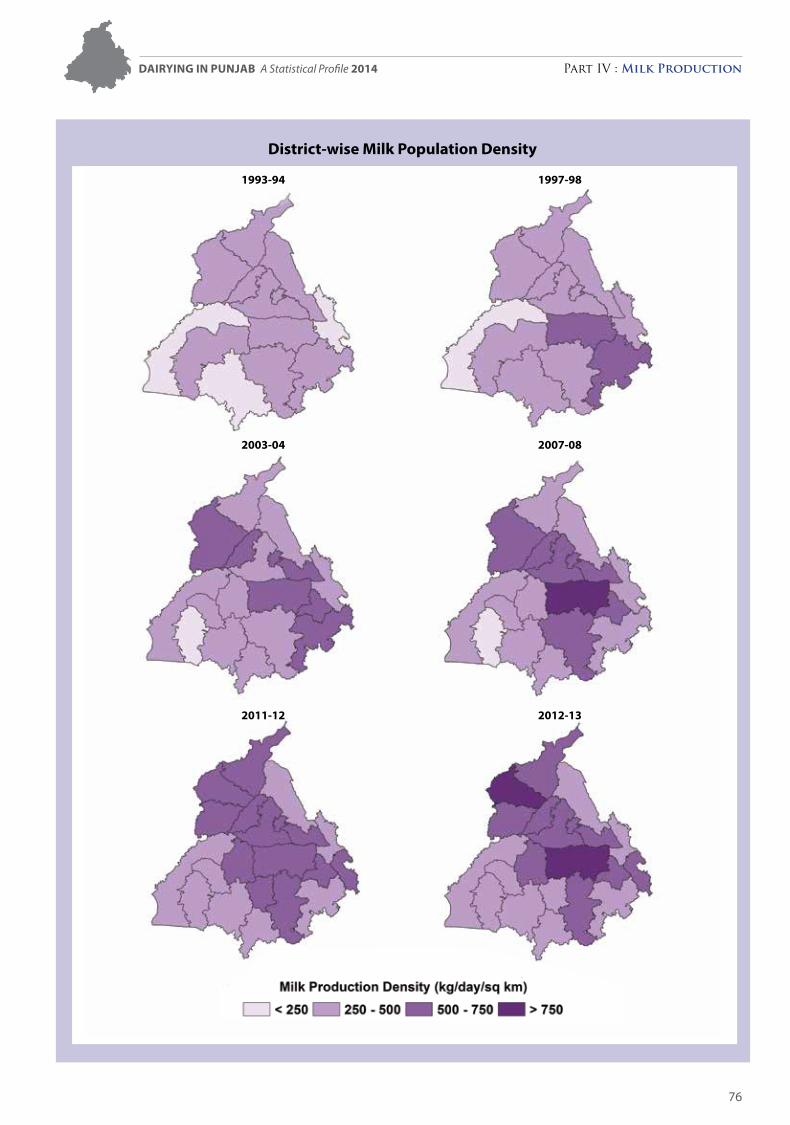
Dairying in Punjab A Statistical Profile 2014 Part IV : Milk Production
76
1993-94 1997-98
2003-04 2007-08
2011-12 2012-13
District-wise Milk Population Density
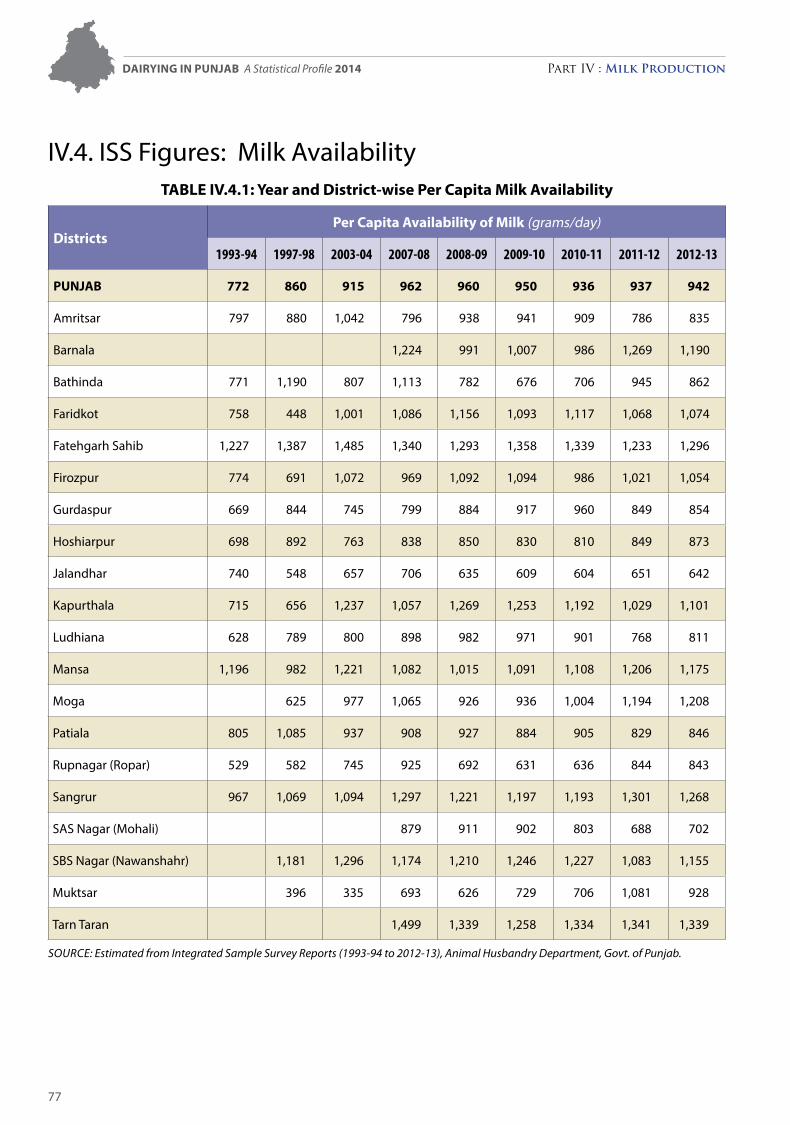
Dairying in Punjab A Statistical Profile 2014 Part IV : Milk Production
77
IV.4. ISS Figures: Milk AvailabilityTable IV.4.1: Year and District-wise Per Capita Milk availability
DistrictsPer Capita availability of Milk (grams/day)
1993-94 1997-98 2003-04 2007-08 2008-09 2009-10 2010-11 2011-12 2012-13
PUNJab 772 860 915 962 960 950 936 937 942
Amritsar 797 880 1,042 796 938 941 909 786 835
Barnala 1,224 991 1,007 986 1,269 1,190
Bathinda 771 1,190 807 1,113 782 676 706 945 862
Faridkot 758 448 1,001 1,086 1,156 1,093 1,117 1,068 1,074
Fatehgarh Sahib 1,227 1,387 1,485 1,340 1,293 1,358 1,339 1,233 1,296
Firozpur 774 691 1,072 969 1,092 1,094 986 1,021 1,054
Gurdaspur 669 844 745 799 884 917 960 849 854
Hoshiarpur 698 892 763 838 850 830 810 849 873
Jalandhar 740 548 657 706 635 609 604 651 642
Kapurthala 715 656 1,237 1,057 1,269 1,253 1,192 1,029 1,101
Ludhiana 628 789 800 898 982 971 901 768 811
Mansa 1,196 982 1,221 1,082 1,015 1,091 1,108 1,206 1,175
Moga 625 977 1,065 926 936 1,004 1,194 1,208
Patiala 805 1,085 937 908 927 884 905 829 846
Rupnagar (Ropar) 529 582 745 925 692 631 636 844 843
Sangrur 967 1,069 1,094 1,297 1,221 1,197 1,193 1,301 1,268
SAS Nagar (Mohali) 879 911 902 803 688 702
SBS Nagar (Nawanshahr) 1,181 1,296 1,174 1,210 1,246 1,227 1,083 1,155
Muktsar 396 335 693 626 729 706 1,081 928
Tarn Taran 1,499 1,339 1,258 1,334 1,341 1,339
Source: estimated from Integrated Sample Survey reports (1993-94 to 2012-13), Animal Husbandry Department, Govt. of Punjab.
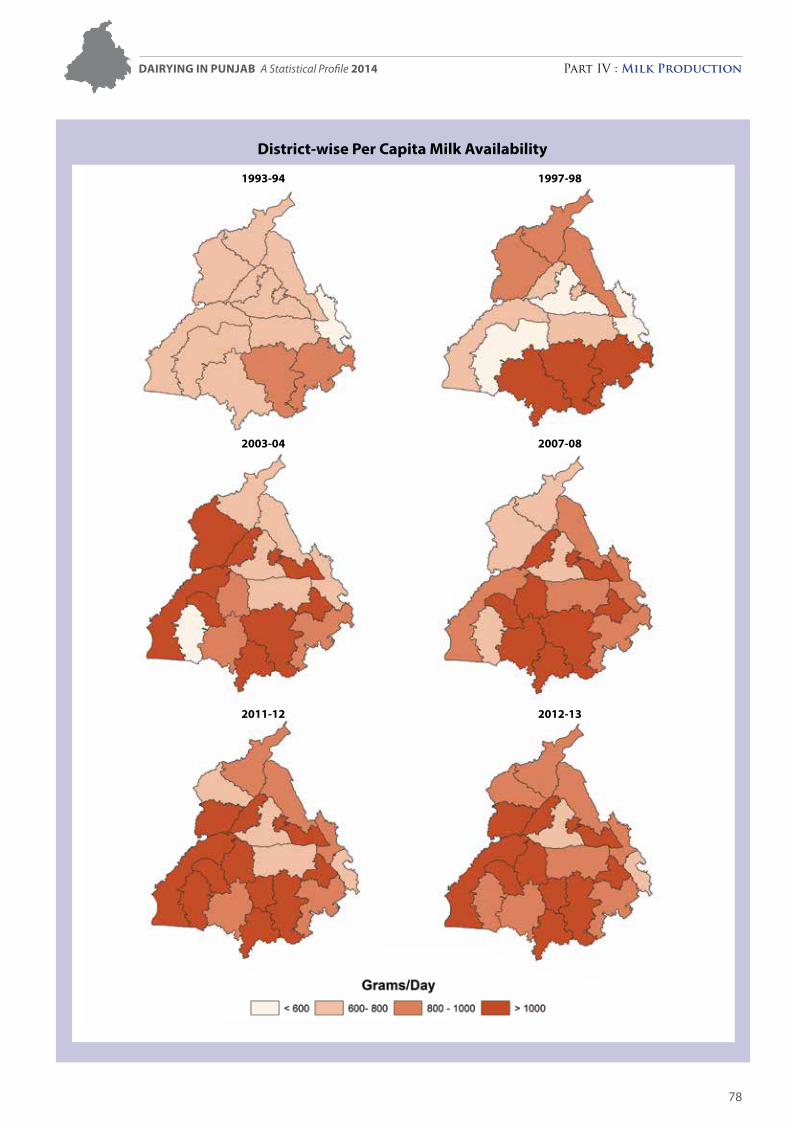
Dairying in Punjab A Statistical Profile 2014 Part IV : Milk Production
78
1993-94 1997-98
2003-04 2007-08
2011-12 2012-13
District-wise Per Capita Milk availability
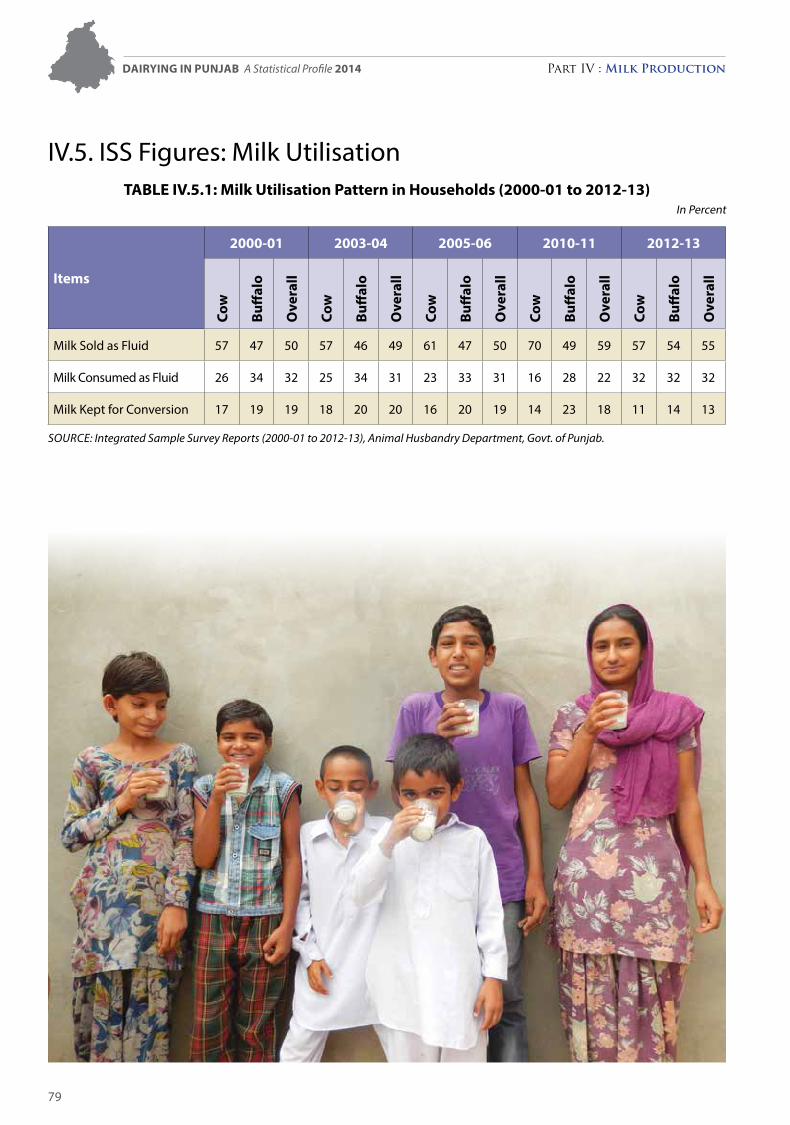
Dairying in Punjab A Statistical Profile 2014 Part IV : Milk Production
79
IV.5. ISS Figures: Milk UtilisationTable IV.5.1: Milk Utilisation Pattern in Households (2000-01 to 2012-13)
In Percent
Items
2000-01 2003-04 2005-06 2010-11 2012-13Co
w
buff
alo
Ove
rall
Cow
buff
alo
Ove
rall
Cow
buff
alo
Ove
rall
Cow
buff
alo
Ove
rall
Cow
buff
alo
Ove
rall
Milk Sold as Fluid 57 47 50 57 46 49 61 47 50 70 49 59 57 54 55
Milk Consumed as Fluid 26 34 32 25 34 31 23 33 31 16 28 22 32 32 32
Milk Kept for Conversion 17 19 19 18 20 20 16 20 19 14 23 18 11 14 13
Source: Integrated Sample Survey reports (2000-01 to 2012-13), Animal Husbandry Department, Govt. of Punjab.
Dairying in Punjab A Statistical Profile 2014 Part IV : Milk Production
80
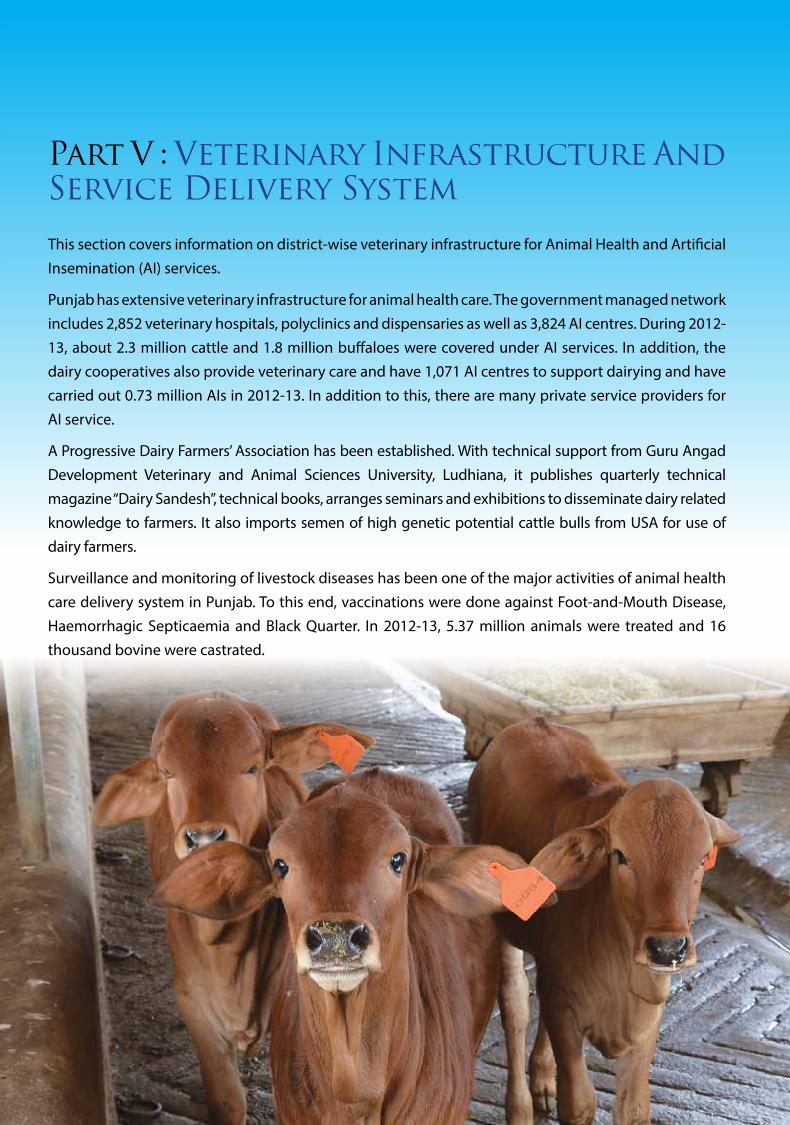
Part V : Veterinary Infrastructure And Service Delivery System
This section covers information on district-wise veterinary infrastructure for Animal Health and Artificial Insemination (AI) services.
Punjab has extensive veterinary infrastructure for animal health care. The government managed network includes 2,852 veterinary hospitals, polyclinics and dispensaries as well as 3,824 AI centres. During 2012-13, about 2.3 million cattle and 1.8 million buffaloes were covered under AI services. In addition, the dairy cooperatives also provide veterinary care and have 1,071 AI centres to support dairying and have carried out 0.73 million AIs in 2012-13. In addition to this, there are many private service providers for AI service.
A Progressive Dairy Farmers’ Association has been established. With technical support from Guru Angad Development Veterinary and Animal Sciences University, Ludhiana, it publishes quarterly technical magazine “Dairy Sandesh”, technical books, arranges seminars and exhibitions to disseminate dairy related knowledge to farmers. It also imports semen of high genetic potential cattle bulls from USA for use of dairy farmers.
Surveillance and monitoring of livestock diseases has been one of the major activities of animal health care delivery system in Punjab. To this end, vaccinations were done against Foot-and-Mouth Disease, Haemorrhagic Septicaemia and Black Quarter. In 2012-13, 5.37 million animals were treated and 16 thousand bovine were castrated.
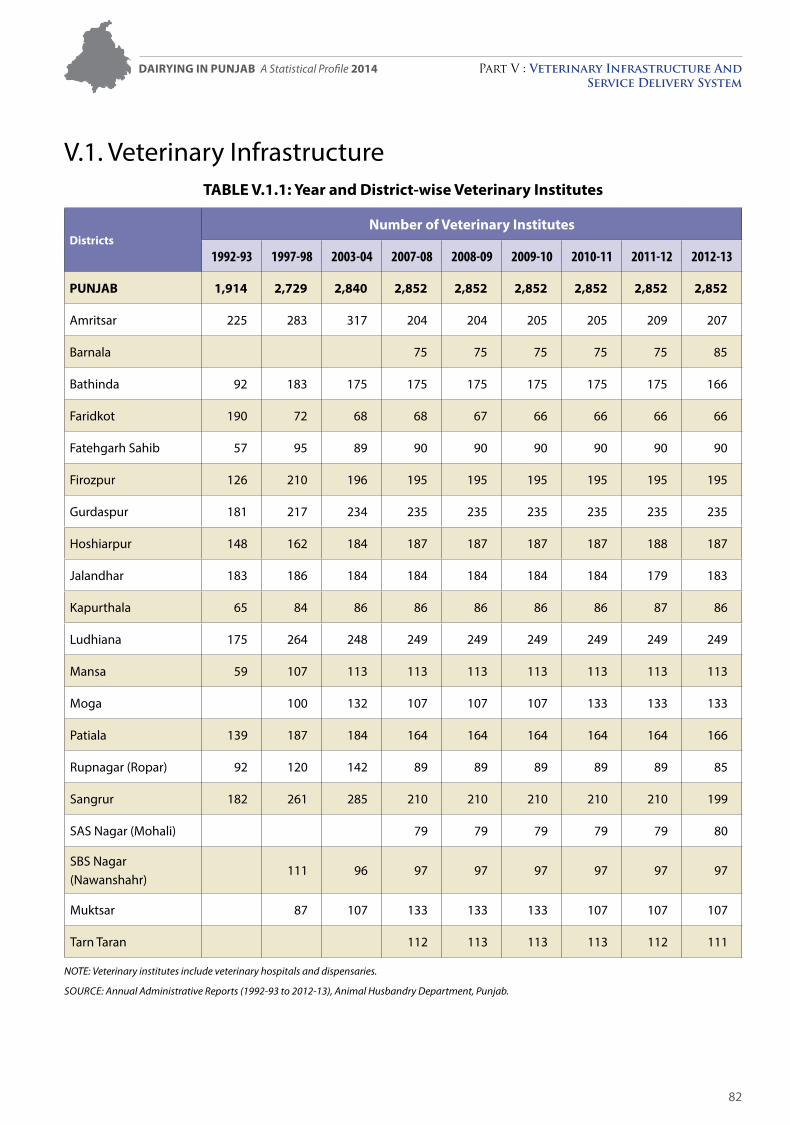
Dairying in Punjab A Statistical Profile 2014 Part V : Veterinary Infrastructure And Service Delivery System
82
V.1. Veterinary Infrastructure TABLE V.1.1: Year and District-wise Veterinary Institutes
DistrictsNumber of Veterinary Institutes
1992-93 1997-98 2003-04 2007-08 2008-09 2009-10 2010-11 2011-12 2012-13
PUNJAB 1,914 2,729 2,840 2,852 2,852 2,852 2,852 2,852 2,852
Amritsar 225 283 317 204 204 205 205 209 207
Barnala 75 75 75 75 75 85
Bathinda 92 183 175 175 175 175 175 175 166
Faridkot 190 72 68 68 67 66 66 66 66
Fatehgarh Sahib 57 95 89 90 90 90 90 90 90
Firozpur 126 210 196 195 195 195 195 195 195
Gurdaspur 181 217 234 235 235 235 235 235 235
Hoshiarpur 148 162 184 187 187 187 187 188 187
Jalandhar 183 186 184 184 184 184 184 179 183
Kapurthala 65 84 86 86 86 86 86 87 86
Ludhiana 175 264 248 249 249 249 249 249 249
Mansa 59 107 113 113 113 113 113 113 113
Moga 100 132 107 107 107 133 133 133
Patiala 139 187 184 164 164 164 164 164 166
Rupnagar (Ropar) 92 120 142 89 89 89 89 89 85
Sangrur 182 261 285 210 210 210 210 210 199
SAS Nagar (Mohali) 79 79 79 79 79 80
SBS Nagar (Nawanshahr)
111 96 97 97 97 97 97 97
Muktsar 87 107 133 133 133 107 107 107
Tarn Taran 112 113 113 113 112 111
NOTE: Veterinary institutes include veterinary hospitals and dispensaries.
SOurcE: Annual Administrative reports (1992-93 to 2012-13), Animal Husbandry Department, Punjab.
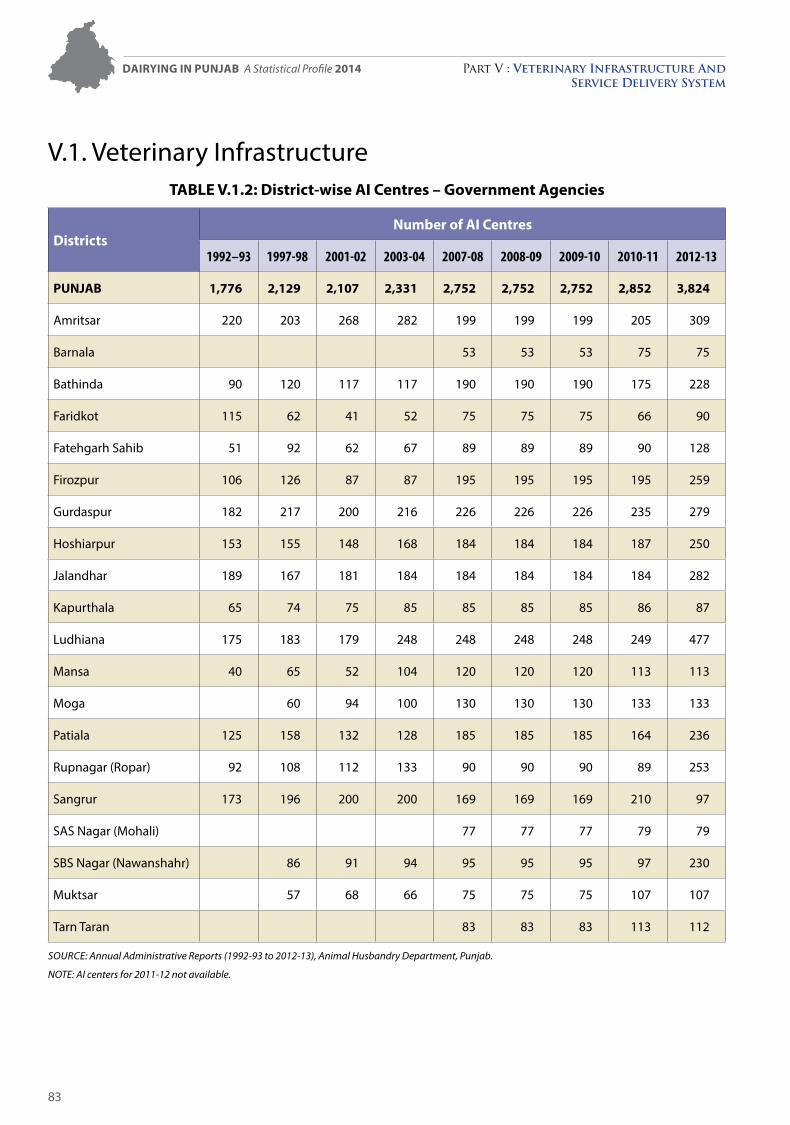
Dairying in Punjab A Statistical Profile 2014 Part V : Veterinary Infrastructure And Service Delivery System
83
V.1. Veterinary Infrastructure TABLE V.1.2: District-wise AI Centres – Government Agencies
DistrictsNumber of AI Centres
1992–93 1997-98 2001-02 2003-04 2007-08 2008-09 2009-10 2010-11 2012-13
PUNJAB 1,776 2,129 2,107 2,331 2,752 2,752 2,752 2,852 3,824
Amritsar 220 203 268 282 199 199 199 205 309
Barnala 53 53 53 75 75
Bathinda 90 120 117 117 190 190 190 175 228
Faridkot 115 62 41 52 75 75 75 66 90
Fatehgarh Sahib 51 92 62 67 89 89 89 90 128
Firozpur 106 126 87 87 195 195 195 195 259
Gurdaspur 182 217 200 216 226 226 226 235 279
Hoshiarpur 153 155 148 168 184 184 184 187 250
Jalandhar 189 167 181 184 184 184 184 184 282
Kapurthala 65 74 75 85 85 85 85 86 87
Ludhiana 175 183 179 248 248 248 248 249 477
Mansa 40 65 52 104 120 120 120 113 113
Moga 60 94 100 130 130 130 133 133
Patiala 125 158 132 128 185 185 185 164 236
Rupnagar (Ropar) 92 108 112 133 90 90 90 89 253
Sangrur 173 196 200 200 169 169 169 210 97
SAS Nagar (Mohali) 77 77 77 79 79
SBS Nagar (Nawanshahr) 86 91 94 95 95 95 97 230
Muktsar 57 68 66 75 75 75 107 107
Tarn Taran 83 83 83 113 112
SOurcE: Annual Administrative reports (1992-93 to 2012-13), Animal Husbandry Department, Punjab.
NOTE: AI centers for 2011-12 not available.
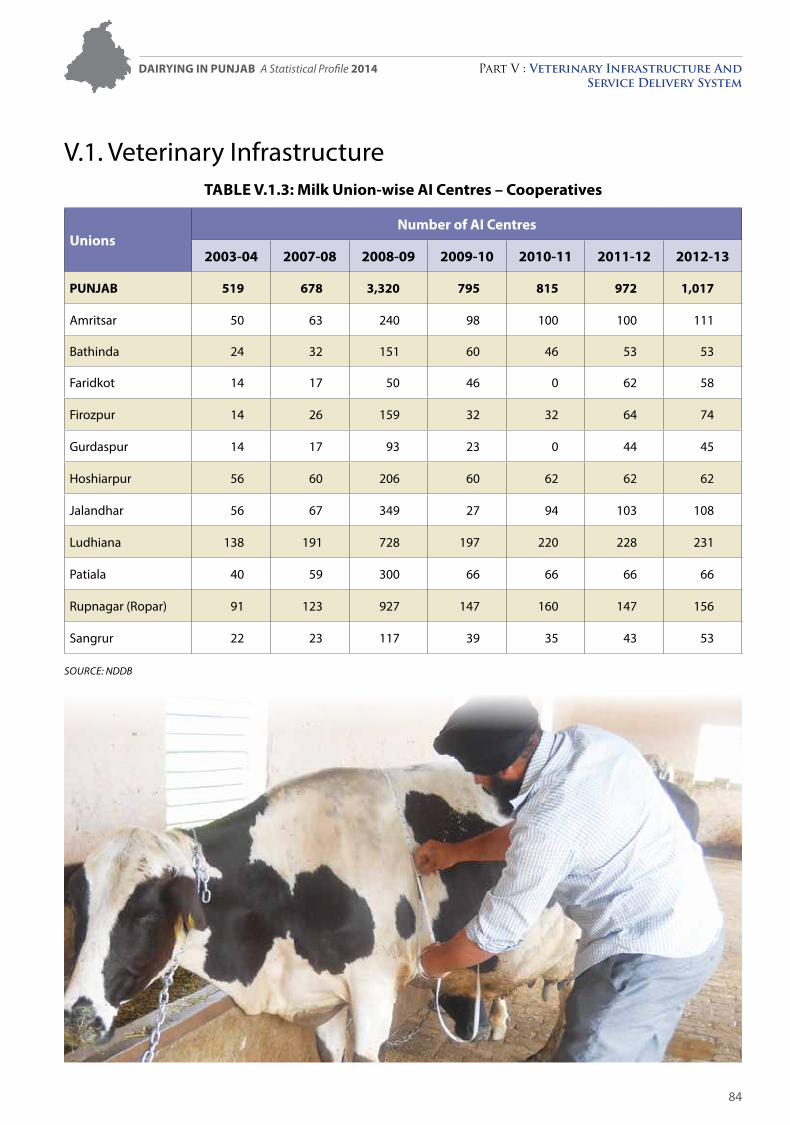
Dairying in Punjab A Statistical Profile 2014 Part V : Veterinary Infrastructure And Service Delivery System
84
V.1. Veterinary Infrastructure TABLE V.1.3: Milk Union-wise AI Centres – Cooperatives
UnionsNumber of AI Centres
2003-04 2007-08 2008-09 2009-10 2010-11 2011-12 2012-13
PUNJAB 519 678 3,320 795 815 972 1,017
Amritsar 50 63 240 98 100 100 111
Bathinda 24 32 151 60 46 53 53
Faridkot 14 17 50 46 0 62 58
Firozpur 14 26 159 32 32 64 74
Gurdaspur 14 17 93 23 0 44 45
Hoshiarpur 56 60 206 60 62 62 62
Jalandhar 56 67 349 27 94 103 108
Ludhiana 138 191 728 197 220 228 231
Patiala 40 59 300 66 66 66 66
Rupnagar (Ropar) 91 123 927 147 160 147 156
Sangrur 22 23 117 39 35 43 53
SOurcE: NDDB
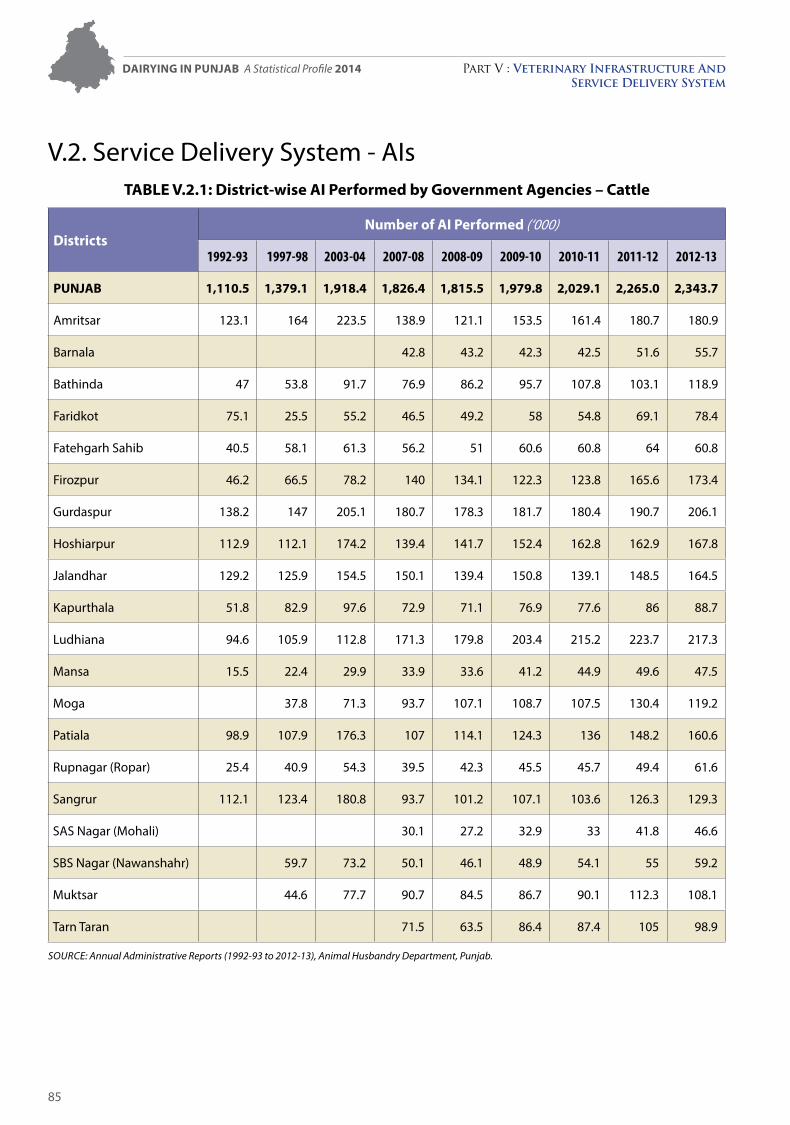
Dairying in Punjab A Statistical Profile 2014 Part V : Veterinary Infrastructure And Service Delivery System
85
V.2. Service Delivery System - AIsTABLE V.2.1: District-wise AI Performed by Government Agencies – Cattle
DistrictsNumber of AI Performed (‘000)
1992-93 1997-98 2003-04 2007-08 2008-09 2009-10 2010-11 2011-12 2012-13
PUNJAB 1,110.5 1,379.1 1,918.4 1,826.4 1,815.5 1,979.8 2,029.1 2,265.0 2,343.7
Amritsar 123.1 164 223.5 138.9 121.1 153.5 161.4 180.7 180.9
Barnala 42.8 43.2 42.3 42.5 51.6 55.7
Bathinda 47 53.8 91.7 76.9 86.2 95.7 107.8 103.1 118.9
Faridkot 75.1 25.5 55.2 46.5 49.2 58 54.8 69.1 78.4
Fatehgarh Sahib 40.5 58.1 61.3 56.2 51 60.6 60.8 64 60.8
Firozpur 46.2 66.5 78.2 140 134.1 122.3 123.8 165.6 173.4
Gurdaspur 138.2 147 205.1 180.7 178.3 181.7 180.4 190.7 206.1
Hoshiarpur 112.9 112.1 174.2 139.4 141.7 152.4 162.8 162.9 167.8
Jalandhar 129.2 125.9 154.5 150.1 139.4 150.8 139.1 148.5 164.5
Kapurthala 51.8 82.9 97.6 72.9 71.1 76.9 77.6 86 88.7
Ludhiana 94.6 105.9 112.8 171.3 179.8 203.4 215.2 223.7 217.3
Mansa 15.5 22.4 29.9 33.9 33.6 41.2 44.9 49.6 47.5
Moga 37.8 71.3 93.7 107.1 108.7 107.5 130.4 119.2
Patiala 98.9 107.9 176.3 107 114.1 124.3 136 148.2 160.6
Rupnagar (Ropar) 25.4 40.9 54.3 39.5 42.3 45.5 45.7 49.4 61.6
Sangrur 112.1 123.4 180.8 93.7 101.2 107.1 103.6 126.3 129.3
SAS Nagar (Mohali) 30.1 27.2 32.9 33 41.8 46.6
SBS Nagar (Nawanshahr) 59.7 73.2 50.1 46.1 48.9 54.1 55 59.2
Muktsar 44.6 77.7 90.7 84.5 86.7 90.1 112.3 108.1
Tarn Taran 71.5 63.5 86.4 87.4 105 98.9
SOurcE: Annual Administrative reports (1992-93 to 2012-13), Animal Husbandry Department, Punjab.
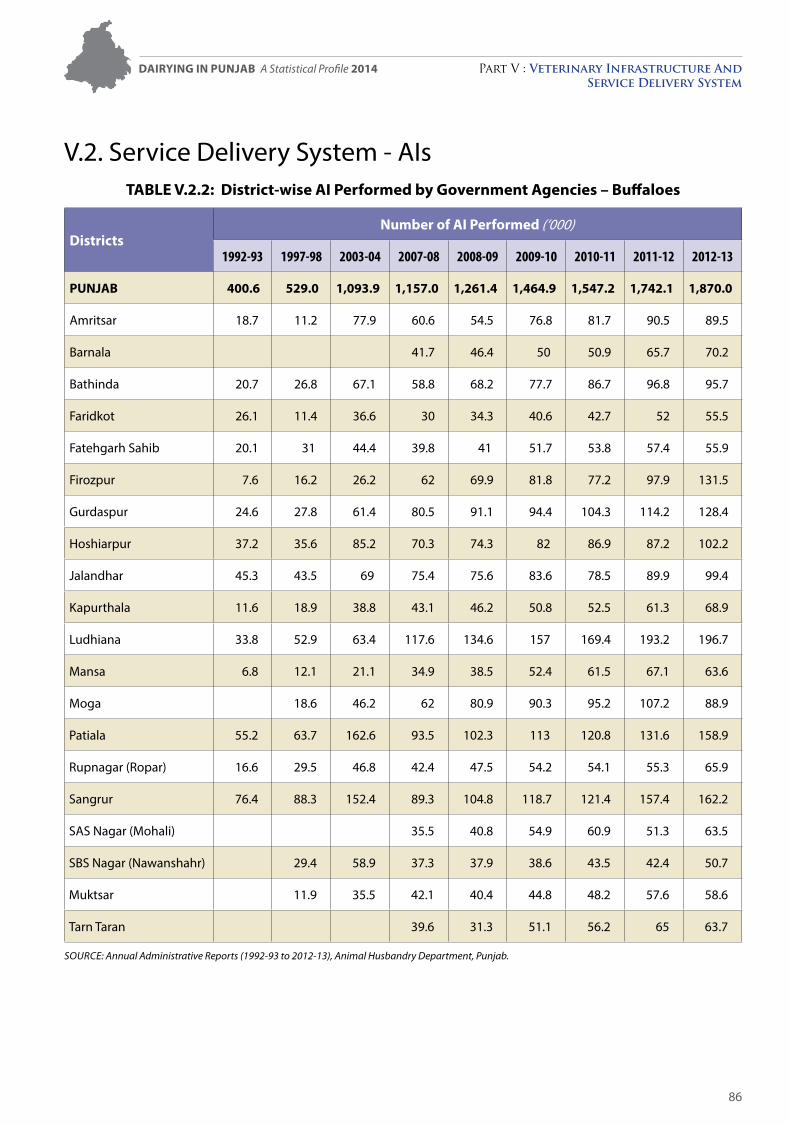
Dairying in Punjab A Statistical Profile 2014 Part V : Veterinary Infrastructure And Service Delivery System
86
V.2. Service Delivery System - AIsTABLE V.2.2: District-wise AI Performed by Government Agencies – Buffaloes
DistrictsNumber of AI Performed (‘000)
1992-93 1997-98 2003-04 2007-08 2008-09 2009-10 2010-11 2011-12 2012-13
PUNJAB 400.6 529.0 1,093.9 1,157.0 1,261.4 1,464.9 1,547.2 1,742.1 1,870.0
Amritsar 18.7 11.2 77.9 60.6 54.5 76.8 81.7 90.5 89.5
Barnala 41.7 46.4 50 50.9 65.7 70.2
Bathinda 20.7 26.8 67.1 58.8 68.2 77.7 86.7 96.8 95.7
Faridkot 26.1 11.4 36.6 30 34.3 40.6 42.7 52 55.5
Fatehgarh Sahib 20.1 31 44.4 39.8 41 51.7 53.8 57.4 55.9
Firozpur 7.6 16.2 26.2 62 69.9 81.8 77.2 97.9 131.5
Gurdaspur 24.6 27.8 61.4 80.5 91.1 94.4 104.3 114.2 128.4
Hoshiarpur 37.2 35.6 85.2 70.3 74.3 82 86.9 87.2 102.2
Jalandhar 45.3 43.5 69 75.4 75.6 83.6 78.5 89.9 99.4
Kapurthala 11.6 18.9 38.8 43.1 46.2 50.8 52.5 61.3 68.9
Ludhiana 33.8 52.9 63.4 117.6 134.6 157 169.4 193.2 196.7
Mansa 6.8 12.1 21.1 34.9 38.5 52.4 61.5 67.1 63.6
Moga 18.6 46.2 62 80.9 90.3 95.2 107.2 88.9
Patiala 55.2 63.7 162.6 93.5 102.3 113 120.8 131.6 158.9
Rupnagar (Ropar) 16.6 29.5 46.8 42.4 47.5 54.2 54.1 55.3 65.9
Sangrur 76.4 88.3 152.4 89.3 104.8 118.7 121.4 157.4 162.2
SAS Nagar (Mohali) 35.5 40.8 54.9 60.9 51.3 63.5
SBS Nagar (Nawanshahr) 29.4 58.9 37.3 37.9 38.6 43.5 42.4 50.7
Muktsar 11.9 35.5 42.1 40.4 44.8 48.2 57.6 58.6
Tarn Taran 39.6 31.3 51.1 56.2 65 63.7
SOurcE: Annual Administrative reports (1992-93 to 2012-13), Animal Husbandry Department, Punjab.
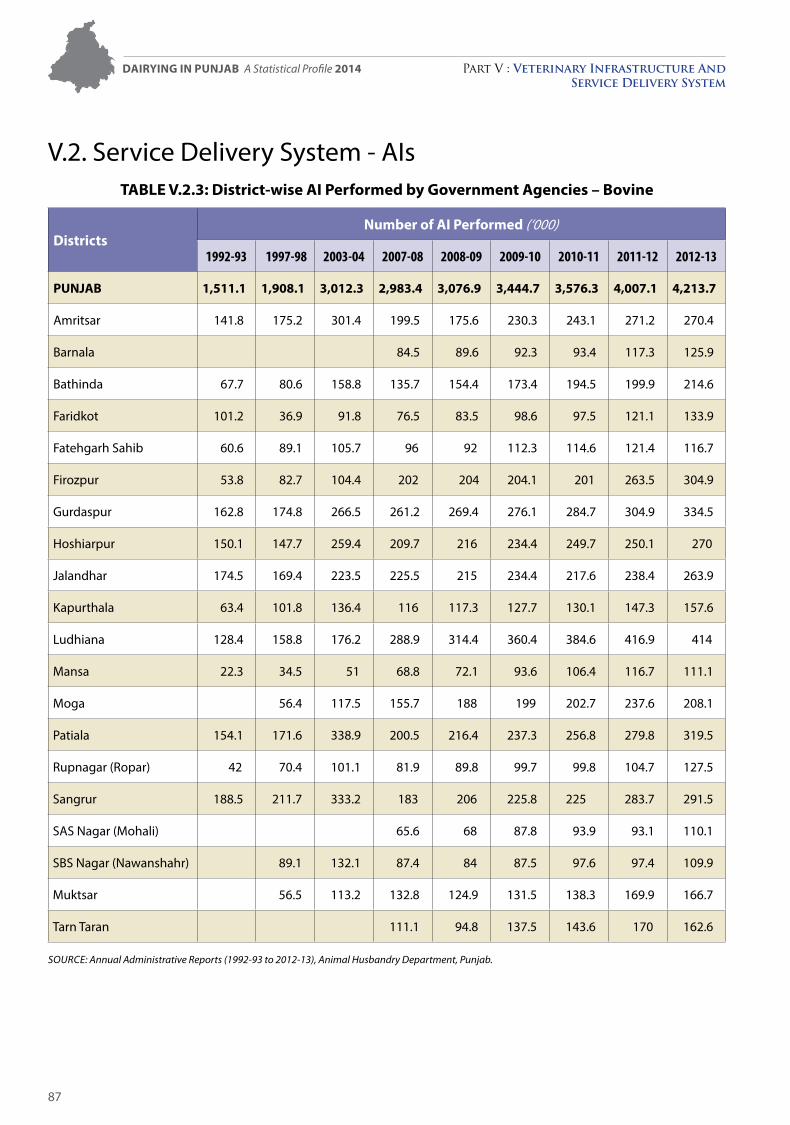
Dairying in Punjab A Statistical Profile 2014 Part V : Veterinary Infrastructure And Service Delivery System
87
V.2. Service Delivery System - AIsTABLE V.2.3: District-wise AI Performed by Government Agencies – Bovine
DistrictsNumber of AI Performed (‘000)
1992-93 1997-98 2003-04 2007-08 2008-09 2009-10 2010-11 2011-12 2012-13
PUNJAB 1,511.1 1,908.1 3,012.3 2,983.4 3,076.9 3,444.7 3,576.3 4,007.1 4,213.7
Amritsar 141.8 175.2 301.4 199.5 175.6 230.3 243.1 271.2 270.4
Barnala 84.5 89.6 92.3 93.4 117.3 125.9
Bathinda 67.7 80.6 158.8 135.7 154.4 173.4 194.5 199.9 214.6
Faridkot 101.2 36.9 91.8 76.5 83.5 98.6 97.5 121.1 133.9
Fatehgarh Sahib 60.6 89.1 105.7 96 92 112.3 114.6 121.4 116.7
Firozpur 53.8 82.7 104.4 202 204 204.1 201 263.5 304.9
Gurdaspur 162.8 174.8 266.5 261.2 269.4 276.1 284.7 304.9 334.5
Hoshiarpur 150.1 147.7 259.4 209.7 216 234.4 249.7 250.1 270
Jalandhar 174.5 169.4 223.5 225.5 215 234.4 217.6 238.4 263.9
Kapurthala 63.4 101.8 136.4 116 117.3 127.7 130.1 147.3 157.6
Ludhiana 128.4 158.8 176.2 288.9 314.4 360.4 384.6 416.9 414
Mansa 22.3 34.5 51 68.8 72.1 93.6 106.4 116.7 111.1
Moga 56.4 117.5 155.7 188 199 202.7 237.6 208.1
Patiala 154.1 171.6 338.9 200.5 216.4 237.3 256.8 279.8 319.5
Rupnagar (Ropar) 42 70.4 101.1 81.9 89.8 99.7 99.8 104.7 127.5
Sangrur 188.5 211.7 333.2 183 206 225.8 225 283.7 291.5
SAS Nagar (Mohali) 65.6 68 87.8 93.9 93.1 110.1
SBS Nagar (Nawanshahr) 89.1 132.1 87.4 84 87.5 97.6 97.4 109.9
Muktsar 56.5 113.2 132.8 124.9 131.5 138.3 169.9 166.7
Tarn Taran 111.1 94.8 137.5 143.6 170 162.6
SOurcE: Annual Administrative reports (1992-93 to 2012-13), Animal Husbandry Department, Punjab.
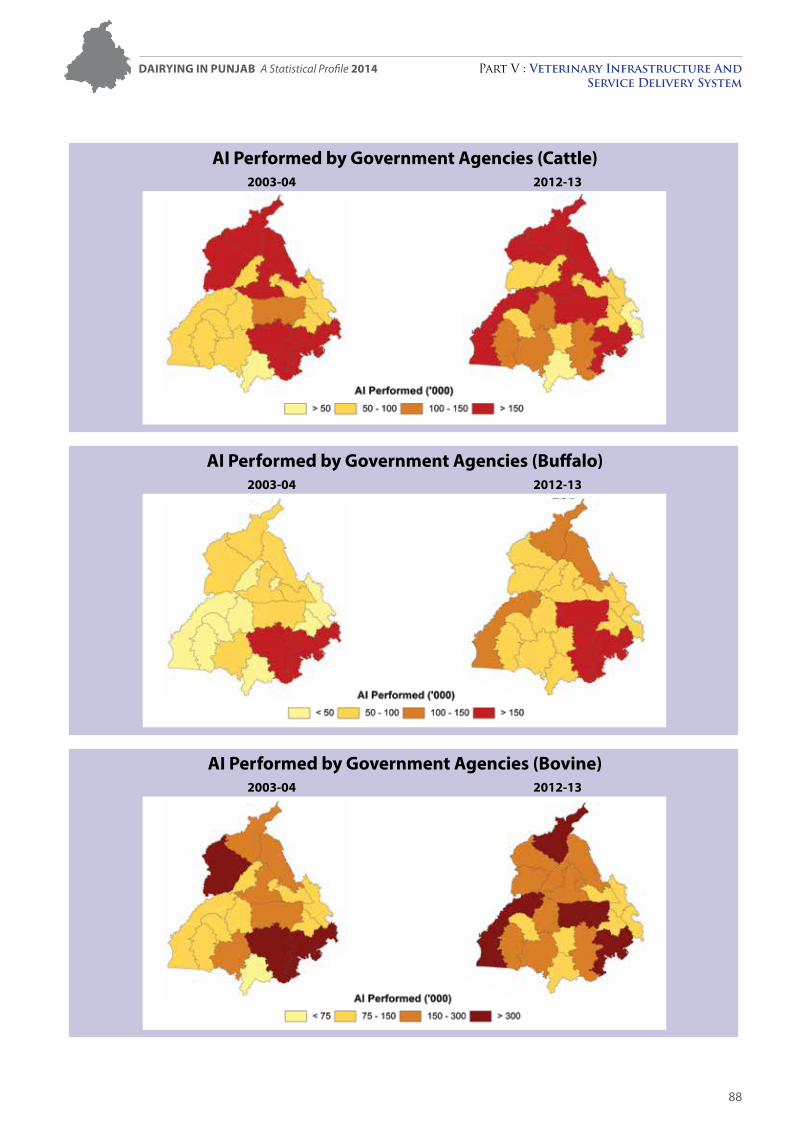
Dairying in Punjab A Statistical Profile 2014 Part V : Veterinary Infrastructure And Service Delivery System
88
AI Performed by Government Agencies (Cattle) 2003-04 2012-13
AI Performed by Government Agencies (Buffalo) 2003-04 2012-13
AI Performed by Government Agencies (Bovine) 2003-04 2012-13
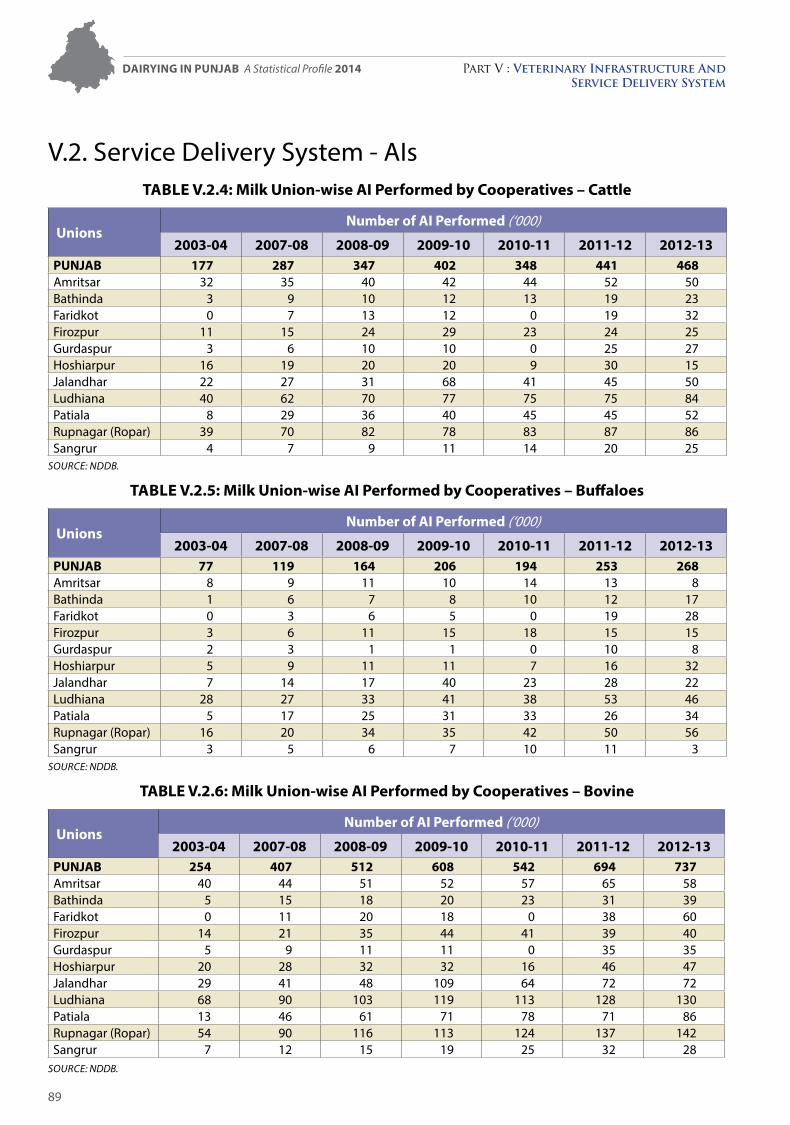
Dairying in Punjab A Statistical Profile 2014 Part V : Veterinary Infrastructure And Service Delivery System
89
V.2. Service Delivery System - AIsTABLE V.2.4: Milk Union-wise AI Performed by Cooperatives – Cattle
UnionsNumber of AI Performed (‘000)
2003-04 2007-08 2008-09 2009-10 2010-11 2011-12 2012-13PUNJAB 177 287 347 402 348 441 468Amritsar 32 35 40 42 44 52 50Bathinda 3 9 10 12 13 19 23Faridkot 0 7 13 12 0 19 32Firozpur 11 15 24 29 23 24 25Gurdaspur 3 6 10 10 0 25 27Hoshiarpur 16 19 20 20 9 30 15Jalandhar 22 27 31 68 41 45 50Ludhiana 40 62 70 77 75 75 84Patiala 8 29 36 40 45 45 52Rupnagar (Ropar) 39 70 82 78 83 87 86Sangrur 4 7 9 11 14 20 25
SOurcE: NDDB.
TABLE V.2.5: Milk Union-wise AI Performed by Cooperatives – Buffaloes
UnionsNumber of AI Performed (‘000)
2003-04 2007-08 2008-09 2009-10 2010-11 2011-12 2012-13PUNJAB 77 119 164 206 194 253 268Amritsar 8 9 11 10 14 13 8Bathinda 1 6 7 8 10 12 17Faridkot 0 3 6 5 0 19 28Firozpur 3 6 11 15 18 15 15Gurdaspur 2 3 1 1 0 10 8Hoshiarpur 5 9 11 11 7 16 32Jalandhar 7 14 17 40 23 28 22Ludhiana 28 27 33 41 38 53 46Patiala 5 17 25 31 33 26 34Rupnagar (Ropar) 16 20 34 35 42 50 56Sangrur 3 5 6 7 10 11 3
SOurcE: NDDB.
TABLE V.2.6: Milk Union-wise AI Performed by Cooperatives – Bovine
UnionsNumber of AI Performed (‘000)
2003-04 2007-08 2008-09 2009-10 2010-11 2011-12 2012-13PUNJAB 254 407 512 608 542 694 737Amritsar 40 44 51 52 57 65 58Bathinda 5 15 18 20 23 31 39Faridkot 0 11 20 18 0 38 60Firozpur 14 21 35 44 41 39 40Gurdaspur 5 9 11 11 0 35 35Hoshiarpur 20 28 32 32 16 46 47Jalandhar 29 41 48 109 64 72 72Ludhiana 68 90 103 119 113 128 130Patiala 13 46 61 71 78 71 86Rupnagar (Ropar) 54 90 116 113 124 137 142Sangrur 7 12 15 19 25 32 28
SOurcE: NDDB.

Dairying in Punjab A Statistical Profile 2014 Part V : Veterinary Infrastructure And Service Delivery System
90
V.3. Service Delivery System - Animal HealthTABLE V.3.1: District-wise Vaccination Performed for Foot-and-Mouth Disease
Districts Foot-and-Mouth Disease Vaccination (‘000)
1992-93 1997-98 2003-04 2007-08 2008-09 2009-10 2010-11 2011-12 2012-13
PUNJAB 1,816 3,065 4,049 8,171 7,674 7,463 12,574 6,986 13,446
Amritsar 257 313 230 766 391 409 790 387 882
Barnala 237 227 241 437 226 450
Bathinda 149 153 391 523 415 415 824 378 760
Faridkot 142 85 139 145 202 147 311 167 325
Fatehgarh Sahib 56 127 97 200 200 310 385 210 405
Firozpur 97 210 486 1,778 629 627 1,291 682 1,254
Gurdaspur 197 296 158 732 472 368 897 400 857
Hoshiarpur 123 178 259 140 650 490 685 345 720
Jalandhar 149 155 301 185 343 626 519 501 681
Kapurthala 51 101 149 126 285 54 315 375 340
Ludhiana 107 324 279 289 631 436 853 679 1,260
Mansa 85 108 48 310 300 313 568 250 496
Moga 119 166 152 354 170 665 342 632
Patiala 176 212 205 600 440 440 933 385 937
Rupnagar (Ropar) 89 237 149 111 300 273 353 199 400
Sangrur 139 242 717 918 666 595 1,178 550 1,106
SAS Nagar (Mohali) 61 182 159 237 195 390
SBS Nagar (Nawanshahr) 97 165 100 300 292 326 172 344
Muktsar 106 110 120 342 725 390 211 470
Tarn Taran 678 346 374 619 330 736
SOurcE: Annual Administrative reports (1992-93 to 2012-13), Animal Husbandry Department, Punjab.
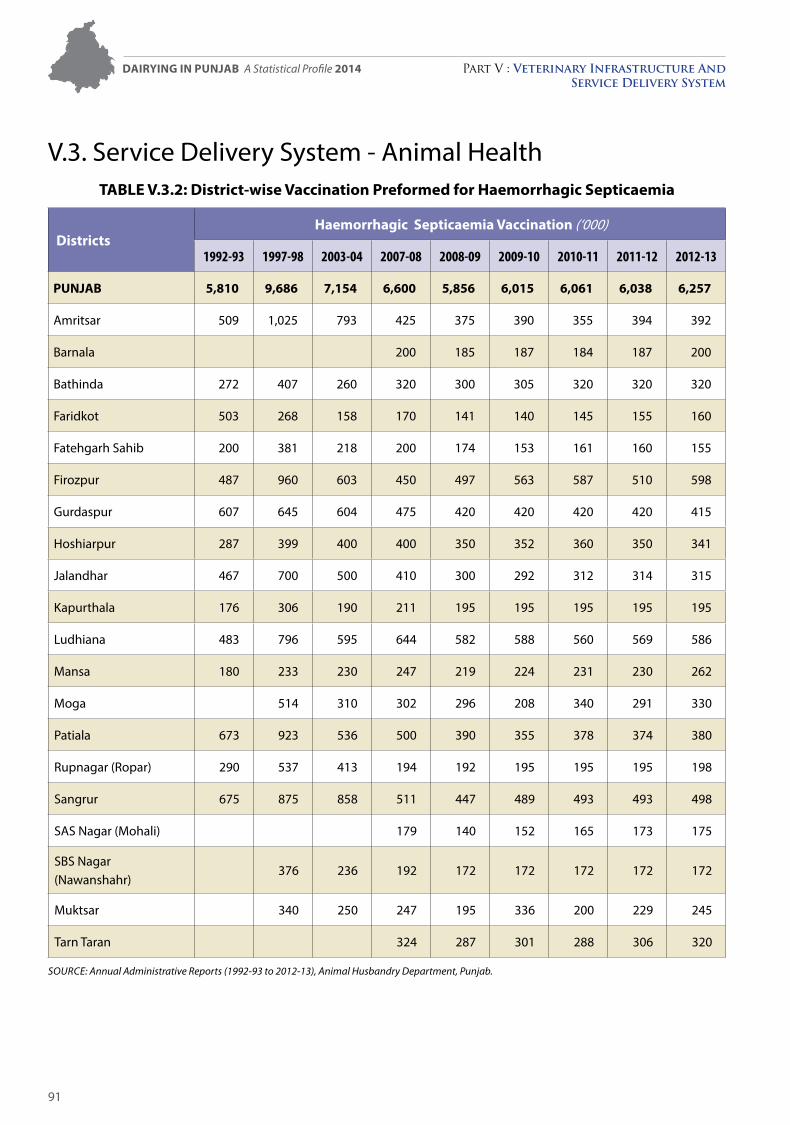
Dairying in Punjab A Statistical Profile 2014 Part V : Veterinary Infrastructure And Service Delivery System
91
V.3. Service Delivery System - Animal HealthTABLE V.3.2: District-wise Vaccination Preformed for Haemorrhagic Septicaemia
Districts Haemorrhagic Septicaemia Vaccination (‘000)
1992-93 1997-98 2003-04 2007-08 2008-09 2009-10 2010-11 2011-12 2012-13
PUNJAB 5,810 9,686 7,154 6,600 5,856 6,015 6,061 6,038 6,257
Amritsar 509 1,025 793 425 375 390 355 394 392
Barnala 200 185 187 184 187 200
Bathinda 272 407 260 320 300 305 320 320 320
Faridkot 503 268 158 170 141 140 145 155 160
Fatehgarh Sahib 200 381 218 200 174 153 161 160 155
Firozpur 487 960 603 450 497 563 587 510 598
Gurdaspur 607 645 604 475 420 420 420 420 415
Hoshiarpur 287 399 400 400 350 352 360 350 341
Jalandhar 467 700 500 410 300 292 312 314 315
Kapurthala 176 306 190 211 195 195 195 195 195
Ludhiana 483 796 595 644 582 588 560 569 586
Mansa 180 233 230 247 219 224 231 230 262
Moga 514 310 302 296 208 340 291 330
Patiala 673 923 536 500 390 355 378 374 380
Rupnagar (Ropar) 290 537 413 194 192 195 195 195 198
Sangrur 675 875 858 511 447 489 493 493 498
SAS Nagar (Mohali) 179 140 152 165 173 175
SBS Nagar (Nawanshahr)
376 236 192 172 172 172 172 172
Muktsar 340 250 247 195 336 200 229 245
Tarn Taran 324 287 301 288 306 320
SOurcE: Annual Administrative reports (1992-93 to 2012-13), Animal Husbandry Department, Punjab.
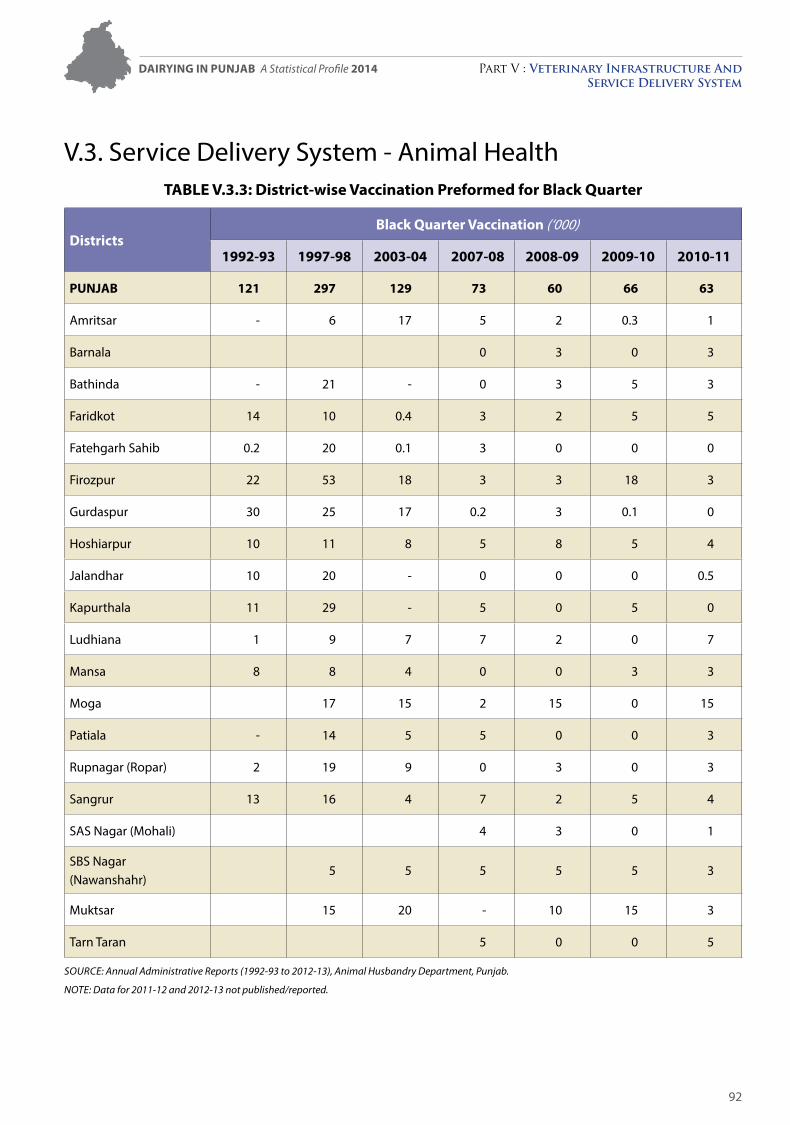
Dairying in Punjab A Statistical Profile 2014 Part V : Veterinary Infrastructure And Service Delivery System
92
V.3. Service Delivery System - Animal HealthTABLE V.3.3: District-wise Vaccination Preformed for Black Quarter
Districts Black Quarter Vaccination (‘000)
1992-93 1997-98 2003-04 2007-08 2008-09 2009-10 2010-11
PUNJAB 121 297 129 73 60 66 63
Amritsar - 6 17 5 2 0.3 1
Barnala 0 3 0 3
Bathinda - 21 - 0 3 5 3
Faridkot 14 10 0.4 3 2 5 5
Fatehgarh Sahib 0.2 20 0.1 3 0 0 0
Firozpur 22 53 18 3 3 18 3
Gurdaspur 30 25 17 0.2 3 0.1 0
Hoshiarpur 10 11 8 5 8 5 4
Jalandhar 10 20 - 0 0 0 0.5
Kapurthala 11 29 - 5 0 5 0
Ludhiana 1 9 7 7 2 0 7
Mansa 8 8 4 0 0 3 3
Moga 17 15 2 15 0 15
Patiala - 14 5 5 0 0 3
Rupnagar (Ropar) 2 19 9 0 3 0 3
Sangrur 13 16 4 7 2 5 4
SAS Nagar (Mohali) 4 3 0 1
SBS Nagar (Nawanshahr)
5 5 5 5 5 3
Muktsar 15 20 - 10 15 3
Tarn Taran 5 0 0 5
SOurcE: Annual Administrative reports (1992-93 to 2012-13), Animal Husbandry Department, Punjab.
NOTE: Data for 2011-12 and 2012-13 not published/reported.
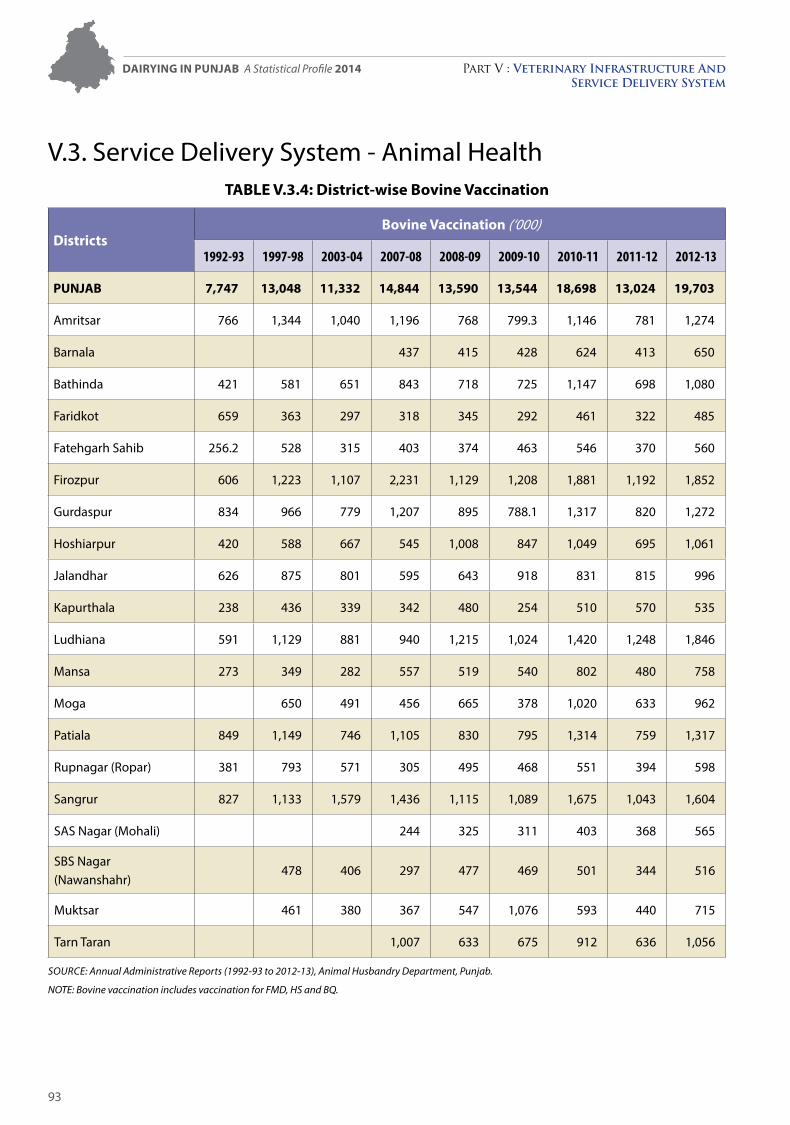
Dairying in Punjab A Statistical Profile 2014 Part V : Veterinary Infrastructure And Service Delivery System
93
V.3. Service Delivery System - Animal HealthTABLE V.3.4: District-wise Bovine Vaccination
Districts Bovine Vaccination (‘000)
1992-93 1997-98 2003-04 2007-08 2008-09 2009-10 2010-11 2011-12 2012-13
PUNJAB 7,747 13,048 11,332 14,844 13,590 13,544 18,698 13,024 19,703
Amritsar 766 1,344 1,040 1,196 768 799.3 1,146 781 1,274
Barnala 437 415 428 624 413 650
Bathinda 421 581 651 843 718 725 1,147 698 1,080
Faridkot 659 363 297 318 345 292 461 322 485
Fatehgarh Sahib 256.2 528 315 403 374 463 546 370 560
Firozpur 606 1,223 1,107 2,231 1,129 1,208 1,881 1,192 1,852
Gurdaspur 834 966 779 1,207 895 788.1 1,317 820 1,272
Hoshiarpur 420 588 667 545 1,008 847 1,049 695 1,061
Jalandhar 626 875 801 595 643 918 831 815 996
Kapurthala 238 436 339 342 480 254 510 570 535
Ludhiana 591 1,129 881 940 1,215 1,024 1,420 1,248 1,846
Mansa 273 349 282 557 519 540 802 480 758
Moga 650 491 456 665 378 1,020 633 962
Patiala 849 1,149 746 1,105 830 795 1,314 759 1,317
Rupnagar (Ropar) 381 793 571 305 495 468 551 394 598
Sangrur 827 1,133 1,579 1,436 1,115 1,089 1,675 1,043 1,604
SAS Nagar (Mohali) 244 325 311 403 368 565
SBS Nagar (Nawanshahr)
478 406 297 477 469 501 344 516
Muktsar 461 380 367 547 1,076 593 440 715
Tarn Taran 1,007 633 675 912 636 1,056
SOurcE: Annual Administrative reports (1992-93 to 2012-13), Animal Husbandry Department, Punjab.
NOTE: Bovine vaccination includes vaccination for FMD, HS and BQ.
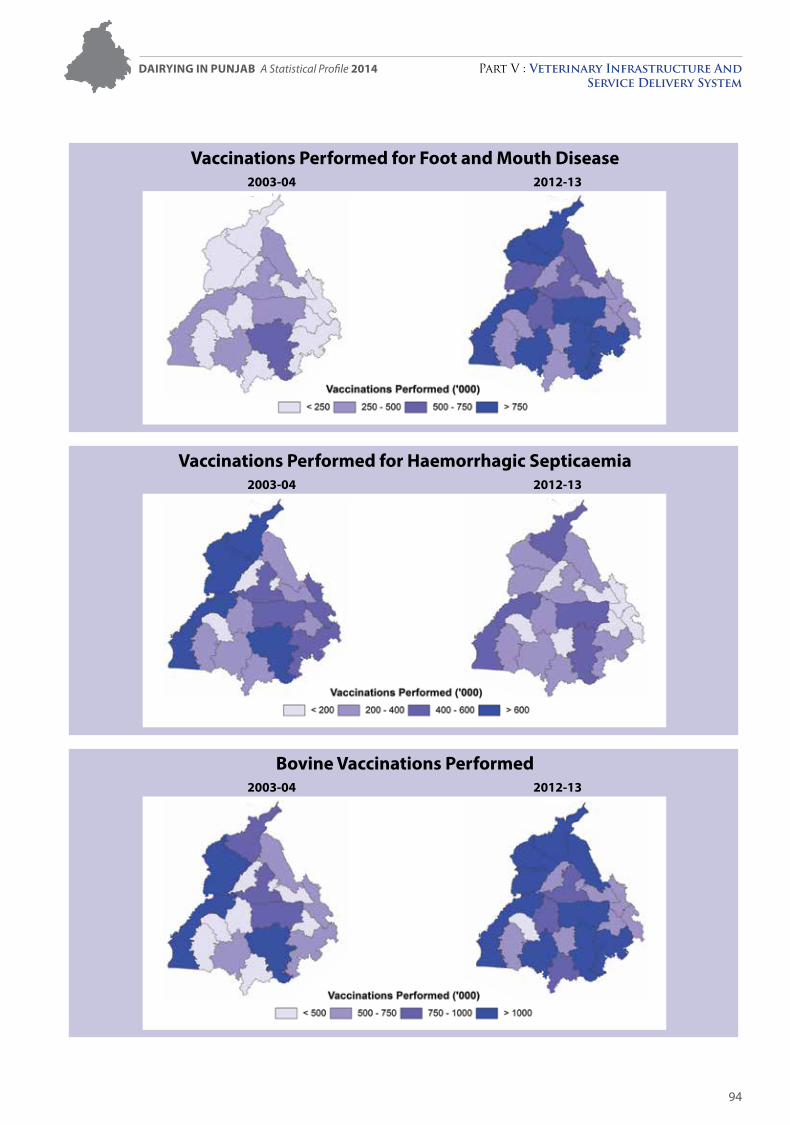
Dairying in Punjab A Statistical Profile 2014 Part V : Veterinary Infrastructure And Service Delivery System
94
Vaccinations Performed for Foot and Mouth Disease 2003-04 2012-13
Vaccinations Performed for Haemorrhagic Septicaemia 2003-04 2012-13
Bovine Vaccinations Performed 2003-04 2012-13
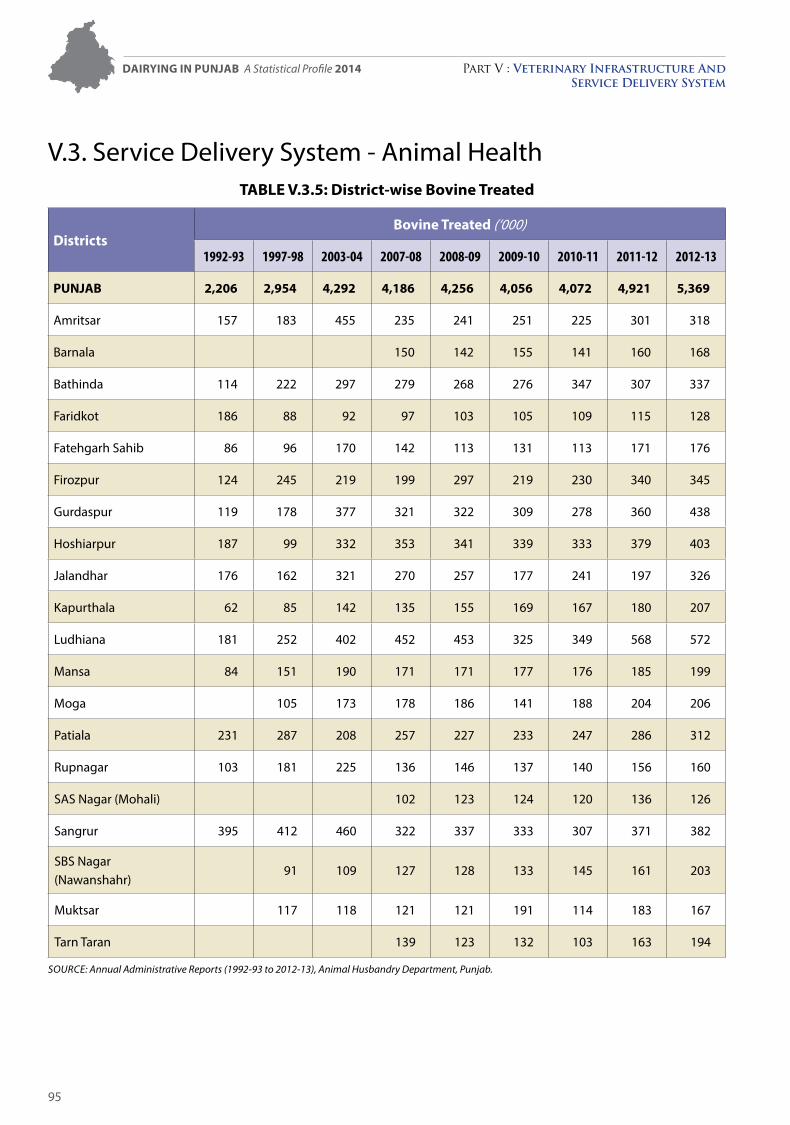
Dairying in Punjab A Statistical Profile 2014 Part V : Veterinary Infrastructure And Service Delivery System
95
V.3. Service Delivery System - Animal HealthTABLE V.3.5: District-wise Bovine Treated
DistrictsBovine Treated (‘000)
1992-93 1997-98 2003-04 2007-08 2008-09 2009-10 2010-11 2011-12 2012-13
PUNJAB 2,206 2,954 4,292 4,186 4,256 4,056 4,072 4,921 5,369
Amritsar 157 183 455 235 241 251 225 301 318
Barnala 150 142 155 141 160 168
Bathinda 114 222 297 279 268 276 347 307 337
Faridkot 186 88 92 97 103 105 109 115 128
Fatehgarh Sahib 86 96 170 142 113 131 113 171 176
Firozpur 124 245 219 199 297 219 230 340 345
Gurdaspur 119 178 377 321 322 309 278 360 438
Hoshiarpur 187 99 332 353 341 339 333 379 403
Jalandhar 176 162 321 270 257 177 241 197 326
Kapurthala 62 85 142 135 155 169 167 180 207
Ludhiana 181 252 402 452 453 325 349 568 572
Mansa 84 151 190 171 171 177 176 185 199
Moga 105 173 178 186 141 188 204 206
Patiala 231 287 208 257 227 233 247 286 312
Rupnagar 103 181 225 136 146 137 140 156 160
SAS Nagar (Mohali) 102 123 124 120 136 126
Sangrur 395 412 460 322 337 333 307 371 382
SBS Nagar (Nawanshahr)
91 109 127 128 133 145 161 203
Muktsar 117 118 121 121 191 114 183 167
Tarn Taran 139 123 132 103 163 194
SOurcE: Annual Administrative reports (1992-93 to 2012-13), Animal Husbandry Department, Punjab.
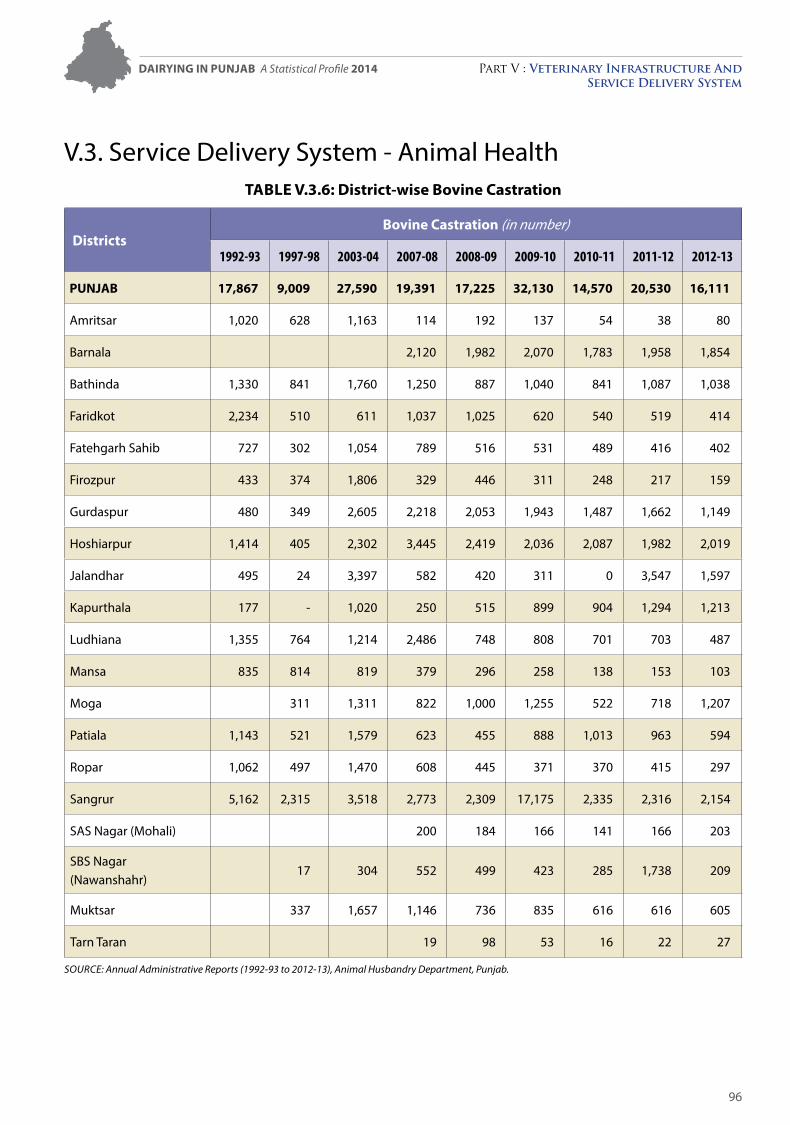
Dairying in Punjab A Statistical Profile 2014 Part V : Veterinary Infrastructure And Service Delivery System
96
V.3. Service Delivery System - Animal HealthTABLE V.3.6: District-wise Bovine Castration
DistrictsBovine Castration (in number)
1992-93 1997-98 2003-04 2007-08 2008-09 2009-10 2010-11 2011-12 2012-13
PUNJAB 17,867 9,009 27,590 19,391 17,225 32,130 14,570 20,530 16,111
Amritsar 1,020 628 1,163 114 192 137 54 38 80
Barnala 2,120 1,982 2,070 1,783 1,958 1,854
Bathinda 1,330 841 1,760 1,250 887 1,040 841 1,087 1,038
Faridkot 2,234 510 611 1,037 1,025 620 540 519 414
Fatehgarh Sahib 727 302 1,054 789 516 531 489 416 402
Firozpur 433 374 1,806 329 446 311 248 217 159
Gurdaspur 480 349 2,605 2,218 2,053 1,943 1,487 1,662 1,149
Hoshiarpur 1,414 405 2,302 3,445 2,419 2,036 2,087 1,982 2,019
Jalandhar 495 24 3,397 582 420 311 0 3,547 1,597
Kapurthala 177 - 1,020 250 515 899 904 1,294 1,213
Ludhiana 1,355 764 1,214 2,486 748 808 701 703 487
Mansa 835 814 819 379 296 258 138 153 103
Moga 311 1,311 822 1,000 1,255 522 718 1,207
Patiala 1,143 521 1,579 623 455 888 1,013 963 594
Ropar 1,062 497 1,470 608 445 371 370 415 297
Sangrur 5,162 2,315 3,518 2,773 2,309 17,175 2,335 2,316 2,154
SAS Nagar (Mohali) 200 184 166 141 166 203
SBS Nagar (Nawanshahr)
17 304 552 499 423 285 1,738 209
Muktsar 337 1,657 1,146 736 835 616 616 605
Tarn Taran 19 98 53 16 22 27
SOurcE: Annual Administrative reports (1992-93 to 2012-13), Animal Husbandry Department, Punjab.
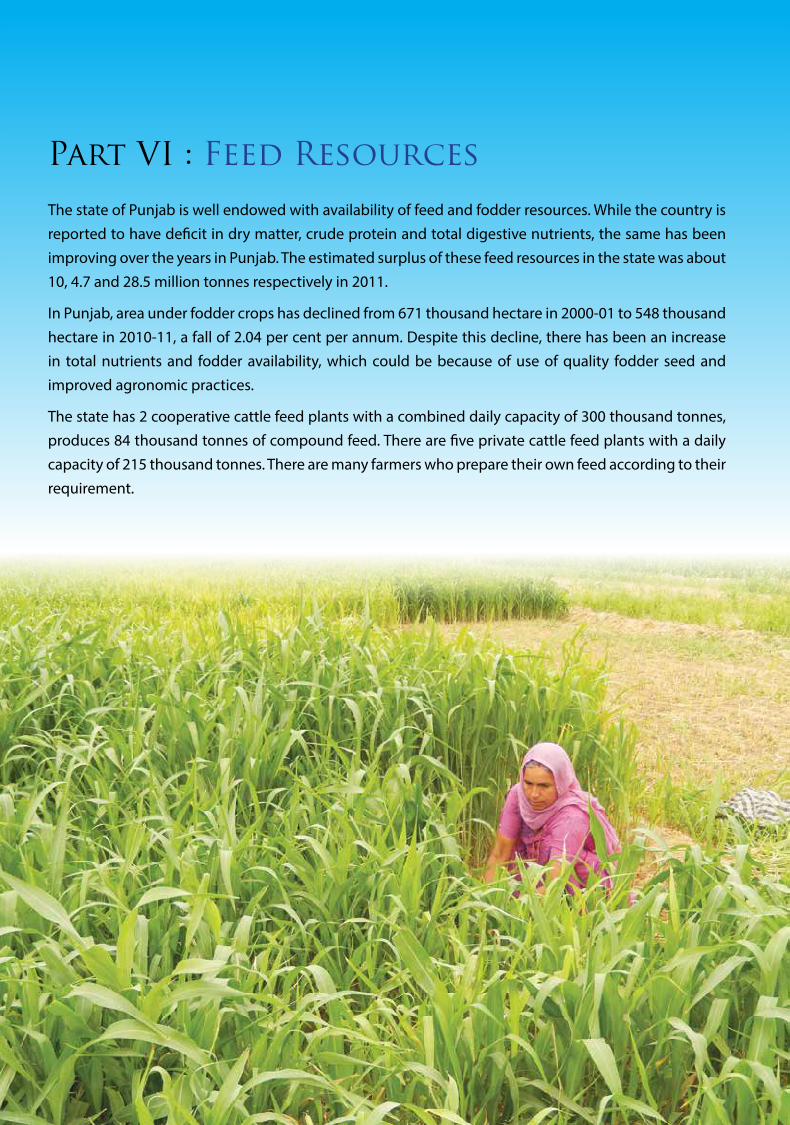
97
Part VI : Feed Resources
The state of Punjab is well endowed with availability of feed and fodder resources. While the country is reported to have deficit in dry matter, crude protein and total digestive nutrients, the same has been improving over the years in Punjab. The estimated surplus of these feed resources in the state was about 10, 4.7 and 28.5 million tonnes respectively in 2011.
In Punjab, area under fodder crops has declined from 671 thousand hectare in 2000-01 to 548 thousand hectare in 2010-11, a fall of 2.04 per cent per annum. Despite this decline, there has been an increase in total nutrients and fodder availability, which could be because of use of quality fodder seed and improved agronomic practices.
The state has 2 cooperative cattle feed plants with a combined daily capacity of 300 thousand tonnes, produces 84 thousand tonnes of compound feed. There are five private cattle feed plants with a daily capacity of 215 thousand tonnes. There are many farmers who prepare their own feed according to their requirement.
01
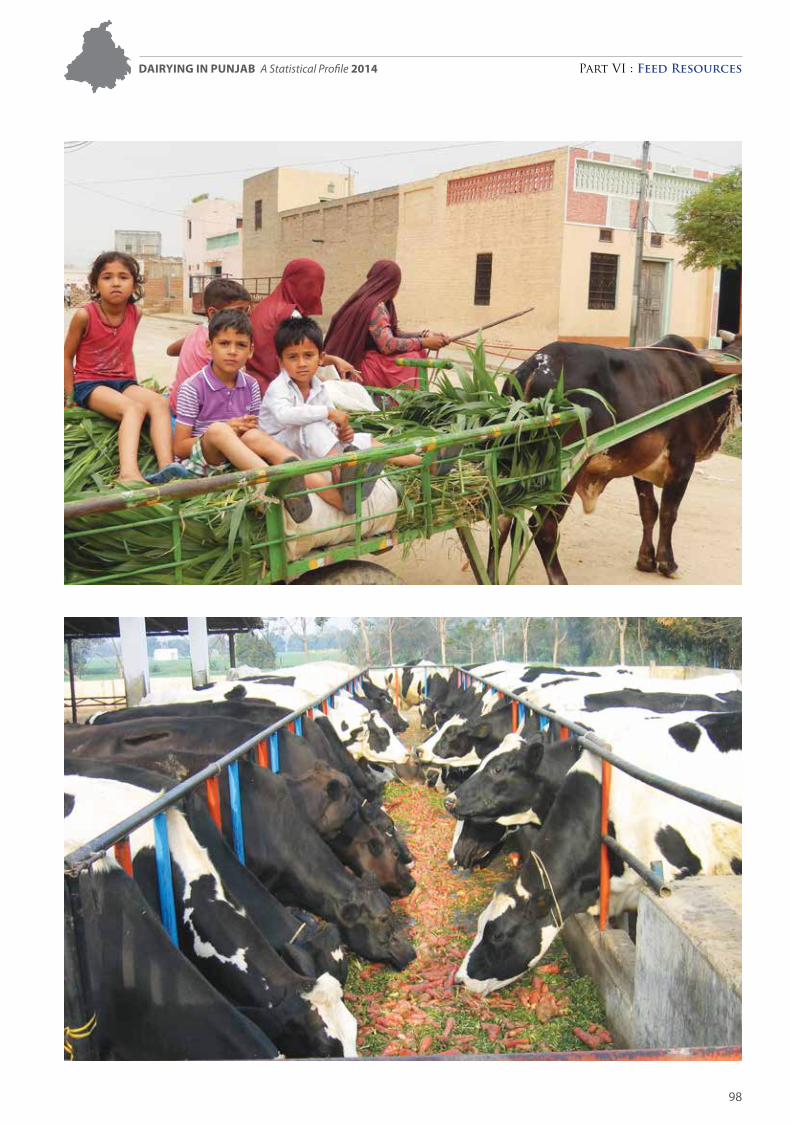
98
Dairying in Punjab A Statistical Profile 2014 Part VI : Feed Resources
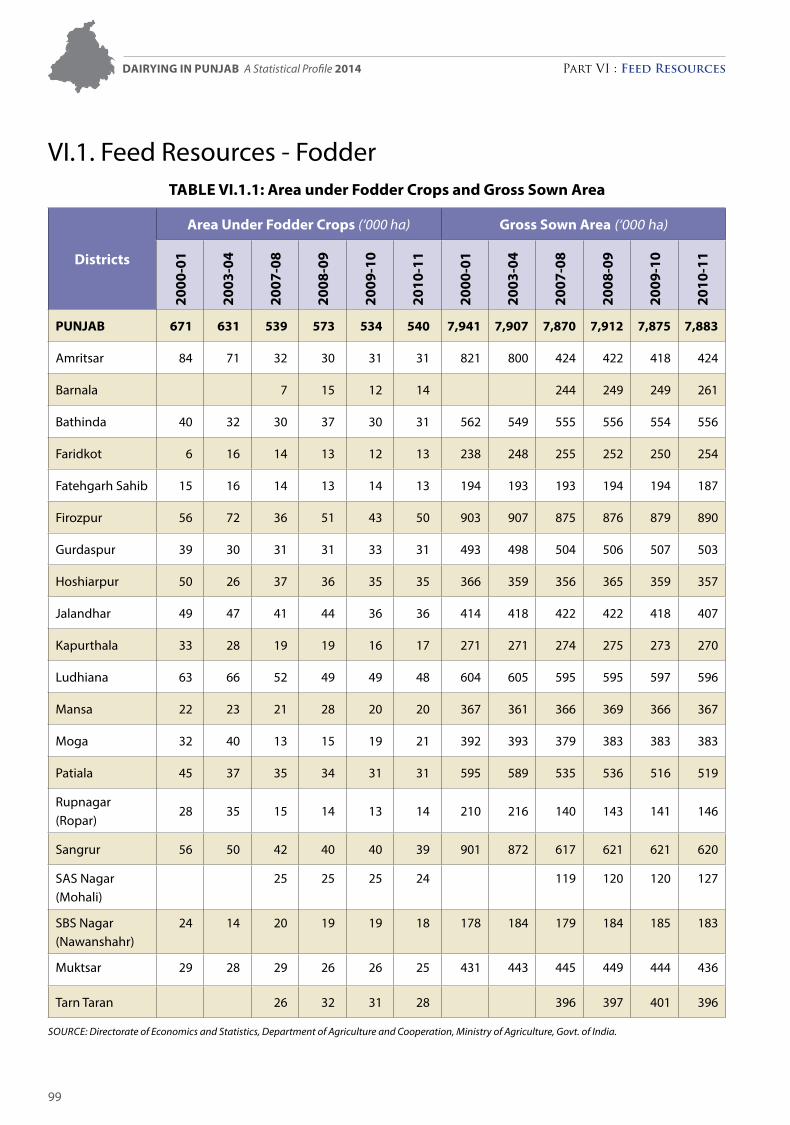
99
Dairying in Punjab A Statistical Profile 2014 Part VI : Feed Resources
VI.1. Feed Resources - FodderTable Vi.1.1: area under Fodder Crops and gross Sown area
Districts
area under Fodder Crops (‘000 ha) gross Sown area (‘000 ha)
2000
-01
2003
-04
2007
-08
2008
-09
2009
-10
2010
-11
2000
-01
2003
-04
2007
-08
2008
-09
2009
-10
2010
-11
Punjab 671 631 539 573 534 540 7,941 7,907 7,870 7,912 7,875 7,883
Amritsar 84 71 32 30 31 31 821 800 424 422 418 424
Barnala 7 15 12 14 244 249 249 261
Bathinda 40 32 30 37 30 31 562 549 555 556 554 556
Faridkot 6 16 14 13 12 13 238 248 255 252 250 254
Fatehgarh Sahib 15 16 14 13 14 13 194 193 193 194 194 187
Firozpur 56 72 36 51 43 50 903 907 875 876 879 890
Gurdaspur 39 30 31 31 33 31 493 498 504 506 507 503
Hoshiarpur 50 26 37 36 35 35 366 359 356 365 359 357
Jalandhar 49 47 41 44 36 36 414 418 422 422 418 407
Kapurthala 33 28 19 19 16 17 271 271 274 275 273 270
Ludhiana 63 66 52 49 49 48 604 605 595 595 597 596
Mansa 22 23 21 28 20 20 367 361 366 369 366 367
Moga 32 40 13 15 19 21 392 393 379 383 383 383
Patiala 45 37 35 34 31 31 595 589 535 536 516 519
Rupnagar (Ropar)
28 35 15 14 13 14 210 216 140 143 141 146
Sangrur 56 50 42 40 40 39 901 872 617 621 621 620
SAS Nagar (Mohali)
25 25 25 24 119 120 120 127
SBS Nagar (Nawanshahr)
24 14 20 19 19 18 178 184 179 184 185 183
Muktsar 29 28 29 26 26 25 431 443 445 449 444 436
Tarn Taran 26 32 31 28 396 397 401 396
Source: Directorate of economics and Statistics, Department of Agriculture and cooperation, Ministry of Agriculture, Govt. of India.
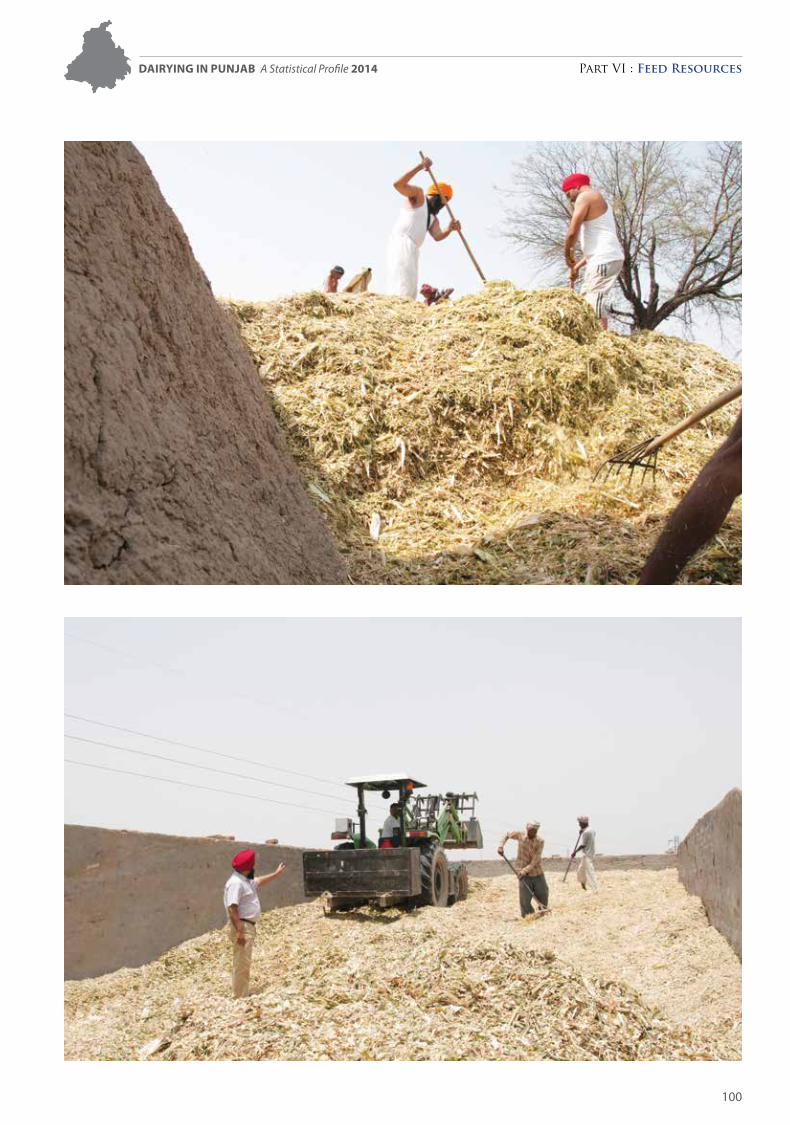
100
Dairying in Punjab A Statistical Profile 2014 Part VI : Feed Resources
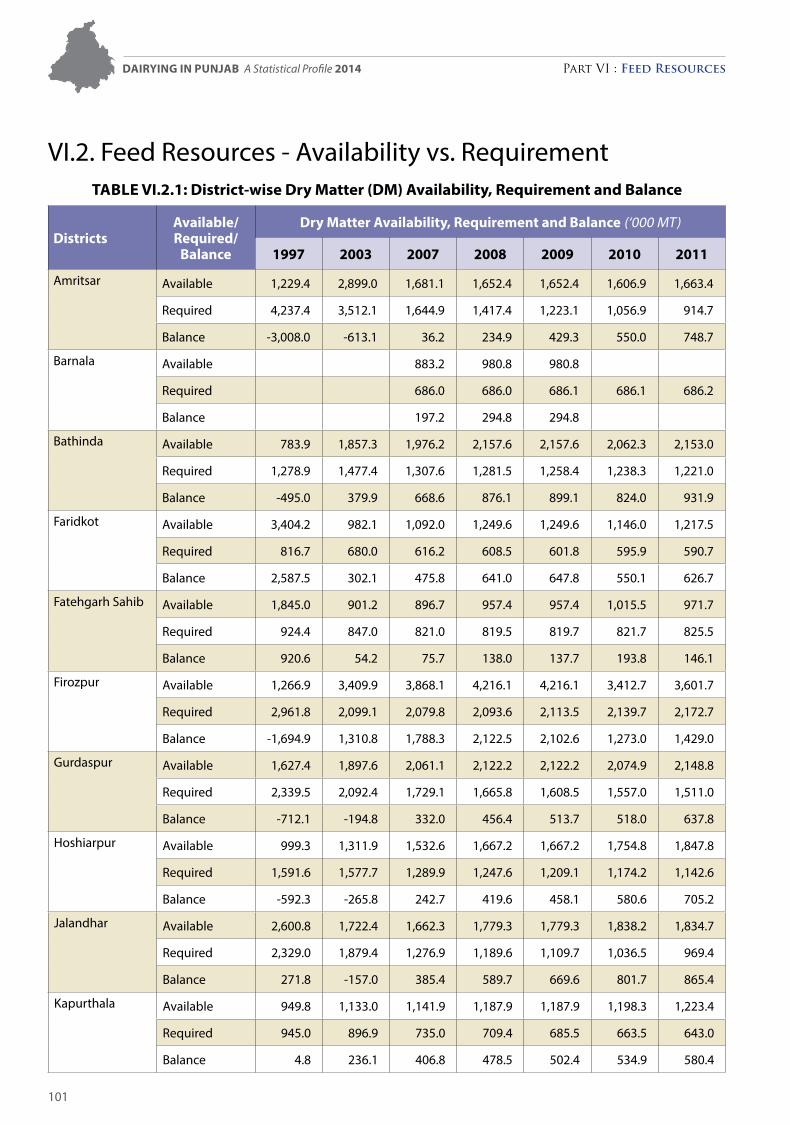
101
VI.2. Feed Resources - Availability vs. RequirementTable Vi.2.1: District-wise Dry Matter (DM) availability, requirement and balance
Districtsavailable/ required/
balance
Dry Matter availability, requirement and balance (‘000 MT)
1997 2003 2007 2008 2009 2010 2011
Amritsar Available 1,229.4 2,899.0 1,681.1 1,652.4 1,652.4 1,606.9 1,663.4
Required 4,237.4 3,512.1 1,644.9 1,417.4 1,223.1 1,056.9 914.7
Balance -3,008.0 -613.1 36.2 234.9 429.3 550.0 748.7
Barnala Available 883.2 980.8 980.8
Required 686.0 686.0 686.1 686.1 686.2
Balance 197.2 294.8 294.8
Bathinda Available 783.9 1,857.3 1,976.2 2,157.6 2,157.6 2,062.3 2,153.0
Required 1,278.9 1,477.4 1,307.6 1,281.5 1,258.4 1,238.3 1,221.0
Balance -495.0 379.9 668.6 876.1 899.1 824.0 931.9
Faridkot Available 3,404.2 982.1 1,092.0 1,249.6 1,249.6 1,146.0 1,217.5
Required 816.7 680.0 616.2 608.5 601.8 595.9 590.7
Balance 2,587.5 302.1 475.8 641.0 647.8 550.1 626.7
Fatehgarh Sahib Available 1,845.0 901.2 896.7 957.4 957.4 1,015.5 971.7
Required 924.4 847.0 821.0 819.5 819.7 821.7 825.5
Balance 920.6 54.2 75.7 138.0 137.7 193.8 146.1
Firozpur Available 1,266.9 3,409.9 3,868.1 4,216.1 4,216.1 3,412.7 3,601.7
Required 2,961.8 2,099.1 2,079.8 2,093.6 2,113.5 2,139.7 2,172.7
Balance -1,694.9 1,310.8 1,788.3 2,122.5 2,102.6 1,273.0 1,429.0
Gurdaspur Available 1,627.4 1,897.6 2,061.1 2,122.2 2,122.2 2,074.9 2,148.8
Required 2,339.5 2,092.4 1,729.1 1,665.8 1,608.5 1,557.0 1,511.0
Balance -712.1 -194.8 332.0 456.4 513.7 518.0 637.8
Hoshiarpur Available 999.3 1,311.9 1,532.6 1,667.2 1,667.2 1,754.8 1,847.8
Required 1,591.6 1,577.7 1,289.9 1,247.6 1,209.1 1,174.2 1,142.6
Balance -592.3 -265.8 242.7 419.6 458.1 580.6 705.2
Jalandhar Available 2,600.8 1,722.4 1,662.3 1,779.3 1,779.3 1,838.2 1,834.7
Required 2,329.0 1,879.4 1,276.9 1,189.6 1,109.7 1,036.5 969.4
Balance 271.8 -157.0 385.4 589.7 669.6 801.7 865.4
Kapurthala Available 949.8 1,133.0 1,141.9 1,187.9 1,187.9 1,198.3 1,223.4
Required 945.0 896.9 735.0 709.4 685.5 663.5 643.0
Balance 4.8 236.1 406.8 478.5 502.4 534.9 580.4
Dairying in Punjab A Statistical Profile 2014 Part VI : Feed Resources
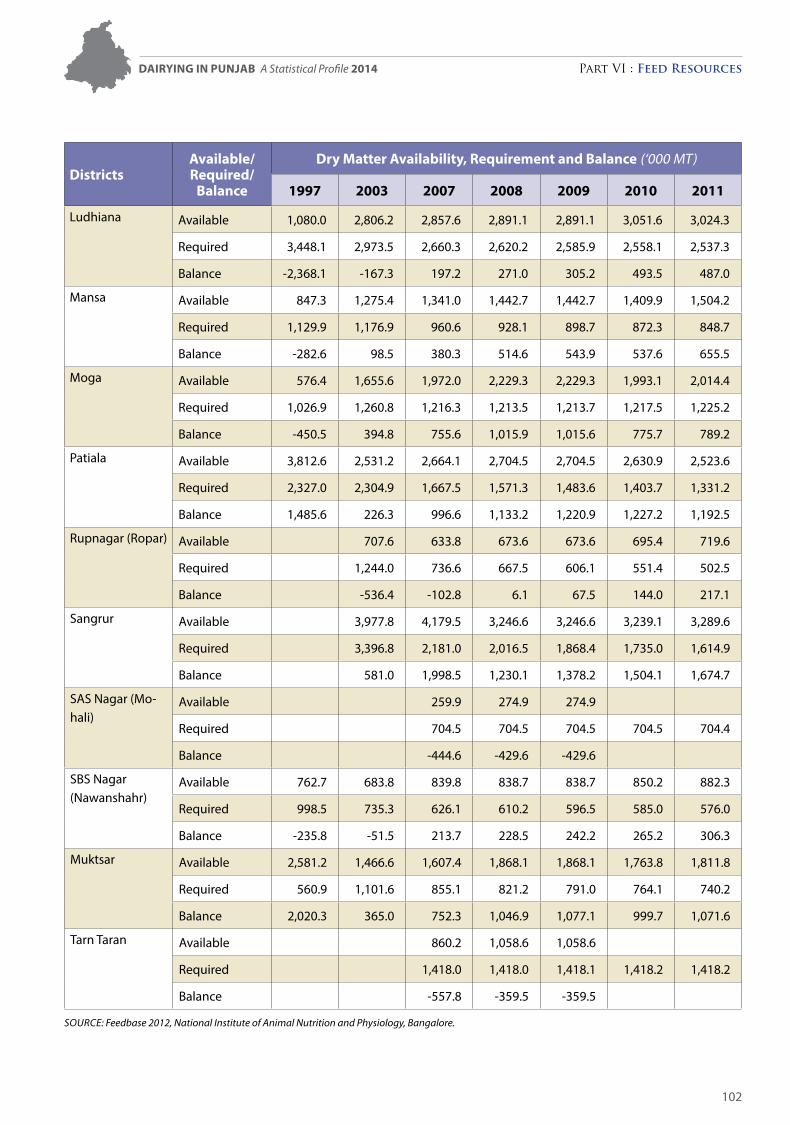
102
Districtsavailable/ required/
balance
Dry Matter availability, requirement and balance (‘000 MT)
1997 2003 2007 2008 2009 2010 2011
Ludhiana Available 1,080.0 2,806.2 2,857.6 2,891.1 2,891.1 3,051.6 3,024.3
Required 3,448.1 2,973.5 2,660.3 2,620.2 2,585.9 2,558.1 2,537.3
Balance -2,368.1 -167.3 197.2 271.0 305.2 493.5 487.0
Mansa Available 847.3 1,275.4 1,341.0 1,442.7 1,442.7 1,409.9 1,504.2
Required 1,129.9 1,176.9 960.6 928.1 898.7 872.3 848.7
Balance -282.6 98.5 380.3 514.6 543.9 537.6 655.5
Moga Available 576.4 1,655.6 1,972.0 2,229.3 2,229.3 1,993.1 2,014.4
Required 1,026.9 1,260.8 1,216.3 1,213.5 1,213.7 1,217.5 1,225.2
Balance -450.5 394.8 755.6 1,015.9 1,015.6 775.7 789.2
Patiala Available 3,812.6 2,531.2 2,664.1 2,704.5 2,704.5 2,630.9 2,523.6
Required 2,327.0 2,304.9 1,667.5 1,571.3 1,483.6 1,403.7 1,331.2
Balance 1,485.6 226.3 996.6 1,133.2 1,220.9 1,227.2 1,192.5
Rupnagar (Ropar) Available 707.6 633.8 673.6 673.6 695.4 719.6
Required 1,244.0 736.6 667.5 606.1 551.4 502.5
Balance -536.4 -102.8 6.1 67.5 144.0 217.1
Sangrur Available 3,977.8 4,179.5 3,246.6 3,246.6 3,239.1 3,289.6
Required 3,396.8 2,181.0 2,016.5 1,868.4 1,735.0 1,614.9
Balance 581.0 1,998.5 1,230.1 1,378.2 1,504.1 1,674.7
SAS Nagar (Mo-hali)
Available 259.9 274.9 274.9
Required 704.5 704.5 704.5 704.5 704.4
Balance -444.6 -429.6 -429.6
SBS Nagar (Nawanshahr)
Available 762.7 683.8 839.8 838.7 838.7 850.2 882.3
Required 998.5 735.3 626.1 610.2 596.5 585.0 576.0
Balance -235.8 -51.5 213.7 228.5 242.2 265.2 306.3
Muktsar Available 2,581.2 1,466.6 1,607.4 1,868.1 1,868.1 1,763.8 1,811.8
Required 560.9 1,101.6 855.1 821.2 791.0 764.1 740.2
Balance 2,020.3 365.0 752.3 1,046.9 1,077.1 999.7 1,071.6
Tarn Taran Available 860.2 1,058.6 1,058.6
Required 1,418.0 1,418.0 1,418.1 1,418.2 1,418.2
Balance -557.8 -359.5 -359.5
Source: Feedbase 2012, National Institute of Animal Nutrition and Physiology, Bangalore.
Dairying in Punjab A Statistical Profile 2014 Part VI : Feed Resources
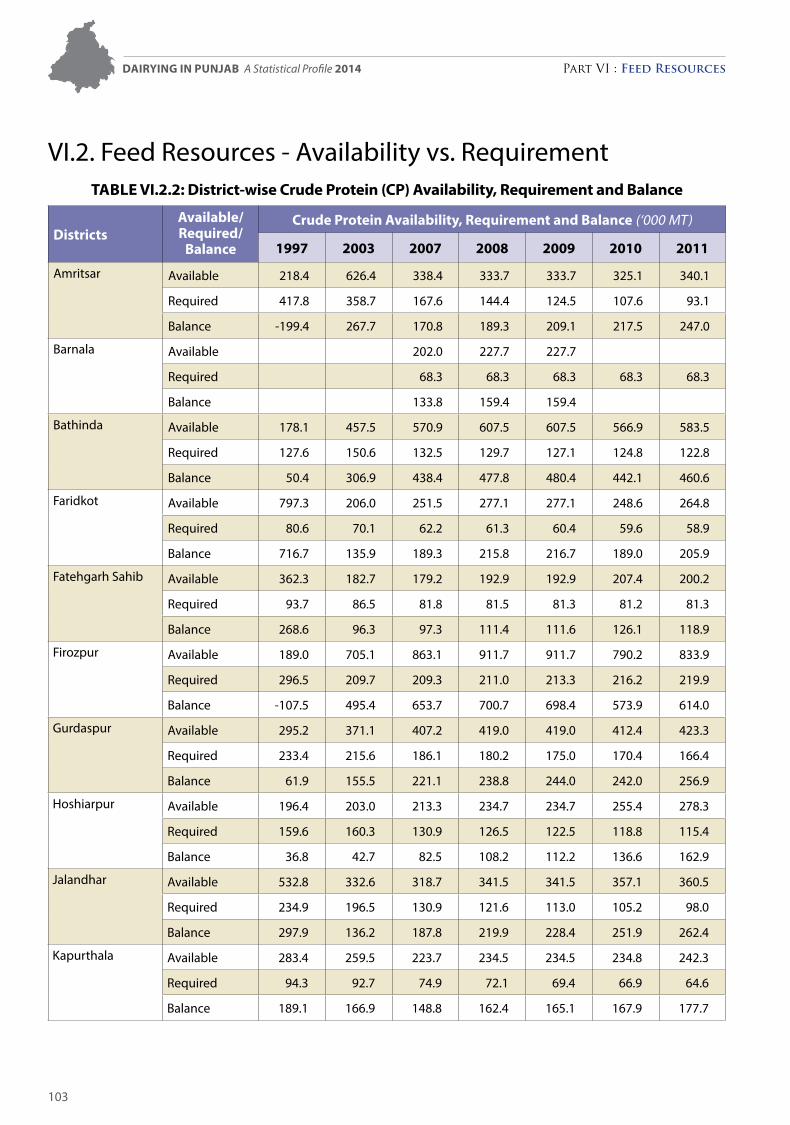
103
VI.2. Feed Resources - Availability vs. RequirementTable Vi.2.2: District-wise Crude Protein (CP) availability, requirement and balance
Districtsavailable/ required/
balance
Crude Protein availability, requirement and balance (‘000 MT)
1997 2003 2007 2008 2009 2010 2011
Amritsar Available 218.4 626.4 338.4 333.7 333.7 325.1 340.1
Required 417.8 358.7 167.6 144.4 124.5 107.6 93.1
Balance -199.4 267.7 170.8 189.3 209.1 217.5 247.0
Barnala Available 202.0 227.7 227.7
Required 68.3 68.3 68.3 68.3 68.3
Balance 133.8 159.4 159.4
Bathinda Available 178.1 457.5 570.9 607.5 607.5 566.9 583.5
Required 127.6 150.6 132.5 129.7 127.1 124.8 122.8
Balance 50.4 306.9 438.4 477.8 480.4 442.1 460.6
Faridkot Available 797.3 206.0 251.5 277.1 277.1 248.6 264.8
Required 80.6 70.1 62.2 61.3 60.4 59.6 58.9
Balance 716.7 135.9 189.3 215.8 216.7 189.0 205.9
Fatehgarh Sahib Available 362.3 182.7 179.2 192.9 192.9 207.4 200.2
Required 93.7 86.5 81.8 81.5 81.3 81.2 81.3
Balance 268.6 96.3 97.3 111.4 111.6 126.1 118.9
Firozpur Available 189.0 705.1 863.1 911.7 911.7 790.2 833.9
Required 296.5 209.7 209.3 211.0 213.3 216.2 219.9
Balance -107.5 495.4 653.7 700.7 698.4 573.9 614.0
Gurdaspur Available 295.2 371.1 407.2 419.0 419.0 412.4 423.3
Required 233.4 215.6 186.1 180.2 175.0 170.4 166.4
Balance 61.9 155.5 221.1 238.8 244.0 242.0 256.9
Hoshiarpur Available 196.4 203.0 213.3 234.7 234.7 255.4 278.3
Required 159.6 160.3 130.9 126.5 122.5 118.8 115.4
Balance 36.8 42.7 82.5 108.2 112.2 136.6 162.9
Jalandhar Available 532.8 332.6 318.7 341.5 341.5 357.1 360.5
Required 234.9 196.5 130.9 121.6 113.0 105.2 98.0
Balance 297.9 136.2 187.8 219.9 228.4 251.9 262.4
Kapurthala Available 283.4 259.5 223.7 234.5 234.5 234.8 242.3
Required 94.3 92.7 74.9 72.1 69.4 66.9 64.6
Balance 189.1 166.9 148.8 162.4 165.1 167.9 177.7
Dairying in Punjab A Statistical Profile 2014 Part VI : Feed Resources
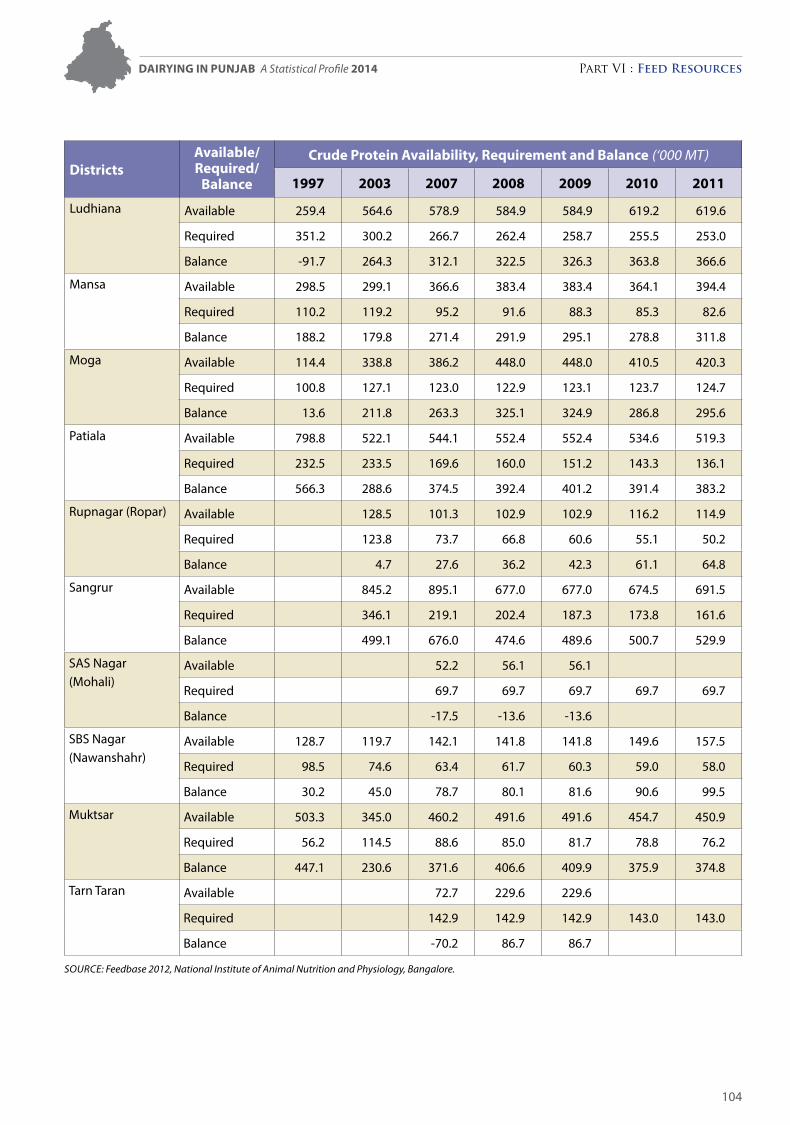
104
Districtsavailable/ required/
balance
Crude Protein availability, requirement and balance (‘000 MT)
1997 2003 2007 2008 2009 2010 2011
Ludhiana Available 259.4 564.6 578.9 584.9 584.9 619.2 619.6
Required 351.2 300.2 266.7 262.4 258.7 255.5 253.0
Balance -91.7 264.3 312.1 322.5 326.3 363.8 366.6
Mansa Available 298.5 299.1 366.6 383.4 383.4 364.1 394.4
Required 110.2 119.2 95.2 91.6 88.3 85.3 82.6
Balance 188.2 179.8 271.4 291.9 295.1 278.8 311.8
Moga Available 114.4 338.8 386.2 448.0 448.0 410.5 420.3
Required 100.8 127.1 123.0 122.9 123.1 123.7 124.7
Balance 13.6 211.8 263.3 325.1 324.9 286.8 295.6
Patiala Available 798.8 522.1 544.1 552.4 552.4 534.6 519.3
Required 232.5 233.5 169.6 160.0 151.2 143.3 136.1
Balance 566.3 288.6 374.5 392.4 401.2 391.4 383.2
Rupnagar (Ropar) Available 128.5 101.3 102.9 102.9 116.2 114.9
Required 123.8 73.7 66.8 60.6 55.1 50.2
Balance 4.7 27.6 36.2 42.3 61.1 64.8
Sangrur Available 845.2 895.1 677.0 677.0 674.5 691.5
Required 346.1 219.1 202.4 187.3 173.8 161.6
Balance 499.1 676.0 474.6 489.6 500.7 529.9
SAS Nagar (Mohali)
Available 52.2 56.1 56.1
Required 69.7 69.7 69.7 69.7 69.7
Balance -17.5 -13.6 -13.6
SBS Nagar (Nawanshahr)
Available 128.7 119.7 142.1 141.8 141.8 149.6 157.5
Required 98.5 74.6 63.4 61.7 60.3 59.0 58.0
Balance 30.2 45.0 78.7 80.1 81.6 90.6 99.5
Muktsar Available 503.3 345.0 460.2 491.6 491.6 454.7 450.9
Required 56.2 114.5 88.6 85.0 81.7 78.8 76.2
Balance 447.1 230.6 371.6 406.6 409.9 375.9 374.8
Tarn Taran Available 72.7 229.6 229.6
Required 142.9 142.9 142.9 143.0 143.0
Balance -70.2 86.7 86.7
Source: Feedbase 2012, National Institute of Animal Nutrition and Physiology, Bangalore.
Dairying in Punjab A Statistical Profile 2014 Part VI : Feed Resources
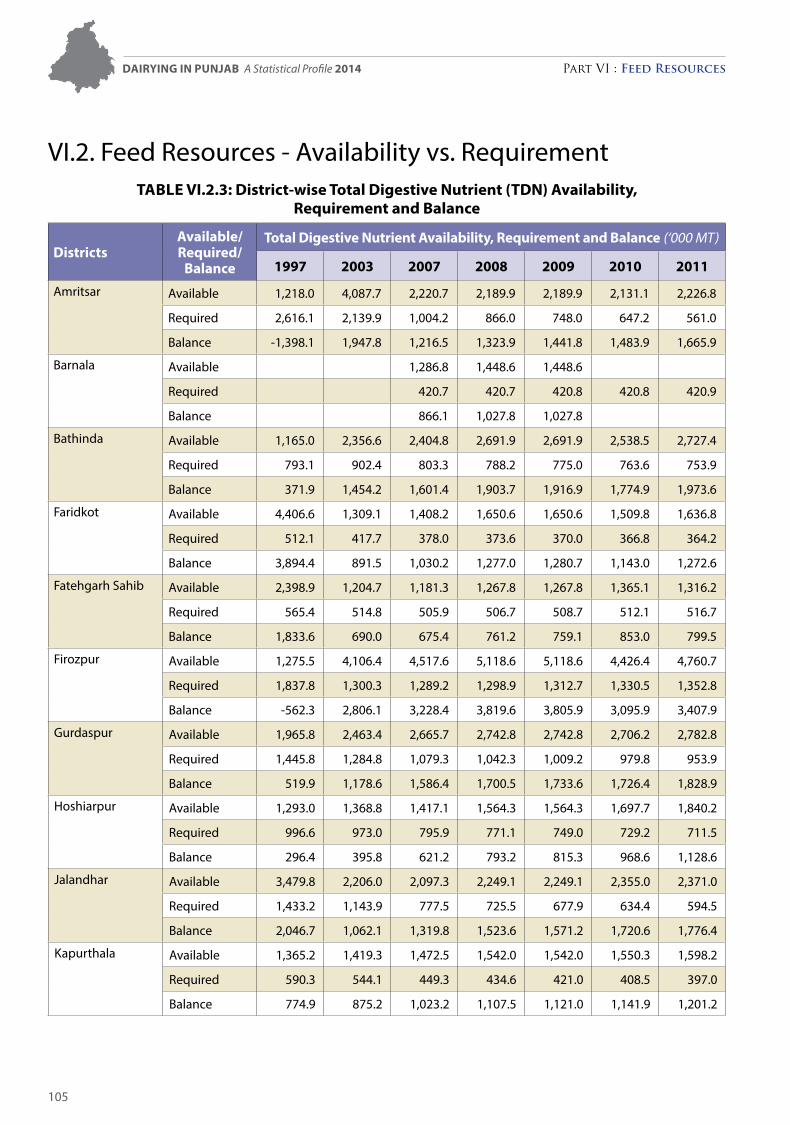
105
VI.2. Feed Resources - Availability vs. RequirementTable Vi.2.3: District-wise Total Digestive nutrient (TDn) availability,
requirement and balance
Districtsavailable/ required/
balance
Total Digestive nutrient availability, requirement and balance (‘000 MT)
1997 2003 2007 2008 2009 2010 2011
Amritsar Available 1,218.0 4,087.7 2,220.7 2,189.9 2,189.9 2,131.1 2,226.8
Required 2,616.1 2,139.9 1,004.2 866.0 748.0 647.2 561.0
Balance -1,398.1 1,947.8 1,216.5 1,323.9 1,441.8 1,483.9 1,665.9
Barnala Available 1,286.8 1,448.6 1,448.6
Required 420.7 420.7 420.8 420.8 420.9
Balance 866.1 1,027.8 1,027.8
Bathinda Available 1,165.0 2,356.6 2,404.8 2,691.9 2,691.9 2,538.5 2,727.4
Required 793.1 902.4 803.3 788.2 775.0 763.6 753.9
Balance 371.9 1,454.2 1,601.4 1,903.7 1,916.9 1,774.9 1,973.6
Faridkot Available 4,406.6 1,309.1 1,408.2 1,650.6 1,650.6 1,509.8 1,636.8
Required 512.1 417.7 378.0 373.6 370.0 366.8 364.2
Balance 3,894.4 891.5 1,030.2 1,277.0 1,280.7 1,143.0 1,272.6
Fatehgarh Sahib Available 2,398.9 1,204.7 1,181.3 1,267.8 1,267.8 1,365.1 1,316.2
Required 565.4 514.8 505.9 506.7 508.7 512.1 516.7
Balance 1,833.6 690.0 675.4 761.2 759.1 853.0 799.5
Firozpur Available 1,275.5 4,106.4 4,517.6 5,118.6 5,118.6 4,426.4 4,760.7
Required 1,837.8 1,300.3 1,289.2 1,298.9 1,312.7 1,330.5 1,352.8
Balance -562.3 2,806.1 3,228.4 3,819.6 3,805.9 3,095.9 3,407.9
Gurdaspur Available 1,965.8 2,463.4 2,665.7 2,742.8 2,742.8 2,706.2 2,782.8
Required 1,445.8 1,284.8 1,079.3 1,042.3 1,009.2 979.8 953.9
Balance 519.9 1,178.6 1,586.4 1,700.5 1,733.6 1,726.4 1,828.9
Hoshiarpur Available 1,293.0 1,368.8 1,417.1 1,564.3 1,564.3 1,697.7 1,840.2
Required 996.6 973.0 795.9 771.1 749.0 729.2 711.5
Balance 296.4 395.8 621.2 793.2 815.3 968.6 1,128.6
Jalandhar Available 3,479.8 2,206.0 2,097.3 2,249.1 2,249.1 2,355.0 2,371.0
Required 1,433.2 1,143.9 777.5 725.5 677.9 634.4 594.5
Balance 2,046.7 1,062.1 1,319.8 1,523.6 1,571.2 1,720.6 1,776.4
Kapurthala Available 1,365.2 1,419.3 1,472.5 1,542.0 1,542.0 1,550.3 1,598.2
Required 590.3 544.1 449.3 434.6 421.0 408.5 397.0
Balance 774.9 875.2 1,023.2 1,107.5 1,121.0 1,141.9 1,201.2
Dairying in Punjab A Statistical Profile 2014 Part VI : Feed Resources
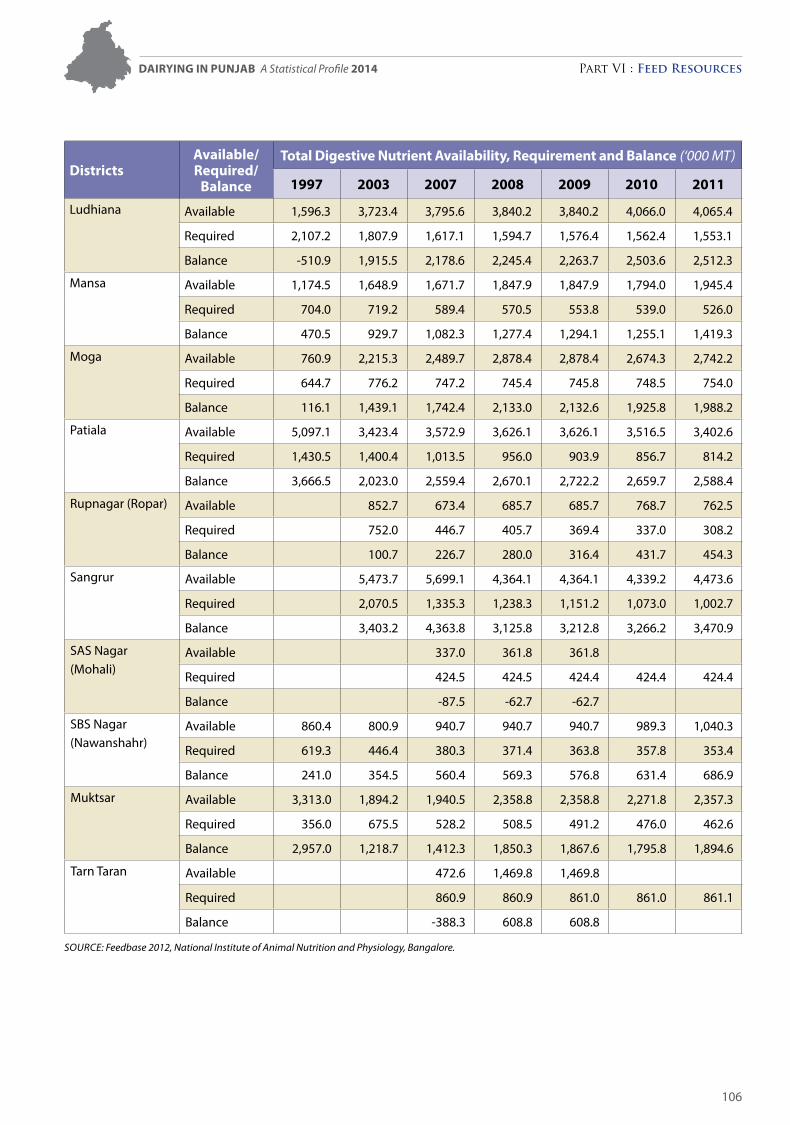
106
Districtsavailable/ required/
balance
Total Digestive nutrient availability, requirement and balance (‘000 MT)
1997 2003 2007 2008 2009 2010 2011
Ludhiana Available 1,596.3 3,723.4 3,795.6 3,840.2 3,840.2 4,066.0 4,065.4
Required 2,107.2 1,807.9 1,617.1 1,594.7 1,576.4 1,562.4 1,553.1
Balance -510.9 1,915.5 2,178.6 2,245.4 2,263.7 2,503.6 2,512.3
Mansa Available 1,174.5 1,648.9 1,671.7 1,847.9 1,847.9 1,794.0 1,945.4
Required 704.0 719.2 589.4 570.5 553.8 539.0 526.0
Balance 470.5 929.7 1,082.3 1,277.4 1,294.1 1,255.1 1,419.3
Moga Available 760.9 2,215.3 2,489.7 2,878.4 2,878.4 2,674.3 2,742.2
Required 644.7 776.2 747.2 745.4 745.8 748.5 754.0
Balance 116.1 1,439.1 1,742.4 2,133.0 2,132.6 1,925.8 1,988.2
Patiala Available 5,097.1 3,423.4 3,572.9 3,626.1 3,626.1 3,516.5 3,402.6
Required 1,430.5 1,400.4 1,013.5 956.0 903.9 856.7 814.2
Balance 3,666.5 2,023.0 2,559.4 2,670.1 2,722.2 2,659.7 2,588.4
Rupnagar (Ropar) Available 852.7 673.4 685.7 685.7 768.7 762.5
Required 752.0 446.7 405.7 369.4 337.0 308.2
Balance 100.7 226.7 280.0 316.4 431.7 454.3
Sangrur Available 5,473.7 5,699.1 4,364.1 4,364.1 4,339.2 4,473.6
Required 2,070.5 1,335.3 1,238.3 1,151.2 1,073.0 1,002.7
Balance 3,403.2 4,363.8 3,125.8 3,212.8 3,266.2 3,470.9
SAS Nagar (Mohali)
Available 337.0 361.8 361.8
Required 424.5 424.5 424.4 424.4 424.4
Balance -87.5 -62.7 -62.7
SBS Nagar (Nawanshahr)
Available 860.4 800.9 940.7 940.7 940.7 989.3 1,040.3
Required 619.3 446.4 380.3 371.4 363.8 357.8 353.4
Balance 241.0 354.5 560.4 569.3 576.8 631.4 686.9
Muktsar Available 3,313.0 1,894.2 1,940.5 2,358.8 2,358.8 2,271.8 2,357.3
Required 356.0 675.5 528.2 508.5 491.2 476.0 462.6
Balance 2,957.0 1,218.7 1,412.3 1,850.3 1,867.6 1,795.8 1,894.6
Tarn Taran Available 472.6 1,469.8 1,469.8
Required 860.9 860.9 861.0 861.0 861.1
Balance -388.3 608.8 608.8
Source: Feedbase 2012, National Institute of Animal Nutrition and Physiology, Bangalore.
Dairying in Punjab A Statistical Profile 2014 Part VI : Feed Resources

107
VI.2. Feed Resources - Availability vs. RequirementTable Vi.2.4: availability, requirement and Surplus/Deficit of Feed nutrients
(‘000 MT)
year
Dry Matter Crude Protein Total Digestible nutrients
ava
ilabi
lity
requ
irem
ent
Defi
cit/
Su
rplu
s
ava
ilabi
lity
requ
irem
ent
Defi
cit/
Su
rplu
s
ava
ilabi
lity
requ
irem
ent
Defi
cit/
Su
rplu
s
1997 24,367 26,916 -2,549 5,156 2,688 2,468 31,370 16,652 14,718
2003 31,218 29,258 1,960 6,506 2,980 3,526 40,554 17,870 22,684
2007 34,011 25,212 8,799 7,167 2,556 4,611 42,265 15,446 26,819
2008 35,199 24,290 10,909 7,448 2,462 4,986 44,839 14,904 29,935
2009 35,199 23,482 11,717 7,448 2,379 5,069 44,839 14,433 30,406
2010 32,138 22,780 9,358 6,731 2,306 4,425 40,808 14,029 26,779
2011 32,826 22,175 10,651 6,905 2,244 4,661 42,157 13,686 28,471
Source: Feedbase 2012, National Institute of Animal Nutrition and Physiology, Bangalore.
Dairying in Punjab A Statistical Profile 2014 Part VI : Feed Resources
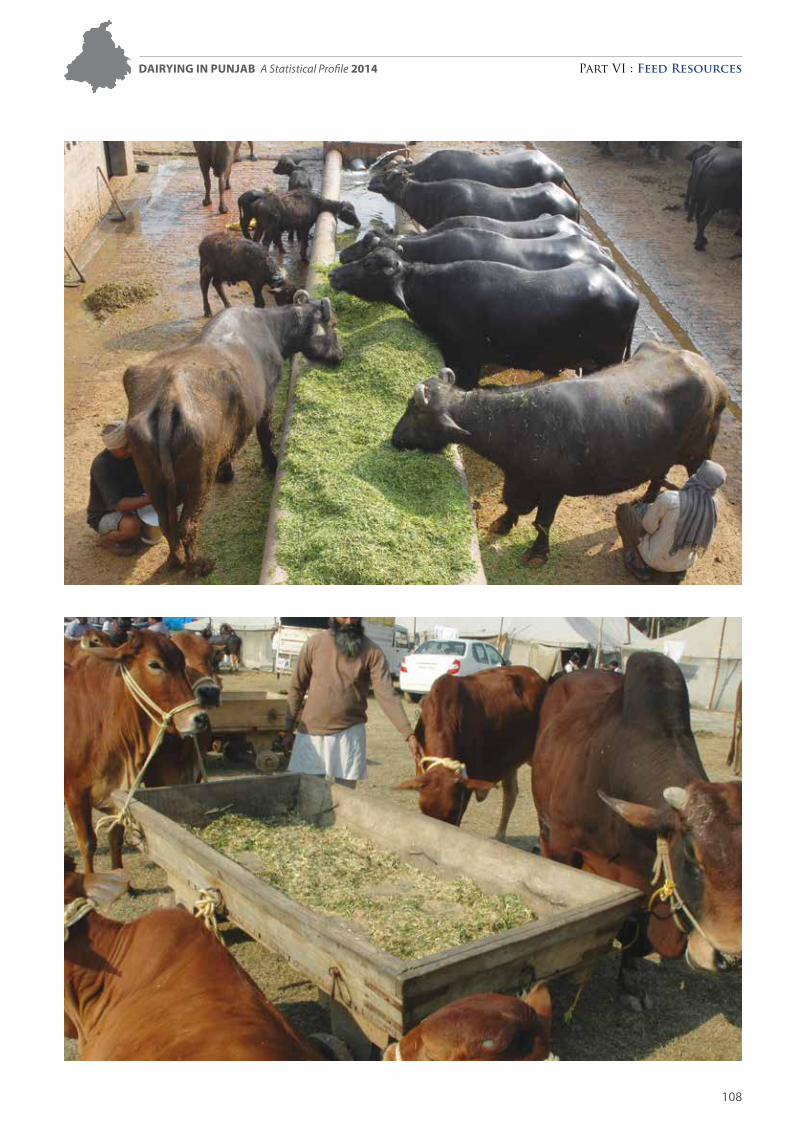
108
Dairying in Punjab A Statistical Profile 2014 Part VI : Feed Resources
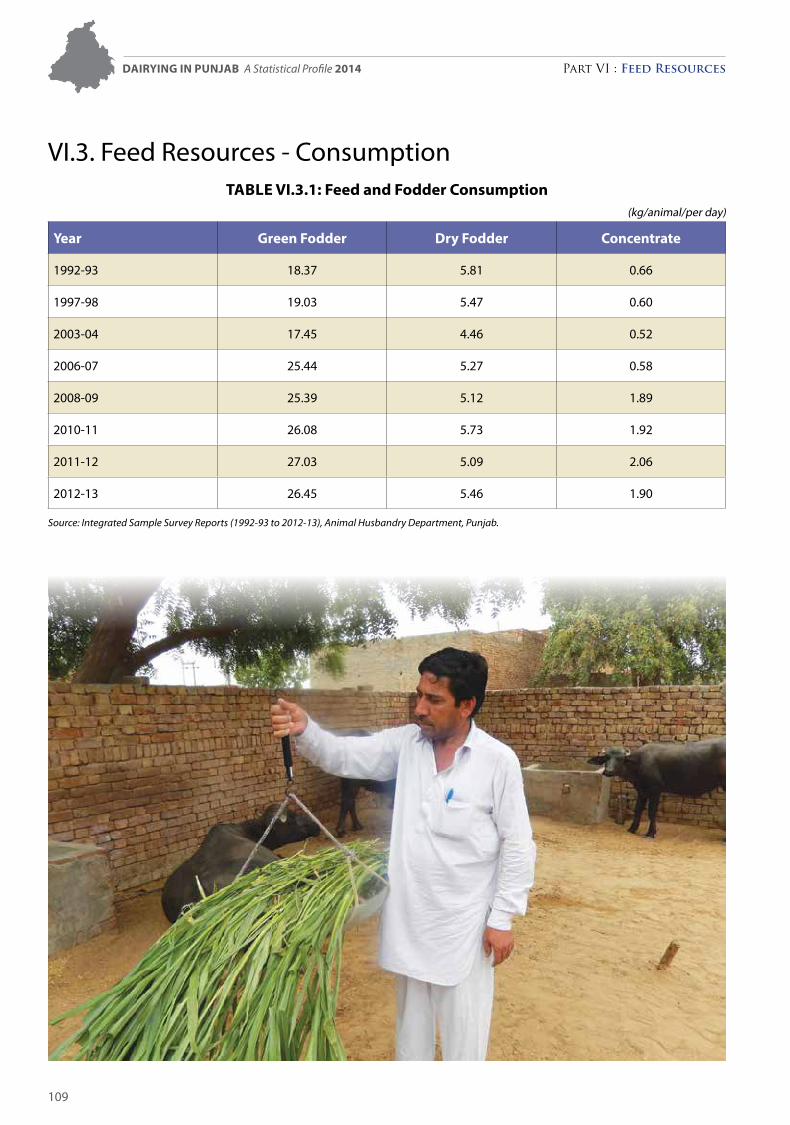
109
VI.3. Feed Resources - ConsumptionTable Vi.3.1: Feed and Fodder Consumption
(kg/animal/per day)
year green Fodder Dry Fodder Concentrate
1992-93 18.37 5.81 0.66
1997-98 19.03 5.47 0.60
2003-04 17.45 4.46 0.52
2006-07 25.44 5.27 0.58
2008-09 25.39 5.12 1.89
2010-11 26.08 5.73 1.92
2011-12 27.03 5.09 2.06
2012-13 26.45 5.46 1.90
Source: Integrated Sample Survey reports (1992-93 to 2012-13), Animal Husbandry Department, Punjab.
Dairying in Punjab A Statistical Profile 2014 Part VI : Feed Resources
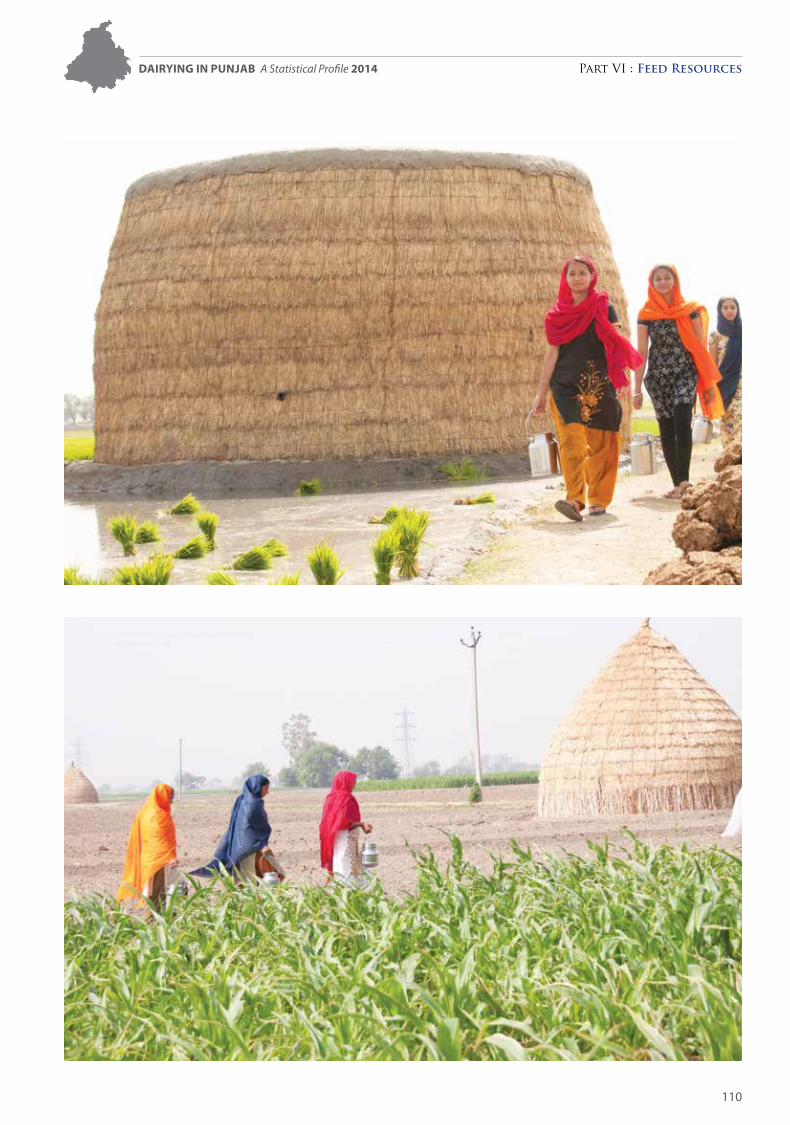
110
Dairying in Punjab A Statistical Profile 2014 Part VI : Feed Resources
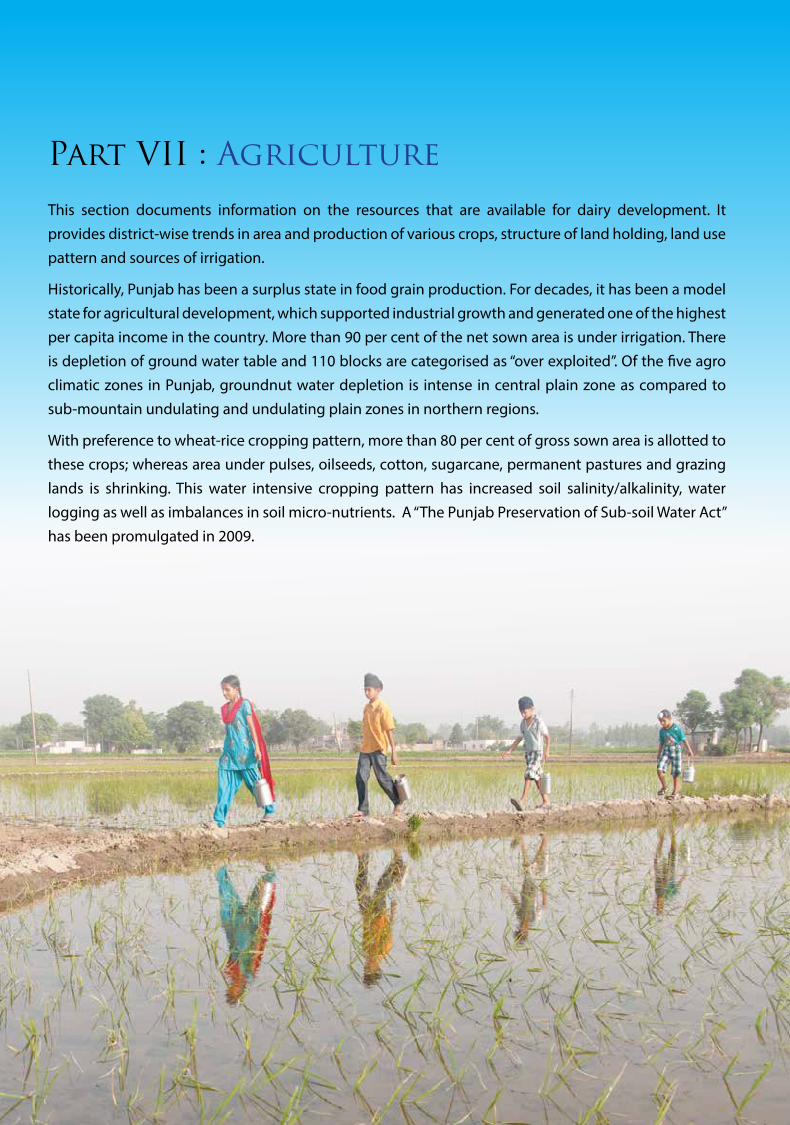
Part VII : Agriculture
This section documents information on the resources that are available for dairy development. It provides district-wise trends in area and production of various crops, structure of land holding, land use pattern and sources of irrigation.
Historically, Punjab has been a surplus state in food grain production. For decades, it has been a model state for agricultural development, which supported industrial growth and generated one of the highest per capita income in the country. More than 90 per cent of the net sown area is under irrigation. There is depletion of ground water table and 110 blocks are categorised as “over exploited”. Of the five agro climatic zones in Punjab, groundnut water depletion is intense in central plain zone as compared to sub-mountain undulating and undulating plain zones in northern regions.
With preference to wheat-rice cropping pattern, more than 80 per cent of gross sown area is allotted to these crops; whereas area under pulses, oilseeds, cotton, sugarcane, permanent pastures and grazing lands is shrinking. This water intensive cropping pattern has increased soil salinity/alkalinity, water logging as well as imbalances in soil micro-nutrients. A “The Punjab Preservation of Sub-soil Water Act” has been promulgated in 2009.
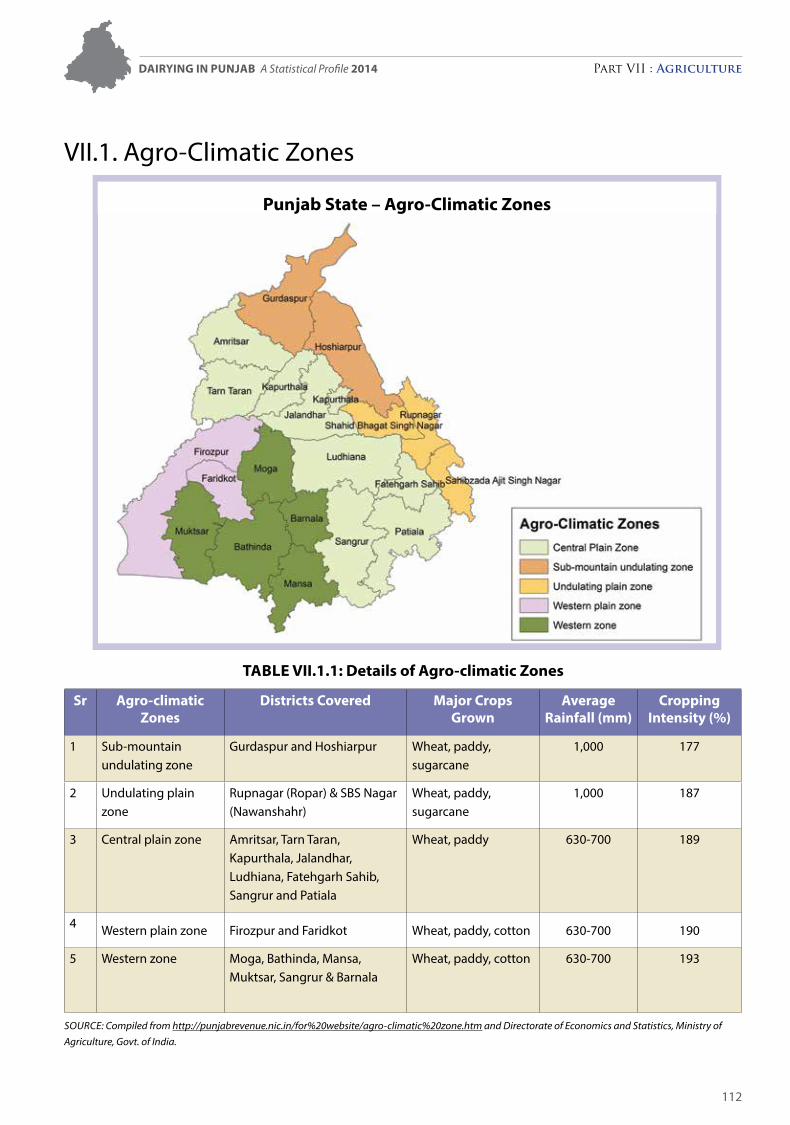
112
Table VII.1.1: Details of agro-climatic Zones
Sr agro-climatic Zones
Districts Covered Major Crops Grown
average Rainfall (mm)
Cropping Intensity (%)
1 Sub-mountain undulating zone
Gurdaspur and Hoshiarpur Wheat, paddy, sugarcane
1,000 177
2 Undulating plain zone
Rupnagar (Ropar) & SBS Nagar (Nawanshahr)
Wheat, paddy, sugarcane
1,000 187
3 Central plain zone Amritsar, Tarn Taran, Kapurthala, Jalandhar, Ludhiana, Fatehgarh Sahib, Sangrur and Patiala
Wheat, paddy 630-700 189
4 Western plain zone Firozpur and Faridkot Wheat, paddy, cotton 630-700 190
5 Western zone Moga, Bathinda, Mansa, Muktsar, Sangrur & Barnala
Wheat, paddy, cotton 630-700 193
Source: compiled from http://punjabrevenue.nic.in/for%20website/agro-climatic%20zone.htm and Directorate of economics and Statistics, Ministry of Agriculture, Govt. of India.
VII.1. Agro-Climatic Zones
Punjab State – agro-Climatic Zones
DaIRyInG In Punjab A Statistical Profile 2014 Part VII : Agriculture
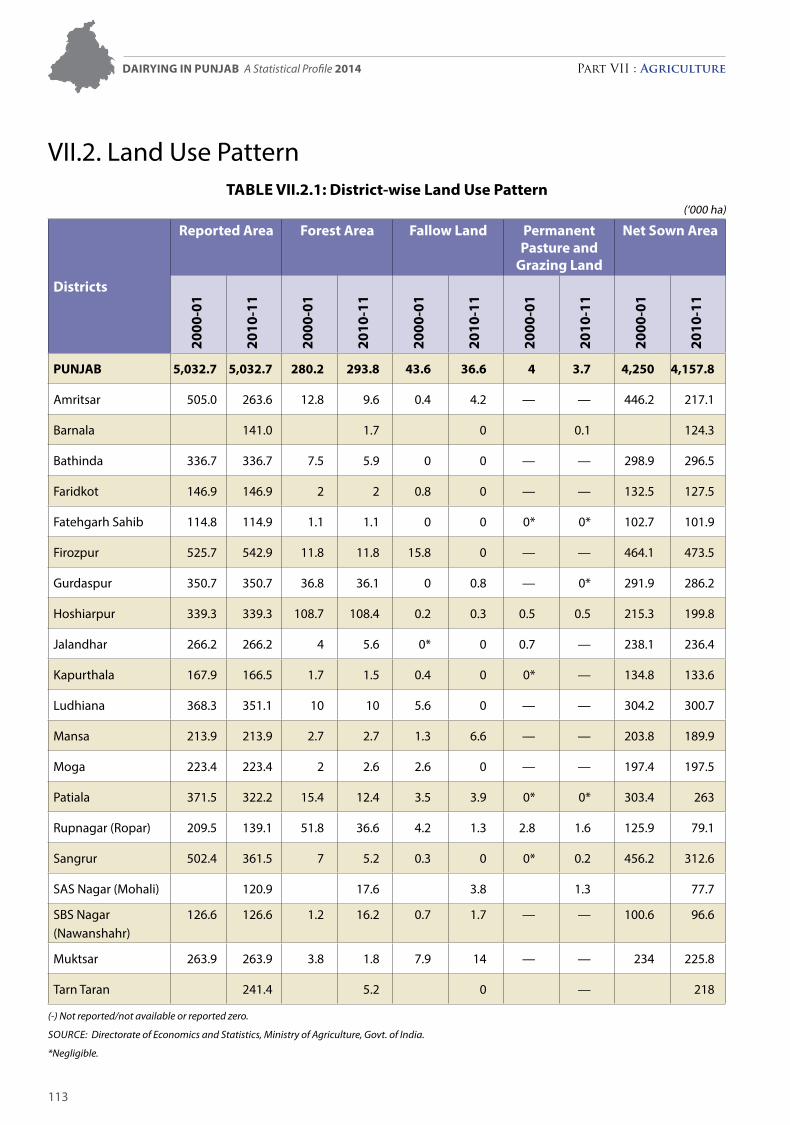
113
DaIRyInG In Punjab A Statistical Profile 2014 Part VII : Agriculture
VII.2. Land Use PatternTable VII.2.1: District-wise land use Pattern
(‘000 ha)
Districts
Reported area Forest area Fallow land Permanent Pasture and
Grazing land
net Sown area
2000
-01
2010
-11
2000
-01
2010
-11
2000
-01
2010
-11
2000
-01
2010
-11
2000
-01
2010
-11
Punjab 5,032.7 5,032.7 280.2 293.8 43.6 36.6 4 3.7 4,250 4,157.8
Amritsar 505.0 263.6 12.8 9.6 0.4 4.2 — — 446.2 217.1
Barnala 141.0 1.7 0 0.1 124.3
Bathinda 336.7 336.7 7.5 5.9 0 0 — — 298.9 296.5
Faridkot 146.9 146.9 2 2 0.8 0 — — 132.5 127.5
Fatehgarh Sahib 114.8 114.9 1.1 1.1 0 0 0* 0* 102.7 101.9
Firozpur 525.7 542.9 11.8 11.8 15.8 0 — — 464.1 473.5
Gurdaspur 350.7 350.7 36.8 36.1 0 0.8 — 0* 291.9 286.2
Hoshiarpur 339.3 339.3 108.7 108.4 0.2 0.3 0.5 0.5 215.3 199.8
Jalandhar 266.2 266.2 4 5.6 0* 0 0.7 — 238.1 236.4
Kapurthala 167.9 166.5 1.7 1.5 0.4 0 0* — 134.8 133.6
Ludhiana 368.3 351.1 10 10 5.6 0 — — 304.2 300.7
Mansa 213.9 213.9 2.7 2.7 1.3 6.6 — — 203.8 189.9
Moga 223.4 223.4 2 2.6 2.6 0 — — 197.4 197.5
Patiala 371.5 322.2 15.4 12.4 3.5 3.9 0* 0* 303.4 263
Rupnagar (Ropar) 209.5 139.1 51.8 36.6 4.2 1.3 2.8 1.6 125.9 79.1
Sangrur 502.4 361.5 7 5.2 0.3 0 0* 0.2 456.2 312.6
SAS Nagar (Mohali) 120.9 17.6 3.8 1.3 77.7
SBS Nagar (Nawanshahr)
126.6 126.6 1.2 16.2 0.7 1.7 — — 100.6 96.6
Muktsar 263.9 263.9 3.8 1.8 7.9 14 — — 234 225.8
Tarn Taran 241.4 5.2 0 — 218
(-) Not reported/not available or reported zero.
Source: Directorate of economics and Statistics, Ministry of Agriculture, Govt. of India.
*Negligible.
114
DaIRyInG In Punjab A Statistical Profile 2014 Part VII : Agriculture
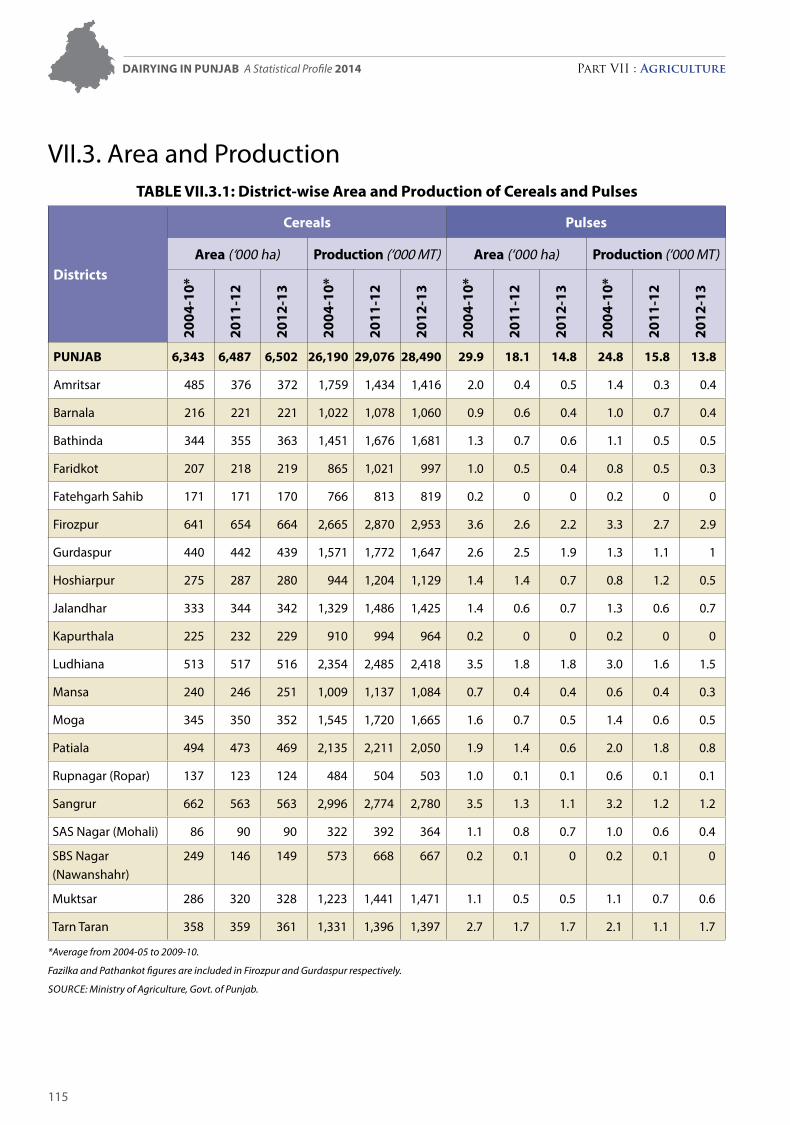
115
VII.3. Area and ProductionTable VII.3.1: District-wise area and Production of Cereals and Pulses
Districts
Cereals Pulses
area (‘000 ha) Production (‘000 MT) area (‘000 ha) Production (‘000 MT)
2004
-10*
2011
-12
2012
-13
2004
-10*
2011
-12
2012
-13
2004
-10*
2011
-12
2012
-13
2004
-10*
2011
-12
2012
-13
Punjab 6,343 6,487 6,502 26,190 29,076 28,490 29.9 18.1 14.8 24.8 15.8 13.8
Amritsar 485 376 372 1,759 1,434 1,416 2.0 0.4 0.5 1.4 0.3 0.4
Barnala 216 221 221 1,022 1,078 1,060 0.9 0.6 0.4 1.0 0.7 0.4
Bathinda 344 355 363 1,451 1,676 1,681 1.3 0.7 0.6 1.1 0.5 0.5
Faridkot 207 218 219 865 1,021 997 1.0 0.5 0.4 0.8 0.5 0.3
Fatehgarh Sahib 171 171 170 766 813 819 0.2 0 0 0.2 0 0
Firozpur 641 654 664 2,665 2,870 2,953 3.6 2.6 2.2 3.3 2.7 2.9
Gurdaspur 440 442 439 1,571 1,772 1,647 2.6 2.5 1.9 1.3 1.1 1
Hoshiarpur 275 287 280 944 1,204 1,129 1.4 1.4 0.7 0.8 1.2 0.5
Jalandhar 333 344 342 1,329 1,486 1,425 1.4 0.6 0.7 1.3 0.6 0.7
Kapurthala 225 232 229 910 994 964 0.2 0 0 0.2 0 0
Ludhiana 513 517 516 2,354 2,485 2,418 3.5 1.8 1.8 3.0 1.6 1.5
Mansa 240 246 251 1,009 1,137 1,084 0.7 0.4 0.4 0.6 0.4 0.3
Moga 345 350 352 1,545 1,720 1,665 1.6 0.7 0.5 1.4 0.6 0.5
Patiala 494 473 469 2,135 2,211 2,050 1.9 1.4 0.6 2.0 1.8 0.8
Rupnagar (Ropar) 137 123 124 484 504 503 1.0 0.1 0.1 0.6 0.1 0.1
Sangrur 662 563 563 2,996 2,774 2,780 3.5 1.3 1.1 3.2 1.2 1.2
SAS Nagar (Mohali) 86 90 90 322 392 364 1.1 0.8 0.7 1.0 0.6 0.4
SBS Nagar (Nawanshahr)
249 146 149 573 668 667 0.2 0.1 0 0.2 0.1 0
Muktsar 286 320 328 1,223 1,441 1,471 1.1 0.5 0.5 1.1 0.7 0.6
Tarn Taran 358 359 361 1,331 1,396 1,397 2.7 1.7 1.7 2.1 1.1 1.7
*Average from 2004-05 to 2009-10.
Fazilka and Pathankot figures are included in Firozpur and Gurdaspur respectively.
Source: Ministry of Agriculture, Govt. of Punjab.
DaIRyInG In Punjab A Statistical Profile 2014 Part VII : Agriculture
116
DaIRyInG In Punjab A Statistical Profile 2014 Part VII : Agriculture
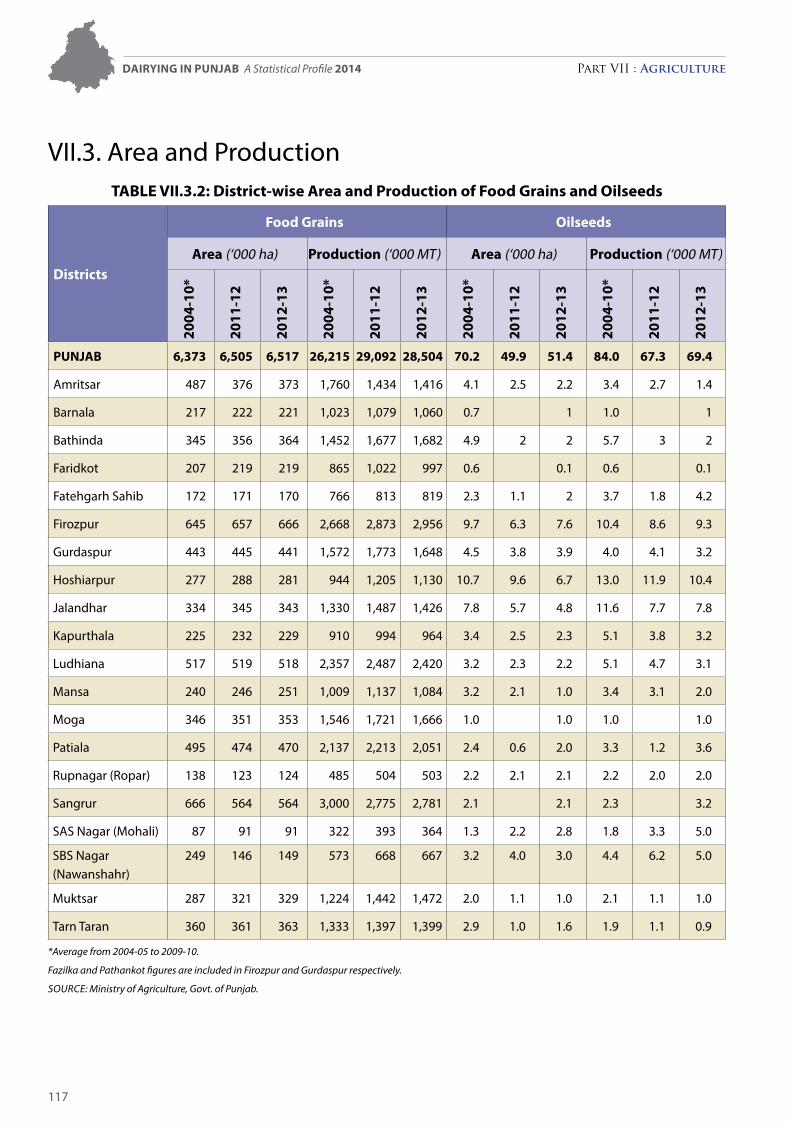
117
VII.3. Area and ProductionTable VII.3.2: District-wise area and Production of Food Grains and Oilseeds
Districts
Food Grains Oilseeds
area (‘000 ha) Production (‘000 MT) area (‘000 ha) Production (‘000 MT)
2004
-10*
2011
-12
2012
-13
2004
-10*
2011
-12
2012
-13
2004
-10*
2011
-12
2012
-13
2004
-10*
2011
-12
2012
-13
Punjab 6,373 6,505 6,517 26,215 29,092 28,504 70.2 49.9 51.4 84.0 67.3 69.4
Amritsar 487 376 373 1,760 1,434 1,416 4.1 2.5 2.2 3.4 2.7 1.4
Barnala 217 222 221 1,023 1,079 1,060 0.7 1 1.0 1
Bathinda 345 356 364 1,452 1,677 1,682 4.9 2 2 5.7 3 2
Faridkot 207 219 219 865 1,022 997 0.6 0.1 0.6 0.1
Fatehgarh Sahib 172 171 170 766 813 819 2.3 1.1 2 3.7 1.8 4.2
Firozpur 645 657 666 2,668 2,873 2,956 9.7 6.3 7.6 10.4 8.6 9.3
Gurdaspur 443 445 441 1,572 1,773 1,648 4.5 3.8 3.9 4.0 4.1 3.2
Hoshiarpur 277 288 281 944 1,205 1,130 10.7 9.6 6.7 13.0 11.9 10.4
Jalandhar 334 345 343 1,330 1,487 1,426 7.8 5.7 4.8 11.6 7.7 7.8
Kapurthala 225 232 229 910 994 964 3.4 2.5 2.3 5.1 3.8 3.2
Ludhiana 517 519 518 2,357 2,487 2,420 3.2 2.3 2.2 5.1 4.7 3.1
Mansa 240 246 251 1,009 1,137 1,084 3.2 2.1 1.0 3.4 3.1 2.0
Moga 346 351 353 1,546 1,721 1,666 1.0 1.0 1.0 1.0
Patiala 495 474 470 2,137 2,213 2,051 2.4 0.6 2.0 3.3 1.2 3.6
Rupnagar (Ropar) 138 123 124 485 504 503 2.2 2.1 2.1 2.2 2.0 2.0
Sangrur 666 564 564 3,000 2,775 2,781 2.1 2.1 2.3 3.2
SAS Nagar (Mohali) 87 91 91 322 393 364 1.3 2.2 2.8 1.8 3.3 5.0
SBS Nagar (Nawanshahr)
249 146 149 573 668 667 3.2 4.0 3.0 4.4 6.2 5.0
Muktsar 287 321 329 1,224 1,442 1,472 2.0 1.1 1.0 2.1 1.1 1.0
Tarn Taran 360 361 363 1,333 1,397 1,399 2.9 1.0 1.6 1.9 1.1 0.9
*Average from 2004-05 to 2009-10.
Fazilka and Pathankot figures are included in Firozpur and Gurdaspur respectively.
Source: Ministry of Agriculture, Govt. of Punjab.
DaIRyInG In Punjab A Statistical Profile 2014 Part VII : Agriculture
118
DaIRyInG In Punjab A Statistical Profile 2014 Part VII : Agriculture
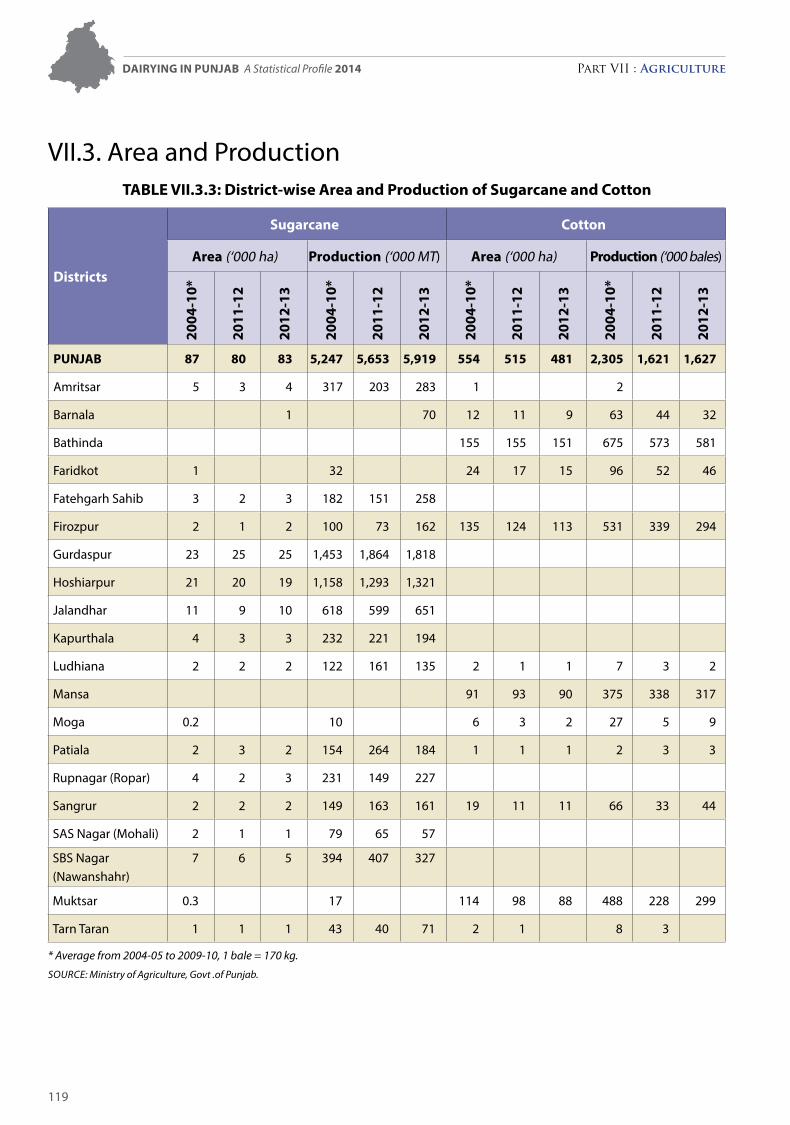
119
VII.3. Area and ProductionTable VII.3.3: District-wise area and Production of Sugarcane and Cotton
Districts
Sugarcane Cotton
area (‘000 ha) Production (‘000 MT) area (‘000 ha) Production (‘000 bales)
2004
-10*
2011
-12
2012
-13
2004
-10*
2011
-12
2012
-13
2004
-10*
2011
-12
2012
-13
2004
-10*
2011
-12
2012
-13
Punjab 87 80 83 5,247 5,653 5,919 554 515 481 2,305 1,621 1,627
Amritsar 5 3 4 317 203 283 1 2
Barnala 1 70 12 11 9 63 44 32
Bathinda 155 155 151 675 573 581
Faridkot 1 32 24 17 15 96 52 46
Fatehgarh Sahib 3 2 3 182 151 258
Firozpur 2 1 2 100 73 162 135 124 113 531 339 294
Gurdaspur 23 25 25 1,453 1,864 1,818
Hoshiarpur 21 20 19 1,158 1,293 1,321
Jalandhar 11 9 10 618 599 651
Kapurthala 4 3 3 232 221 194
Ludhiana 2 2 2 122 161 135 2 1 1 7 3 2
Mansa 91 93 90 375 338 317
Moga 0.2 10 6 3 2 27 5 9
Patiala 2 3 2 154 264 184 1 1 1 2 3 3
Rupnagar (Ropar) 4 2 3 231 149 227
Sangrur 2 2 2 149 163 161 19 11 11 66 33 44
SAS Nagar (Mohali) 2 1 1 79 65 57
SBS Nagar (Nawanshahr)
7 6 5 394 407 327
Muktsar 0.3 17 114 98 88 488 228 299
Tarn Taran 1 1 1 43 40 71 2 1 8 3
* Average from 2004-05 to 2009-10, 1 bale = 170 kg.
Source: Ministry of Agriculture, Govt .of Punjab.
DaIRyInG In Punjab A Statistical Profile 2014 Part VII : Agriculture
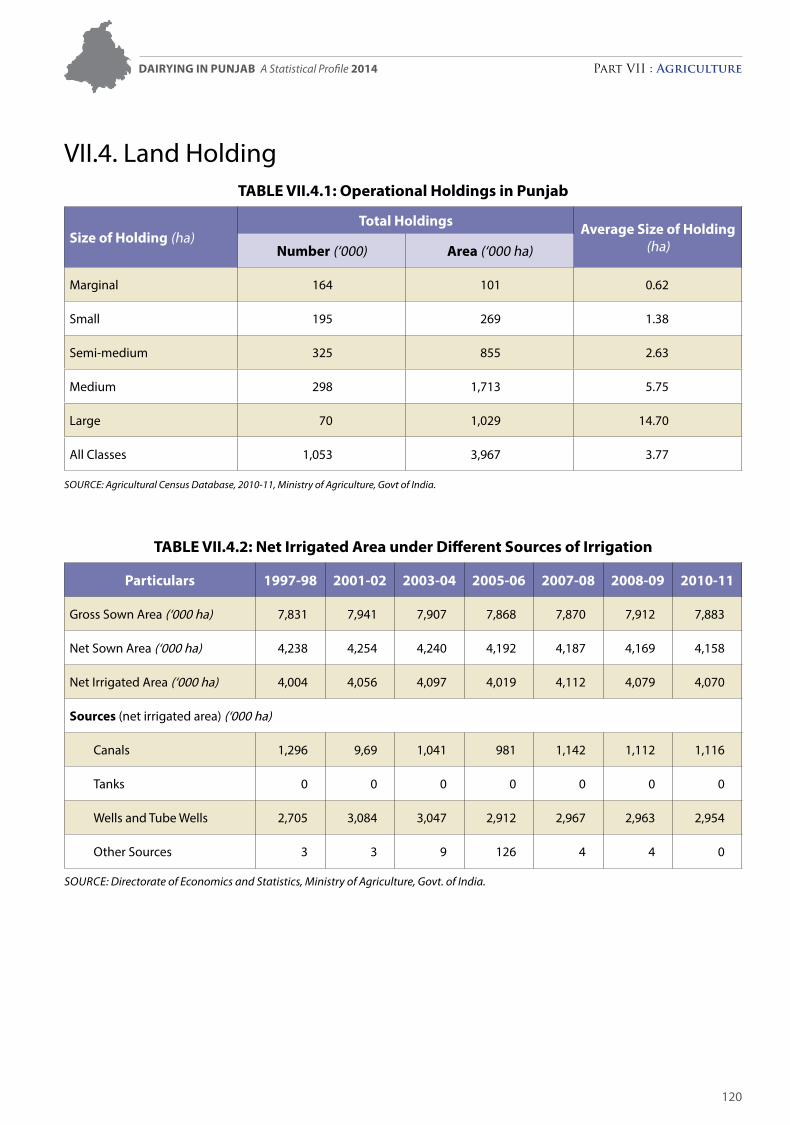
120
VII.4. Land HoldingTable VII.4.1: Operational Holdings in Punjab
Size of Holding (ha)Total Holdings average Size of Holding
(ha)number (‘000) area (‘000 ha)
Marginal 164 101 0.62
Small 195 269 1.38
Semi-medium 325 855 2.63
Medium 298 1,713 5.75
Large 70 1,029 14.70
All Classes 1,053 3,967 3.77
Source: Agricultural census Database, 2010-11, Ministry of Agriculture, Govt of India.
Table VII.4.2: net Irrigated area under Different Sources of Irrigation
Particulars 1997-98 2001-02 2003-04 2005-06 2007-08 2008-09 2010-11
Gross Sown Area (‘000 ha) 7,831 7,941 7,907 7,868 7,870 7,912 7,883
Net Sown Area (‘000 ha) 4,238 4,254 4,240 4,192 4,187 4,169 4,158
Net Irrigated Area (‘000 ha) 4,004 4,056 4,097 4,019 4,112 4,079 4,070
Sources (net irrigated area) (‘000 ha)
Canals 1,296 9,69 1,041 981 1,142 1,112 1,116
Tanks 0 0 0 0 0 0 0
Wells and Tube Wells 2,705 3,084 3,047 2,912 2,967 2,963 2,954
Other Sources 3 3 9 126 4 4 0
Source: Directorate of economics and Statistics, Ministry of Agriculture, Govt. of India.
DaIRyInG In Punjab A Statistical Profile 2014 Part VII : Agriculture
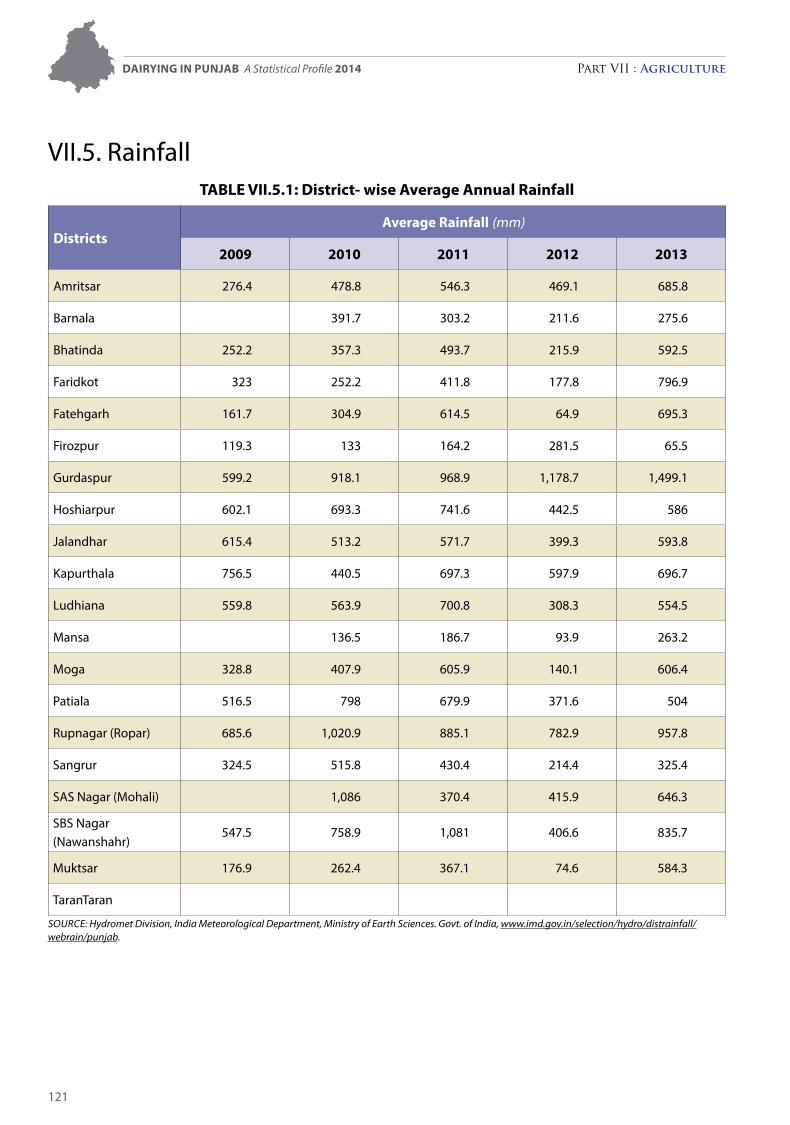
121
VII.5. RainfallTable VII.5.1: District- wise average annual Rainfall
Districtsaverage Rainfall (mm)
2009 2010 2011 2012 2013
Amritsar 276.4 478.8 546.3 469.1 685.8
Barnala 391.7 303.2 211.6 275.6
Bhatinda 252.2 357.3 493.7 215.9 592.5
Faridkot 323 252.2 411.8 177.8 796.9
Fatehgarh 161.7 304.9 614.5 64.9 695.3
Firozpur 119.3 133 164.2 281.5 65.5
Gurdaspur 599.2 918.1 968.9 1,178.7 1,499.1
Hoshiarpur 602.1 693.3 741.6 442.5 586
Jalandhar 615.4 513.2 571.7 399.3 593.8
Kapurthala 756.5 440.5 697.3 597.9 696.7
Ludhiana 559.8 563.9 700.8 308.3 554.5
Mansa 136.5 186.7 93.9 263.2
Moga 328.8 407.9 605.9 140.1 606.4
Patiala 516.5 798 679.9 371.6 504
Rupnagar (Ropar) 685.6 1,020.9 885.1 782.9 957.8
Sangrur 324.5 515.8 430.4 214.4 325.4
SAS Nagar (Mohali) 1,086 370.4 415.9 646.3
SBS Nagar (Nawanshahr)
547.5 758.9 1,081 406.6 835.7
Muktsar 176.9 262.4 367.1 74.6 584.3
TaranTaran
Source: Hydromet Division, India Meteorological Department, Ministry of earth Sciences. Govt. of India, www.imd.gov.in/selection/hydro/distrainfall/webrain/punjab.
DaIRyInG In Punjab A Statistical Profile 2014 Part VII : Agriculture
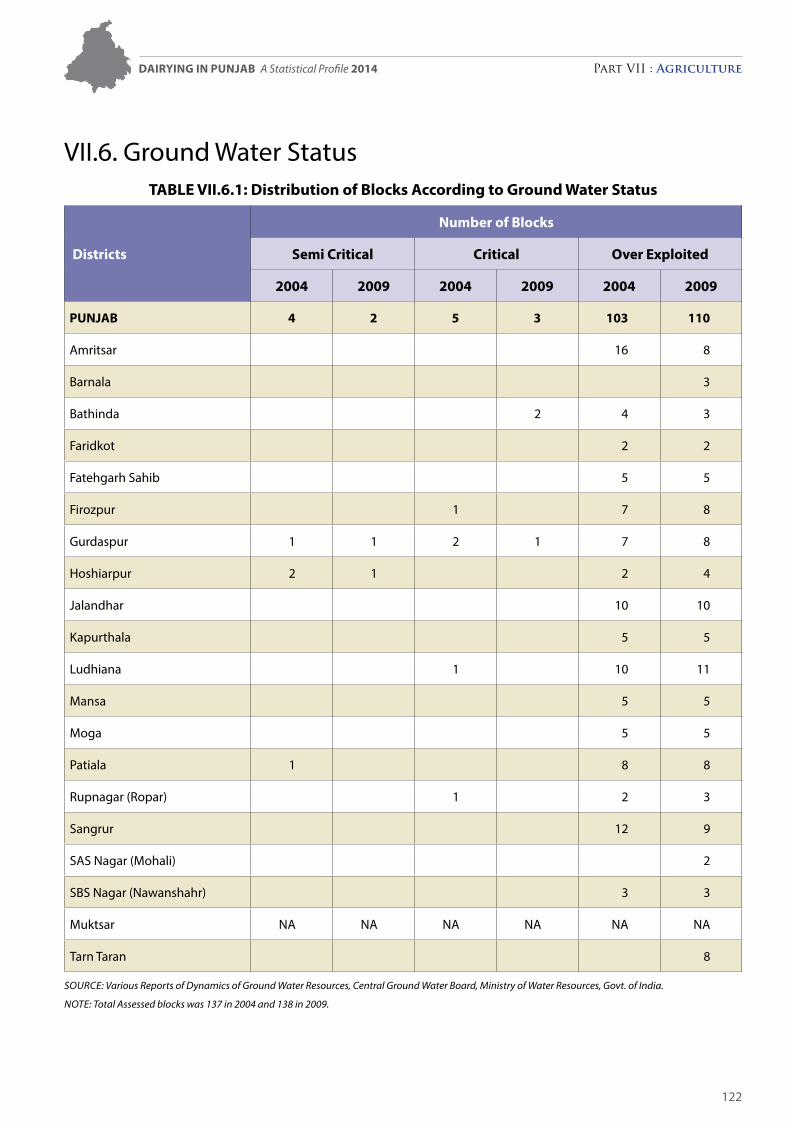
122
VII.6. Ground Water StatusTable VII.6.1: Distribution of blocks according to Ground Water Status
Districts
number of blocks
Semi Critical Critical Over exploited
2004 2009 2004 2009 2004 2009
Punjab 4 2 5 3 103 110
Amritsar 16 8
Barnala 3
Bathinda 2 4 3
Faridkot 2 2
Fatehgarh Sahib 5 5
Firozpur 1 7 8
Gurdaspur 1 1 2 1 7 8
Hoshiarpur 2 1 2 4
Jalandhar 10 10
Kapurthala 5 5
Ludhiana 1 10 11
Mansa 5 5
Moga 5 5
Patiala 1 8 8
Rupnagar (Ropar) 1 2 3
Sangrur 12 9
SAS Nagar (Mohali) 2
SBS Nagar (Nawanshahr) 3 3
Muktsar NA NA NA NA NA NA
Tarn Taran 8
Source: Various reports of Dynamics of Ground Water resources, central Ground Water Board, Ministry of Water resources, Govt. of India.
Note: total Assessed blocks was 137 in 2004 and 138 in 2009.
DaIRyInG In Punjab A Statistical Profile 2014 Part VII : Agriculture
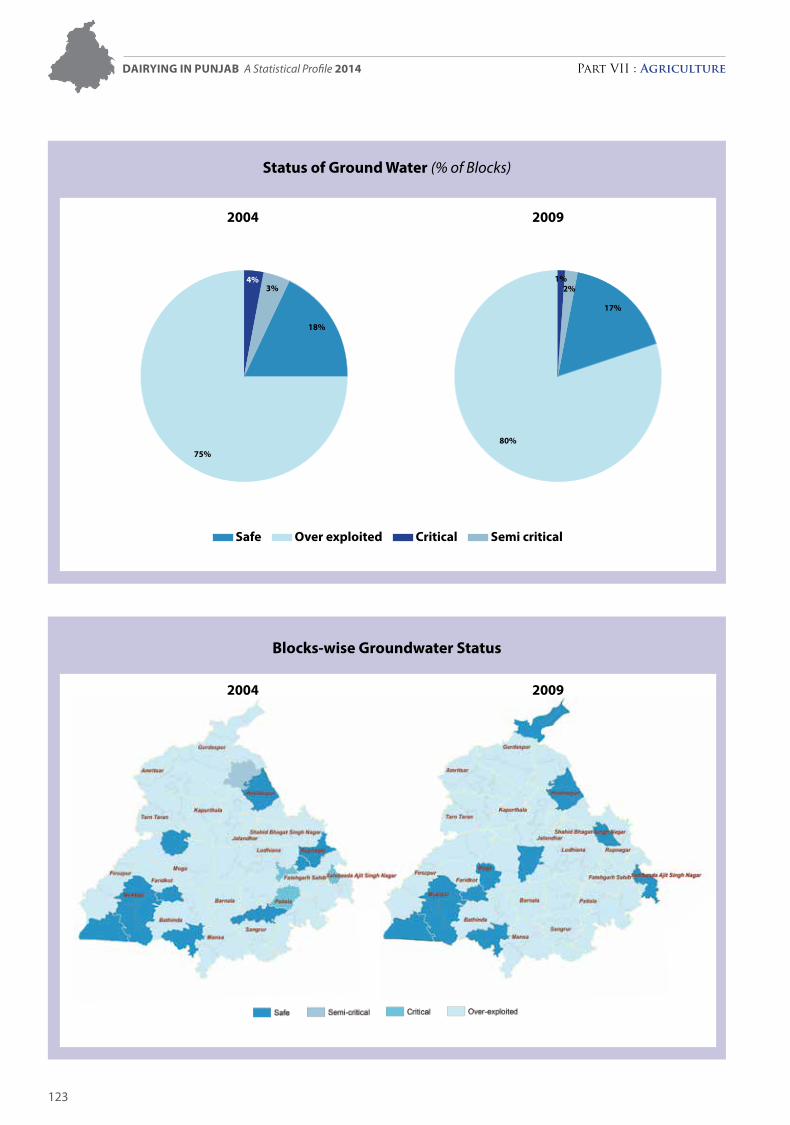
123
DaIRyInG In Punjab A Statistical Profile 2014 Part VII : Agriculture
Status of Ground Water (% of Blocks)
4%3%
18%
75%
2%1%
17%
80%
Safe Over exploited Critical Semi critical
2004 2009
blocks-wise Groundwater Status
2004 2009
124
DaIRyInG In Punjab A Statistical Profile 2014 Part VII : Agriculture
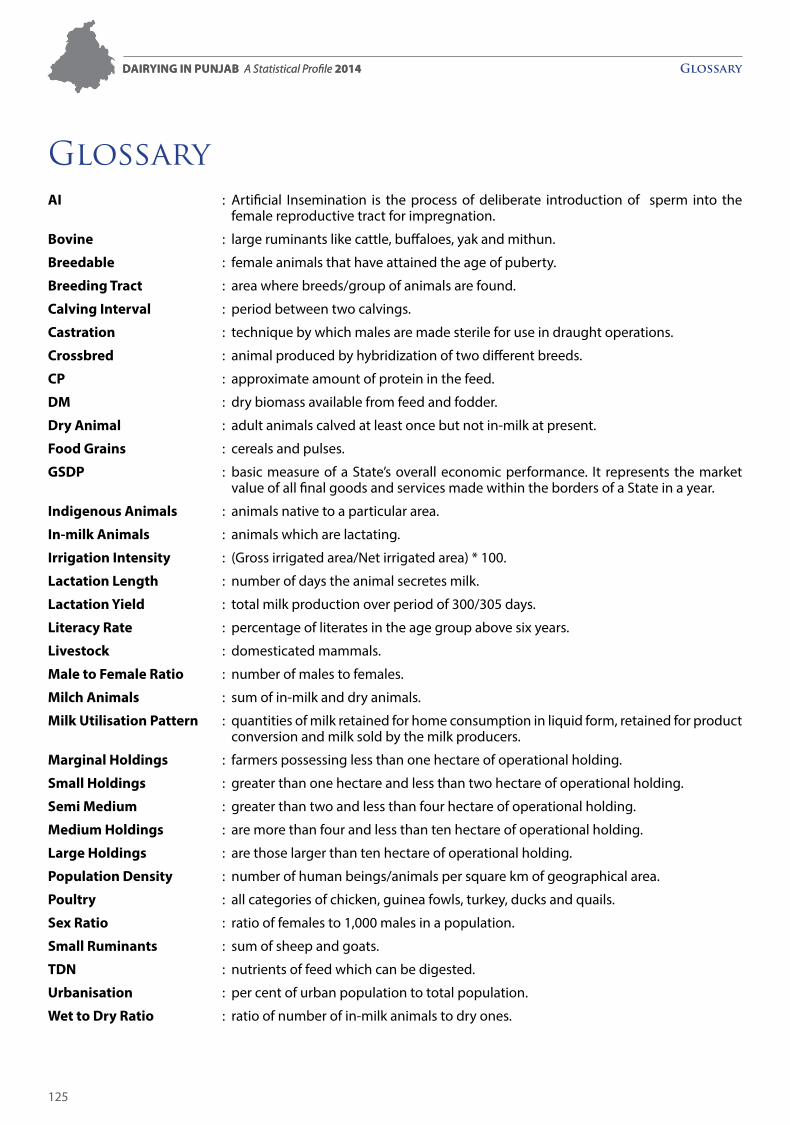
Dairying in Punjab A Statistical Profile 2014 Glossary
125
Dairying in Punjab A Statistical Profile 2014
Glossaryai : Artificial Insemination is the process of deliberate introduction of sperm into the
female reproductive tract for impregnation.
bovine : large ruminants like cattle, buffaloes, yak and mithun.
breedable : female animals that have attained the age of puberty.
breeding Tract : area where breeds/group of animals are found.
Calving interval : period between two calvings.
Castration : technique by which males are made sterile for use in draught operations.
Crossbred : animal produced by hybridization of two different breeds.
CP : approximate amount of protein in the feed.
DM : dry biomass available from feed and fodder.
Dry animal : adult animals calved at least once but not in-milk at present.
Food grains : cereals and pulses.
gSDP : basic measure of a State’s overall economic performance. It represents the market value of all final goods and services made within the borders of a State in a year.
indigenous animals : animals native to a particular area.
in-milk animals : animals which are lactating.
irrigation intensity : (Gross irrigated area/Net irrigated area) * 100.
Lactation Length : number of days the animal secretes milk.
Lactation yield : total milk production over period of 300/305 days.
Literacy rate : percentage of literates in the age group above six years.
Livestock : domesticated mammals.
Male to Female ratio : number of males to females.
Milch animals : sum of in-milk and dry animals.
Milk utilisation Pattern : quantities of milk retained for home consumption in liquid form, retained for product conversion and milk sold by the milk producers.
Marginal Holdings : farmers possessing less than one hectare of operational holding.
Small Holdings : greater than one hectare and less than two hectare of operational holding.
Semi Medium : greater than two and less than four hectare of operational holding.
Medium Holdings : are more than four and less than ten hectare of operational holding.
Large Holdings : are those larger than ten hectare of operational holding.
Population Density : number of human beings/animals per square km of geographical area.
Poultry : all categories of chicken, guinea fowls, turkey, ducks and quails.
Sex ratio : ratio of females to 1,000 males in a population.
Small ruminants : sum of sheep and goats.
TDn : nutrients of feed which can be digested.
urbanisation : per cent of urban population to total population.
Wet to Dry ratio : ratio of number of in-milk animals to dry ones.

National Dairy Development BoardAnand 388 001
GUJARATPhone : (02692) 260148 / 260149 / 260160
Fax : (02692) 260157 / 260159
Dairying In Punjab