Embed Size (px)
Citation preview
National Corruption Perception Survey 2011
28thDecember2011

Sponsors:

Contents
Page No
Foreword 06 Pakistan at a Glance 08 GALLUP Note 13 Public Encounter and Reputation of Corruption 17
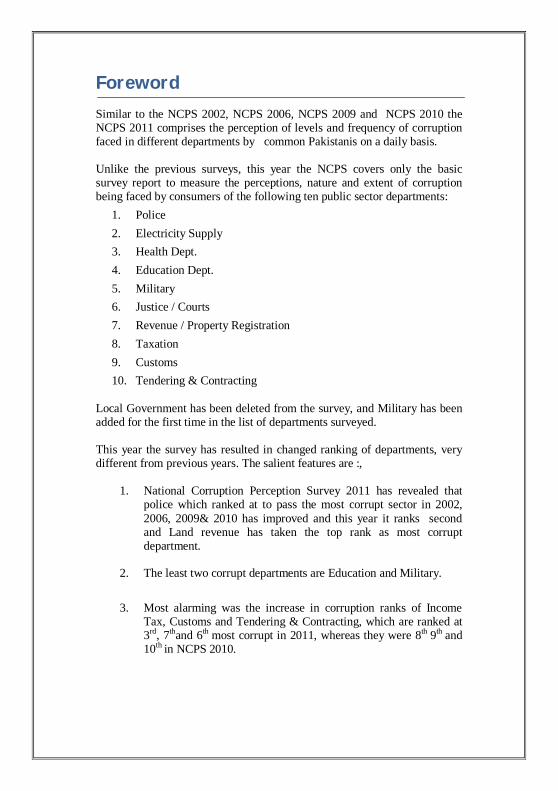
Foreword Similar to the NCPS 2002, NCPS 2006, NCPS 2009 and NCPS 2010 the NCPS 2011 comprises the perception of levels and frequency of corruption faced in different departments by common Pakistanis on a daily basis. Unlike the previous surveys, this year the NCPS covers only the basic survey report to measure the perceptions, nature and extent of corruption being faced by consumers of the following ten public sector departments:
1. Police 2. Electricity Supply 3. Health Dept. 4. Education Dept. 5. Military 6. Justice / Courts 7. Revenue / Property Registration 8. Taxation 9. Customs 10. Tendering & Contracting
Local Government has been deleted from the survey, and Military has been added for the first time in the list of departments surveyed. This year the survey has resulted in changed ranking of departments, very different from previous years. The salient features are :,
1. National Corruption Perception Survey 2011 has revealed that police which ranked at to pass the most corrupt sector in 2002, 2006, 2009& 2010 has improved and this year it ranks second and Land revenue has taken the top rank as most corrupt department.
2. The least two corrupt departments are Education and Military.
3. Most alarming was the increase in corruption ranks of Income
Tax, Customs and Tendering & Contracting, which are ranked at 3rd, 7thand 6th most corrupt in 2011, whereas they were 8th 9th and 10th in NCPS 2010.
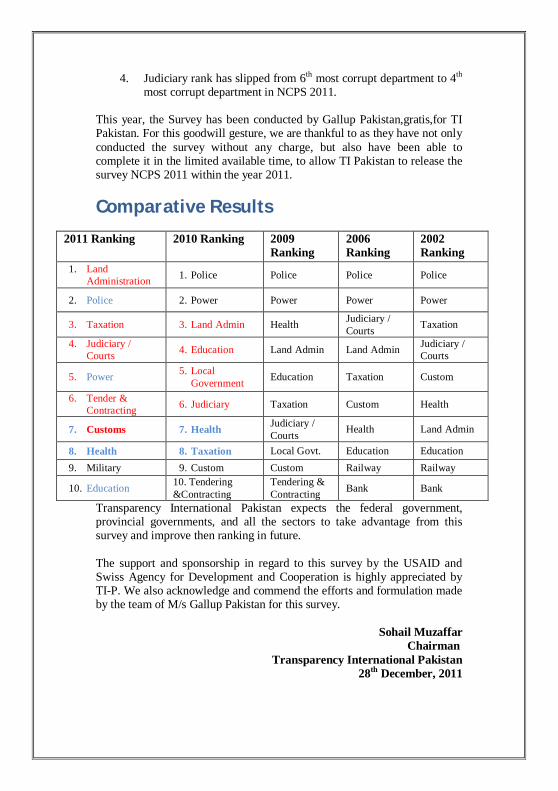
4. Judiciary rank has slipped from 6th most corrupt department to 4th most corrupt department in NCPS 2011.
This year, the Survey has been conducted by Gallup Pakistan,gratis,for TI Pakistan. For this goodwill gesture, we are thankful to as they have not only conducted the survey without any charge, but also have been able to complete it in the limited available time, to allow TI Pakistan to release the survey NCPS 2011 within the year 2011.
Comparative Results
2011 Ranking 2010 Ranking 2009 Ranking
2006 Ranking
2002 Ranking
1. Land Administration 1. Police Police Police Police
2. Police 2. Power Power Power Power
3. Taxation 3. Land Admin Health Judiciary / Courts Taxation
4. Judiciary / Courts 4. Education Land Admin Land Admin Judiciary /
Courts
5. Power 5. Local Government Education Taxation Custom
6. Tender & Contracting 6. Judiciary Taxation Custom Health
7. Customs 7. Health Judiciary / Courts Health Land Admin
8. Health 8. Taxation Local Govt. Education Education 9. Military 9. Custom Custom Railway Railway
10. Education 10. Tendering &Contracting
Tendering & Contracting Bank Bank
Transparency International Pakistan expects the federal government, provincial governments, and all the sectors to take advantage from this survey and improve then ranking in future. The support and sponsorship in regard to this survey by the USAID and Swiss Agency for Development and Cooperation is highly appreciated by TI-P. We also acknowledge and commend the efforts and formulation made by the team of M/s Gallup Pakistan for this survey.
Sohail Muzaffar Chairman
Transparency International Pakistan 28th December, 2011
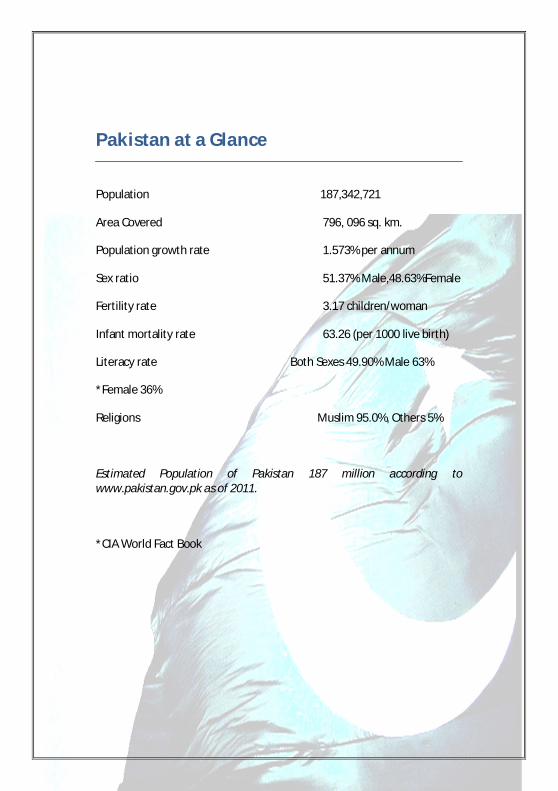
Pakistan at a Glance
Population 187,342,721
Area Covered 796, 096 sq. km.
Population growth rate 1.573% per annum
Sex ratio 51.37% Male,48.63%Female
Fertility rate 3.17 children/woman
Infant mortality rate 63.26 (per 1000 live birth)
Literacy rate Both Sexes 49.90% Male 63%
*Female 36%
Religions Muslim 95.0%, Others 5%
Estimated Population of Pakistan 187 million according to www.pakistan.gov.pk as of 2011.
*CIA World Fact Book
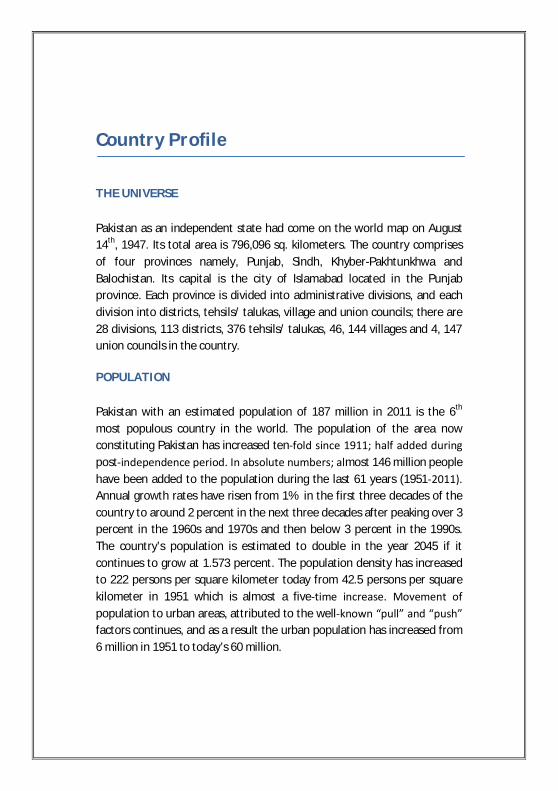
Country Profile
THE UNIVERSE Pakistan as an independent state had come on the world map on August 14th, 1947. Its total area is 796,096 sq. kilometers. The country comprises of four provinces namely, Punjab, Sindh, Khyber-Pakhtunkhwa and Balochistan. Its capital is the city of Islamabad located in the Punjab province. Each province is divided into administrative divisions, and each division into districts, tehsils/ talukas, village and union councils; there are 28 divisions, 113 districts, 376 tehsils/ talukas, 46, 144 villages and 4, 147 union councils in the country. POPULATION Pakistan with an estimated population of 187 million in 2011 is the 6th most populous country in the world. The population of the area now constituting Pakistan has increased ten‐fold since 1911; half added during post‐independence period. In absolute numbers; almost 146 million people have been added to the population during the last 61 years (1951‐2011). Annual growth rates have risen from 1% in the first three decades of the country to around 2 percent in the next three decades after peaking over 3 percent in the 1960s and 1970s and then below 3 percent in the 1990s. The country’s population is estimated to double in the year 2045 if it continues to grow at 1.573 percent. The population density has increased to 222 persons per square kilometer today from 42.5 persons per square kilometer in 1951 which is almost a five‐time increase. Movement of population to urban areas, attributed to the well‐known “pull” and “push” factors continues, and as a result the urban population has increased from 6 million in 1951 to today’s 60 million.
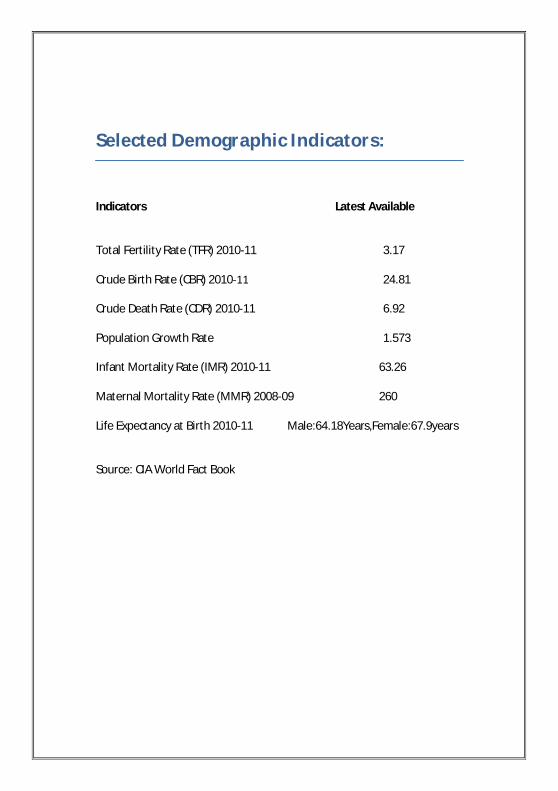
Selected Demographic Indicators:
Indicators Latest Available
Total Fertility Rate (TFR) 2010-11 3.17
Crude Birth Rate (CBR) 2010‐11 24.81
Crude Death Rate (CDR) 2010-11 6.92
Population Growth Rate 1.573
Infant Mortality Rate (IMR) 2010-11 63.26
Maternal Mortality Rate (MMR) 2008-09 260
Life Expectancy at Birth 2010-11 Male:64.18Years,Female:67.9years
Source: CIA World Fact Book
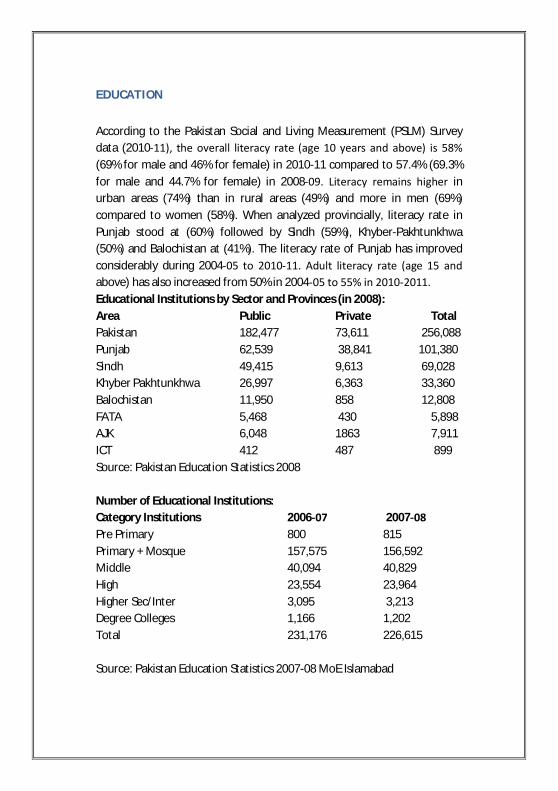
EDUCATION According to the Pakistan Social and Living Measurement (PSLM) Survey data (2010‐11), the overall literacy rate (age 10 years and above) is 58% (69% for male and 46% for female) in 2010-11 compared to 57.4% (69.3% for male and 44.7% for female) in 2008‐09. Literacy remains higher in urban areas (74%) than in rural areas (49%) and more in men (69%) compared to women (58%). When analyzed provincially, literacy rate in Punjab stood at (60%) followed by Sindh (59%), Khyber-Pakhtunkhwa (50%) and Balochistan at (41%). The literacy rate of Punjab has improved considerably during 2004‐05 to 2010‐11. Adult literacy rate (age 15 and above) has also increased from 50% in 2004‐05 to 55% in 2010‐2011. Educational Institutions by Sector and Provinces (in 2008): Area Public Private Total Pakistan 182,477 73,611 256,088 Punjab 62,539 38,841 101,380 Sindh 49,415 9,613 69,028 Khyber Pakhtunkhwa 26,997 6,363 33,360 Balochistan 11,950 858 12,808 FATA 5,468 430 5,898 AJK 6,048 1863 7,911 ICT 412 487 899 Source: Pakistan Education Statistics 2008 Number of Educational Institutions: Category Institutions 2006‐07 2007‐08 Pre Primary 800 815 Primary + Mosque 157,575 156,592 Middle 40,094 40,829 High 23,554 23,964 Higher Sec/Inter 3,095 3,213 Degree Colleges 1,166 1,202 Total 231,176 226,615 Source: Pakistan Education Statistics 2007-08 MoE Islamabad
HEALTH
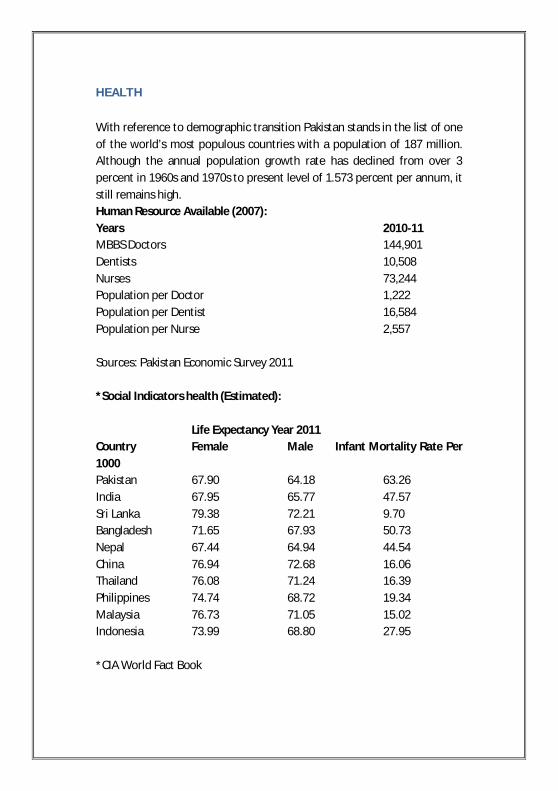
With reference to demographic transition Pakistan stands in the list of one of the world’s most populous countries with a population of 187 million. Although the annual population growth rate has declined from over 3 percent in 1960s and 1970s to present level of 1.573 percent per annum, it still remains high. Human Resource Available (2007): Years 2010-11 MBBS Doctors 144,901 Dentists 10,508 Nurses 73,244 Population per Doctor 1,222 Population per Dentist 16,584 Population per Nurse 2,557 Sources: Pakistan Economic Survey 2011 *Social Indicators health (Estimated):
Life Expectancy Year 2011 Country Female Male Infant Mortality Rate Per 1000 Pakistan 67.90 64.18 63.26 India 67.95 65.77 47.57 Sri Lanka 79.38 72.21 9.70 Bangladesh 71.65 67.93 50.73 Nepal 67.44 64.94 44.54 China 76.94 72.68 16.06 Thailand 76.08 71.24 16.39 Philippines 74.74 68.72 19.34 Malaysia 76.73 71.05 15.02 Indonesia 73.99 68.80 27.95 *CIA World Fact Book

GALLUP Pakistan Note
A study on
REPUTATION OF CORRUPTION Among users of various public services in Pakistan
Methodology:
This is based on a nationally representative survey of over 2,500 Pakistani
men and women adults. The sample is a cross-section of rural and urban
areas of all four provinces of the country and includes persons of various
age, education and linguistic backgrounds. The field work was conducted
during October 2011. The mode of interview was in-home face to face. The
error margin for a sample of this size is + 3-5% at 95% confidence level.
Introduction
The focus of this study is on Reputation of corruption among the users of
various services in the country. These services include those which are
generally considered to deliver a private service, such as Education,
Health, Electricity supply or a public service such as Police, Justice /
Courts, Military, Revenue authorities, Taxation and Customs.
They also involve activities in which a party enters into a contact to deliver
services to another.
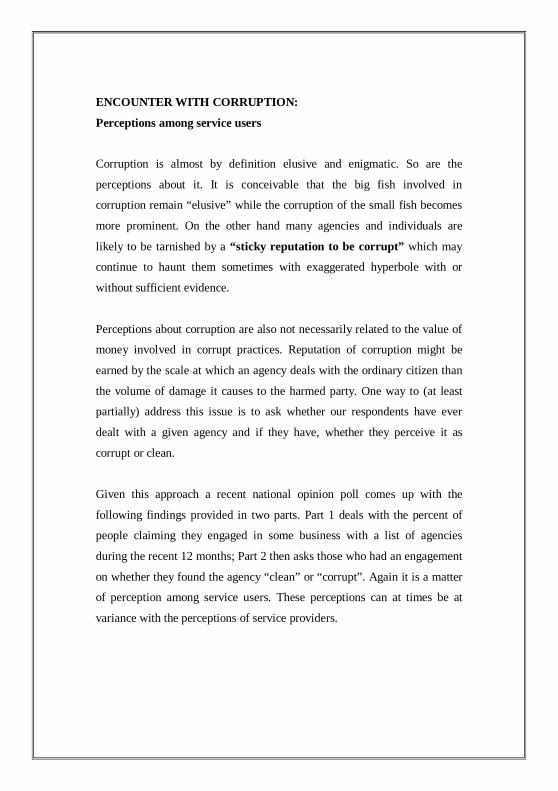
ENCOUNTER WITH CORRUPTION:
Perceptions among service users
Corruption is almost by definition elusive and enigmatic. So are the
perceptions about it. It is conceivable that the big fish involved in
corruption remain “elusive” while the corruption of the small fish becomes
more prominent. On the other hand many agencies and individuals are
likely to be tarnished by a “sticky reputation to be corrupt” which may
continue to haunt them sometimes with exaggerated hyperbole with or
without sufficient evidence.
Perceptions about corruption are also not necessarily related to the value of
money involved in corrupt practices. Reputation of corruption might be
earned by the scale at which an agency deals with the ordinary citizen than
the volume of damage it causes to the harmed party. One way to (at least
partially) address this issue is to ask whether our respondents have ever
dealt with a given agency and if they have, whether they perceive it as
corrupt or clean.
Given this approach a recent national opinion poll comes up with the
following findings provided in two parts. Part 1 deals with the percent of
people claiming they engaged in some business with a list of agencies
during the recent 12 months; Part 2 then asks those who had an engagement
on whether they found the agency “clean” or “corrupt”. Again it is a matter
of perception among service users. These perceptions can at times be at
variance with the perceptions of service providers.
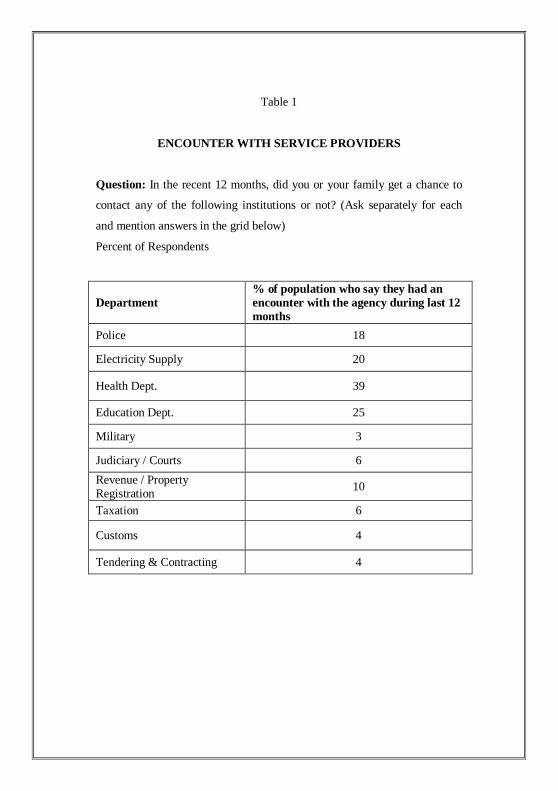
Table 1
ENCOUNTER WITH SERVICE PROVIDERS
Question: In the recent 12 months, did you or your family get a chance to
contact any of the following institutions or not? (Ask separately for each
and mention answers in the grid below)
Percent of Respondents
Department % of population who say they had an encounter with the agency during last 12 months
Police 18
Electricity Supply 20
Health Dept. 39
Education Dept. 25
Military 3
Judiciary / Courts 6 Revenue / Property Registration 10
Taxation 6
Customs 4
Tendering & Contracting 4

Table 2
REPUTATION OF CORRUPTION
Among Service Users
Question: Only ask about those institutions for which the respondent said
they encountered the Dept. during last 12 months)
Department % of encountered population which says 'I felt compelled to pay a bribe'
Police 54
Electricity Supply 45
Health Dept 15
Education Dept 9
Military 11
Judiciary / Courts 46
Revenue / Property Registration 62
Taxation 52
Customs 26
Tendering & Contracting 43
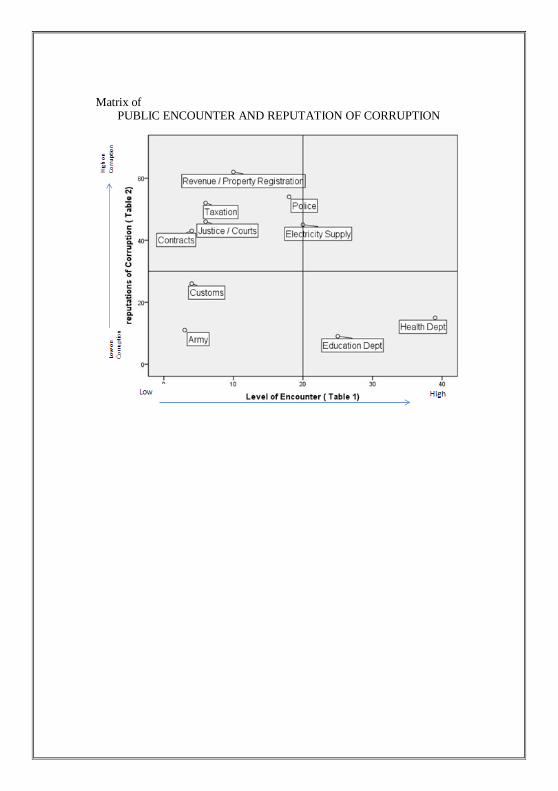
Matrix of PUBLIC ENCOUNTER AND REPUTATION OF CORRUPTION

Department
% of population who say they had an encounter with the agency during last 12 months
% of encountered population which says 'I felt compelled to pay a bribe'
Police 18 54
Electricity Supply 20 45
Health Dept 39 15
Education Dept 25 9
Military 3 11
Judiciary / Courts 6 46 Revenue / Property Registration 10 62
Taxation 6 52
Customs 4 26 Tendering & Contracting 4 43
We have chosen 10 Agencies which deliver various kinds of services to Pakistani citizens. These services encompass personal services such as health and education as well as public services such as police and justice / courts. Some of these services have low contact with the average citizen (customs) others have high level of contact such as Health department and Police. Furthermore some have a poor reputation and are seen as corrupt. Others enjoy a relatively favourable reputation. Based on our survey findings we have classified the various agencies under four groups: Group # 1: High Contact and Good Reputation Group # 2: Low Contact and Good Reputation Group # 3: Low Contact and Poor Reputation Group # 4: High Contact and Poor Reputation We find it interactive to analyze the problems of corruption distinctly for each of the four groups. While this study provides the classification subsequent studies might move ahead to identify further areas to be probed within each group.

Board of Trustees 1. Mr. Sohail Muzaffar Chairman 2. Ms. Yasmeen Lari. 3. Mr. Khurram S Abbas. 4. Justice (R) Dr. Ghous Muhammad. 5. Mr. Javed Farooq 6. Mr. Wajid Jawad. 7. Dr.Ayesha Siddiqa. 8. Mr. Muhammad Hidayatullah 9. Justice (R) Nasira Javed Iqbal.
Advisory Committee 1. Mr. Syed Adil Gilani 2. Mr. Khursheed Anwar 3. Ms. Shahana Kaukab 4. Mr. Syed Saleem Ahmad 5. Mr Abid Shaikh 6. Mr. Khalid Parwez Executive Director Mr. Saad Rashid
TRANSPARENCY INTERNATIONAL-PAKISTAN 5-C, 2ND FLOOR, KHYABAN-E-ITTEHAD,PHASE VII, DEFENCE HOUSING AUTHORITY, KARACHI PHONE : (0092-21) 35390408-9 35311897-8 FAX : (0092-21) 35390410 E-MAIL : [email protected] WEBSITE : www.transparency.org.pk