Embed Size (px)
Citation preview
28
African Governance Report IV
CHAPTER
Why are current perception-based measures of corruption inadequate for Africa?
2
Measuring corruption in Africa: The international dimension matters
29
Chapter 1 highlighted the importance of tackling corruption, in particular the need to reconsider its measurement in the context of Africa.
Current perception-based measures of corruption are inadequate in providing a credible assessment, given the specificities of the African context. While it is important to review how African countries have performed against these measures, to understand the implications for policy development and institutional building, the question for Africa’s policymakers is: what is the usefulness or otherwise of such perception-based measures, noting that a wider governance agenda must be brought into the debate? In order to answer this question it is critical to assess the conceptual and methodological frameworks underpinning most corruption measurements. In addition, it is equally critical to understand the main limitations of popular corruption measurements. There is, therefore, a need to move away from naming and shaming and ranking countries, which does not provide useful policy insights and recommendations to inform policy reforms.
A. What are perception-based measurements of corruption and what methodologies do they use?
Definitional ambiguity impacts on measurement of corruptionCorrupt practices are carried out behind closed doors and away from the eyes of the general public, which makes measuring corruption difficult. Furthermore, the perception of corruption varies from country to country and from region to region. What is clearly labelled as a corrupt practice in advanced economies may fall in a grey area in Africa, and may even be an outright acceptable practice in other parts of the world.
Corruption takes many forms and may originate from different sources. Of critical importance is the fact that types of corruption differ from one another in terms of the source of power that is exploited and the impact on the economy and wider society. One type could be in the form of small bribes from an official in exchange for a service, while another might be the aggrandizement of society’s assets by a leader as personal property – grand or political corruption.
When it comes to bribes, the service in question would have been a right of the individual. The official has some power to impose costs (in the form of delays and opportunity costs of permit denial) on the beneficiary before granting the service. A bribe is thus demanded to reduce that cost. This form of bureaucratic corrup-tion tends to occur when a regulatory regime exists and the resource allocation decisions are made – the official in question is interfering with the implementation of decisions or the regulatory regime.
Economic models of bureaucratic corruption undertake to analyse problems of information asymmetry (to identify which agents are corrupt and which will par-ticipate in propagating corruption) and uncertainties about costs (associated with probabilities and penalties of detection, as well as with the purchase of loyalties of other agents) alongside other explanatory variables such as demand and supply factors. Rose-Ackerman (1978), Murphy, Shleifer and Vishny (1993), Dabla-Norris (2002), Ahlin and Bose (2007), and Lambert-Mogiliansky and others (2007), among many others, provide examples of such economic models. Acemoglu and Verdier (2000) illustrate the role of corruption in Governments’ attempts to correct market failures.
In political or grand corruption, the leader maximizes personal wealth rather than the welfare of the popula-tion. To do so, the leader must acquire near to complete control of political powers within the country. A portion of the wealth amassed through corruption is used to buy the loyalty of those who will help the dictator to remain in power, and to undermine civic society and the public institutions that could rise up in opposition to such breaches of the social contract. Grand corrup-tion drives misallocation of resources and an extreme degree of concentration of wealth into the hands of a few kleptocrats. Grand corruption also has the tendency of killing democratic political institutions in a country. For example, in Uganda, the lifting of the constitutional two-term presidential limit in 2011 sparked political controversy, as this coincided with the provision of funds to parliamentarians, allegedly to support their constituency development work. This action resulted in a public perception of possible political corruption.
There are many ways to view corruption other than in between the two extremes of petty and grand corrup-tion. Aidt (2003) outlines four types of corrupt activities. It is worthwhile to exclude fraud and the mere existence of poverty (or worsening of income distribution)
30
African Governance Report IV
as signs of corruption. Similarly, influencing public policy through legitimate routes, either by providing information or by making political contributions, is not necessarily evidence of corruption. Political Action Committees in the United States and similar lobbying groups in other countries have a legitimate role to play in modern democracies and their activities need not be considered corrupt. Equally, policy decisions responding to the demands of specific voting groups, and hence in the personal interest of a politician, may not be considered corrupt.
The definitional ambiguity surrounding the concept of corruption is particularly unsettling when attempts are made to measure it. The type of definition one chooses to describe corruption will influence the conceptual, methodological and empirical framework adopted to analyse it. In this regard, it is unsurprising that the drafters of the United Nations Convention against Corruption experienced difficulties when trying to come up with a definition of corruption: “It was decided that the text of the Convention would not include a definition of corruption, as this is a polyvalent and changeable term that means different things to different people, and above all because it is an evolving concept” (Argandona, 2006, pp. 5).
The effects of corruption on the economy can be sum-marized as follows: higher prices for consumers; reduced tax revenue; Governments’ inability to finance budget expenditures; and substandard public infrastructure and its poor maintenance. Corruption also leads to uncertainty in economic transactions, whilst undermin-ing the people’s trust in its institutions and leadership.
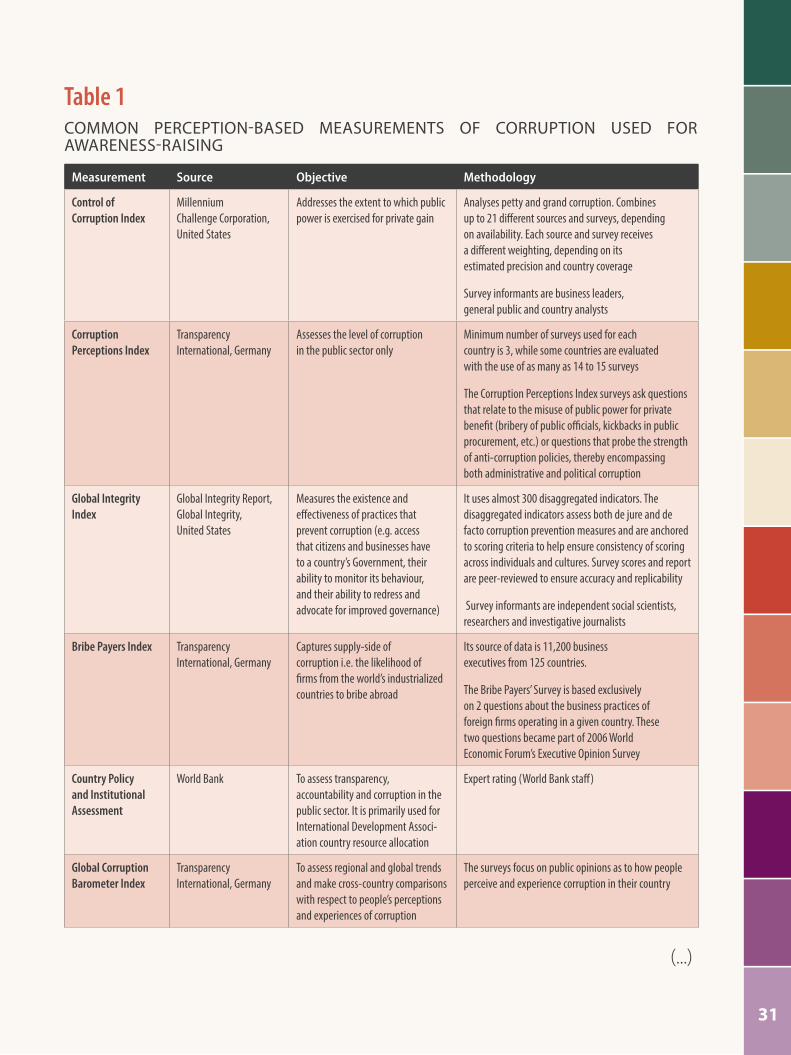
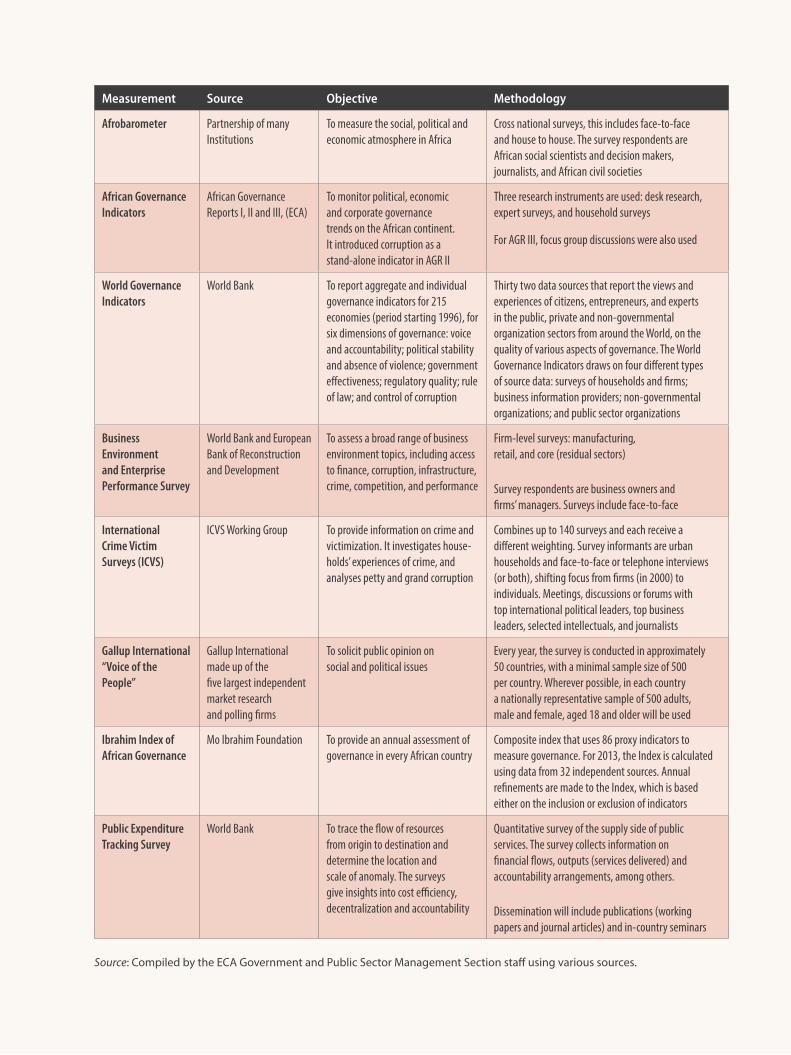
Awareness-raising on corruption through country rankingsRealizing the impacts of corruption on development, practitioners have sought to raise awareness in the general public and policymakers. The most widely used approach has been to rank countries by how corrupt they are, using various statistical proxies. Annual reports on corruption have led to heated debates and in the process have placed corruption at the centre of public policy debates in developing countries. As this chapter will demonstrate, corruption measurements are only useful for raising awareness as opposed to pol-icymaking, given the difficulty of measuring it precisely.
Transparency International has led the way by attempt-ing to quantify and qualify corruption through its annual publication of the Corruption Perceptions Index. As Johnston (2005, p. xi) states: “I have methodological reservations about Transparency International’s famous Corruption Perceptions Index […] but I also have great respect for what Transparency International – and its index – have done to put corruption issues on page one and keep them there”.
The World Bank, along with many others, has also entered the crowded field of measuring corruption, through its World Governance Indicators. There are numerous measurements of corruption developed by private firms specializing in political and economic risk analysis. These include the Economist Intelligence Unit and Business International (now a part of the Economist group). Others are produced by advocacy groups (e.g. World Economic Forum and Freedom House); opinion-poll firms (e.g. Gallup), media houses (e.g. The Wall Street Journal), and groups of analysts, sometimes working in collaboration with international organiza-tions and agencies (see table 1). The literature highlights that the Corruption Perceptions Index contributes to awareness-raising and gives a reasonable signal on the overall extent of corruption within countries (Heywood and Rose, 2014). Such awareness-raising has in turn contributed to bringing corruption to the forefront of the development agenda. For example, in South Africa, following the country’s considerable slippage in the Corruption Perceptions Index rankings over time, Corruption Watch has become more assertive in leading anti-corruption campaigns.
Monitoring the general movements of indicators over time is critical to the efforts in evaluating the
“
”
The literature highlights that the Corruption Perceptions Index
contributes to awareness-raising and
gives a reasonable signal on the overall extent of corruption
within countries.
Measuring corruption in Africa: The international dimension matters
31
Table 1COMMON PERCEPTION-BASED MEASUREMENTS OF CORRUPTION USED FOR AWARENESS-RAISING
Measurement Source Objective Methodology
Control of Corruption Index
Millennium Challenge Corporation, United States
Addresses the extent to which public power is exercised for private gain
Analyses petty and grand corruption. Combines up to 21 different sources and surveys, depending on availability. Each source and survey receives a different weighting, depending on its estimated precision and country coverage
Survey informants are business leaders, general public and country analysts
Corruption Perceptions Index
Transparency International, Germany
Assesses the level of corruption in the public sector only
Minimum number of surveys used for each country is 3, while some countries are evaluated with the use of as many as 14 to 15 surveys
The Corruption Perceptions Index surveys ask questions that relate to the misuse of public power for private benefit (bribery of public officials, kickbacks in public procurement, etc.) or questions that probe the strength of anti-corruption policies, thereby encompassing both administrative and political corruption
Global Integrity Index
Global Integrity Report, Global Integrity, United States
Measures the existence and effectiveness of practices that prevent corruption (e.g. access that citizens and businesses have to a country’s Government, their ability to monitor its behaviour, and their ability to redress and advocate for improved governance)
It uses almost 300 disaggregated indicators. The disaggregated indicators assess both de jure and de facto corruption prevention measures and are anchored to scoring criteria to help ensure consistency of scoring across individuals and cultures. Survey scores and report are peer-reviewed to ensure accuracy and replicability
Survey informants are independent social scientists, researchers and investigative journalists
Bribe Payers Index Transparency International, Germany
Captures supply-side of corruption i.e. the likelihood of firms from the world’s industrialized countries to bribe abroad
Its source of data is 11,200 business executives from 125 countries.
The Bribe Payers’ Survey is based exclusively on 2 questions about the business practices of foreign firms operating in a given country. These two questions became part of 2006 World Economic Forum’s Executive Opinion Survey
Country Policy and Institutional Assessment
World Bank To assess transparency, accountability and corruption in the public sector. It is primarily used for International Development Associ-ation country resource allocation
Expert rating (World Bank staff)
Global Corruption Barometer Index
Transparency International, Germany
To assess regional and global trends and make cross-country comparisons with respect to people’s perceptions and experiences of corruption
The surveys focus on public opinions as to how people perceive and experience corruption in their country
(...)
32
African Governance Report IV
Measurement Source Objective Methodology
Afrobarometer Partnership of many Institutions
To measure the social, political and economic atmosphere in Africa
Cross national surveys, this includes face-to-face and house to house. The survey respondents are African social scientists and decision makers, journalists, and African civil societies
African Governance Indicators
African Governance Reports I, II and III, (ECA)
To monitor political, economic and corporate governance trends on the African continent. It introduced corruption as a stand-alone indicator in AGR II
Three research instruments are used: desk research, expert surveys, and household surveys
For AGR III, focus group discussions were also used
World Governance Indicators
World Bank To report aggregate and individual governance indicators for 215 economies (period starting 1996), for six dimensions of governance: voice and accountability; political stability and absence of violence; government effectiveness; regulatory quality; rule of law; and control of corruption
Thirty two data sources that report the views and experiences of citizens, entrepreneurs, and experts in the public, private and non-governmental organization sectors from around the World, on the quality of various aspects of governance. The World Governance Indicators draws on four different types of source data: surveys of households and firms; business information providers; non-governmental organizations; and public sector organizations
Business Environment and Enterprise Performance Survey
World Bank and European Bank of Reconstruction and Development
To assess a broad range of business environment topics, including access to finance, corruption, infrastructure, crime, competition, and performance
Firm-level surveys: manufacturing, retail, and core (residual sectors)
Survey respondents are business owners and firms’ managers. Surveys include face-to-face
International Crime Victim Surveys (ICVS)
ICVS Working Group To provide information on crime and victimization. It investigates house-holds’ experiences of crime, and analyses petty and grand corruption
Combines up to 140 surveys and each receive a different weighting. Survey informants are urban households and face-to-face or telephone interviews (or both), shifting focus from firms (in 2000) to individuals. Meetings, discussions or forums with top international political leaders, top business leaders, selected intellectuals, and journalists
Gallup International “Voice of the People”
Gallup International made up of the five largest independent market research and polling firms
To solicit public opinion on social and political issues
Every year, the survey is conducted in approximately 50 countries, with a minimal sample size of 500 per country. Wherever possible, in each country a nationally representative sample of 500 adults, male and female, aged 18 and older will be used
Ibrahim Index of African Governance
Mo Ibrahim Foundation To provide an annual assessment of governance in every African country
Composite index that uses 86 proxy indicators to measure governance. For 2013, the Index is calculated using data from 32 independent sources. Annual refinements are made to the Index, which is based either on the inclusion or exclusion of indicators
Public Expenditure Tracking Survey
World Bank To trace the flow of resources from origin to destination and determine the location and scale of anomaly. The surveys give insights into cost efficiency, decentralization and accountability
Quantitative survey of the supply side of public services. The survey collects information on financial flows, outputs (services delivered) and accountability arrangements, among others.
Dissemination will include publications (working papers and journal articles) and in-country seminars
Source: Compiled by the ECA Government and Public Sector Management Section staff using various sources.
Measuring corruption in Africa: The international dimension matters
33
effectiveness of anti-corruption interventions at the national level. Measurements of corruption also serve as a diagnostic tool for international financial institutions, enabling them to evaluate the progress they are making in their engagement with developing countries. It is interesting to note that historically, almost all institutions producing these indicators were based in developed countries. In the past few years, however, some attempts have been made by institu-tions such as ECA14 and the African Development Bank to “Africanize” the design and the application of corrup-tion measurement instruments. There is therefore an increasing realization that an African perspective on the issue of measuring corruption is critical in shaping the structural transformation debate.
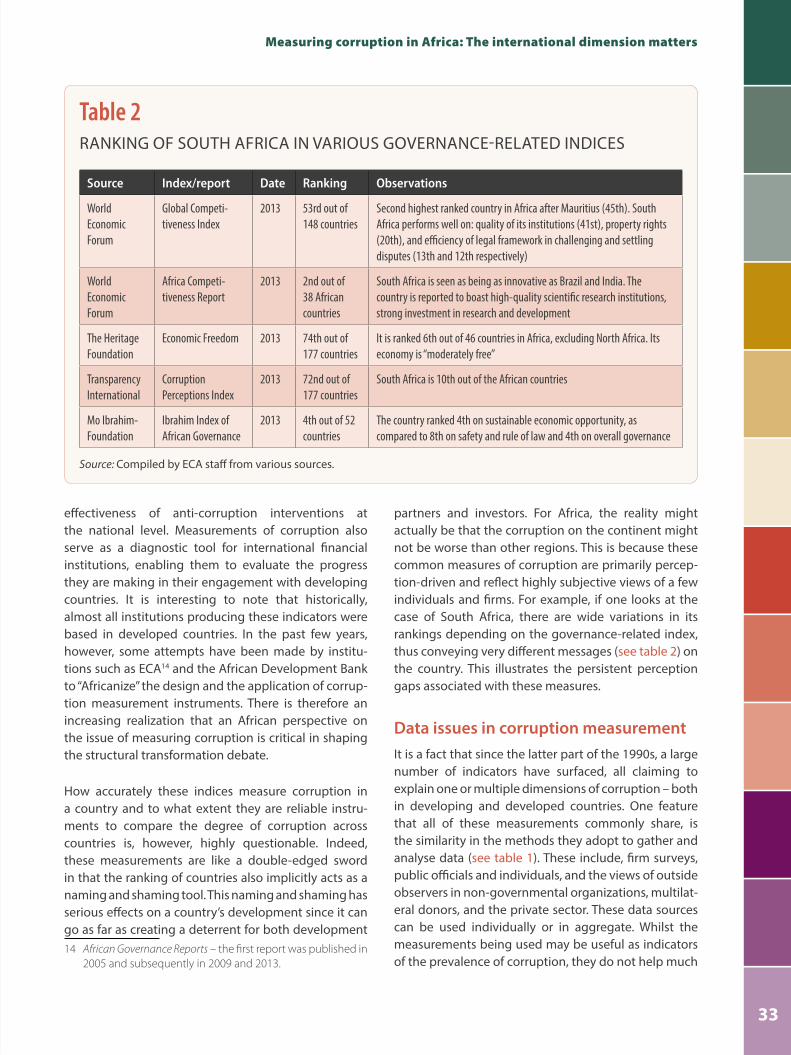
How accurately these indices measure corruption in a country and to what extent they are reliable instru-ments to compare the degree of corruption across countries is, however, highly questionable. Indeed, these measurements are like a double-edged sword in that the ranking of countries also implicitly acts as a naming and shaming tool. This naming and shaming has serious effects on a country’s development since it can go as far as creating a deterrent for both development 14 African Governance Reports – the first report was published in
2005 and subsequently in 2009 and 2013.
partners and investors. For Africa, the reality might actually be that the corruption on the continent might not be worse than other regions. This is because these common measures of corruption are primarily percep-tion-driven and reflect highly subjective views of a few individuals and firms. For example, if one looks at the case of South Africa, there are wide variations in its rankings depending on the governance-related index, thus conveying very different messages (see table 2) on the country. This illustrates the persistent perception gaps associated with these measures.
Data issues in corruption measurementIt is a fact that since the latter part of the 1990s, a large number of indicators have surfaced, all claiming to explain one or multiple dimensions of corruption – both in developing and developed countries. One feature that all of these measurements commonly share, is the similarity in the methods they adopt to gather and analyse data (see table 1). These include, firm surveys, public officials and individuals, and the views of outside observers in non-governmental organizations, multilat-eral donors, and the private sector. These data sources can be used individually or in aggregate. Whilst the measurements being used may be useful as indicators of the prevalence of corruption, they do not help much
Table 2 RANKING OF SOUTH AFRICA IN VARIOUS GOVERNANCE-RELATED INDICES
Source Index/report Date Ranking Observations
World Economic Forum
Global Competi-tiveness Index
2013 53rd out of 148 countries
Second highest ranked country in Africa after Mauritius (45th). South Africa performs well on: quality of its institutions (41st), property rights (20th), and efficiency of legal framework in challenging and settling disputes (13th and 12th respectively)
World Economic Forum
Africa Competi-tiveness Report
2013 2nd out of 38 African countries
South Africa is seen as being as innovative as Brazil and India. The country is reported to boast high-quality scientific research institutions, strong investment in research and development
The Heritage Foundation
Economic Freedom 2013 74th out of 177 countries
It is ranked 6th out of 46 countries in Africa, excluding North Africa. Its economy is “moderately free”
Transparency International
Corruption Perceptions Index
2013 72nd out of 177 countries
South Africa is 10th out of the African countries
Mo Ibrahim-Foundation
Ibrahim Index of African Governance
2013 4th out of 52 countries
The country ranked 4th on sustainable economic opportunity, as compared to 8th on safety and rule of law and 4th on overall governance
Source: Compiled by ECA staff from various sources.
34
African Governance Report IV
by way of advancing policy reforms in Africa. Critics cast doubt over their methodological approach and reliability of data sources.
Current corruption indicators do not present a reliable picture of the phenomenon in Africa. Most of the indices are perception-based and are highly subjective, and can even be misrepresentative of the realities on the ground. The question which arises is whether these measurements are actually capturing what they aim to capture. Most of the data are collected from victimization surveys and expert opinions, which, for the most part, measure people’s opinions of cor-ruption. There are two reasons why the victimization surveys are still perception-driven: the data reflect how people perceive the prevalence of corruption in reality and a given time; and objective data are difficult to collect or are too expensive (or both). Indeed, views of people selected to respond to survey questionnaires are shaped by media, culture, experiences, among others. The survey questions often deal with respondents’ engagement with public servants and institutions, and seem to be more concerned about how corruption affects a selected group in a society. But corruption does not affect only one group or a segment of the popula-tion; it could very well affect all categories of the society. Furthermore, as long as the results of such exercises reflect only the views of a minority, policymakers are not encouraged to push for fundamental reforms.
The corruption indices tend to be underpinned sample bias. Survey respondents are often a small circle of individuals, such as businessmen, media personalities and non-governmental employees. For any indicator of corruption to be strong and reliable, it is necessary that
the sample be homogeneous. The standard practice is that different indicators are used in the various corrup-tion indices, which are gathered from surveys based on questions to a limited sample of people. For example, business people are most likely representatives of mul-tinational companies and represent the views of only a small number of people. However, a good score for cor-ruption on the company level does not result in a good score for corruption on the private level. This means that most influential factors, such as the experience of poor and disenfranchised people, are ignored.
In the light of the data constraint, corruption indicators are also ill-suited for cross-country comparisons over time. Comparing corruption between country X and Y is like comparing apples with oranges, since each country has itsunique historical experiences and culture. For example, natural resources-rich countries are prone to certain types of corruption, which may never be experi-enced by resource-poor countries. These factors, which definitely influence public perceptions, have to be the same across countries to allow for comparisons and the ranking of countries. Results of such rankings can never be accurate, but their consequences, especially on developing countries, should never be underesti-mated. For instance, Quazi, Vemuri, and Soliman (2014), use a dynamic panel regression for 53 African countries to evaluate the effects of corruption on foreign direct investment. Interestingly, their findings show that there is a positive correlation between corruption and foreign direct investment, but which in time degenerates into a negative relationship, depending on regulatory quality.
Finally, the present corruption indicators do not capture the international dimension of corruption, which is highly prevalent in African countries. Three trends have contributed to the globalization of corruption. First, greater economic integration has increased the chances that corruption in one region or country will have an impact on the economic and political activities in other parts of the world, as demonstrated by the scandalous collapse of the Bank of Credit and Commerce International (see box 10). Second, developments in communication technology have revolutionized the international financial system and enhanced the ability of traders to engage in corruption and other IFFs. The rise of electronic fund transfers makes it difficult for countries to deal effectively with corruption and IFFs. This implies that corrupt activ-ities can be effectively hidden from the public, making it virtually impossible for such illicit funds to be recovered in the event of conviction. In this regard, policing agencies
“
”
Greater economic integration has increased
the chances that corruption in one region or country will have an
impact on the economic and political activities in other parts of the world.
Measuring corruption in Africa: The international dimension matters
35
need to innovate and come up with technology that can effectively monitor traffic in these electronic networks. Third, while continued globalization exacerbates the problem of corruption by roping many and diverse players, it also offers opportunities for its control.
B. How have African countries performed over the years based on the perception measures?
Transparency International’s Corruption Perceptions Index is the most popular measure of corruption. In terms of visibility, the most direct competitor of the
Index is arguably the World Bank’s Control of Corruption indicator. Simple Google searches indicate very different levels of visibility, with over 400,000 results for the “Corruption Perceptions Index”, and only about 27,000 for the “corruption control index” (the “corruption control indicator” delivers fewer than 6,000 hits).
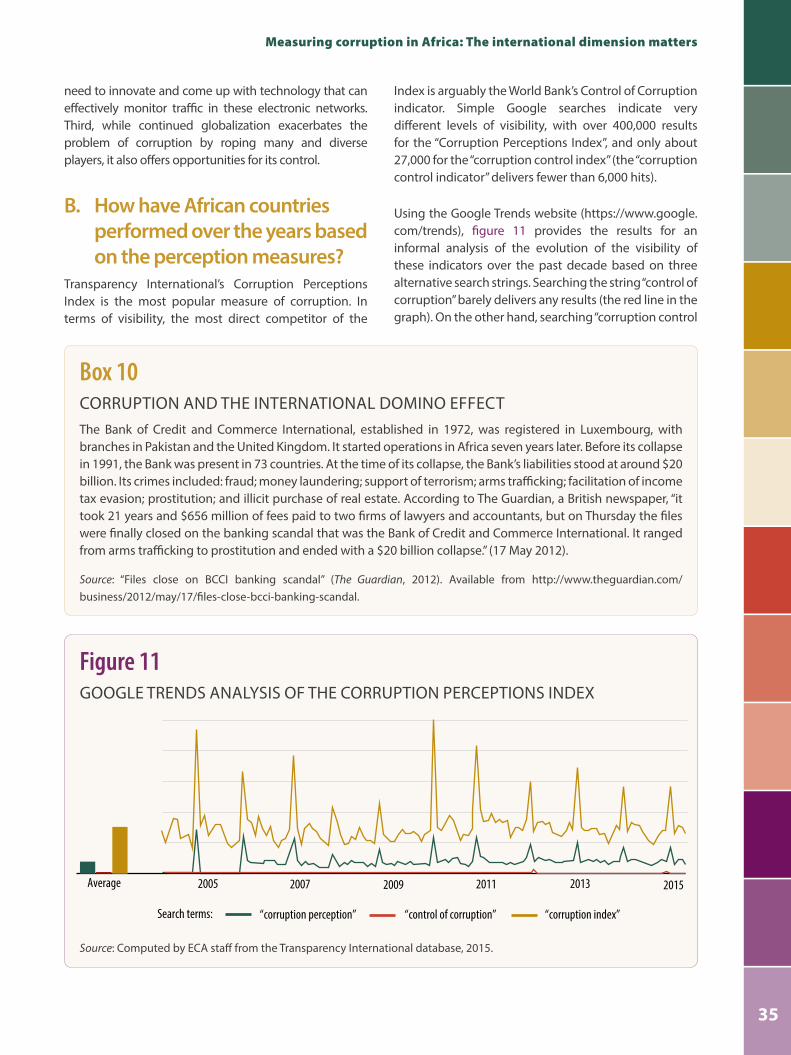
Using the Google Trends website (https://www.google.com/trends), figure 11 provides the results for an informal analysis of the evolution of the visibility of these indicators over the past decade based on three alternative search strings. Searching the string “control of corruption” barely delivers any results (the red line in the graph). On the other hand, searching “corruption control
Box 10CORRUPTION AND THE INTERNATIONAL DOMINO EFFECT The Bank of Credit and Commerce International, established in 1972, was registered in Luxembourg, with branches in Pakistan and the United Kingdom. It started operations in Africa seven years later. Before its collapse in 1991, the Bank was present in 73 countries. At the time of its collapse, the Bank’s liabilities stood at around $20 billion. Its crimes included: fraud; money laundering; support of terrorism; arms trafficking; facilitation of income tax evasion; prostitution; and illicit purchase of real estate. According to The Guardian, a British newspaper, “it took 21 years and $656 million of fees paid to two firms of lawyers and accountants, but on Thursday the files were finally closed on the banking scandal that was the Bank of Credit and Commerce International. It ranged from arms trafficking to prostitution and ended with a $20 billion collapse.” (17 May 2012).
Source: “Files close on BCCI banking scandal” (The Guardian, 2012). Available from http://www.theguardian.com/business/2012/may/17/files-close-bcci-banking-scandal.
Figure 11 GOOGLE TRENDS ANALYSIS OF THE CORRUPTION PERCEPTIONS INDEX
Source: Computed by ECA staff from the Transparency International database, 2015.
2005 2007 2009 2011 2013 2015Average
“corruption perception” “corruption index”“control of corruption”Search terms:
36
African Governance Report IV
index” results in the blue time series. Even more signifi-cantly, searching a generic “corruption index” string delivers the highest number of results as evidenced in the yellow time series – the vast majority of which refers to the Corruption Perceptions Index. Both the yellow and the blue series spike at the beginning of December every year, which is when the Index is released.
Comparing yearly Corruption Perceptions Index rankings for AfricaTransparency International has warned against com-parisons of their Corruption Perceptions Index across
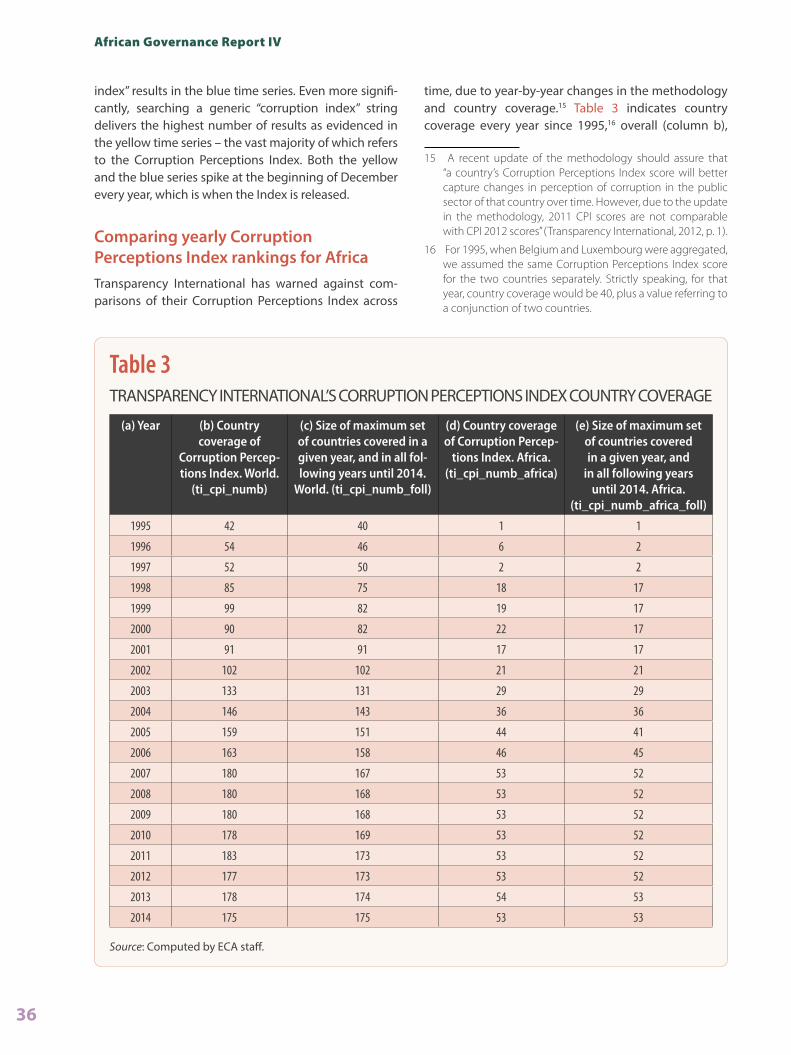
time, due to year-by-year changes in the methodology and country coverage.15 Table 3 indicates country coverage every year since 1995,16 overall (column b),
15 A recent update of the methodology should assure that “a country’s Corruption Perceptions Index score will better capture changes in perception of corruption in the public sector of that country over time. However, due to the update in the methodology, 2011 CPI scores are not comparable with CPI 2012 scores” (Transparency International, 2012, p. 1).
16 For 1995, when Belgium and Luxembourg were aggregated, we assumed the same Corruption Perceptions Index score for the two countries separately. Strictly speaking, for that year, country coverage would be 40, plus a value referring to a conjunction of two countries.
Table 3TRANSPARENCY INTERNATIONAL’S CORRUPTION PERCEPTIONS INDEX COUNTRY COVERAGE
(a) Year (b) Country coverage of
Corruption Percep-tions Index. World.
(ti_cpi_numb)
(c) Size of maximum set of countries covered in a given year, and in all fol-lowing years until 2014.
World. (ti_cpi_numb_foll)
(d) Country coverage of Corruption Percep-
tions Index. Africa. (ti_cpi_numb_africa)
(e) Size of maximum set of countries covered in a given year, and
in all following years until 2014. Africa.
(ti_cpi_numb_africa_foll)
1995 42 40 1 1
1996 54 46 6 2
1997 52 50 2 2
1998 85 75 18 17
1999 99 82 19 17
2000 90 82 22 17
2001 91 91 17 17
2002 102 102 21 21
2003 133 131 29 29
2004 146 143 36 36
2005 159 151 44 41
2006 163 158 46 45
2007 180 167 53 52
2008 180 168 53 52
2009 180 168 53 52
2010 178 169 53 52
2011 183 173 53 52
2012 177 173 53 52
2013 178 174 54 53
2014 175 175 53 53
Source: Computed by ECA staff.
Measuring corruption in Africa: The international dimension matters
37
and for Africa (column d). The country coverage of the Corruption Perceptions Index has significantly increased overtime: the analysis covered fewer than 50 countries in its first years of existence, while in recent years, it has measured perceived corruption in approxi-mately 180 countries.
In time, comparisons of rankings may be made by con-sidering groups of countries which are continuously present within a time window. Columns (c) and (e) of table 3 indicate the size of the maximum set of such countries for the World and for Africa, respectively, that have been continuously present starting in a given year, and until 2014. For example, South Africa was the only African country covered in the 1995 release of the Corruption Perceptions Index, so that the 1995 entry of column (d) for 1995 is equal to 1. South Africa has also been continuously included in subsequent releases of the Index, so that the 1995 entry for column (e) also equals 1. In 1996, on the other hand, the Index included a total of six African countries. However, only two of these were covered every year since. So for 1996, the entries in columns (d) and (e) are 6 and 2, respectively.
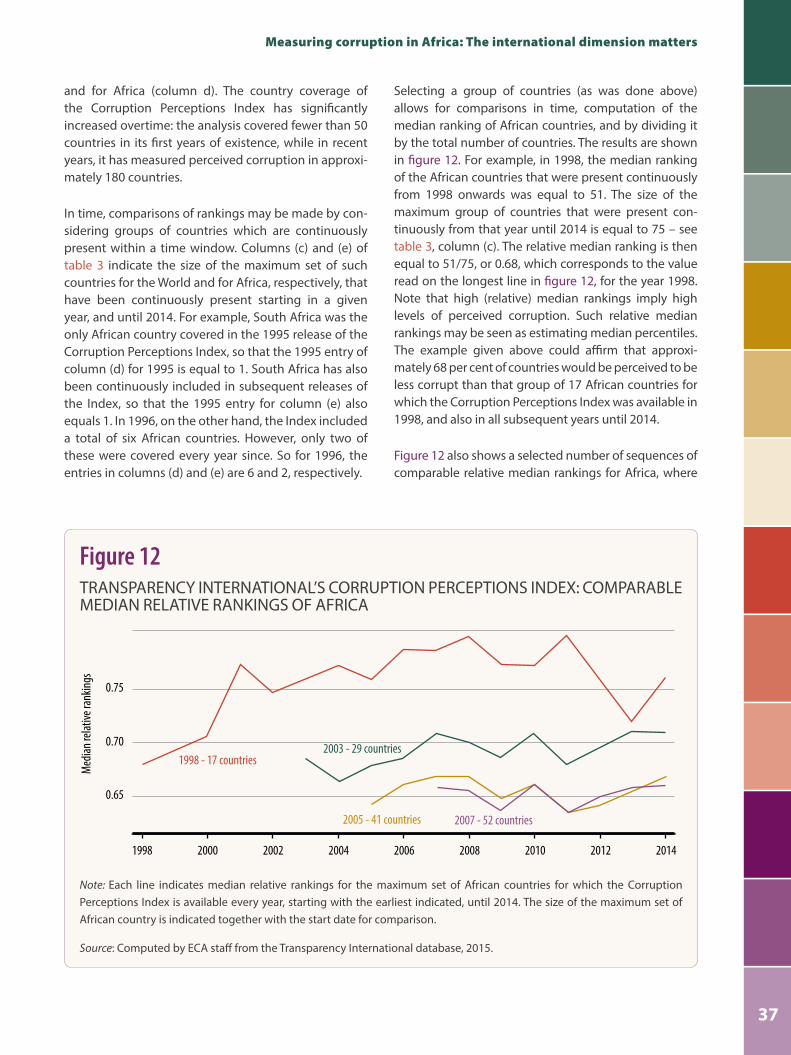
Selecting a group of countries (as was done above) allows for comparisons in time, computation of the median ranking of African countries, and by dividing it by the total number of countries. The results are shown in figure 12. For example, in 1998, the median ranking of the African countries that were present continuously from 1998 onwards was equal to 51. The size of the maximum group of countries that were present con-tinuously from that year until 2014 is equal to 75 – see table 3, column (c). The relative median ranking is then equal to 51/75, or 0.68, which corresponds to the value read on the longest line in figure 12, for the year 1998. Note that high (relative) median rankings imply high levels of perceived corruption. Such relative median rankings may be seen as estimating median percentiles. The example given above could affirm that approxi-mately 68 per cent of countries would be perceived to be less corrupt than that group of 17 African countries for which the Corruption Perceptions Index was available in 1998, and also in all subsequent years until 2014.
Figure 12 also shows a selected number of sequences of comparable relative median rankings for Africa, where
Figure 12TRANSPARENCY INTERNATIONAL’S CORRUPTION PERCEPTIONS INDEX: COMPARABLE MEDIAN RELATIVE RANKINGS OF AFRICA
Note: Each line indicates median relative rankings for the maximum set of African countries for which the Corruption Perceptions Index is available every year, starting with the earliest indicated, until 2014. The size of the maximum set of African country is indicated together with the start date for comparison.
Source: Computed by ECA staff from the Transparency International database, 2015.
1998
0.65
0.70
0.75
2000 2002 2004 2006 2008 2010 2012 2014
Med
ian re
lative
rank
ings
1998 - 17 countries2003 - 29 countries
2005 - 41 countries 2007 - 52 countries
38
African Governance Report IV
years have been chosen to correspond with years of significant increases in coverage. The blue (and longest) line corresponds to a group of 17 African countries, which was continuously covered from 1998 onward. For those African countries, it was observed that perceived corruption had worsened significantly up until 2008, with a change close to 10 percentile points. After 2010, there was a marked improvement in perceptions, but then it worsened again in 2014. The series of comparable relative ranking starting in 2003 includes 29 countries. The relative rankings stay fairly constant in time, at values of around 0.7, and always lower compared to the previous group – the increase in size from 17 to 24 countries must have included countries with relatively low levels of perceived corruption.
The relative rankings of African countries from 2005, and also from 2007, do not show important changes in the relative median ranking for Africa. The latter case includes 52 countries, which corresponds to virtually all African countries. In all comparable groups, there has
been a worsening of the perceptions of corruption in the past few years.
The analysis of relative median rankings in perceived corruption shows that Africa is perceived to be signifi-cantly corrupt, with a median ranking around the 65th
percentile, based on the largest group, which becomes comparable in time starting in 2007. If one focuses on a reduced set of countries (14 out of 54) for which the Corruption Perceptions Index is available since 1998, there is a worsening of the perception of corruption until 2008, and then an improvement. For bigger sets of African countries, for which the Index is continuously available for shorter periods of time, no important changes in time in the perceptions of corruption, relative to the rest of the world, have been observed. Notwithstanding the important efforts that have been made by African countries to control corruption, the perceptions of corruption, as presented by Corruption Perceptions Index, have not improved.
Figure 13CORRUPTION PERCEPTIONS INDEX: COMPARABLE RELATIVE RANKINGS OF AFRICAN SUBREGIONS
Note: Each line indicates, for each subregion, median relative rankings for the maximum set of African countries for which the Corruption Perceptions Index is available continuously between2007 and 2014.
Source: Computed by ECA staff from the Transparency International database, 2015.
Africa
2007 2008 2009 2010 2011 2012 2013 2014
3
4
5
6
7
8
9
West Africa
Med
ian re
lative
rank
ings
Central Africa North Africa East Africa South Africa
Measuring corruption in Africa: The international dimension matters
39
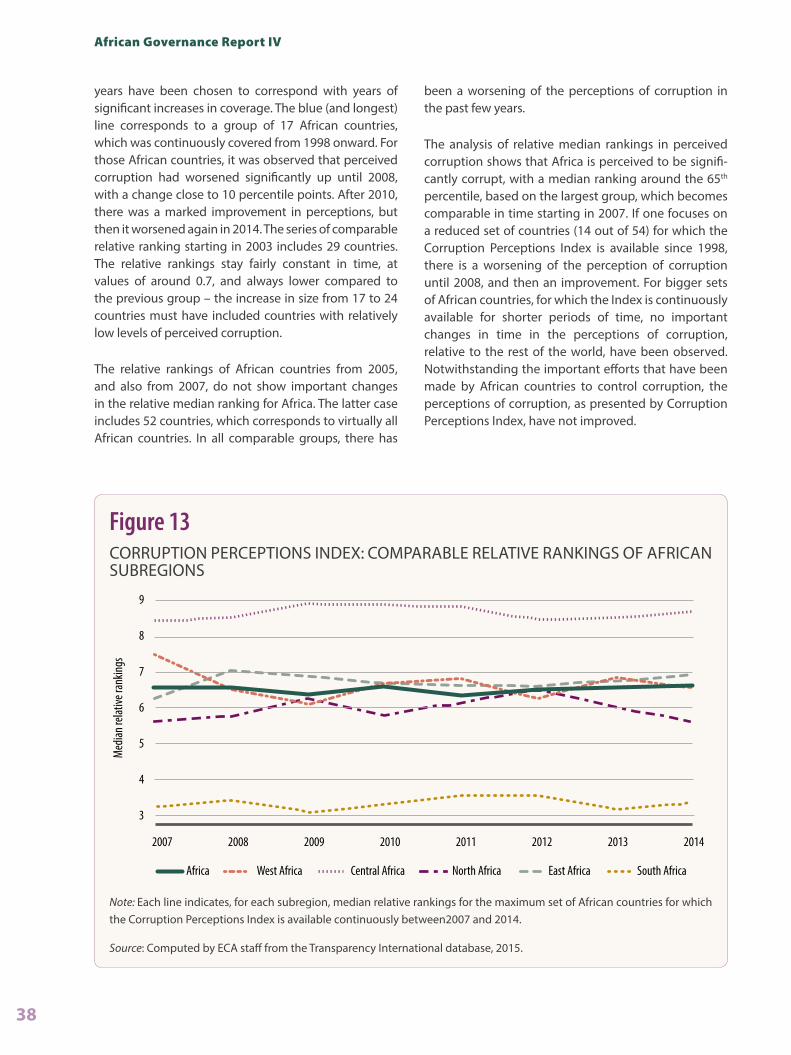
Comparing yearly Corruption Perceptions Index rankings for African subregionsFigure 13 shows the results of a computation of relative median ranking for the five African subregions using UN Division of Statistics (see http://unstats.un.org/unsd/methods/m49/m49regin.htm), only for the group of 52 countries for which the Corruption Perceptions Index is available without interruptions from 2007 onward. The thick line refers to the relative median ranking for Africa as a whole, and it corresponds to the line starting in 2007 in figure 12. The different vertical scale of figure 12 compared to figure 13 makes the time series appear much smoother in the latter figure. The relative median rankings of North, West and East Africa are rather similar to that of Africa as a whole – with North Africa appearing in most years to be slightly less corrupt than the continent as a whole. On the other hand, the present report observes that Central Africa is perceived to be significantly more corrupt and
Southern Africa less corrupt, than the continent as a whole.
Between 2007 and 2014, there was no observed important variation in the overall story. As already noted with regard to figure 12, there has been a slight worsening of perceptions on Africa overall since 2011. Looking at African subregions, one observes that the perceptions of the level of corruption in North Africa have improved somehow in 2013, and again in 2014.
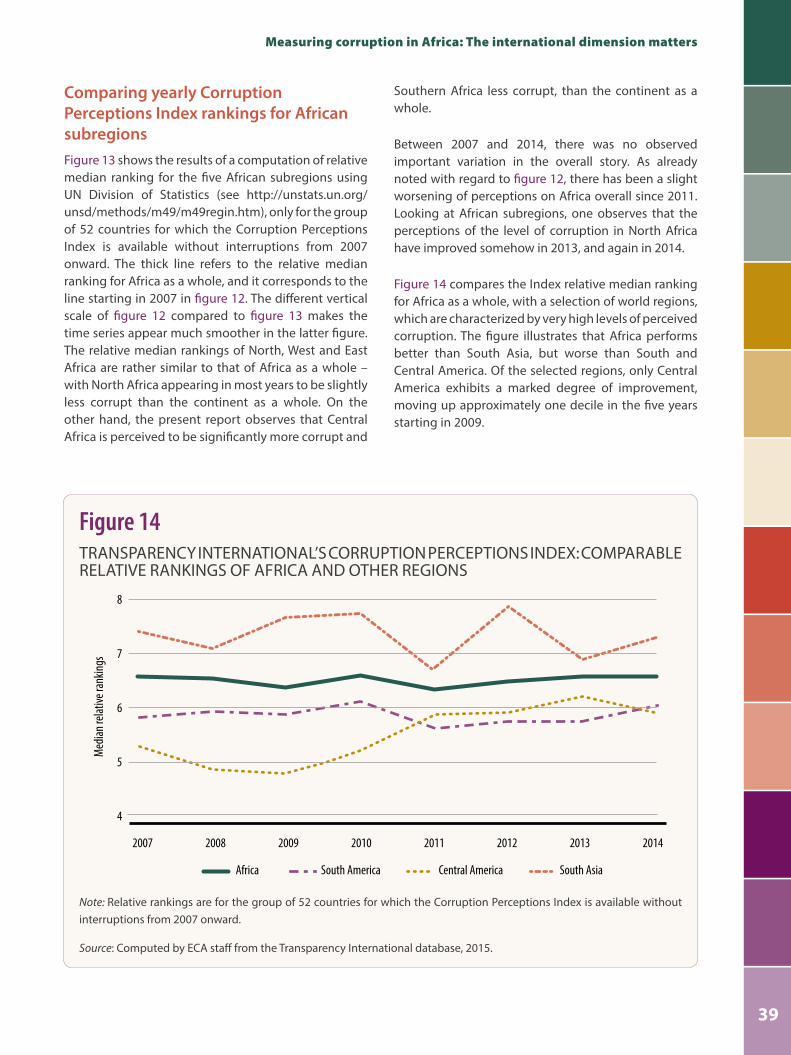
Figure 14 compares the Index relative median ranking for Africa as a whole, with a selection of world regions, which are characterized by very high levels of perceived corruption. The figure illustrates that Africa performs better than South Asia, but worse than South and Central America. Of the selected regions, only Central America exhibits a marked degree of improvement, moving up approximately one decile in the five years starting in 2009.
Figure 14TRANSPARENCY INTERNATIONAL’S CORRUPTION PERCEPTIONS INDEX: COMPARABLE RELATIVE RANKINGS OF AFRICA AND OTHER REGIONS
Note: Relative rankings are for the group of 52 countries for which the Corruption Perceptions Index is available without interruptions from 2007 onward.
Source: Computed by ECA staff from the Transparency International database, 2015.
Africa
4
5
6
7
8
Med
ian re
lative
rank
ings
South America Central America South Asia
2007 2008 2009 2010 2011 2012 2013 2014
40
African Governance Report IV
Impact of the perception of corruption in AfricaNdikumana (2006) argues that the increased focus on corruption in Africa is the result of greater democrati-zation and freedom of the press, which has provided the political space for the public to scrutinize corrup-tion and demand more accountability on the part of Governments. Equally, more civil society activity has brought the issue of corruption to higher levels in national and international policy debates (see box 11).
Another critical factor in driving the spotlight on corruption is the pressure for economic reforms in many African countries and the role of governance in economic performance (Hillman, 2004). International donor agencies have been at the forefront of pushing reforms and putting anti-corruption activities at the core of their development assistance conditionalities. This focus on corruption is a result of the realization that aid in the hands of corrupt leaders is not only econom-ically wasteful but can also be politically destabilizing. Aid to corrupt regimes concentrates power further in incumbent regimes, to the detriment of the progressive forces of social and structural transformation.
Corruption, whether real or perceived, affects economies in five or so ways. Ndikumana (2006) lists the following transmission channels: private investment, public infra-structure, tax revenue, human capital accumulation and productivity, and political instability. These channels are explored briefly:
a. Corruption undermines economic growth via reduced private investment. Corruption discour-ages investment as bribes, kickbacks, and other forms of illicit payments increase uncertainty and transaction costs, thereby reducing profit-ability (Mauro, 1995; Tanzi and Davoodi, 2002). Corruption is a “special tax”, largely secret and uncertain. The corruption tax is uncertain partly because agreements between the investor and the bureaucrat are illegal and therefore not enforceable in any commercial court. Equally, the tax cannot be internalized, which undermines the investment climate. Corruption has been shown to have significant effects on investment. Pellegrini and Gerlagh (2004) estimate that a one standard deviation decline in the corruption index drives private invest-ment by 2.46 percentage points. The resultant rise in private investment in turn pushes GDP growth by about 0.34 percentage points, thus compounding the direct effect of the decline in corruption on growth.
Box 11COST OF CORRUPTION IN AFRICA The effects of corruption are felt in the political, social and economic spheres. Although the direct cost of corrup-tion may be high in terms of lost revenue or funds diverted from their intended use, the indirect cost in terms of economic distortions, inefficiencies and waste resulting from corrupt practices, are more problematic over the long term and thus make it more difficult to deal with. Corruption increases the cost of doing business and wastes resources, which in turn, radically reduces revenue accruing to the State. It also results in poor service delivery, “moonlighting” or multiple concurrent sources of employment and refusal to perform normal functions without additional payment. Moreover, corruption deepens poverty and makes it difficult for ordinary people to get ahead as the result of their own efforts. There is increasing evidence that the social and economic cost of corruption disproportionately affects the poor, who not only suffer from the lack of services and an efficient Government, but who are also powerless to resist the demands of corrupt officials. Different arguments have been put forward to explain the pervasiveness of corruption in Africa; these include poverty, the personalization of public office, the political culture, and the inability of leaders to overcome their colonial mentality in respect of their perception of public office.
Source: Lawal (2007, pp. 1–4).
Measuring corruption in Africa: The international dimension matters
41
b. Corruption undermines the quantity and quality of public investment and growth. As the work of Moser (2008) on Madagascar showed, corrup-tion erodes the quality of public investment because the choice of public investment is driven by the expected private gains for decision makers rather than the public good. More often than not, Governments end up building “roads that go nowhere” (Driscol, 1998), simply because these activities generate kickbacks or serve the political interests of decision makers. Generally, the maintenance of public infrastructure does not get adequate attention, partly because new projects generate higher kickbacks (Mauro, 1998; Tanzi and Davoodi,2002). Corruption may therefore lead to poorer, not better public infrastructure as a result of these rent-seeking behaviours (Tanzi and Davoodi, 2002).
c. Corruption retards growth by reducing tax revenue. Corruption erodes the tax base by negating the investment climate and perpetuating leakages due to tax evasion and embezzlement by tax collectors, which undermine growth (Murphy, Shleifer and Vishny, 1993). As tax revenue declines, funding for public infrastructure is constrained, which retards growth. Ghura (1998) found that, for 39 African countries over the period 1985–1996, corruption was one of the strongest predictors of tax revenue. This suggests that measures taken to reduce corruption are likely to enhance tax revenue significantly.
d. Corruption slows down growth through inefficient use of human capital. Arguably, corruption, on the whole, channels skills into unproductive activities, thereby adversely
affecting productivity in the specified sector of the economy. For example, when civil servants use valuable time chasing bribes, kickbacks and other forms of illicit bonuses rather than delivering services and implementing gov-ernment regulations. Corruption also distorts decision-making by inducing individuals to choose rent seeking rather than develop the skills that are necessary for individuals to be productive members of society. Corruption generates inefficiency in programme funding, where the budget is often squandered or mis-appropriated. A World Bank tracking study on education financing in Uganda found that in 1996, only 36 percent of the contributions from the central Government reached schools (World Bank, 2002). In essence, corruption prevented the country from achieving its full potential of human capital formation with dire implications for economic performance and growth.
e. Corruption increases the risk of political insta-bility and its negative consequences on growth. Corruption by heightening rent seeking and conflict over resources increases the risk of political and social instability. Elite control of power to optimize opportunities for rent seeking speeds up the process by which the citizenry becomes disenfranchized. Any intra-elite struggle over rent can contaminate the general social and investment climate with negative consequences for State legitimacy and economic growth. The lethal cocktails of intra-elite rent-seeking struggle and demand for reform by the citizenry more often than not ignite social and political conflict, thus under-mining economic performance and structural transformation.
Perception of corruption measurements and institutional reforms in AfricaIt is not clear from the literature the extent to which the perception-based measures of corruption have informed the efforts of countries to undertake insti-tutional building. This is not to say that Africa has not setup anti-corruption or accountability institutions. According to the literature, the introduction of New Public Management reforms in African countries in the 1990s was motivated by a fierce critique of bureaucracy as being inefficient and possibly corrupt. This triggered
“
”
More often than not, Governments end up building “roads that go
nowhere”, simply because these activities generate
kickbacks or serve the political interests of
decision makers.
42
African Governance Report IV
a push for reforms, which allegedly gave birth to inter-nally focused, rule-driven and hierarchically structured organizations (Owusu, 2012; Chipkin and Lipietz, 2012). Chipkin (2013), drawing on the South African experi-ence, argued that because of the political economy around black empowerment after 1994, the post-Apart-heid public service was not led by autonomous and values-driven managers that focused on outcomes, unrestrained by bureaucratic rules and regulations. Instead, the reforms and innovations were associated with a general neglect of administrative processes in government departments, and in some instance, outright corruption. Chipkin (2013) also reported that a diagnostic of the Limpopo provincial administration showed that administrators found evidence of looting and departments operating without basic administra-tive processes. Departmental records were reportedly chaotic; contract documents were missing; there was no asset registry; and provincial data were unreliable or simply non-existent. The pace of technological change had not been accompanied by sufficient training. Public servants could not operate the information technology systems effectively and so relied on earlier and unautho-rized processes to do their jobs.
The New Public Management reforms also prompted high turnover rates at the senior-management level, associated with a constantly changing world of work. This resulted in the juniorization of the senior-man-agement function and creation of high levels of instability. When senior managers hold their positions for short periods, processes and systems do not have time to stabilize as a new manager introduces his or her own management model. Instability is sometimes compounded by “management interventions” to “turn
around” distressed organizations with limited attention paid to the objective of ensuring institutional maturity.
It is arguable that non-compliance with policies, processes and regulations is not necessarily a symptom of corruption, negligence or incompetence. It might point to the weak quality of the governance institu-tions and the inability of organizational practices to be effective. It is also arguable that corruption is not simply a problem of the indiscipline of officials, but the failure in delivering the objectives of good governance. Corruption weakens the institutional character of the State and reduces its sovereignty and legitimacy as citizens refuse to respect the social contract. Effective control of corruption must be based on institutional reforms, including constitutions, to constrain the ability of the State to intervene in private transactions. Broadly, three institutional characteristics can be distinguished (although others are also possible): efficient; captured; and weak (see box 12).
In light of the foregoing, it is difficult to assess how perception data on corruption can be meaningfully used to identify the taxonomy needed for a practical approach to institutional building or reforms. African countries need solid foundations on which to develop the rules that determine the “incentives” available to economic and political actors.
C. Limitations of perception-based measures for policymaking
Most data on corruption would not be useful for pol-icymakers in Africa, because the focus is on peoples’ attitude towards the prevalence of corruption and not the nature of the act or its exact magnitude. Generally, victims of corrupt practices will perceive a country to be more corrupt, whereas those that have not experienced such practices will think otherwise. For example, data on reported cases of corruption tend to correspond to information about the response of criminal justice systems rather than the true extent and nature of the crime itself. Given the difficulty to collect data on factual experiences of corruption, methods based on the assessments of experts have remained dominant (United Nations Office on Drugs and Crime, 2009). Certain measurements of corruption, notably the Corruption Perceptions Index and Worldwide
“
”
Effective control of corruption must be
based on institutional reforms, including constitutions, to
constrain the ability of the State to intervene in private transactions.
Measuring corruption in Africa: The international dimension matters
43
Governance Indicators, are influential because of their importance in foreign policy, investment, aid, and country risk analysis. It is the core argument of the African Governance Report IV that no single indicator of corruption should be used, given the limitations of the methodologies.
Knack (2007) was among the earlier researchers who expressed serious reservations about the usefulness of the Corruption Perceptions Index and the Worldwide Governance Indicators in capturing the level of cor-ruption in a given country. While they recognized the importance of both indices in terms of their contribu-tions to awareness-raising, they also demonstrated the inherent limitations in explaining various aspects of corruption. These include, what Knack (2007) describes as a definitional distinction between measures of administrative corruption and State capture. He gives an example of bribes, which aimed at influencing the content of rules and laws (e.g. State capture), or alter-natively, to influence their implementation, which is known as administrative corruption. Furthermore, he identifies the problems associated with aggregating data from various sources to construct perception indices. He (with similar views shared by Khan, 2006) argues that “conceptual, methodological and empirical materials strongly support the message that no single corruption measure, nor single data source on corrup-tion, is most appropriate for all purposes” (p. 282).
Along the same line of argument, Rohwer (2009) gives a comparative analysis between the Corruption Perceptions Index and the Worldwide Governance Indicators, which casts doubts about the accuracy and effectiveness of the two most popular corruption perception measurements. She recognizes the impor-tance of composite indicators, as used by both indices, in summarizing information from diverse sources and thus minimizing the impact of possible measurement error in an individual indicator. She also raises concerns about the limitations that come with such an approach. More specifically, she argues that “it is unclear what exactly the Corruption Perceptions Index and the Worldwide Governance Indicators are measuring, when sources, which measure such different aspects of corruption, are averaged together” (p. 49).
Many analysts have observed that the sources used in the building of the indices vary from country to country, and also tend to vary from year to year for a given country, which could well distort trend analysis.17 Perhaps among the strongest and most recent criti-cisms lodged against the Corruption Perceptions Index comes from Cobham (2013). In an article in “Foreign Policy”, he questioned the accuracy of the Index
17 This point seems to have been addressed in the Transparency International’s other perception measurement, the Global Corruption Barometer, where the results are comparable across countries and over time.
Box 12POSSIBLE INSTITUTIONAL CHARACTERISTICS OF A STATE
• An efficient institution is one where officials pursue the “public good” by acting neutrally and in a disinterested manner vis-à-vis their own views and interests. These officials may be those of the bureau-cracy or those with other broader affiliations, such as political ideology, religion or other group interests.
• In the context of a captured institution, officials operate on the basis of particularity. In essence, they do not claim, nor do they try to work in the interests of the public good, but service their own interests or those of particular constituencies and interests to which they pay allegiance.
• A weak institution is distinct from the other two and by definition weak. It is incapable of producing an “effect of universality”, not because relevant economic agents work in their own interests or those of a particular social group (capture). Under a weak institution, there are no common “rules of the game” (North, 1991) to define social relations in predictable conventions and routines. Equally, equipment and other productive resources are used in capricious and unpredictable ways with no consideration to societal well-being.
Source: Compiled by ECA staff from various sources.
44
African Governance Report IV
report, which, in his opinion, is prepared using highly subjective methods of data collection and analysis. His article provides an excellent sense of the types of indi-viduals and groups whose opinion forms the basis of the Index – which is derived by combining 13 different perception surveys. Cobham (2013, p. 1) points to the striking commonality in the people whose perceptions are actually assessed in all of the 13 surveys:
A group of country economists; recognized country experts; two experts per country; experts based primarily in London (but also in New York, Hong Kong, Beijing and Shanghai) who are supported by a global network of in-country spe-cialists; staff and consultants; over 100 in-house country specialists, who also draw on the expert opinions of in-country freelancers, clients and other contacts; 4,200 business executives; 100 business executives ... in each country; staff; 100 business executives from 30 different countries/territories; staff (experts); 100 business executives per country/territory; and finally, over 2,000 experts and 66,000 other individuals from around the world have participated [to date].
His criticism, which is similar to others mentioned earlier, focuses mostly on the method of aggregation to produce a single corruption index. Furthermore, he claims that the correlations between the various components of the Corruption Perceptions Index run between 80 per cent and 100 per cent, resulting from similarities between the individuals who were sampled.18 The result lacks any sense of diversity. He cites Brazil as an example, where the perception of corruption had changed when the experiences of a group of citizens were considered instead of restricting it to elite perceptions only. Cobham also highlights that even the original creator of the Index, Johann Graf Lambsdorff, called for an end to its wide usage. He quoted Lambsdorff as saying: “In 1995, I invented the Corruption Perceptions Index and have orchestrated it ever since, putting Transparency International in the spotlight of international attention. In August 2009, I had informed Cobus de Swardt, Managing Director of Transparency International, that I am no longer available for doing the Corruption Perceptions Index”. While the creator of the Index did not give a full account of the reasons for his departure, it was obvious among experts in the field that he had serious reservations about the way it was being used.18 Correlation is a statistical technique that can show whether
and how strongly pairs of variables are related.
Both the Corruption Perceptions Index and the Worldwide Governance Indicators, as most other indices, fall short of exploring the international dimension of the problem, particularly asset repatriation and money laundering. It is clear that both the money launderers and the receivers of such laundered funds (those who steal funds and assets and the receivers of such items) are equally guilty. In other words, grand corruption in Africa would prove unattractive without the participa-tion of these external actors. If the survey questions designed to rank countries according to perceived level of corruption included the above corrupt practices, some of the top ranking countries in corruption percep-tion indicators could very well find themselves in the company of some of the worst offenders.
D. Rationale for re-thinking perception of corruption measurements and broader issues
Assessing corruption in a broader governance contextThere is extensive literature to support the view that perception-based corruption indicators are subjective. For instance, Olken (2005a) measures the perception of corruption to a more objective measure of graft, for a road project in a rural village in Indonesia. For the most part, the villagers were able to recognize corruption in the marked-up prices of materials, but not in the deliber-ate increase in quantities of the materials. This led Olken to conclude that “perception data…should be used
“
”
Both the Corruption Perceptions Index
and the Worldwide Governance Indicators,
as most other indices, fall short of exploring the
international dimension of the problem.
Measuring corruption in Africa: The international dimension matters
45
with considerable caution” (2005b, p. 29). Moreover, in her assessment of advances in measuring corruption, Sequeira (2012) highlights “reporting bias” as being one of the main drawbacks with perception-based measurements. She explained that respondents can be influenced by the “most commonly held perceptions of corruption in a given country, even if they are not sub-stantiated by the respondent’s actual experience, in the same way that international experts and businessmen expect poorer countries or more dysfunctional govern-ments to also be more corrupt” (p. 5).
Notwithstanding the considerable body of literature critiquing the corruption perception indicators, there are still very few studies that have proposed viable and credible alternative ways of measuring corruption. Rydland, Arnesen and Østensen (2007) argue that although the clandestine nature of corruption presents challenges, it does not imply that corruption is impossi-ble to measure.
This begs the question of how we can measure cor-ruption in African countries. Literature on the subject indicates that such studies generally use two kinds of data –“objective facts” or “events” and subjective perceptions. Objective measures of corruption may include a number of situations, such as the adoption of anti-corruption laws, the number of people tried and convicted on corruption and related charges, or the number of corruption cases brought to the media’s attention. Objective data only expresses the Government and the media’s level of determination and their capacity to expose and combat corruption. It does
not specifically deal with issues relating to the degree of corrupt practices in a given country and are therefore deemed unsuitable for comparative purposes. Most scholars who are on the side of using objective indica-tors fall back into favouring the use of proxy measures, such as indicators that monitor observable changes in government policies or actions and the changes in the economy that create incentives for corruption or reveal its effects (Johnston and Kpundeh, 2002). Examples of objective indicators are: contract intensive money; how long it takes to clear customs or set up a business; the speed of service delivery; and telephone waiting times (Knack and Kugler, 2002). Again, these objective indicators do not measure the real level of corruption, and can only function as imperfect proxies.
Subjective measures are generally still deemed to be the best approach, notwithstanding their own serious limitations (Kaufmann, Kraay and Mastruzzi, 2006). For instance, Duncan (2006) highlights that the ethno-graphic approach of measuring corruption “has been able to provide reliable data on many specific sectors” (p. 151). Indeed, one of the most cited studies that use this approach is by Wade (1982, 1984) who identified levels of corruption in the Indian water sector (cited in Hite, 2006). According to Wade (1982, p. 291), “corrup-tion can only be properly understood by using more informal, more ‘anthropological’ means”.
Admittedly, corruption measurements, constructed using subjective measurements, do indeed provide a general and broad picture of the state of corruption across regions and countries. Nevertheless, they are not very useful when it comes to designing and imple-menting specific reform policies aimed at combating corruption.
In light of the above discussions, there are four reasons why it is necessary to re-assess the way in which the results of corruption perception measurements are presented and utilized. First, corruption remains a social phenomenon, which is intrinsically linked to the problem of governance. Critics, such as Johnson (2000), have raised concern over the growing tendency to treat corruption as merely “a problem of political and economic liberalization”. The neo-liberal thinking, that the free market will eventually correct such abnor-malities in economic transactions, is continually being challenged by various researchers and by social and economic realities. Institutions such as the World Bank, among others, vigorously pushed this idea throughout
“
”
Objective data...does not specifically deal
with issues relating to the degree of corrupt
practices in a given country and are therefore
deemed unsuitable for comparative purposes.
46
African Governance Report IV
the 1970s and 1980s under what was known as the Structural Adjustment Programme. Proponents of such thinking, including Birdsall and Fukuyama (2011), openly admit to the fact that “for the last three decades, Washington-based development institutions have taken the view that growth is threatened more by government incompetence and corruption than by market failures” (p. 50). However, as argued by many experts, policies associated with the Structural Adjustment Programme are in fact responsible for undermining the capacities of institutions of gover-nance, resulting in rampant corrupt practices, which to this day remain entrenched across the continent. In this regard, strengthening institutions of governance is instrumental in tackling governance challenges, including corruption.
Moving the debates beyond composite indicatorsMeasurement tools that aggregate data sources, such as the Corruption Perceptions Index or the Worldwide Governance Indicators, have their strengths and weaknesses. While composite indicators can be useful in summarizing a lot of information from several sources, and in so doing, can limit the influence of measurement error in individual indicators and potentially increase the accuracy of measuring a concept as broad as corruption, they run the risk of losing conceptual clarity.
Composite aggregation masks the broad concept of corruption. It is unclear what the corruption indices actually tell us because the types of corruption and their meaning vary from one country to the next (Thompson and Shah, 2005). For example, the original purpose for
a perception-based indicator was to raise awareness of corruption and to provide researchers with better data for analysing the causes and consequences of corrup-tion. The real problem is that there are different forms of corruption and the composite index cannot capture the various elements with the necessary precision.
Moreover, the extent of corruption in a country or region may depend on the frequency of corrupt acts, the amount of bribes paid, or the gain that contractors achieve through corruption (ibid). It is sometimes unclear what each of the different indicators used in the aggregated indices really measure, as different indica-tors measure different kinds of corruption. For example, the World Bank Country Policy and Institutional Assessment examines ineffective audits, conflicts of interest, policies being biased towards narrow interests, policies affected by corruption, and public resources diverted to private gain, while the World Economic Forum assesses the amount of bribes paid (Lambsdorff, 2008). However, composite indicators are effective in summarizing a lot of information from several sources, thus limiting the influence of measurement error in individual indicators of corruption.
Composite indicators may also worsen transparency in assessing levels of corruption. It is relatively well known that some indicators rely on sources, which are not publicly available (e.g. the International Country Risk Guide). More importantly, aggregated indices are generally ambiguous because some of their compo-nents are too vague. For instance, if the International Country Risk Guide provides little guidance as to how various aspects of corruption are weighted or what data are used, it is impossible to fully explain what the Worldwide Governance Indicators– control of corrup-tion – indicator is measuring or what the measurement is based on (Knack, 2006).
In addition, the normalization of different indicators reduces the sensitivity to detect changes in a specific indicator over time. This makes both the scores and rankings incomparable across time as the survey would have a different sample composition. Changes in a country score maybe driven by adding a new data source or dropping an outdated one. However, one can make a comparison for a single country at two data points, if it is based on a common set of sources. It is therefore important to keep in mind any changes in the methodology or in the definition over time.
“
”
The real problem is that there are different
forms of corruption and the composite index cannot capture the
various elements with the necessary precision.
Measuring corruption in Africa: The international dimension matters
47
Another issue, when constructing composite indica-tors, is the strong likelihood of correlation of errors among sources. A specific weighting scheme may have to be adopted to deal with the problem of correlation. The weighting is based on the assumption that data errors are uncorrelated across sources and countries. In this regard, sources that tend to be highly correlated among themselves are simply assumed to be more informative. Accordingly, the practice is to attribute higher weights to these sources rather than those that are less closely correlated. Data that have low weights go into the composite indicator with a lower influence.
It is therefore critical to note that the weighting scheme is very sensitive because of the elements of the composite indicator. Arndt and Oman (2006) argued that if some given data were to be aggregated in one composite indicator and some were very similar, the weights of the similar sources will be overbalanced, whereas the data from sources, which differ, will have nearly no weight in the constructed composite indicator. There are at least four reasons why the errors of the used data are not uncorrelated across sources and countries (ibid):
a. Respondents who are used in one source are often informed of, and influenced by, the assess-ments of other experts supplying such data for other sources;
b. Experts who provide their views for different sources are often informed of, and influenced by, perceptions and assessments from the same third parties;
c. Crises and perceived changes or longer-term socioeconomic trends in a country often influence the data for perception-based measures of corruption;
d. Since the interpretation of survey questions is context-and culture-specific, perception errors from different data sources relying on respon-dents from the same country or culture, tend to be correlated.
There are also concerns over allocation of weights in a cor-ruption index. For example, in the case of the Corruption Perceptions Index, the scores always fall between zero and ten. Galtung (2006) argues that this methodology is defective as it is natural to compare a country with its neighbours in order to have a baseline of comparison when respondents or even expert panels rank countries. Unfortunately, even with reform efforts and country
assessments being on a positive trend by some of the Corruption Perceptions Index sources, its ranking in comparison to neighbouring countries may take years to change. Any such change is hard, even if other countries in a given region try to do the same. Hence, the matching percentiles technique punishes small improvements in a country’s ranking. The question which then arises is what the plausible weighting scheme in any corruption index is. Knack (2006) argues that a weighting scheme should ensure: sources representing truly independent assessments are weighted more heavily; those with more extensive publicly available documentation and detailed justifications are weighted more heavily; and those sources with larger and more nationally represen-tative samples and with more questions on corruption are given more weight.
Need for the truth about measuring perception of corruptionMeasurements of corruption have become an ever-growing empirical field with various attempts to improve our understanding of the phenomenon. These empirical exercises are forcing a rethink of the conven-tional approaches to tackling corruption. They also represent efforts of moving away from simply blaming public officials for corruption, or advocating voluntary and often not enforceable codes of conduct to having a holistic view. For African countries to progress in their fight against corruption on all fronts, requires the measurement of corruption itself, in order to diagnose problems and monitor results. This recognition has renewed interest in the development fraternity
“
”
Even with reform efforts and country assessments
being on a positive trend by some of the
Corruption Perceptions Index sources, its ranking
in comparison to neighbouring countries
may take years to change.
48
African Governance Report IV
(Kauffman, 2005). This in turn has also sparked new debate on how best to measure corruption and monitor progress in reducing it. The present report reflects on some of the main issues in these debates (see box 13).
E. ConclusionsCorruption can and is being measured through a wide variety of approaches, either by itself or as a dimension of governance. Given the imperfections of any indi-vidual approach, it is preferable to rely on different approaches – subjective and objective, individual and aggregate, cross-country and country-specific – in order to monitor tangible results on the ground and develop anti-corruption programmes.
It is a fact that one cannot measure what is hidden. A precise measure of corruption is, by all experts’ account, impossible. Data on money illegally exchanging hands are made purposely difficult to trace. It is for this reason that almost all corruption-related indicators resort to measuring public perception rather than corruption itself. It is therefore difficult to know that it even exists, much less to measure its magnitude.
ECA recognizes that, notwithstanding the importance of perception-based measurements, there are serious limitations, in particular for African countries. It is essential that most of the perception measurements being used, rethink their conceptual understanding and technical measurements of corruption to align themselves with current development thinking and practice. To put it simply “there is little value in a mea-surement if it does not tell us what needs to be fixed” (United Nations Development Programme, 2008, p. 8).
The problem of corruption measurement is even more acute when it is based on perception. Not only have these measurements been used to name and shame countries, they have also been used for assessing the business environment by investors, donors and other development partners, with dire implications for Africa’s development. For example, foreign direct investment and aid allocations have been influenced by the per-ception of corruption in many African countries even when such indicators may be misleading.
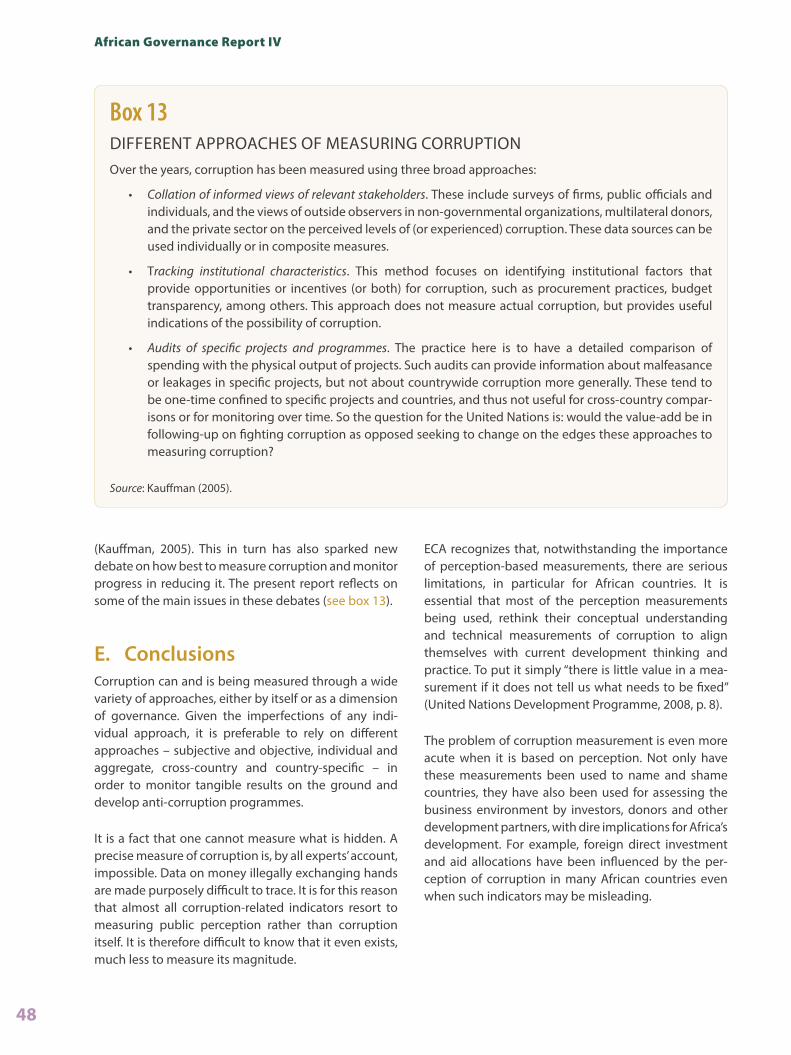
Box 13DIFFERENT APPROACHES OF MEASURING CORRUPTIONOver the years, corruption has been measured using three broad approaches:
• Collation of informed views of relevant stakeholders. These include surveys of firms, public officials and individuals, and the views of outside observers in non-governmental organizations, multilateral donors, and the private sector on the perceived levels of (or experienced) corruption. These data sources can be used individually or in composite measures.
• Tracking institutional characteristics. This method focuses on identifying institutional factors that provide opportunities or incentives (or both) for corruption, such as procurement practices, budget transparency, among others. This approach does not measure actual corruption, but provides useful indications of the possibility of corruption.
• Audits of specific projects and programmes. The practice here is to have a detailed comparison of spending with the physical output of projects. Such audits can provide information about malfeasance or leakages in specific projects, but not about countrywide corruption more generally. These tend to be one-time confined to specific projects and countries, and thus not useful for cross-country compar-isons or for monitoring over time. So the question for the United Nations is: would the value-add be in following-up on fighting corruption as opposed seeking to change on the edges these approaches to measuring corruption?
Source: Kauffman (2005).


![Measures to Reduce Corruption Final[1]](https://img.pdfslide.us/doc/110x75/546a4a81af795967298b4625/measures-to-reduce-corruption-final1.jpg)