Embed Size (px)
Citation preview

Engaging with the Community: What do the Numbers Tell Us?
National Core Indicators Project
Lynnette Henderson, PhD UCEDD Associate Director of Community Services
Vanderbilt Kennedy Center

WHAT IS NATIONAL CORE INDICATORS (NCI)?
• Multi-state collaboration of state DD agencies • Measures performance of public systems for
people with intellectual and developmental disabilities
• Assesses performance in several areas, including: employment, community inclusion, choice, rights, and health and safety
• Launched in 1997 in 13 participating states • Supported by participating states • NASDDDS – HSRI Collaboration
National Core Indicators
• National Association of State Directors of Developmental
Disabilities Services (NASDDDS)
• Human Services Research Institute (HSRI).

National Core Indicators
• The guiding principle of NCI has always been to enhance the transparency of information about system performance.
• Publications, • Data reports, • a customizable “chart-making” tool, and other important
resources can be found at: • www.nationalcoreindicators.org
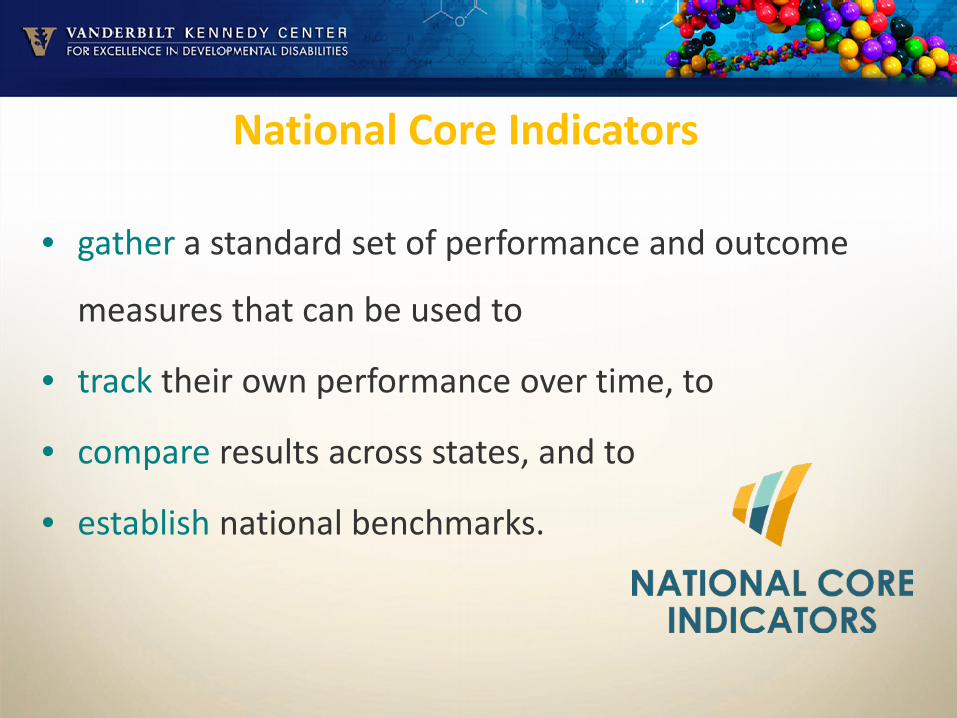
National Core Indicators
• gather a standard set of performance and outcome
measures that can be used to
• track their own performance over time, to
• compare results across states, and to
• establish national benchmarks.

CT
NCI State Participation 2013-14
HI
WA
AZ OK
KY
AL
NC
PA
MA
TX
AR GA
NM
NJ
MO
NH
OH* IL
LA
NY
Wash DC
FL
CA*
SD OR
MN
UT CO KS
MS
TN SC
WI
MI
IN
VA
DE
MD
State contract awarded in 2013-14 through AIDD funding CA*- Includes 21 Regional Centers OH*- Also includes the Mid-East Ohio Regional Council
39 states, the District of Columbia and 22 sub-state regions
ME
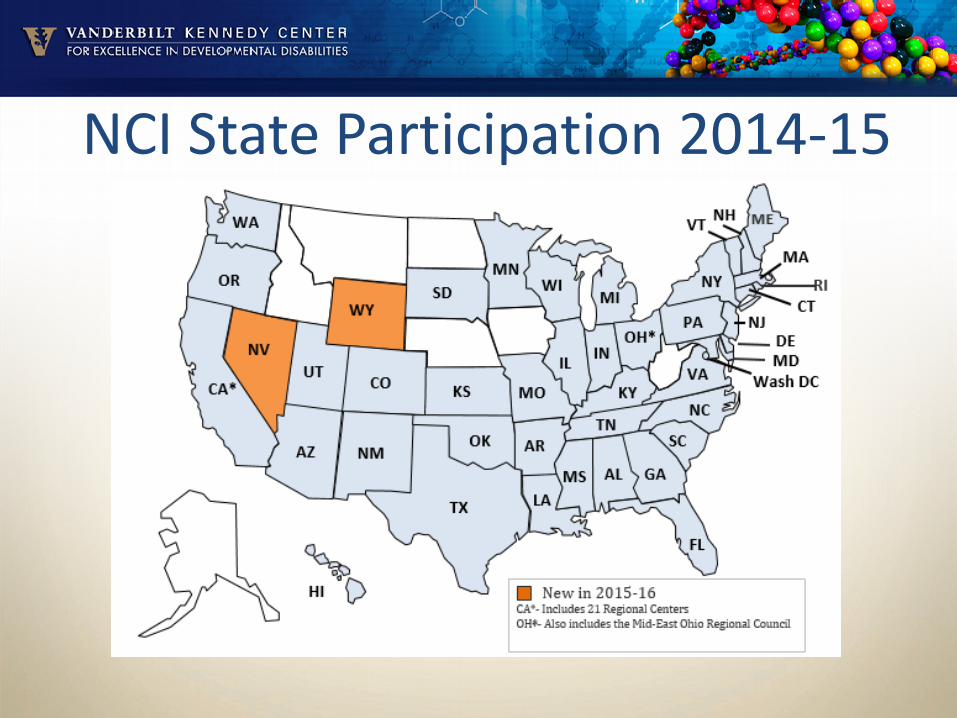
NCI State Participation 2014-15

National Core Indicators • 39 states using 4 main data sources: 1. an Adult Consumer Survey ACS
• e.g., rights and choice issues, 2. family surveys
• e.g., satisfaction with supports, 3. a provider survey
• e.g., staff turnover, and 4. system data from state administrative records
• e.g., mortality rates

Adult Consumer Survey
• This face-to-face survey • collects data on ~ ½ of the indicators • individual demographic, service and health
information about adults with IDD as • valued outcomes directly from adults with IDD • 400 randomly selected adults served by DIDD • Interviewed by People Talking to People crews

NCI in TN
National Data Measurement Project May 2013

Why NCI? Indicators selected are: � • Reflective of the mission, vision and values of the field; � • Measurable; � • Practical to implement; � • Reliable and valid; � • Sensitive to changes in the system; � • Representative of issues the states had some ability to
influence; and � • Reflective of outcomes that were important to all
individuals regardless of level of disability or residential setting.
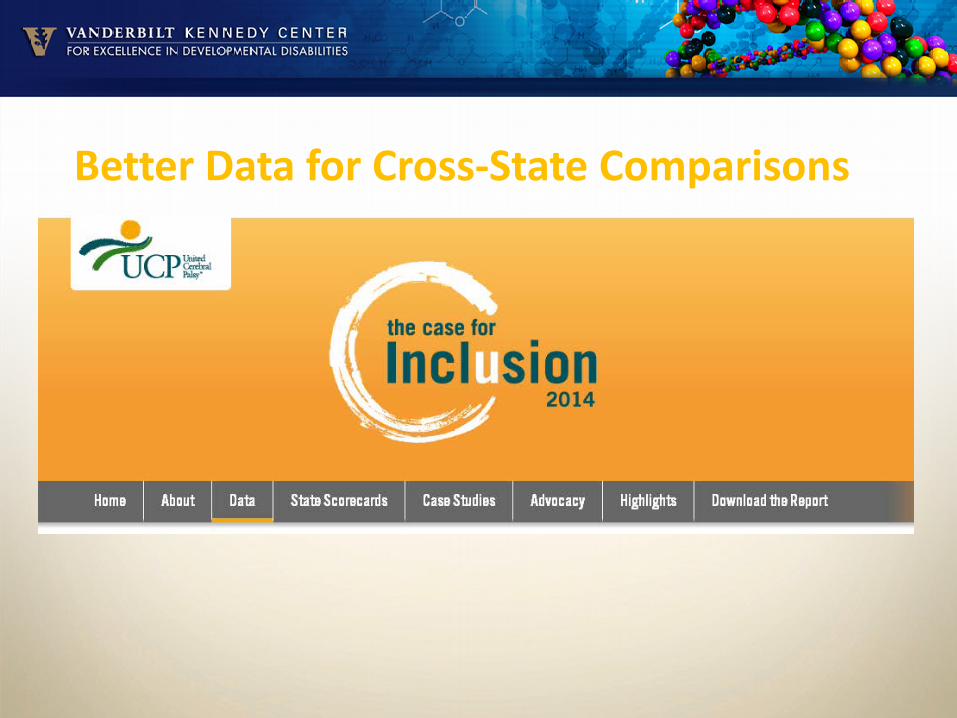
Better Data for Cross-State Comparisons

Preferred data reporting system of AIDD/ACL

NCI Sample for each year • Randomly drawn from individuals over 18 receiving at least one
service from DIDD • Collected Background Information on
– 436 in 2013-14, – 568 in 2014-15
• The Arc TN People Talking to People interviewed most of them • Number of people (n) changes with the question • Percentages reflect the percentage of the number of people who
answered the question • When possible to characterize level of HCBS compliance, blue is
used to reflect compliance, red is used to indicate non-compliance and purple is used to indicate a non-specific middle ground between the 2 categories.

2013-14=430
2014-15=560
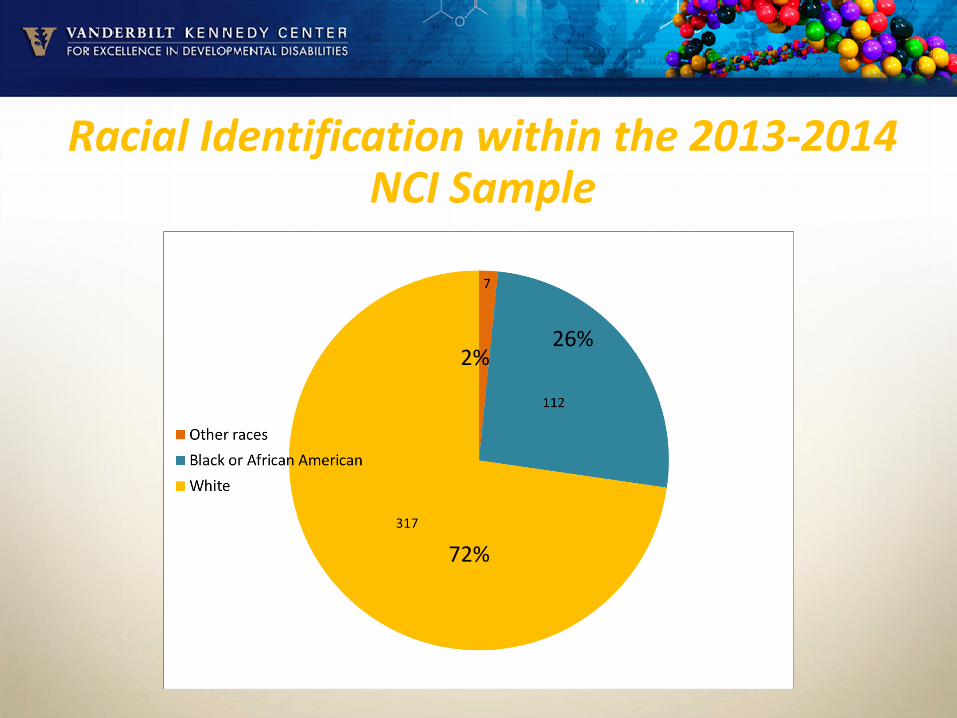
Racial Identification within the 2013-2014 NCI Sample
72%
26% 2%

Racial Identification within the 2014-2015 NCI Sample
11, 2%
143, 24%
431, 74%
Other races Black or African-American White

Gender distribution of the 2014-2015 NCI Sample
GENDER Frequency Percent Male 361 61% Female 223 38%

Gender distribution of the 2013-2014 NCI Sample
GENDER Frequency Percent Male 265 60.8 Female 171 39.2
60.8%
39.2%

National Core Indicators Data
• A Tale of Two Samples
If yes, what level of ID? GENDER
Total Male Female
No ID 1 3 4
Mild ID 108 83 191 Moderate ID 111 55 166 Profound ID 47 37 84 Severe ID 44 29 73 ID level unknown 31 13 44 Unspecified level of ID 15 3 18 Not applicable - no ID diagnosis 1 1 2
Total 357 223 580
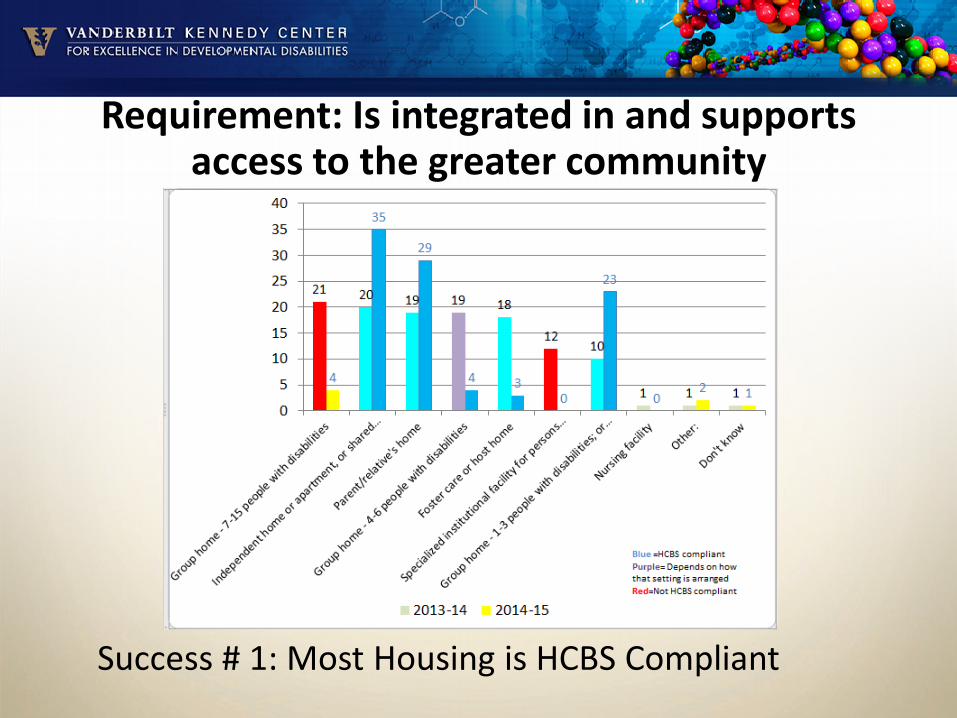
Requirement: Is integrated in and supports access to the greater community
Success # 1: Most Housing is HCBS Compliant
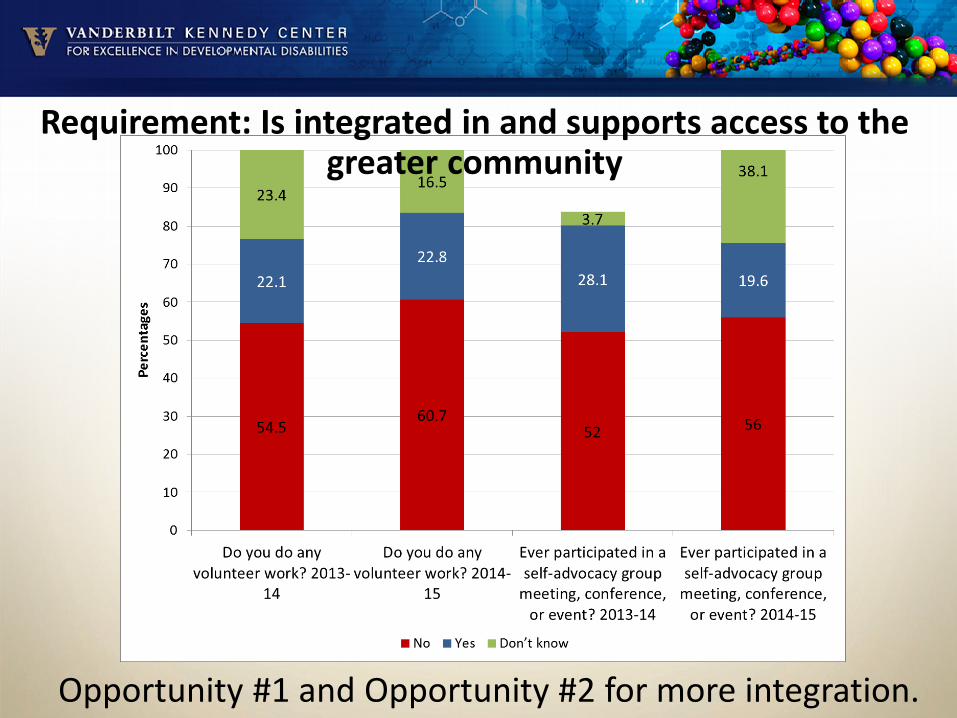
Requirement: Is integrated in and supports access to the greater community
Opportunity #1 and Opportunity #2 for more integration.

Requirement: Service planning process is driven by the individual
Success #2: People get the services they need.

Requirement: Facilitates choice of services and who provides them
Opportunity #3 Service coordinators are not viewed as partners.

Requirement: Ensures right to privacy, dignity and respect and freedom from coercion and restraint
Opportunity #4: We reduced the % who couldn’t express whether they feel fear.

Requirement: The State establishes overall health care standards and monitors those standards based on the responsibility of the
service provider as stated in the approved waiver

Requirement: Is integrated in and supports access to the greater community
Success # 3: Access to Family and Friends is HCBS Compliant

Requirement: Is integrated in and supports access to the greater community
Success #4: Almost ALL Adults are out in the Community!

Requirement: Provides opportunities to seek employment and work in competitive integrated settings, engage in
community life, and control personal resources
Success #5: We are providing a lot of employment –related supports.

Requirement: Is integrated in and supports access to the greater community
Opportunity #5 for more integration. Who are going with?

Requirement: Provides opportunities to seek employment and work in competitive integrated settings, engage in
community life, and control personal resources
Success #6: Controlling personal resources.

Requirement: Ensures right to privacy, dignity and respect and freedom from coercion and restraint
Success #7: People feel good about their privacy.

Requirement: Optimizes autonomy and independence in making life choices
Success #8: People have choices about their free time.

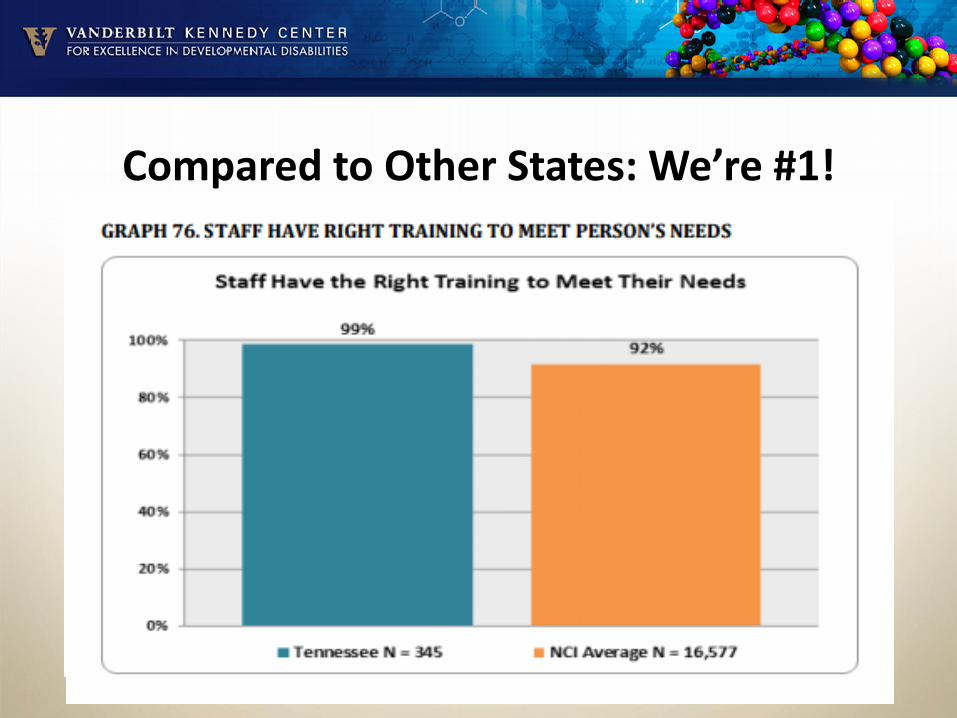
Compared to Other States: We’re #1!

Compared to Other States: We’re #1!
Compared to Other States: We’re #1!

Compared to Other States: We’re #1

Below Average⇓

Below Average⇓

Recommendations for using NCI Data for Quality Improvement
• Generate State-Specific Charts on the Website • Share the Data in an Accessible Format • http://vkc.mc.vanderbilt.edu/vkc/nci/
• Generate hypotheses and check against real data • Make changes in policy and track their effectiveness • Longitudinal tracking over time of employment, aging, health,
and other issues of interest.

o Elise McMillan o Bob Hodapp o Elisabeth Dykens o Frank Meeuwis o PTP Interview Teams o Commissioner Debra Payne o Families and staff who cooperated o Adults who agreed to participate