Embed Size (px)
Citation preview

NATIONAL CONFERENCE FOR KHARIF CAMPAIGN 2013
Department of Agriculture, Andhra Pradesh
(6th & 7h March 2013)
Northern Telangana ZoneCentral Telangana ZoneSouthern Telangana ZoneScarce Rainfall Zone
Southern ZoneNorth Coastal ZoneGodavari ZoneKrishna Zone
High Altitude Zone
Legend
1
S.No Item UnitAndhra Pradesh
1 Total Geographical area Lakh ha 275.04
2 Gross cropped area Lakh ha 145.12
3 Net cropped area Lakh ha 112.88
4 Gross Irrigated area Lakh ha 71.53
5 Net Irrigated area Lakh ha 50.34
6 % of Rainfed area % 55
7 Number of Farm Holdings Lakh Nos 131.75
a) Marginal Lakh Nos 84.25
b) Small Lakh Nos 29.18
c) Others Lakh Nos 18.32
8 Average Annual Rainfall mm 940
9 Cropping Intensity % 1.29
10 Irrigation Intensity % 1.42
ANDHRA PRADESH AGRICULTURE PROFILE
2

Sl.No. Crop
Normal Production
2012-13 (Expected)
Kharif Rabi Total
1 Rice 131.43 72.12 35.50 107.63
2 Pulses 14.49 3.47 12.53 16.01
3 Total Foodgrains 189.10 102.35 80.47 182.82
4 Oil Seeds 27.28 9.34 7.46 16.80
5 Cotton (lakh bales) 34.75 61.33 0.05 61.38
(Lakhs tones)
NOTE: Originally the food grains production target was fixed at 218.00 LMTs, but due to deficit rainfall in major parts of state during June & July 2012, and unseasonal rains during Nov. Dec. 2012, the state could not achieve the targeted food grain production.
Kharif 2012 & Rabi 2012-13 Achievements (Abstract)
3

4
Area in lakh ha, Productivity in kgs/ha & Production in LMTs
RABI 2012-13 ASSESSMENT COMPARED TO RABI 11-12 AND NORMAL
1 2 3 4 5 6 7 8 9 10 111 Rice 14.84 12.22 9.78 3642 3542 3777 54.23 43.28 35.50
2 Jowar 1.72 1.73 2.20 1523 1977 1541 2.64 3.42 3.39
3 Bajra 0.12 0.11 0.04 977 1036 938 0.12 0.11 0.04
4 Maize 3.08 3.33 3.99 6920 7759 7232 21.17 21.63 28.86
5 Bengalgram 6.06 5.65 7.36 1202 921 1264 7.71 5.20 9.30
6 Greengram 1.23 1.31 1.04 438 608 440 0.52 0.80 0.46
7 Blackgram 3.76 4.77 3.80 631 686 625 2.34 3.27 2.38
Total Pulses 11.68 12.23 12.77 935 781 980 10.92 9.56 12.53
Total Foodgrains 31.61 29.77 29.01 2825 2628 2820 89.30 78.23 80.47
8 Groundnut 2.76 2.50 2.99 1989 1849 2100 5.48 4.67 6.28
9 Sunflower 2.44 1.41 1.23 880 808 800 2.21 1.14 0.98
Total oilseeds 5.92 4.68 4.67 1353 1305 1625 8.01 6.11 7.46
10 Chillies 0.47 0.47 0.42 3366 3654 3446 1.61 1.56 1.45
11 Tobacco 1.43 1.32 1.25 1710 1965 1747 2.78 2.07 2.18
Total cropped area 39.87 36.53 35.46
Expected2012-132011-12
Expected2012-13
Normal2011-12
CropSl.No.
PRODUCTIVITY(kg/ha) PRODUCTION (LMTs)AREA (lakh ha)
Normal2011-12
Expected2012-13
Normal

5
KHARIF PROSPECTS 2013 COMPARED TO KHARIF 2012
( * ) Cotton production in lakh bales of 170 kgs. of lint (#) Mesta production in lakh bales of 180 kgs.
Normal 2012Target2013
Normal
Expctd.2012
Target2013
Normal
Expctd.
2012
Target 2013
1 Rice 26.30 24.87 28.00 2865 2900 3100 75.25 72.12 86.802 Jowar 1.25 1.03 1.30 1274 1475 1530 1.54 1.52 1.993 Bajra 0.45 0.60 0.50 1438 1749 1750 0.66 1.05 0.884 Ragi 0.39 0.36 0.45 1009 1019 1050 0.39 0.37 0.475 Maize 5.07 5.65 5.70 3165 4152 4235 16.08 23.46 24.146 Redgram 4.92 4.76 5.50 402 400 450 1.98 1.90 2.487 Greengram 1.95 1.51 2.10 442 654 670 0.83 0.99 1.418 Blackgram 0.71 0.57 0.80 574 922 930 0.39 0.53 0.74
Total Pulses 7.75 6.97 8.60 422 498 3.28 3.47 4.72 Total Foodgrains 41.50 39.84 44.90 2347 2569 97.42 102.35 119.349 Groundnut 11.95 10.59 13.00 483 512 860 5.30 5.42 11.18
10 Soybean 1.44 1.60 1.70 1466 1819 1825 2.09 2.91 3.1011 Castor 1.86 2.02 2.00 437 400 600 0.78 0.81 1.20 Total oilseeds 16.60 14.66 17.65 801 16.26 9.34 16.02
12 Cotton (*) 18.23 24.19 19.50 375 431 600 40.00 61.33 68.8213 Mesta (#) 0.25 0.14 0.25 1497 1552 1600 2.07 1.21 2.2214 Chillies 1.69 1.75 1.70 3562 3500 3600 5.98 6.13 6.1215 Sugarcane 1.89 1.96 2.00 77494 75000 87000 146.89 147.00 174.0016 Turmeric 0.68 0.68 0.70 6425 6463 6800 4.36 4.39 4.76
Total cropped area 81.12 83.47 86.95
PRODUCTION (LMTs)Sl.N.
Crop
AREA (in lakh ha) PRODUCTIVITY (in Kg/ha)

Interventions/Strategies for increasing pulse
production to achieve the target of 19+ million tones
for year 2013-14
6
GROUP IV

S.NoFiscal Year /
TermAll Pulses
Value (Crores)
1 2006-07 2491.00 4560.802 2007-08 2952.00 5649.603 2008-09 2474.11 6246.404 2009-10 3509.58 9813.375 2010-11 (P) 2591.25 6979.95
Import of Pulses(All India)
(000’ tons)
7
Source: Ministry of Agriculture – Government of India.

8
• Share of Pulses in total Cropped area = 14.68%
• Share of Pulses in Food Grains area = 26.54%
• Share of pulses in total Food Grains production = 7.09%
• Contribution of Identified Pulses to total pulse = 97.43% production (Redgram, Bengalgram, Greengram
and Blackgram)
• Area irrigated under Pulses = 1.6%
Highlights of pulses in Andhra Pradesh

9
CropArea (lakh ha) Productivity (kg/ha) Production (lakh tons)
Min Max Min Max Min Max
Redgram 4.43 6.38 307 651 1.48 3.02
Greengram 2.83 4.38 204 597 0.63 1.92
Blackgram 3.38 5.40 496 702 2.20 3.79
Bengalgram 5.65 6.47 920 1448 5.20 9.12
Pulses – Fluctuations in Area, Productivity and Production- Andhra Pradesh
(2007-08 to 2011-12)
Source:- Department of Economics & Statistics
Impact of NFSM
Xth Plan XI Plan
Area 4.30 6.07 7.14%
Yield 1150 1265 1.92%
Production 4.93 7.72 9.38%
Area 19.71 19.75 0.04%
Yield 618 736 1.36%
Production 12.08 14.52 3.75%
S.No CropNormal
CAGR
2 Total Pulses
1 Bengalgram

10
Limitations under Pulse Production in Andhra Pradesh 1. Grown under diverse situations
• Rain fed• ID crops• Under residual moisture
2. Grown under diverse soil condition• Black soils• Red soils• Chalka soils• Sandy loams
3. Input quality and availability related constraints
4. Pests & Diseases
5. Credit and Market related constraints
6. Success depends upon other crops in the crop rotation• Delayed Kharif rice reduces blackgram yields under rice fallow situation
7. Grown under poor management with less inputs• Farmers cannot afford weedicides in poor yielding blackgram / Greengram
crops.
8. Short duration blackgram / greengram are prone to vagaries of monsoon.• Rains and dry spell during kharif reduce yields of blackgram / greengram.
9. Requirement of location specific high yielding varieties and production technologies.
10. Competition from dominant commercial crops – cotton, chillies and maize.
11 . Inherent poor yielding crops and uncertain economic returns.

11
Opportunities for pulses production in Andhra Pradesh
• Fits for low rainfall areas.
• Fits in crop rotation / intercropping / mixed cropping / relay cropping situations.
• Suitable to varied soil conditions
• suitable to cultivation in rainfed / ID crop / under residual moisture situation.
• Ready market and no storage problem.
•Enable to setup small / medium dall mills in the villages creating additional employment opportunities.
• Suitable for tail end areas under project commands, tanks and wells.
• leading to saving of precious irrigation water and higher productivity of pulse crops.
• There is a large gap existing between potential and normal productivity of pulses

12
S.No CropPotential
ProductivityKg / ha
Normal Productivity
kg / ha
ProductivityGap kg / ha
1 Redgram 1274 509 765
2 Greengram 1000 414 586
3 Blackgram 2250 572 1678
4 Bengalgram 2500 1253 1247
Statement showing crop wise Potential Productivity, Normal Productivity and Productivity gap in Pulses
Source:- Department of Agriculture
Potential Productivity – Farmers best yield

13
Issues under Pulses Cultivation in Andhra Pradesh • Lack of Soil test based fertilizer use
• Not adopting balanced use of fertilizers and micronutrients
• Insufficient availability of quality seed of improved varieties
• Non availability of high yielding hybrids for high economic returns
• Lack of improved package of practices for all farming situations
• Lack of improved varieties for specific areas and requirements. eg. YMV / Maruca pod borer – Alkaline or problem soils
• Use of poor quality / un certified seed
• Use of excess seed rate and delayed sowings

14
Issues under Pulses Cultivation in Andhra Pradesh (Contd)
• Seed treatment not taken up
• Regular attack by pests and diseases
• New and minor emerging pests: Redgram –Spotted pod borer
Bengalgram –Lucerne cutworm (Spodoptera exigua)
• Rizobium innoculation not taken up
• Lack of weed management
• Non adoption of ICM
• Improved dry land farming techniques not adopted
• Area of pulses under intercropping to be increased
• Lack of Farm Mechanization
• Lack of credit support for pulses
• Less Insurance coverage for pulses• Absence of assured irrigation support
15
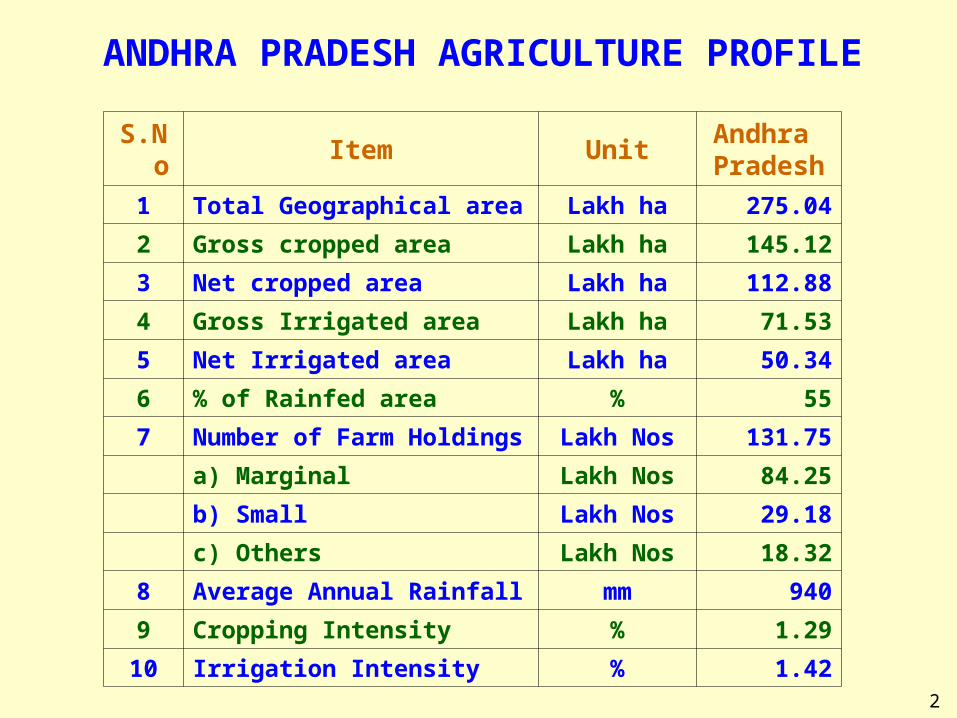
VARIETAL REPLACEMENT IN PULSES
The old varieties are being replaced by the new varieties which are as follows:
• Redgram :-The traditional variety LRG-30 is being
replaced by LRG-41, ICPL85063, ICPL87119, PRG-158.
• Greengram:-The old variety- ML-267 is being replaced
by LGG-407, LGG-460, MGG-295.
• Blackgram:-The old varieties eg. T-9 are being replaced
by LBG-752, LBG- 623, LBG-645.
• Bengal gram:-Annegiri variety is being replaced by JG-11, JAKI-9218, KAK-2, ICCC-37, ICCV-10.

16
SEED REPLACEMENT RATE (%)
NB: This programme is supported under NFSM & ISOPOM
Sl.No.Name of the
crop2006-07 2007 -08 2008-09 2009- 10 2010-11 2011-12 2012-13
1 Redgram 32 36 42 45 47 48 50
2 Greengram 28 39 44 44 45 47 50
3 Blackgram 22 34 39 40 42 45 46
4 Bengalgram 49 53 60 62 64 65 65
Sl N0
CROPNO
RELEASEDNAME OF THE VARIETY
DURATION (Days)
Yield Potential (Q/Ha)
1 Blackgram 2 MBG-207, LBG-752, PU-31 75 TO 80 13 TO 18
2 Greengram 1 MGG-347 60 TO 70 12 TO 14
3 Redgram 2 WRG-53, MRG-1004 160 TO 180 16 TO 22
NEW VARIETIES BROUGHT INTO SEED CHAIN
This programme is supported under RKVY, State Plan

17
S.No CropArea
Covered (ha)
Number of units (10 ha)
Expected C/S Production (lakh qtls)
1 Redgram 2520 252 201602 Greengram 880 88 35203 Blackgram 3510 351 140404 Bengalgram 20970 2097 131038
SEED VILLAGE PROGRAMME UNDER PULSES
SEED MULTIPLICATION RATIO (SMR)
S.No Crop SMR
1 Redgram 1 : 100
2 Greengram 1 : 40
3 Blackgram 1 : 40
4 Bengalgram 1 : 10
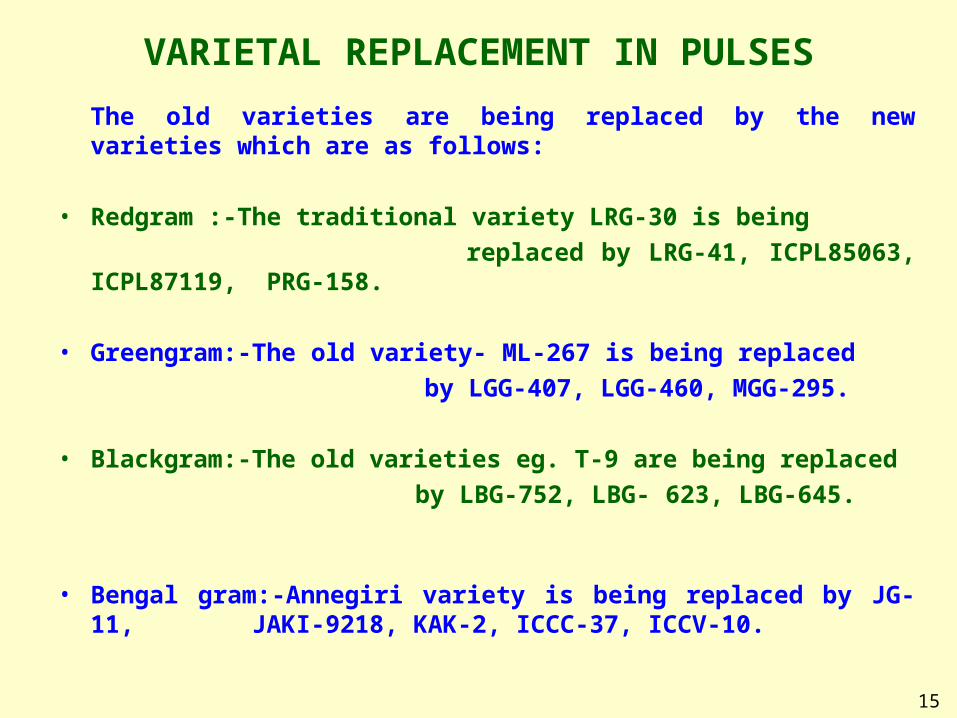
Coordination with SFAC/NGOs for promotion of Pulses (A3P)
• SFAC identified the following NGOs for capacity building to organize FPOs, investment and market linkage under A3P, 60000 villages.
• Access Livelihoods Consulting India
• Vrutti Livelihood Resource Centre
• Indian Society of Agri Business Professionals
• A3P Demonstrations were allotted to these NGOs in Kharif -12 as detailed below.
S.No
DistrictResource agency
CropNo. of A3P
cluster Mandal
1 Medak VRUTTIBlackgram 10 ZaheerabadGreengram 10 Regode
2 Mahabubnagar ALCI Redgram 10 Kodangal
3 Adilabad ISAP Redgram 10Tamsi
Kerameri
18
• The yield recorded under A3P of Redgram demonstration in Mahabubnagar and Adilabad districts is ranged between 1450 to 1480 Kg / ha as against 1210 Kg / ha in other farmer’s field.
• The yield recorded under A3P of Greengram & Blackgram in Medak district is 1175 kgs / ha as against 950 kg / ha in other farmer’s field.

Procurement of Pulses by APMARKFED
Blackgram:
• APMARKFED - Nodal agency for procurement of pulses and to coordinate with NAFED
• MARKFED is monitoring the market prices and opened purchase centres for Blackgram in four districts and procured 44500 qtls so far.
Redgram
• MARKFED identified 8 districts for procurement center i.e. Rangareddy, Adilabad, Medak, Mahabubnagar, Guntur, Prakasam, Kurnool and Ananthapur.
• So far 52000 qtls of Redgram is procured
19

20
CONCLUSIONS
• Proposed to increase the area under pulses from 19.30 lakh ha (2011-12) to 21.00 lakh ha by 2013-14.
• Production will be increased from a normal of 14.74 lakh tons to 18.19 lakh tons by enhancing productivity and area.
• Proposed to bridge the yield gap by increased Seed Replacement and integrated crop management.
• Thus optimizing from normal productivity to potential productivity.

Good Practices and success stories
21

Promotion of SRI in a mission mode
Credit - Andhra Pradesh State holds the No. 1 rank in disbursement of agricultural crop and term loans
Interest free loan from Rabi 2011-12
Andhra Pradesh Government has issued Land Licensed Cultivators Ordinance to protect the interest of Licensed Cultivators
Loan & Other benefit eligibility cards issued by the government to the Licensed Cultivators and being provided Bank credit, Input subsidy and Insuurance coverage.
Focus on Farm Mechanization
Strengthening seed, fertilizer and pesticide labs
e-Vyavasayam - AGRISNET
DAATT centres in all districts
BEST PRACTICES ADOPTED IN AGRICULTUREBEST PRACTICES ADOPTED IN AGRICULTURE
22

Achievement of Kharif – 1.53 lakh ha Target for Rabi - 3.40 lakh ha Achievement so far – 1.27 lakh ha 4175 Drum Seeders supplied on 50%
subsidy 3325 Conoweeders supplied on 50%
subsidy.
23
Promotion of SRI Cultivation

Institutional Credit - Rythusri
Sl. No Financial
Year
Target/Proposed
Total Agriculture
(crores)
Crop loans
AgricultureCredit Achv.
No.of farmers covered
No.of farmers
proposed to cover
(lakhs)
Amount Proposed for 0% Interest on crop loans
Remarks
1 2011-12 48000 36451 58510 99.00 - -
22012-13 as on 28-2-13
52972 37373 45565 82.00 99.00 375
3 2013-14 63000 40921 - - 99.25 560
4 2014-15 72000 47000 - - 99.50 875
5 2015-16 81000 53500 - - 99.75 967
6 2016-17 92000 61000 - - 100.00 1070
The budget proposed for 0% interest on crop loans has been calculated by assuming that about 70% of crop loans disbursed are repaid in time.
• To mitigate the financial burden of the farmers – additional relief
• To encourage the farmers to avail institutional credit and inculcate timely repayment – Interest free loans are provided from Rabi-2011-12
24
Target/Proposed Total Agriculture (crores)
0
20000
40000
60000
80000
100000
1 2 3 4 5 6
Target/Proposed TotalAgriculture (crores)

Crop Insurance Support
S.No. YearNo.of Crops
(Kharif+ Rabi)No. of Farmers Insured (lakhs)
1 2011-12 25 30.602 2012-13 26 33.003 2013-14 26 33.504 2014-15 26 34.005 2015-16 26 34.506 2016-17 26 35.00
• To provide a measure of financial support to the farmers in the event of yield loss
• To restore credit eligibility of farmers in case of crop failure• To help stabilize farm incomes particularly in disaster years
25
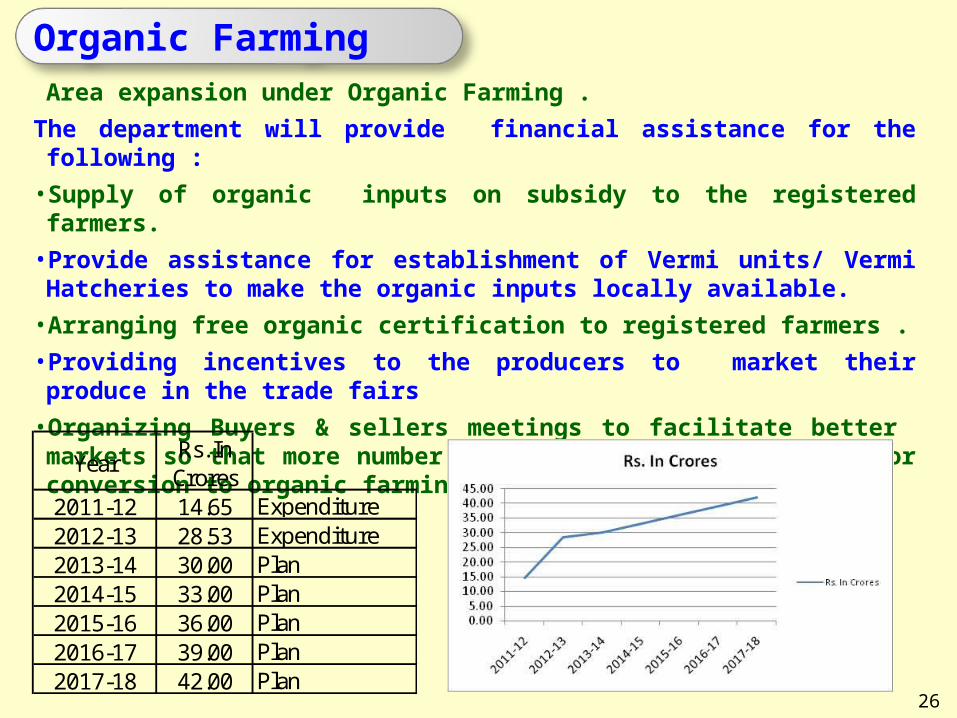
Organic FarmingArea expansion under Organic Farming .
The department will provide financial assistance for the following :
• Supply of organic inputs on subsidy to the registered farmers.
• Provide assistance for establishment of Vermi units/ Vermi Hatcheries to make the organic inputs locally available.
• Arranging free organic certification to registered farmers .
• Providing incentives to the producers to market their produce in the trade fairs
• Organizing Buyers & sellers meetings to facilitate better markets so that more number of farmers can be motivated for conversion to organic farming etc.
YearRs. In
Crores2011-12 14.65 Expenditure2012-13 28.53 Expenditure2013-14 30.00 Plan2014-15 33.00 Plan2015-16 36.00 Plan2016-17 39.00 Plan2017-18 42.00 Plan
26
Innovations
1. Farmers Producers Organizations
Objectives:
• Mobilizing farmers in groups at village level and build their associations – FPOs
• Strengthen farmers capacity
• Ensuring access to and usage of quality inputs and services
• Facilitate access to fair and remunerative market
Andhra Pradesh is the only state in the country to promote FPOs in coordination with SFAC / NGOs under pulses development.
In three districts i.e. Mahabubnagar, Adilabad and Medak farmers have been organized in coordination with SFAC / NGOs.
SFAC proposes to operate 8 procurement centers for purchase of pulses in the above districts with 40 FPOs on pilot basis to ensure MSP
The FPOs will operate at farmer’s door step.
It is proposed to upscale and organize FPOs in all the districts
27

1 Physical Target 3600 nos2 Total cost 100.00 cr3 30% subsidy from MNRE 30.00 cr4 50% subsidy from RKVY 50.00 cr5 20% farmers contribution 20.00 cr
2. SOLAR PUMPS FOR IRRIGATION
Out lay of Proposed Project -2013-14
3. Upscaling of SRI Cultivation• Coordination with ANGRAU, DRR, ICRISAT, NABARD and NGOs
FOCUS ON CONSEVATION OF ENERGY IN AGRICULTURE
Diversification of crops from Paddy to other crops
Promotion of SRI Cultivation / Direct seeding Adopting ISI make mono block pump sets Usage of capacitors for the motors Usage of rigid PVC pipes to carry water Distribution of broachers in Telugu to farmers
during RCY / Rythu Sadassulu
28

12th Plan Objectives• Faster growth: Targets a growth rate higher than national average• More inclusive growth: Broad-based growth involving all sectors and
all section of people.• Sustainability of growth:
o Resource conservation and efficient useo Arresting environmental degradation
Outcome indicators in the Agriculture
2013-14 2016-171 Foodgrains area (lakh ha) 82.00 84.50 94.002 Foodgrains Production (lakh tons) 184.00 225.00 300.003 SRI area (lakh ha) 3.00 5.00 10.004 Pulses (lakh ha) 19.00 21.00 25.005 Institutional Credit (lakh crores) 0.53 0.62 0.926 Micronuutrient (Area coverage in lakh ha) 0.5 2.00 10.00
ToFromCropS.No
29

• Diversification of farming systems, achievement of complementarity• Farm Mechanization and Automation• Institutional Credit & Insurance Support to Farmers• Aggregation of farmers and market development• Food processing• Research and Development
Broad Strategies
Opportunities• Import substitution.
• Edible Oil Import - 10 - 12 MMTs• Pulses Import - 2 - 4 MMTs
• Increasing domestic demand for high value foods i.e. Meat, Milk, Fruits and Vegetables
• Export potential for Rice, Maize, Cotton, Sugar, Soybean, Poultry, Meat, Dairy & Fishery products.
• Nationally funded schemes such as RKVY and NREGP• PPP interventions 30

• 131 lakh enthusiastic farmers• 140 lakh ha cultivable area• 75 lakh ha of irrigation potential• 900 km of coast line & 3 major river basins• Record productivities achieved in case of maize, soybean,
chickpea, jowar, poultry and fishery sectors• Network of SAU and ICAR Institutions in the State
Strengths
Weaknesses• Small farm size (1.08 ha)• Lack of specialized farming belts & associated infrastructure• Natural calamities, droughts & floods.• Only 8 lakh ha of irrigated area under micro irrigation.• Shortages in storage space including cold storages• Very low level of food Processing• Dominance of supply side orientation over demand side management by
the R&D and Extension Systems 32

• Increasing the area under SRI cultivation from 3 lakh ha to 10 lakh ha
• Extending oil palm to cover the entire identified area of 4.2 lakh ha.
• Increasing the area under micro irrigation from 7.8 lakh ha to 15 lakh ha.
• Adoption of precision farming techniques• Organization and Development of Farmers’ Interest Groups
(FIGs) and Farmers’ Producers Organizations. (FPOs) Setting up of farmers’ commission and farm commodities’ council
• Focus on Farm Mechanization• Establishment of 1000 Machinery Hiring And Service Centres• Bringing about 1.0 lakh ha under Bio-fuel plantations (0.3 lakh
MT of bio-fuel)
Priorities for XII Five Year Plan
32

Sl.No
CropArea (Lakh ha) Productivity
(MT/ha)Production (L.MT)
2011-12
2016-17
2011-12
2016-17
2011-12
2016-17
1. Rice 40 40 3.182 4.0 132 160.00
2. Maize 8.53 10 4.253 5.0 36.27 50.00
3. Jowar 2.84 5.0 1.20 2.5 3.41 12.50
4. Bengal gram 5.70 10.0 1.325 2.0 7.55 20.00
5. Soybean 1.26 2.0 1.488 2.0 1.87 4.00
6. Groundnut 13.10 10.0 0.846 1.5 11.08 15.00
Important XII Plan Projection
33

GSDP at Current and Constant Prices (2004-05)
Agriculture and Allied Sector
Achievements during XI Plan, projected demand / growth during XII Plan and Monitorable targets
in Agriculture and Allied Sectors
A.
Constant Current Constant Current
2007-08 22.95 40.51 17.38 28.83
2008-09 -2.52 14.61 0.76 14.69
2009-10 -3.04 8.86 1.32 12.60
2010-11 9.67 24.51 9.00 18.44
2011-12 -10.52 -2.65 -1.79 5.74
Total 3.31 17.17 5.33 16.06
YearAgriculture Total Primary sector
34

Achievements during XI Plan Projected demand of foodgrains and other commodities
B.
Sl. No.
Crop/Commodities UnitsTargets
for XI Plan
Achievements by
end of XI Plan
Projected Demand by
end of XII Plan
1 Total Foodgrains1.1 Rice 000 tons 10763 14739 216581.2 Wheat 000 tons 7 12 131.3 Maize 000 tons 5232 5144 51381.4 Total cereals 000 tons 16682 20721 276231.5 Total Pulses 000 tons 1601 1776 24291.6 Total Oilseeds 000 tons 1680 2499 32221.7 Total Fruits 000 tons 53000 57601 777601.8 Total Vegetables 000 tons 35000 38351 51700
2 Commercial Crops2.1 Cotton 000 tons 6138 6882 35542.2 Sugarcane 000 tons 80145 77018 78011
3 Critical Inputs3.1 Seed 000 tons 87.57 87.57 110.613.2 Fertilizer 000 tons 34415 31969 446203.3 Bio Fertilizers 000 tons 0.54 0.51 1.003.4 Credit Rs. Lakhs 16698500 19095100 32628100
35

Monitorable targets for XII PlanC.
Sl. No.
Crop/Commodities UnitsTargets for XI Plan
Achievements by
end of XI Plan
Projected Demand by
end of XII Plan
1 Cereal Crops1.1 Rice 000 tons 10763 14739 216581.2 Wheat 000 tons 7 12 131.3 Total cereals 000 tons 16682 20721 27623
2 Total Pulses 000 tons 1601 1776 24292.1 Gram 000 tons 930 910 10082.2 Tur 000 tons 193 148 728
3 Total Oilseeds 000 tons 1680 2499 32223.1 Groundnut 000 tons 1170 1748 23963.2 R&M 000 tons 3 15 43.3 Soybean 000 tons 291 310 296
4 Total Fruits 000 tons4.1 Banana 000 tons 3218 3531 60004.2 Apple 000 tons - - -4.3 Mango 000 tons 3901 4300 6600
Cont….36

Cont….
Cont….
Sl. No.
Crop/Commodities UnitsTargets for XI Plan
Achievements by
end of XI Plan
Projected Demand by
end of XII Plan
5 Total Vegetables5.1 Potato 000 tons 101 103 1135.2 Tomato 000 tons 6185 6375 82145.3 Other (Specify) 000 tons 6088 10338 43353
6 Commercial Crops6.1 Cotton 000 tons 6138 6882 65546.2 Jute 000 tons 121 222 3436.3 Sugarcane 000 tons 15010 15208 78011
77.1 Seed production (B/S, F/S, C/S) Lakh qtls 152.26 152.26 204.837.2 Seed distribution (on subsidy) Lakh qtls 87.57 87.57 110.61
8 Micro Irrigation8.1 Addl. Area under Micro Irrigationlakh ha 6.84 6.83 18.69
9 Credit9.1 No. of farmers insured (in lakh) Number - 133.18 1709.2 Area of crop insured lakh ha - 206.06 2639.3 No. of K.C.C. Number - 1888000 2076000
Seeds production and distribution Crop wise
37

Cont….
Sl. No.
Crop/Commodities UnitsTargets for XI Plan
Achievements by
end of XI Plan
Projected Demand by
end of XII Plan
10 Farm Mechanization10.1 Energy uses kw/ha 1.63 1.7 1.910.2 No. of tractors Number 100 150 300010.3 No. of seed drills Number 2500 12000 2500010.4 No. of sprayers Number 20000 100000 15000010.5 No. of Rotavators Number 10000 18000 4500010.6 No.of cultivators Number 30000 70000 5000010.7 No. of Power weeders Number 5000 12000 2500010.8 No. of transplanters Number 250 100 500011 Agriculture area expansion11.1 Addl. Area under irrigation Lakh ha 7.2 3.6 3.611.2 Addl. Area under cultivation Lakh ha 0.2 0.12 0.0811.3 Wasteland developed for cultivationLakh ha 2.76 1.1 1.66
38

39
THANK YOUTHANK YOU

GSDP at Current and Constant Prices (2004-05)
Agriculture and Allied Sector
GSDP (Rs. in Crores)
Growth Rate (%)
GSDP (Rs. in Crores)
Growth Rate (%)
2006-07 34951 60966
2007-08 42973 22.95 71563 17.38
2008-09 41891 -2.52 72108 0.76
2009-10 40616 -3.04 73059 1.32
2010-11 44545 9.67 79631 9.00
2011-12 39858 -10.52 78208 -1.79
Average 3.31 5.33
Year
Agriculture alone Agriculture & Allied Sector
Achievements during XI Plan, projected demand / growth during XII Plan and Monitorable targets
in Agriculture and Allied Sectors
A.
40

AGRICULTURE:
Distribution of seeds at subsidized rates by providing Rs.262 crores
Own seed development scheme (Seed Village Scheme) with an outlay of Rs.52 crores
Production of new Varieties of foundation and certified seed, Development of infrastructure by providing Rs.25 crores
Expansion of sprinkler and drip irrigation with Rs.40 crores
Correcting Micronutrient deficiency with Rs.15 crores
Farmer Field Schools- Rs.13 crores
Organizing RCYs & Rythu Sadassus in the State
Providing Rs.17 crores under Input subsidy to other farmers under crop losses due to Natural calamities
Single window facility for Agriculture services
Hire service centers for farm machines
“Bhoochetana” throughout State
Highlights of Agriculture Budget 2012-13
41

Classification of states based on Yield and Variability
States can be classified based on yield variability as:• High yield high variability – Andhra Pradesh & Gujarat etc.• High yield low variability – MP & Maharashtra etc• Low yield high variability – Raj & TN etc.• Low yield and low variability – Orissa.
NB:- These states have 45.8% of the area and 48.8% of production
Kharif Pulses
High LowestAndhra Pradesh 551 226Gujarat 725 292Madhya Pradesh 527 370Maharastra 665 350
High yield high variability
Category StateAverage yield
(1995-96 to 2006-07) (kg/ha)
NB:- These states have 25.4% of the area and 24.4% of production
(Total Pulses)
High LowestAndhra Pradesh 772 330Bihar 887 609Gujarat 748 300Karnataka 487 295
Average yield (1995-96 to 2006-07) (kg/ha)
High yield high variability
Category State
44