Embed Size (px)
Citation preview
NBER WORKING PAPER SERIES
FREE DISTRIBUTION OR COST-SHARING? EVIDENCE FROM A MALARIAPREVENTION EXPERIMENT
Jessica CohenPascaline Dupas
Working Paper 14406http://www.nber.org/papers/w14406
NATIONAL BUREAU OF ECONOMIC RESEARCH1050 Massachusetts Avenue
Cambridge, MA 02138October 2008
We thank the Mulago Foundation for its financial support. We also thank the donors to TAMTAMAfrica, Inc. for providing the free nets distributed in this study. Jessica Cohen was funded by a NationalScience Foundation Graduate Research Fellowship. We are very grateful to the Kenya Ministry ofHealth and its staff for their collaboration. We thank Eva Kaplan, Nejla Liias, and especially KatharineConn and Moses Baraza for the smooth implementation of the project and the excellent data collection.We also thank David Autor, Esther Duflo, William Easterly, Greg Fischer, Raymond Guiteras, SendhilMullainathan, Mead Over, Dani Rodrik, and numerous seminar participants for helpful comments.All errors are our own. The views expressed herein are those of the author(s) and do not necessarilyreflect the views of the National Bureau of Economic Research.
NBER working papers are circulated for discussion and comment purposes. They have not been peer-reviewed or been subject to the review by the NBER Board of Directors that accompanies officialNBER publications.
© 2008 by Jessica Cohen and Pascaline Dupas. All rights reserved. Short sections of text, not to exceedtwo paragraphs, may be quoted without explicit permission provided that full credit, including © notice,is given to the source.
Free Distribution or Cost-Sharing? Evidence from a Malaria Prevention ExperimentJessica Cohen and Pascaline DupasNBER Working Paper No. 14406October 2008JEL No. C93,D12,H23,H42
ABSTRACT
It is often argued that cost-sharing—charging a subsidized, positive price—for a health product isnecessary to avoid wasting resources on those who will not use or do not need the product. We explorethis argument through a field experiment in Kenya, in which we randomized the price at which prenatalclinics could sell long lasting anti-malarial insecticide-treated nets (ITNs) to pregnant women. Wefind no evidence that cost-sharing reduces wastage on those that will not use the product: women whoreceived free ITNs are not less likely to use them than those who paid subsidized positive prices. Wealso find no evidence that cost-sharing induces selection of women who need the net more: those whopay higher prices appear no sicker than the average prenatal client in the area in terms of measuredanemia (an important indicator of malaria). Cost-sharing does, however, considerably dampen demand.We find that uptake drops by 75 percent when the price of ITNs increases from zero to $0.75 (i.e.from 100 to 87.5 percent subsidy), the price at which ITNs are currently sold to pregnant women inKenya. We combine our estimates in a cost-effectiveness analysis of ITN prices on child mortalitythat incorporates both private and social returns to ITN usage. Overall, our results suggest that freedistribution of ITNs could save many more lives than cost-sharing programs have achieved so far,and, given the large positive externality associated with widespread usage of ITNs, it would likelydo so at a lesser cost per life saved.
Jessica CohenBrookings Insitution1775 Massachusetts Ave, NWWashington, DC [email protected]
Pascaline DupasDepartment of EconomicsUCLA8283 Bunche HallLos Angeles, CA 90095and [email protected]
1. Introduction Standard public finance analysis implies that health goods generating positive externalities should be
publicly funded, or even subsidized at more than 100% if the private non-monetary costs (such as side
effects) are high. While this analysis applies to goods whose effectiveness is independent of the behavior of
the recipients (e.g. vaccines, de-worming pills administered to schoolchildren every 6 months), it does not
necessarily apply to goods that require active usage (adherence) by their owner for the public health
benefits to be realized (e.g. bed nets for reduced malaria transmission, pit latrines for reduced water
contamination, etc.). For such goods, charging non-zero prices (“cost-sharing”) could improve the efficacy
of public subsidies by reducing wastage from giving products to those who will not use them. There are
three possible effects of positive prices on the likelihood that people who acquire the product use it
appropriately. First, a selection effect: charging a positive price could select out those who do not value the
good and place it only in the hands of those who are likely to use it (Ashraf, Berry and Shapiro, 2007; PSI,
2003; Oster, 1995). Second, a psychological effect: paying a positive price for a good could induce people
to use it more if they exhibit “sunk cost” effects (Thaler, 1980; Arkes and Blumer, 1985). Third, higher
prices may encourage usage if they are interpreted as a signal of higher quality (Bagwell and Riordan, 1991;
Riley, 2001).2
While cost-sharing may lead to higher usage intensity than free distribution, it may also reduce program
coverage by dampening demand. A number of experimental and field studies indicate that there may be
special psychological properties to zero financial price and that demand may drop precipitously when the
price is raised slightly above zero (Ariely and Shampan’er, 2006; Kremer and Miguel, 2007). Beyond
reducing demand, selection effects are not straightforward in the context of credit and cash constraints. That
is, if people who cannot afford to pay a positive price are more likely to be sick and need the good, then
charging a positive price would screen out the neediest and could significantly reduce the health benefits of
the partial subsidy.
In the end, the relative benefits of various levels of subsidization of health products depend on a few key
factors: 1) the elasticity of demand with respect to price, 2) the elasticity of usage with respect to price
(which potentially includes selection, psychological, and signaling effects), 3) the impact of price variation
2 Most likely, the price of a public health good influences beliefs about its importance/benefits and its value if the good is being distributed in a context in which its health benefits and re-sale value are not well known.
2
on the vulnerability (i.e. need) of the marginal consumer and, finally, 4) the presence of non-linearities or
externalities in the health production function.3
This paper estimates the first three parameters simultaneously and explores the tradeoffs between free
distribution and cost-sharing for a health product with a proven positive externality: insecticide-treated bed
nets (ITNs). ITNs are used to prevent malaria infection and have been proven highly effective in reducing
maternal anemia and infant mortality, both directly for users and indirectly for non-users with a large
enough share of users in their vicinity.4 The manufacturing of ITNs is expensive and the question of how
much to subsidize them is at the center of a very vivid debate in the international community, opposing
proponents of free distribution (Sachs, 2005; WHO, 2007) to advocates of cost-sharing (PSI, 2003;
Easterly, 2006).
In a field experiment in Kenya, we randomized the price at which 20 prenatal clinics could sell long-lasting
ITNs to pregnant women. Four clinics served as a control group and four price levels were used among the
other 16 clinics, ranging from 0 (free distribution) to 40 Kenyan shillings ($0.60). ITNs were thus heavily-
subsidized, with the highest price corresponding to a 90 percent subsidy, comparable to the subsidies
offered by the major cost-sharing interventions operating in the area and in many other malaria endemic
African countries. To check whether women who need the ITN most are willing to pay more for it, we
measured hemoglobin levels (a measure of anemia and an important indicator of malaria in pregnancy) at
the time of the prenatal visit. To estimate the impact of price variation on usage, we visited a sub-sample of
women at home a few months later to check whether they still had the net and whether they were using it.
The relationship between prices and usage that we estimate based on follow-up home visits is the combined
effect of selection and sunk cost effects.5 To isolate these separate channels, we follow Karlan and Zinman
(2008) and Ashraf et al. (2007) and implement a randomized, two-stage pricing design. In clinics charging a
positive price, a sub-sample of women who decided to buy the net at the posted price could participate in a
3 There are other potential channels from the price of a health product to its health impact. For example, the price could influence how the product is cared for (e.g. a more expensive bed net could be washed too frequently, losing the efficacy of its insecticide) or could have spillover effects to other health behaviors. We focus on the four channels described above because these are most commonly cited in the debate over pricing of public health products and likely to be of first-order impact in the relationship between prices and health outcomes. 4 While the externality has been demonstrated to be very strong for non-users in the vicinity of users, it should theoretically be substantial for individuals further away as well since the presence of ITNs reduces the overall number of mosquitoes in the population (the malaria vector) and the number of malaria parasites available for the remaining mosquitoes to transmit. 5 The correlation between prices and usage is also potentially the product of signaling effects of prices, but it is unlikely in our context. Qualitative evidence suggests that the great majority of households in Kenya know that ITNs are subsidized heavily for pregnant women and young children and that the “true” price of ITNs (i.e. the signal of their value) is in the $4-$6 range. This is likely due to the fact that retail shops sell unsubsidized ITNs at these prices.
3

lottery for an additional discount; for women who participated in this second-stage lottery, the actual price
ranged from 0 to the posted price. Among women who agreed to pay a given posted price, any variation in
usage with the actual price paid should be the result of psychological sunk cost effects. Taken together, both
stages of this experimental design enable us to estimate the relative merits of free distribution and varying
degrees of cost-sharing on uptake, selection, and usage intensity.
We find that the uptake of ITNs drops significantly at modest cost-sharing prices. While we do not find a
large drop in demand when the price increases from zero to slightly above zero ($0.15), demand drops by
60 percent when the price is increased from zero to 40Ksh ($0.60). This latter price is still 10Ksh ($0.15)
below the prevailing cost-sharing price offered to pregnant women in this region. Our estimates suggest that
of 100 pregnant women receiving an ITN under full-subsidy, 25 of them would purchase an ITN at the
prevailing cost-sharing price.
Given the very low take up at higher prices, the sample of women for which usage could be measured is
much smaller than the initial sample of women included in the experiment, limiting the precision of the
estimates of the effect of price on usage. Keeping in mind this caveat, we find no evidence that usage
intensity is increasing with the price of ITNs. Women who paid the highest price were slightly (though
insignificantly) more likely to be using the net than women who received the net for free, but at
intermediate prices the opposite was true, showing no clear relationship between the price paid and
probability of usage, as well as no discontinuity in usage rates between zero and positive prices. Further,
when we look only at women coming for their first prenatal care visit (the relevant long-run group to
consider) usage is highest among women receiving the fully-subsidized net. Women who received the net
free were also no more likely to have re-sold it than women paying higher prices.
This result combines the selection and sunk cost effects, and the finding that there is no overall effect of
ITN prices on usage suggests that any potential psychological effects of prices on usage are minor in this
context (unless they are counteracted by opposite selection effects, which is unlikely). The absence of
evidence of sunk cost effects is supported by the results from our second-stage randomization, in which we
find no significant effect of the actual price paid (holding the posted price constant) on usage. This result is
consistent with other recent field work on the sunk cost effect of prices on usage of a water purification
product (Ashraf et al. 2007).
In order to explore whether higher prices induce selection of women who need the net more, we measured
baseline hemoglobin levels (anemia rates) for women buying/receiving nets at each price. Anemia is an
4
important indicator of malaria and is a common symptom of the disease in pregnant women in particular.
We find that prenatal clients who pay positive prices for an ITN are no sicker, at baseline, than the clients at
the control clinics. On the other hand, we find that recipients of free nets are healthier at baseline than the
average prenatal population. We suspect it is driven by the incentive effect the free net had on returning for
follow-up prenatal care before the benefits of the previous visit (e.g. iron supplementation) had worn off.
Taken together, our results suggest that cost-sharing ITN programs may have difficulty reaching a large
fraction of the populations most vulnerable to malaria. While our estimates of usage rates among buyers
suffer from small sample imprecision, effective coverage (i.e. the fraction of the population using a program
net) can be precisely estimated and appears significantly (and considerably) higher under free distribution
than under a 90 percent subsidy. In other words, we can confidently reject the possibility that the drop in
demand induced by higher prices is offset by increases in usage. Because effective coverage declines with
price increases, the level of coverage under cost-sharing is likely to be too low to achieve the strong social
benefits that ITNs can confer. When we combine our estimates of demand elasticity and usage elasticity in
a model of cost-effectiveness that incorporates both private and social benefits of ITNs on child mortality,
we find that for reasonable parameters, free distribution is at least as cost-effective as partial-but-still-highly
subsidized distribution such as the cost-sharing program for ITNs that is currently underway in Kenya. We
also find that, for the full range of parameter values, the number of child lives saved is highest when ITNs
are distributed free.
An important dimension of the debate on free distribution versus cost-sharing is the effect of full subsidies
on the distribution system. In particular, the behavior of agents on the distribution side, notably health
workers in our context, could depend on the level of subsidy. While user fees can be used to incentivize
providers (World Bank, 2004), free distribution schemes have been shown to be plagued by corruption (in
the form of diversion) among providers (Olken, 2006). Our experiment focused on the demand side, and
was not powered to address this distribution question, but the anecdotal evidence gathered in our
experiment does not support the hypothesis that distribution generates higher leakage of ITNs to non-
intended beneficiaries.6 We also did not observe any second-hand market develop in areas with free
distribution. Among both buyers and “recipients” of ITNs, the retention rate was above 90 percent.
Our findings are consistent with previous literature on the value of free products: in a series of lab
experiments, both hypothetical and real, Ariely and Shampan’er (2006) found that when people have to
6 We observed more leakage and theft (by clinic staff) when ITNs were sold at a higher price; but given the limited number of clinics involved in the study, we do not have statistical power to draw any conclusion.
5
choose between two products, one of which is free, charging zero price increases consumers’ valuation of
the product itself, in addition to reducing its cost. In a recent study in Uganda, Hoffmann (2007) found that
households who are told about the vulnerability of children to malaria on the day they acquire an ITN are
more likely to use the ITN to protect their children when they receive it for free than when they have to pay
for it.7 In a study conducted with the general Kenyan population, Dupas (2008) randomly varied ITN prices
over a much larger range (between 0 and $4), and also found no evidence that charging higher prices leads
to higher usage intensity.
On the other hand, our finding that usage of ITNs is insensitive to the price paid to acquire them contrasts
with the finding of Ashraf et al. (2007), in which Zambian households that paid a higher price for a water-
treatment product were more likely to report treating their drinking water 2 weeks later. Their experimental
design departs from ours in two ways that could explain the difference in findings. First, because the range
of prices at which the product was offered in their experiment did not include zero, Ashraf et al. (2007) do
not measure usage under a free distribution scheme. Second, in contrast to a bed net that can be used for
three years before it wears out, the bottle of water disinfectant used in Ashraf et al. (2007) lasts for only
about 1 month if used consistently to treat the drinking water of an average family; in this context, it is
possible that households who purchased the water disinfectant but were not using it two weeks later had
stored the bottle for later use (e.g. for the next sickness episode in their household or the next cholera
outbreak), and therefore the evidence on usage in Ashraf et al. (2007) has a different interpretation than
ours.
Our results also have to be considered in their context: ITNs have been advertised heavily for the past few
years in Kenya, both by the Ministry of Health and the social-marketing NGO Populations Services
International (PSI); pregnant women and parents of young children have been particularly targeted by the
malaria prevention messages; and most people (even in rural areas) are aware that the unsubsidized price of
ITNs is high, thus reducing the risk that low prices through large subsidies are taken as a signal of bad
quality. Our results thus do not speak to the debate on optimal pricing for health products that are unknown
to the public.
But if the context of widespread awareness about ITNs may explain why price does not seem to affect
usage among owners, it makes the steep price-elasticity of demand we observe all the more puzzling.
7 A possible interpretation of this result is that recipients of free ITNs may feel that they “owe” it to the donor to use the ITN as intended. It is also possible that households that are willing to pay more for a net are those who want it in order to protect the primary-income earner.
6

While large effects of prices on take-up have been observed in other contexts, they were found for less well-
known products, such as de-worming medication (Kremer and Miguel, 2007) or contraceptives (Harvey,
1994). Given the high private returns to ITN use, the price-elasticity we observe is larger in magnitude than
what a standard model of human capital investments would predict, and suggests that pregnant women in
rural Kenya are either highly credit- or saving- constrained or highly present-biased (or both). Further
research is needed to estimate the relative importance of these factors.
The remainder of the paper proceeds as follows. Section 2 presents the conceptual framework. Section 3
provides background information on ITNs and describes the experiment and the data. Section 4 describes
the results on price elasticity of demand, price elasticity of usage, and selection effects on health. Section 5
presents a cost-effectiveness analysis, and Section 6 concludes.
2. Conceptual Framework Let’s consider a social planner whose objective is to minimize the incidence of some poor health outcome Y
(e.g. malaria episodes) through the distribution of a health tool (X). The social planner has to choose the
price P at which to sell the good. Define effective coverage as:
NIOC ×
=
where O is the number of people owning the good, I is the fraction of those who own the good using it and
N is the total population.
Suppose the structural relationship between health outcomes (Y), effective coverage (C) and prices (P) is
given by: . We can rewrite this as: Y = F [C{O(P), I(P)}], and we can derive: )]P(C[FY =
PI
IC
CF
PO
OC
CF]
PI
IC
PO
OC[
CF
PC
CF
PY
∂∂
⋅∂∂⋅
∂∂
+∂∂⋅
∂∂⋅
∂∂
=∂∂
⋅∂∂
+∂∂⋅
∂∂
⋅∂∂
=∂∂⋅
∂∂
=∂∂
(1)
The first component in (1) corresponds to the “demand” effect of price, or the extensive margin. The second
component corresponds to the “intensity of usage” effect of price. Let’s consider each component of (1)
separately.
Demand effect: Extensive margin
We know that (i.e. higher effective coverage with X reduces the prevalence of some disease
Y). We also know that (i.e. if more people own the good, effective coverage increases) and
(i.e. if the price of a good increases the number of people owning it decreases). Therefore, if
there is no impact of price on the intensive margin (e.g. if everyone who owns the good uses it, so that:
0<∂∂ C/F
∂ /C 0≥∂O
0≤∂∂ P/O
7
0=∂∂ P/I
P/I ∂∂
) then moving to cost-sharing from free-distribution unambiguously reduces coverage and thus
is worse for health outcomes.
Intensive Margin
We know that (i.e. if a higher fraction of owners are using the good, effective coverage
increases). However the sign of is unknown. As mentioned above, there are two potential reasons
why may be positive in our context.
0≥∂∂ I/C
P/I ∂∂8 First is the selection effect—a higher price generates a pool
of owners who are more likely to use the good. Second is the sunk cost effect—paying a higher price for the
good may induce usage for psychological reasons. It is also possible that P/I ∂∂ is negative. For example,
this may be the case if higher prices screen out poor people and poor people value the good more (e.g.
because they are sicker). Since all of these mechanisms could be present, the sign of could also
depend on the price level at which we are evaluating it.
P/I ∂∂
The field experiment we conducted sought to estimate the net effect of prices on coverage ( PC ∂∂ / ) in the
case of anti-malarial bed nets in a highly malaria-endemic area.
3. Background on ITNs and Experimental Set-Up
3.1. Background on Insecticide-Treated Nets (ITNs)
ITNs have been shown to reduce overall child mortality by at least 20 percent on average in regions of
Africa where malaria is the leading cause of death among children under 5.9 ITN coverage protects
pregnant women and their children from the serious detrimental effects of maternal malaria. Sleeping under
an ITN has been shown to reduce severe maternal anemia (the morbidity measure most sensitive to changes
in malaria transmission levels) by up to 47 percent during pregnancy (Marchant et al., 2002; Ter Kuile et
al., 2003). In addition, ITN use can help avert some of the substantial direct costs of treatment and the
indirect costs of malaria infection on impaired learning and lost income.10 Lucas (2007) estimates that,
alone, the gains to education of a malaria-free environment more than compensate for the cost of an ITN.
8 We ignore the effect of higher prices as signals of quality, as discussed in footnote 5 on page 3. 9 See Lengeler (2004) for a review. 10 In a study conducted in Kenya, Chuma, et al. (2006) estimate that 7.1 and 5.4 percent of monthly expenditures are devoted to the direct and indirect costs of malaria infection, respectively. Among the poorest households, these figures were 11 and 8.1 percent, respectively. Ettling et al. (1994) find that poor households in a malaria-endemic area of Malawi spend roughly 28 percent of their cash income treating malaria episodes.
8
Despite the proven efficacy and increasing availability of ITNs on the retail market, the majority of
pregnant women and children in sub-Saharan Africa do not use an ITN.11 At $5 - $7 a net (US$ in PPP),
they are unaffordable to most families, and so governments and NGOs distribute ITNs at heavily subsidized
prices.12 However, the price that is charged for the net varies greatly by the distributing organization,
country and consumer.
The failure to achieve higher ITN coverage rates despite repeated pledges by governments and the
international community (such as the Abuja Declaration of 2000) has put ITNs at the center of a lively
debate over how to price vital public health products in developing countries (Lengeler et al, 2007).
Proponents of cost-sharing ITN distribution programs argue that charging a positive price is needed to
screen out people who will not use the net, and thus avoid wasting the subsidy on non-users. Cost-sharing
programs often have a “social marketing” component, which uses mass media communication strategies
and branding to increase the consumer’s willingness to pay (PSI, 2003; Schellenberg, et al. 1999 and 2001).
The goal is to shore up demand and usage by making the value of ITN use salient to consumers. Proponents
of cost-sharing programs also point out that positive prices are necessary to ensure the development of a
commercial market, considered key to ensuring a sustainable supply of ITNs.
Proponents of full-subsidization argue that, while the private benefits of ITN use can be substantial, ITNs
also have important positive health externalities deriving from reduced disease transmission.13,14 In a
randomized trial of an ITN distribution program at the village level in Western Kenya, the positive impacts
of ITN distribution on child mortality, anemia and malaria infection were as strong among non-beneficiary
households within 300 meters of beneficiary villages as they were among households in the beneficiary
villages themselves (Gimnig et al., 2003; Hawley et al., 2003).15 While ITNs may have positive
externalities at low levels of coverage (e.g. for unprotected children in the same household), it is estimated
that at least 50 percent coverage is required to achieve strong community effects on mortality and morbidity
(Hawley et al., 2003). To date, no cost-sharing distribution program is known to have reached this threshold
(WHO, 2007).
11 According to the World Malaria Report 2008, which compiled results from surveys in 18 African countries, 23 percent of children and 27 percent of pregnant women sleep under an ITN. 12 Guyatt et al. (2002), Okrah, et al. (2002), Holtz, et al. (2002). 13 The external effects of ITN use derive from three sources: (1) fewer mosquitoes due to contact with insecticide, (2) reduction in the infective mosquito population due to the decline in the available blood supply, and (3) fewer malaria parasites to be passed on to others. 14 The case for fully-subsidizing ITNs has also been made on the basis of the substantial costs to the government of hospital admissions and outpatient consultations due to malaria (Evans, et al., 1997). 15 In a similar study in Ghana, Binka et al. (1998) find that child mortality increases by 6.7 percent with each 100 meter shift away from the nearest household with an ITN.
9
3.2. Experimental Set-up
The experiment was conducted in 20 communities in Western Kenya, spread across four districts: Busia,
Bungoma, Butere and Mumias. Malaria is endemic in this region of Kenya: transmission occurs throughout
the year with two peaks corresponding to periods of heavy rain, in May/June/July and October/November.
In two nearby districts, a study by the CDC and the Kenyan Medical Research Institute found that pregnant
women may receive as many as 230 infective bites during their 40 weeks of gestation (Ter Kuile et al.,
2003). Malaria and anemia are common during pregnancy in Western Kenya and up to a third of all infants
are born either premature, small-for-gestational age or with low birth weight (Ter Kuile et al., 2003).
The latest published data on net ownership and usage available for the region come from the Kenya
Demographic and Health Survey of 2003. It estimated that 19.8 percent of households in western Kenya
had at least one net and 6.7 percent had a treated net (an ITN); 12.4 percent of children under 5 slept under
a net and 4.8 percent under an ITN; 6 percent of pregnant women slept under a net the night before and 3
percent under an ITN. Net ownership is very likely to have gone up since, however.16 In July 2006, the
Measles Initiative ran a one-week campaign throughout Western Kenya to vaccinate children between 9
months and 5 years of age and distributed a free long-lasting ITN to each mother who brought her children
to be vaccinated. A 2007 survey conducted (for a separate project) in the area of study among 622
households with school-age children found a rate of long-lasting ITN ownership around 30% (Dupas,
2008).
Our experiment targeted ITN distribution to pregnant women visiting health clinics for prenatal care.17
Distribution was targeted in this way since pregnant women and newborns are very vulnerable to acquiring
and suffering severe consequences from malaria. We worked with 20 rural public health centers chosen
from a total of 70 health centers in the region, 17 of whom were private and 53 were public. The 20 health
centers we sampled were chosen based on their public status, their size, services offered and distance from
each other. We then randomly assigned them to one of five groups: 4 clinics formed the “control group”; 5
clinics were provided with ITNs and instructed to give them free of charge to all expectant mothers coming
for prenatal care; 5 clinics were provided with ITNs to be sold at 10Ksh (corresponding to a 97.5 percent
subsidy); 3 clinics were provided with ITNs to be sold at 20Ksh (95.0 percent subsidy); and the last 3
16 While 2003 is the most recent household survey data available for Kenya, the 2008 World Malaria Report uses ITN distribution figures to estimate that 65 percent of Kenyans now own an ITN. (http://www.who.int/malaria/wmr2008/malaria2008.pdf) 17 The nets distributed through our program were PermaNets, sold by Vestergaard Frandsen. They are circular, polyester bed nets, treated with the insecticide Deltamethrin and maintain efficacy without retreatment for about 3 – 5 years (or about 20 washes).
10
clinics were provided with ITNs to be sold at 40Ksh (90 percent subsidy). The highest price is 10Ksh below
the prevailing subsidized price of ITNs in this region, offered through PSI to pregnant women at prenatal
clinics.18 Table 1 presents summary statistics on the main characteristics of health centers in each group.
While the relatively small number of clinics leads to imperfect balancing of characteristics, the clinics
appear reasonably similar across ITN price assignment and we show below that controlling for clinic
characteristics does not change our estimates except to add precision.
Clinics were provided with financial incentives to carry out the program as designed. For each month of
implementation, clinics received a cash bonus (or a piece of equipment of their choice) worth 5,000Ksh
(approximately $75) if no evidence of “leakage” or mismanagement of the ITNs or funds was observed.19
Clinics were informed that random spot checks of their record books would be conducted, as well as visits
to a random sub-sample of beneficiaries to confirm the price at which the ITNs had been sold and to
confirm that they had indeed purchased an ITN (if the clinic’s records indicated so). Despite this, we
observed leakages and mismanagement of the ITNs in 4 of the 11 clinics that were asked to sell ITNs for a
positive price (one at 10Ksh, two at 20Ksh, and one at 40Ksh). We did not observe any evidence of
mismanagement in the five clinics instructed to give out the ITNs for free. Out of the four clinics that
mismanaged the ITNs, none of them altered the price at which ITNs were made available to prenatal clients,
but three clinics sold some of the program ITNs to ineligible recipients (i.e. non prenatal clients).20 In
addition, the stock of ITNs stored by clinics depleted and was unaccounted for in three clinics.21
The ITN distribution program was phased into all clinics between March and May 2007, and was kept in
place for at least 3 months in each clinic, throughout the peak “long rains” malaria season and subsequent
months. Posters were put up in clinics to inform prenatal clients of the price at which the ITNs were sold.
Other than offering a free hemoglobin test to each woman on survey days, we did not interfere with the
normal procedures these clinics use at prenatal care visits, which in principle include a discussion of the
importance of bed net use.
18 Results from a pre-program clinic survey suggest that it is perhaps not appropriate to interpret our results in the context of widely available ITNs to pregnant women at 50Ksh, as many of the clinics reported the supply of PSI nets to be erratic and frequently out of stock. 19 Clinics that implemented the program for three months without incident thus received a $225 gift, a substantial amount for rural clinics in Kenya. 20 They forged receipts for purchased nets, but spot checks with the supposed "buyers" proved that the ITNs had been sold to others. These cases were observed in 2 clinics in the 20 Ksh group and 1 clinic in the 40 Ksh group. 21 15 ITNs were stolen in one of the five clinics selling the ITNs at 10Ksh; 42 ITNs were stolen from one of the clinics selling the ITNs at 20Ksh; and 22 ITNs were stolen in one of the clinics selling the ITNs at 40Ksh. In all three cases, it is likely that a staff member of the clinic stole the ITNs from the storage room.
11
Within clinics where the posted price was positive, a second stage randomization was conducted on
unannounced, random days. On those days, women who had expressed their willingness and showed their
ability to purchase an ITN at the posted price (by putting the required amount of money on the counter)
were given the opportunity to participate in a lottery for an additional promotion by picking an envelope
from a basket. The final price paid by women participating in the lottery could be the initial offer price if
they picked an empty envelope; zero if they picked a “free net” envelope; or a positive price below the
initial offer price if the initial price was 40Ksh. This second-stage randomization started at least five weeks
after the program had started in a given clinic, and took place no more than once a week, on varying week
days, to avoid biasing the women’s decisions to purchase the ITN based on the expectation of a second-
stage discount.
3.3. Data
Three types of survey data were collected. First, administrative records kept by the clinic on ITN sales were
collected. Second, each clinic was visited three or four times on random days, and on those days
enumerators surveyed all pregnant women who came for a prenatal visit. Women were asked basic
background questions and whether they purchased a net, and their hemoglobin level was recorded. In total,
these measures were collected from 545 pregnant women. Third, a random sample of 246 prenatal clients
who had purchased/received a net through the program was selected to be visited at their home three to ten
weeks after their net purchase. All home visits were conducted within three weeks in July 2007 to ensure
that all respondents faced the same environment (especially in terms of malaria seasonality) at the time of
the follow-up. Of this sub-sample, 92 percent (226 women) were found and consented to be interviewed.
During the home visit, respondents were asked to show the net, whether they had started using it, and who
was sleeping under it. Surveyors checked to see whether the net was taken out of the packaging, whether it
was hanging, and the condition of the net.22
The price at which ITNs were sold was randomized at the clinic level, but our outcomes of interest are at
the individual-level: take-up, usage rates and health. When regressing individual-level dependent variables
on clinic-level characteristics we are likely to overstate the precision of our estimators if we ignore the fact
that observations within the same clinic (cluster) are not independent (Moulton, 1990; Donald and Lang,
2007). We compute cluster-robust standard errors by using the cluster-correlated Huber-White covariance
matrix method. In addition, since the number of clusters is small (16 treatment clinics), the critical values
for the tests of significance are drawn from a t-distribution with 14 (= 16 - 2) degrees of freedom (Cameron,
22 The nets that were distributed through the program were easily recognizable through their tag. Enumerators were instructed to check the tag to confirm the origin of the net.
12
Miller and Gelbach, 2007). The critical values for the 1 percent, 5 percent and 10 percent significance levels
are thus 2.98, 2.14 and 1.76, respectively.
4. Results
4.1. Price-Elasticity of Demand for ITNs
Figure 1a plots average weekly sales during the first 6 weeks of the program by ITN price. Demand appears
to be decreasing monotonically in price, with only a modest drop between 0 and 10Ksh, and the largest drop
occurring between 20 and 40Ksh.
Table 2 presents coefficient estimates from OLS regressions of weekly ITN sales on price with district fixed
effects. The coefficient estimate on ITN price from the most basic specification in Column 1 is -0.797. This
estimate implies that weekly ITN sales drop by about 8 nets for each 10Ksh increase in price. Since clinics
distributing ITNs for free to their clients distribute an average of 41 ITNs per week, these estimates imply
that a 10Ksh increase in ITN price leads to a 20 percent decline in weekly ITN sales. The specification in
Column 2 regresses weekly ITN sales on indicator variables for each ITN price (0Ksh is excluded). Though
noisy, since observations are at the clinic-level, these estimates suggest that the impact of price on demand
is non-linear. The elasticity of demand is lowest between 0 and 10Ksh. Raising the price from 0 to 40Ksh
reduces demand by 80 percent (from 41 ITNs per week to 9)—a substantial decline in demand, a bit smaller
than the decline implied by the linear estimate in Column 1.
Columns 3 and 4 present results of robustness checks conducted by including various characteristics of the
clinics as controls. Since net sales are conditional on enrollment at prenatal clinics, one concern is that our
demand estimates are confounded by variation in the level of prenatal attendance across clinics. Subsidized
ITNs may provide an incentive to receive prenatal care, and therefore the level of prenatal enrollment after
the introduction of the program is an endogenous variable of interest (Dupas, 2005). Any impact of ITN
price on total enrollment should be captured by total ITN sales (which reflect the change in the number of
patients and in the fraction of patients willing to buy ITNs at each price). However, our demand estimates
could be biased if total attendance prior to program introduction is correlated with the assigned ITN price.
To check whether this is the case, the specification in Column 3 controls for monthly prenatal attendance at
each clinic in 2006. The specification in Column 4 controls for additional clinic characteristics that could
potentially influence attendance such as any fee for prenatal care, whether the clinic offers counseling
and/or testing for HIV, the distance to the closest other clinic/hospital in our sample and the distance to the
13
closest other clinic/hospital in the area. The coefficient estimates on ITN price are basically unchanged
when clinic controls are included, but their precision is improved.
One might be concerned that our net sales data is biased due to (a moderate amount of) mismanagement,
theft and misreporting by clinics. Further, since the number of observations in Table 2 is small, demand
estimates are not precisely estimated. For these reasons, it is important to check that the demand estimates
based on net sales are consistent with those based on our survey data. Table 3 presents additional estimates
of demand based on individual-level data from surveys conducted among all prenatal clients who visited the
clinics on the randomly chosen days where baseline surveys were conducted. These specifications
correspond to linear probability models where the dependent variable is a dummy equal to one if the patient
bought or received an ITN; the independent variables are the price at which ITNs were sold, or dummies for
each price. The coefficient estimate of -.015 on ITN price in Column 1 implies that a 10Ksh ($.15) increase
in the price of ITNs reduces demand by 15 percentage points (or roughly 20 percent at the mean purchase
probability of .81). This is very consistent with the results based on net sales and corresponds to a price
elasticity (at the mean price and purchase probability) of -.37. These results imply that demand for ITNs is
75 percent lower at the current cost-sharing price in Kenya (50Ksh or $0.75) than it would be under a free
distribution scheme.
Robustness checks are presented in Columns 2 and 3 of Table 3. Column 2 controls for when the survey
was administered, including day of the week fixed effects and the time elapsed since program introduction.
Column 3 controls for the same clinic characteristics used in Table 2, Column 4. These coefficient estimates
are still very close to the basic specification.
Estimates in Column 4 confirm that demand decreases increasingly rapidly with price. The decrease in
demand for an increase in price from 0 to 10Ksh is estimated at 7 percentage points (larger than suggested
by the clinic-level ITN sales in Table 2), but an increase in price from 20 to 40Ksh leads to a 43 percentage
point drop in demand. That is, demand drops at a rate three times faster between 20 and 40Ksh than
between 0 and 10Ksh.
Column 5 presents demand estimates for the restricted sample of women who are making their first prenatal
care visit for their current pregnancy. This is the relevant long-run population to consider when estimating
the impact of a permanent distribution scheme at a given price P through prenatal clinics; indeed, once the
stock of women who are pregnant when the program begins runs out, every woman would have access to an
ITN at price P at their first visit. It is also important to separate first visits from revisits because the latter
14
may be returning because they are sick. Alternatively, women who are coming for a second or third visit
may be healthier, since they have already received the benefits of the earlier visit(s), some of which can
directly affect their immediate need for an ITN (such as malaria prophylaxis and iron supplementation). The
coefficient estimate in Column 5 is larger than that for the entire sample, implying that women coming for
the first time are more sensitive to price than women coming for a revisit. This could be because women
learn about the subsidized ITN program at their first visit and bring the cash to purchase the net at their
second visit.
Access to free ITNs from other sources could have dampened demand for ITNs distributed through the
program. This is a real concern, since the Measles Initiative ran a campaign in July 2006 (9 months before
the start of our experiment) throughout Kenya to vaccinate children between 9 months and 5 years of age,
distributing free ITNs to mothers of these children in Western Kenya. To examine the demand response
among women who are less likely to have had access to free ITNs in the past, Column (6) estimates the
impact of ITN price on demand for women in their first pregnancy only. When we restrict the sample in this
way, the coefficient on ITN price drops to -.011. This implies that women in their first pregnancy are indeed
less sensitive to ITN price differences, but their demand still drops by 55 percentage points when the ITN
price is raised from 0 to 50Ksh.
Our baseline survey asked respondents if they had received a free ITN in the previous year, and 37.3% said
they did. In Columns 7 and 8, we focus on the 63% who reported not having received a free ITN and
estimate how their demand for an ITN in our program was affected by price. We find a coefficient on price
equal to that obtained with the full sample (-0.015), and the specifications with dummies for each price
group generate estimates that are also indistinguishable from those obtained with the full sample.
Nearly three-quarters of prenatal clients walked to the clinics for prenatal care. Since clinics included in our
sample were at least 13 kilometers from one another it is unlikely that prenatal clients would switch from
one of our program clinics to another. However, it is likely that our program generated some crowd-out of
prenatal clients at non-program clinics in the vicinity, particularly in the case of free nets. Since these
“switchers” are driven by price differences in ITNs that would not exist in a scaled-up program, we should
look at the demand response of those prenatal clients who, at the time of the interview, were attending the
same clinic that they had in the past. In the Appendix Table A1, we replicate Table 3 for this sub-sample of
prenatal clients that did not switch clinics. The results are nearly unchanged, suggesting that the same
degree of price sensitivity would prevail in a program with one price.
15
In sum, our findings suggest that demand for ITNs is not sensitive to small increases in price from zero, but
that even a moderate degree of cost-sharing leads to large decreases in demand. At the mean, a 10Ksh
($0.15) increase in ITN price decreases demand by 20 percent. These estimates suggest that the majority of
pregnant women are either unable or unwilling to pay the prevailing cost-sharing price, which is itself still
far below the manufacturing cost of ITNs.
4.2 Price-Elasticity of the Usage of ITNs
Usage conditional on ownership
Let us start this section with an important caveat: Our sample size to study usage conditional on take-up is
considerably hampered by the fact that take-up was low in the higher-priced groups: only a small fraction of
the respondents interviewed at baseline in the 40Ksh group purchased an ITN and could be followed-up at
home for a usage check.
Keeping this caveat in mind, Figure 2 shows the average usage rate of program-issued ITNs across price
groups. The right panels show self-reported usage rates, and the left panels show the likelihood that the ITN
was found hanging, both measured during an unannounced home visit by an enumerator. We present the
data for all women followed-up (top panel), only those coming for their first prenatal visit (middle panel),
and finally for those who reported not having received a free ITN the previous year. On average, 62 percent
of women visited at home claimed to be using the ITN they acquired through the program, a usage rate that
is very consistent with previous usage studies (Alaii et al., 2003; D’Alessandro et al., 1994). The observed
hanging rate was only slightly lower, at 57%. However, we find little variation in usage across price groups,
and no systematic pattern. This is confirmed by the regression estimates of selection effects on usage,
presented in Table 4. Our coefficient estimate on ITN price in Column 1 is positive, but insignificant,
suggesting that a price increase of 10Ksh increases usage by 4 percentage points, representing an increase
of 6 percent at the mean. The confidence interval is large, however, and the true coefficient could be on
either side of zero (the 95% confidence interval is -0.004; 0.012). These estimates correspond to a price
elasticity of usage (at the mean price and usage rate) of .097. Adding controls in Column 2 does not
improve precision but reduces the size of the estimated effect.
Estimates using indicators for each price in Column 3 are also very imprecise, but show no pattern of
increasing use with price. Women who pay 10 and 20Ksh are less likely to be using their ITN than women
receiving it for free, but women who pay 40Ksh appear close to 10 percent more likely to be using their
ITN. In none of the cases, however, can we reject the null hypothesis that price has no effect on intensity of
usage.
16
The fact that higher prices do not seem to systematically encourage selection of those more likely to use an
ITN is more apparent when we restrict the sample to first visits and first pregnancies. Women who received
a free ITN at their first visit appear more likely than all other price groups to be using the net (Column 5),
but none of the coefficients on prices are significant. When restricting the sample to women in their first
pregnancy we find overall usage rates are about 10 percent higher than for the sample as a whole (71
percent compared to 62 percent, columns 6 and 7). The point estimate on usage is negative for this
subgroup as well, but here again the sample size is very small and the estimates are insignificant. Finally,
when the sample is restricted to those who did not receive a free net in the previous year, the results are
similar to those obtained on the full sample (columns 8 and 9), with coefficients on price dummies
suggesting a U-shape pattern, but none of them are significant.
Usage has traditionally been difficult to measure. In this case, checking usage of ITNs is fairly
straightforward since the surveyor can see whether the net is hanging. Of course, we cannot observe
whether the net is actually used at night, but it is reasonable to believe that, if the ITN is taken out of its
packaging and has been hung on the ceiling, it is being used.23 Of those women who claimed to be using the
ITN, 95 percent of them had the net hanging. Results for whether or not the net is hanging (Columns 10 and
11) are very similar to those using self-reported usage (Columns 1 and 3).
One might be concerned that usage rates among prenatal clients receiving a free net are higher than they
would be under a one-price policy, since pregnant women who value an ITN highly may have switched
clinics in order to get a free net. We show in Appendix Table A2 that, as with our demand estimates, usage
rates among the sub-sample of women who did not switch clinics are not different from the sample as a
whole.
Overall, the results so far suggest that, at least in the Kenyan context, positive prices do not help generate
higher usage intensity than free distribution.24 The absence of a selection effect on usage could be due to the
nature of the good studied, which is probably valued very highly in areas of endemic malaria, particularly
among pregnant women who want to protect their babies. The context in which the evaluation took place
also probably contributed to the high valuation among those who didn’t have to pay. In particular, women
had to travel to the health clinic for the prenatal visit and were told at the check-up about the importance of
23 Having the insecticide-treated net hanging from the ceiling creates health benefits even if people do not sleep under the net, because it repels, disables and/or kill mosquitoes coming into contact with the insecticide on the netting material (WHO, 2007). 24 We also find no evidence that women receiving a free net are more likely to resell it. In fact, none of the women in our sample had sold the net at the time of our visit. Among those not using the net, the most common reasons given were that they were waiting for the birth of the child or for another net (typically untreated with insecticide) to wear out.
17
protection against malaria. In addition, PSI has been conducting a very intense advertising campaign for
ITN use throughout Kenya over the past 5 years. Last, the evaluation took place in a very poor region of
Kenya, in which many households do not have access to credit and have difficulty affording even modest
prices for health goods. Thus, a large number of prenatal clients may value ITNs but be unable to pay
higher prices for them.
Unconditional usage: “effective coverage”
While our estimates of usage rates among buyers suffer from small sample size imprecision, effective
coverage (i.e. the fraction of the population using a program net) can be precisely estimated. Figure 3
presents effective coverage with program ITNs across ITN prices for both the full sample and the
subsample of women who did not previously receive a free ITN. The corresponding regressions are
presented in Table 5. The coefficient on price in the linear specification (column 1) is -0.012, significant at
the 1% level. This corresponds to a price-elasticity of effective coverage of -0.44. The share of prenatal
clients that are protected by an ITN under the free distribution scheme is 64 percent, versus 14 percent when
ITNs are sold for 40Ksh; this difference is significant at the 1% level (column 2). The results hold across all
specifications and subgroups presented in Table 5. These results imply that, at least in the Kenyan context,
the ongoing cost-sharing program cannot offset through increased usage rates what is lost in dampened
demand.
4.3. Are there Psychological Effects of Prices on Usage of ITNs?
In this section, we test whether the act of paying itself can stimulate higher product use by triggering a sunk
cost effect, when willingness to pay is held constant. We use data from the ex-post price randomization
conducted with a subset of women who had expressed their willingness to pay the posted price (in clinics
charging a positive price). For those women, the transaction price ranged from “free” to the posted price
they initially agreed to pay. Table 6 presents the coefficients of the effect of price levels (Columns 1 – 3)
and of the act paying (Columns 4 – 8) on the likelihood of usage and likelihood that the ITN has been hung.
These coefficients are from linear probability models with clinic fixed effects, estimated on the sample of
women who visited a clinic where ITNs were sold at a positive price, decided to buy an ITN at the posted
price, and were sampled to participate in the ex-post lottery determining the transaction price they
eventually had to pay to take the net home. Since the take-up of ITNs decreased sharply with the price, the
sample we have at hand to test for the presence of sunk cost effects is small, and therefore the precision of
the estimates we present below is limited.
18
We find no psychological effect of price or the act of paying on usage, as expected from the earlier result
that there is no overall effect of prices on usage. In Column 1, the coefficient for price is negative,
suggesting that higher prices could discourage usage, but the effect is not significant and cannot be
distinguished from zero. The 95% confidence interval is (-0.0158; 0.0098), suggesting that a 10Ksh
increase in price could lead to anything from a decrease of 16 to an increase of 10 percentage points in
usage. Larger effects on either side can be confidently rejected, however. Adding a control for having
received a free ITN from the government in the previous year does not reduce the standard error but
decreases the coefficient of price further, enabling us to rule out sunk cost effects of more than 7 percentage
points per 10Ksh increase in price (Column 2). In Column 4, the coefficient for the act of paying a positive
price is also negative, suggesting that if the act of paying has any effect, it would decrease usage rather than
increase it, but here again the coefficient cannot be confidently distinguished from zero. The 95%
confidence interval for this estimate is quite large, and suggests that a 10Ksh increase in price could lead to
anything from a decrease of 22 to an increase of 20 percentage points in usage.
Overall, these results suggest that, in the case of ITNs marketed through health clinics, there is no large
positive psychological effect of price on usage. We do not have data on baseline time preferences to check
whether certain subgroups are more likely to exhibit a “sunk cost” effect. We also do not have data on what
women perceived ex post as the price they paid for the ITN; we thus cannot verify that those who received a
discount mentally “integrated” the two events (payment and discount) to “cancel” the loss, in the terms of
Thaler (1985), or whether they “segregated” the two events and perceived the payment as a cash loss and
the discount as a cash gain.25
If usage might not increase with price, what about the private benefits to the users? Is it the case, as often
assumed, that the users reached through the 40Ksh distribution system are those that really need the ITN,
whereas the additional users obtained through the free distribution will not benefit from using the ITN
because they don’t need it as much (i.e. they are healthier, or can afford other means to protect themselves
against malaria)? From a public health point of view, this issue might be irrelevant in the case of ITNs,
given the important community-wide effects of ITN use documented in the medical literature cited earlier.
Nevertheless, it is interesting to test the validity of the argument advanced by cost-sharing programs with
respect to the private returns of ITN use. This is what we attempt to do in the next section.
25 After having committed to purchase the ITN at the posted price, women could have mentally accounted the discount they received as a cash gain, and thus felt that they had paid for the ITN at its posted price despite the discount. If that’s the case, even those who received the discount could have felt a “sunk cost”, explaining why we do not see a difference across discount groups.
19
4.4 Selection Effects of ITN Prices
This section presents results on selection effects of positive prices on the health of patients who buy them.
The argument that cost-sharing targets those who are more vulnerable by screening out women who appear
to need the ITN less assumes that willingness to pay is the main factor in the decision to buy an ITN. In the
presence of extreme poverty and weak credit markets, however, it is possible that ability to pay also plays a
major role. The overall effect of price on the average “need” of ITN owners will thus depend on the relative
importance of those two factors: willingness and ability to pay. The optimal subsidy level will have to be
low enough to discourage women who do not need the product to buy it, while at the same time high
enough to enable credit-constrained women to buy it if they need it. We focus our analysis on an objective
measure of health among prenatal clients – their hemoglobin level. Women who are anemic (i.e. with a low
hemoglobin level) are likely the women with the most exposure and least resistance to malaria, and are
likely the consumers that a cost-sharing program would want to target.
To judge whether higher prices encourage sicker women to purchase nets, we study the impact of price on
the health of “takers” (i.e. buyers and recipients of free nets) relative to the health of the prenatal clients
attending control clinics. Figure 4 plots the cumulative density functions (CDF) of hemoglobin levels for
women buying/receiving a net at each price relative to women in the control group. For the intermediate
positive prices (10Ksh and 20Ksh), the CDF of hemoglobin levels of women who pay is indistinguishable
from the CDF of women in the control clinics. However, both the CDFs for women receiving free nets and
that of women paying the highest price (40Ksh) stochastically dominate the distribution in the control
group, implying that both women who get free nets and those who pay the highest price are healthier than
the average prenatal woman. While this result for the latter group might come from an income effect
(women who can pay the highest price are richer), the result for the free net group is surprising.
For each price level, we test the significance of the differences in CDFs (compared to the control group)
with the Kolmogorov-Smirnov equality-of-distributions test. This non-parametric test rejects the null
hypothesis of samples coming from the same populations if there is a point for which the cumulative
empirical distributions of two independent samples are significantly different (Cassiman and Golovko,
2007). The results of the tests are presented in Table 7, Panel A. We can reject the null hypothesis of
equality of distributions between women who receive free nets and those attending control clinics at the 5
percent significance level (Panel A, Column 1). With p-values of .41 and .25, we cannot reject the equality
of distributions for women in the control population and those paying 10 and 20Ksh for an ITN. Although
the CDF of women paying 40Ksh appears to stochastically dominate that of the control group in Figure 4,
the p-value for the difference in distributions is not quite significant at .17.
20
Panel B in Table 7 presents the average characteristics of prenatal clients in control clinics (Column 1), and,
for each price group, how the average buyer diverges from the average woman in the control group
(Columns 2 to 5). These coefficient estimates reflect what can be seen in Figure 4: hemoglobin levels are
.94 points higher among women who receive a free net than among women in the control group, while point
estimates for higher prices are positive but not significant. Similarly, women paying positive prices are not
more likely to be moderately or severely anemic than women in the control population, but women
receiving free nets are substantially less likely to be anemic (-18 percentage points off of a base of 69%).26
Why would it be that women who receive free nets appear substantially healthier, even though higher prices
do not appear to induce selection of women who are sicker than the general prenatal population? Dupas
(2005) shows that there is a strong incentive effect of free ITNs on enrollment for prenatal care. The results
in Panel B2 of Table 6 provide some evidence that the incentive effect of free ITNs was strong here as well:
women who came for free nets were 12 percent more likely to be coming for a repeat visit, 12 percent less
likely to have come by foot (some more likely to have come by public transportation), and they paid about
3.5Ksh more to travel to the clinic than women in the control group. These results suggest that the free ITN
distribution induced women who had come to the clinic before the introduction of the program to come
back for a revisit earlier than scheduled, and therefore before the health benefits of their first prenatal visit
had worn out.27
Since women who received free nets appear to have traveled further and spent more money on travel to the
clinic, one might expect that this group was composed of many switchers from non-program clinics.
However, we find that the effects of price on selection in terms of health are unchanged for the sub-sample
of women staying with the same clinic (Appendix Table A3). Finally, it is interesting to note in Panel B2 of
Table 7 that women who bought nets for 40Ksh were more likely to pay for transportation and paid more to
come to the clinic than the control group, probably reflecting the fact that women who could afford 40Ksh
are on average wealthier than women in the control group.28
26 While the characteristics of buyers is what is of interest in analyzing selection effects of cost-sharing, one might be concerned that it is inappropriate to compare characteristics of buyers at each price to the characteristics of the entire control group. We were not able to collect information on who bought nets at the control clinics, but when we compare the health and other characteristics of the total group of women attending clinics in each price group to the total control group, we find very similar results (tables available upon request). 27 In Kenya, pregnant women are typically given free iron supplements, as well as free presumptive malaria treatment, when they come for prenatal care. Both of these “treatments” have a positive impact on hemoglobin levels. 28 This hypothesis is supported by the fact that, when we compare the average client at 40Ksh clinics (rather than the average buyer at these clinics) to the average control client, they are no more likely to have paid for transportation and paid no more for transportation than the control group (results not shown).
21
Overall, the results in this section suggest that women who pay more for a net are no more likely to be sick
than women in the general population. Due to the large decline in demand, this implies that ITNs are
reaching fewer vulnerable women at 40Ksh than under free distribution. Figure 5 estimates effective
program ITN coverage of anemic women across ITN prices. It shows that, when the price is 40Ksh or
higher, the number of anemic pregnant women gaining access to ITN coverage in the presence of a cost-
sharing scheme is significantly lower than under a free distribution scheme.
5. Cost-Effectiveness Analysis In this section we attempt to estimate the cost-effectiveness of each pricing strategy in terms of children’s
lives saved. As discussed in Section 3, there are many benefits to preventing malaria transmission in
addition to saving children’s lives, and restricting ourselves to child mortality will lead to conservative
estimates of cost-effectiveness.
Quantifying Differences in Costs
In the analysis that follows, we assume that the only difference in cost per ITN between free distribution
and cost-sharing is the difference in the subsidy. That is, we assume that an ITN given for free costs only
40Ksh more to the social planner than an ITN sold for 40Ksh. This assumption could be wrong for two
reasons. First, given the demand effect, many more ITNs need to be delivered to clinics when they are
distributed for free; this decreases the cost of distribution (per net), given economies of scale. In addition,
cost-sharing introduces the need for additional supervision and accounting to ensure that the proceeds of the
sales are not captured by clinic staff. This will tend to increase the logistical cost of cost-sharing. We do not
have sufficient evidence on the importance of these two possible effects to quantify the differences in costs
more precisely, and therefore make the conservative assumption that the delivery cost is similar across
subsidy groups.
Quantifying Differences in Benefits
An important dimension to keep in mind in the cost-effectiveness analysis is the non-linearity in the health
benefits associated with ITN use: high-density ITN coverage reduces overall transmission rates and thus
positively affects the health of both non-users and users. The results of a recent medical trial of ITNs in
Western Kenya imply that “in areas with intense malaria transmission with high ITN coverage, the primary
effect of insecticide-treated nets is via area-wide effects on the mosquito population and not, as commonly
supposed, by simple imposition of a physical barrier protecting individuals from biting” (Hawley et al,
2003). In this context, we propose the following methodology to measure the health impact of each ITN
22
pricing scheme: we create a “protection index for non-users” (a logistic function of the share of users in the
total population) and a “protection index for users” (a weighted sum of a “physical barrier” effect of the
ITN and the externality effect, the weights depending on the share of users). This enables us to compute the
health impact of each pricing scheme on both users and non-users and to (roughly) approximate the total
number of child lives saved, as well as the cost per life saved.29 Because the relative importance of the
“physical barrier” effect and of the externality are uncertain, we consider three possible values for the
parameter of the logistic function predicting the protection index for non-users (the “threshold externality
parameter”) and three possible values for the effectiveness of ITNs as physical barriers. This gives us a total
of 3 x 3 = 9 different scenarios and 9 different cost-per-life-saved estimates for each of the 4 pricing
strategies. Figure 6 illustrates how the protection indices vary with the share of users in the entire
population, and shows the 3 options we consider for each parameter. Figure 6a shows that under the “low
threshold” assumption the protection index for non-users reaches 0.7 for a share of users as low as 35
percent; whereas under the “medium” and “high” threshold assumption the protection index for non-users
doesn’t reach 0.5 until the share of users is 50 and 65 percent, respectively.30
Given the importance of the externality effect, another key parameter in the cost-effectiveness analysis is
the share of ITN users in the total population. In Table 8, we assume that distribution programs would last
for five years and estimate the share of ITN users in the entire population that would result under each price
scenario at the end of the five years. This number depends on three factors: the share of ITN owners among
households eligible for the program (i.e. households with a pregnancy), the share of users among owners,
and the share of eligible households in the total population.31 While we estimated the first two factors in our
experiment, we do not know the last factor with certainty. We thus propose three possibilities (where the
share of eligible households in a five year period is 65, 75 or 85 percent) and compute the resulting share of
ITN users in the entire population. As discussed in the previous section, we find that cost-sharing
considerably reduces the share of ITN users. With the conservative estimate of only 65 percent of
29 Randomized controlled trials in different malaria transmission settings have shown insecticide-treated bed nets (ITNs) reduce all cause mortality in children less than five years old by 17 percent (Phillips-Howard et al., 2003). We follow these results, under the assumption that the baseline under-five mortality rate (in the absence of ITN coverage) is 50 deaths per 1000 child-years. To compute the number of lives saved in Table 9, we assume that for 1000 households with a newborn, 42.5 child lives will be saved if all 1000 households are fully protected (100 percent protection index) for five years, but only (42.5 x p/100) child lives will be saved if the protection index among those households is only p (p between 0 and 100). These figures might be too rough, but they don’t affect the outcome of the cost-effectiveness comparisons. The costs per life saved in Table 9 are only provided to enable these comparisons, but their absolute values should be taken with caution. 30 The latest literature suggests that the threshold is around 50 percent (Hawley et al, 2003). Therefore the “medium” case seems the most realistic. 31 A distribution scheme such as the one explored in this paper will depend on the share of pregnant women who receive prenatal care, this rate is very high in Kenya (nearly 90 percent) and would likely be increased even more by the incentive effect of low priced ITNs.
23
households experiencing a pregnancy, we see that none of the schemes manages to reach the 50 percent
coverage threshold that has been discussed in the epidemiology literature with respect to the importance of
the externality effect.
Mechanically, in the presence of an ITN distribution program through prenatal clinics, the share of ITN
users in the entire population increases as the share of households experiencing a pregnancy within five
years increases. Since the share of users plays an important role in the cost-effectiveness estimates, we will
restrict ourselves to the most conservative assumption (only 65 percent of households experiencing a
pregnancy within five years). Making a less conservative assumption would increase the cost-effectiveness
of distribution programs that generate a higher coverage rate (i.e. free distribution compared to cost-
sharing).
Cost-Effectiveness Results
Table 9 presents the cost-effectiveness results for each of the 9 hypothetical scenarios for each of the 4
pricing schemes. In all 9 scenarios, child mortality is reduced more under free distribution than any cost-
sharing strategy. This result is not surprising considering the large negative effect of cost-sharing on the
share of ITN users in the entire population that we identified earlier. Under the low threshold assumption
for the externality effect, in terms of cost per life saved, we find that charging 40Ksh is more cost-effective
than free distribution if the physical barrier effect of ITNs is high (Panel D, Column 1). When the
assumptions about the effectiveness of ITNs as physical barriers for their users are less optimistic, we find
that free distribution becomes at least as cost-effective, if not more, than cost-sharing. Under the assumption
of a “medium” externality threshold level, we find that free distribution could dominate cost-sharing in
terms of cost-effectiveness (Panel D, Columns 4 – 6). Last, in the scenario where a large share of ITN users
is necessary for a substantial externality to take place, we find that cost-sharing is again slightly cheaper
than free distribution, unless the physical barrier effectiveness is very low. This is due to the fact that under
the high threshold hypothesis, even free distribution to pregnant women is not enough to generate
significant community-wide effects since not all households experience a pregnancy. It is worth noting,
however, that under less conservative estimates regarding the number of households eligible for the free
distribution program within five years, the free distribution strategy would become more effective than cost-
sharing even for a high externality threshold level.
That said, given the very large standard errors on the usage estimates, the differences observed in cost per
life saved cannot be distinguished from zero. The general conclusion of this cost-effectiveness exercise is
24
thus that cost-sharing is at best marginally more cost-effective than free distribution, but free distribution
leads to many more lives saved.
6. Conclusion The argument that charging a positive price for a commodity is necessary to ensure that it is effectively
used has recently gained prominence in the debate on the efficiency of foreign aid. In his 2006 book The
White Man’s Burden, William Easterly, discussing the rationale for the cost-sharing ITN program run by
PSI in Malawi, argues that ITNs distributed for free “are often diverted to the black market, become out of
stock at health clinics, or wind up being used as fishing nets or wedding veils” (p. 13). The cost-sharing
model of selling nets for $0.50 to mothers through prenatal clinics is believed to reduce waste because “it
gets the nets to those who both value them and need them.” Our randomized pricing experiment in Western
Kenya finds no evidence to support these assertions. We find no evidence that cost-sharing reduces wastage
by sifting out those who would not use the net: pregnant women who receive free ITNs are no less likely to
put them to intended use than pregnant women who pay for their nets. This suggests that cost-sharing does
not increase usage intensity in this context. While it doesn’t increase usage intensity, cost-sharing does
considerably dampen demand: we find that the current cost-sharing scheme in Kenya for this population
results in a coverage rate 75 percentage points lower than with a full subsidy. In terms of getting nets to
those who need them, our results on selection based on health imply that women who purchase nets at cost-
sharing prices are no more likely to be anemic than the average prenatal woman in the area. We also find
that localized, short-lived free distribution programs disproportionately benefit healthier women who can
more easily travel to the distribution sites.
While our results speak to the ongoing debate regarding the optimal subsidization level for ITNs—one of
the most promising health tools available in public health campaigns in sub-Saharan Africa—they may not
be applicable to other public health goods that are important candidates for subsidization. In particular, it is
important to keep in mind that this study was conducted when ITNs were already highly valued in Kenya,
thanks to years of advertising by both the Ministry of Health and Population Services International. This
high ex-ante valuation likely diminished the risk that a zero or low price be perceived as a signal of bad
quality.
While ITN distribution programs that use cost-sharing are less effective and not more cost-effective than
free distribution in terms of health impact, they might have other benefits. Indeed, they often have the
explicit aim of promoting sustainability. The aim is to encourage a sustainable retail sector for ITNs by
combining public and private sector distribution channels (Mushi et al., 2003; Webster, 2007). Our
25
experiment does not enable us to quantify the potentially negative impact of free distribution on the
viability of the retail sector and therefore our analysis does not consider this externality. As with most
randomized experiments, we are unable to characterize or quantify the impact of these distribution schemes
when they have been scaled up and general equilibrium effects have set in. This experiment should thus be
seen as one piece in the puzzle of how to increase take-up of effective, externality-generating health
products in resource-poor settings.
Taken together, our two main findings – usage is price-inelastic but demand is highly price-elastic – suggest
that pregnant women in rural Kenya are either highly credit and saving constrained, or highly present-
biased (or both), causing them to under-invest in health compared to what would be privately optimal. More
research is needed to understand the respective role of these factors, and to identify financial and/or
commitment devices that would enable rural households to reach privately optimal levels of health
investments. Subsidies would then only be needed to achieve the socially optimal level of investment in
externality-generating products.
26
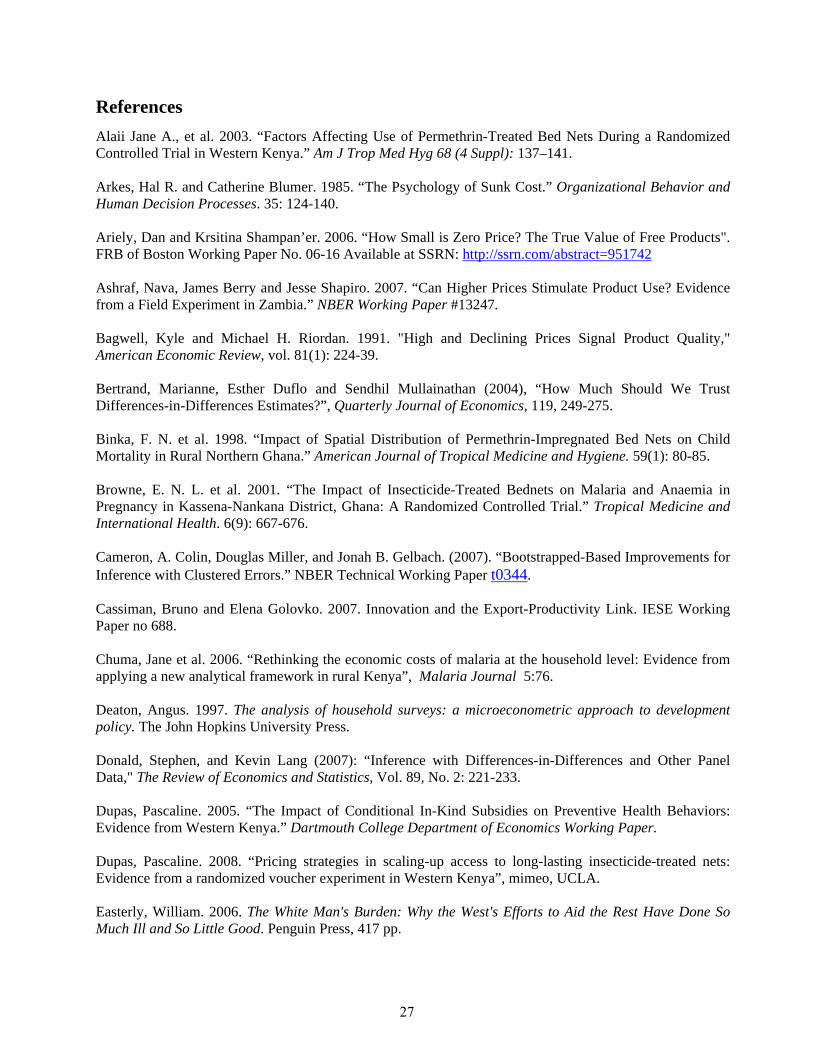
References Alaii Jane A., et al. 2003. “Factors Affecting Use of Permethrin-Treated Bed Nets During a Randomized Controlled Trial in Western Kenya.” Am J Trop Med Hyg 68 (4 Suppl): 137–141. Arkes, Hal R. and Catherine Blumer. 1985. “The Psychology of Sunk Cost.” Organizational Behavior and Human Decision Processes. 35: 124-140. Ariely, Dan and Krsitina Shampan’er. 2006. “How Small is Zero Price? The True Value of Free Products". FRB of Boston Working Paper No. 06-16 Available at SSRN: http://ssrn.com/abstract=951742 Ashraf, Nava, James Berry and Jesse Shapiro. 2007. “Can Higher Prices Stimulate Product Use? Evidence from a Field Experiment in Zambia.” NBER Working Paper #13247. Bagwell, Kyle and Michael H. Riordan. 1991. "High and Declining Prices Signal Product Quality," American Economic Review, vol. 81(1): 224-39. Bertrand, Marianne, Esther Duflo and Sendhil Mullainathan (2004), “How Much Should We Trust Differences-in-Differences Estimates?”, Quarterly Journal of Economics, 119, 249-275. Binka, F. N. et al. 1998. “Impact of Spatial Distribution of Permethrin-Impregnated Bed Nets on Child Mortality in Rural Northern Ghana.” American Journal of Tropical Medicine and Hygiene. 59(1): 80-85. Browne, E. N. L. et al. 2001. “The Impact of Insecticide-Treated Bednets on Malaria and Anaemia in Pregnancy in Kassena-Nankana District, Ghana: A Randomized Controlled Trial.” Tropical Medicine and International Health. 6(9): 667-676. Cameron, A. Colin, Douglas Miller, and Jonah B. Gelbach. (2007). “Bootstrapped-Based Improvements for Inference with Clustered Errors.” NBER Technical Working Paper t0344. Cassiman, Bruno and Elena Golovko. 2007. Innovation and the Export-Productivity Link. IESE Working Paper no 688. Chuma, Jane et al. 2006. “Rethinking the economic costs of malaria at the household level: Evidence from applying a new analytical framework in rural Kenya”, Malaria Journal 5:76. Deaton, Angus. 1997. The analysis of household surveys: a microeconometric approach to development policy. The John Hopkins University Press. Donald, Stephen, and Kevin Lang (2007): “Inference with Differences-in-Differences and Other Panel Data," The Review of Economics and Statistics, Vol. 89, No. 2: 221-233. Dupas, Pascaline. 2005. “The Impact of Conditional In-Kind Subsidies on Preventive Health Behaviors: Evidence from Western Kenya.” Dartmouth College Department of Economics Working Paper. Dupas, Pascaline. 2008. “Pricing strategies in scaling-up access to long-lasting insecticide-treated nets: Evidence from a randomized voucher experiment in Western Kenya”, mimeo, UCLA. Easterly, William. 2006. The White Man's Burden: Why the West's Efforts to Aid the Rest Have Done So Much Ill and So Little Good. Penguin Press, 417 pp.
27

Ettling M, et al. 1994. “Economic Impact of Malaria in Malawian Households.” Tropical Medicine and Parasitology. 45: 74-79. Evans, D. B., et al. 1997. “Should Governments Subsidize the Use of Insecticide-Impregnated Mosquito Nets in Africa? Implications of a Cost-Effectiveness Analysis.” Health Policy and Planning. 12(2): 107-114. Gimnig, John E., et al. 2003. “Effect of Permethrin-Treated Bed Nets on the Spatial Distribution of Malaria Vectors in Western Kenya.” American Journal of Tropical Medicine and Hygiene. 68 (Suppl. 4): 115-120. Goodman, C. A and Mills, A. J. 1999. “The Evidence Base on the Cost-Effectiveness of Malaria Control Measures in Africa.” Health Policy and Planning. 14(4): 301-312. Grabowsky, M. et al. 2005. “Distributing Insecticide-Treated Bednets During Measles Vaccination: A Low-Cost Means of Achieving High and Equitable Coverage.” Bulletin of the World Health Organization. 83(3): 195-201. Guyatt, Helen L., Sam A. Ochola and Robert W. Snow. 2002. “Too Poor to Pay: Charging for Insecticide-Treated Bednets in Highland Kenya.” Tropical Medicine and International Health. 7(10): 846-850. Hanson, Kara, et al. 2003. “Cost-Effectiveness of Social Marketing of Insecticide-Treated Nets for Malaria Control in the United Republic of Tanzania.” Bulletin of the World Health Organization. 81(4): 269-276. Harvey P, The impact of condom prices on sales in social marketing programs, Studies in Family Planning, 1994, 25(1):52-58. Hawley, William A. et al. 2003. “Community-Wide Effects of Permethrin-Treated Bed Nets on Child Mortality and Malaria Morbidity in Western Kenya.” American Journal of Tropical Medicine and Hygiene. 68(Suppl. 4): 121-127. Hoffman, Vivian . 2007. “Psychology, gender, and the intrahousehold allocation of free and purchased mosquito nets”. Mimeo, Cornell University. Holtz Timothy H., et al. 2002. Insecticide-treated bednet use, anemia, and malaria parasitaemia in Blantyre District, Malawi. Trop Med Int Health 7: 220-230. Karlan, Dean and Jonathan Zinman. 2008. “Observing Unobservables: Identifying Information Asymmetries with a Consumer Credit Field Experiment”. Forthcoming, Econometrica. Kremer, Michael and Edward Miguel. 2007. “The Illusion of Sustainability”. Quarterly Journal of Economics 112(3), 1007-1065. Lengeler, C. 2004. Insecticide-Treated bed nets and curtains for preventing malaria. Cochrane Dabatase Syst Rev; 2:CF000363 Lengeler, Christian, et al. 2007. “Quick Wins Versus Sustainability: Options for the Upscaling of Insecticide-Treated Nets”Am. J. Trop. Med. Hyg., 77(6_Suppl): 222-226. Lucas, Adrienne. 2007. "Economic Effects of Malaria Eradication: Evidence from the Malarial Periphery". Mimeo, Wellesley College.
28

Marchant, Tanya, et al. 2002. “Socially Marketed Insecticide-Treated Nets Improve Malaria and Anaemia in Pregnancy in Southern Tanzania.” Tropical Medicine and International Health. 7(2): 149-158. Maxwell, C. A. et al. 2002. “Effect of Community-Wide Use of Insecticide-Treated Nets for 3-4 Years on Malarial Morbidity in Tanzania.” Tropical Medicine and International Health. 7(12): 1003-1008. Moulton, Brent R. 1986, “Random Group Effects and the Precision of Regression Estimates,” Journal of Econometrics, 32, 385-397. Moulton, Brent R. 1990. “An Illustration of a Pitfall in Estimating the Effects of Aggregate Variables on Micro Units, Review of Economics and Statistics, 72, 334-38.” Mushi, Adiel K., et al. 2003. “Targeted subsidy for malaria control with treated nets using a discount voucher system in southern Tanzania.” Health Policy and Planning, 18(2), 163–171. Olken, Benjamin (2006). “Corruption and the Costs of Redistribution: Micro Evidence from Indonesia” Journal of Public Economics, 90 (4-5), pp. 853-870. Okrah, Jane, et al. 2002. “Community Factors associated with malaria prevention by mosquito nets: an exploratory study in rural Burkina Faso.” Trop Med Int Health 7: 240-248. Oster, Sharon. 1995. Strategic Management for nonprofit organizations: Theory and Cases. Oxford University Press, Oxford, 1995. Phillips-Howard, Penelope A., et al. 2003. “Efficacy of Permethrin-Treated Bed Nets in the Prevention of Mortality in Young Children in an Area of High Perennial Malaria Transmission in Western Kenya.” American Journal of Tropical Medicine and Hygiene. 68(Suppl. 4): 23-29. Riley, John G. 2001. “Silver Signals: Twenty-Five Years of Screening and Signaling”. Journal of Economic Literature, Vol. 39, No. 2, pp. 432-478. Population Services International. 2003. “What is Social Marketing?”; available online at: http://www.psi.org/resources/pubs/what_is_smEN.pdf Sachs, Jeffrey. 2005. The End of Poverty: Economic Possibilities for Our Time, New York: Penguin Press. Schellenberg, JRMA. et al. 1999. “KINET: a social marketing programme of treated nets and net treatment for malaria control in Tanzania, with evaluation of child health and long-term survival.” Transactions of the Royal Society of Tropical Medicine and Hygiene 93, 225–231. Schellenberg Joanna A., et al. 2001. “Effect of large-scale social marketing of insecticide-treated nets on child survival in rural Tanzania.” Lancet 357, 1241–1247. Ter Kuile, Feiko O., et al. 2003. “Reduction of Malaria During Pregnancy by Permethrin-Treated Bed Nets in an Area of Intense Perennial Malaria Transmission in Western Kenya.” American Journal of Tropical Medicine and Hygiene. 68(Suppl. 4): 50 - 60. Thaler, Richard. 1980. Toward a Positive Theory of Consumer Choice. Journal of Economic Behavior and Organization. 1(1): 39-60.
29

Thaler, Richard. 1985. “Mental Accounting and Consumer Choice”. Marketing Science, Vol. 4, No. 3. pp. 199-214. Thaler, Richard. 1999. “Mental Account Matters.” Journal of Behavioral Decision Making, 12:183:206. Webster, Jane, Jo Lines, and Lucy Smith. 2007. “Protecting all Pregnant Women and Children Under Five Years Living in Malaria Endemic Areas in Africa with Insecticide Treated Mosquito Nets.” World Health Organization Working Paper. http://www.who.int/malaria/docs/VulnerableGroupsWP.pdf WHO, 2005. World Malaria Report 2005. WHO, Geneva. WHO, 2007. WHO Global Malaria Programme: Position Statement on ITNs. http://www.who.int/malaria/docs/itn/ITNspospaperfinal.pdf Wooldridge, Jeffrey M. (2004): “Cluster-Sample Methods in Applied Econometrics," American Economic Review, 93(2), 133-138. World Bank (2004). World Development Report 2004: Making Services Work for Poor People. World Bank and Oxford University Press.
30
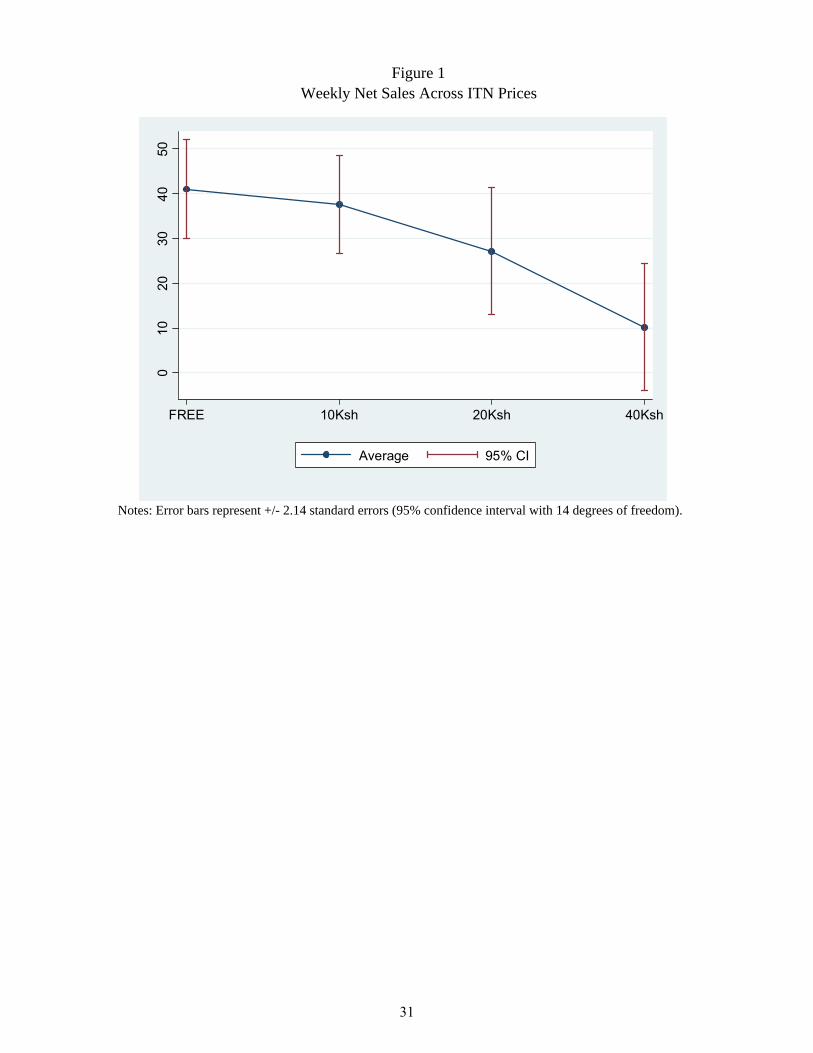
Figure 1Weekly Net Sales Across ITN Prices
Notes: Error bars represent +/- 2.14 standard errors (95% confidence interval with 14 degrees of freedom).
010
2030
4050
FREE 10Ksh 20Ksh 40Ksh
Average 95% CI
31
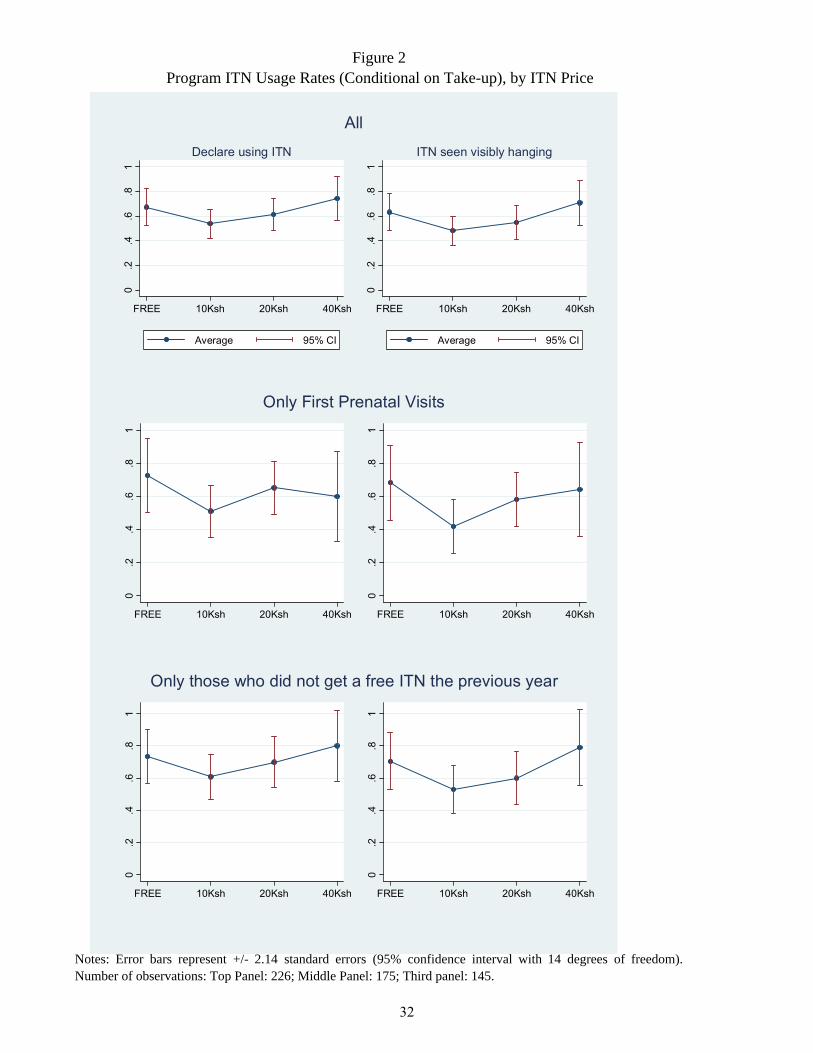
Notes: Error bars represent +/- 2.14 standard errors (95% confidence interval with 14 degrees of freedom).Number of observations: Top Panel: 226; Middle Panel: 175; Third panel: 145.
Figure 2Program ITN Usage Rates (Conditional on Take-up), by ITN Price
0.2
.4.6
.81
FREE 10Ksh 20Ksh 40Ksh
Average 95% CI
Declare using ITN
0.2
.4.6
.81
FREE 10Ksh 20Ksh 40Ksh
Average 95% CI
ITN seen visibly hanging
All0
.2.4
.6.8
1
FREE 10Ksh 20Ksh 40Ksh
0.2
.4.6
.81
FREE 10Ksh 20Ksh 40Ksh
Only First Prenatal Visits
0.2
.4.6
.81
FREE 10Ksh 20Ksh 40Ksh
0.2
.4.6
.81
FREE 10Ksh 20Ksh 40Ksh
Only those who did not get a free ITN the previous year
32
Figure 3Effective Coverage: Program ITN Usage Rates, Unconditional on Take-up
Notes: Sample includes women sampled for baseline survey during clinic visit, and who either did not acquire anITN or acquired one and were later randomly sampled for home follow-up. Usage of program ITN is zero for thosewho did not acquire a program ITN. Error bars represent +/- 2.14 standard errors (5% confidence interval with 14degrees of freedom). In Kenya, ITNs are currently social-marketed through prenatal clinics at the price of 50Ksh .
0.2
.4.6
.8
FREE 10Ksh 20Ksh 40Ksh
Average 95% CI
All
0.2
.4.6
.8
FREE 10Ksh 20Ksh 40Ksh
Average 95% CI
Only those who did not receive a free ITN the previous year
33
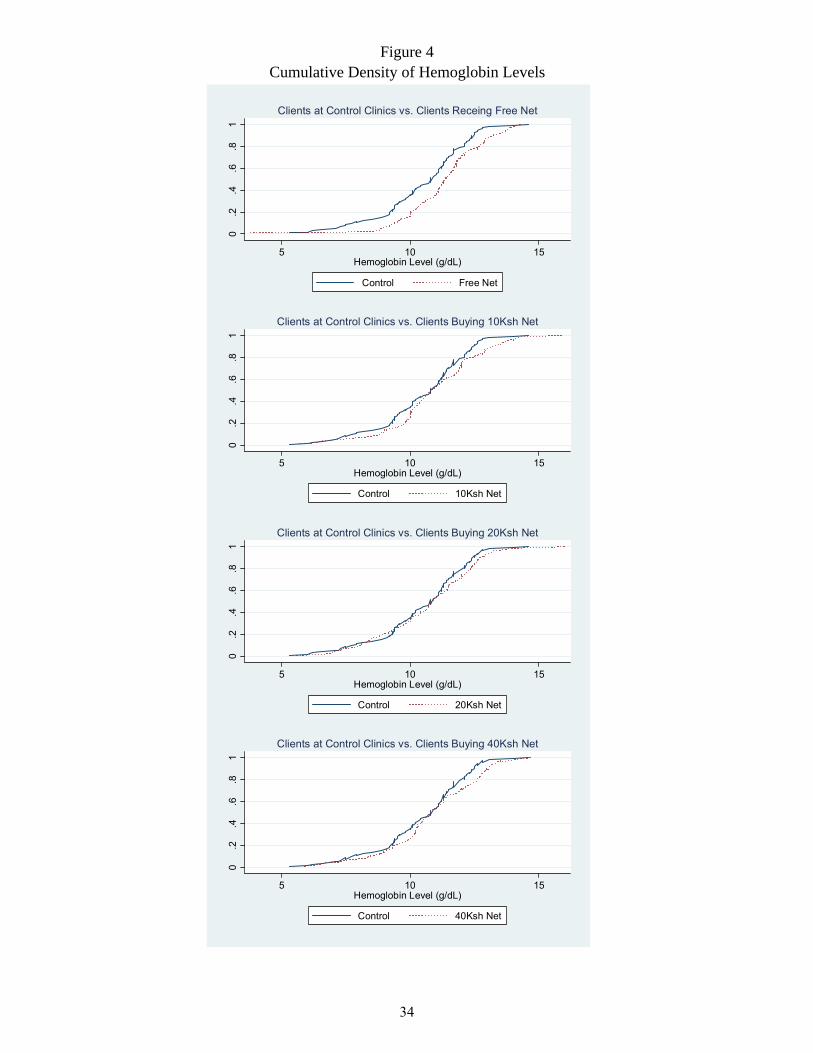
Figure 4Cumulative Density of Hemoglobin Levels
0.2
.4.6
.81
5 10 15Hemoglobin Level (g/dL)
Control Free Net
Clients at Control Clinics vs. Clients Receing Free Net
0.2
.4.6
.81
5 10 15Hemoglobin Level (g/dL)
Control 10Ksh Net
Clients at Control Clinics vs. Clients Buying 10Ksh Net
0.2
.4.6
.81
5 10 15Hemoglobin Level (g/dL)
Control 20Ksh Net
Clients at Control Clinics vs. Clients Buying 20Ksh Net
0.2
.4.6
.81
5 10 15Hemoglobin Level (g/dL)
Control 40Ksh Net
Clients at Control Clinics vs. Clients Buying 40Ksh Net
34
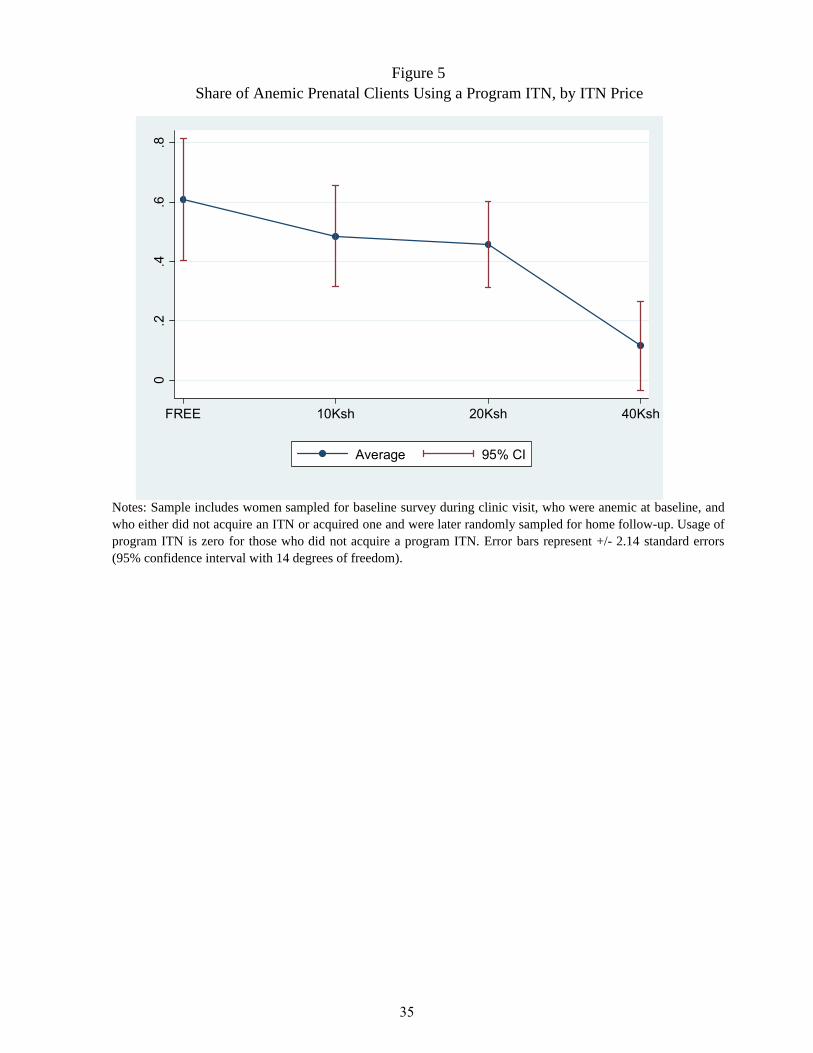
Figure 5Share of Anemic Prenatal Clients Using a Program ITN, by ITN Price
Notes: Sample includes women sampled for baseline survey during clinic visit, who were anemic at baseline, andwho either did not acquire an ITN or acquired one and were later randomly sampled for home follow-up. Usage ofprogram ITN is zero for those who did not acquire a program ITN. Error bars represent +/- 2.14 standard errors(95% confidence interval with 14 degrees of freedom).
0.2
.4.6
.8
FREE 10Ksh 20Ksh 40Ksh
Average 95% CI
35
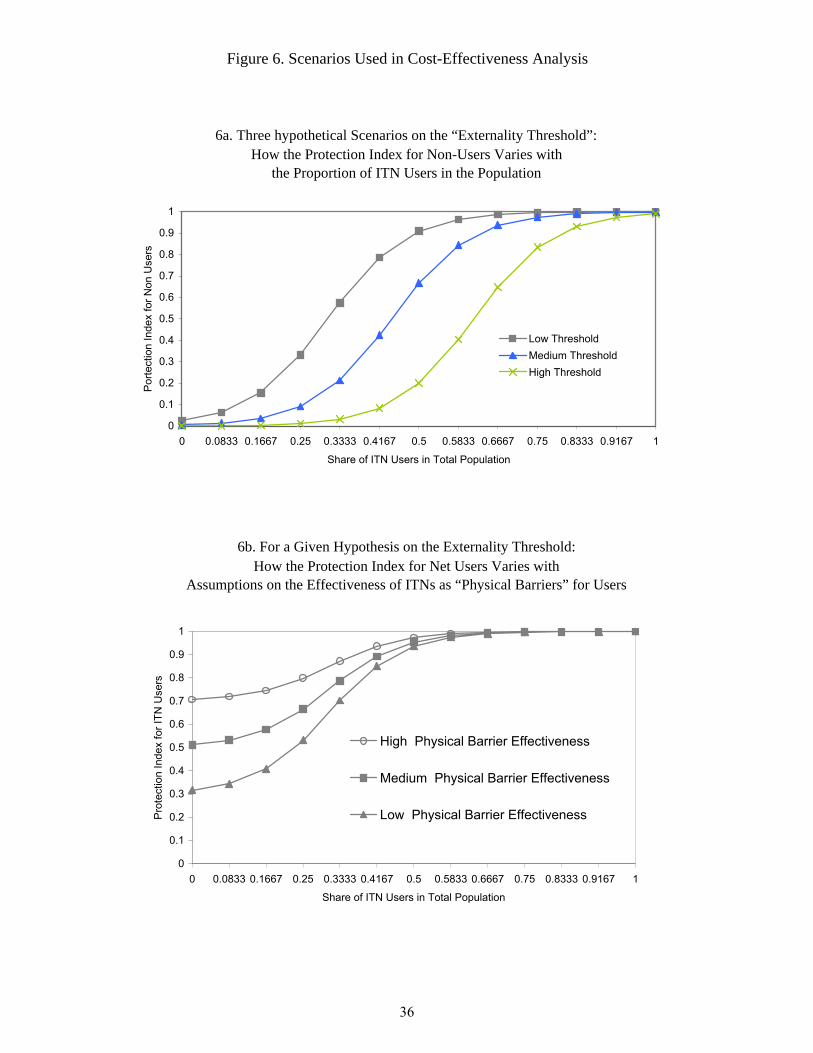
6b. For a Given Hypothesis on the Externality Threshold: How the Protection Index for Net Users Varies with
Assumptions on the Effectiveness of ITNs as “Physical Barriers” for Users
Figure 6. Scenarios Used in Cost-Effectiveness Analysis
6a. Three hypothetical Scenarios on the “Externality Threshold”:How the Protection Index for Non-Users Varies with
the Proportion of ITN Users in the Population
0
0.1
0.2
0.3
0.4
0.5
0.6
0.7
0.8
0.9
1
0 0.0833 0.1667 0.25 0.3333 0.4167 0.5 0.5833 0.6667 0.75 0.8333 0.9167 1
Share of ITN Users in Total Population
Por
tect
ion
Inde
x fo
r Non
Use
rs
Low ThresholdMedium ThresholdHigh Threshold
0
0.1
0.2
0.3
0.4
0.5
0.6
0.7
0.8
0.9
1
0 0.0833 0.1667 0.25 0.3333 0.4167 0.5 0.5833 0.6667 0.75 0.8333 0.9167 1
Share of ITN Users in Total Population
Pro
tect
ion
Inde
x fo
r ITN
Use
rs
High Physical Barrier Effectiveness
Medium Physical Barrier Effectiveness
Low Physical Barrier Effectiveness
36
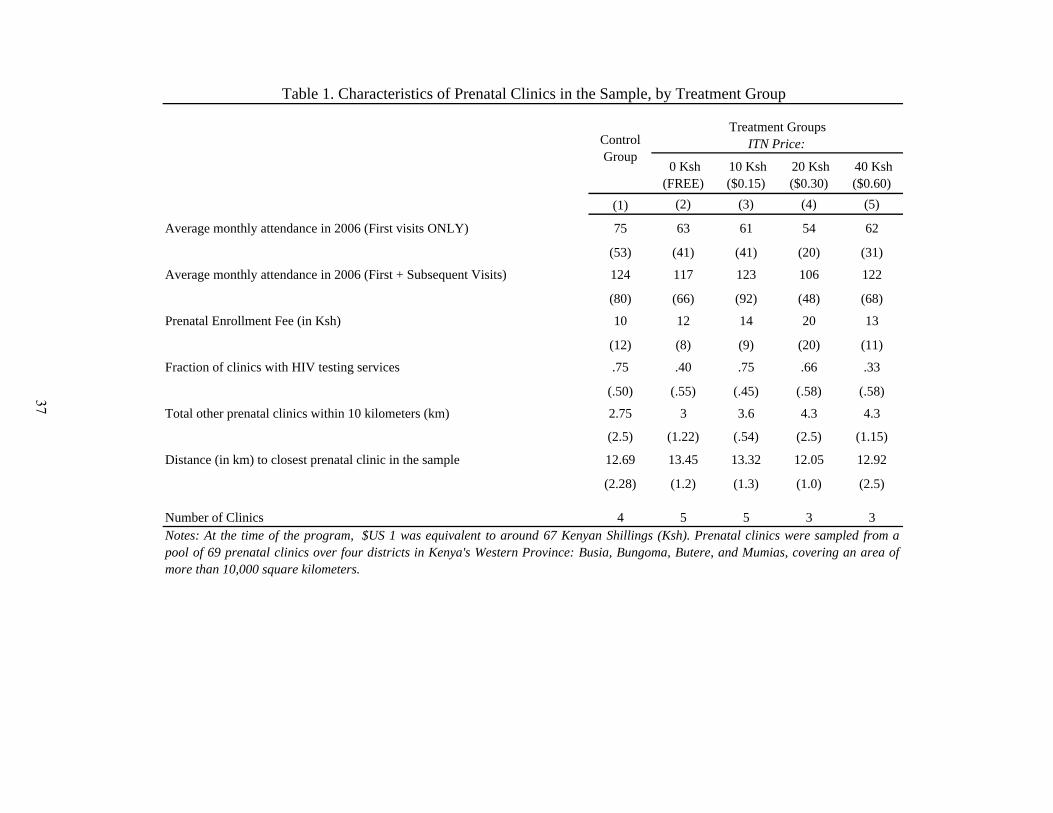
0 Ksh (FREE)
10 Ksh ($0.15)
20 Ksh ($0.30)
40 Ksh ($0.60)
(1) (2) (3) (4) (5)
Average monthly attendance in 2006 (First visits ONLY) 75 63 61 54 62
(53) (41) (41) (20) (31)
Average monthly attendance in 2006 (First + Subsequent Visits) 124 117 123 106 122
(80) (66) (92) (48) (68)
Prenatal Enrollment Fee (in Ksh) 10 12 14 20 13
(12) (8) (9) (20) (11)
Fraction of clinics with HIV testing services .75 .40 .75 .66 .33
(.50) (.55) (.45) (.58) (.58)
Total other prenatal clinics within 10 kilometers (km) 2.75 3 3.6 4.3 4.3
(2.5) (1.22) (.54) (2.5) (1.15)
Distance (in km) to closest prenatal clinic in the sample 12.69 13.45 13.32 12.05 12.92
(2.28) (1.2) (1.3) (1.0) (2.5)
Number of Clinics 4 5 5 3 3
Table 1. Characteristics of Prenatal Clinics in the Sample, by Treatment Group
Treatment GroupsITN Price: Control
Group
Notes: At the time of the program, $US 1 was equivalent to around 67 Kenyan Shillings (Ksh). Prenatal clinics were sampled from apool of 69 prenatal clinics over four districts in Kenya's Western Province: Busia, Bungoma, Butere, and Mumias, covering an area ofmore than 10,000 square kilometers.
37
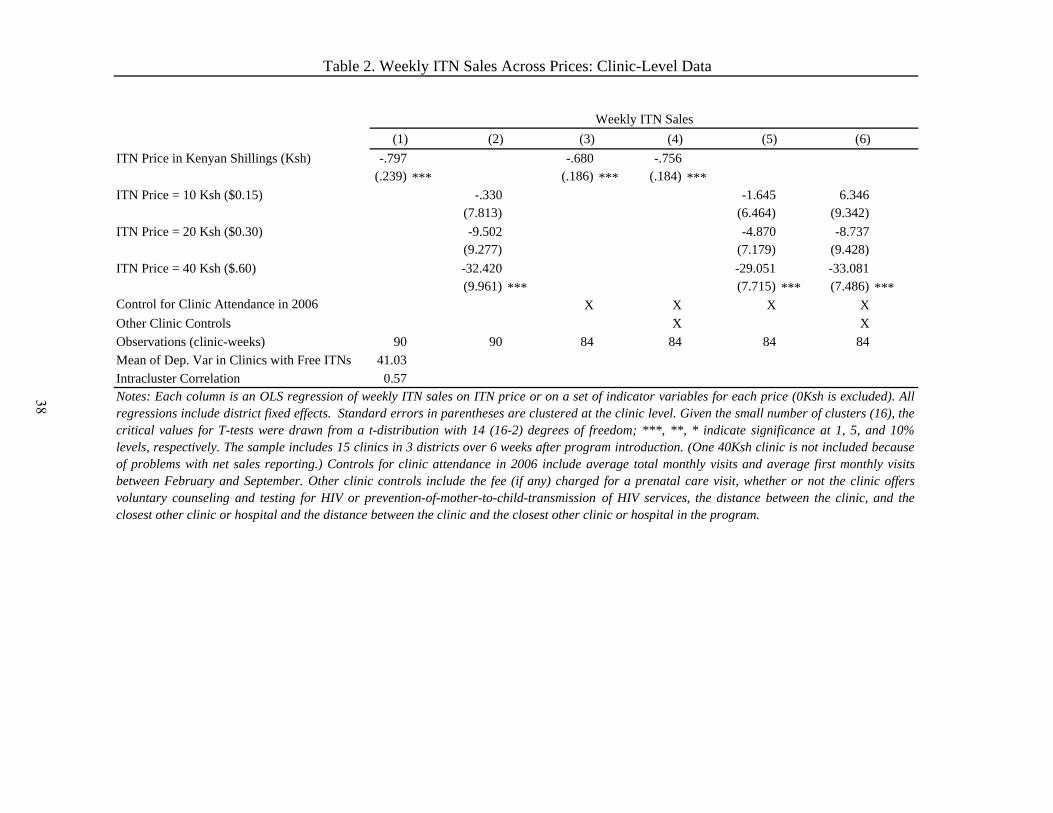
(1) (2) (3) (4) (5) (6)ITN Price in Kenyan Shillings (Ksh) -.797 -.680 -.756
(.239) *** (.186) *** (.184) *** ITN Price = 10 Ksh ($0.15) -.330 -1.645 6.346
(7.813) (6.464) (9.342) ITN Price = 20 Ksh ($0.30) -9.502 -4.870 -8.737
(9.277) (7.179) (9.428) ITN Price = 40 Ksh ($.60) -32.420 -29.051 -33.081
(9.961) *** (7.715) *** (7.486) ***Control for Clinic Attendance in 2006 X X X XOther Clinic Controls X XObservations (clinic-weeks) 90 90 84 84 84 84Mean of Dep. Var in Clinics with Free ITNs 41.03Intracluster Correlation 0.57Notes: Each column is an OLS regression of weekly ITN sales on ITN price or on a set of indicator variables for each price (0Ksh is excluded). Allregressions include district fixed effects. Standard errors in parentheses are clustered at the clinic level. Given the small number of clusters (16), thecritical values for T-tests were drawn from a t-distribution with 14 (16-2) degrees of freedom; ***, **, * indicate significance at 1, 5, and 10%levels, respectively. The sample includes 15 clinics in 3 districts over 6 weeks after program introduction. (One 40Ksh clinic is not included becauseof problems with net sales reporting.) Controls for clinic attendance in 2006 include average total monthly visits and average first monthly visitsbetween February and September. Other clinic controls include the fee (if any) charged for a prenatal care visit, whether or not the clinic offersvoluntary counseling and testing for HIV or prevention-of-mother-to-child-transmission of HIV services, the distance between the clinic, and theclosest other clinic or hospital and the distance between the clinic and the closest other clinic or hospital in the program.
Table 2. Weekly ITN Sales Across Prices: Clinic-Level Data
Weekly ITN Sales
38
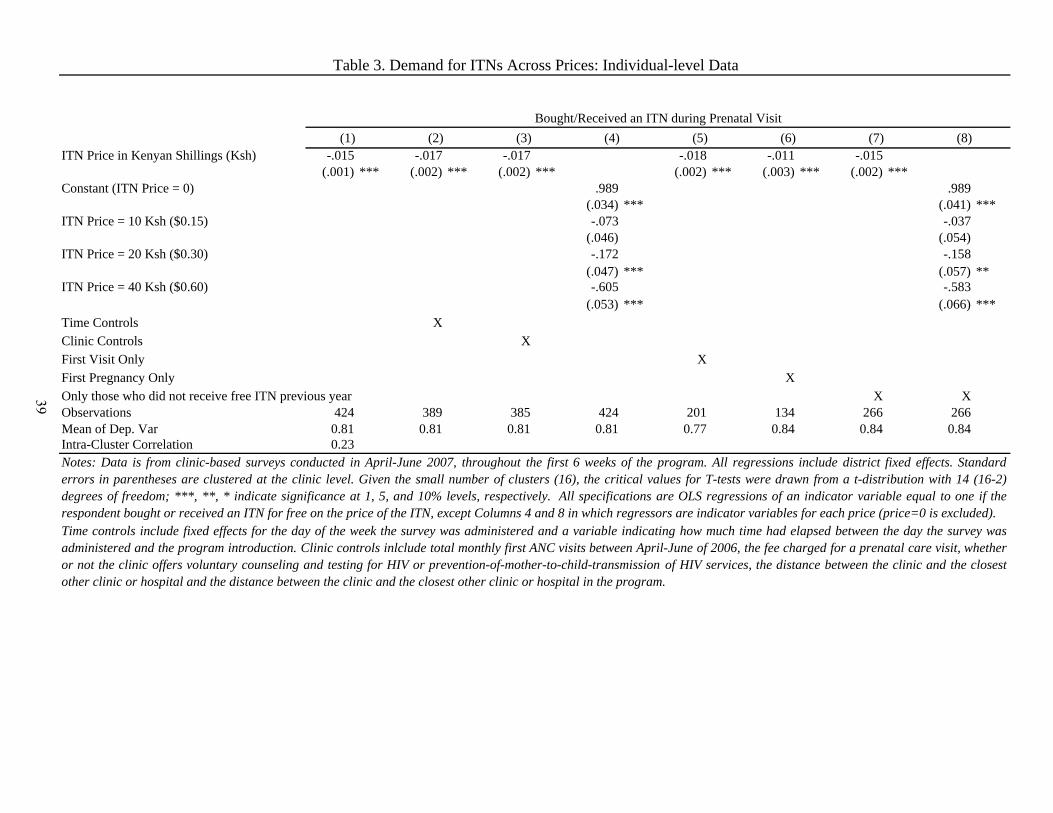
(1) (2) (3) (4) (5) (6) (7) (8)ITN Price in Kenyan Shillings (Ksh) -.015 -.017 -.017 -.018 -.011 -.015
(.001) *** (.002) *** (.002) *** (.002) *** (.003) *** (.002) ***Constant (ITN Price = 0) .989 .989
(.034) *** (.041) ***ITN Price = 10 Ksh ($0.15) -.073 -.037
(.046) (.054)ITN Price = 20 Ksh ($0.30) -.172 -.158
(.047) *** (.057) **ITN Price = 40 Ksh ($0.60) -.605 -.583
(.053) *** (.066) ***Time Controls XClinic Controls XFirst Visit Only XFirst Pregnancy Only XOnly those who did not receive free ITN previous year X XObservations 424 389 385 424 201 134 266 266Mean of Dep. Var 0.81 0.81 0.81 0.81 0.77 0.84 0.84 0.84Intra-Cluster Correlation 0.23Notes: Data is from clinic-based surveys conducted in April-June 2007, throughout the first 6 weeks of the program. All regressions include district fixed effects. Standarderrors in parentheses are clustered at the clinic level. Given the small number of clusters (16), the critical values for T-tests were drawn from a t-distribution with 14 (16-2)degrees of freedom; ***, **, * indicate significance at 1, 5, and 10% levels, respectively. All specifications are OLS regressions of an indicator variable equal to one if therespondent bought or received an ITN for free on the price of the ITN, except Columns 4 and 8 in which regressors are indicator variables for each price (price=0 is excluded).Time controls include fixed effects for the day of the week the survey was administered and a variable indicating how much time had elapsed between the day the survey wasadministered and the program introduction. Clinic controls inlclude total monthly first ANC visits between April-June of 2006, the fee charged for a prenatal care visit, whetheror not the clinic offers voluntary counseling and testing for HIV or prevention-of-mother-to-child-transmission of HIV services, the distance between the clinic and the closestother clinic or hospital and the distance between the clinic and the closest other clinic or hospital in the program.
Table 3. Demand for ITNs Across Prices: Individual-level Data
Bought/Received an ITN during Prenatal Visit
39
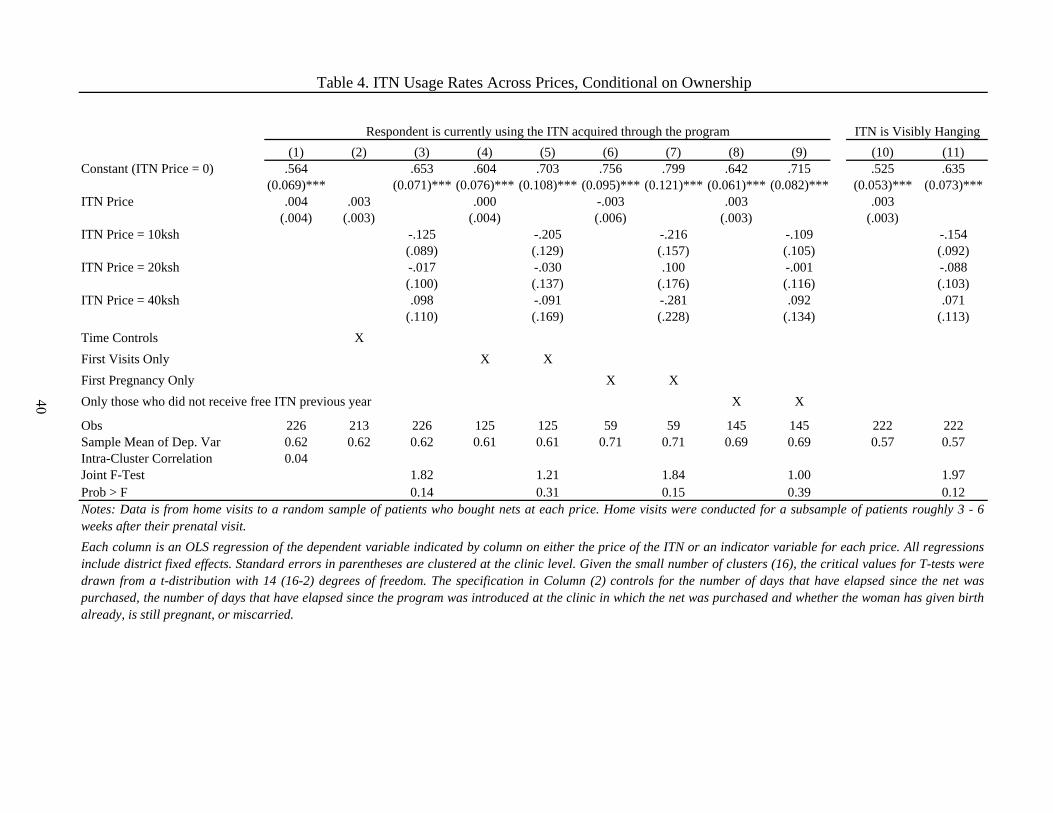
(1) (2) (3) (4) (5) (6) (7) (8) (9) (10) (11)Constant (ITN Price = 0) .564 .653 .604 .703 .756 .799 .642 .715 .525 .635
(0.069)*** (0.071)*** (0.076)*** (0.108)*** (0.095)*** (0.121)*** (0.061)*** (0.082)*** (0.053)*** (0.073)***ITN Price .004 .003 .000 -.003 .003 .003
(.004) (.003) (.004) (.006) (.003) (.003)ITN Price = 10ksh -.125 -.205 -.216 -.109 -.154
(.089) (.129) (.157) (.105) (.092)ITN Price = 20ksh -.017 -.030 .100 -.001 -.088
(.100) (.137) (.176) (.116) (.103)ITN Price = 40ksh .098 -.091 -.281 .092 .071
(.110) (.169) (.228) (.134) (.113)Time Controls XFirst Visits Only X XFirst Pregnancy Only X XOnly those who did not receive free ITN previous year X X
Obs 226 213 226 125 125 59 59 145 145 222 222Sample Mean of Dep. Var 0.62 0.62 0.62 0.61 0.61 0.71 0.71 0.69 0.69 0.57 0.57Intra-Cluster Correlation 0.04Joint F-Test 1.82 1.21 1.84 1.00 1.97Prob > F 0.14 0.31 0.15 0.39 0.12
Each column is an OLS regression of the dependent variable indicated by column on either the price of the ITN or an indicator variable for each price. All regressionsinclude district fixed effects. Standard errors in parentheses are clustered at the clinic level. Given the small number of clusters (16), the critical values for T-tests weredrawn from a t-distribution with 14 (16-2) degrees of freedom. The specification in Column (2) controls for the number of days that have elapsed since the net waspurchased, the number of days that have elapsed since the program was introduced at the clinic in which the net was purchased and whether the woman has given birthalready, is still pregnant, or miscarried.
Table 4. ITN Usage Rates Across Prices, Conditional on Ownership
ITN is Visibly Hanging
Notes: Data is from home visits to a random sample of patients who bought nets at each price. Home visits were conducted for a subsample of patients roughly 3 - 6weeks after their prenatal visit.
Respondent is currently using the ITN acquired through the program
40
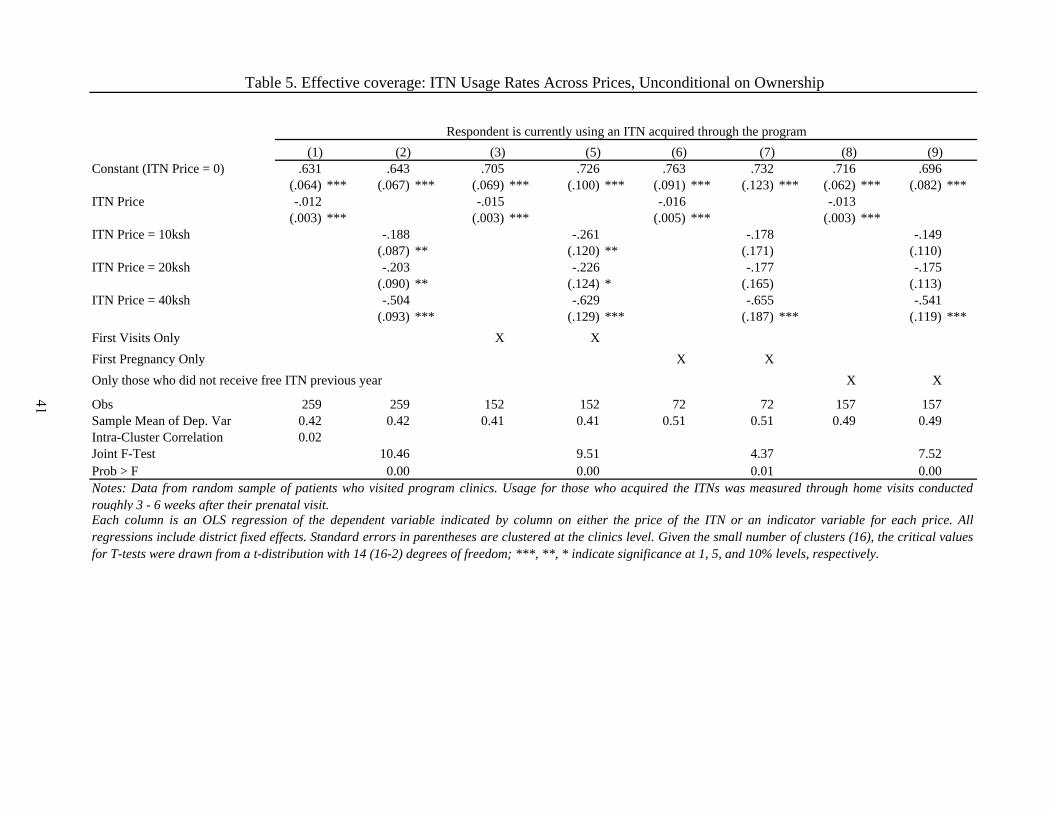
(1) (2) (3) (5) (6) (7) (8) (9)Constant (ITN Price = 0) .631 .643 .705 .726 .763 .732 .716 .696
(.064) *** (.067) *** (.069) *** (.100) *** (.091) *** (.123) *** (.062) *** (.082) ***ITN Price -.012 -.015 -.016 -.013
(.003) *** (.003) *** (.005) *** (.003) ***ITN Price = 10ksh -.188 -.261 -.178 -.149
(.087) ** (.120) ** (.171) (.110) ITN Price = 20ksh -.203 -.226 -.177 -.175
(.090) ** (.124) * (.165) (.113) ITN Price = 40ksh -.504 -.629 -.655 -.541
(.093) *** (.129) *** (.187) *** (.119) ***First Visits Only X XFirst Pregnancy Only X XOnly those who did not receive free ITN previous year X X
Obs 259 259 152 152 72 72 157 157Sample Mean of Dep. Var 0.42 0.42 0.41 0.41 0.51 0.51 0.49 0.49Intra-Cluster Correlation 0.02Joint F-Test 10.46 9.51 4.37 7.52Prob > F 0.00 0.00 0.01 0.00
Table 5. Effective coverage: ITN Usage Rates Across Prices, Unconditional on Ownership
Respondent is currently using an ITN acquired through the program
Notes: Data from random sample of patients who visited program clinics. Usage for those who acquired the ITNs was measured through home visits conductedroughly 3 - 6 weeks after their prenatal visit.Each column is an OLS regression of the dependent variable indicated by column on either the price of the ITN or an indicator variable for each price. Allregressions include district fixed effects. Standard errors in parentheses are clustered at the clinics level. Given the small number of clusters (16), the critical valuesfor T-tests were drawn from a t-distribution with 14 (16-2) degrees of freedom; ***, **, * indicate significance at 1, 5, and 10% levels, respectively.
41
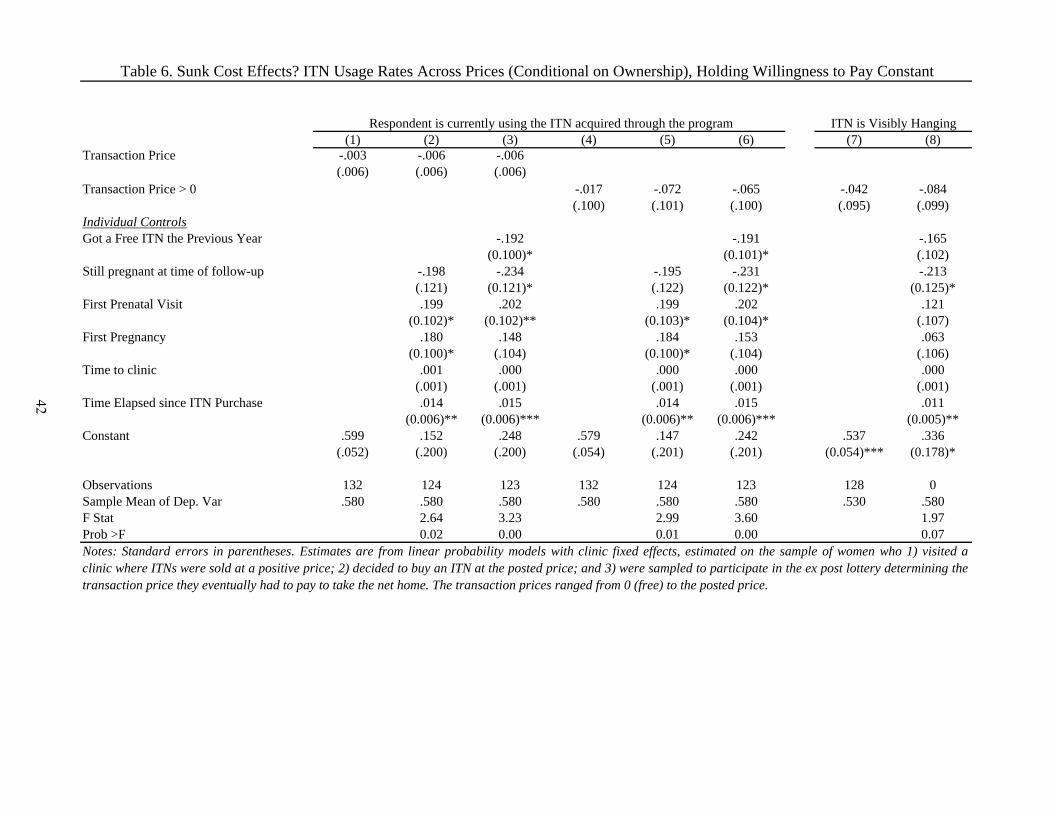
(1) (2) (3) (4) (5) (6) (7) (8)Transaction Price -.003 -.006 -.006
(.006) (.006) (.006)Transaction Price > 0 -.017 -.072 -.065 -.042 -.084
(.100) (.101) (.100) (.095) (.099)Individual ControlsGot a Free ITN the Previous Year -.192 -.191 -.165
(0.100)* (0.101)* (.102)Still pregnant at time of follow-up -.198 -.234 -.195 -.231 -.213
(.121) (0.121)* (.122) (0.122)* (0.125)*First Prenatal Visit .199 .202 .199 .202 .121
(0.102)* (0.102)** (0.103)* (0.104)* (.107)First Pregnancy .180 .148 .184 .153 .063
(0.100)* (.104) (0.100)* (.104) (.106)Time to clinic .001 .000 .000 .000 .000
(.001) (.001) (.001) (.001) (.001)Time Elapsed since ITN Purchase .014 .015 .014 .015 .011
(0.006)** (0.006)*** (0.006)** (0.006)*** (0.005)**Constant .599 .152 .248 .579 .147 .242 .537 .336
(.052) (.200) (.200) (.054) (.201) (.201) (0.054)*** (0.178)*
Observations 132 124 123 132 124 123 128 0Sample Mean of Dep. Var .580 .580 .580 .580 .580 .580 .530 .580F Stat 2.64 3.23 2.99 3.60 1.97Prob >F 0.02 0.00 0.01 0.00 0.07
Respondent is currently using the ITN acquired through the program ITN is Visibly Hanging
Notes: Standard errors in parentheses. Estimates are from linear probability models with clinic fixed effects, estimated on the sample of women who 1) visited aclinic where ITNs were sold at a positive price; 2) decided to buy an ITN at the posted price; and 3) were sampled to participate in the ex post lottery determining thetransaction price they eventually had to pay to take the net home. The transaction prices ranged from 0 (free) to the posted price.
Table 6. Sunk Cost Effects? ITN Usage Rates Across Prices (Conditional on Ownership), Holding Willingness to Pay Constant
42
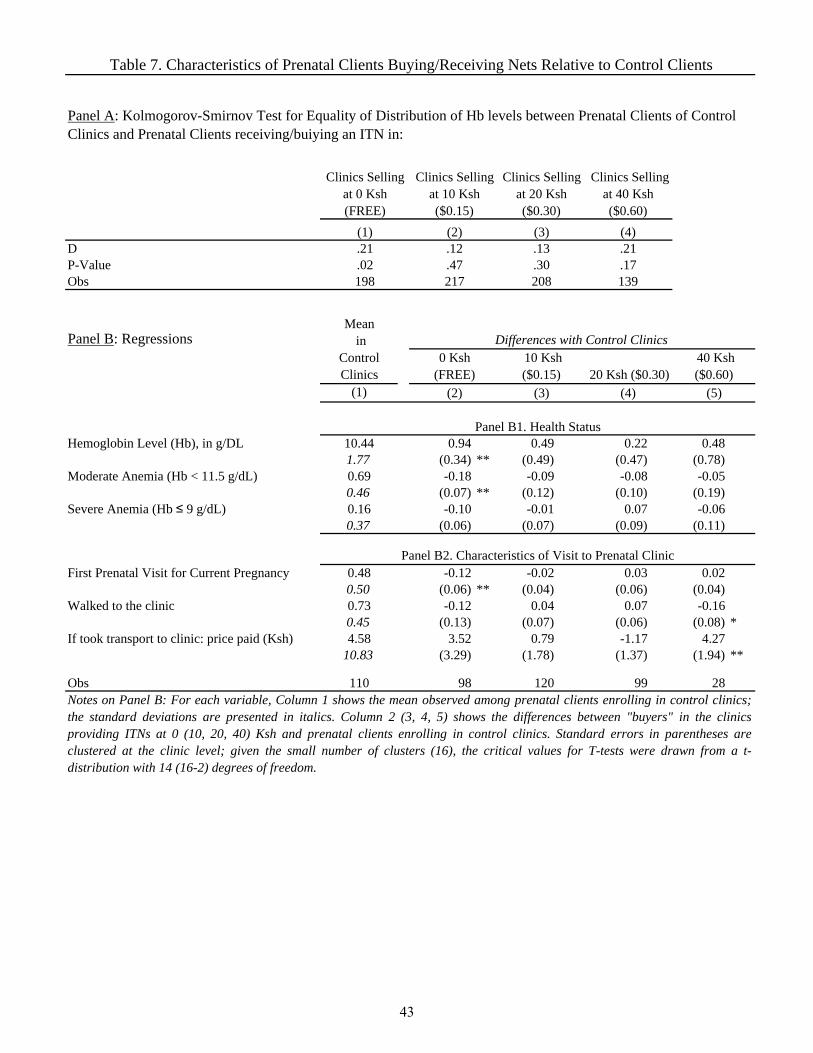
DP-ValueObs
Panel B: Regressions
(1)
Hemoglobin Level (Hb), in g/DL 10.44 0.94 0.49 0.22 0.481.77 (0.34) ** (0.49) (0.47) (0.78)
Moderate Anemia (Hb < 11.5 g/dL) 0.69 -0.18 -0.09 -0.08 -0.050.46 (0.07) ** (0.12) (0.10) (0.19)
Severe Anemia (Hb ≤ 9 g/dL) 0.16 -0.10 -0.01 0.07 -0.060.37 (0.06) (0.07) (0.09) (0.11)
First Prenatal Visit for Current Pregnancy 0.48 -0.12 -0.02 0.03 0.020.50 (0.06) ** (0.04) (0.06) (0.04)
Walked to the clinic 0.73 -0.12 0.04 0.07 -0.160.45 (0.13) (0.07) (0.06) (0.08) *
If took transport to clinic: price paid (Ksh) 4.58 3.52 0.79 -1.17 4.2710.83 (3.29) (1.78) (1.37) (1.94) **
Obs 110 98 120 99 28
40 Ksh ($0.60)
Differences with Control Clinics
Notes on Panel B: For each variable, Column 1 shows the mean observed among prenatal clients enrolling in control clinics;the standard deviations are presented in italics. Column 2 (3, 4, 5) shows the differences between "buyers" in the clinicsproviding ITNs at 0 (10, 20, 40) Ksh and prenatal clients enrolling in control clinics. Standard errors in parentheses areclustered at the clinic level; given the small number of clusters (16), the critical values for T-tests were drawn from a t-distribution with 14 (16-2) degrees of freedom.
Panel B2. Characteristics of Visit to Prenatal Clinic
(2) (3) (4) (5)
Mean in
Control Clinics
0 Ksh (FREE)
10 Ksh ($0.15) 20 Ksh ($0.30)
.17198 217 208 139
(3)(1)
.02 .47 .30
.21 .12 .13(4).21
Panel B1. Health Status
Table 7. Characteristics of Prenatal Clients Buying/Receiving Nets Relative to Control Clients
Panel A: Kolmogorov-Smirnov Test for Equality of Distribution of Hb levels between Prenatal Clients of Control Clinics and Prenatal Clients receiving/buiying an ITN in:
Clinics Selling at 0 Ksh (FREE)
Clinics Selling at 10 Ksh ($0.15)
Clinics Selling at 20 Ksh ($0.30)
Clinics Selling at 40 Ksh ($0.60)
(2)
43
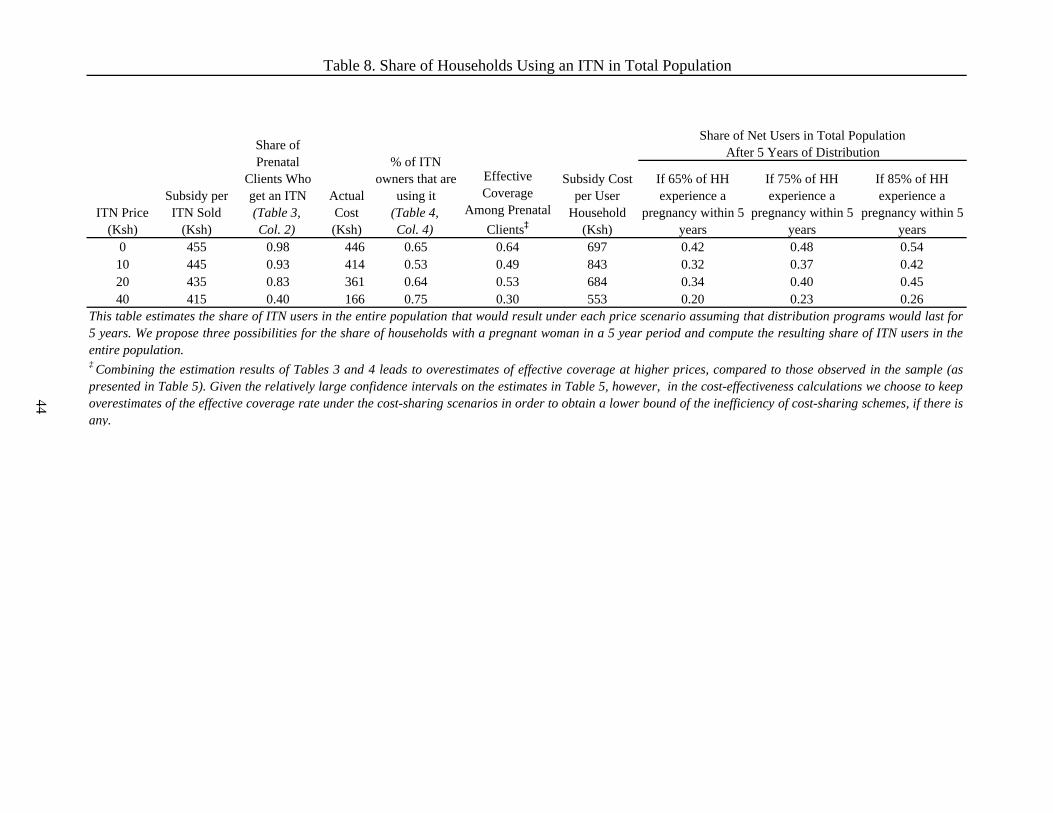
Actual Cost (Ksh)
If 65% of HH experience a
pregnancy within 5 years
If 75% of HH experience a
pregnancy within 5 years
If 85% of HH experience a
pregnancy within 5 years
0 455 0.98 446 0.65 0.64 697 0.42 0.48 0.5410 445 0.93 414 0.53 0.49 843 0.32 0.37 0.4220 435 0.83 361 0.64 0.53 684 0.34 0.40 0.4540 415 0.40 166 0.75 0.30 553 0.20 0.23 0.26
This table estimates the share of ITN users in the entire population that would result under each price scenario assuming that distribution programs would last for5 years. We propose three possibilities for the share of households with a pregnant woman in a 5 year period and compute the resulting share of ITN users in theentire population. ‡ Combining the estimation results of Tables 3 and 4 leads to overestimates of effective coverage at higher prices, compared to those observed in the sample (aspresented in Table 5). Given the relatively large confidence intervals on the estimates in Table 5, however, in the cost-effectiveness calculations we choose to keepoverestimates of the effective coverage rate under the cost-sharing scenarios in order to obtain a lower bound of the inefficiency of cost-sharing schemes, if there isany.
Table 8. Share of Households Using an ITN in Total Population
Share of Net Users in Total Population After 5 Years of Distribution
ITN Price (Ksh)
Subsidy per ITN Sold
(Ksh)
Share of Prenatal
Clients Who get an ITN(Table 3, Col. 2)
% of ITN owners that are
using it (Table 4, Col. 4)
Effective Coverage
Among Prenatal Clients‡
Subsidy Cost per User
Household (Ksh)
44
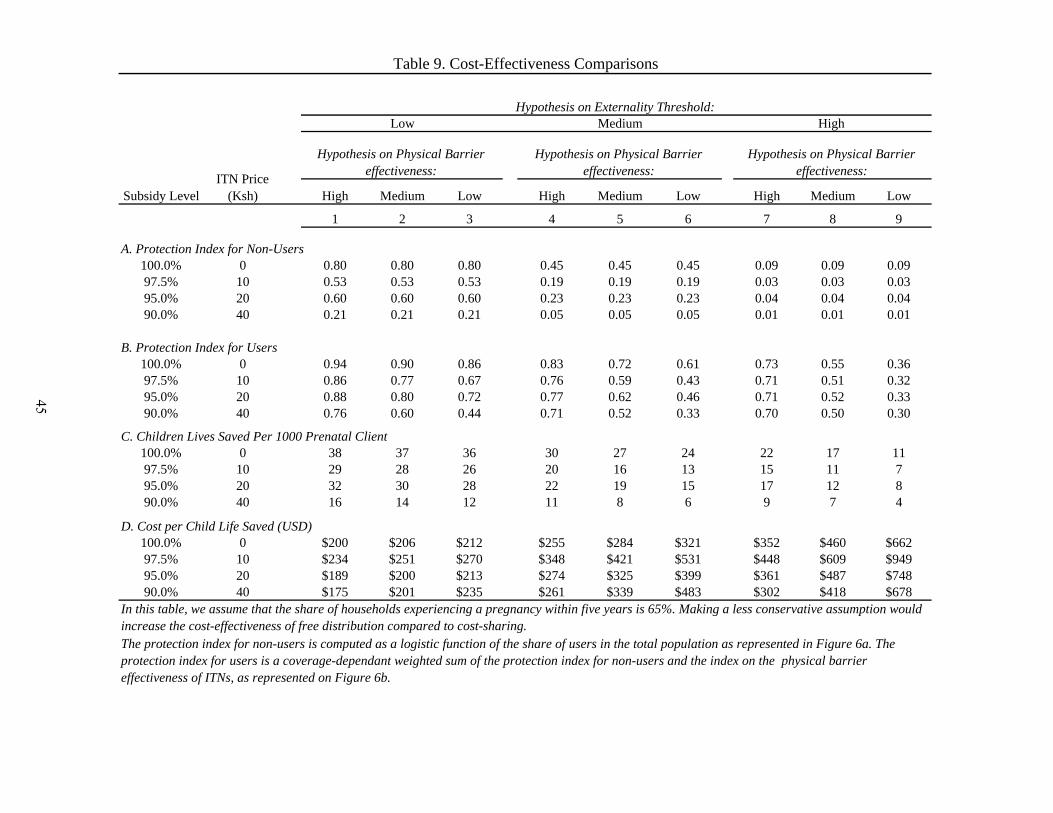
High Medium Low High Medium Low High Medium Low
1 2 3 4 5 6 7 8 9
A. Protection Index for Non-Users100.0% 0 0.80 0.80 0.80 0.45 0.45 0.45 0.09 0.09 0.0997.5% 10 0.53 0.53 0.53 0.19 0.19 0.19 0.03 0.03 0.0395.0% 20 0.60 0.60 0.60 0.23 0.23 0.23 0.04 0.04 0.0490.0% 40 0.21 0.21 0.21 0.05 0.05 0.05 0.01 0.01 0.01
B. Protection Index for Users100.0% 0 0.94 0.90 0.86 0.83 0.72 0.61 0.73 0.55 0.3697.5% 10 0.86 0.77 0.67 0.76 0.59 0.43 0.71 0.51 0.3295.0% 20 0.88 0.80 0.72 0.77 0.62 0.46 0.71 0.52 0.3390.0% 40 0.76 0.60 0.44 0.71 0.52 0.33 0.70 0.50 0.30
C. Children Lives Saved Per 1000 Prenatal Client100.0% 0 38 37 36 30 27 24 22 17 1197.5% 10 29 28 26 20 16 13 15 11 795.0% 20 32 30 28 22 19 15 17 12 890.0% 40 16 14 12 11 8 6 9 7 4
D. Cost per Child Life Saved (USD)100.0% 0 $200 $206 $212 $255 $284 $321 $352 $460 $66297.5% 10 $234 $251 $270 $348 $421 $531 $448 $609 $94995.0% 20 $189 $200 $213 $274 $325 $399 $361 $487 $74890.0% 40 $175 $201 $235 $261 $339 $483 $302 $418 $678
Table 9. Cost-Effectiveness Comparisons
Hypothesis on Physical Barrier effectiveness:
Hypothesis on Physical Barrier effectiveness:
Low Medium
Hypothesis on Physical Barrier effectiveness:
High
In this table, we assume that the share of households experiencing a pregnancy within five years is 65%. Making a less conservative assumption would increase the cost-effectiveness of free distribution compared to cost-sharing. The protection index for non-users is computed as a logistic function of the share of users in the total population as represented in Figure 6a. The protection index for users is a coverage-dependant weighted sum of the protection index for non-users and the index on the physical barrier effectiveness of ITNs, as represented on Figure 6b.
ITN Price (Ksh)
Hypothesis on Externality Threshold:
Subsidy Level
45
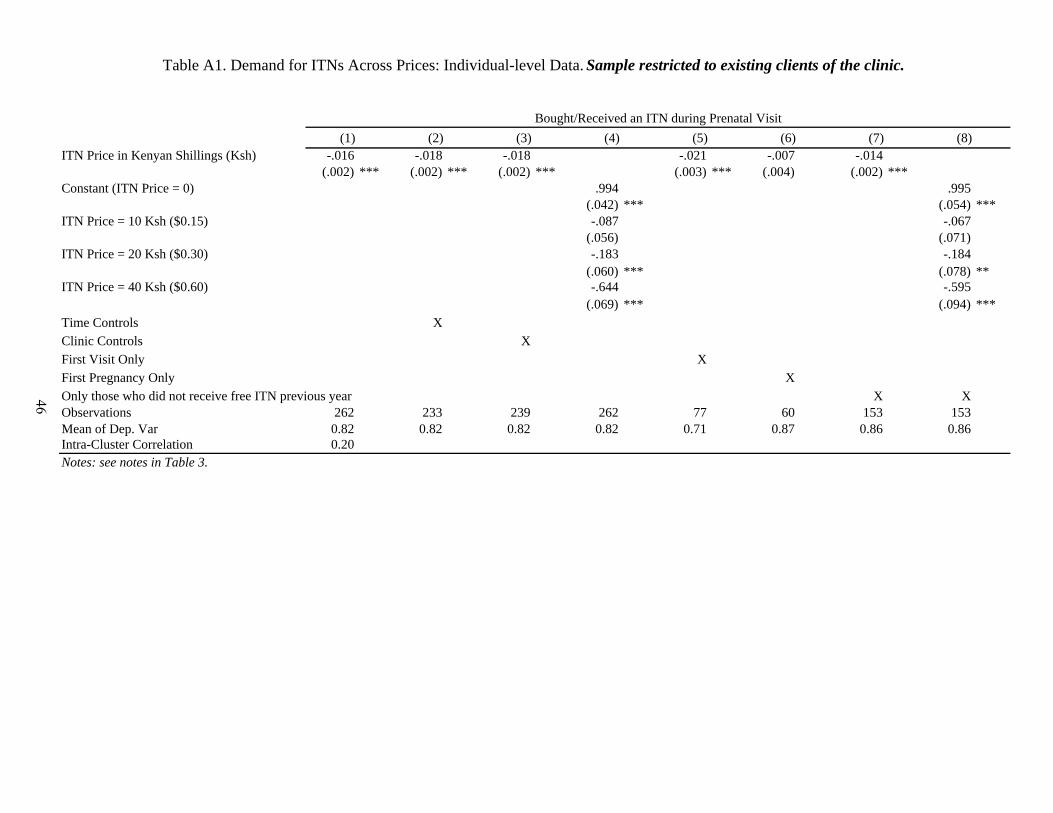
(1) (2) (3) (4) (5) (6) (7) (8)ITN Price in Kenyan Shillings (Ksh) -.016 -.018 -.018 -.021 -.007 -.014
(.002) *** (.002) *** (.002) *** (.003) *** (.004) (.002) ***Constant (ITN Price = 0) .994 .995
(.042) *** (.054) ***ITN Price = 10 Ksh ($0.15) -.087 -.067
(.056) (.071)ITN Price = 20 Ksh ($0.30) -.183 -.184
(.060) *** (.078) **ITN Price = 40 Ksh ($0.60) -.644 -.595
(.069) *** (.094) ***Time Controls XClinic Controls XFirst Visit Only XFirst Pregnancy Only XOnly those who did not receive free ITN previous year X XObservations 262 233 239 262 77 60 153 153Mean of Dep. Var 0.82 0.82 0.82 0.82 0.71 0.87 0.86 0.86Intra-Cluster Correlation 0.20Notes: see notes in Table 3.
Table A1. Demand for ITNs Across Prices: Individual-level Data. Sample restricted to existing clients of the clinic.
Bought/Received an ITN during Prenatal Visit
46
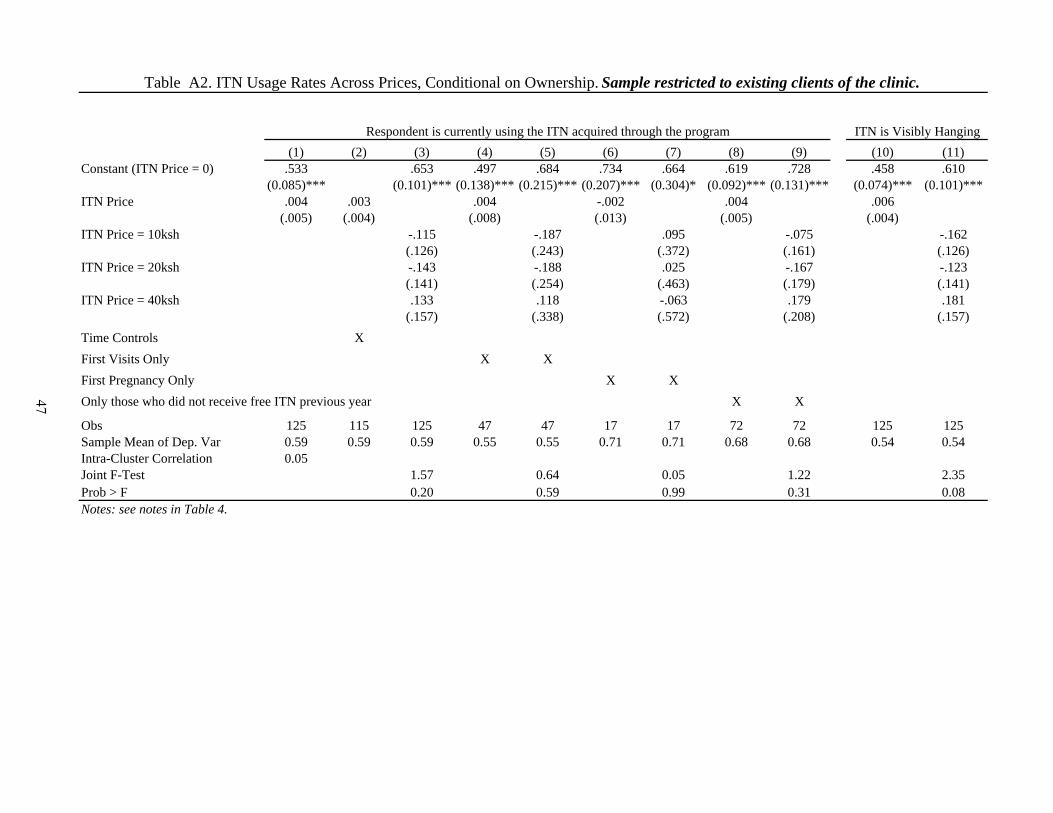
(1) (2) (3) (4) (5) (6) (7) (8) (9) (10) (11)Constant (ITN Price = 0) .533 .653 .497 .684 .734 .664 .619 .728 .458 .610
(0.085)*** (0.101)*** (0.138)*** (0.215)*** (0.207)*** (0.304)* (0.092)*** (0.131)*** (0.074)*** (0.101)***ITN Price .004 .003 .004 -.002 .004 .006
(.005) (.004) (.008) (.013) (.005) (.004)ITN Price = 10ksh -.115 -.187 .095 -.075 -.162
(.126) (.243) (.372) (.161) (.126)ITN Price = 20ksh -.143 -.188 .025 -.167 -.123
(.141) (.254) (.463) (.179) (.141)ITN Price = 40ksh .133 .118 -.063 .179 .181
(.157) (.338) (.572) (.208) (.157)Time Controls XFirst Visits Only X XFirst Pregnancy Only X XOnly those who did not receive free ITN previous year X X
Obs 125 115 125 47 47 17 17 72 72 125 125Sample Mean of Dep. Var 0.59 0.59 0.59 0.55 0.55 0.71 0.71 0.68 0.68 0.54 0.54Intra-Cluster Correlation 0.05Joint F-Test 1.57 0.64 0.05 1.22 2.35Prob > F 0.20 0.59 0.99 0.31 0.08
Table A2. ITN Usage Rates Across Prices, Conditional on Ownership. Sample restricted to existing clients of the clinic.
ITN is Visibly HangingRespondent is currently using the ITN acquired through the program
Notes: see notes in Table 4.
47
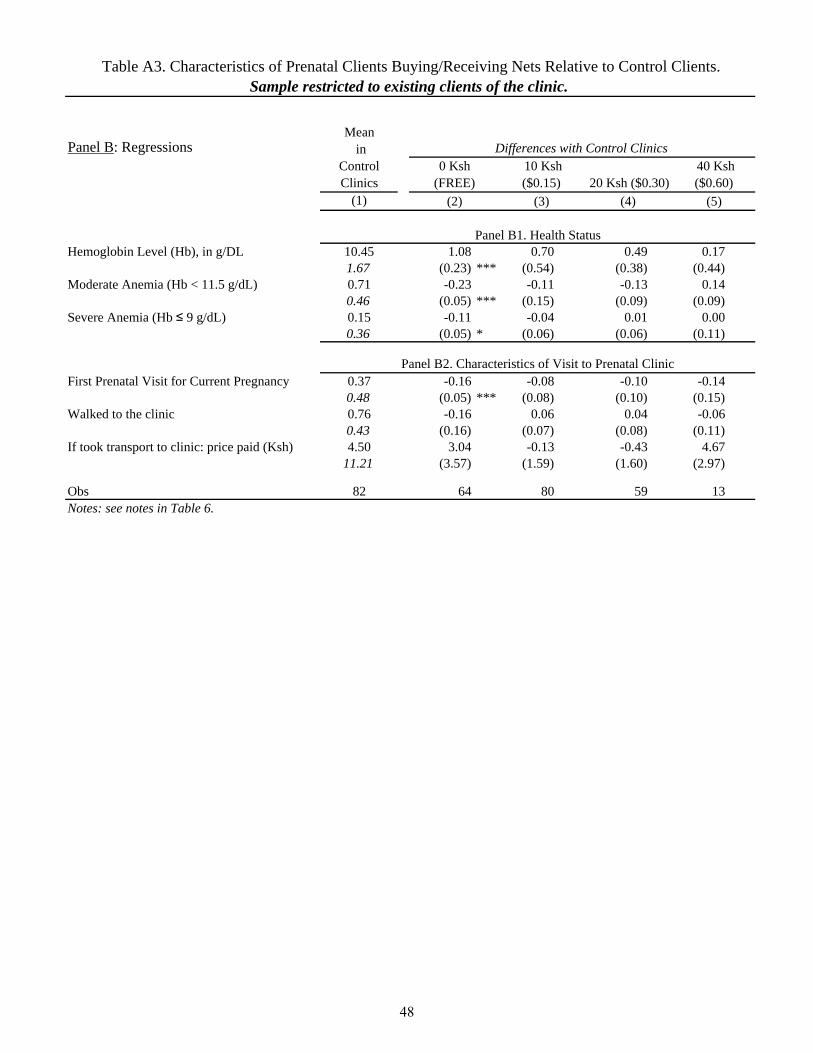
Panel B: Regressions
(1)
Hemoglobin Level (Hb), in g/DL 10.45 1.08 0.70 0.49 0.171.67 (0.23) *** (0.54) (0.38) (0.44)
Moderate Anemia (Hb < 11.5 g/dL) 0.71 -0.23 -0.11 -0.13 0.140.46 (0.05) *** (0.15) (0.09) (0.09)
Severe Anemia (Hb ≤ 9 g/dL) 0.15 -0.11 -0.04 0.01 0.000.36 (0.05) * (0.06) (0.06) (0.11)
First Prenatal Visit for Current Pregnancy 0.37 -0.16 -0.08 -0.10 -0.140.48 (0.05) *** (0.08) (0.10) (0.15)
Walked to the clinic 0.76 -0.16 0.06 0.04 -0.060.43 (0.16) (0.07) (0.08) (0.11)
If took transport to clinic: price paid (Ksh) 4.50 3.04 -0.13 -0.43 4.6711.21 (3.57) (1.59) (1.60) (2.97)
Obs 82 64 80 59 13
Panel B1. Health Status
Table A3. Characteristics of Prenatal Clients Buying/Receiving Nets Relative to Control Clients.Sample restricted to existing clients of the clinic.
10 Ksh ($0.15) 20 Ksh ($0.30)
40 Ksh ($0.60)
Differences with Control Clinics
Notes: see notes in Table 6.
Panel B2. Characteristics of Visit to Prenatal Clinic
(2) (3) (4) (5)
Mean in
Control Clinics
0 Ksh (FREE)
48