Embed Size (px)
Citation preview
NBER WORKING PAPER SERIES
THE EFFECT OF EVALUATION ON PERFORMANCE:EVIDENCE FROM LONGITUDINAL STUDENT ACHIEVEMENT DATA OF MID-CAREER TEACHERS
Eric S. TaylorJohn H. Tyler
Working Paper 16877http://www.nber.org/papers/w16877
NATIONAL BUREAU OF ECONOMIC RESEARCH1050 Massachusetts Avenue
Cambridge, MA 02138March 2011
Authors are listed alphabetically. The authors would like to thank Susan Moore Johnson, Eric Bettinger,Susanna Loeb, and seminar participants at Wellesley College, Stanford University, and the NBEREducation Program meeting for helpful comments on previous drafts of this paper. The research reportedhere was supported in part by the Institute of Education Sciences, U.S. Department of Education, throughGrant R305C090023 to the President and Fellows of Harvard College. The opinions expressed arethose of the authors and do not represent views of the Institute, the U.S. Department of Education,or the National Bureau of Economic Research. We also gratefully acknowledge the Center for EducationPolicy Research at Harvard University, the Joyce Foundation for their generous support of this project,as well as the cooperation and support of the Cincinnati Public Schools.
NBER working papers are circulated for discussion and comment purposes. They have not been peer-reviewed or been subject to the review by the NBER Board of Directors that accompanies officialNBER publications.
© 2011 by Eric S. Taylor and John H. Tyler. All rights reserved. Short sections of text, not to exceedtwo paragraphs, may be quoted without explicit permission provided that full credit, including © notice,is given to the source.

The Effect of Evaluation on Performance: Evidence from Longitudinal Student AchievementData of Mid-career TeachersEric S. Taylor and John H. TylerNBER Working Paper No. 16877March 2011JEL No. I21,J24,M59
ABSTRACT
The effect of evaluation on employee performance is traditionally studied in the context of the principal-agentproblem. Evaluation can, however, also be characterized as an investment in the evaluated employee’shuman capital. We study a sample of mid-career public school teachers where we can consider thesetwo types of evaluation effect separately. Employee evaluation is a particularly salient topic in publicschools where teacher effectiveness varies substantially and where teacher evaluation itself is increasinglya focus of public policy proposals. We find evidence that a quality classroom-observation-based evaluationand performance measures can improve mid-career teacher performance both during the period ofevaluation, consistent with the traditional predictions; and in subsequent years, consistent with humancapital investment. However the estimated improvements during evaluation are less precise. Additionally,the effects sizes represent a substantial gain in welfare given the program’s costs.
Eric S. TaylorStanford [email protected]
John H. TylerBox 193821 Manning WalkBrown UniversityProvidence, RI 02912and [email protected]

1
Introduction
Employers evaluate employees partly to encourage better job performance. Evaluation-
induced improvements may, however, be transient if the incentives only operate on behavior that
contributes to an evaluation score. By contrast, the effects may be more likely to persist if the
evaluation spurs employees’ investment in human capital. While distinct, these mechanisms are
not mutually-exclusive which complicates any investigation of the effect of evaluation on
performance.
Economics has built a substantial body of research, both theoretical and empirical, on
performance evaluation and employee responses (see Prendergast 1999 and Gibbons 2005 for
reviews). The literature, however, focuses on the predictions of principal-agent, contract-
incentive models of the proximate effects. There is much less evidence on how information from
an evaluation contributes to investments in human capital. In this paper we study a sample of
mid-career public school teachers where we can measure performance in periods before, during,
and after evaluation.
Thoughtful consideration of performance evaluation is particularly timely for American
public school teachers and their employers. In recent years evaluating teacher effectiveness has
become a dominant theme in American education reform efforts, an emphasis motivated in no
small part by the apparently large variation in teacher productivity as measured by ability to
promote student achievement growth. Estimates of the standard deviation in teacher
effectiveness range between 0.10 and 0.25 student-level standard deviations in math with
somewhat smaller differences reported for English language arts (see Hanushek and Rivkin 2010
for a review).1 Coupling the large variation in teacher effectiveness with research documenting
1 Pioneering work in this area was done by Hanushek (1971) and Murnane and Phillips (1981). More recent examples include Aaronson, Barrow, and Sander (2003), Rockoff (2004), Rivkin, Hanushek, and Kain (2005), and
2
the long-run labor market effects of achievement differences (Chetty et al. 2010, Hanushek
2010), the recent emphasis on teacher evaluation should come as no surprise.
Advocates believe robust teacher evaluation could improve average teacher performance,
citing both the incentives of evaluation per se and the potential contribution to teachers’ human
capital development. To date, however, there is little empirical evidence to support either of
these propositions.2 In any case, existing evaluation programs, widely viewed as mostly
perfunctory, do not appear up to the task (Johnson 1990, Donaldson 2009, Weisburg et al. 2009).
In this paper we address two questions: First, does evaluation improve teacher
performance, as measured by student achievement gains, during the evaluation period? Second,
does past evaluation improve teacher performance in periods after the teacher is no longer being
evaluated?
We use data from the Cincinnati Public Schools, who’s long-running Teacher Evaluation
System (TES) is considered much more well-developed than most existing teacher evaluation
programs (Fairman et al. 2009, Johnson 2010). TES evaluates teachers’ professional practice
through multiple, detailed classroom observations and a review of work products (but not student
test scores). We compare within teacher differences in performance over time for a sample where
the timing of evaluation is plausibly exogenous.
We focus on classroom observation based evaluation for two reasons. First, much has
been written about the potential use of test-score based measures in teacher evaluation,
particularly in selective retention policies (Gordon, Kane, and Staiger 2006, Glazerman et al.
Kane, Rockoff, and Staiger (2006). And while estimates across researchers and settings are relatively consistent, there remain questions about the empirical identification (Rothstein 2010, Kodel and Betts 2009, Kane and Staiger 2008, Todd and Wolpin 2003). 2 One exception is Golhaber and Anthony (2007) who study the National Board for Professional Teaching Standards teacher certification process; as a side note the authors find that, if anything, teachers applying for NBPTS certification perform less well during the school year that they are applying for certification. A second is Rockoff et al. 2010, which studies how principals use new information on teacher performance to update their appraisals and make human resource decisions.

3
2010, Staiger and Rockoff 2010, Golhaber and Hansen 2010). Classroom observation measures
have received little attention by comparison,3 though the two approaches are increasingly
partnered in policy proposals. Second, the inherent focus on observable practice increases the
chances that classroom observation based evaluation will lead to persistent changes in
performance through improved skill. Test-score measures provide little, if any, prescription for
changes in performance.
We find that high-quality, classroom-observation-based evaluation improves mid-career
teacher performance both during the period of evaluation and in subsequent years, though the
estimated improvements during evaluation are not always robust. Specifically, students assigned
to a teacher after she participates in TES score about 10 percent of a standard deviation higher in
math than similar students taught by the same teacher prior to TES participation. Effects of this
size represent a potentially substantial gain in welfare given the program’s costs.
Teacher Performance Evaluation in Cincinnati
The data for our analysis come from the Cincinnati Public Schools. In the 2000-2001
school year Cincinnati launched the Teacher Evaluation System (TES), a practice-based
evaluation system that gathers data from both classroom observations and from work products
such as teacher lesson plans, evidence of professional development activities, and family contact
logs. During the year-long TES evaluation process, teachers are typically observed and scored
four times: three times by an assigned peer evaluator—high-performing, experienced teachers
who are external to the school—and once by the principal or other school administrator. Both
peer evaluators and administrators complete an intensive TES evaluator training course, and
must accurately score videotaped teaching examples to check inter-rater reliability. Teachers are 3 A notable exception is the large scale Bill & Melinda Gates Foundation study currently in progress (2010).
4
informed of the week during which the first observation will occur, with all other observations
being unannounced.
Teachers are evaluated on dozens of specific skills and practices covering classroom
management, instruction, content knowledge, and planning, among other topics. Evaluators use a
scoring rubric, based on Charlotte Danielson’s Enhancing Professional Practice: A Framework
for Teaching (1996), which describes performance of each skill and practice at four levels:
“Distinguished”, “Proficient”, “Basic”, and “Unsatisfactory.” For example, standard 3.4.B
addresses the use of questions in instructional settings:
Distinguished: “Teacher routinely asks thought-provoking questions at the evaluative, synthesis, and/or analysis levels that focus on the objectives of the lesson. Teacher seeks clarification and elaboration through additional questions. Teacher provides appropriate wait time.”
Proficient: “Teacher asks thought-provoking questions at the evaluative, synthesis, and/or analysis levels that focus on the objectives of the lesson. Teacher seeks clarification through additional questions. Teacher provides appropriate wait time.”
Basic: “Teacher asks questions that are relevant to the objectives of the lesson. Teacher asks follow-up questions. Teacher is inconsistent in providing appropriate wait time.”
Unsatisfactory: “Teacher frequently asks questions that are inappropriate to objectives of the lesson. Teacher frequently does not ask follow-up questions. Teacher answers own questions. Teacher frequently does not provide appropriate wait time.” 4
Peer evaluators and administrators provide written feedback to the teacher within ten
days of each classroom observation, and meet with the teacher personally soon after their first
classroom observation. Owing to union-negotiated guidelines, the evaluator is instructed to not
offer suggestions for improvement outside the official rubric language in the feedback and
during the conference. Thus an evaluator may point out the stated characteristics of higher-level
4 The complete TES rubric is available on the Cincinnati Public Schools website: http://www.cps-k12.org/employment/tchreval/stndsrubrics.pdf.
5
performance in a given area and reference details of the observation, but should not give an
example from, for example, a different teachers’ evaluation.
At the end of the year a final summative score in each of four domains of practice is
calculated and presented to the evaluated teacher.5 For beginning teachers (those evaluated in
their first and their fourth years) the consequences of a poor evaluation could be non-renewal of
their contract, and a successful evaluation is required before receiving tenure. For tenured
teachers, the consequences of the evaluation include determining eligibility for promotions or
additional tenure protection, or, if the evaluation was poor, placement in the peer assistance
program with only a small risk of termination.
Teachers only undergo TES evaluation periodically; typically the first year as a new hire,
the fourth year after being hired, and every five years after that point. However, teachers hired
before the TES program began in 2000-01 were “phased in” to the program. That is, the first
year these veteran teachers received a TES evaluation was in the middle of their career and
determined by a pre-agreed schedule. These mid-career teachers are the focus of our analysis: we
observe their performance before, during, and after the TES evaluation process; and the timing of
their evaluation is plausibly exogenous. We return to these characteristics in the discussion of
our empirical strategy.
Data provided by the Cincinnati Public Schools identify the year(s) in which a teacher
was evaluated by TES, the dates when each observation occurred, and the scores. We combine
these TES data with additional administrative Cincinnati data that allow us to match teachers to
students and student test scores.
Theoretical Framework 5 For more details on the scoring process see Kane et al. (forthcoming).
6
Personnel Economics and the Proximate Effects of Evaluation
A broad literature, largely situated in personnel economics, explores the role of
evaluation and performance measurement in employer-employee relationships. The authors of
this literature have developed nuanced models to address varied principal-agent conditions (for
reviews see Prendergast 1999, Gibbons 2005, and Lazear and Oyer forthcoming). However, as
Dixit (2002) has discussed, the underlying assumptions often do not hold in public sector labor
markets, including teaching (see also the discussion in Neal 2011).6 Nevertheless, the general
intuition behind many of these models can still be instructive in public sector settings such as
education.
The extent to which evaluation affects performance, the models from personnel
economics generally suggest, is a function of two key dimensions: (i) how performance is
measured or evaluated, and (ii) what action is taken with the resulting information. Our
discussion here will address these two dimensions with regard to the TES program, and teacher
evaluation more generally, including how these dimensions shape predictions for our empirical
analysis.
With regard to the first dimension, Holstrom (1979), Holmstrom and Milgrom (1991),
Baker (1992), and others discuss how employee behavior is affected when performance
measures are imperfect or incomplete. In such circumstances, employees may take actions that
improve their performance score at the expense of actual performance or performance in other
important areas.
6 Status quo teacher employment arrangements are consistent with Dixit’s (2002) analysis. The prevailing teacher compensation contracts are based on seniority and highest degree earned; far from efficient mechanisms for motivating performance (Ballou and Podgursky 2002). Some school systems have or are experimenting with alternative compensation schemes but with noted difficulty (Neal 2011). Additionally, teacher evaluation falls short of traditional employee monitoring models (Shapiro and Stiglitz 1984); most importantly, few teachers are terminated as a result of annual reviews (Weisberg et al. 2009).
7
Classroom-observation-based evaluations, including Cincinnati’s TES, are at best
incomplete measures of teaching that produces gains in student achievement and attainment.
Additionally, unlike many other teacher evaluation programs, Cincinnati’s teachers are only
subject to TES evaluation every few years. If, as theory predicts, teachers prioritize actions that
improve their evaluation score, these characteristics of TES suggest two predictions. First, during
an evaluation, teachers will prioritize behaviors that increase their TES score. Thus TES
evaluation will only affect student achievement outcomes to the extent the TES rubric criteria
produce higher achievement.7 Empirical evidence suggests teachers who score higher on the TES
rubric do produce greater student achievement gains (Kane et al. forthcoming, Milanowski
2004a, 2004b, Holtzapple 2003).
A second prediction, which we test in this paper, is that TES evaluation will only affect
teacher behavior, and thus student achievement, during the TES evaluation year. That is,
performance may improve while a teacher is being evaluated, but fall again once the evaluation
period ends. The periodic structure of TES evaluation (e.g., one year on TES followed by four
years off) creates the opportunity to test this prediction empirically.8 This periodic structure is
not, however, common in status quo teacher evaluation.9 In the following section on human
capital models, we explore reasons why performance in non-TES years may nevertheless be
affected.
7 In this paper we only analyze data from TES program, thus we cannot explore the role of variation in different measures’ relationship to the output of interest. 8 This periodic structure may result in even larger effects on performance during the TES year, compared to a program in which teachers were evaluated annually. A teacher’s TES score will have some influence over her career for five years. Thus, she might rationally choose to “borrow” effort from future years; increasing her performance above her steady state during the TES year at the expense of falling below that steady state in future years. 9 For example, the District of Columbia Public Schools recently instituted a similar classroom-observation program with an extensive rubric and trained peer evaluators (District of Columbia Public Schools 2010), but in DC teachers are evaluated every school year.

8
We now turn to the second underlying dimension. Here the key prediction is that
employee performance will respond to evaluation to the extent that the information created by
the evaluation affects, positively or negatively, the employee’s own welfare (Lazear and Oyer
forthcoming). While we do not observe variation in TES’s (expected) effect on individual
welfare, a sense of the general stakes is important to forming an expectation about the average
effects on performance which we can measure.
These relationships are traditionally studied with relatively straightforward incentive
mechanisms, especially performance measures tied to monetary compensation or the threat of
termination (Prendergast 1999, Gibbons 2005). However, first, pay-for-performance incentives
are rare in teacher contracts (Neal 2011), and Cincinnati is no exception. Second, while many
teacher contracts nominally threaten termination the empirical risk is small (Weisberg et al.
2009); again TES is not an exception (TNTP 2009).10
While not tied to compensation, there are potential consequences, positive and negative,
attached to teachers’ TES evaluations that might well affect their welfare and thus their desire to
perform well during the evaluation. First, low scoring teachers—those rated as “Basic (2)” or
“Unsatisfactory (1)” in any one of four domains (see previous section for a description) –are
placed on “intervention” status. Teachers on intervention must undergo a year-long process of
intensive assistance from a mentor, another full TES evaluation with more frequent classroom
observations (i.e., six formal plus two informal versus the regular four formal), along with other
miscellaneous meetings and writing assignment. These actions are designed to help the teacher
improve, but do place extra burden and scrutiny on teachers whose TES scores are low.
10 The risk of termination is often severely curtailed by other dimensions of the employment contract. However, there is some evidence teacher performance would respond to potential termination. When Chicago school principals were given greater flexibility to fire teachers, teacher effort, as measured by the number of absences, increased (Jacob 2010).
9
Additionally, a teacher on intervention who does not show sufficient improvement can be
dismissed.11
Second, and on the positive side, teachers who achieve particularly high TES scores—
values higher than those required for basic tenure—can apply for “lead teacher status.”12 Lead
teacher status in Cincinnati is a coveted title. It opens up additional job opportunities such as
department chair, curriculum specialist, or TES evaluator; these roles are associated with
professional advancement and bring extra compensation. Other lead teachers remain in strictly
classroom teacher roles, but again the status confers a sense of extra job security and comes with
an extra $6,000 to $6,500 annual salary supplement.
In addition to the direct uses of TES scores just discussed, teachers’ TES evaluations
could impact their welfare in broader ways by affecting their reputation. Fama (1980) and
Holmstrom (1999) study situations in which current performance evaluations affect an
employee’s future labor market outcomes by contributing to her reputation. In these “career
concerns” models employees may rationally choose to improve their performance during an
evaluation, even if the formal consequences of that evaluation in the current job are weak.
“Career concerns” motivations may be particularly salient for teachers (Dixit 2002), even
though monetary compensation generally does not vary from school to school within a market.
In particular, evaluation may implicitly affect decisions that do differentiate teachers’ net utility:
which students a teacher is assigned, whether a transfer request is granted, or selection for
informal leadership promotions. There is empirical evidence that both teachers’ and principals’
11 New teachers must score “Proficient (3)” or higher in all four domains before they are granted tenure; however, our study analyses a sample of tenured teachers. These and other details about the TES program in this paper are drawn from the authors’ interactions with the TES staff and from the programs’ handbooks which were coauthored by the Cincinnati Public Schools and the Cincinnati Federation of Teachers. 12 Lead teachers must have scored “Distinguished (4)” in the Teaching for Learning domain—the core pedagogical and content knowledge measures, also score “Distinguished” in one other domain, and not score lower than “Proficient (3)” in any domain.

10
decisions in school to school transfers are influenced by teacher effectiveness (Boyd et al.
forthcoming). However, direct evidence on how classroom observation data impacts these beliefs
and decisions appears to be lacking.13 Our sample is, however, entirely mid-career teachers, and
career concerns models suggest that such performance measure effects will be stronger for newer
and less experienced employees.14
Human Capital Growth through Evaluation
In contrast to the proximate effects discussed thus far, evaluation may contribute to
lasting improvements in performance if the information generated facilitates a new investment in
employee skill development. In other words, under the right conditions employee evaluation
could function as a particular form of on-the-job training—an investment in employee human
capital (Becker 1993). This mechanism for evaluation affecting performance has been much less
studied.
Evaluation provides information, with more or less clarity, on an individual employee’s
performance relative to some normative or positive criteria. This new information reduces one
important cost in the human capital investment calculus; namely, where to invest and, in some
evaluation systems, how to improve. All else equal, a reduction in this cost should lead to greater
investment in skill development. Thus, we would predict an increase in performance in years
following evaluation relative to years preceding evaluation. In many empirical settings the
frequency of evaluation (e.g., annually or quarterly) leaves little room to test this prediction; our
data from Cincinnati’s TES program are an exception.
13 Rockoff et al. (2010) did find that principals’ updated their beliefs about individual teachers when they received new student-test-score-based information on teacher performance. 14 See Gibbons and Murphy (1992) and Chevalier and Ellison (1999).
11
To improve performance, however, a first order condition is that the changes inferred by
the evaluation information must actually positively affect performance, and not harm
performance or simply rearrange the deck chairs. While rational employers should believe their
evaluative criteria predict productivity, there is often little empirical evidence, especially in
teaching. A lack of evidence is the norm for classroom-observation-based evaluation programs,
though the TES measures are an exception having been shown to predict student achievement
growth (Kane et al. forthcoming, Milanowski 2004a, 2004b, Holtzapple 2003).
But even good information can be poorly communicated or disregarded. Literature on
teachers suggests a few characteristics that should improve the probability of take up. First,
feedback should be intentionally prescriptive and should identify how change might proceed
(Milanowski and Hememan 2001, Kimball 2002, Milanowski 2004). Second, the criteria against
which individuals are being judged should be well-defined and should clearly differentiate levels
of practice. Milanowski (2001) suggests that when done well the descriptive language of an
evaluation rubric alone can provide useful information, even to those who have not been
formally evaluated. Unfortunately, the criteria in teacher evaluations are often constructed to
minimize differentiation (Donaldson 2009). Third, feedback may be most effective when it
comes from multiple sources, particularly from the employee’s peers (Seifert, Yukl and
McDonald 2003). Multi-source evaluations, often called “360 degree feedback” have become
popular in many sectors, though the evidence on their relative effectiveness is mixed.15
Measured against these dimensions, Cincinnati’s TES program is relatively well designed
to foster teacher performance-improving skill development, at least when compared to other
teacher evaluation programs. If Cincinnati’s teachers do respond to TES by working to improve
15 In their meta-analysis Kluger and DNisi (1996) found only small improvements, and negative effects one-third of the time. Luthans and Peterson (2003) and Smither et al. (2003) find more positive effects, but the treatments also included coaching and workshops.

12
their skill level, then we should see improved performance in years after participation in TES
even if the teacher is not actively being evaluated. Performance might also improve during the
TES evaluation year if the changes inferred by feedback are easy to adopt quickly.
Empirical Strategy
Our objective is to estimate the extent to which a teacher’s participation in TES improves
her performance or effectiveness in promoting student achievement growth. Using annual district
administrative data on students, teachers, and classes in the 2003-04 through 2009-10 school
years we estimate the following specification:
(1)
where is the math achievement of student i taught by teacher j in school year t, as measured
by the end-of-year state test.16 Throughout the paper test scores have been standardized (mean
zero, standard deviation one) within test administration (grade-level, school-year) using the
district distribution. The variable is equal to one if teacher j participated in TES
during school year t and zero otherwise (i.e., T=t where T represents the year teacher j
participated in TES). Similarly is equal to one if teacher j participated in some past
school year (i.e., t>T). The coefficients of interest capture differences in the achievement of
students taught during, , or after, , teacher participation in TES compared to students taught
before participation (the implicit left-out category, i.e., t<T).
16 Between 2002-03 and 2009-10 Cincinnati students, in general, took end of year exams in reading and math in third through eighth grades. Over the course of 2003-04 to 2005-06 the state switched tests from the State Proficiency Test (SPT) and its companion the Off Grade Proficiency Test (OGPT) to the Ohio Achievement Test (OAT). In all cases we standardize (mean zero, standard deviation one) test scores by grade and year. In tested grades and years we have math test scores for 93 percent of students (ranging from 83 percent to 97 percent in any particular grade and year) and reading scores for 94 percent of students (ranging from 83 percent to 98 percent in any particular grade and year). Our empirical strategy requires both an outcome test (e.g., end of year test in school year t) and a baseline test (e.g., end of year test in school year t-1). Thus, our analysis sample will exclude some entire grade-by-year cohorts for whom the state of Ohio did not administer a test in school year t or t-1.
13
Our specification also includes a teacher fixed effect, represented in equation 1 by . We
prefer the resulting within-teacher estimates of and for two primary reasons. First, existing
evidence suggests that both inexperienced and experienced teachers vary greatly in their ability
to promote student achievement (see reviews in Hanushek and Rivkin 2010, Gordon, Kane and
Staiger 2006). To the extent high (low) ability teachers are more likely to participate in TES
(e.g., through differential attrition from the district, or volunteering for the program) simple
cross-sectional estimates would be biased. Second, the teacher fixed effect will account for time-
invariant, non-random differences in the assignment of students to specific teachers. Some
teachers may year after year be asked to teach classes with high (low) potential for achievement
gains (e.g., through principal favoritism, or school assignment).
However, not all the dynamics of student-teacher assignment need be time-invariant. To
account for variation in students assigned to a given teacher from year to year, we include a
vector of observable student characteristics, . Most notably, captures the student’s prior
achievement including the main effect of the prior year math test score, the score interacted with
each grade-level, and fixed effects for each test (i.e., grade-by-year fixed effects). When the
baseline score was missing for a student, we imputed with the grade-by-year mean, and included
an indicator for missing baseline score.17 Additionally, includes separate indicators for
student gender, racial/ethnic subgroup, special education classification, gifted classification,
English proficiency classification, and whether the student was retained in grade.
And while teacher effectiveness varies across careers, there is evidence of returns to
experience on average especially early in the career (Gordon, Kane and Staiger 2006).
Accordingly we include controls for the teacher’s years of experience and years of experience
17 Our estimates are robust to excluding students with missing baseline test scores.
14
squared, represented by . Our estimates are robust to, alternatively, specifying
with a series of indicator variables for categorized experience-levels. Lastly we include a vector
of grade-level by school-year fixed effects, , to account for secular trends in student test scores
within each grade level which would be confounded with our before, during, and after strategy.
We estimate equation 1 using the sample of teachers (and their students) who were hired
by Cincinnati Public Schools between 1993-94 and 1999-2000—before the implementation of
the TES program in 2000-01—but who were eventually required to participate in TES according
to a schedule which “phased-in” veteran teachers. The phase-in schedule, determined during the
TES program’s planning stages and detailed in table 1, delayed the participation of teachers
already working in the district as of the 1999-2000 school year. The delay allows us to observe
student achievement for this sample of teachers’ classes before they participated in TES; as
implied above, these before years serve as our counterfactual.
The pattern of scheduled participation years for our sample creates relatively exogenous
variation in the timing of teachers’ TES participation. Thus, for example, a teacher hired in 1998-
99 would participate in 2007-08 which for the average teacher would be their tenth year
teaching; while a teacher hired the prior year in 1997-98 would participate in 2005-06, their ninth
year (see table 1). This variation allows us to identify the returns to experience and overall
temporal trends, if any, separately from the year of TES participation. Had the TES program
designers decided to build the phase-in schedule based on experience level this separation would
likely not have been possible. While we can and do control for teacher experience, the existing
literature suggests the marginal returns to experience are relatively small beyond year five (see
for example Rockoff 2004), and as reported later our estimates are not substantively changed by
the exclusion of experience controls.
15
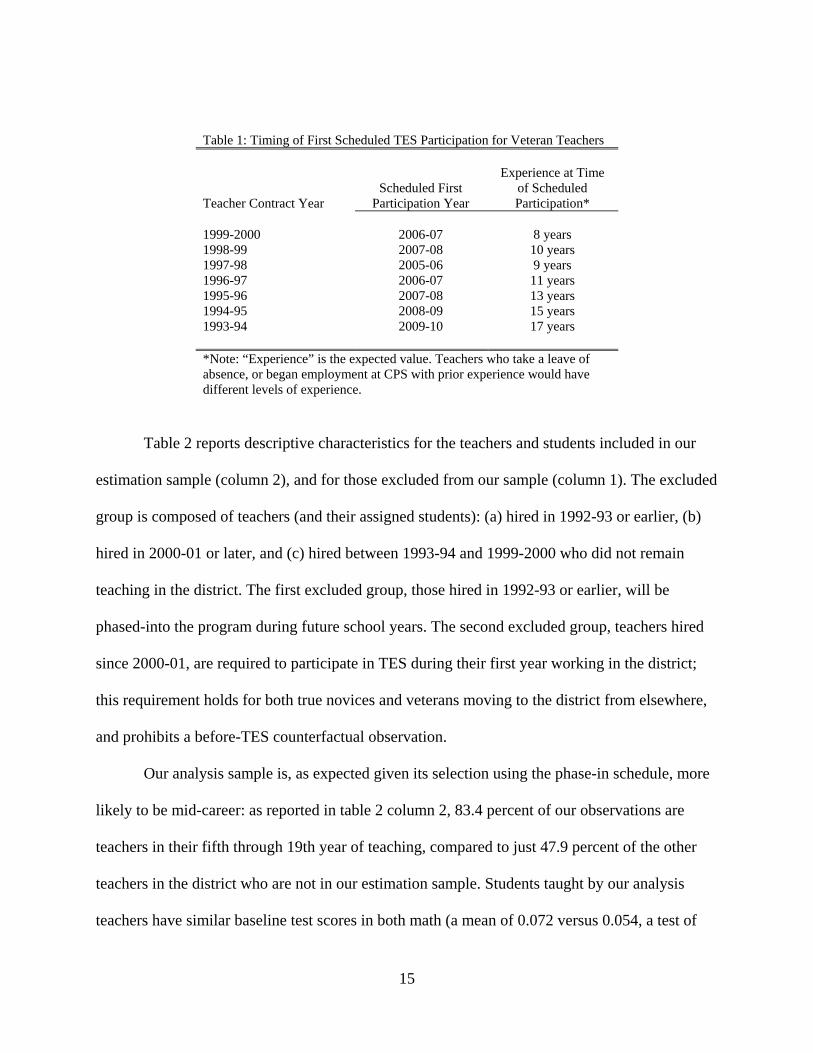
Table 1: Timing of First Scheduled TES Participation for Veteran Teachers
Teacher Contract Year
Scheduled First Participation Year
Experience at Time of Scheduled Participation*
1999-2000 2006-07 8 years 1998-99 2007-08 10 years 1997-98 2005-06 9 years 1996-97 2006-07 11 years 1995-96 2007-08 13 years 1994-95 2008-09 15 years 1993-94 2009-10 17 years *Note: “Experience” is the expected value. Teachers who take a leave of absence, or began employment at CPS with prior experience would have different levels of experience.
Table 2 reports descriptive characteristics for the teachers and students included in our
estimation sample (column 2), and for those excluded from our sample (column 1). The excluded
group is composed of teachers (and their assigned students): (a) hired in 1992-93 or earlier, (b)
hired in 2000-01 or later, and (c) hired between 1993-94 and 1999-2000 who did not remain
teaching in the district. The first excluded group, those hired in 1992-93 or earlier, will be
phased-into the program during future school years. The second excluded group, teachers hired
since 2000-01, are required to participate in TES during their first year working in the district;
this requirement holds for both true novices and veterans moving to the district from elsewhere,
and prohibits a before-TES counterfactual observation.
Our analysis sample is, as expected given its selection using the phase-in schedule, more
likely to be mid-career: as reported in table 2 column 2, 83.4 percent of our observations are
teachers in their fifth through 19th year of teaching, compared to just 47.9 percent of the other
teachers in the district who are not in our estimation sample. Students taught by our analysis
teachers have similar baseline test scores in both math (a mean of 0.072 versus 0.054, a test of

16
the difference yields a p-value of 0.06), and reading (a mean of 0.066 versus 0.072, a test of the
difference yields a p-value of 0.53). Additionally, analysis sample teachers were slightly more
likely to be teaching earlier grades, but had similar students in terms of demographic and
program participation characteristics.
Most but not all teachers hired between 1993-94 and 1999-2000 participated in TES
during their scheduled phase-in year reported in table 1. We extend our main estimates in two
ways to address two different potential motivations for of non-compliance. First, about 25
percent of teachers in our sample participated early; they volunteered to participate in TES
before their scheduled phase-in year. Many teachers who requested to participate early—
especially those who participate many years early—did so to fulfill the requirements for
obtaining “lead teacher status” (eligibility for certain valued positions with greater
compensation). Thus in many cases volunteering should be a signal of some latent characteristic
that may be positively correlated with teacher effectiveness. Accordingly, in one robustness
check, we estimate the coefficients of interest separately for volunteers and non-volunteers.
Table 2 provides descriptive statistics for our analysis sample (column 2) separated into
scheduled participants (column 3) and volunteer participants (column 4). On average, the
students of volunteer participants begin the school year with higher achievement—a difference
of 0.041 standard deviations in math (p=0.02) and 0.069 in reading (p<0.01). This difference
may be in partly influenced by slightly fewer special education and English language learner
students. Volunteers also are noticeably more likely to be teaching earlier grade levels.
Volunteers and scheduled participants, however, have similar experience profiles.
Second, about one in five of our sample participated one year early or one year late
relative to their scheduled phase-in year. These early participants still had to volunteer (and are
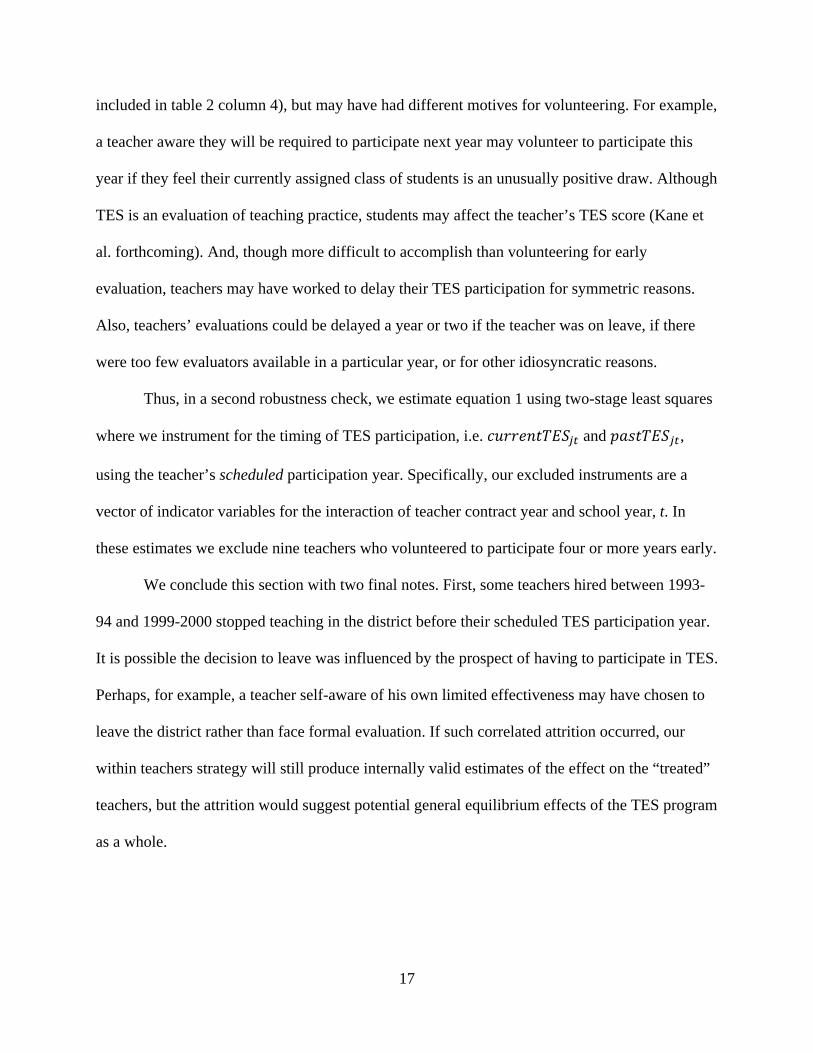
17
included in table 2 column 4), but may have had different motives for volunteering. For example,
a teacher aware they will be required to participate next year may volunteer to participate this
year if they feel their currently assigned class of students is an unusually positive draw. Although
TES is an evaluation of teaching practice, students may affect the teacher’s TES score (Kane et
al. forthcoming). And, though more difficult to accomplish than volunteering for early
evaluation, teachers may have worked to delay their TES participation for symmetric reasons.
Also, teachers’ evaluations could be delayed a year or two if the teacher was on leave, if there
were too few evaluators available in a particular year, or for other idiosyncratic reasons.
Thus, in a second robustness check, we estimate equation 1 using two-stage least squares
where we instrument for the timing of TES participation, i.e. and ,
using the teacher’s scheduled participation year. Specifically, our excluded instruments are a
vector of indicator variables for the interaction of teacher contract year and school year, t. In
these estimates we exclude nine teachers who volunteered to participate four or more years early.
We conclude this section with two final notes. First, some teachers hired between 1993-
94 and 1999-2000 stopped teaching in the district before their scheduled TES participation year.
It is possible the decision to leave was influenced by the prospect of having to participate in TES.
Perhaps, for example, a teacher self-aware of his own limited effectiveness may have chosen to
leave the district rather than face formal evaluation. If such correlated attrition occurred, our
within teachers strategy will still produce internally valid estimates of the effect on the “treated”
teachers, but the attrition would suggest potential general equilibrium effects of the TES program
as a whole.

18
Second, about 33 percent of our sample teachers do not appear in our sample after their
TES participation year.18 In this context attrition means no longer teaching math in grades 4-8 in
years with state math tests. Thus teachers may attrit without separating from the district, and
indeed at least 91 percent of attriters were still employed by the district after TES participation
but in roles outside our sample (e.g., teaching other grades or subjects, or working outside of
classrooms). If, however, this attrition is correlated (positively or negatively) with the effect of
TES participation on performance than our estimates will be biased. We discuss this issue further
in the next section and offer bounds for our estimates.
Results
We find that, on average, participation in the Teacher Evaluation System (TES), a high-
quality classroom observation based approach, improves mid-career teachers’ effectiveness in
promoting student achievement growth in math. Teacher performance improves both during the
school year the teacher is being evaluated and in the years after evaluation, though the estimated
improvements during evaluation are not always robust.
Table 3 columns 1 through 5 report the coefficients of interest estimated using variations
on equation 1 and the sample described in the previous section. Column 1 reports the
uncontrolled differences in mean math achievement levels for students assigned to teachers
during and after TES participation relative to students assigned to teachers before participation.
The differences are small and not significant. However, the essentially descriptive statistics in
column 1 ignore any non-random assignment of students across teachers or across years within
18 An additional 7 percent of our sample, teachers hired in 1993-94, participated in TES during the 2009-10 school year, and thus our data cannot observe them after participation. As with attriters these cases contribute to estimating other coefficients.
19
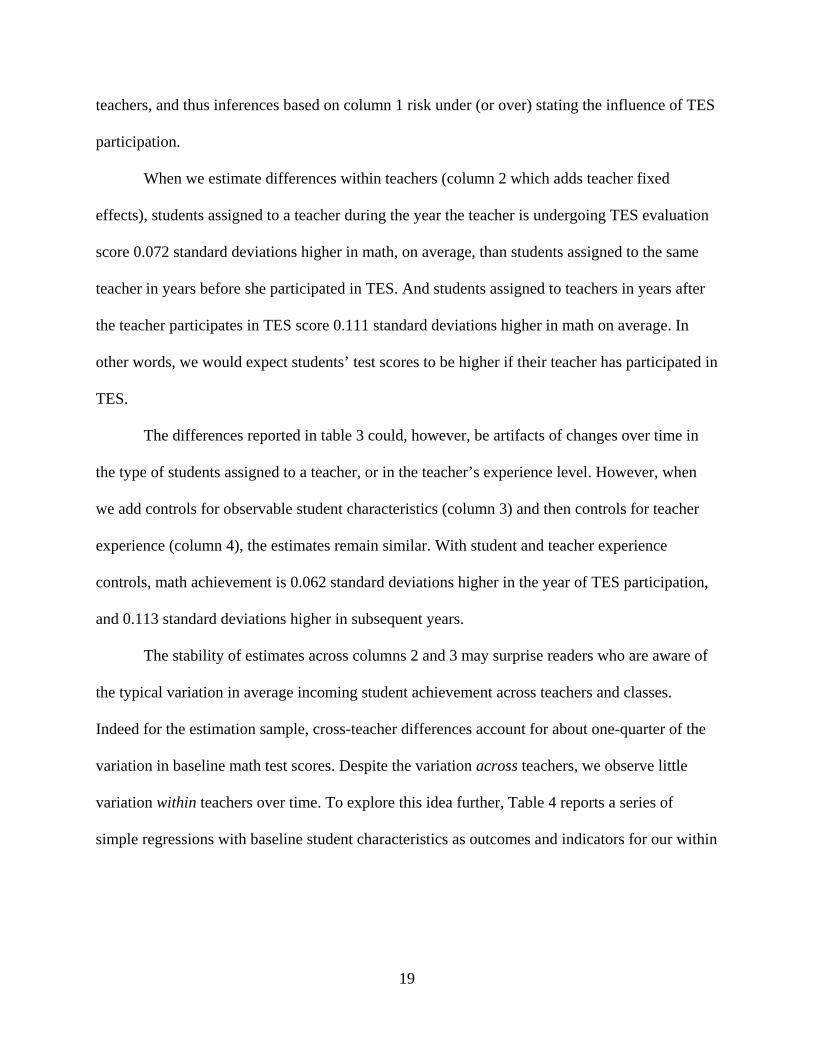
teachers, and thus inferences based on column 1 risk under (or over) stating the influence of TES
participation.
When we estimate differences within teachers (column 2 which adds teacher fixed
effects), students assigned to a teacher during the year the teacher is undergoing TES evaluation
score 0.072 standard deviations higher in math, on average, than students assigned to the same
teacher in years before she participated in TES. And students assigned to teachers in years after
the teacher participates in TES score 0.111 standard deviations higher in math on average. In
other words, we would expect students’ test scores to be higher if their teacher has participated in
TES.
The differences reported in table 3 could, however, be artifacts of changes over time in
the type of students assigned to a teacher, or in the teacher’s experience level. However, when
we add controls for observable student characteristics (column 3) and then controls for teacher
experience (column 4), the estimates remain similar. With student and teacher experience
controls, math achievement is 0.062 standard deviations higher in the year of TES participation,
and 0.113 standard deviations higher in subsequent years.
The stability of estimates across columns 2 and 3 may surprise readers who are aware of
the typical variation in average incoming student achievement across teachers and classes.
Indeed for the estimation sample, cross-teacher differences account for about one-quarter of the
variation in baseline math test scores. Despite the variation across teachers, we observe little
variation within teachers over time. To explore this idea further, Table 4 reports a series of
simple regressions with baseline student characteristics as outcomes and indicators for our within

20
teacher periods of interest, and in equation 1 terms, as predictors.
Most coefficients are small and not statistically significantly different from zero.19
Returning to our primary estimates of interest in table 3, for column 5 we add an
indicator for the school year immediately prior to the year the teacher participated in TES (i.e.,
t=(T-1)); accordingly the reported coefficients are now differences relative to students taught two
or more years prior to TES participation (i.e., t<(T-1)). Separating out the year prior to
participation allows us to test whether teachers who were about to participate in TES were
already on an upward trajectory. As reported in column 5, the coefficient on prior year is positive
(0.033 standard deviations) but not statistically significantly. Additionally, the coefficients of
interest are somewhat larger than in the previous models. These results suggest that teachers may
have been on an upward trajectory not captured by the returns to experience, but we cannot rule
out that the slight trend we estimate is the result of chance.
The estimates in table 3 column 4 suggest that a student taught by a mid-career post-
evaluation teacher will score about 0.1113 standard deviations higher in math than a similar
student taught by the same teacher before the teacher was evaluated by TES. If those two
students began their respective years with the teacher at the 50th percentile of math achievement,
the first student would score about 4.5 percentile points higher at the end of the year.
Additionally, a student taught in the year the teacher participates in TES will score 0.062
standard deviations higher than students taught before participation.20
19 While student assignment patterns may not be correlated with TES participation timing, the accumulated experience of any individual teacher will be correlated—each teacher’s experience level after TES participation must necessarily be greater than his experience before participation. However, most existing evidence suggests that the marginal returns to experience are small after the first five years teaching (Rockoff 2004, Gordon, Kane and Staiger 2006), and essentially none of the teachers in our sample have fewer than five years experience by 2003-04 when our observations begin. 20 For comparison, the standard deviation in total teacher effect on match achievement for our analysis sample is about 0.22. The magnitude is on the high-end of estimates obtained by other researchers using a similar empirical

21
Attrition Following Evaluation
The estimates in table 3, columns 1-5 are potentially sensitive to teacher attrition. Given
TES is an evaluation program, teachers who scored low may be more likely to separate from the
district after their TES year. As it turns out, teachers who scored high may also be more likely to
leave teaching for a promotion since high TES scores are explicitly used by the district in some
promotion decisions. But attrition correlated with high or low TES scores per se is not
necessarily a problem given our teacher fixed effects strategy; our estimates measure the average
teacher improvement (decline) in post-TES years compared to each teacher’s own pre-TES
years. Our estimates would, however, be affected by attrition that is correlated with the trajectory
of change in teacher effectiveness after TES participation. For example, teachers who did not
benefit from TES participation may be more likely to leave which would lead to positive bias in
our estimates.
Columns 6 and 7 of table 3 replicate columns 4 and 5 respectively except that the sample
is limited to the 61 teachers whom we explicitly observe after TES participation. The story does
not dramatically change under this restricted sample, though the estimates are less precise. The
similarity supports the notion that our empirical strategy is relatively robust to attrition correlated
with levels of effectiveness.
Still, attrition correlated with TES-induced change in effectiveness remains a concern. To
get a sense of the magnitude of the potential bias we can make different assumptions about the
post-TES performance of attrtiers and update our estimate of average performance in post-TES
years. First, assume that the performance of the attriter teachers was unaffected by TES
strategy in other settings, but mostly over a broader range of teacher experience levels (see Hanushek and Rivkin 2010).
22
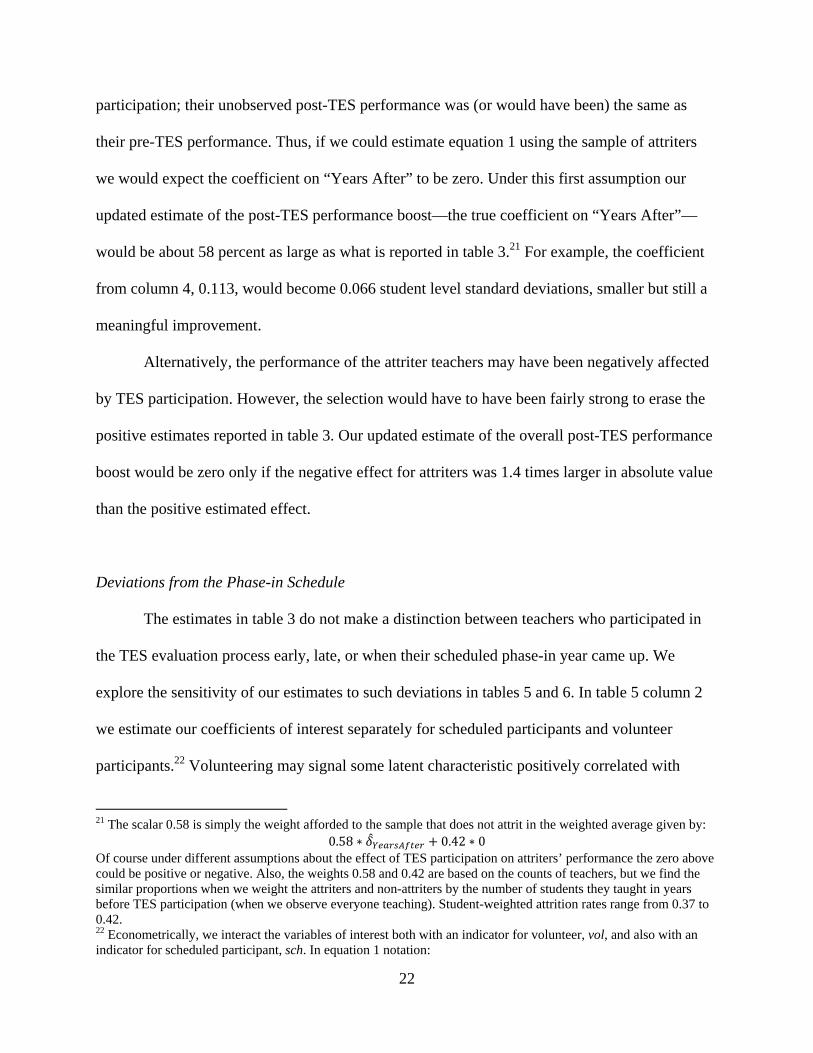
participation; their unobserved post-TES performance was (or would have been) the same as
their pre-TES performance. Thus, if we could estimate equation 1 using the sample of attriters
we would expect the coefficient on “Years After” to be zero. Under this first assumption our
updated estimate of the post-TES performance boost—the true coefficient on “Years After”—
would be about 58 percent as large as what is reported in table 3.21 For example, the coefficient
from column 4, 0.113, would become 0.066 student level standard deviations, smaller but still a
meaningful improvement.
Alternatively, the performance of the attriter teachers may have been negatively affected
by TES participation. However, the selection would have to have been fairly strong to erase the
positive estimates reported in table 3. Our updated estimate of the overall post-TES performance
boost would be zero only if the negative effect for attriters was 1.4 times larger in absolute value
than the positive estimated effect.
Deviations from the Phase-in Schedule
The estimates in table 3 do not make a distinction between teachers who participated in
the TES evaluation process early, late, or when their scheduled phase-in year came up. We
explore the sensitivity of our estimates to such deviations in tables 5 and 6. In table 5 column 2
we estimate our coefficients of interest separately for scheduled participants and volunteer
participants.22 Volunteering may signal some latent characteristic positively correlated with
21 The scalar 0.58 is simply the weight afforded to the sample that does not attrit in the weighted average given by:
0.58 ∗ 0.42 ∗ 0 Of course under different assumptions about the effect of TES participation on attriters’ performance the zero above could be positive or negative. Also, the weights 0.58 and 0.42 are based on the counts of teachers, but we find the similar proportions when we weight the attriters and non-attriters by the number of students they taught in years before TES participation (when we observe everyone teaching). Student-weighted attrition rates range from 0.37 to 0.42. 22 Econometrically, we interact the variables of interest both with an indicator for volunteer, vol, and also with an indicator for scheduled participant, sch. In equation 1 notation:

23
teacher effectiveness, and possibly also correlated with growth from TES participation. The
coefficients for scheduled participants—non-volunteers—remain similar to the combined
estimates (column 1 which simply repeats table 3 column 5) though slightly smaller. In other
words, the estimates in table 3 are not driven by more effective teachers who volunteer to be
evaluated.
However, the point estimates in column 2 for volunteer participants are larger. The
results for volunteers suggest two things. First, volunteering is indeed likely a signal of latent
ability. Students taught by TES volunteers score one-tenth to one-twelfth of a standard deviation
better in math beginning in at least the year of TES participation. Second, even though they are
unlikely to be representative, the estimated coefficients in column 2 suggest volunteers may also
be improving as a result of TES participation. The coefficients increase from 0.053 to 0.161 and
then to 0.226; a positive trajectory though not as steep as for non-volunteers.
Table 6 reports two-stage least squares estimates where we instrument for the timing of
TES participation, i.e. and in equation 1, using the teacher’s scheduled
participation year as determined by her hire cohort. In all table 6 estimates we exclude nine
teachers who volunteered four or more years before their scheduled phase-in year on the
assumption that they were most clearly signaling their high ability. Columns 1 and 4 provide
ordinary least squares estimates similar to table 3 for this sample, and columns 2 and 5 report the
joint significance F-statistics for the excluded instruments in stage one. The instrumented
estimates in columns 3 and 6 are generally larger, though only the improvement in years after
TES evaluation remains statistically significant.
∗ ∗ ∗ ∗
The inclusion of teacher fixed effects precludes estimating a main effect of vol.

24
Heterogeneous Effects
Last, as shown in table 7, we find some evidence that the effects of TES participation are
not uniform. The change in teacher performance from before to after evaluation is larger for both
teachers who received relatively low TES scores (panel A) and teachers whose TES scores grew
the most during TES participation (panel B). In table 7 panel A, we interacted our indicator for
past TES participation, , with indicators for quartile of overall TES score received
during the year of participation, T. This overall TES score is the average of more than two dozen
teaching practices scored in four separate classroom observations.23 The difference between
average math student achievement after TES participation versus before participation was largest
for teachers with bottom-quartile TES scores: 0.279 student-level standard deviations.
Similarly in table 7 panel B, the estimated difference is largest for teachers in the top two
quartiles of TES score growth: 0.183 for the quartile of largest growth and 0.229 for the quartile
of second largest growth, though we cannot reject that these coefficients are equal. This TES
score growth is the change in overall TES score from the first to the last classroom observation
during the TES year.
Discussion
The estimates presented here—greater student achievement gains even in years following
TES evaluation—are consistent with the hypothesis that teachers develop human capital as a
result of participating in the evaluation process, at least in terms of promoting math achievement.
As additional support for this hypothesis, we find that teachers who were least skilled at the time
of their evaluation benefit most from the evaluation process.
23 These two dozen teaching practices are collectively known as TES Domains 2 and 3. See Kane et al. (forthcoming) for more information about the process, rubric, and scores.
25
By contrast, we do not find the kind of transitory boost in performance during the year of
TES evaluation that would support models where teachers only adjust their behavior when
actively under evaluation. There is, however, some evidence of improvement during the
evaluation period. The estimated performance improvement of around 10 percent of a standard
deviation is not trivial. Hill et al. (2008) estimate that average annual gains in math achievement
from fourth through eighth grade range from 56 to 30 percent of a standard deviation with larger
gains in the earlier grades to which our sample is weighted.
A natural comparison for these effects would be teacher professional development
programs (in-service training often delivered in formal classroom settings). Unfortunately,
despite the substantial budgets allocated to such programs, there is little rigorous evidence on
their effects (see Yoon et al. 2007 for an extensive review).
There are, however, other estimates from the general literature on teacher human capital
development. First, among extant evidence the largest gains in teacher effectiveness occur as
teachers gain on-the-job experience in the first three to five years. Rockoff (2004) reports gains
of about 0.10 standard deviations over the first two years of teaching when effectiveness is
measured by math computation gains; when measured by math concepts the gains are about half
as big and not statistically significant. Second, Jackson and Bruegmann (2009) study the effect of
working around more effective colleagues, and find that better teacher peers improves a teacher’s
own performance. A one standard deviation increase in teacher-peer quality was associated with
0.04 standard deviation increase in math achievement. Additionally, the effects both accumulated
over time and persisted even after the working relationships ended. The TES program’s use of
peer evaluators may capture some of the same benefits.

26
While our estimates are consistent with human capital gains, much of the causal story
remains unclear. First, even if teachers’ actions changed after evaluation we do not know what
their expectations were when the evaluation process began. For example, some teachers may
have begun the TES participation year planning to adhere to the TES rubric only during
evaluation, or not expecting to learn much from the process; but found the feedback helpful and
ultimately adjusted their behavior long run. Second, we cannot say what teachers changed about
their behavior, nor which changes were most important to student achievement growth.
Following the TES rubric’s explicit suggestions for best practices is only one possible
mechanism. Alternatively, the general peer- and self-scrutiny may have uncovered opportunities
for improvement in areas not addressed by the TES rubric.
Additionally, while our focus in this paper has been on math achievement, in similar analyses of
reading achievement we do not find significant differences in student achievement associated with TES
participation.24 For reading, the coefficients of interest are close to zero and not statistically significant.
Several studies now have found less variation in teachers’ effects on reading achievement
compared to the variation in teachers’ effects on math achievement (Hanushek and Rivkin 2010).
Some have hypothesized that these smaller reading teacher differences could arise because
students learn reading in many settings at school and at home outside a formal reading class. If
teachers have less influence on reading achievement variation, then changes in teacher practices
may have smaller returns.
Evaluation Costs and Returns
24 Results based on reading instead of math test scores for all tables included in this paper are available from the authors upon request.
27
Finally, before concluding we turn briefly to the costs of the TES evaluation program in
comparison to the gains estimated in this paper. The TES program carries two important types of
cost: (a) the salaries of TES evaluators and staff, and other direct program costs; and (b) the
student achievement losses incurred by allocating effective, experienced classroom teachers to
evaluator roles.
Given the a-typically intense nature of the TES evaluation process, it should not be
surprising that the budget expenditure is relatively large. From 2004-05 to 2009-10 the district
budget directly allocated between $1.8M and $2.1M per year to the TES program, or about
$7,000-7,500 per teacher evaluated (Cincinnati Public Schools 2010). However, these figures do
not include time spent by the teachers being evaluated. By comparison the district formal
professional development budget (excluding TES) is approximately $695 per teacher.
The district also incurs a cost in terms of lost student achievement. The TES program
selects effective, experienced classroom teachers to serve as full-time evaluators. The teaching
positions they vacate will, presumably, be filled with less-effective, likely novice teachers.25
Viewing evaluation from a human capital development perspective, the net loss in
productivity—the production of student achievement—from these substitutions is a central cost
of the investment (Becker 1962).
To make the discussion concrete, assume that TES evaluators are drawn from the top
quartile of the district’s teacher effectiveness distribution, and their replacements from the
bottom quartile. In Cincinnati a student in the classroom of a 75th percentile teacher would score
about 0.16 standard deviations higher than if he had instead been assigned to the classroom of a
25 From the perspective of the school district, the replacement is always a new hire. While a principal may be able to replace a peer evaluator with a veteran who transfers from elsewhere in the district, the district will need to replace that transfer with a new hire.

28
25th percentile teacher.26 Thus the expected student achievement “cost” of one evaluator is
approximately 0.16 multiplied by the number of students she would have been teaching instead
of serving as an evaluator. Using Hanushek’s (2010) estimates, this loss in student achievement
would translate to approximately $300,000 in lost student lifetime earnings for each class of 20
students the evaluator would have otherwise taught.27 The average TES evaluator caseload is
about 20-25teachers per year making the cost per teacher evaluated about $12,000-15,000 in lost
student lifetime earnings.
While substantial, these costs nevertheless compare favorably to the estimated returns.
Using the estimates in table 3 column 4, students taught by a teacher who has previously
participated in the TES evaluation will score 0.113 standard deviations higher than they
otherwise would have. Again following Hanushek (2010), this achievement boost predicts an
additional $200,000 in student lifetime earnings for each class of 20 students taught.28 Thus
even if the effect of evaluation lasted just one school year, the returns would be approximately
$177,500-181,000 per teacher evaluated ($200,000 minus $7,000-7,500 in salary costs and
$12,000-15,000 in lost student achievement induced costs). Additionally, our estimates suggest
the returns would continue at least over the first few years following a teacher’s TES evaluation.
29 The net gain is smaller but still positive at the lower bound estimate of 0.066 under
pessimistic attrition assumptions.
Conclusion
26 Kane et al. (forthcoming) estimate the standard deviation in overall teacher effect in Cincinnati at 0.12 student-level standard deviations in math. This variation is consistent with, but on the small side of estimates from other districts (Hanushek and Rivkin 2010). 27 Hanushek’s estimate of the difference between a 25th and 75th percentile teacher is larger, a little over $500,000 (figure 1) but he assumes a wider distribution of teacher effectiveness. 28 The distribution of teacher effectiveness among our sample of mid-career teachers is somewhat wider than the district overall. The standard deviation is approximately 0.22, making the coefficient of 0.113 about half of a standard deviation. 29 Even if Hanushek’s estimates are off by an order of magnitude our calculus would still likely support the TES investment.
29
The estimates presented here are consistent with the hypothesis that employee evaluation
programs, at least in the case of teachers, can improve performance even after the evaluation
period ends. One likely mechanism for such productivity growth is that the feedback provided in
the evaluation spurs employee investments in human capital development.
In particular, we find higher student achievement in classrooms taught during the
evaluation year and especially in the years following evaluation. Our estimates suggest that a
student taught by a teacher after that teacher participates in the TES evaluation program will
score about 10 percent of a standard deviation higher in math than a similar student taught by the
same teacher before the teacher participated in TES. If those two students began their respective
years with the teacher at the 50th percentile of math achievement, the first student would score
about 4.5 percentile points higher at the end of the year.
Advocates of teacher evaluation should, however, take caution when extrapolating these
results to other programs and proposals. First, Cincinnati’s investment in the Teacher Evaluation
System is substantial: a detailed rubric describing practices shown to correlate positively with
student achievement, multiple observations and feedback opportunities over the course of an
entire school year, regular evaluator training. If the district’s teachers are using evaluation
feedback to improve their skills, the effect is likely sensitive to the quality and reputation of the
feedback. Second, we do not find effects of TES evaluation on students’ reading achievement.
Third, the teachers in our analysis sample were all beyond their fifth year of teaching when they
participated in the evaluation. The effects may be larger (smaller) for teachers earlier in (or very
late in) their career.
Our results suggest optimism that well-structured teacher evaluation programs can
improve the average effectiveness of mid-career teachers at least in mathematics. And,

30
importantly, that such a program can net substantial returns. Thus gains from evaluation need not
only come through selective termination of teachers who score low. However, the dimensions of
“well-structured” remain elusive; a critical gap in a time when many new evaluation systems are
under development. The entire sector would be well served by K-12 systems willing to
experimentally vary the components of their evaluation system (including the timing of teacher
participation), and measure any resulting differences in teacher effectiveness.

References
Aaronson, Daniel, Lisa Barrow, and William Sander. 2003. “Teachers and Student Achievement
in the Chicago Public Schools.” Federal Reserve Bank of Chicago Working Paper WP-
2002-28.
Baker, George P. 1992. “Incentive Measures and Performance Measurement.” Journal of
Political Economy, 100(3):598-614.
Becker, Garry S. 1962. “Investment in Human Capital: A Theoretical Analysis.” Journal of
Political Economy 70(5): 9-49.
Becker, Gary S. 1993. Human Capital: A Theoretical and Empirical Analysis with special
Reference to Education, Third Edition. Chicago, IL: The University of Chicago Press.
Bill & Melinda Gates Foundation. 2010. “Learning About Teaching: Initial Findings from the
Measures of Effective Teaching Project.” MET Project Research Paper.
Boyd, Don, Hamilton Lankford, Susanna Loeb, Matthew Ronfeldt, and James Wyckoff.
Forthcoming. “The Role of Teacher Quality in Retention and Hiring: Using Applications-
to-Transfer to Uncover Preferences of Teachers and Schools.” Journal of Policy Analysis
and Management.
Chetty, Raj, John Friedman, Nathaniel Hilger, Emmanuel Saez, Diane Whitmore Schanzenbach,
and Danny Yagan. 2010. “How Does Your Kindergarten Classroom Effect Your
Earnings? Evidence from Project STAR.” National Bureau of Economic Research
Working Paper 16381.
Chevalier, Judith and Glenn Ellison. 1999. “Career Concerns of Mutual Fund Managers.” The
Quarterly Journal of Economics, 114(2):389-432.
Cincinnati Public Schools. 2010. “Superintendent’s 2010-11 General Fund Budget.” (Also

similar documents for 2005, 2006, 2007, 2008 and 2009.)
Danielson, Charlotte. 1996. Enhancing Professional Practice: A Framework for Teaching.
Alexandria, Va.: Association for Supervision and Curriculum Development.
Dixit, Avinash. 2002. "Incentives and Organizations in the Public Sector: An Interpretative
Review." The Journal of Human Resources, 37(4): 696-727.
Donaldson, Morgaen. L. 2009. “So long, Lake Wobegon? Using teacher evaluation to raise
teacher quality.” Center for American Progress.
Fairman, Sarah Edith, Susan Moore Johnson, Mindy Sick Munger, John P. Papay, and Emily
Kalejs Qazilbash. 2009. "Teachers Leading Teachers: The Experiences of Peer
Assistance and Review Consulting Teachers." Paper presented at the annual meeting of
the American Educational Research Association, San Diego, April 2009.
Fama, Eugene F. 1980. “Agency Problems and the Theory of the Firm.” Journal of Political
Economy, 88(2):288-307.
Gibbons, Robert. 2005. “Incentives Between Firms (and Within).” Management Science, 51(1):
2-17
Glazerman, Steven, Susanna Loeb, Dan Goldhaber, Douglas Staiger, Stephen Raudenbush, and
Grover Whitehurst. 2010. “Evaluating Teachers: The Important Role of Value-Added.”
Brown Center on Education Policy. Washington, DC.: Brookings Institution.
Goldhaber, Dan and Emily Anthony. 2007. “Can Teacher Quality Be Effectively Assessed?”
Review of Economics and Statistics, 89(1): 134-150.
Goldhaber, Dan and Michael Hansen 2010. “Assessing the Potential of Using Value-Added
Estimates of Teacher Job Performance for Making Tenure Decisions,” National Center
for Analysis of Longitudinal Data in Education Research, Working Paper 31.

Gordon, Robert, Thomas J. Kane, and Douglas O. Staiger. 2006. “Identifying Effective Teachers
Using Performance on the Job.” Hamilton Project Discussion Paper. Washington, DC.:
Brookings Institution.
Hanushek, Eric A. 1971. "Teacher Characteristics and Gains in Student Achievement:
Estimation Using Micro Data." The American Economic Review 61(2): 280-288.
Hanushek, Eric A. 2010. “The Economic Value of Higher Teacher Quality.” National Bureau of
Economic Research Working Paper 16606.
Hanushek, Eric A., and Steven G. Rivkin. 2010. “Using Value-Added Measures of Teacher
Quality.” American Economic Review 100(2):267-271.
Harkins, S. G. 2006. "Mere Effort as the Mediator of the Evaluation-Performance Relationship."
Journal of Personality and Social Psychology 91(3): 436-455.
Hill, Carolyn J., Howard S. Bloom, Alison Rebeck Black, and Mark W. Lipsey. 2008.
“Empirical Benchmarks for Interpreting Effect Sizes in Research.” Child Development
Perspectives, 2(3): 172-177.
Holmstrom, Bengt. 1979. “Moral Hazard and Observability.” Bell Journal of Economics, 10(1):
74-91.
Holmstrom, Bengt. 1999. “Managerial Incentive Problems: A Dynamic Perspective.” Review of
Economic Studies, 66(1):169-182.
Holmstrom, Bengt. and Paul Milgrom. 1991. “Multitask Principal-Agent Analyses: Incentive
Contracts, Asset Ownership, and Job Design,” Journal of Law, Economics, and
Organization, 7(Sp): 24-52.
Holtzapple, Elizabeth. 2003. “Criterion-Related Validity Evidence for a Standards-Based
Teacher Evaluation System.” Journal of Personnel Evaluation in Education, 17(3):207-
219.
Jacob, Brian A. 2010. “Do Principals Fire the Worst Teachers?” National Bureau of
Economic Research Working Paper 15715.
Jackson, C. Kirabo, and Elias Bruegmann. 2009. “Teaching Students and Teaching Each Other:
The Importance of Peer Learning for Teachers.” American Economic Journal: Applied
Economics, 1(4):1-27.
Johnson, Susan Moore. 1990. Teachers at Work: Achieving Success in Our Schools. New York,
Basic Books.
Johnson, Susan Moore. 2010. Personal communication.
Kane, Thomas J., Jonah E. Rockoff, and Douglas O. Staiger. 2008. “What Does Certification
Tell Us About Teacher Effectiveness? Evidence from New York City.” Economics of
Education Review 27(6):615-631.
Kane, Thomas J., and Douglas O. Staiger. 2008. “Estimating Teacher Impacts on Student
Achievement: An Experimental Evaluation.” National Bureau of Economic Research
Working Paper 14601.
Kane, Thomas J., Eric S. Taylor, John H. Tyler, and Amy L. Wooten. Forthcoming. "Identifying
Effective Classroom Practices Using Student Achievement Data." Journal of Human
Resources.
Kimball, S. M. 2002. "Analysis of Feedback, Enabling Conditions and Fairness Perceptions of
Teachers in Three School Districts with New Standards-Based Evaluation Systems."
Journal of Personnel Evaluation in Education, 16(4): 241-268.
Koedel, Corey. and Julian R. Betts. 2009. “Does Student Sorting Invalidate Value-Added
Models of Teacher Effectiveness? An Extended Analysis of the Rothstein Critique.”
University of Missouri, Working Paper 0902.
Kluger, Avraham N. and Angelo DeNisi. 1996. "The Effects of Feedback Interventions on
Performance: A Historical Review, a Meta-Analysis, and a Preliminary Feedback
Intervention Theory." Psychological Bulletin, 119(2): 254-284.
Lazear, Edward P. and Paul Oyer. Forthcoming. “Personnel Economics.” In The Handbook of
Organizational Economics, Robert Gibbons and D. John Roberts (eds.). Princeton, N.J.:
Princeton Universty Press.
Luthans, F. and S. J. Peterson. 2003. "360-degree feedback with systematic coaching: Empirical
analysis suggests a winning combination." Human Resource Management, 42(3): 243-
256.
Milanowski, Anthony. 2004a. “The Relationship Between Teacher Performance Evaluation
Scores and Student Achievement: Evidence from Cincinnati.” Peabody Journal of
Education 79(4):33-53.
Milanowski, Anthony. 2004b. “Relationships Among Dimension Scores of Standards-Based
Teacher Evaluation Systems, and the Stability of Evaluation Score-Student Achievement
Relationships Over Time.” Consortium for Policy Research in Education, University of
Wisconsin Working Paper Series TC-04-02.
Milanowski, A. T. and H. G. Heneman. 2001. "Assessment of Teacher Reactions to a Standards-
Based Teacher Evaluation System: A Pilot Study." Journal of Personnel Evaluation in
Education, 15(3): 193-212.
Murnane, Richard. J., and Barbara R. Phillips. 1981. “What Do Effective Teachers of Inner-City
Children Have in Common?” Social Science Research, 10(1):83-100.
Neal, Derek. 2011. “The Design of Performance Pay in Education.” National Bureau of
Economic Research Working Paper 16710.
The New Teacher Project. 2009. “Human Capital Reform in Cincinnati Public Schools:
Strengthening Teacher Effectiveness and Support.” New York City, N.Y.: The New
Teacher Project.
Prendergast, Canice. 1999. “The Provision of Incentives in Firms.” Journal of Economic
Literature, 37(1): 7-63.
Rivkin, Steven G., Eric A. Hanushek, and John Kain. 2005. “Teachers, Schools and Academic
Achievement.” Econometrica 73(2):417-458.
Rockoff, Jonah E. 2004. “The Impact of Individual Teachers on Student Achievement: Evidence
from Panel Data.” American Economic Review 94(2):247-252.
Rockoff, Jonah E., Douglas O. Staiger, Thomas J. Kane, and Eric S. Taylor. 2010. “Information
and Employee Evaluation: Evidence from a Randomized Intervention in Public Schools.”
National Bureau of Economic Research Working Paper 16240.
Rothstein, Jesse. 2010. “Teacher Quality in Educational Production: Tracking, Decay, and
Student Achievement.” Quarterly Journal of Economics 25(1):175-214.
Seifert, C. F., G. Yukl, et al. 2003. "Effects of Multisource Feedback and a Feedback Facilitator
on the Influence Behavior of Managers Toward Subordinates." Journal of Applied
Psychology, 88(3): 561-569.
Smither, J. W., M. London, et al. 2003. "Can Working With an Executive Coach Improve
Multisource Feedback Ratings Over Time? A Quasi-Experimental Field Study."
Personnel Psychology, 56(1): 23-44.
Staiger, Douglas O. and Jonah E. Rockoff. 2010. "Searching for Effective Teachers with
Imperfect Information." The Journal of Economic Perspectives 24: 97-117.
Todd, Petra E. and Kenneth I. Wolpin. 2003. “On the Specification and Estimation of the
Production Function for Cognitive Achievement” Economic Journal, 113(485).
Weisberg, Daniel, Susan Sexton, Jennifer Mulhern, and David Keeling. 2009. The Widget Effect:
Our National Failure to Acknowledge and Act on Teacher Effectiveness. New York City,
N.Y.: The New Teacher Project.
Yoon , Kwang Suk, Teresa Duncan, Silvia Wen-Yu Lee, Beth Scarloss, Kathy L. Shapley. 2007.
“Reviewing the Evidence on How Teacher Professional Development Affects Student
Achievment.” Issues & Answers Report, REL 2007–No. 033. Washington, DC: U.S.
Department of Education, Institute of Education Sciences, National Center for Education
Evaluation and Regional Assistance, Regional Educational Laboratory Southwest.

TotalScheduled
ParticipationVolunteer
Participation(1) (2) (3) (4)
Student Characteristics
Baseline Math Score 0.072 0.054 0.043 0.084 Standard Deviation (1.009) (0.938) (0.941) (0.930)Baseline Reading Score 0.066 0.072 0.054 0.123 Standard Deviation (1.000) (0.937) (0.950) (0.899)
Grade 4 22.0% 25.9% 22.3% 36.1%Grade 5 16.8% 26.0% 22.5% 36.0%Grade 6 13.0% 18.7% 21.2% 11.6%Grade 7 25.6% 17.5% 20.0% 10.2%Grade 8 22.5% 12.0% 14.0% 6.2%
Male 50.4% 48.1% 47.2% 50.4%Racial/Ethnic Minority 76.1% 79.7% 79.1% 81.1%White 23.8% 20.4% 20.9% 18.9%Special Education 19.1% 17.7% 18.2% 16.5%English Language Learner 2.6% 3.0% 3.6% 1.5%Gifted & Talented 9.8% 11.4% 11.8% 10.1%Retained in Grade 1.1% 0.7% 0.8% 0.7%
Number of Students 44,648 14,208 10,503 3,705
Teacher Characteristics
First Year Teaching 0.9% 0.0% 0.0% 0.0%1 Year Experience 2.0% 0.0% 0.0% 0.0%2 Years Experience 2.6% 0.0% 0.0% 0.0%3 Years Experience 3.0% 0.0% 0.0% 0.0%4 Years Experience 4.2% 0.9% 0.8% 1.3%5-9 Years Experience 19.2% 15.6% 14.2% 20.1%10-19 Years Experience 28.7% 67.8% 68.4% 66.3%20 or More Years Experience 39.5% 15.6% 16.6% 12.5%
Contract Year 1992 or earlier 36.9% 0.0% 0.0% 0.0%Contract Year 1993 1.6% 8.6% 10.0% 4.0%Contract Year 1994 1.8% 18.1% 15.0% 28.0%Contract Year 1995 0.9% 3.8% 3.7% 4.0%Contract Year 1996 0.9% 13.3% 16.3% 4.0%Contract Year 1997 0.5% 21.0% 23.7% 12.0%Contract Year 1998 0.5% 21.9% 18.8% 32.0%Contract Year 1999 1.2% 13.3% 12.5% 16.0%Contract Year 2000 or later 44.9% 0.0% 0.0% 0.0%
Number of Teachers 561 105 80 25
Main Estimation SampleNot In Estimation
Sample
Table 2: Observable Student and Teacher Characteristics of Estimation Sample

(1) (2) (3) (4) (5) (6) (7)
School Year Relative to Year of TES Participation (Years Prior Omitted)
Year Immediately Prior 0.033 -0.027(0.042) (0.048)
Year of Participation -0.012 0.072+ 0.063+ 0.062+ 0.086+ 0.107* 0.085(0.087) (0.043) (0.036) (0.036) (0.045) (0.046) (0.061)
Years After 0.047 0.111* 0.116* 0.113* 0.145* 0.130* 0.104(0.106) (0.054) (0.047) (0.048) (0.060) (0.059) (0.079)
Teacher Fixed Effects Y Y Y Y Y YTeacher Experience Controls Y Y Y YStudent-level Controls Y Y Y Y Y
Teacher Clusters 105 105 105 105 105 61 61Student Observations 14,208 14,208 14,208 14,208 14,208 11,107 11,107Adjusted R-squared 0.013 0.245 0.576 0.576 0.576 0.579 0.579
Table 3: Estimated Differences in Math Achievement for Students Taught During and After TES Participation (Compared to Students Taught Before)
Full Sample
Only Teachers Observed
After Participationa
Note: Each column represents a separate student-level specification predicting math test score as a function of grade-by-year fixed effects, and the indicated covariates. Student-level controls include prior year achievement (main effect, interaction with grade level, and indicator for missing value) and indicators for gender, race/ethnicity subgroup, special education classification, English language learner classification, gifted and talented classification, and students retained in grade. Clustered (teacher) standard errors in parentheses. a The excluded attriters include (i) any teacher who does not teach grades 4-8 math in years with state tests after TES participation, as well as (ii) teachers who participated in TES in 2009-10, the last year in out data.** indicates p<0.01, * p<0.05, and + p<0.10.
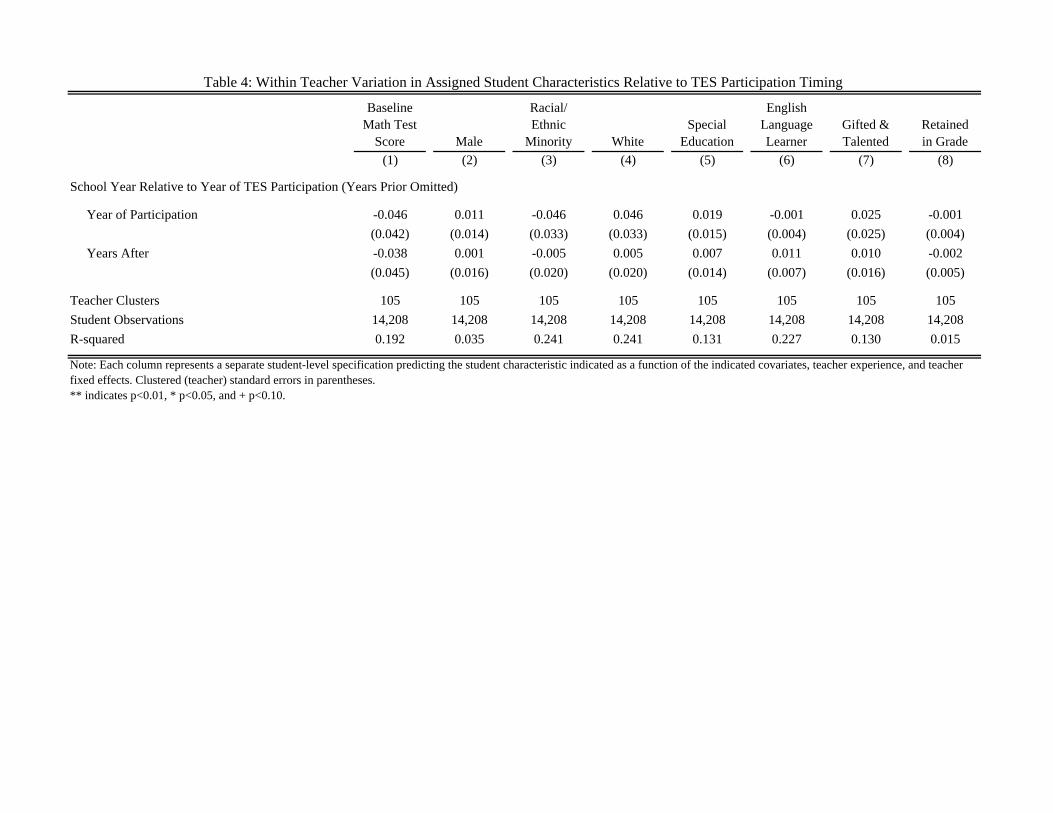
Baseline Math Test
Score Male
Racial/ Ethnic
Minority WhiteSpecial
Education
English Language Learner
Gifted & Talented
Retained in Grade
(1) (2) (3) (4) (5) (6) (7) (8)
School Year Relative to Year of TES Participation (Years Prior Omitted)
Year of Participation -0.046 0.011 -0.046 0.046 0.019 -0.001 0.025 -0.001
(0.042) (0.014) (0.033) (0.033) (0.015) (0.004) (0.025) (0.004)
Years After -0.038 0.001 -0.005 0.005 0.007 0.011 0.010 -0.002
(0.045) (0.016) (0.020) (0.020) (0.014) (0.007) (0.016) (0.005)
Teacher Clusters 105 105 105 105 105 105 105 105
Student Observations 14,208 14,208 14,208 14,208 14,208 14,208 14,208 14,208
R-squared 0.192 0.035 0.241 0.241 0.131 0.227 0.130 0.015
Table 4: Within Teacher Variation in Assigned Student Characteristics Relative to TES Participation Timing
Note: Each column represents a separate student-level specification predicting the student characteristic indicated as a function of the indicated covariates, teacher experience, and teacher fixed effects. Clustered (teacher) standard errors in parentheses. ** indicates p<0.01, * p<0.05, and + p<0.10.
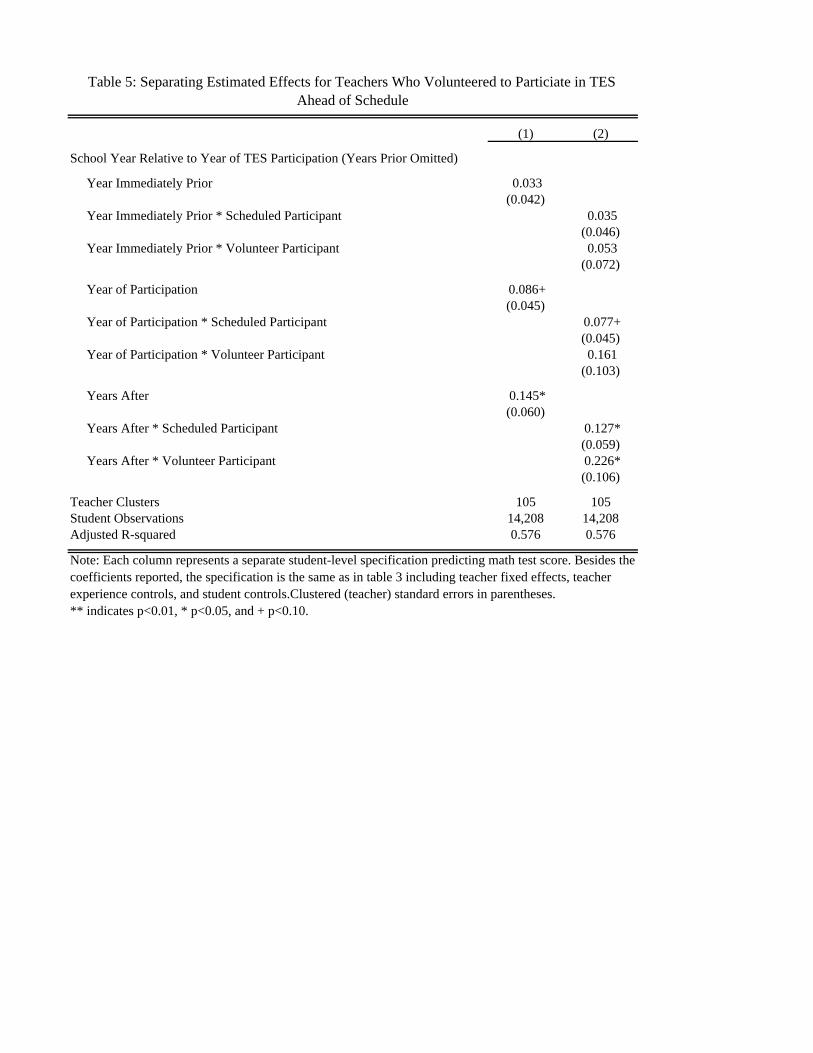
(1) (2)
School Year Relative to Year of TES Participation (Years Prior Omitted)
Year Immediately Prior 0.033(0.042)
Year Immediately Prior * Scheduled Participant 0.035(0.046)
Year Immediately Prior * Volunteer Participant 0.053(0.072)
Year of Participation 0.086+(0.045)
Year of Participation * Scheduled Participant 0.077+(0.045)
Year of Participation * Volunteer Participant 0.161(0.103)
Years After 0.145*(0.060)
Years After * Scheduled Participant 0.127*(0.059)
Years After * Volunteer Participant 0.226*(0.106)
Teacher Clusters 105 105Student Observations 14,208 14,208Adjusted R-squared 0.576 0.576
Table 5: Separating Estimated Effects for Teachers Who Volunteered to Particiate in TES Ahead of Schedule
Note: Each column represents a separate student-level specification predicting math test score. Besides the coefficients reported, the specification is the same as in table 3 including teacher fixed effects, teacher experience controls, and student controls.Clustered (teacher) standard errors in parentheses. ** indicates p<0.01, * p<0.05, and + p<0.10.

OLS
First-Stage F-test on
Excluded Instruments IV OLS
First-Stage F-test on
Excluded Instruments IV
(1) (2) (3) (4) (5) (6)
School Year Relative to Year of TES Participation (Years Prior Omitted)
Year Immediately Prior 0.030 45.16 0.131(0.042) (0.095)
Year of Participation 0.054 13.05 0.052 0.077+ 13.05 0.127(0.037) (0.078) (0.046) (0.092)
Years After 0.094* 114.54 0.150* 0.124* 114.54 0.251**(0.046) (0.061) (0.058) (0.089)
Teacher Clusters 96 96 96 96Student Observations 13,111 13,111 13,111 13,111Adjusted R-squared 0.587 0.586 0.587 0.586
Table 6: IV Estimates of Differences in Math Achievement for Students Taught During and After TES Participation
Note: The estimation sample excludes teachers who volunteered to participate four or more years before their scheduled year. Columns 1, 3, 4 and 6 each represent a separate student-level specification predicting math test score. Besides the coefficients reported, the specification is the same as in table 3 including teacher fixed effects, teacher experience controls, and student controls. The excluded instruments are a vector of dummary variables for each interaction of teacher hire cohort (which determined TES participation schedule) and school year. Clustered (teacher) standard errors in parentheses. ** indicates p<0.01, * p<0.05, and + p<0.10.
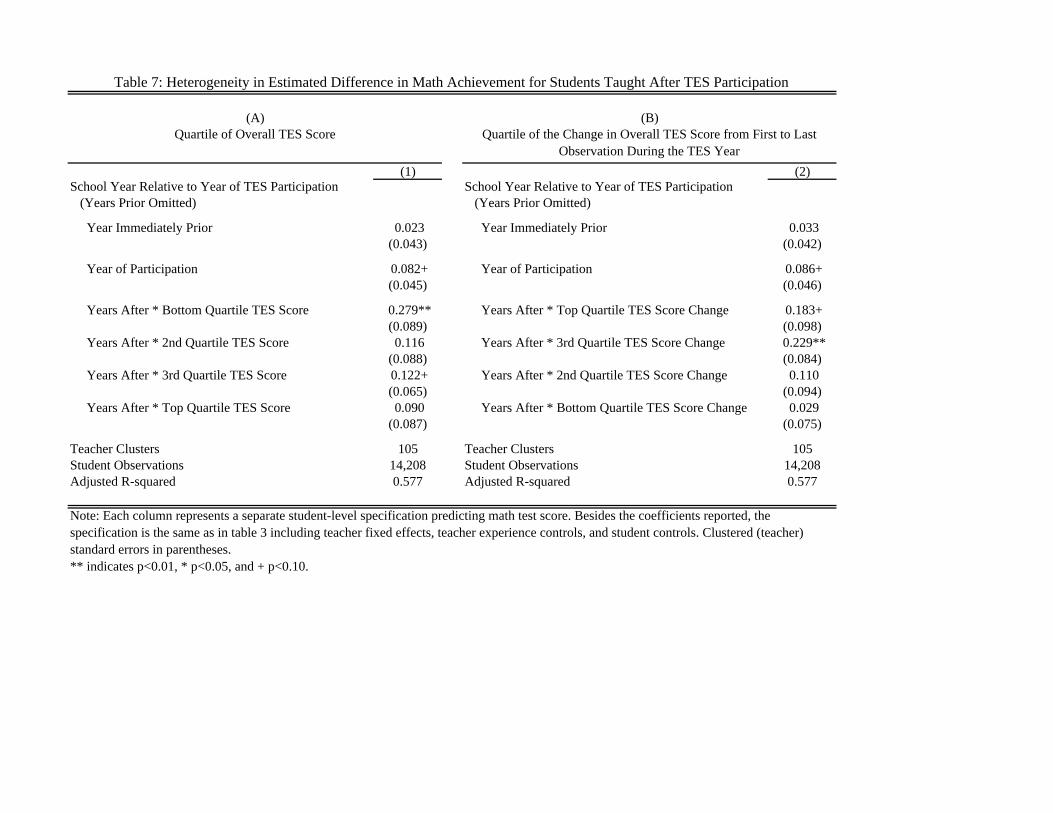
(1) (2)School Year Relative to Year of TES Participation School Year Relative to Year of TES Participation (Years Prior Omitted) (Years Prior Omitted)
Year Immediately Prior 0.023 Year Immediately Prior 0.033(0.043) (0.042)
Year of Participation 0.082+ Year of Participation 0.086+(0.045) (0.046)
Years After * Bottom Quartile TES Score 0.279** Years After * Top Quartile TES Score Change 0.183+(0.089) (0.098)
Years After * 2nd Quartile TES Score 0.116 Years After * 3rd Quartile TES Score Change 0.229**(0.088) (0.084)
Years After * 3rd Quartile TES Score 0.122+ Years After * 2nd Quartile TES Score Change 0.110(0.065) (0.094)
Years After * Top Quartile TES Score 0.090 Years After * Bottom Quartile TES Score Change 0.029(0.087) (0.075)
Teacher Clusters 105 Teacher Clusters 105Student Observations 14,208 Student Observations 14,208Adjusted R-squared 0.577 Adjusted R-squared 0.577
Note: Each column represents a separate student-level specification predicting math test score. Besides the coefficients reported, the specification is the same as in table 3 including teacher fixed effects, teacher experience controls, and student controls. Clustered (teacher) standard errors in parentheses. ** indicates p<0.01, * p<0.05, and + p<0.10.
Table 7: Heterogeneity in Estimated Difference in Math Achievement for Students Taught After TES Participation
(A) (B)Quartile of Overall TES Score Quartile of the Change in Overall TES Score from First to Last
Observation During the TES Year