Embed Size (px)
Citation preview
Reports 1/2010
Marte Rønning
Homework and pupil achievement in Norway
Evidence from TIMSS
Statistisk sentralbyrå • Statistics NorwayOslo–Kongsvinger
In this series, analyses and annotated statistical results are published from various surveys. Surveys include sample surveys, censuses and register-based surveys.
Reports
Symbols in tables SymbolCategory not applicable .Data not available ..Data not yet available …Not for publication :Nil -Less than 0.5 of unit employed 0Less than 0.05 of unit employed 0.0Provisional or preliminary figure *Break in the homogeneity of a vertical series
—
Break in the homogeneity of a horizontal series
|
© Statistics Norway, January 2010 When using material from this publication, Stastistics Norway shall be quoted as the source. ISBN 978-82-537-7753-5 Printed version ISBN 978-82-537-7754-2 Electronic version ISSN 0806-2056 Subject: 04.02.20 Print: Statistics Norway
Decimal punctuation mark .
Reports 1/2010 Homework and pupil achievement in Norway
Statistisk sentralbyrå 3
Preface This report is financed by the Norwegian Ministry of Education. The Norwegian Ministry of Education is not responsible for the analysis in this report. The report has benefited from valuable discussions and suggestions from Torbjørn Hægeland and Edwin Leuven. I am also grateful for useful comments from Ådne Cappelen and Marie W. Arneberg and her colleagues from the Norwegian Ministry of Education. Statistics Norway Oslo/Kongsvinger 7 January 2010

Reports 1/2010 Homework and pupil achievement in Norway
Statistisk sentralbyrå 5
Abstract By using data on Norwegian 4th and 8th graders who participated in TIMSS 2007, this report starts out by investigating whether time spent on homework varies across pupils from different socio-economic backgrounds. The findings show that pupils from lower socio-economic backgrounds, in both 4th and 8th grade, are more likely to spend no time on homework than pupils from higher socio-economic backgrounds (although homework is given). At the same time it is also found that if pupils from lower socio-economic backgrounds spend time on homework, they actually spend more time on it than pupils from higher socio-economic backgrounds. One reason why pupils from lower socio-economic backgrounds are more likely to spend zero time on homework could be lack of interest or necessary skills. Another explanation may be poor out-of-school learning environments. I.e., these pupils may have parents who do not or cannot help with homework or make sure that they complete their homework. There are also many possible explanations why pupils from lower socio-economic background spend more time on homework than pupils from higher socio-economic backgrounds. First of all, they may need more time in to complete their homework if they find the homework more difficult than pupils from higher socio-economic backgrounds. Also more time spend on homework can reflect problems related to motivation, frustration and concentration. On the other hand, more time spent on homework may also reflect high educational ambitions, regardless of socioeconomic background. The second aim of the report is to analyze the effect of homework on pupil achievement. There seem to be a positive effect of homework (in mathematics) on average. However, not all pupils seem to benefit from homework. In fact, pupils from lower socio-economic backgrounds (measured as no or very few books at home) actually perform better if less homework is assigned. One explanation why homework has a negative effect for some pupils, may be that homework leads to declining motivation (also during school hours), and hence indirectly affect the achievement negatively. Another explanation may be poor out of school learning environments in combination with that homework serves as a substitute for learning in school. It is well documented in the literature that pupils from lower socio-economic backgrounds learn relatively more while in school/kindergarten than at home, compared to pupils from higher socio-economic backgrounds. An implication of this may be that if topics which are supposed to be taught in class are given as homework, this may negatively affect the achievement of pupils from lower socio-economic backgrounds because these pupils, on average, learn relatively more while in school than at home.
Homework and pupil achievement in Norway Reports 1/2010
6 Statistisk sentralbyrå
Contents Preface .................................................................................................................................. 3 Abstract................................................................................................................................. 5 1. Introduction ............................................................................................................... 7 2. Institutional settings and data.................................................................................. 8 2.1. Institutional settings ..................................................................................................... 8 2.2. Data............................................................................................................................. 8 3. Time spent on homework and family background ............................................... 12 4. Empirical approach ................................................................................................. 14 4.1. OLS ........................................................................................................................... 14 4.2. First difference approach........................................................................................... 15 5. Results ..................................................................................................................... 16 5.1. OLS ........................................................................................................................... 16 5.2. 4th grade: 1st difference approach............................................................................ 20 6. Discussion and concluding remarks ..................................................................... 23 References.......................................................................................................................... 25 Appendix A ......................................................................................................................... 26 List of tables ....................................................................................................................... 27
Reports 1/2010 Homework and pupil achievement in Norway
Statistisk sentralbyrå 7
1. Introduction It is a widespread belief among school leaders, teachers and parents that homework is a valuable educational tool (Cooper et al., 1998). Yet the empirical literature is ambiguous when it comes to evaluating the causal effect of homework on pupil achievement in primary school (Cooper, 1989; Cooper et al., 2006; Trautwein, 2007). One reason for that may be that a majority of the studies do not take into account that homework is correlated with other factors that also influence pupil achievement, such as family background and attributes of the teachers, whereas studies with an experimental design are small scale case studies and hence lack precision (see Cooper et al., 2006 and references therein). Completion of homework requires that the pupils exert some effort during non school hours. The amount of effort is probably not homogeneous across pupils in primary school. For instance, high-performing pupils may need less time to complete their homework assignments than low-performing pupils (Trautwein and Köller, 2003). By using data on Norwegian pupils who participated in TIMSS 2007, the current report has two aims. The first one is to investigate the extent to which time spent on homework differs across pupils from different backgrounds. Since the relationship between time spent on homework and achievement is not necessarily linear (Schmitz and Skinner, 1993; Trautwein et al., 2006) I will also check whether the probability of spending zero time on homework differs across pupils from different socio-economic backgrounds (conditional on that homework is given). The second aim is to investigate the impact of homework on pupil achievement. In order to come closer to a causal effect of homework I will exploit within-pupil variation in homework (across subjects) in a sample of pupils who have the same teacher and peers in both mathematics and science. Confounding teacher and class effects will hence drop out when applying a first difference model. It is well documented in the literature that better educated parents spend more time helping their children with homework than less educated parents (Guryan et al., 2008; Rønning, 2009). To the extent that the home environment is important for whether the homework is completed or not, and hence how much pupils learn from homework, children of better educated parents may benefit more from homework than children of less educated parents (Rønning, 2009).1 In addition to estimating the average effect of homework, I will therefore also investigate whether the effect of homework differs across gender and pupils from different family backgrounds.
1 Because of the structure of the data, Rønning (2009) is only able to look at whether pupils from higher socio-economic status groups benefit relatively more from homework than pupils from lower socio-economic status groups, and not whether homework has a positive effect on the achievement level.
Homework and pupil achievement in Norway Reports 1/2010
8 Statistisk sentralbyrå
2. Institutional settings and data
2.1. Institutional settings Compulsory schooling in Norway consists of ten years: grades 1-7 in primary school and grades 8-10 in lower secondary school. The children start (primary) school the year they turn 6, and graduate (from lower secondary) the year they turn 15. Most pupils attend separate primary and lower secondary schools, but about one quarter of the pupils are enrolled in so-called combined schools that offer both primary and lower secondary education. Schools have catchment areas, and parental choice among schools for given residence is usually not allowed. Grade repetition is not common in Norway.
2.2. Data This paper uses data from the TIMSS (Trends in International Mathematics and Science Study) 2007 database. TIMSS is an international survey conducted by the International Association for the Evaluation of Educational Achievement (IEA) together with PIRLS (the Progress in the International Reading Literacy Study). TIMSS covers a random sample of 4th and 8th graders in 59 countries, and its database contains information on pupil achievement in mathematics and science, as well as background information on the pupils, teachers and schools. The pupil's parents did not participate in the TIMSS survey. The analysis in this paper is based on data for Norway. In total 4108 4th graders and 4627 8th graders from Norway participated in TIMSS 2007. In grade 4 in Norway a majority of the pupils have the same teacher in mathematics and science (only 281 pupils have separate teachers in the two subjects). 40 percent of the 8th graders have separate teachers in mathematics and science (116 8th graders have also more than one teacher in mathematics).
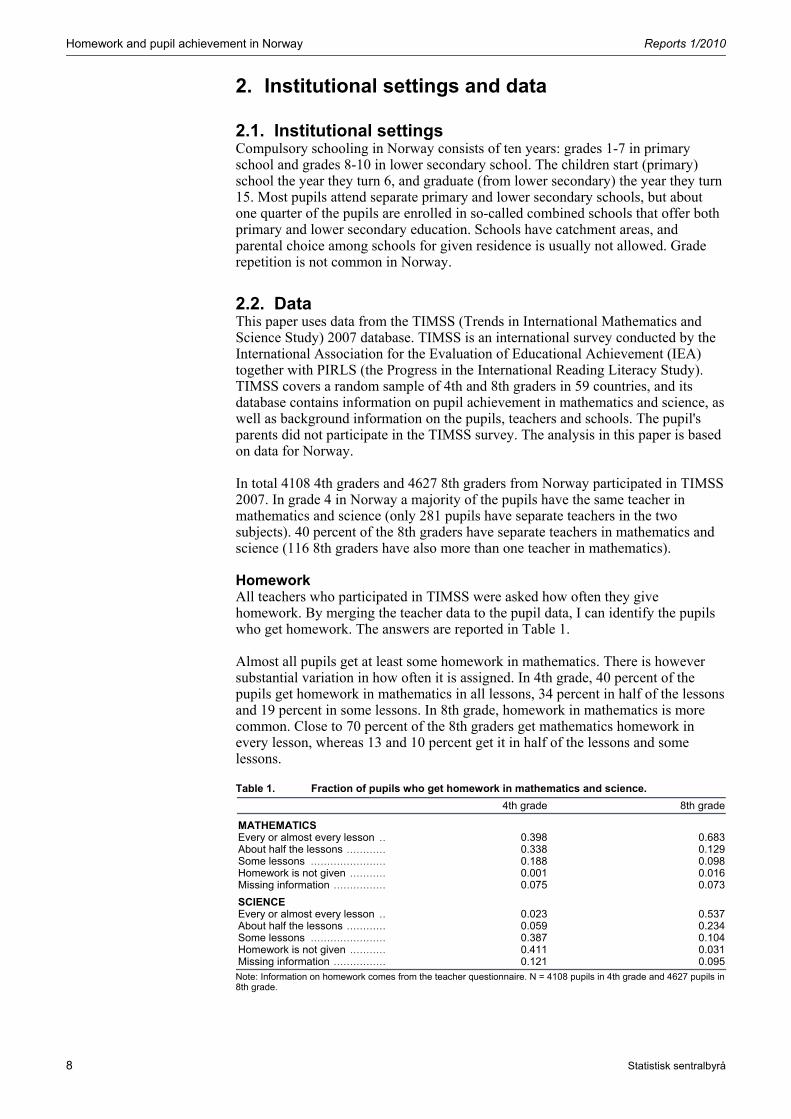
Homework All teachers who participated in TIMSS were asked how often they give homework. By merging the teacher data to the pupil data, I can identify the pupils who get homework. The answers are reported in Table 1. Almost all pupils get at least some homework in mathematics. There is however substantial variation in how often it is assigned. In 4th grade, 40 percent of the pupils get homework in mathematics in all lessons, 34 percent in half of the lessons and 19 percent in some lessons. In 8th grade, homework in mathematics is more common. Close to 70 percent of the 8th graders get mathematics homework in every lesson, whereas 13 and 10 percent get it in half of the lessons and some lessons.
Table 1. Fraction of pupils who get homework in mathematics and science.
4th grade 8th grade
MATHEMATICS
Every or almost every lesson .. 0.398 0.683About half the lessons ............ 0.338 0.129Some lessons ....................... 0.188 0.098Homework is not given ........... 0.001 0.016Missing information ................ 0.075 0.073
SCIENCE Every or almost every lesson .. 0.023 0.537About half the lessons ............ 0.059 0.234Some lessons ....................... 0.387 0.104Homework is not given ........... 0.411 0.031Missing information ................ 0.121 0.095Note: Information on homework comes from the teacher questionnaire. N = 4108 pupils in 4th grade and 4627 pupils in 8th grade.
Reports 1/2010 Homework and pupil achievement in Norway
Statistisk sentralbyrå 9
The difference in homework practices is more marked between 4th and 8th grade when it comes to science. Whereas more than 40 percent of the 4th graders do not get homework in science, we see that only 3 percent of the 8th graders do not get homework in science. On the other extreme, hardly any pupils in 4th grade get science homework every lesson, whereas 54 percent of the 8th graders get science homework on such a regular basis. If 4th graders get homework in science, it tends to be given only in some lessons.
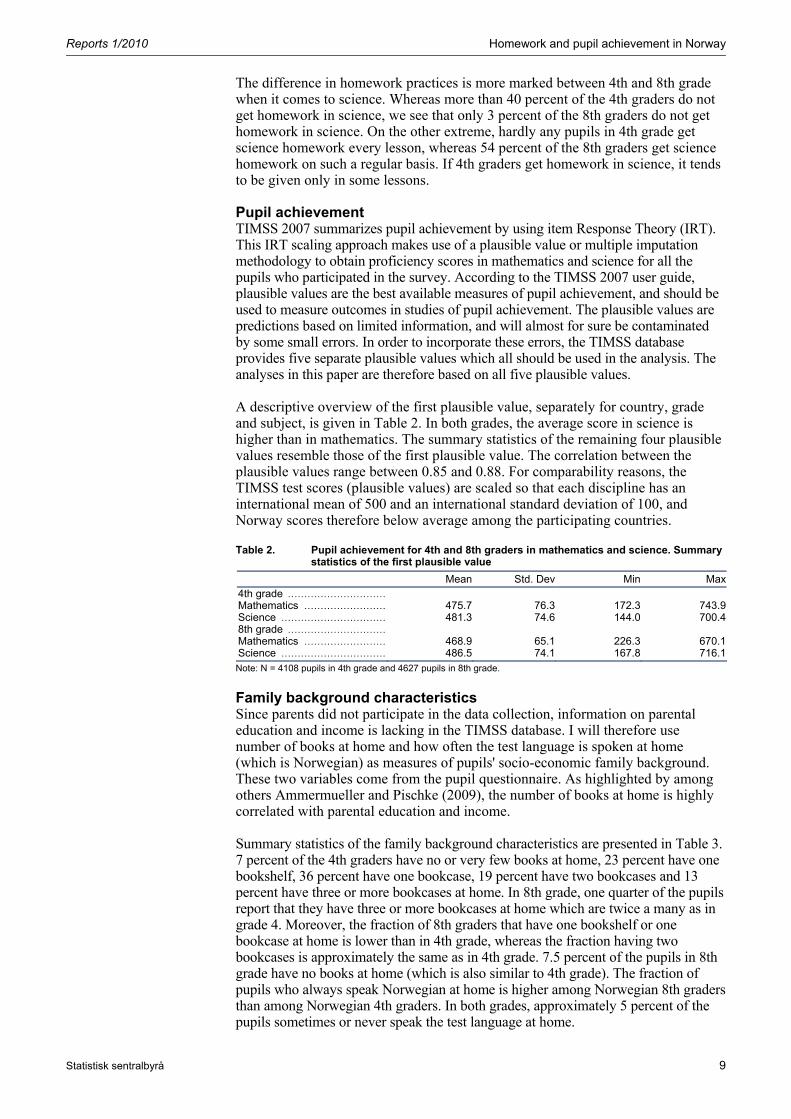
Pupil achievement TIMSS 2007 summarizes pupil achievement by using item Response Theory (IRT). This IRT scaling approach makes use of a plausible value or multiple imputation methodology to obtain proficiency scores in mathematics and science for all the pupils who participated in the survey. According to the TIMSS 2007 user guide, plausible values are the best available measures of pupil achievement, and should be used to measure outcomes in studies of pupil achievement. The plausible values are predictions based on limited information, and will almost for sure be contaminated by some small errors. In order to incorporate these errors, the TIMSS database provides five separate plausible values which all should be used in the analysis. The analyses in this paper are therefore based on all five plausible values. A descriptive overview of the first plausible value, separately for country, grade and subject, is given in Table 2. In both grades, the average score in science is higher than in mathematics. The summary statistics of the remaining four plausible values resemble those of the first plausible value. The correlation between the plausible values range between 0.85 and 0.88. For comparability reasons, the TIMSS test scores (plausible values) are scaled so that each discipline has an international mean of 500 and an international standard deviation of 100, and Norway scores therefore below average among the participating countries.
Table 2. Pupil achievement for 4th and 8th graders in mathematics and science. Summary statistics of the first plausible value
Mean Std. Dev Min Max4th grade .............................. Mathematics ......................... 475.7 76.3 172.3 743.9Science ................................ 481.3 74.6 144.0 700.48th grade .............................. Mathematics ......................... 468.9 65.1 226.3 670.1Science ................................ 486.5 74.1 167.8 716.1Note: N = 4108 pupils in 4th grade and 4627 pupils in 8th grade.
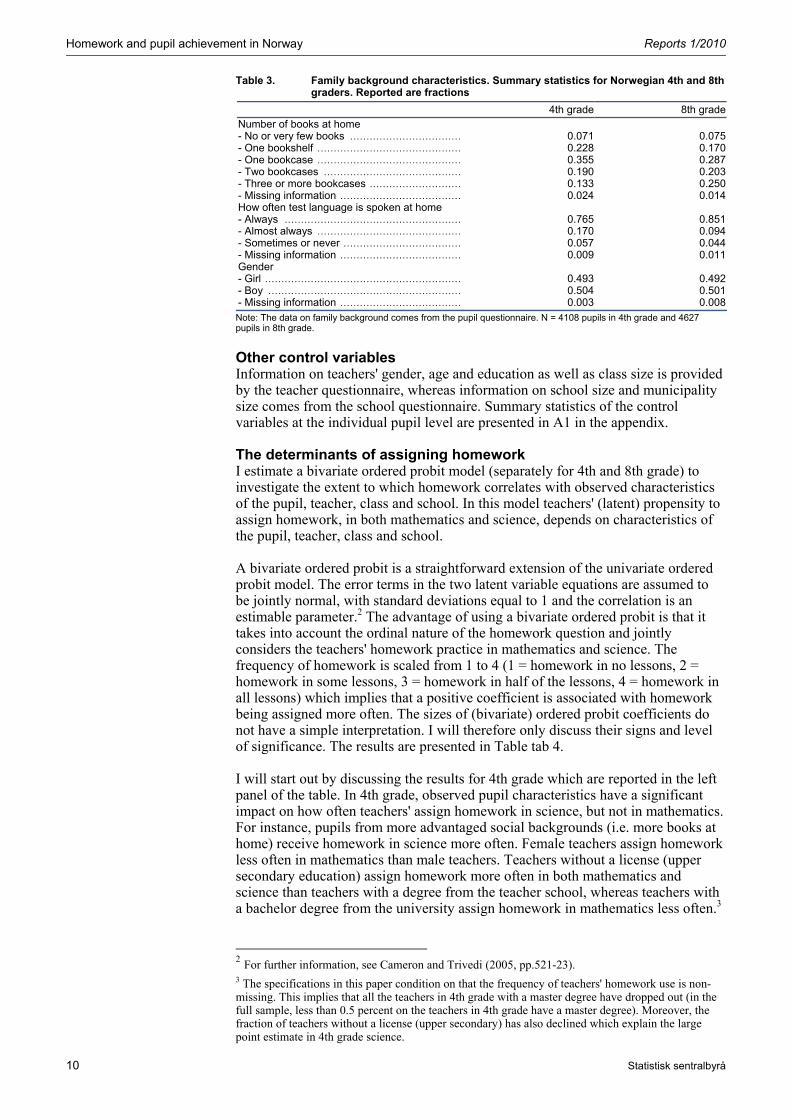
Family background characteristics Since parents did not participate in the data collection, information on parental education and income is lacking in the TIMSS database. I will therefore use number of books at home and how often the test language is spoken at home (which is Norwegian) as measures of pupils' socio-economic family background. These two variables come from the pupil questionnaire. As highlighted by among others Ammermueller and Pischke (2009), the number of books at home is highly correlated with parental education and income. Summary statistics of the family background characteristics are presented in Table 3. 7 percent of the 4th graders have no or very few books at home, 23 percent have one bookshelf, 36 percent have one bookcase, 19 percent have two bookcases and 13 percent have three or more bookcases at home. In 8th grade, one quarter of the pupils report that they have three or more bookcases at home which are twice a many as in grade 4. Moreover, the fraction of 8th graders that have one bookshelf or one bookcase at home is lower than in 4th grade, whereas the fraction having two bookcases is approximately the same as in 4th grade. 7.5 percent of the pupils in 8th grade have no books at home (which is also similar to 4th grade). The fraction of pupils who always speak Norwegian at home is higher among Norwegian 8th graders than among Norwegian 4th graders. In both grades, approximately 5 percent of the pupils sometimes or never speak the test language at home.
Homework and pupil achievement in Norway Reports 1/2010
10 Statistisk sentralbyrå
Table 3. Family background characteristics. Summary statistics for Norwegian 4th and 8th graders. Reported are fractions
4th grade 8th gradeNumber of books at home - No or very few books .................................. 0.071 0.075 - One bookshelf ............................................ 0.228 0.170- One bookcase ............................................ 0.355 0.287- Two bookcases .......................................... 0.190 0.203- Three or more bookcases ............................ 0.133 0.250- Missing information ..................................... 0.024 0.014How often test language is spoken at home - Always ...................................................... 0.765 0.851- Almost always ............................................ 0.170 0.094- Sometimes or never .................................... 0.057 0.044- Missing information ..................................... 0.009 0.011Gender - Girl ............................................................ 0.493 0.492- Boy ........................................................... 0.504 0.501- Missing information ..................................... 0.003 0.008
Note: The data on family background comes from the pupil questionnaire. N = 4108 pupils in 4th grade and 4627 pupils in 8th grade.
Other control variables Information on teachers' gender, age and education as well as class size is provided by the teacher questionnaire, whereas information on school size and municipality size comes from the school questionnaire. Summary statistics of the control variables at the individual pupil level are presented in A1 in the appendix.
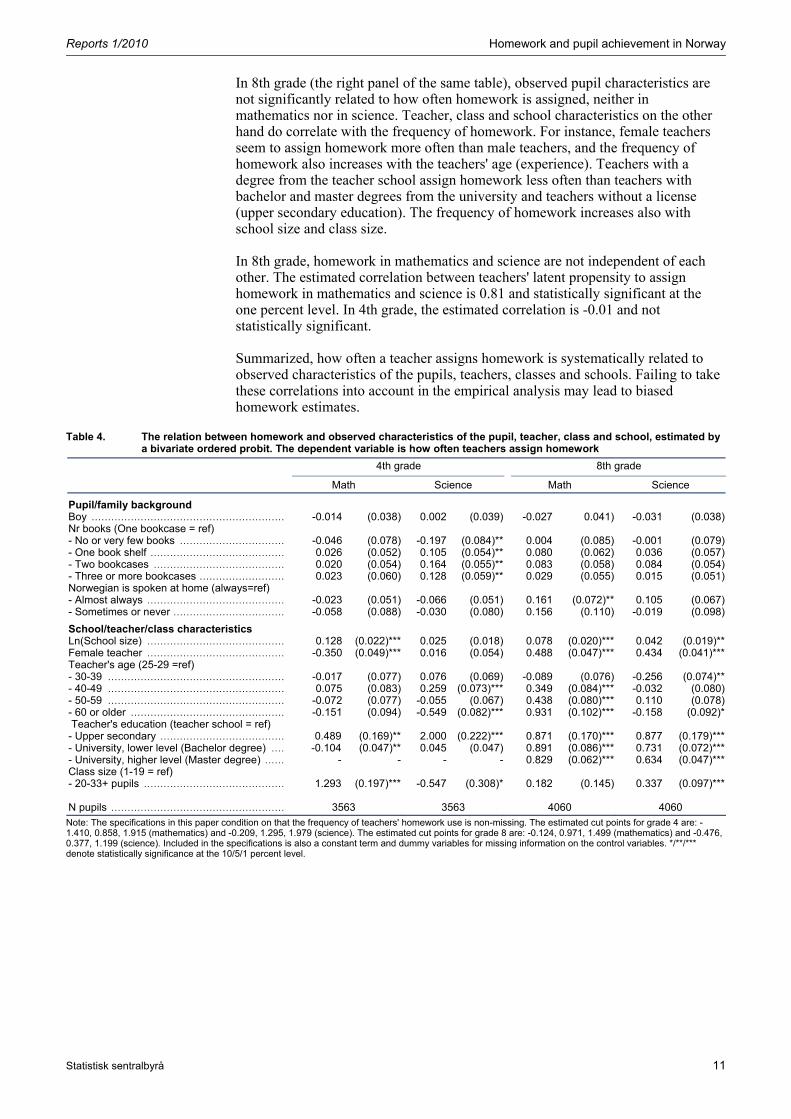
The determinants of assigning homework I estimate a bivariate ordered probit model (separately for 4th and 8th grade) to investigate the extent to which homework correlates with observed characteristics of the pupil, teacher, class and school. In this model teachers' (latent) propensity to assign homework, in both mathematics and science, depends on characteristics of the pupil, teacher, class and school. A bivariate ordered probit is a straightforward extension of the univariate ordered probit model. The error terms in the two latent variable equations are assumed to be jointly normal, with standard deviations equal to 1 and the correlation is an estimable parameter.2 The advantage of using a bivariate ordered probit is that it takes into account the ordinal nature of the homework question and jointly considers the teachers' homework practice in mathematics and science. The frequency of homework is scaled from 1 to 4 (1 = homework in no lessons, 2 = homework in some lessons, 3 = homework in half of the lessons, 4 = homework in all lessons) which implies that a positive coefficient is associated with homework being assigned more often. The sizes of (bivariate) ordered probit coefficients do not have a simple interpretation. I will therefore only discuss their signs and level of significance. The results are presented in Table tab 4. I will start out by discussing the results for 4th grade which are reported in the left panel of the table. In 4th grade, observed pupil characteristics have a significant impact on how often teachers' assign homework in science, but not in mathematics. For instance, pupils from more advantaged social backgrounds (i.e. more books at home) receive homework in science more often. Female teachers assign homework less often in mathematics than male teachers. Teachers without a license (upper secondary education) assign homework more often in both mathematics and science than teachers with a degree from the teacher school, whereas teachers with a bachelor degree from the university assign homework in mathematics less often.3
2 For further information, see Cameron and Trivedi (2005, pp.521-23). 3 The specifications in this paper condition on that the frequency of teachers' homework use is non-missing. This implies that all the teachers in 4th grade with a master degree have dropped out (in the full sample, less than 0.5 percent on the teachers in 4th grade have a master degree). Moreover, the fraction of teachers without a license (upper secondary) has also declined which explain the large point estimate in 4th grade science.
Reports 1/2010 Homework and pupil achievement in Norway
Statistisk sentralbyrå 11
In 8th grade (the right panel of the same table), observed pupil characteristics are not significantly related to how often homework is assigned, neither in mathematics nor in science. Teacher, class and school characteristics on the other hand do correlate with the frequency of homework. For instance, female teachers seem to assign homework more often than male teachers, and the frequency of homework also increases with the teachers' age (experience). Teachers with a degree from the teacher school assign homework less often than teachers with bachelor and master degrees from the university and teachers without a license (upper secondary education). The frequency of homework increases also with school size and class size. In 8th grade, homework in mathematics and science are not independent of each other. The estimated correlation between teachers' latent propensity to assign homework in mathematics and science is 0.81 and statistically significant at the one percent level. In 4th grade, the estimated correlation is -0.01 and not statistically significant. Summarized, how often a teacher assigns homework is systematically related to observed characteristics of the pupils, teachers, classes and schools. Failing to take these correlations into account in the empirical analysis may lead to biased homework estimates.
Table 4. The relation between homework and observed characteristics of the pupil, teacher, class and school, estimated by a bivariate ordered probit. The dependent variable is how often teachers assign homework
4th grade 8th grade
Math Science Math Science
Pupil/family background
Boy ........................................................... -0.014 (0.038) 0.002 (0.039) -0.027 0.041) -0.031 (0.038)Nr books (One bookcase = ref) - No or very few books ................................ -0.046 (0.078) -0.197 (0.084)** 0.004 (0.085) -0.001 (0.079)- One book shelf ......................................... 0.026 (0.052) 0.105 (0.054)** 0.080 (0.062) 0.036 (0.057)- Two bookcases ........................................ 0.020 (0.054) 0.164 (0.055)** 0.083 (0.058) 0.084 (0.054)- Three or more bookcases .......................... 0.023 (0.060) 0.128 (0.059)** 0.029 (0.055) 0.015 (0.051)Norwegian is spoken at home (always=ref) - Almost always .......................................... -0.023 (0.051) -0.066 (0.051) 0.161 (0.072)** 0.105 (0.067)- Sometimes or never .................................. -0.058 (0.088) -0.030 (0.080) 0.156 (0.110) -0.019 (0.098)
School/teacher/class characteristics
Ln(School size) .......................................... 0.128 (0.022)*** 0.025 (0.018) 0.078 (0.020)*** 0.042 (0.019)**Female teacher .......................................... -0.350 (0.049)*** 0.016 (0.054) 0.488 (0.047)*** 0.434 (0.041)***Teacher's age (25-29 =ref) - 30-39 ...................................................... -0.017 (0.077) 0.076 (0.069) -0.089 (0.076) -0.256 (0.074)**- 40-49 ...................................................... 0.075 (0.083) 0.259 (0.073)*** 0.349 (0.084)*** -0.032 (0.080)- 50-59 ...................................................... -0.072 (0.077) -0.055 (0.067) 0.438 (0.080)*** 0.110 (0.078)- 60 or older ............................................... -0.151 (0.094) -0.549 (0.082)*** 0.931 (0.102)*** -0.158 (0.092)* Teacher's education (teacher school = ref) - Upper secondary ...................................... 0.489 (0.169)** 2.000 (0.222)*** 0.871 (0.170)*** 0.877 (0.179)***- University, lower level (Bachelor degree) .... -0.104 (0.047)** 0.045 (0.047) 0.891 (0.086)*** 0.731 (0.072)***- University, higher level (Master degree) ...... - - - - 0.829 (0.062)*** 0.634 (0.047)***Class size (1-19 = ref) - 20-33+ pupils ........................................... 1.293 (0.197)*** -0.547 (0.308)* 0.182 (0.145) 0.337 (0.097)*** N pupils ..................................................... 3563 3563 4060 4060
Note: The specifications in this paper condition on that the frequency of teachers' homework use is non-missing. The estimated cut points for grade 4 are: -1.410, 0.858, 1.915 (mathematics) and -0.209, 1.295, 1.979 (science). The estimated cut points for grade 8 are: -0.124, 0.971, 1.499 (mathematics) and -0.476, 0.377, 1.199 (science). Included in the specifications is also a constant term and dummy variables for missing information on the control variables. */**/*** denote statistically significance at the 10/5/1 percent level.
Homework and pupil achievement in Norway Reports 1/2010
12 Statistisk sentralbyrå
3. Time spent on homework and family background
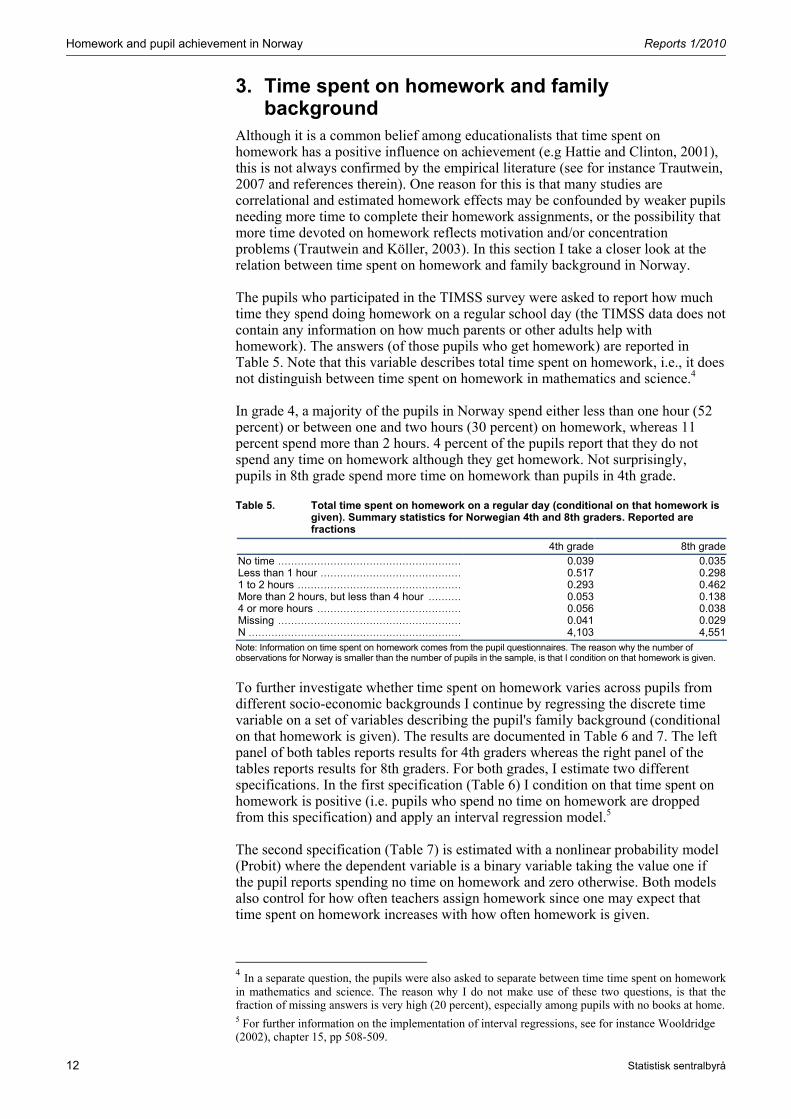
Although it is a common belief among educationalists that time spent on homework has a positive influence on achievement (e.g Hattie and Clinton, 2001), this is not always confirmed by the empirical literature (see for instance Trautwein, 2007 and references therein). One reason for this is that many studies are correlational and estimated homework effects may be confounded by weaker pupils needing more time to complete their homework assignments, or the possibility that more time devoted on homework reflects motivation and/or concentration problems (Trautwein and Köller, 2003). In this section I take a closer look at the relation between time spent on homework and family background in Norway. The pupils who participated in the TIMSS survey were asked to report how much time they spend doing homework on a regular school day (the TIMSS data does not contain any information on how much parents or other adults help with homework). The answers (of those pupils who get homework) are reported in Table 5. Note that this variable describes total time spent on homework, i.e., it does not distinguish between time spent on homework in mathematics and science.4 In grade 4, a majority of the pupils in Norway spend either less than one hour (52 percent) or between one and two hours (30 percent) on homework, whereas 11 percent spend more than 2 hours. 4 percent of the pupils report that they do not spend any time on homework although they get homework. Not surprisingly, pupils in 8th grade spend more time on homework than pupils in 4th grade.
Table 5. Total time spent on homework on a regular day (conditional on that homework is given). Summary statistics for Norwegian 4th and 8th graders. Reported are fractions
4th grade 8th gradeNo time ........................................................ 0.039 0.035 Less than 1 hour ........................................... 0.517 0.2981 to 2 hours .................................................. 0.293 0.462More than 2 hours, but less than 4 hour .......... 0.053 0.1384 or more hours ............................................ 0.056 0.038Missing ........................................................ 0.041 0.029N ................................................................. 4,103 4,551Note: Information on time spent on homework comes from the pupil questionnaires. The reason why the number of observations for Norway is smaller than the number of pupils in the sample, is that I condition on that homework is given.
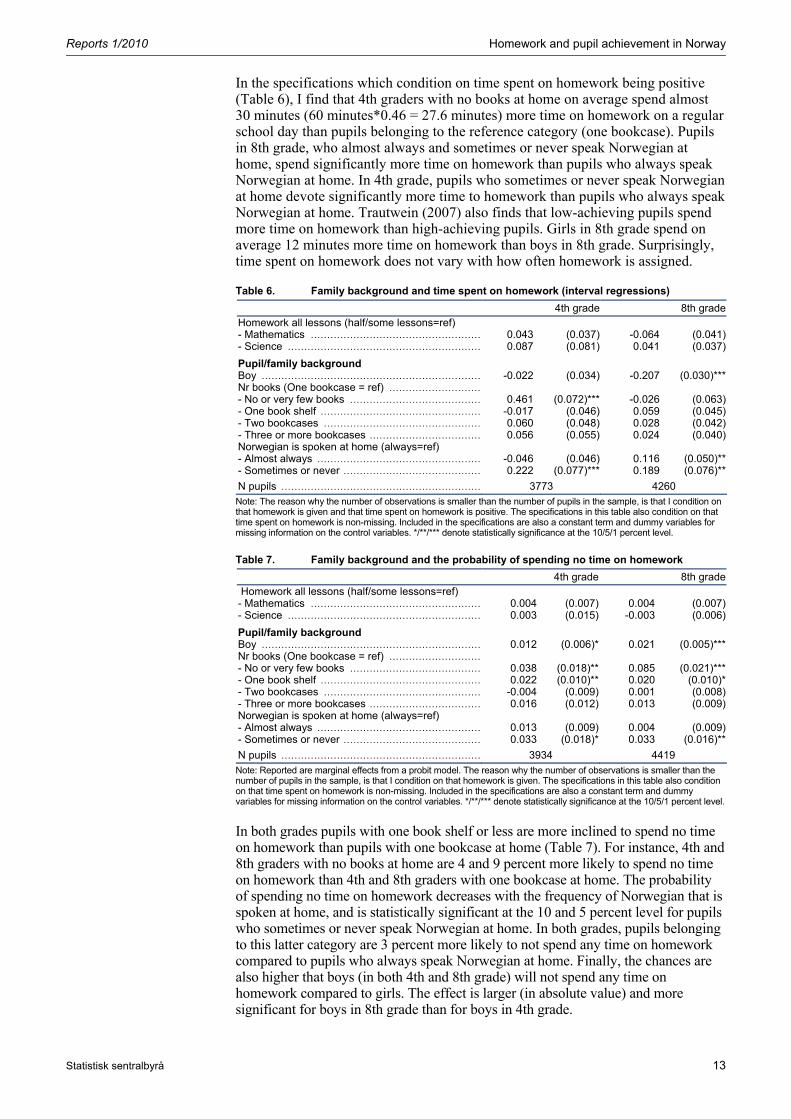
To further investigate whether time spent on homework varies across pupils from different socio-economic backgrounds I continue by regressing the discrete time variable on a set of variables describing the pupil's family background (conditional on that homework is given). The results are documented in Table 6 and 7. The left panel of both tables reports results for 4th graders whereas the right panel of the tables reports results for 8th graders. For both grades, I estimate two different specifications. In the first specification (Table 6) I condition on that time spent on homework is positive (i.e. pupils who spend no time on homework are dropped from this specification) and apply an interval regression model.5 The second specification (Table 7) is estimated with a nonlinear probability model (Probit) where the dependent variable is a binary variable taking the value one if the pupil reports spending no time on homework and zero otherwise. Both models also control for how often teachers assign homework since one may expect that time spent on homework increases with how often homework is given.
4 In a separate question, the pupils were also asked to separate between time time spent on homework in mathematics and science. The reason why I do not make use of these two questions, is that the fraction of missing answers is very high (20 percent), especially among pupils with no books at home. 5 For further information on the implementation of interval regressions, see for instance Wooldridge (2002), chapter 15, pp 508-509.
Reports 1/2010 Homework and pupil achievement in Norway
Statistisk sentralbyrå 13
In the specifications which condition on time spent on homework being positive (Table 6), I find that 4th graders with no books at home on average spend almost 30 minutes (60 minutes*0.46 = 27.6 minutes) more time on homework on a regular school day than pupils belonging to the reference category (one bookcase). Pupils in 8th grade, who almost always and sometimes or never speak Norwegian at home, spend significantly more time on homework than pupils who always speak Norwegian at home. In 4th grade, pupils who sometimes or never speak Norwegian at home devote significantly more time to homework than pupils who always speak Norwegian at home. Trautwein (2007) also finds that low-achieving pupils spend more time on homework than high-achieving pupils. Girls in 8th grade spend on average 12 minutes more time on homework than boys in 8th grade. Surprisingly, time spent on homework does not vary with how often homework is assigned.
Table 6. Family background and time spent on homework (interval regressions)
4th grade 8th gradeHomework all lessons (half/some lessons=ref) - Mathematics .................................................... 0.043 (0.037) -0.064 (0.041) - Science ........................................................... 0.087 (0.081) 0.041 (0.037)
Pupil/family background
Boy ................................................................... -0.022 (0.034) -0.207 (0.030)***Nr books (One bookcase = ref) ............................ - No or very few books ........................................ 0.461 (0.072)*** -0.026 (0.063)- One book shelf ................................................. -0.017 (0.046) 0.059 (0.045)- Two bookcases ................................................ 0.060 (0.048) 0.028 (0.042)- Three or more bookcases .................................. 0.056 (0.055) 0.024 (0.040) Norwegian is spoken at home (always=ref) - Almost always .................................................. -0.046 (0.046) 0.116 (0.050)** - Sometimes or never .......................................... 0.222 (0.077)*** 0.189 (0.076)**
N pupils ............................................................. 3773 4260 Note: The reason why the number of observations is smaller than the number of pupils in the sample, is that I condition on that homework is given and that time spent on homework is positive. The specifications in this table also condition on that time spent on homework is non-missing. Included in the specifications are also a constant term and dummy variables for missing information on the control variables. */**/*** denote statistically significance at the 10/5/1 percent level.
Table 7. Family background and the probability of spending no time on homework
4th grade 8th grade Homework all lessons (half/some lessons=ref) - Mathematics .................................................... 0.004 (0.007) 0.004 (0.007) - Science ........................................................... 0.003 (0.015) -0.003 (0.006)
Pupil/family background
Boy ................................................................... 0.012 (0.006)* 0.021 (0.005)***Nr books (One bookcase = ref) ............................ - No or very few books ........................................ 0.038 (0.018)** 0.085 (0.021)***- One book shelf ................................................. 0.022 (0.010)** 0.020 (0.010)* - Two bookcases ................................................ -0.004 (0.009) 0.001 (0.008)- Three or more bookcases .................................. 0.016 (0.012) 0.013 (0.009) Norwegian is spoken at home (always=ref) - Almost always .................................................. 0.013 (0.009) 0.004 (0.009)- Sometimes or never .......................................... 0.033 (0.018)* 0.033 (0.016)**
N pupils ............................................................. 3934 4419 Note: Reported are marginal effects from a probit model. The reason why the number of observations is smaller than the number of pupils in the sample, is that I condition on that homework is given. The specifications in this table also condition on that time spent on homework is non-missing. Included in the specifications are also a constant term and dummy variables for missing information on the control variables. */**/*** denote statistically significance at the 10/5/1 percent level.
In both grades pupils with one book shelf or less are more inclined to spend no time on homework than pupils with one bookcase at home (Table 7). For instance, 4th and 8th graders with no books at home are 4 and 9 percent more likely to spend no time on homework than 4th and 8th graders with one bookcase at home. The probability of spending no time on homework decreases with the frequency of Norwegian that is spoken at home, and is statistically significant at the 10 and 5 percent level for pupils who sometimes or never speak Norwegian at home. In both grades, pupils belonging to this latter category are 3 percent more likely to not spend any time on homework compared to pupils who always speak Norwegian at home. Finally, the chances are also higher that boys (in both 4th and 8th grade) will not spend any time on homework compared to girls. The effect is larger (in absolute value) and more significant for boys in 8th grade than for boys in 4th grade.
Homework and pupil achievement in Norway Reports 1/2010
14 Statistisk sentralbyrå
4. Empirical approach This section explains how to empirically investigate the effect of homework on pupil achievement, and whether this effect varies across gender and pupils belonging to different socio-economic backgrounds.
4.1. OLS I start out by assuming that the effect of homework on pupil achievement in mathematics and science can be explained by the following education production functions: (1) yim = Xiβxm + Zjkβzm +HWjkmβmm+ HWjksβsm + eijkm (2) yis = Xiβxs + Zjkβzs +HWjksβss +HWjkmβms + vijks where yim and yis measure the achievement of pupil i in mathematics and science. Xi is a vector consisting of family background characteristics, Zjk is a vector of characteristics of the teacher (j) and class (k). βxm and βxs are the effects of Xi on yim and yis. And βzm and βzs and are the effects of Zjk on yim and yis. HWjkm and HWjks are measures of homework in mathematics and science. As indicated by the equations, I allow for potential spillover effects of homework, i.e., homework in science may have an impact on the achievement in mathematics and vice versa. Βmm and βsm are the effects of homework in mathematics and science on the achievement in mathematics, whereas Βss and βms and are the effects of homework in science and mathematics on the achievement in science.6 How homework in mathematics and science are measured varies however across subjects and grades due to differences in teachers' homework practice across grades and subjects. Nearly all pupils in 4th grade get homework in mathematics, and almost all pupils in 8th grade get homework in both mathematics and science. However, as indicated by Table 1, there is substantial variation in how often homework is given. In 4th grade, about 50 percent of pupils get homework in science. And among those 4th graders who get homework in science, almost all of them get it in only some lessons. As a measure of homework in mathematics in 4th grade and mathematics and science in 8th grade, I use a dummy variable which equals one 1 if the pupil gets homework in all lessons, and zero if homework is given in half/some/no lessons (pooling these three categories does not matter for the results). Homework in science in 4th grade is measured as a dummy variable taking the value 1 if homework is given and 0 if homework is not given. The central problem I face when estimating equation (1) and (2) by ordinary least squares (OLS) is that the estimates of the homework effect may be contaminated by omitted variables such as the influence of unmeasured class and teacher characteristics. Consequently, I must be careful with giving the point estimates of homework in Equations (1) and (2) a causal interpretation. Note that the sign of the bias is not clear a priori. If high-performing classes get more homework than low-performing classes (to do even better), the effect of homework will be overestimated. If low-performing classes get more homework than high-performing classes (to make up for poor learning environments), the effect of homework will be underestimated. Poor teachers may also use homework to compensate for the lack of teaching skills, which will lead to a downward bias in the homework coefficient. If high-skilled teachers use homework to achieve ambitious goals, the homework estimate is upward biased. How these correlations
6 In the presence of potential (classical) measurement errors in the teachers' homework practice the estimated βmm, βsm, βss and βms are underestimated.
Reports 1/2010 Homework and pupil achievement in Norway
Statistisk sentralbyrå 15
net out is unclear. Because in my sample homework is measured at the class/teacher level, I can rule out correlations between homework and unobserved individual pupil effects conditional on a class/teacher-fixed effect. A standard way to solve these problems would be to include teacher (ηj) and class (μk) fixed-effects as done in Equation (3) and (4). (3) yim = Xiβxm + Zjkβzm +HWjkmβmm+ HWjksβsm + ηj + μk + eijkm (4) yis = Xiβxs + Zjkβzs +HWjksβss +HWjkmβms + ηj + μk + vijks Unfortunately (ηj) and (μk) cannot be identified when estimating these two equations separately. The remainder of this section is therefore concerned with how to come closer to estimating a causal effect of homework.
4.2. First difference approach I will from now on rely on those pupils who have the same peers and teacher in mathematics and science. This involves a reduction in the sample of 4th graders from 4108 to 3879 in 4th grade. The estimation approach described below cannot be implemented for 8th graders due to lack of variation in the homework question when condition on that the pupils have the same teacher in mathematics and science. The advantaged of this sample is that all the unobserved components arguably will drop out when taking the within pupil differences in test scores in mathematics and science. This can easily be seen by subtracting Equation (4) from Equation (3) which gives the following specification: (5) Δyi = Xiα1 + Zjkα2 + HWjkmαm +HWjksαs + uijkms In this equation, αm > 0 involves that, everything else equal, a pupil who get homework in mathematics in all lessons perform better in mathematics than in science compared to a pupil who get homework in mathematics less often. αs < 0
implies that, everything else equal, a pupil who get homework in science perform better in science than in mathematics compared to a pupil who does not get homework in science.7 Since one of the aims of this analysis is to investigate whether the effect of homework differs across gender and pupils from different socio-economic backgrounds, I will also include an interaction term between homework and pupils with no books at home and an interaction term between homework and boys. Although first difference estimation improves on OLS, there may still be problems related to omitted variables. One example in place is unobserved subject effects and unobserved characteristics of the teacher and class which may vary across mathematics and science. Although, the pupils in this sample have the same teacher in these two subjects, it may still be the case that this teacher is better qualified to teach mathematics than science and consequently assigns more homework in mathematics than in science. Such situations, and similar ones, are not controlled for in Equation (5). Thus, one must also be cautious when interpreting the first difference coefficients. In the empirical analysis, I will regress homework (and other control variables) on each of the five plausible values separately, and then calculate the average of these coefficients. This is my final estimate which is reported in the result section. Standard errors were calculated using bootstrapping.
7 Δyi = yim – yis , α1 = (β1m- β1s), α2 = (β2m- β2s), αm = (βmm- βms), αs = (βsm- βss) and uijkms = eijkm - vijks
Homework and pupil achievement in Norway Reports 1/2010
16 Statistisk sentralbyrå
5. Results
5.1. OLS
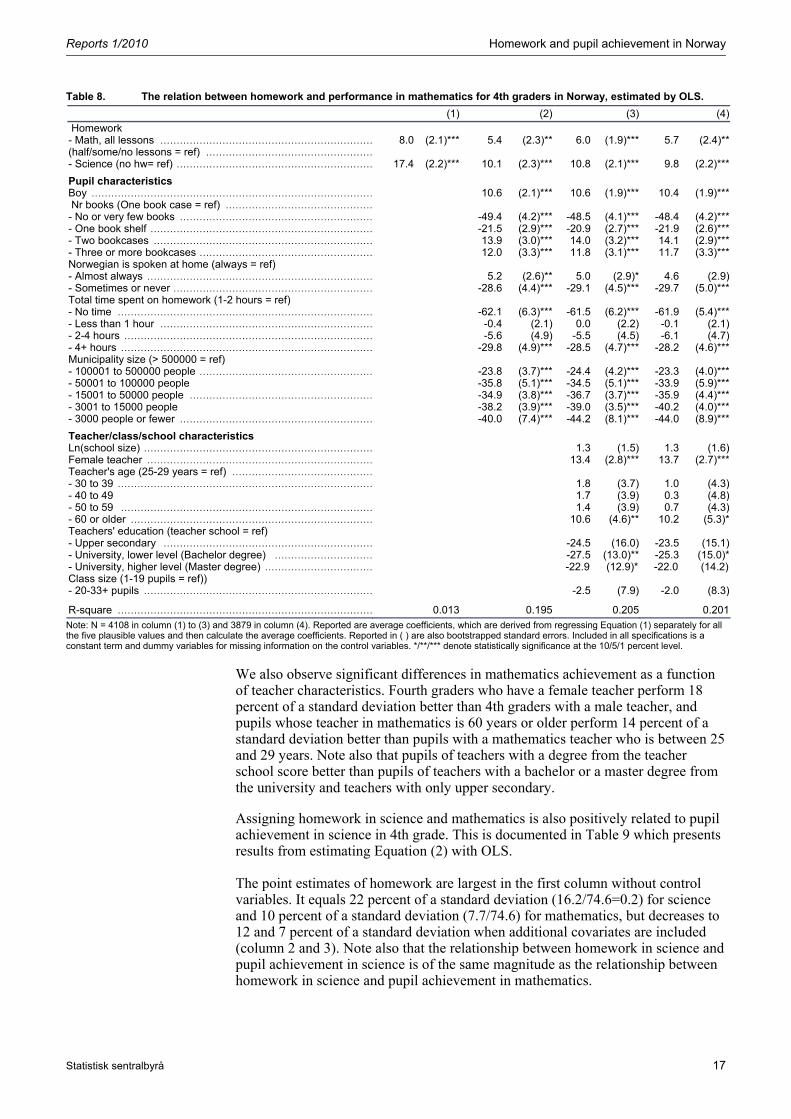
4th grade Obtained results for 4th grade from estimating Equation (1) with OLS are presented in Table 8. Each column represents one specification. These specifications differ from each other in number of control variables that are included (in addition to homework). In the first specification in Table 8, which does not include any control variables, the point estimate of homework in mathematics is 8.0 (or 11 percent of a standard deviation (8.0/76.3=0.105) and statistically significant at the one percent level. This means that 4th grade pupils who get homework in mathematics in all lessons score on average 8 points higher on the mathematics test than pupils who get homework in mathematics in half/some/no lessons. Getting homework in science is also positively correlated with achievement in mathematics. Moreover the size of this point estimate is 22 percent of a standard deviation, and hence substantially larger than the one for mathematics. The estimates in the first column are simply raw test score differences between those who get homework (as defined by our homework variables) and those who do not. We saw above that homework systematically varies with student background and teacher, class and school characteristics. At a minimum one would like to controls for these observed factors, which is what I do in columns (2) and (3). When controlling for family background characteristics and gender (column 2) and school, teacher and class characteristics (column 3) the homework coefficients in both mathematics and science decline to approximately 8 (mathematics) and 13 (science) percent of a standard deviation, but are still statistically significant at the one percent level. The homework estimates are unchanged when reducing the sample to those pupils who will be used in the first difference approach (column (4)) (the results from this identification method will be presented later in this section). Although not the focus of the analysis, it is interesting to briefly discuss the size and sign of the remaining control variables. As often found, boys perform significantly better than girls in mathematics (13 percent of a standard deviation). We observe substantial achievement differences with respect to socio-economic background. Achievement increases with the number of books at home, and how often Norwegian is spoken at home. For instance, pupils in 4th grade with no books at home perform about 63 percent of a standard deviation worse than pupils with one bookcase at home. And pupils who sometimes or never speak Norwegian at home perform 38 percent of a standard deviation worse than pupils who always speak Norwegian at home. Note also that pupils living in municipalities with more than half a million inhabitants (Oslo) perform significantly better than pupils in smaller municipalities. This finding is therefore in accordance with previous research done for Norway (see for instance Bonesrønning and Iversen, 2008). The relationship between time spent on homework and achievement in mathematics confirms the findings in Table 6 and 7. Those pupils who spend no time on homework and those who spend more than 4 hours on homework perform significantly lower than pupils who spend between 1 and 2 hours on homework.8
8 Time spent on homework is endogenous. Moreover OLS now estimates the effect of homework while keeping constant time spent on homework. In this view one should not include time spent on homework in the control variables in the empirical analysis. In a specification which does not include time spent on homework, the point estimates of homework in Table 8 and 9 are however unaltered.
Reports 1/2010 Homework and pupil achievement in Norway
Statistisk sentralbyrå 17
Table 8. The relation between homework and performance in mathematics for 4th graders in Norway, estimated by OLS.
(1) (2) (3) (4) Homework - Math, all lessons ................................................................. 8.0 (2.1)*** 5.4 (2.3)** 6.0 (1.9)*** 5.7 (2.4)**(half/some/no lessons = ref) ................................................... - Science (no hw= ref) ............................................................ 17.4 (2.2)*** 10.1 (2.3)*** 10.8 (2.1)*** 9.8 (2.2)***
Pupil characteristics
Boy ...................................................................................... 10.6 (2.1)*** 10.6 (1.9)*** 10.4 (1.9)*** Nr books (One book case = ref) ............................................. - No or very few books ........................................................... -49.4 (4.2)*** -48.5 (4.1)*** -48.4 (4.2)***- One book shelf .................................................................... -21.5 (2.9)*** -20.9 (2.7)*** -21.9 (2.6)***- Two bookcases ................................................................... 13.9 (3.0)*** 14.0 (3.2)*** 14.1 (2.9)***- Three or more bookcases ..................................................... 12.0 (3.3)*** 11.8 (3.1)*** 11.7 (3.3)***Norwegian is spoken at home (always = ref) - Almost always ..................................................................... 5.2 (2.6)** 5.0 (2.9)* 4.6 (2.9) - Sometimes or never ............................................................. -28.6 (4.4)*** -29.1 (4.5)*** -29.7 (5.0)***Total time spent on homework (1-2 hours = ref) - No time .............................................................................. -62.1 (6.3)*** -61.5 (6.2)*** -61.9 (5.4)***- Less than 1 hour ................................................................. -0.4 (2.1) 0.0 (2.2) -0.1 (2.1) - 2-4 hours ............................................................................ -5.6 (4.9) -5.5 (4.5) -6.1 (4.7) - 4+ hours ............................................................................. -29.8 (4.9)*** -28.5 (4.7)*** -28.2 (4.6)***Municipality size (> 500000 = ref) - 100001 to 500000 people ..................................................... -23.8 (3.7)*** -24.4 (4.2)*** -23.3 (4.0)***- 50001 to 100000 people -35.8 (5.1)*** -34.5 (5.1)*** -33.9 (5.9)***- 15001 to 50000 people ........................................................ -34.9 (3.8)*** -36.7 (3.7)*** -35.9 (4.4)***- 3001 to 15000 people -38.2 (3.9)*** -39.0 (3.5)*** -40.2 (4.0)***- 3000 people or fewer ........................................................... -40.0 (7.4)*** -44.2 (8.1)*** -44.0 (8.9)***
Teacher/class/school characteristics
Ln(school size) ...................................................................... 1.3 (1.5) 1.3 (1.6) Female teacher ..................................................................... 13.4 (2.8)*** 13.7 (2.7)***Teacher's age (25-29 years = ref) ........................................... - 30 to 39 .............................................................................. 1.8 (3.7) 1.0 (4.3)- 40 to 49 1.7 (3.9) 0.3 (4.8)- 50 to 59 ............................................................................. 1.4 (3.9) 0.7 (4.3)- 60 or older .......................................................................... 10.6 (4.6)** 10.2 (5.3)*Teachers' education (teacher school = ref) - Upper secondary ................................................................ -24.5 (16.0) -23.5 (15.1)- University, lower level (Bachelor degree) .............................. -27.5 (13.0)** -25.3 (15.0)*- University, higher level (Master degree) ................................. -22.9 (12.9)* -22.0 (14.2)Class size (1-19 pupils = ref)) - 20-33+ pupils ...................................................................... -2.5 (7.9) -2.0 (8.3)
R-square .............................................................................. 0.013 0.195 0.205 0.201Note: N = 4108 in column (1) to (3) and 3879 in column (4). Reported are average coefficients, which are derived from regressing Equation (1) separately for all the five plausible values and then calculate the average coefficients. Reported in ( ) are also bootstrapped standard errors. Included in all specifications is a constant term and dummy variables for missing information on the control variables. */**/*** denote statistically significance at the 10/5/1 percent level.
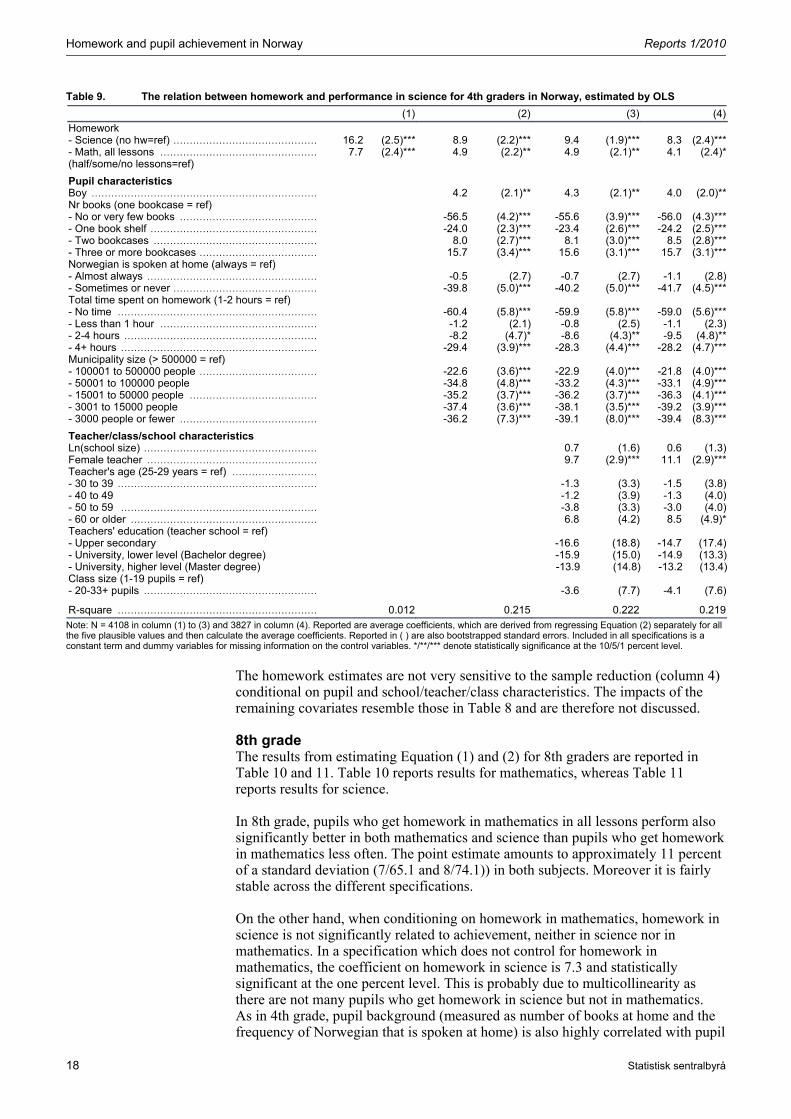
We also observe significant differences in mathematics achievement as a function of teacher characteristics. Fourth graders who have a female teacher perform 18 percent of a standard deviation better than 4th graders with a male teacher, and pupils whose teacher in mathematics is 60 years or older perform 14 percent of a standard deviation better than pupils with a mathematics teacher who is between 25 and 29 years. Note also that pupils of teachers with a degree from the teacher school score better than pupils of teachers with a bachelor or a master degree from the university and teachers with only upper secondary. Assigning homework in science and mathematics is also positively related to pupil achievement in science in 4th grade. This is documented in Table 9 which presents results from estimating Equation (2) with OLS. The point estimates of homework are largest in the first column without control variables. It equals 22 percent of a standard deviation (16.2/74.6=0.2) for science and 10 percent of a standard deviation (7.7/74.6) for mathematics, but decreases to 12 and 7 percent of a standard deviation when additional covariates are included (column 2 and 3). Note also that the relationship between homework in science and pupil achievement in science is of the same magnitude as the relationship between homework in science and pupil achievement in mathematics.
Homework and pupil achievement in Norway Reports 1/2010
18 Statistisk sentralbyrå
Table 9. The relation between homework and performance in science for 4th graders in Norway, estimated by OLS
(1) (2) (3) (4)Homework - Science (no hw=ref) ............................................ 16.2 (2.5)*** 8.9 (2.2)*** 9.4 (1.9)*** 8.3 (2.4)***- Math, all lessons ................................................ 7.7 (2.4)*** 4.9 (2.2)** 4.9 (2.1)** 4.1 (2.4)*(half/some/no lessons=ref)
Pupil characteristics
Boy ..................................................................... 4.2 (2.1)** 4.3 (2.1)** 4.0 (2.0)**Nr books (one bookcase = ref) - No or very few books .......................................... -56.5 (4.2)*** -55.6 (3.9)*** -56.0 (4.3)***- One book shelf ................................................... -24.0 (2.3)*** -23.4 (2.6)*** -24.2 (2.5)***- Two bookcases .................................................. 8.0 (2.7)*** 8.1 (3.0)*** 8.5 (2.8)***- Three or more bookcases .................................... 15.7 (3.4)*** 15.6 (3.1)*** 15.7 (3.1)***Norwegian is spoken at home (always = ref) - Almost always .................................................... -0.5 (2.7) -0.7 (2.7) -1.1 (2.8) - Sometimes or never ............................................ -39.8 (5.0)*** -40.2 (5.0)*** -41.7 (4.5)***Total time spent on homework (1-2 hours = ref) - No time ............................................................. -60.4 (5.8)*** -59.9 (5.8)*** -59.0 (5.6)***- Less than 1 hour ................................................ -1.2 (2.1) -0.8 (2.5) -1.1 (2.3) - 2-4 hours ........................................................... -8.2 (4.7)* -8.6 (4.3)** -9.5 (4.8)** - 4+ hours ............................................................ -29.4 (3.9)*** -28.3 (4.4)*** -28.2 (4.7)***Municipality size (> 500000 = ref) - 100001 to 500000 people .................................... -22.6 (3.6)*** -22.9 (4.0)*** -21.8 (4.0)***- 50001 to 100000 people -34.8 (4.8)*** -33.2 (4.3)*** -33.1 (4.9)***- 15001 to 50000 people ....................................... -35.2 (3.7)*** -36.2 (3.7)*** -36.3 (4.1)***- 3001 to 15000 people -37.4 (3.6)*** -38.1 (3.5)*** -39.2 (3.9)***- 3000 people or fewer .......................................... -36.2 (7.3)*** -39.1 (8.0)*** -39.4 (8.3)***
Teacher/class/school characteristics
Ln(school size) ..................................................... 0.7 (1.6) 0.6 (1.3) Female teacher .................................................... 9.7 (2.9)*** 11.1 (2.9)***Teacher's age (25-29 years = ref) .......................... - 30 to 39 ............................................................. -1.3 (3.3) -1.5 (3.8)- 40 to 49 -1.2 (3.9) -1.3 (4.0)- 50 to 59 ............................................................ -3.8 (3.3) -3.0 (4.0)- 60 or older ......................................................... 6.8 (4.2) 8.5 (4.9)*Teachers' education (teacher school = ref) - Upper secondary -16.6 (18.8) -14.7 (17.4)- University, lower level (Bachelor degree) -15.9 (15.0) -14.9 (13.3)- University, higher level (Master degree) -13.9 (14.8) -13.2 (13.4)Class size (1-19 pupils = ref) - 20-33+ pupils ..................................................... -3.6 (7.7) -4.1 (7.6)
R-square ............................................................. 0.012 0.215 0.222 0.219Note: N = 4108 in column (1) to (3) and 3827 in column (4). Reported are average coefficients, which are derived from regressing Equation (2) separately for all the five plausible values and then calculate the average coefficients. Reported in ( ) are also bootstrapped standard errors. Included in all specifications is a constant term and dummy variables for missing information on the control variables. */**/*** denote statistically significance at the 10/5/1 percent level.
The homework estimates are not very sensitive to the sample reduction (column 4) conditional on pupil and school/teacher/class characteristics. The impacts of the remaining covariates resemble those in Table 8 and are therefore not discussed.
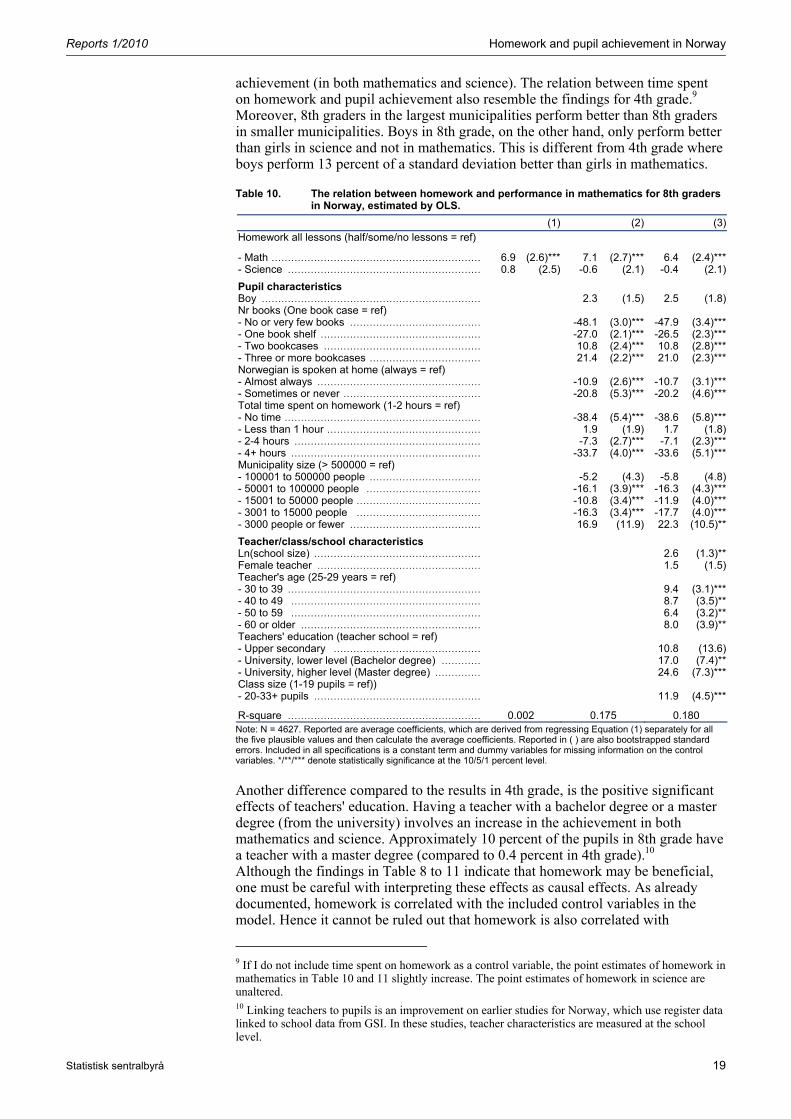
8th grade The results from estimating Equation (1) and (2) for 8th graders are reported in Table 10 and 11. Table 10 reports results for mathematics, whereas Table 11 reports results for science. In 8th grade, pupils who get homework in mathematics in all lessons perform also significantly better in both mathematics and science than pupils who get homework in mathematics less often. The point estimate amounts to approximately 11 percent of a standard deviation (7/65.1 and 8/74.1)) in both subjects. Moreover it is fairly stable across the different specifications. On the other hand, when conditioning on homework in mathematics, homework in science is not significantly related to achievement, neither in science nor in mathematics. In a specification which does not control for homework in mathematics, the coefficient on homework in science is 7.3 and statistically significant at the one percent level. This is probably due to multicollinearity as there are not many pupils who get homework in science but not in mathematics. As in 4th grade, pupil background (measured as number of books at home and the frequency of Norwegian that is spoken at home) is also highly correlated with pupil
Reports 1/2010 Homework and pupil achievement in Norway
Statistisk sentralbyrå 19
achievement (in both mathematics and science). The relation between time spent on homework and pupil achievement also resemble the findings for 4th grade.9 Moreover, 8th graders in the largest municipalities perform better than 8th graders in smaller municipalities. Boys in 8th grade, on the other hand, only perform better than girls in science and not in mathematics. This is different from 4th grade where boys perform 13 percent of a standard deviation better than girls in mathematics.
Table 10. The relation between homework and performance in mathematics for 8th graders in Norway, estimated by OLS.
(1) (2) (3)Homework all lessons (half/some/no lessons = ref) - Math ................................................................ 6.9 (2.6)*** 7.1 (2.7)*** 6.4 (2.4)***- Science ........................................................... 0.8 (2.5) -0.6 (2.1) -0.4 (2.1)
Pupil characteristics
Boy ................................................................... 2.3 (1.5) 2.5 (1.8)Nr books (One book case = ref) - No or very few books ........................................ -48.1 (3.0)*** -47.9 (3.4)***- One book shelf ................................................. -27.0 (2.1)*** -26.5 (2.3)***- Two bookcases ................................................ 10.8 (2.4)*** 10.8 (2.8)***- Three or more bookcases .................................. 21.4 (2.2)*** 21.0 (2.3)***Norwegian is spoken at home (always = ref) - Almost always .................................................. -10.9 (2.6)*** -10.7 (3.1)***- Sometimes or never .......................................... -20.8 (5.3)*** -20.2 (4.6)***Total time spent on homework (1-2 hours = ref) - No time ............................................................ -38.4 (5.4)*** -38.6 (5.8)***- Less than 1 hour ............................................... 1.9 (1.9) 1.7 (1.8)- 2-4 hours ......................................................... -7.3 (2.7)*** -7.1 (2.3)***- 4+ hours .......................................................... -33.7 (4.0)*** -33.6 (5.1)***Municipality size (> 500000 = ref) - 100001 to 500000 people .................................. -5.2 (4.3) -5.8 (4.8)- 50001 to 100000 people ................................... -16.1 (3.9)*** -16.3 (4.3)***- 15001 to 50000 people ...................................... -10.8 (3.4)*** -11.9 (4.0)***- 3001 to 15000 people ...................................... -16.3 (3.4)*** -17.7 (4.0)***- 3000 people or fewer ........................................ 16.9 (11.9) 22.3 (10.5)**
Teacher/class/school characteristics
Ln(school size) ................................................... 2.6 (1.3)**Female teacher .................................................. 1.5 (1.5)Teacher's age (25-29 years = ref) - 30 to 39 ........................................................... 9.4 (3.1)***- 40 to 49 .......................................................... 8.7 (3.5)**- 50 to 59 .......................................................... 6.4 (3.2)**- 60 or older ....................................................... 8.0 (3.9)**Teachers' education (teacher school = ref) - Upper secondary ............................................. 10.8 (13.6)- University, lower level (Bachelor degree) ............ 17.0 (7.4)**- University, higher level (Master degree) .............. 24.6 (7.3)***Class size (1-19 pupils = ref)) - 20-33+ pupils ................................................... 11.9 (4.5)***
R-square ........................................................... 0.002 0.175 0.180 Note: N = 4627. Reported are average coefficients, which are derived from regressing Equation (1) separately for all the five plausible values and then calculate the average coefficients. Reported in ( ) are also bootstrapped standard errors. Included in all specifications is a constant term and dummy variables for missing information on the control variables. */**/*** denote statistically significance at the 10/5/1 percent level.
Another difference compared to the results in 4th grade, is the positive significant effects of teachers' education. Having a teacher with a bachelor degree or a master degree (from the university) involves an increase in the achievement in both mathematics and science. Approximately 10 percent of the pupils in 8th grade have a teacher with a master degree (compared to 0.4 percent in 4th grade).10 Although the findings in Table 8 to 11 indicate that homework may be beneficial, one must be careful with interpreting these effects as causal effects. As already documented, homework is correlated with the included control variables in the model. Hence it cannot be ruled out that homework is also correlated with
9 If I do not include time spent on homework as a control variable, the point estimates of homework in mathematics in Table 10 and 11 slightly increase. The point estimates of homework in science are unaltered. 10 Linking teachers to pupils is an improvement on earlier studies for Norway, which use register data linked to school data from GSI. In these studies, teacher characteristics are measured at the school level.
Homework and pupil achievement in Norway Reports 1/2010
20 Statistisk sentralbyrå
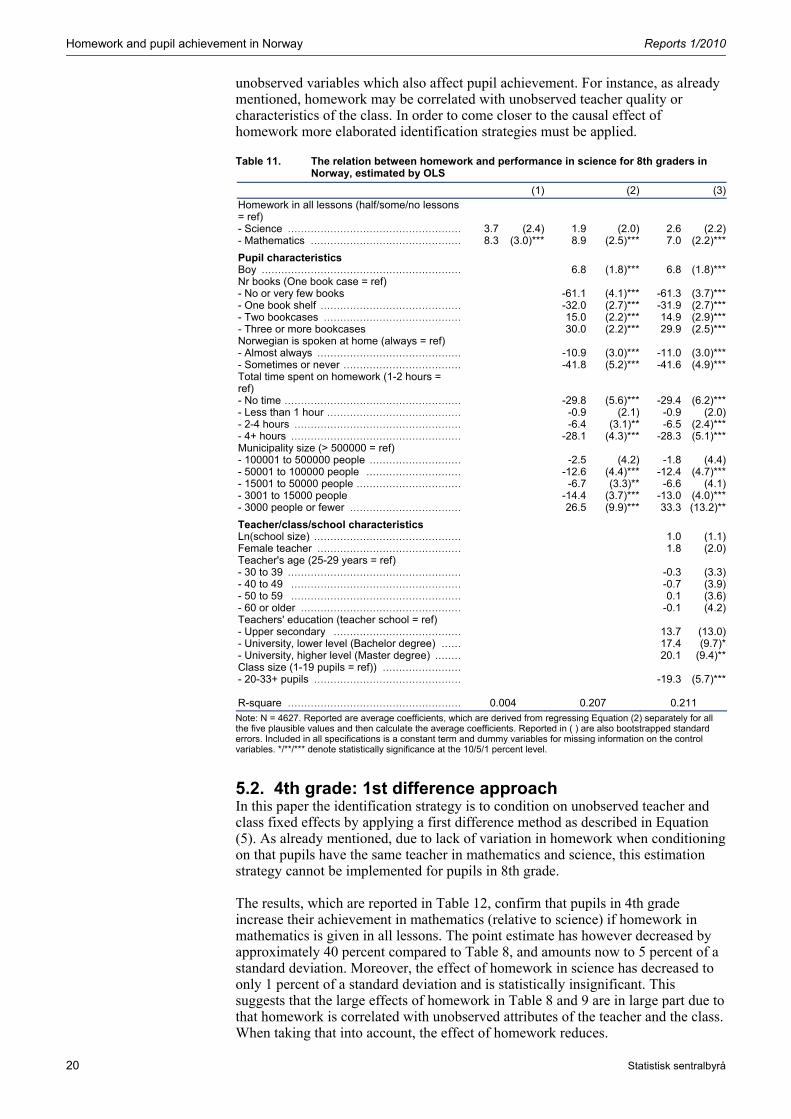
unobserved variables which also affect pupil achievement. For instance, as already mentioned, homework may be correlated with unobserved teacher quality or characteristics of the class. In order to come closer to the causal effect of homework more elaborated identification strategies must be applied.
Table 11. The relation between homework and performance in science for 8th graders in Norway, estimated by OLS
(1) (2) (3)Homework in all lessons (half/some/no lessons = ref)
- Science ..................................................... 3.7 (2.4) 1.9 (2.0) 2.6 (2.2)- Mathematics .............................................. 8.3 (3.0)*** 8.9 (2.5)*** 7.0 (2.2)***
Pupil characteristics
Boy ............................................................. 6.8 (1.8)*** 6.8 (1.8)***Nr books (One book case = ref) - No or very few books -61.1 (4.1)*** -61.3 (3.7)***- One book shelf ........................................... -32.0 (2.7)*** -31.9 (2.7)***- Two bookcases .......................................... 15.0 (2.2)*** 14.9 (2.9)***- Three or more bookcases 30.0 (2.2)*** 29.9 (2.5)***Norwegian is spoken at home (always = ref) - Almost always ............................................ -10.9 (3.0)*** -11.0 (3.0)***- Sometimes or never .................................... -41.8 (5.2)*** -41.6 (4.9)***Total time spent on homework (1-2 hours = ref)
- No time ...................................................... -29.8 (5.6)*** -29.4 (6.2)***- Less than 1 hour ......................................... -0.9 (2.1) -0.9 (2.0)- 2-4 hours ................................................... -6.4 (3.1)** -6.5 (2.4)***- 4+ hours .................................................... -28.1 (4.3)*** -28.3 (5.1)***Municipality size (> 500000 = ref) - 100001 to 500000 people ............................ -2.5 (4.2) -1.8 (4.4)- 50001 to 100000 people ............................. -12.6 (4.4)*** -12.4 (4.7)***- 15001 to 50000 people ................................ -6.7 (3.3)** -6.6 (4.1)- 3001 to 15000 people -14.4 (3.7)*** -13.0 (4.0)***- 3000 people or fewer .................................. 26.5 (9.9)*** 33.3 (13.2)**
Teacher/class/school characteristics
Ln(school size) ............................................. 1.0 (1.1)Female teacher ............................................ 1.8 (2.0)Teacher's age (25-29 years = ref) - 30 to 39 ..................................................... -0.3 (3.3)- 40 to 49 .................................................... -0.7 (3.9)- 50 to 59 .................................................... 0.1 (3.6)- 60 or older ................................................. -0.1 (4.2)Teachers' education (teacher school = ref) - Upper secondary ....................................... 13.7 (13.0)- University, lower level (Bachelor degree) ...... 17.4 (9.7)*- University, higher level (Master degree) ........ 20.1 (9.4)**Class size (1-19 pupils = ref)) ........................ - 20-33+ pupils ............................................. -19.3 (5.7)*** R-square ..................................................... 0.004 0.207 0.211 Note: N = 4627. Reported are average coefficients, which are derived from regressing Equation (2) separately for all the five plausible values and then calculate the average coefficients. Reported in ( ) are also bootstrapped standard errors. Included in all specifications is a constant term and dummy variables for missing information on the control variables. */**/*** denote statistically significance at the 10/5/1 percent level.
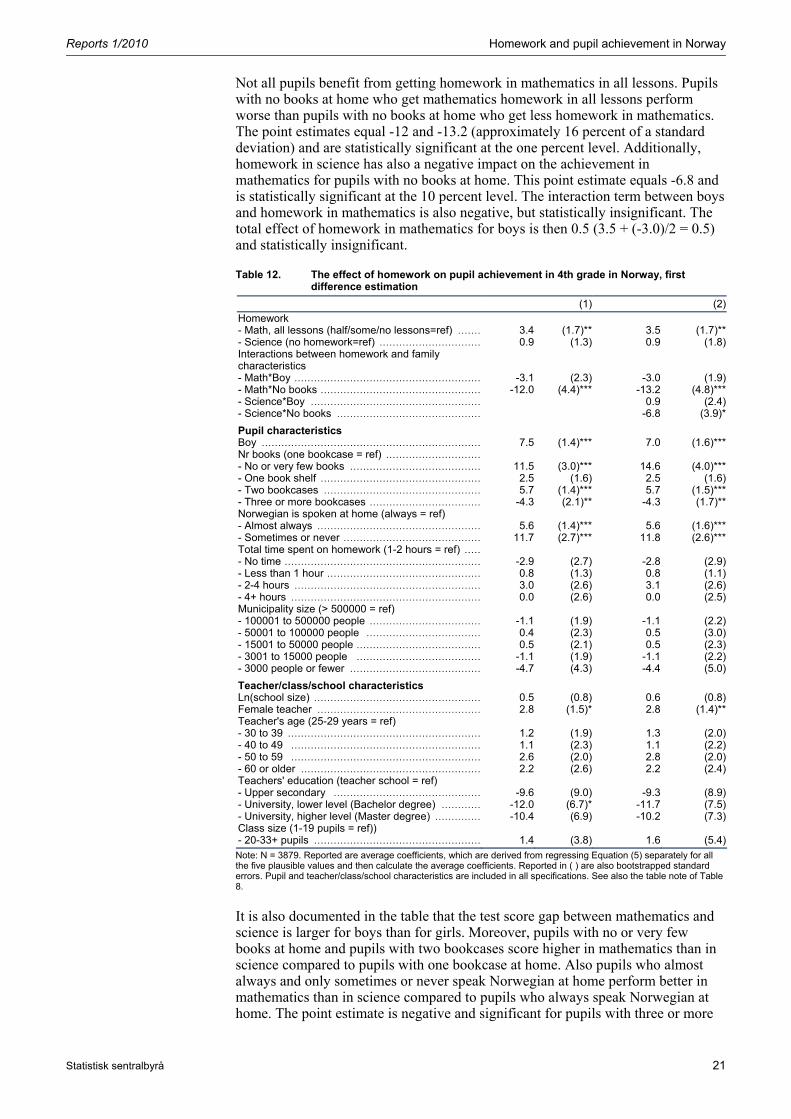
5.2. 4th grade: 1st difference approach In this paper the identification strategy is to condition on unobserved teacher and class fixed effects by applying a first difference method as described in Equation (5). As already mentioned, due to lack of variation in homework when conditioning on that pupils have the same teacher in mathematics and science, this estimation strategy cannot be implemented for pupils in 8th grade. The results, which are reported in Table 12, confirm that pupils in 4th grade increase their achievement in mathematics (relative to science) if homework in mathematics is given in all lessons. The point estimate has however decreased by approximately 40 percent compared to Table 8, and amounts now to 5 percent of a standard deviation. Moreover, the effect of homework in science has decreased to only 1 percent of a standard deviation and is statistically insignificant. This suggests that the large effects of homework in Table 8 and 9 are in large part due to that homework is correlated with unobserved attributes of the teacher and the class. When taking that into account, the effect of homework reduces.
Reports 1/2010 Homework and pupil achievement in Norway
Statistisk sentralbyrå 21
Not all pupils benefit from getting homework in mathematics in all lessons. Pupils with no books at home who get mathematics homework in all lessons perform worse than pupils with no books at home who get less homework in mathematics. The point estimates equal -12 and -13.2 (approximately 16 percent of a standard deviation) and are statistically significant at the one percent level. Additionally, homework in science has also a negative impact on the achievement in mathematics for pupils with no books at home. This point estimate equals -6.8 and is statistically significant at the 10 percent level. The interaction term between boys and homework in mathematics is also negative, but statistically insignificant. The total effect of homework in mathematics for boys is then 0.5 (3.5 + (-3.0)/2 = 0.5) and statistically insignificant.
Table 12. The effect of homework on pupil achievement in 4th grade in Norway, first difference estimation
(1) (2)Homework - Math, all lessons (half/some/no lessons=ref) ....... 3.4 (1.7)** 3.5 (1.7)**- Science (no homework=ref) ............................... 0.9 (1.3) 0.9 (1.8) Interactions between homework and family characteristics
- Math*Boy ......................................................... -3.1 (2.3) -3.0 (1.9)- Math*No books ................................................. -12.0 (4.4)*** -13.2 (4.8)***- Science*Boy .................................................... 0.9 (2.4)- Science*No books ............................................ -6.8 (3.9)*
Pupil characteristics
Boy ................................................................... 7.5 (1.4)*** 7.0 (1.6)***Nr books (one bookcase = ref) ............................. - No or very few books ........................................ 11.5 (3.0)*** 14.6 (4.0)***- One book shelf ................................................. 2.5 (1.6) 2.5 (1.6) - Two bookcases ................................................ 5.7 (1.4)*** 5.7 (1.5)***- Three or more bookcases .................................. -4.3 (2.1)** -4.3 (1.7)** Norwegian is spoken at home (always = ref) - Almost always .................................................. 5.6 (1.4)*** 5.6 (1.6)***- Sometimes or never .......................................... 11.7 (2.7)*** 11.8 (2.6)***Total time spent on homework (1-2 hours = ref) ..... - No time ............................................................ -2.9 (2.7) -2.8 (2.9)- Less than 1 hour ............................................... 0.8 (1.3) 0.8 (1.1)- 2-4 hours ......................................................... 3.0 (2.6) 3.1 (2.6)- 4+ hours .......................................................... 0.0 (2.6) 0.0 (2.5)Municipality size (> 500000 = ref) - 100001 to 500000 people .................................. -1.1 (1.9) -1.1 (2.2)- 50001 to 100000 people ................................... 0.4 (2.3) 0.5 (3.0)- 15001 to 50000 people ...................................... 0.5 (2.1) 0.5 (2.3)- 3001 to 15000 people ...................................... -1.1 (1.9) -1.1 (2.2)- 3000 people or fewer ........................................ -4.7 (4.3) -4.4 (5.0)
Teacher/class/school characteristics
Ln(school size) ................................................... 0.5 (0.8) 0.6 (0.8) Female teacher .................................................. 2.8 (1.5)* 2.8 (1.4)** Teacher's age (25-29 years = ref) - 30 to 39 ........................................................... 1.2 (1.9) 1.3 (2.0)- 40 to 49 .......................................................... 1.1 (2.3) 1.1 (2.2)- 50 to 59 .......................................................... 2.6 (2.0) 2.8 (2.0)- 60 or older ....................................................... 2.2 (2.6) 2.2 (2.4)Teachers' education (teacher school = ref) - Upper secondary ............................................. -9.6 (9.0) -9.3 (8.9)- University, lower level (Bachelor degree) ............ -12.0 (6.7)* -11.7 (7.5)- University, higher level (Master degree) .............. -10.4 (6.9) -10.2 (7.3)Class size (1-19 pupils = ref)) - 20-33+ pupils ................................................... 1.4 (3.8) 1.6 (5.4)Note: N = 3879. Reported are average coefficients, which are derived from regressing Equation (5) separately for all the five plausible values and then calculate the average coefficients. Reported in ( ) are also bootstrapped standard errors. Pupil and teacher/class/school characteristics are included in all specifications. See also the table note of Table 8.
It is also documented in the table that the test score gap between mathematics and science is larger for boys than for girls. Moreover, pupils with no or very few books at home and pupils with two bookcases score higher in mathematics than in science compared to pupils with one bookcase at home. Also pupils who almost always and only sometimes or never speak Norwegian at home perform better in mathematics than in science compared to pupils who always speak Norwegian at home. The point estimate is negative and significant for pupils with three or more
Homework and pupil achievement in Norway Reports 1/2010
22 Statistisk sentralbyrå
bookcases at home, hence these pupils score higher in science than in mathematics compared to the pupils in the reference group (one bookcase). The distance between the scores in mathematics and science is also larger for pupils of female teacher (compared to pupils of male teachers). Finally, having a teacher with a degree from the teacher school also seem to increase the distance between the scores in mathematics and science compared to having a teacher with upper secondary and university education.
Reports 1/2010 Homework and pupil achievement in Norway
Statistisk sentralbyrå 23
6. Discussion and concluding remarks By using data on Norwegian 4th and 8th graders who participated in TIMSS 2007, this report starts out by investigating whether time spent on homework varies across pupils from different socio-economic backgrounds. I find that pupils from lower socio-economic backgrounds, in both 4th and 8th grade, are more likely to spend no time on homework than pupils from higher socio-economic backgrounds (although homework is given). At the same time, it is also found that if pupils from lower socio-economic backgrounds spend time on homework, they actually spend more time on it than pupils from higher socio-economic backgrounds. One reason why pupils from lower socio-economic backgrounds are more likely to spend zero time on homework, could be lack of interest or necessary skills. Another explanation may be poor out-of-school learning environments. I.e., these pupils may have parents who do not or cannot help with homework or make sure that they complete their homework. There are also many possible explanations why pupils from lower socio-economic background spend more time on homework than pupils from higher socio-economic backgrounds. First of all, they may need more time in to complete their homework if they find the homework more difficult than pupils from higher socio-economic backgrounds. Also more time spend on homework can reflect problems related to motivation, frustration and concentration (Trautwein and Köller, 2003). On the other hand, more time spent on homework may also reflect high educational ambitions, regardless of socioeconomic background. The second aim of the report is to analyze the effect of homework on pupil achievement. A simple OLS analysis reveals positive correlations between homework and pupil achievement in both 4th and 8th grade. After conditioning on teacher and class fixed effects (first difference approach), the effect of homework in mathematics decreases for 4th graders, but is still positive (5 percent of a standard deviation) and statistically significant at the five percent level. The effect of homework in science on the achievement in 4th grade is close to zero and statistically insignificant. The first difference approach cannot be implemented for 8th graders due to lack of variation in the homework question when restricting the sample to those pupils who have the same teacher in mathematics and science. Nevertheless, given the results for 4th graders, it is reasonable to believe that there is an effect of homework on the achievement in 8th grade, but which is probably not bigger than that estimated in the OLS analyses. Although the first difference estimates improve on the OLS coefficients, it cannot be ruled out that they also suffer from omitted variable bias, and may not necessarily reveal the true causal effects of homework. It is important to keep this in mind when interpreting the results. Not all pupils seem to benefit from being assigned homework. 4th graders with no books at home, who get homework in mathematics in all lessons, perform worse than 4th graders with no books at home, who get homework in mathematics less often. Homework in science has also a negative impact on the achievement in mathematics for pupils with no books at home. One explanation why homework has a negative effect for some pupils may be that homework leads to declining motivation (also during school hours), and hence indirectly affect the achievement negatively. Another explanation may be poor out of school learning environments in combination with that homework serves as a substitute for learning in school. It is well documented in the literature that pupils from lower socio-economic backgrounds learn relatively more while in school/kindergarten than at home, compared to pupils from higher socio-economic backgrounds (Cooper et al., 1996; Entwisle et al., 2007; Leuven et al. 2009). An
Homework and pupil achievement in Norway Reports 1/2010
24 Statistisk sentralbyrå
implication of this may be that if topics which are supposed to be taught in class are given as homework (for instance because the teachers ran out of time for one or another reason, i.e., homework is a substitute for classwork), this may negatively affect the achievement of we pupils from lower socio-economic backgrounds because these pupils, on average, learn relatively more while in school than at home. Summarized, there seem to be a positive effect of homework (in mathematics) on average. However, not all pupils seem to benefit from homework. In fact, pupils from lower socio-economic backgrounds (measured as no or very few books at home) actually perform better if less homework is assigned, a result which merits further investigation. It is beyond the scope of this report to further investigate the underlying mechanisms which can explain the effect of homework on pupil achievement. This is a topic for future research.
Reports 1/2010 Homework and pupil achievement in Norway
Statistisk sentralbyrå 25
References Ammermueller, A. and Pischke, J-S. (2009). Peer effects in European primary schools: Evidence from PIRLS. Journal of Labour Economics, 27, 315-348. Bonesrønning, H. and Iversen, J. M. V. (2008). Suksessfaktorer i grunnskolen: Analyse av nasjonale prøver 2007. SØF-rapport 05/08 Cooper, H. (1989). Homework. White Plains, NY: Longman Cooper, H., Nye, B., Charlton, K., Lindsey, J. and Greathouse, S. (1996). The Effect of Summer Vacation on Achievement Test Scores: A Narrative and Meta-Analytic Review. Review of Educational Research 66(3): 227-268. Cooper, H., Lindsay, J. J., Nye, B. and Greathouse, S. (1998). Relationships among attitudes about homework, amount of homework assigned and completed, and student achievement. Journal of Educational Psychology, 90, 70-83. Cooper, H., Robinson, J. C. and Patall, E. A. (2006). Does homework improve academic achievement? A synthesis of research, 1987-2003. Review of Educational Research, 76, 1-62. Entwisle, D. R., Alexander, K. L. and Olson, S. L.. (2007). Lasting consequences of the summer learning gap. American Sociology Review, 72, 167-180. Guryan J., Hurst E. and Kearney M. S. (2008). Parental education and parental time with children. Journal of Economic Perspectives, 22(3), 23-46. Hattie, J. and Clinton, J. (2001). The assessment of teachers. Teaching Education, 12, 279-300. Leuven E., Lindahl M., Oosterbeek H. and Webbink D. (2009). Expanding schooling opportunities for 4-year-olds. Forthcoming in Economics of Education Review. Rønning, M. (2009). Who benefits from homework assignments? Working Paper No 566, Statistics Norway Schmitz, B. and Skinner, E. (1993). Perceived control, effort and academic performance: interindividual, intraindividual, and multivariate time series analyses. Journal of Personality and Social Psychology, 64, 1010-1028. TIMSS 2007 user guide for the International Database. Lynch School of Education, Boston College. Trautwein, U. and Köller, O. (2003). The relationship between homework and achievement: still much of a mystery. Educational Psychology Review, 15, 115-145. Trautwein, U. (2007). The homework-achievement relation reconsidered: Differentiating homework time, homework frequency, and homework effort. Learning and Instructions, 17, 372-388. Trautwein, U., Lüdtke, O., Schnynder, I. and Niggli, A. (2006). Predicting homework effort: support for a domain-specific, multilevel homework model. Journal of Educational Psychology, 98, 438-456 Wooldridge, J. M. (2002). Econometric Analysis of Cross Section and Panel Data. Cambridge, MA: MIT Press.
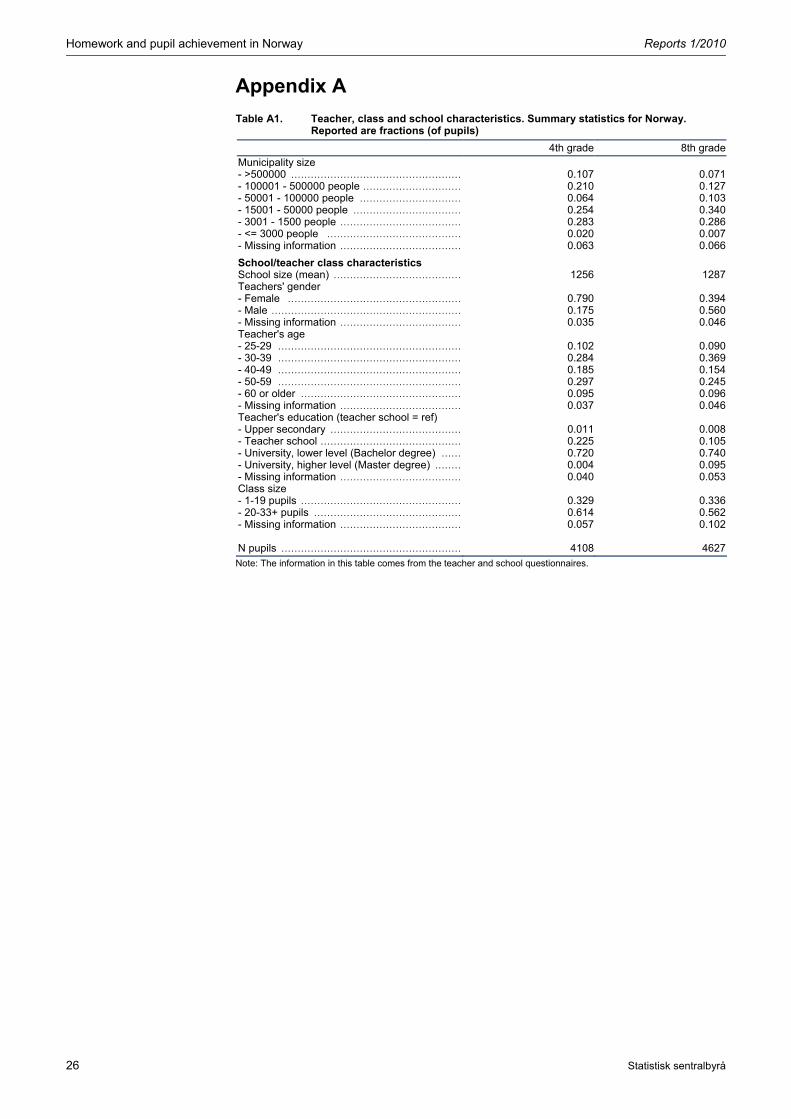
Homework and pupil achievement in Norway Reports 1/2010
26 Statistisk sentralbyrå
Appendix A
Table A1. Teacher, class and school characteristics. Summary statistics for Norway. Reported are fractions (of pupils)
4th grade 8th gradeMunicipality size - >500000 .................................................... 0.107 0.071- 100001 - 500000 people .............................. 0.210 0.127- 50001 - 100000 people ............................... 0.064 0.103- 15001 - 50000 people ................................. 0.254 0.340- 3001 - 1500 people ..................................... 0.283 0.286- <= 3000 people ......................................... 0.020 0.007- Missing information ..................................... 0.063 0.066
School/teacher class characteristics
School size (mean) ....................................... 1256 1287Teachers' gender - Female ..................................................... 0.790 0.394- Male .......................................................... 0.175 0.560- Missing information ..................................... 0.035 0.046Teacher's age - 25-29 ........................................................ 0.102 0.090- 30-39 ........................................................ 0.284 0.369- 40-49 ........................................................ 0.185 0.154- 50-59 ........................................................ 0.297 0.245- 60 or older ................................................. 0.095 0.096- Missing information ..................................... 0.037 0.046Teacher's education (teacher school = ref) - Upper secondary ........................................ 0.011 0.008- Teacher school ........................................... 0.225 0.105- University, lower level (Bachelor degree) ...... 0.720 0.740- University, higher level (Master degree) ........ 0.004 0.095- Missing information ..................................... 0.040 0.053Class size - 1-19 pupils ................................................. 0.329 0.336- 20-33+ pupils ............................................. 0.614 0.562- Missing information ..................................... 0.057 0.102 N pupils ....................................................... 4108 4627Note: The information in this table comes from the teacher and school questionnaires.
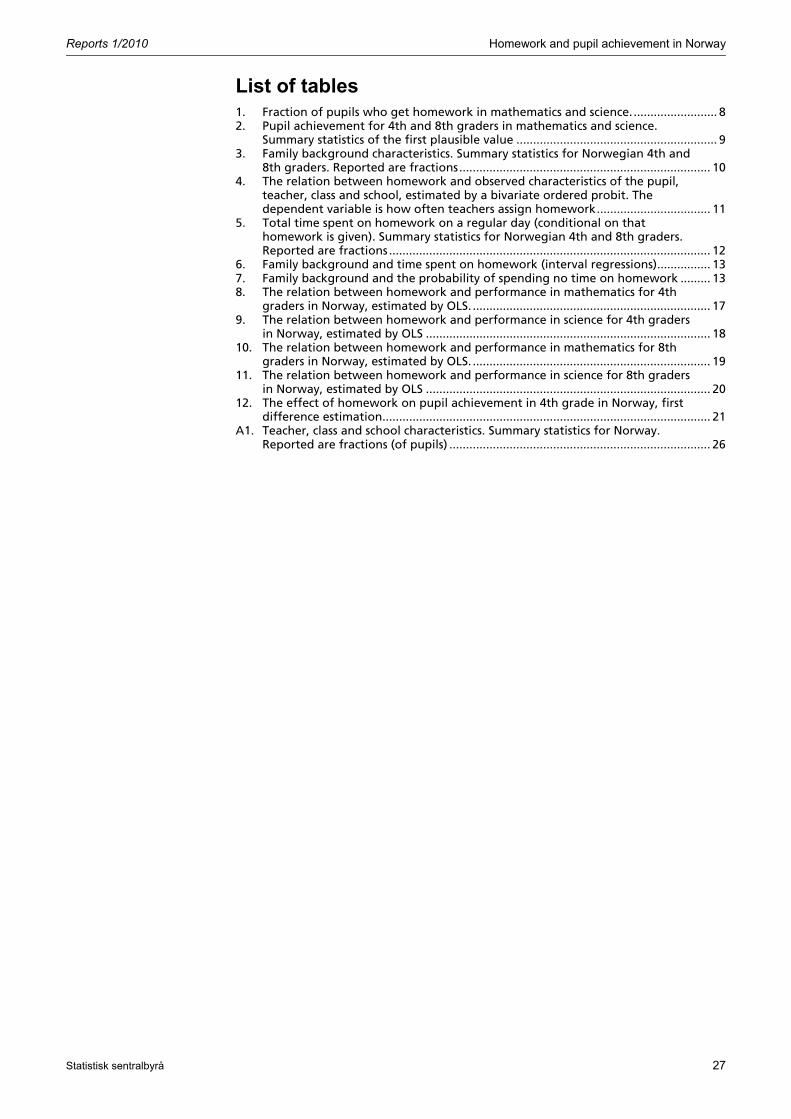
Reports 1/2010 Homework and pupil achievement in Norway
Statistisk sentralbyrå 27
List of tables 1. Fraction of pupils who get homework in mathematics and science. ......................... 8 2. Pupil achievement for 4th and 8th graders in mathematics and science.
Summary statistics of the first plausible value ............................................................ 9 3. Family background characteristics. Summary statistics for Norwegian 4th and
8th graders. Reported are fractions........................................................................... 10 4. The relation between homework and observed characteristics of the pupil,
teacher, class and school, estimated by a bivariate ordered probit. The dependent variable is how often teachers assign homework.................................. 11
5. Total time spent on homework on a regular day (conditional on that homework is given). Summary statistics for Norwegian 4th and 8th graders. Reported are fractions................................................................................................ 12
6. Family background and time spent on homework (interval regressions)................ 13 7. Family background and the probability of spending no time on homework ......... 13 8. The relation between homework and performance in mathematics for 4th
graders in Norway, estimated by OLS. ....................................................................... 17 9. The relation between homework and performance in science for 4th graders
in Norway, estimated by OLS ..................................................................................... 18 10. The relation between homework and performance in mathematics for 8th
graders in Norway, estimated by OLS. ....................................................................... 19 11. The relation between homework and performance in science for 8th graders
in Norway, estimated by OLS ..................................................................................... 20 12. The effect of homework on pupil achievement in 4th grade in Norway, first
difference estimation.................................................................................................. 21 A1. Teacher, class and school characteristics. Summary statistics for Norway.
Reported are fractions (of pupils) .............................................................................. 26