Embed Size (px)
Citation preview
United Nations Expert Group Meeting : "Methodology and lessons learned to evaluate the completeness and quality of vital statistics data from civil registration"
1
National and subnational experience with estimating the extent and trend in completeness of registration of deaths in Brazil1
Bernardo Lanza Queiroz Universidade Federal de Minas Gerais
Everton E. Campos de Lima NEPO - Unicamp
Abstract
In this paper, we analyze the evolution of the completeness of death counts coverage in Brazil and its regions since 1980. We review a series of studies on the quality of mortality registration for the country, states and small areas, compare and contrast different approaches and results. We also investigate the quality of the 2010 Census data regarding the information on household deaths in 2010 to results obtained using the Ministry of Health Mortality Information System. Finally, we produce estimates at the city level and discuss the limitation and importance of producing small areas demographic estimation for public health planning and population forecasts.
Preliminary draft Comments are welcome
1 Research presented in this paper builds on collaborative work with Everton Lima (Unicamp), Flávio Freire (UFRN) and Marcos Gonzaga (UFRN). Support from the Research Projects 470866/2014-4 (MCTI/CNPQ/MEC/CAPES/Ciências Sociais Aplicadas) and 454223/2014-5 (MCTI/CNPQ/Universal 14/2014) are gratefully acknowledged.
United Nations Expert Group Meeting : "Methodology and lessons learned to evaluate the completeness and quality of vital statistics data from civil registration"
2
1. Introduction
The study of the pattern and level of mortality are very important in
understanding the population dynamics, urban planning and social policies, especially at
the local level. AbouZhar and Boerma (2005) argue that the appropriate decisions on
public health occur only with appropriate information on health-related events;
mortality, morbidity, causes of death; which require the existence of an adequate health
information system. The basic pillar of this system is the correct recording of the
number of deaths by age and sex in the country, but information on causes of death and
disease are also critical to the development of appropriate policies. However, it is
important to produce proper estimates of mortality at the national and subnational levels
to subsidize the understanding of population dynamics.
In many countries, estimating mortality becomes a challenge, since the quality of
information is generally unsatisfactory (Luy, 2010; Setel et.al, 2007). Advances in
improving health information and mortality are increassing in recent decades and are
observed even in less developed countries (Setel, et al, 2007), but there are still a large
number of countries and regions within countries with restricted quality of mortality and
health data. There are a number of demographic methods developed to estimate
mortality at the different levels. Most important they provide a way perform an
evaluation of the quality of mortality data (Brass, 1975; Preston et al., 1980; Bennett
and Horiuchi, 1981; Hill, 1987; Hill and Timaeus Choi, 2005; Hill, You and Choi,
2009).
This paper reviews the evolution of completeness of registration of deaths in
Brazil over the last few decades at different geographic levels. We present estimates of
death counts under-reporting by sex and compare to estimates produced by other
authors and agencies. We discuss the importance of evaluating data quality in Brazil in
order to produce good mortality estimates and how demographic methods can be
combined to statistical methods to produce small area estimates. Finally, we show some
results of the evolution of adult mortality for small areas in Brazil.
In recent decades the quality of mortality data in Brazil showed significant
progress, but with large regional variability (France et al, 2008; Agostinho, 2009;
Agostinho and Queiroz, 2010). Lima and Queiroz (2014) showed the advancement of
improved mortality information across Brazilian regions between 1980 and 2010. For
Brazilian states, there are some studies time points that allow an analysis of the
United Nations Expert Group Meeting : "Methodology and lessons learned to evaluate the completeness and quality of vital statistics data from civil registration"
3
evolution of data quality. In particular, Paes (2005), Agostinho (2009) and Queiroz
(2012) study the quality of mortality data from Brazilian states for the periods 1980-
1991, 1991-2000 and 2000-2010 and show that there are signs of improvement but still
a lot of regional heterogeneity. Thus, it is important to review all the estimates of
completeness of death counts registration in Brazil and regions, analyze the main issues
and limitations of methods and data and discuss the road ahead to keep improving the
quality of mortality information in Brazil and regions in Latin America.
The results indicate the steady advance in the quality of mortality data in Brazil.
In 2010, all the states of the South and Southeast regions have complete registration
deaths and some located in the Northeast and Midwest. In addition, there was a
breakthrough in the quality of mortality information in the poorer states of the Northeast
and in the North, especially those who have the worst quality of the previous period.
Regarding the mortality estimates for regions in Brazil, the results indicate an
improvement in health conditions, as measured by the decline in the risk of death
between ages 15 and 59. One point that draws attention and deserves further study is not
reducing the difference in mortality between men and women in the last two decades.
2. Data and Methods
We use two sources of data for mortality in this paper. For the time trend
analysis, we focus on the Ministry of Health Mortality Information System. We also
perform some analysis using the 2010 Census data and compare, at the state level,
information from census and Ministry of Health databases. One additional possibility,
IBGE Vital Registration system will not be used in this paper; we follow the academic
literature in Brazil and focus data analysis in the Ministry of Health Database.
2.1 Ministry of Health – Mortality Information System
We make extensive use of the Ministry of Health database, DATASUS
(http://www2.datasus.gov.br). The database provides information on deaths, causes of
deaths, by age and sex at the municipality level. The data are available since 1979, but
we use information from 1980 to 2010. Mortality data is organized using codes from the
ICD Revision (9th from 1980 to 1995 and 10th from 1996 on). Data cleaning and
compilation is done at the municipal, provincial and state level, and an electronic data
United Nations Expert Group Meeting : "Methodology and lessons learned to evaluate the completeness and quality of vital statistics data from civil registration"
4
file is transferred to the national office every 3 months. Population by age and sex, at
the local level, comes from the Brazilian Censuses (1980, 1991, 2000 and 2010).
2.2. Population Census - 2010
We use the information available in the Brazilian Census 2010 on the household
deaths that occurred in the last 12 months. The respondent also informs sex and age of
the person who died during the reference period. The inclusion of such information
information is part of the suggestions made by the United Nations Principles and
Recommendations for Population and Housing Censuses (1997) for the 2000 and 2010
census round. Household deaths should be evaluated very carefully because it is subject
to four main problems: a) sub-enumeration of deaths due to breakage of households
following the death of a resident or due to high concentration of residents in single
person households; b) young people who migrate from their original homes can be
registered as belonging to more than one domicile; c) errors in the reference period for
that the definition of the period must be as clear as possible and d) possible random and
significant fluctuations in mortality affecting the estimate of interest.
2.3. Death Distribution Methods
The demographic literature has developed several methods based upon equations
of population dynamics to evaluate the coverage of reported deaths relative to
populations. The death distribution methods (DDM) are commonly used to estimate
adult mortality in a non-stable population. A stable population is one in which the birth
and death rates are unchanging over a long period of time. The DDM methods compare
the distribution of deaths by age with the age distribution of the living and provide age
patterns of mortality in a defined reference period. There are two major approaches: the
General Growth Balance Methods, and the Synthetic Extinct Generation method.
In this paper, we use the General Growth Balance method (GGB) and the
Benneth Horichi Adjusted method. The method is derived from the basic demographic
balancing equation, which expresses the identity that the growth rate of a population is
equal to the difference between its entry rate and exit rate. Equation 1 shows the basic
relations of the method
( )( )
( ) ( ) ( )( ) ⎟
⎟⎠
⎞⎜⎜⎝
⎛
+
++⎟⎟⎠
⎞⎜⎜⎝
⎛=+−
+ xNxD
Ckk
kk
txr
xNxN 'ln1'' 2
121
2
1 (1)
United Nations Expert Group Meeting : "Methodology and lessons learned to evaluate the completeness and quality of vital statistics data from civil registration"
5
Where N’(x) is the number of persons who reach the exact age x in the period,
N(x+) is the number of persons at exact age x and over, r(x+) is the population growth
rate, k1 and k2 are the relative coverage of the enumerated population in two censuses,
C is the degree of completeness of death records over the period, D’(x+) is the observed
number of deaths of people with x or more years of age and t is the interval
corresponding to the intercensal period
This identity holds for open-ended age segments x+, and in a closed population
the only entries are through birthdays at age x. The “birth” rate x+ minus the growth
rate x+ thus provides a residual estimate of the death rate x+. If the residual estimate can
be calculated from population data from two population censuses and compared to a
direct estimate using the recorded deaths, the completeness of death recording relative
to population recording can be estimated. The method has a few strong and key
assumptions: the population is closed to migration; the completeness of recording of
deaths is constant by age; the completeness of recording of the population is constant by
age; and ages of the living and dead are reported without error.
The death distribution method has also an important limitation. Since they
compare a distribution of deaths to an intercensal population, they estimate intercensal
completeness of mortality estimates, and not the completeness at the beginning or end
of the intercensal period. This matter is of particular importance when a distribution of
deaths comes from data from the latest census or when vital registration is available for
recent years,. The assumption of the GGB method that the population is closed to
migration is also of importance to Brazil and its regions. The GGB method uses
information on deaths and growth rates cumulated above a series of ages x. If there is
some age x above which net migration is negligible, the performance of the methods
above that age will be unaffected. The intercept and slope of the GGB method were
obtained by orthogonal regression to points for the ages 35+ to 75+.
The Bennett and Horiuchi method, SEG, uses specific growth rates by age for
converting an age distribution of deaths into an age distribution of a population. Once
the observed deaths from a given age x in a population is equal to the population of age
x, adjusted by the rate of population growth by age range, we have the deaths of a
population of age x+ that provide an estimate of the population on that age x. The extent
of death registration coverage is given by the ratio of deaths estimated by the population
United Nations Expert Group Meeting : "Methodology and lessons learned to evaluate the completeness and quality of vital statistics data from civil registration"
6
above the age x and the observed population above the age x. Equation 2 presents the
mathematical formalization of the method
( ) ( ) ( )[ ]∑=
−=ω
xa
rareaDxN ' (2)
Where N’(x) is the number of people who reach the exact age x in a population
with growth rate r, and D(x) is the number of deaths at age x. In this case, the estimate
of deaths under-registration in the period is given by the ratio between the estimated
number of people aged x (N’(x)) and the observed number of people aged x (N(x)). The
diagnostic plot in this case should present a straight line across age, showing constant
completeness. A change in the slope over the age groups indicates possible coverage
problems of population censuses, problems in the age statement of the living and dead
or variation in the quality of the registration / listing of deaths by age group
Hill and colleagues suggest that the combination of GGB and SEG methods
may be more robust than the application of the two methods separately. The adjusted
method consists of applying GGB to obtain estimates of the change in the population
enumeration (k1/k2), and use this ratio to adjust the coverage of both census, and then
apply the SEG method using the adjusted population for the coverage of mortality data.
2.4 Problem with small numbers
Knowing the exact level and structure of mortality is essential for government
agencies to set up their health policies. In face of the millennium goals, more studies on
this field are becoming necessary, especially when the population of interest is small.
Such studies are important because they aid researchers investigating the environmental
and behavioral aspects of diseases, the access to health care, and better understanding
the socioeconomic determinants of mortality and morbidity in these areas (Ferguson et
al.,2004).
Search for better estimates of rates in small areas gained ground in the research
agenda of many demographers even with large samples and censuses, vital rates
estimates in small areas are still very limited and incipient. This often happens due to
the problem of few events recorded in the denominator and/or numerator of the
United Nations Expert Group Meeting : "Methodology and lessons learned to evaluate the completeness and quality of vital statistics data from civil registration"
7
measures of interest. This instability is even worse when sub-national groups are
disaggregated by age and sex (Assunção et al. 2005). Bernadinelli and Montomoli
(1992) argue that, in small populations, the estimated rates generally have extreme
values, often dominated by sampling noise which less reflect the true risks. Assunção et
al. (2005) also show that for a large number of small areas, one can observe a large
variability in the estimated rates that do not reflect the true level of heterogeneity of the
geographic location. Therefore, estimates of vital rates in small areas present a great
challenge for demographers, but several authors argue that a variety of statistical
methods exist to adequately address the volatility of these estimates (for example
Ferguson, 2004). In studies estimating fertility rates in Brazil, Assunção et al. (2005)
showed how Empirical Bayes was effective in the case of Brazilian municipalities.
Therefore, estimates of vital rates in small areas present a great challenge for
demographers, but several authors argue that a variety of statistical methods exist to
adequately address the volatility of these estimates (for example Ferguson, 2004).
3. Results
3.1 Evolution of Death Counts Coverage in Brazil
3.1.1 Evolution from 1980 to 2000
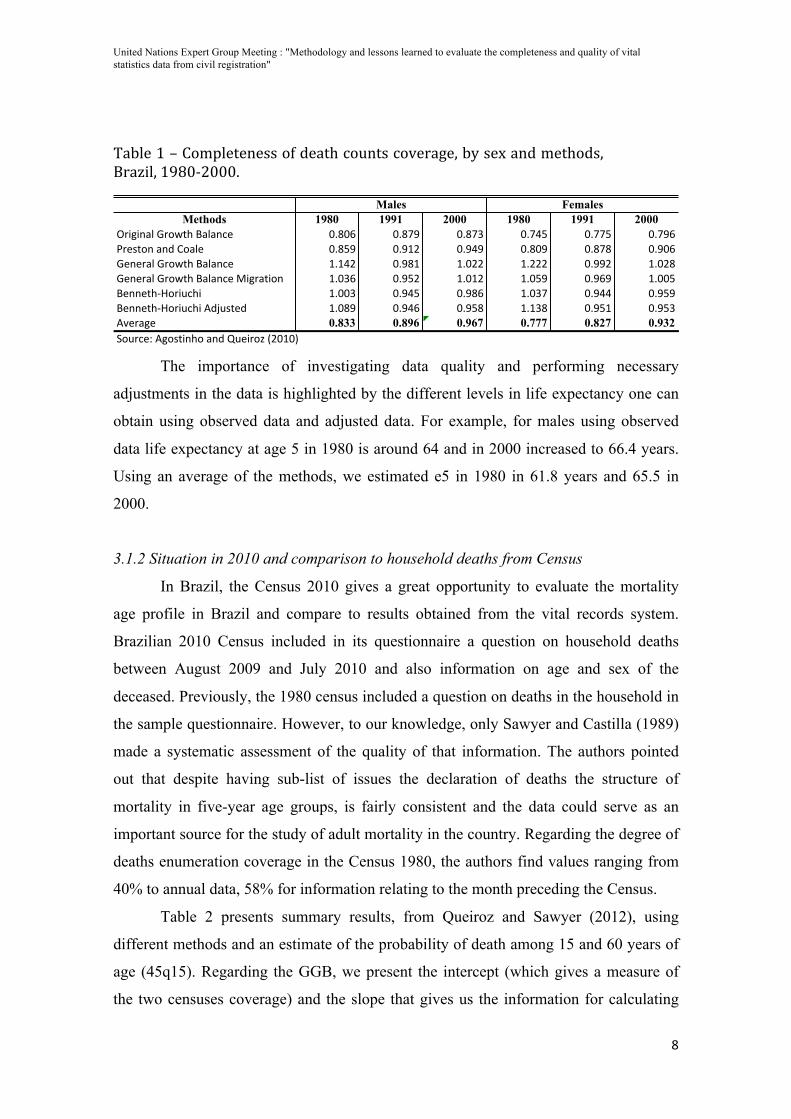
Table 1 shows the trends in completeness of death counts coverage in Brazil, for
males and females, using different methods and age ranges to estimate completeness
and levels of adult mortality. Completeness improved systematically for the country
since 1980, but with important differences between males and females. In general,
completeness of death counts coverage is better for males than for females. The results
indicate that coverage in Brazil increase, for males, from 84% in 1970-1980 to 95% in
1991-2000, we will discuss 2000-2010 in detail later. For females, we find that
completeness improved from 79% to 90%. One important message from Table 1 is that
different methods and different age ranges used to produce estimates can produce
different results. Since the literature does not specify gold-standard method, it is
important to present the results using different approaches.
United Nations Expert Group Meeting : "Methodology and lessons learned to evaluate the completeness and quality of vital statistics data from civil registration"
8
Table 1 – Completeness of death counts coverage, by sex and methods, Brazil, 1980-‐2000.
Methods 1980 1991 2000 1980 1991 2000!"#$#%&'()"*+,-(.&'&%/0 12314 12356 12357 12589 12559 12564:"0;,*%(&%<(=*&'0 12396 126>? 12686 12316 12353 12614)0%0"&'()"*+,-(.&'&%/0 >2>8? 1263> >21?? >2??? 1266? >21?3)0%0"&'()"*+,-(.&'&%/0(@#$"&,#*% >2174 1269? >21>? >2196 12646 >2119.0%%0,-AB*"#C/-# >2117 12689 12634 >2175 12688 12696.0%%0,-AB*"#C/-#(D<EC;,0< >2136 12684 12693 >2>73 1269> 12697DF0"&$0 0.833 0.896 0.967 0.777 0.827 0.932G*C"/0H(D$*;,#%-*(&%<(IC0#"*J(K?1>1L
Males Females
The importance of investigating data quality and performing necessary
adjustments in the data is highlighted by the different levels in life expectancy one can
obtain using observed data and adjusted data. For example, for males using observed
data life expectancy at age 5 in 1980 is around 64 and in 2000 increased to 66.4 years.
Using an average of the methods, we estimated e5 in 1980 in 61.8 years and 65.5 in
2000.
3.1.2 Situation in 2010 and comparison to household deaths from Census
In Brazil, the Census 2010 gives a great opportunity to evaluate the mortality
age profile in Brazil and compare to results obtained from the vital records system.
Brazilian 2010 Census included in its questionnaire a question on household deaths
between August 2009 and July 2010 and also information on age and sex of the
deceased. Previously, the 1980 census included a question on deaths in the household in
the sample questionnaire. However, to our knowledge, only Sawyer and Castilla (1989)
made a systematic assessment of the quality of that information. The authors pointed
out that despite having sub-list of issues the declaration of deaths the structure of
mortality in five-year age groups, is fairly consistent and the data could serve as an
important source for the study of adult mortality in the country. Regarding the degree of
deaths enumeration coverage in the Census 1980, the authors find values ranging from
40% to annual data, 58% for information relating to the month preceding the Census.
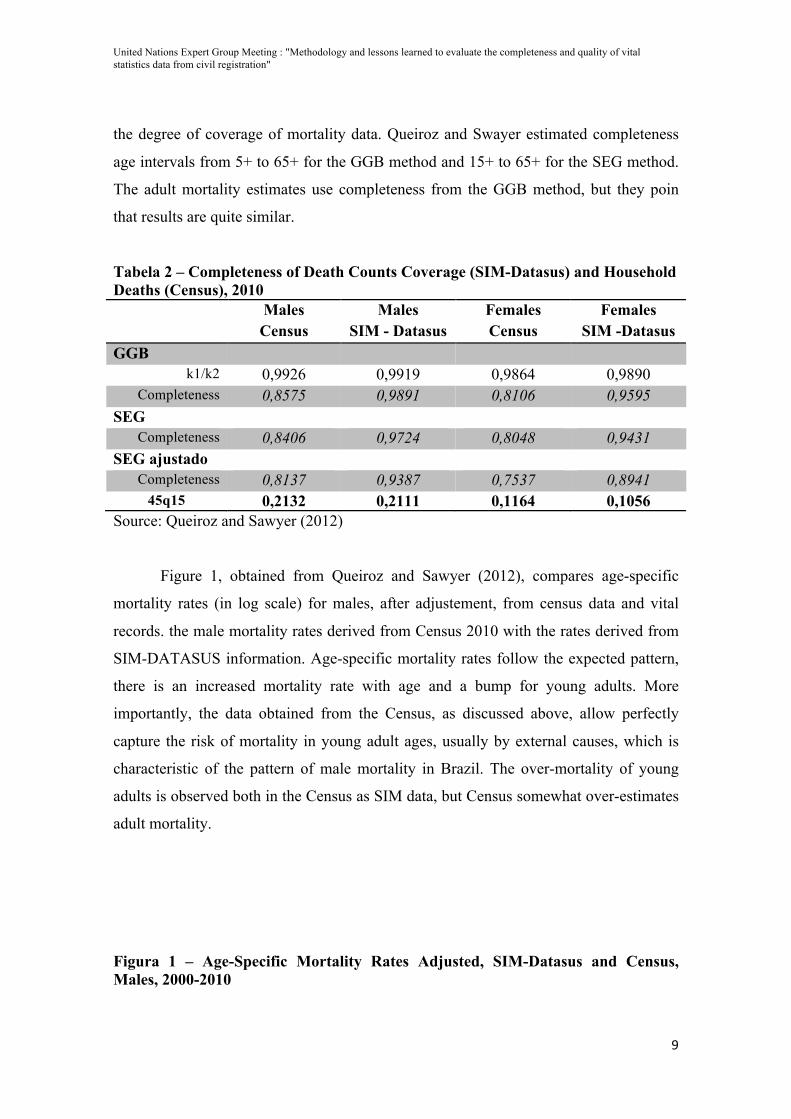
Table 2 presents summary results, from Queiroz and Sawyer (2012), using
different methods and an estimate of the probability of death among 15 and 60 years of
age (45q15). Regarding the GGB, we present the intercept (which gives a measure of
the two censuses coverage) and the slope that gives us the information for calculating
United Nations Expert Group Meeting : "Methodology and lessons learned to evaluate the completeness and quality of vital statistics data from civil registration"
9
the degree of coverage of mortality data. Queiroz and Swayer estimated completeness
age intervals from 5+ to 65+ for the GGB method and 15+ to 65+ for the SEG method.
The adult mortality estimates use completeness from the GGB method, but they poin
that results are quite similar.
Tabela 2 – Completeness of Death Counts Coverage (SIM-Datasus) and Household Deaths (Census), 2010 Males
Census Males
SIM - Datasus Females Census
Females SIM -Datasus
GGB k1/k2 0,9926 0,9919 0,9864 0,9890
Completeness 0,8575 0,9891 0,8106 0,9595 SEG
Completeness 0,8406 0,9724 0,8048 0,9431 SEG ajustado
Completeness 0,8137 0,9387 0,7537 0,8941 45q15 0,2132 0,2111 0,1164 0,1056
Source: Queiroz and Sawyer (2012)
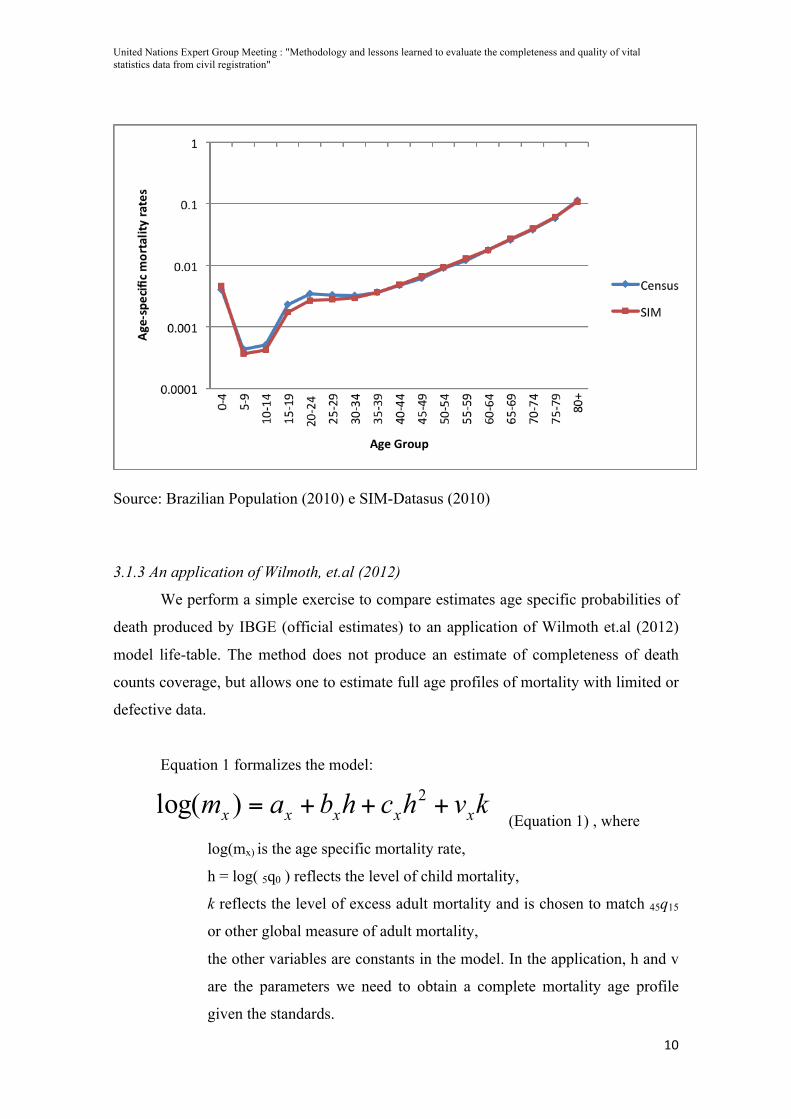
Figure 1, obtained from Queiroz and Sawyer (2012), compares age-specific
mortality rates (in log scale) for males, after adjustement, from census data and vital
records. the male mortality rates derived from Census 2010 with the rates derived from
SIM-DATASUS information. Age-specific mortality rates follow the expected pattern,
there is an increased mortality rate with age and a bump for young adults. More
importantly, the data obtained from the Census, as discussed above, allow perfectly
capture the risk of mortality in young adult ages, usually by external causes, which is
characteristic of the pattern of male mortality in Brazil. The over-mortality of young
adults is observed both in the Census as SIM data, but Census somewhat over-estimates
adult mortality.
Figura 1 – Age-Specific Mortality Rates Adjusted, SIM-Datasus and Census, Males, 2000-2010
United Nations Expert Group Meeting : "Methodology and lessons learned to evaluate the completeness and quality of vital statistics data from civil registration"
10
Source: Brazilian Population (2010) e SIM-Datasus (2010)
3.1.3 An application of Wilmoth, et.al (2012)
We perform a simple exercise to compare estimates age specific probabilities of
death produced by IBGE (official estimates) to an application of Wilmoth et.al (2012)
model life-table. The method does not produce an estimate of completeness of death
counts coverage, but allows one to estimate full age profiles of mortality with limited or
defective data.
Equation 1 formalizes the model:
kvhchbam xxxxx +++= 2)log( (Equation 1) , where
log(mx) is the age specific mortality rate,
h = log( 5q0 ) reflects the level of child mortality,
k reflects the level of excess adult mortality and is chosen to match 45q15
or other global measure of adult mortality,
the other variables are constants in the model. In the application, h and v
are the parameters we need to obtain a complete mortality age profile
given the standards.
United Nations Expert Group Meeting : "Methodology and lessons learned to evaluate the completeness and quality of vital statistics data from civil registration"
11
The main disadvantage is that the constants in the model were constructed using
countries in the Human Mortality Database and the experience of those countries might
not reflect the experience of less developed countries. However, the method is very
flexible and one could re-estimate the constants by adding other countries to the
database. The main issue is that those additional countries might have data limitation
and mortality age-profiles might have been estimated using indirect methods or model
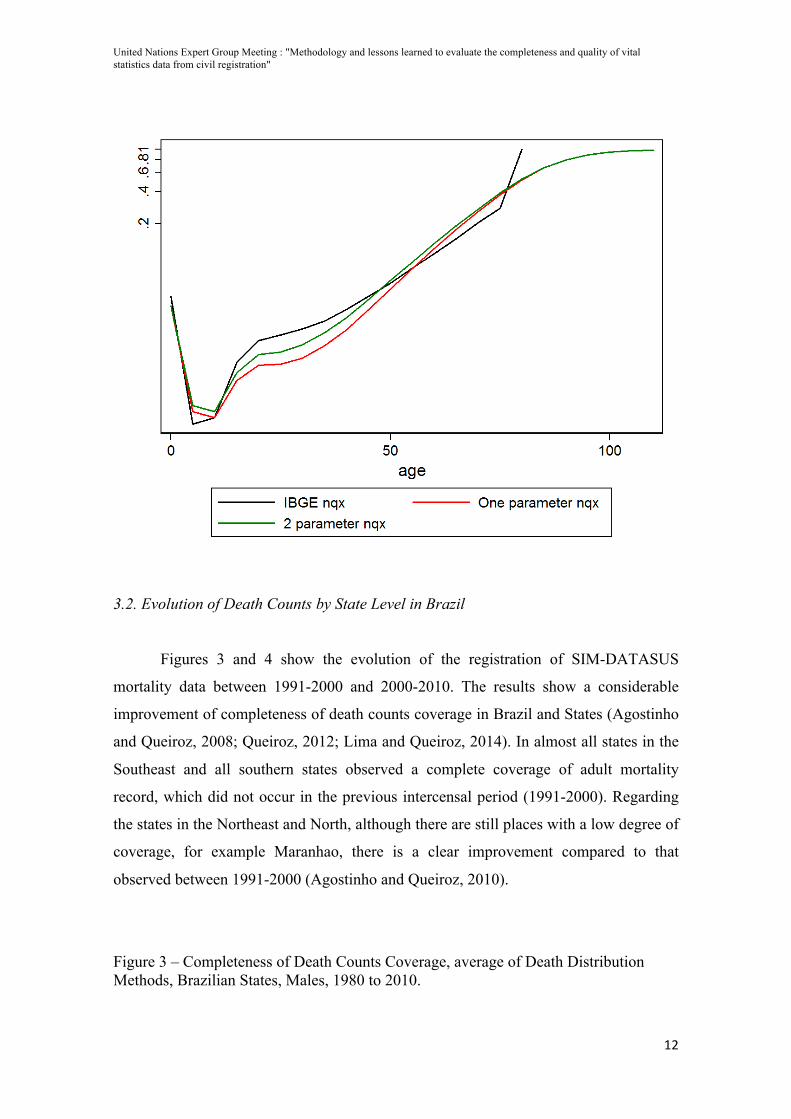
life-tables. Figure 2 compares the official estimates for Brazil in 2000 (IBGE) to the
application of the log-quad model using one and two parameters. We use 5q0 and 45q15
from our estimates presented in the previous section. The main issue is the difference
between the observed level in adult mortality by IBGE and using the log-quad methods.
IBGE estimates 45q15 in 0.2584 whereas one-parameter estimates is 0.2052 and two-
parameter estimates is 0.2460.
Figura 2 – Age specific probabilities of death between ages 15 and 60, 45q15, Males, Brazil, 2000.
United Nations Expert Group Meeting : "Methodology and lessons learned to evaluate the completeness and quality of vital statistics data from civil registration"
12
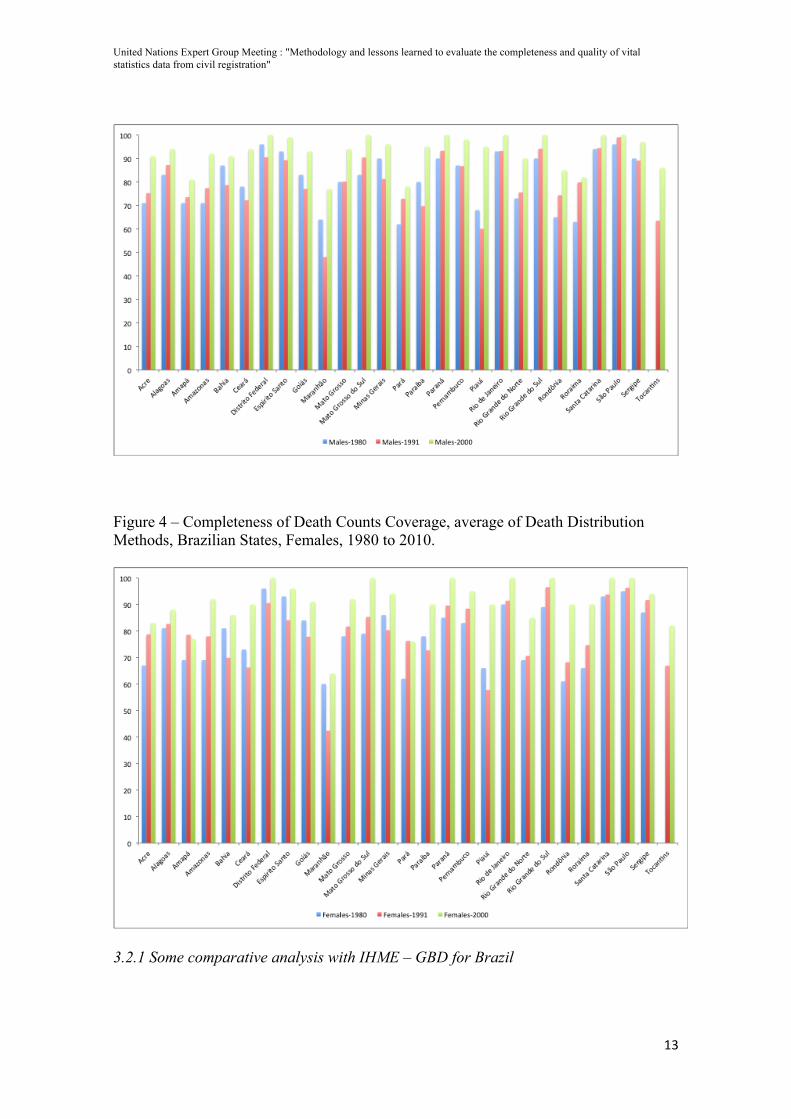
3.2. Evolution of Death Counts by State Level in Brazil
Figures 3 and 4 show the evolution of the registration of SIM-DATASUS
mortality data between 1991-2000 and 2000-2010. The results show a considerable
improvement of completeness of death counts coverage in Brazil and States (Agostinho
and Queiroz, 2008; Queiroz, 2012; Lima and Queiroz, 2014). In almost all states in the
Southeast and all southern states observed a complete coverage of adult mortality
record, which did not occur in the previous intercensal period (1991-2000). Regarding
the states in the Northeast and North, although there are still places with a low degree of
coverage, for example Maranhao, there is a clear improvement compared to that
observed between 1991-2000 (Agostinho and Queiroz, 2010).
Figure 3 – Completeness of Death Counts Coverage, average of Death Distribution Methods, Brazilian States, Males, 1980 to 2010.
United Nations Expert Group Meeting : "Methodology and lessons learned to evaluate the completeness and quality of vital statistics data from civil registration"
13
Figure 4 – Completeness of Death Counts Coverage, average of Death Distribution Methods, Brazilian States, Females, 1980 to 2010.
3.2.1 Some comparative analysis with IHME – GBD for Brazil
United Nations Expert Group Meeting : "Methodology and lessons learned to evaluate the completeness and quality of vital statistics data from civil registration"
14
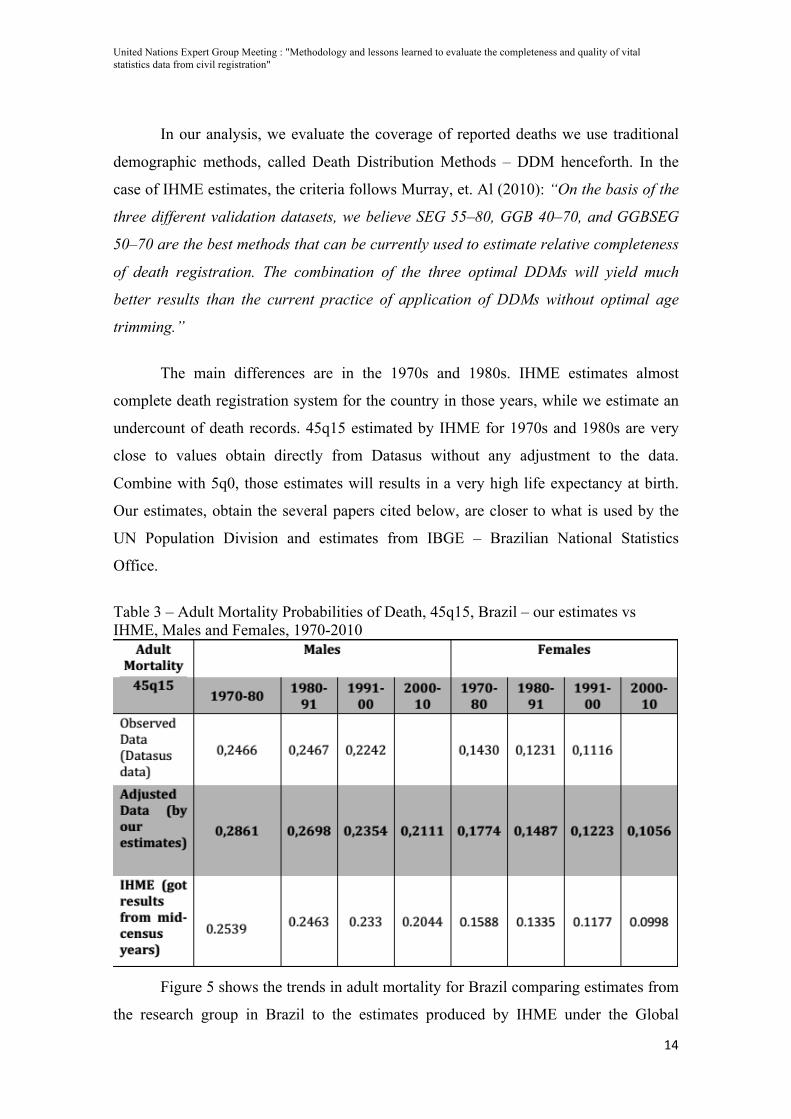
In our analysis, we evaluate the coverage of reported deaths we use traditional
demographic methods, called Death Distribution Methods – DDM henceforth. In the
case of IHME estimates, the criteria follows Murray, et. Al (2010): “On the basis of the
three different validation datasets, we believe SEG 55–80, GGB 40–70, and GGBSEG
50–70 are the best methods that can be currently used to estimate relative completeness
of death registration. The combination of the three optimal DDMs will yield much
better results than the current practice of application of DDMs without optimal age
trimming.”
The main differences are in the 1970s and 1980s. IHME estimates almost
complete death registration system for the country in those years, while we estimate an
undercount of death records. 45q15 estimated by IHME for 1970s and 1980s are very
close to values obtain directly from Datasus without any adjustment to the data.
Combine with 5q0, those estimates will results in a very high life expectancy at birth.
Our estimates, obtain the several papers cited below, are closer to what is used by the
UN Population Division and estimates from IBGE – Brazilian National Statistics
Office.
Table 3 – Adult Mortality Probabilities of Death, 45q15, Brazil – our estimates vs IHME, Males and Females, 1970-2010
Figure 5 shows the trends in adult mortality for Brazil comparing estimates from
the research group in Brazil to the estimates produced by IHME under the Global
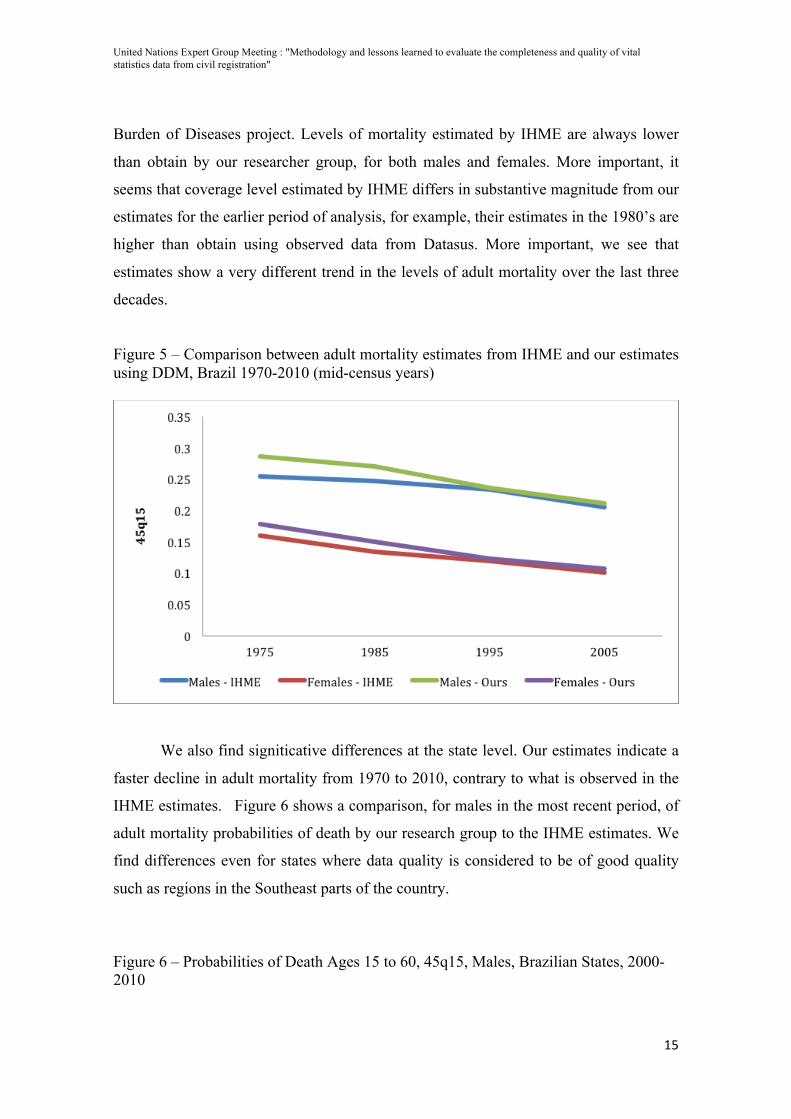
United Nations Expert Group Meeting : "Methodology and lessons learned to evaluate the completeness and quality of vital statistics data from civil registration"
15
Burden of Diseases project. Levels of mortality estimated by IHME are always lower
than obtain by our researcher group, for both males and females. More important, it
seems that coverage level estimated by IHME differs in substantive magnitude from our
estimates for the earlier period of analysis, for example, their estimates in the 1980’s are
higher than obtain using observed data from Datasus. More important, we see that
estimates show a very different trend in the levels of adult mortality over the last three
decades.
Figure 5 – Comparison between adult mortality estimates from IHME and our estimates using DDM, Brazil 1970-2010 (mid-census years)
We also find signiticative differences at the state level. Our estimates indicate a
faster decline in adult mortality from 1970 to 2010, contrary to what is observed in the
IHME estimates. Figure 6 shows a comparison, for males in the most recent period, of
adult mortality probabilities of death by our research group to the IHME estimates. We
find differences even for states where data quality is considered to be of good quality
such as regions in the Southeast parts of the country.
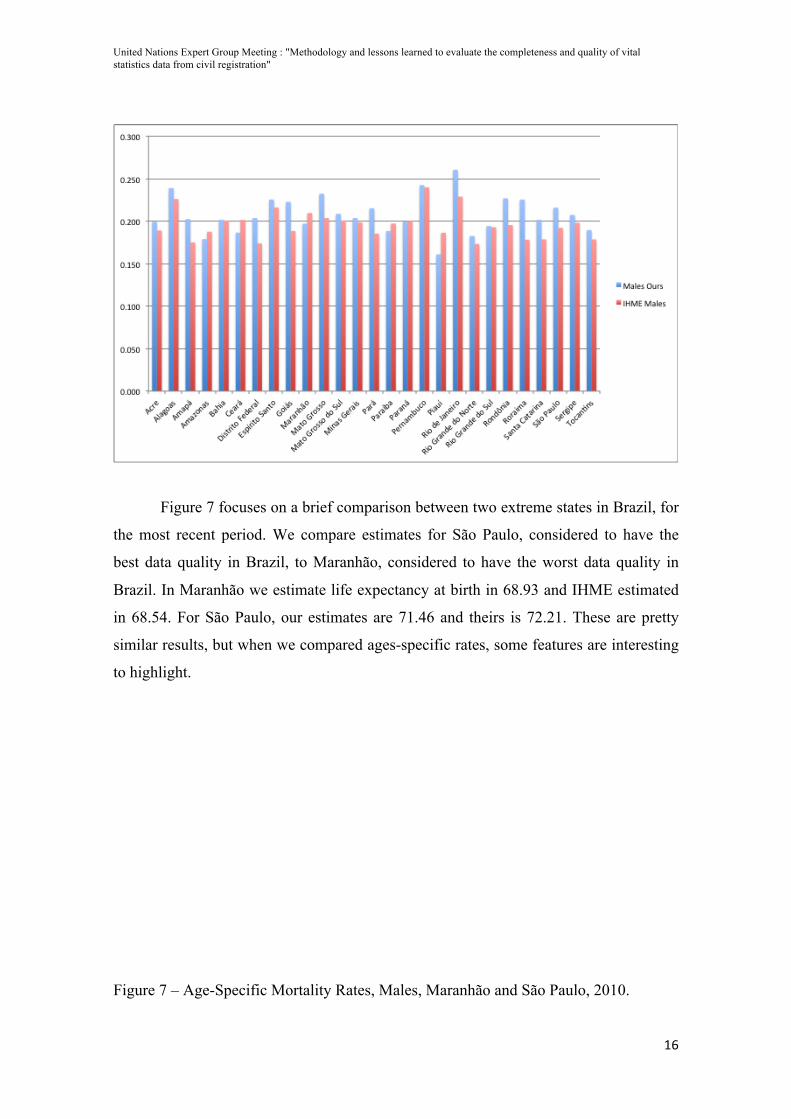
Figure 6 – Probabilities of Death Ages 15 to 60, 45q15, Males, Brazilian States, 2000-2010
United Nations Expert Group Meeting : "Methodology and lessons learned to evaluate the completeness and quality of vital statistics data from civil registration"
16
Figure 7 focuses on a brief comparison between two extreme states in Brazil, for
the most recent period. We compare estimates for São Paulo, considered to have the
best data quality in Brazil, to Maranhão, considered to have the worst data quality in
Brazil. In Maranhão we estimate life expectancy at birth in 68.93 and IHME estimated
in 68.54. For São Paulo, our estimates are 71.46 and theirs is 72.21. These are pretty
similar results, but when we compared ages-specific rates, some features are interesting
to highlight.
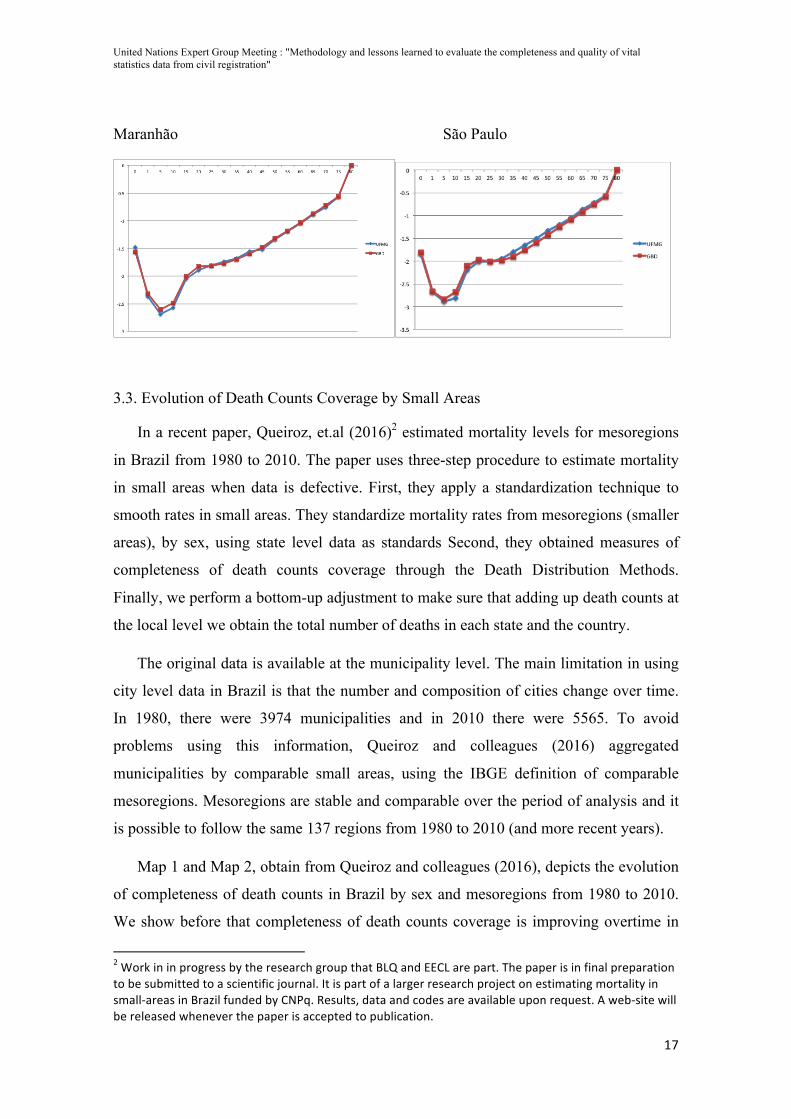
Figure 7 – Age-Specific Mortality Rates, Males, Maranhão and São Paulo, 2010.
United Nations Expert Group Meeting : "Methodology and lessons learned to evaluate the completeness and quality of vital statistics data from civil registration"
17
Maranhão São Paulo
3.3. Evolution of Death Counts Coverage by Small Areas
In a recent paper, Queiroz, et.al (2016)2 estimated mortality levels for mesoregions
in Brazil from 1980 to 2010. The paper uses three-step procedure to estimate mortality
in small areas when data is defective. First, they apply a standardization technique to
smooth rates in small areas. They standardize mortality rates from mesoregions (smaller
areas), by sex, using state level data as standards Second, they obtained measures of
completeness of death counts coverage through the Death Distribution Methods.
Finally, we perform a bottom-up adjustment to make sure that adding up death counts at
the local level we obtain the total number of deaths in each state and the country.
The original data is available at the municipality level. The main limitation in using
city level data in Brazil is that the number and composition of cities change over time.
In 1980, there were 3974 municipalities and in 2010 there were 5565. To avoid
problems using this information, Queiroz and colleagues (2016) aggregated
municipalities by comparable small areas, using the IBGE definition of comparable
mesoregions. Mesoregions are stable and comparable over the period of analysis and it
is possible to follow the same 137 regions from 1980 to 2010 (and more recent years).
Map 1 and Map 2, obtain from Queiroz and colleagues (2016), depicts the evolution
of completeness of death counts in Brazil by sex and mesoregions from 1980 to 2010.
We show before that completeness of death counts coverage is improving overtime in
2 Work in in progress by the research group that BLQ and EECL are part. The paper is in final preparation to be submitted to a scientific journal. It is part of a larger research project on estimating mortality in small-‐areas in Brazil funded by CNPq. Results, data and codes are available upon request. A web-‐site will be released whenever the paper is accepted to publication.
United Nations Expert Group Meeting : "Methodology and lessons learned to evaluate the completeness and quality of vital statistics data from civil registration"
18
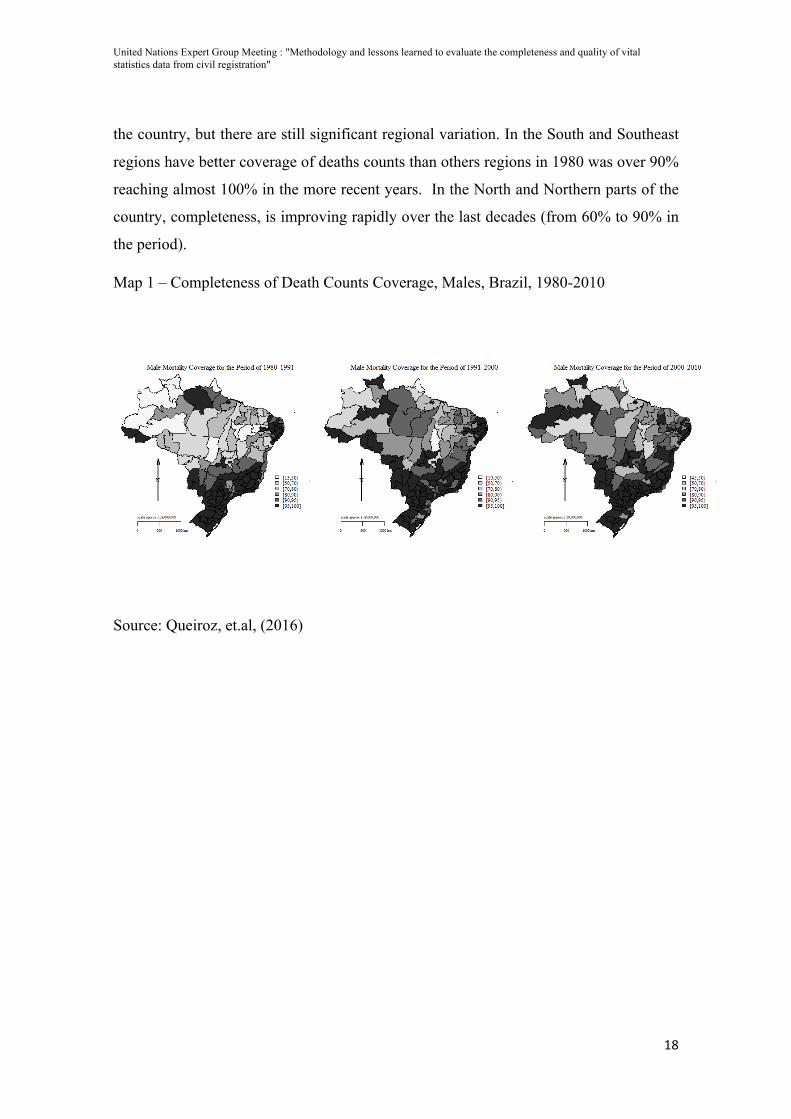
the country, but there are still significant regional variation. In the South and Southeast
regions have better coverage of deaths counts than others regions in 1980 was over 90%
reaching almost 100% in the more recent years. In the North and Northern parts of the
country, completeness, is improving rapidly over the last decades (from 60% to 90% in
the period).
Map 1 – Completeness of Death Counts Coverage, Males, Brazil, 1980-2010
Source: Queiroz, et.al, (2016)
United Nations Expert Group Meeting : "Methodology and lessons learned to evaluate the completeness and quality of vital statistics data from civil registration"
19
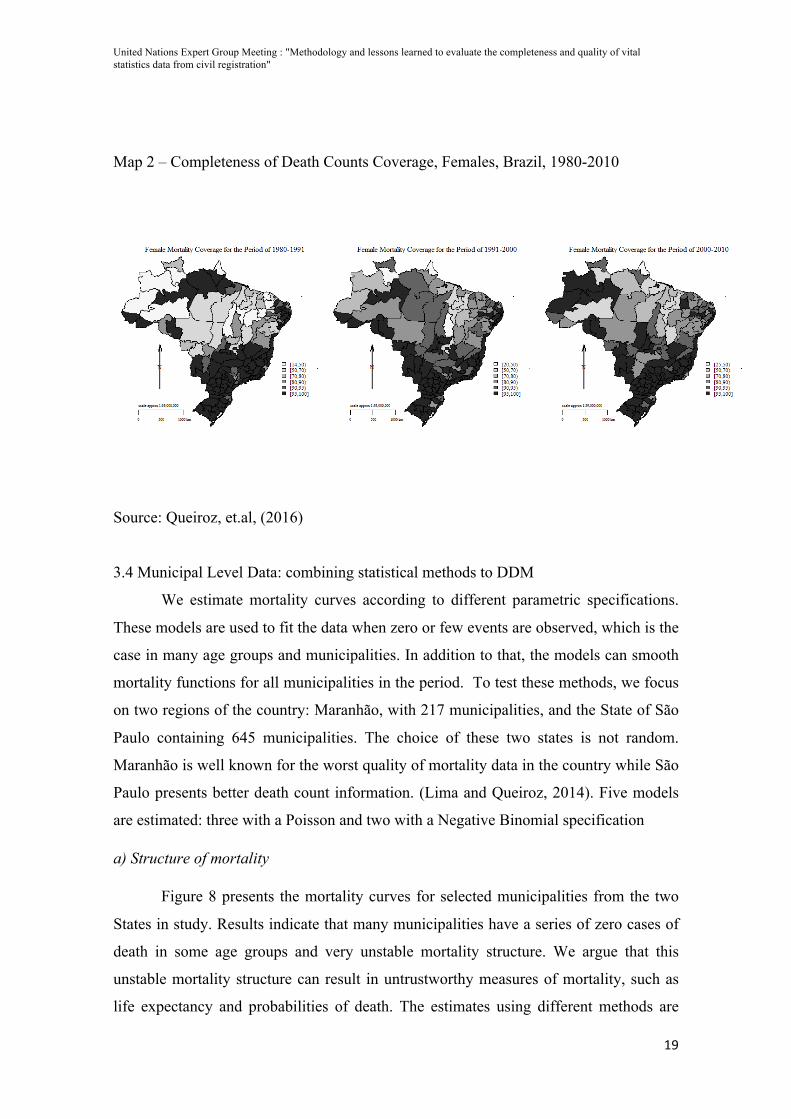
Map 2 – Completeness of Death Counts Coverage, Females, Brazil, 1980-2010
Source: Queiroz, et.al, (2016)
3.4 Municipal Level Data: combining statistical methods to DDM
We estimate mortality curves according to different parametric specifications.
These models are used to fit the data when zero or few events are observed, which is the
case in many age groups and municipalities. In addition to that, the models can smooth
mortality functions for all municipalities in the period. To test these methods, we focus
on two regions of the country: Maranhão, with 217 municipalities, and the State of São
Paulo containing 645 municipalities. The choice of these two states is not random.
Maranhão is well known for the worst quality of mortality data in the country while São
Paulo presents better death count information. (Lima and Queiroz, 2014). Five models
are estimated: three with a Poisson and two with a Negative Binomial specification
a) Structure of mortality
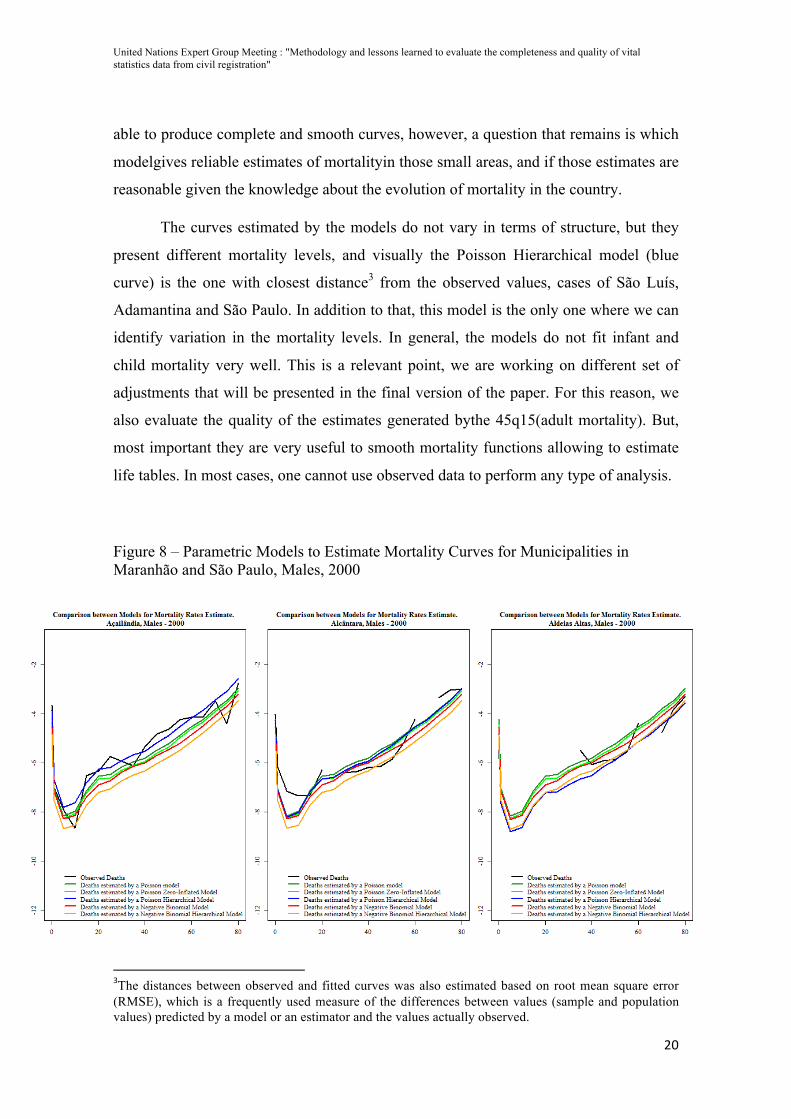
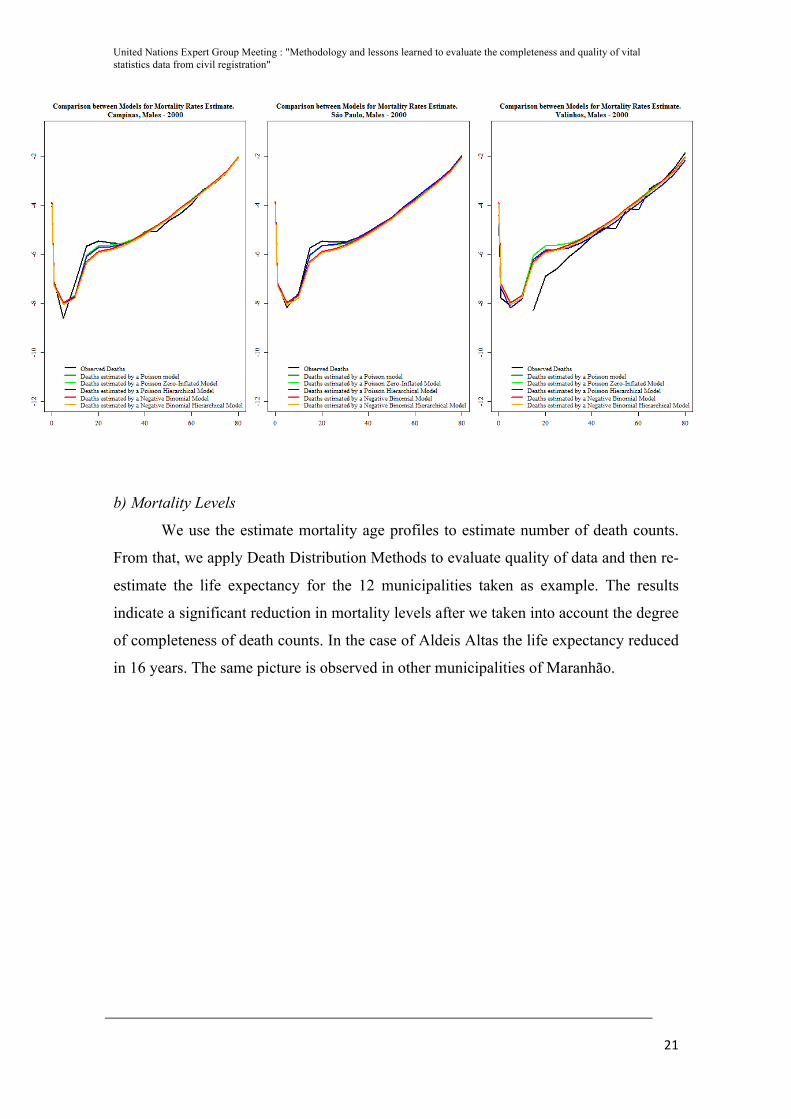
Figure 8 presents the mortality curves for selected municipalities from the two
States in study. Results indicate that many municipalities have a series of zero cases of
death in some age groups and very unstable mortality structure. We argue that this
unstable mortality structure can result in untrustworthy measures of mortality, such as
life expectancy and probabilities of death. The estimates using different methods are
United Nations Expert Group Meeting : "Methodology and lessons learned to evaluate the completeness and quality of vital statistics data from civil registration"
20
able to produce complete and smooth curves, however, a question that remains is which
modelgives reliable estimates of mortalityin those small areas, and if those estimates are
reasonable given the knowledge about the evolution of mortality in the country.
The curves estimated by the models do not vary in terms of structure, but they
present different mortality levels, and visually the Poisson Hierarchical model (blue
curve) is the one with closest distance3 from the observed values, cases of São Luís,
Adamantina and São Paulo. In addition to that, this model is the only one where we can
identify variation in the mortality levels. In general, the models do not fit infant and
child mortality very well. This is a relevant point, we are working on different set of
adjustments that will be presented in the final version of the paper. For this reason, we
also evaluate the quality of the estimates generated bythe 45q15(adult mortality). But,
most important they are very useful to smooth mortality functions allowing to estimate
life tables. In most cases, one cannot use observed data to perform any type of analysis.
Figure 8 – Parametric Models to Estimate Mortality Curves for Municipalities in Maranhão and São Paulo, Males, 2000
3The distances between observed and fitted curves was also estimated based on root mean square error (RMSE), which is a frequently used measure of the differences between values (sample and population values) predicted by a model or an estimator and the values actually observed.
United Nations Expert Group Meeting : "Methodology and lessons learned to evaluate the completeness and quality of vital statistics data from civil registration"
21
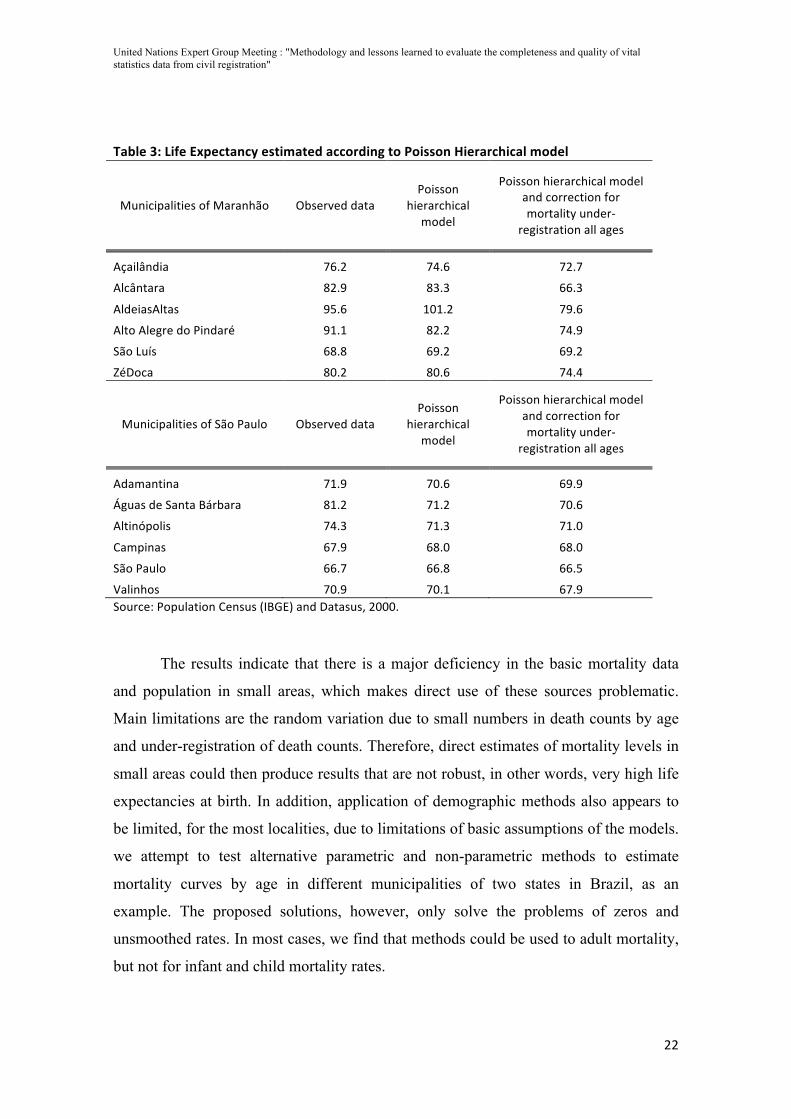
b) Mortality Levels
We use the estimate mortality age profiles to estimate number of death counts.
From that, we apply Death Distribution Methods to evaluate quality of data and then re-
estimate the life expectancy for the 12 municipalities taken as example. The results
indicate a significant reduction in mortality levels after we taken into account the degree
of completeness of death counts. In the case of Aldeis Altas the life expectancy reduced
in 16 years. The same picture is observed in other municipalities of Maranhão.
United Nations Expert Group Meeting : "Methodology and lessons learned to evaluate the completeness and quality of vital statistics data from civil registration"
22
Table 3: Life Expectancy estimated according to Poisson Hierarchical model
Municipalities of Maranhão Observed data Poisson
hierarchical model
Poisson hierarchical model and correction for mortality under-‐
registration all ages
Açailândia 76.2 74.6 72.7
Alcântara 82.9 83.3 66.3
AldeiasAltas 95.6 101.2 79.6
Alto Alegre do Pindaré 91.1 82.2 74.9
São Luís 68.8 69.2 69.2
ZéDoca 80.2 80.6 74.4
Municipalities of São Paulo Observed data Poisson
hierarchical model
Poisson hierarchical model and correction for mortality under-‐
registration all ages
Adamantina 71.9 70.6 69.9
Águas de Santa Bárbara 81.2 71.2 70.6
Altinópolis 74.3 71.3 71.0
Campinas 67.9 68.0 68.0
São Paulo 66.7 66.8 66.5
Valinhos 70.9 70.1 67.9 Source: Population Census (IBGE) and Datasus, 2000.
The results indicate that there is a major deficiency in the basic mortality data
and population in small areas, which makes direct use of these sources problematic.
Main limitations are the random variation due to small numbers in death counts by age
and under-registration of death counts. Therefore, direct estimates of mortality levels in
small areas could then produce results that are not robust, in other words, very high life
expectancies at birth. In addition, application of demographic methods also appears to
be limited, for the most localities, due to limitations of basic assumptions of the models.
we attempt to test alternative parametric and non-parametric methods to estimate
mortality curves by age in different municipalities of two states in Brazil, as an
example. The proposed solutions, however, only solve the problems of zeros and
unsmoothed rates. In most cases, we find that methods could be used to adult mortality,
but not for infant and child mortality rates.
United Nations Expert Group Meeting : "Methodology and lessons learned to evaluate the completeness and quality of vital statistics data from civil registration"
23
4. Discussion
Adult mortality estimates for developing countries are less satisfactory than
infant and child mortality estimates. There are two main reasons for that: there is not an
equivalent to birth history to estimate child mortality from surveys and the methods
used to estimate adult mortality from surveys are less robust than the ones used to
estimate infant and child mortality. In result, we know much less about level and trends
of adult mortality in developing countries than what we know about infant and child
mortality.
The results about the evolution of completeness of death counts and adult
mortality in Brazil show us remarkable regional differences on the completeness of
deaths counts and adult mortality across three last decades. For both sex the North and
Northeast Brazil had more improvement on the completeness of deaths counts during
the last three decades. Areas closest of the states’ capitals have higher coverage during
all the period on both regions. Estimations of infant deaths coverage using a procedure
called Active Search on the Northeast and Amazon regions (Szwarcwald et al, 2011)
showed that the deaths under-reporting on those areas should be lower than the official
estimates (IBGE, 2016).
In this paper we find that:
1. Quality of death counts registration in Brazil is improving over time and across
the country;
2. However, there is a wide regional variation. We find regions with complete
records in the South and Southeast parts of the countries and some regions in the
North and Northeast parts with very low levels of completeness.
3. There is a close association with development level
4. Quality of female registration is lower than for males, and this should be a point
of analysis
5. Methods and combination of methods work well for sub-national levels. Results
from 1980 to 2010 for meso-regions are very promising even using traditional
demographic methods
6. Combination of methods and combination of demographic and statistical
methods are very promising, but one should be careful with migration and small
number issues;
United Nations Expert Group Meeting : "Methodology and lessons learned to evaluate the completeness and quality of vital statistics data from civil registration"
24
The observed improvements seem to be very close associated to investments in
the public health care system and administrative procedures to collect vital statistics
(França, et.al, 2008; França, et.al, 2011). Thus, the quality of mortality data for adults
seems to have expressively improved through the years and across many regions. At the
same time, we find that in areas where mortality is concentrated at older ages the
percentage of deaths registered as ill-defined also increase.
The main limitation is the application of the death distribution methods for small
areas. The methods make strong assumptions about closed population and constant
quality of declaration across age that is more limited for smaller areas. We believe that
this is an important area of future research. In this paper, we have followed similar
approach performed by others and we considered them to be reasonable based on the
relative pattern of completeness across regions. Despite these limitations, we believe
that the study gives important insights about the evolution of data quality in Brazil and
indicates that the South, Southeast and Mid-West regions have good mortality data and
the North and Northeast are improving consistently in recent years.
The analysis suggests that efforts from the central and local governments to
improve data quality in Brazil are being successful, and they will allow a better
understanding of the dynamics of health and mortality transition in Brazil. Continuous
investments in the Brazilian Family Health Program could have important impacts on
the improvement of mortality data quality in Brazil since its personnel works closely to
the community and follows the health status of several individuals under their
jurisdiction.
References AbouZahr, Carla, Don De Savigny, Lene Mikkelsen, Philip W. Setel, Rafael Lozano, and Alan D. Lopez. "Towards universal civil registration and vital statistics systems: the time is now." The Lancet 386, no. 10001 (2015): 1407-1418.
Agostinho, C. S., & Queiroz, B. L. (2008). Estimativas da mortalidade adulta para o Brasil no período 1980/2000: uma abordagem metodológica comparativa. Anais do XVI Encontro Nacional da ABEP.
Assunção, R. M.; Schmertmann, C. P.; Potter, J. E.; Cavenaghi, S. M. (2005).Empirical Bayes Estimation of Demographic Schedules for Small Areas.Demography, Vol. 42, No. 3, (Aug., 2005), pp. 537-558.
United Nations Expert Group Meeting : "Methodology and lessons learned to evaluate the completeness and quality of vital statistics data from civil registration"
25
Bernardinelli, L. and Montomoli, C. (1992). Empirical Bayes versus fully Bayesian analysis of geographical variation in disease risk.Statistics in Medicine, 11: 983-1007.
Banister, J; Hill, K. Mortality in China 1964-2000. Population Studies, 2004, v. 58, n. 1, p.55-75
Bennett, NG;Horiuchi, S. (1981) Estimating the Completeness of Death Registration in a Closed Population. Population Index 47(2):207-21.
Bhat, Mi. (2002). General growth balance method: a reformulation for populations open to migration. Population Studies, 56 , 23-34
Brass, W. (1964) Uses of census or survey data for the estimation of vital rates" (E/CN.14/CAS.4/V57), Paper prepared for the African Seminar on Vital Statistics, Addis Abbaba . 14-19 December.
Brass, W. (1975). Methods for Estimating Fertility and Mortality from Limited and Defective Data. Chapel Hill, N.C: International Programme of Laboratories for Population Statistics, North Carolina Population Center, 1975.
Castro, M.C; Simoes, C.C.S. (2009). Spatio-Temporal Trends of Infant Mortality inBrazil. Paper presented at the XXVI IUSSP International Population Conference,Marocco.
Dorrington R.E. General Growth Balance. In Moultrie TA, RE Dorrington, AG Hill, KH Hill, IM Timæus and B Zaba (eds), Tools for Demographic Estimation. http://demographicestimation.iussp.org/content/general-growth-balance, 2011
Dorrington R.E. Synthetic extinct generations. In Moultrie TA, RE Dorrington, AG Hill, KH Hill, IM Timæus and B Zaba (eds), Tools for Demographic Estimation. http://demographicestimation.iussp.org/content/synthetic-extinct-generations, 2011
Dorrington, R e Timaeus, I. Death Distribution Methods for Estimating Adult Mortality: Sensitivity Analysis with Simulated Data Errors, Revisited. Paper presented at the 2008 Annual Meeting of the Population Association of America – Nova Orleans, Estados Unidos., 2008
Dorrington, R., Timaeus, I., Gregson, S. Adult Mortality in Southern Africa using Deaths reported by households: some methodological issues and results. Meeting of the Union for African Population Studies, 2007.
Ferguson, B.; Reniers, G.; Araya, T.; Jones, J. H.; Sanders, E. (2004) Empirical Bayes Estimationof Small Area Adult Mortality Risk in Addis Ababa, Ethiopia. In: Annual Meeting of the Population of Association of America – 2004. Boston, Massachusetts, April 1-3.
França E, Campos D, Souza MF. Use of verbal autopsy in a national health information system: Effects of the investigation of ill-defined causes of death on proportional mortality due to injury in small municipalities in Brazil. Population Health Metrics. 2011; 9: 39.
França EB, Abreu DMX, Rao C, Lopez A. Evaluation of cause-of-death statistics for Brazil, 2002 2004. International Journal of Epidemiology. 2008; 37:891-901.
United Nations Expert Group Meeting : "Methodology and lessons learned to evaluate the completeness and quality of vital statistics data from civil registration"
26
Hill, K. (1987). “Estimating census and death registration completeness.” Asian and Pacific Census Forum, 1(3): 8-13,23-24.
Hill, K. (2000). Methods for Measuring Adult Mortality in Developing Countries: A Comparative Review. The Global Burden of Disease in Aging Populations – Research Paper No. 01.13.
Hill, K. (2003). Metodos para estimar la mortalidad adulta en los paises en desarollo: una revision comparativa. Notas de Poblacion, no. 76 pps. 81-111.
Hill, K., & Queiroz, B. (2010). Adjusting the general growth balance method for migration. Revista Brasileira de Estudos de População, 27(1), 7-20.
Hill, K; Choi, Y; Timaeus, I. (2005). Unconventional approaches to mortality estimation. Demographic Research, v.13, p.281-300.
Hill, K; You, D; Choi, Y. (2009).Death Distribution Methods for Estimating Adult Mortality: sensitivity analysis with simulated data errors Demographic Research, vol 21, 2009 .
IBGE. Tábuas Abreviadas de mortalidade por sexo e idade: Brasil, Grandes Regiões e Unidades da Federação, 2010. Estudos e pesquisas. Informação Demográfica e Socioeconômica, n. 30. Rio de Janeiro: IBGE, 2013. Avaliable at: http://ibge.gov.br/home/estatistica/populacao/tabuas_abreviadas_mortalidade/2010/default.shtm. Access at: 07/07/2016.
Johnson, L. F., Dorrington, R. E., Laubscher, R., Hoffmann, C. J., Wood, R., Fox, M. P., ... & Davies, M. A. (2015). A comparison of death recording by health centres and civil registration in South Africans receiving antiretroviral treatment. Journal of the International AIDS Society, 18(1).
Lima, E. E. C. D., & Queiroz, B. L. (2014). Evolution of the deaths registry system in Brazil: associations with changes in the mortality profile, under-registration of death counts, and ill-defined causes of death. Cadernos de Saúde Pública, 30(8), 1721-1730.
Lima, E; Queiroz, B. Missov, T. Lenart, A. Reconstructing mortality in Brazilian municipalities: methods, limitations, and examples. Paper presented at the 2016 European Conference.
Lima, E. E. C.; Queiroz, B. L.. A evolução do sub-registro de mortes e causas de óbitos mal definidas em Minas Gerais: diferenciais regionais. Revista Brasileira de Estudos de População, Rio de Janeiro, v. 28, n. 2, p. 303-320, jul./dez. 2011.
Lima, E. E. C. D., Queiroz, B. L., & Sawyer, D. O. (2014). Estimating death counts completeness and mortality in small areas: an application to Minas Gerais microregions. Cadernos Saúde Coletiva, 22(4), 409-418.
Luy, M. (2010). A Classification of the Nature of Mortality Data Underlying the Estimates for the 2004 and 2006 United Nations' World Population Prospects. Comparative Population Studies, vol. 35, no. 2, 2010.
United Nations Expert Group Meeting : "Methodology and lessons learned to evaluate the completeness and quality of vital statistics data from civil registration"
27
Mathers,CD; Inoue, M; Rao, C; Lopez, AD. (2005). Counting the dead and what they died from: an assessment of the global status of cause of death data. Bulletin of the Word Health Organization 83(3), March: 171-9.
Ministério da Saúde. Sistema de Informações sobre Mortalidade (SIM) de 1979 a 2010.
Ministério da Saúde. Health surveillance in SUS: strengthening the responsiveness for old and new challenges. [Vigilância em saúde no SUS: fortalecendo a capacidade de resposta para velhos e novos desafios]. Brasília: MS; 2006:43–7. Available from: http://bvsms.saude.gov.br/bvs/publicacoes/vigilancia_saude_ SUS.pdf
Mahapatra P, Shibuya K, Lopez AD, Coullare F, Notzon FC, et al. (2007) Civil registration systems and vital statistics: successes and missed opportunities. Lancet 370: 1653–1663
Murray, CJL; Rajaratnam JK, Marcus J, Laakso T, Lopez AD. What can we conclude from death registration? Improved methods for evaluating completeness. PLoS Medicine. 2010 April 13; 7(4)
Paes, N. A. Avaliação da cobertura dos registros de óbitos dos Estados brasileiros em 2000. Revista de Saúde Pública, USP, v. 39 n.6, p. 882-90, 2005.
Paes, N. A.; ALBUQUERQUE, M. E. E. Avaliação da qualidade dos dados populacionais e cobertura dos registros de óbitos para as regiões brasileiras. Revista de SaúdePública, USP, v. 33, n. 1, p. 33-43, 1999.
Preston, Samuel, HEUVELINE, P. and GUILLOT, Michel. Demography: Measuring and Modeling Population Processes. Oxford: Blackwell, 2001.
Queiroz, B.L., Lima, E.; Freire, F; Gonzaga, M. (2016) “Temporal and spatial estimates of adult mortality for small areas in Brazil, 1980-2010”. Working Paper in preparation for submission.
Queiroz, B. L., & Sawyer, D. O. (2012). O que os dados de mortalidade do Censo de 2010 podem nos dizer. Rev Bras Estud Popul, 29, 225-38.
Queiroz, B. L. (2012). Estimativas do Grau de Cobertura e da Esperança de Vida para as Unidades da Federação no Brasil entre 2000 e 2010. XVIII Encontro de Estudos de População da ABEP, realizado em Águas de Lindóia, São Paulo, entre, 19.
Sawyer DO, Castilla FM. Dados, medidas e técnicas indiretas de estimação da mortalidade. Rev Bras Estud Popul 1989; 6:39-61
Sawyer, D. O.. A qualidade dos dados e as estimativas de mortalidade em algumas áreas brasileiras In: VI ENCONTRO NACIONAL DE ESTUDOS POPULACIONAIS, 1988, Olinda. Anais do VI Encontro Nacional de Estudos Populacionais. São Paulo: ABEP, 1988. v. 4. p. 301-324.
Setel P, MacFarlane SB, Szreter S, Mikkelsen L, Jha P, et al. (2007) Who Counts (1): A scandal of invisibility: making everyone count by counting everyone. Lancet 370: 1569–1577.
United Nations Expert Group Meeting : "Methodology and lessons learned to evaluate the completeness and quality of vital statistics data from civil registration"
28
Silva, Lariça Emiliano da, Flávio Henrique Miranda de Araújo Freire, and Rafael Henrique Moraes Pereira. "Diferenciais de mortalidade por escolaridade da população adulta brasileira, em 2010." Cadernos de Saúde Pública 32, no. 4 (2016).
Timaeus, I. M. Measurement of adult mortality in less developed countries: A comparative review. Population Index, v.57, n.4, p.552-568, 1991
United Nations. Principles and Recommendations for Population and Housing Censuses. Statistics Division, Department of Economic and Social Affairs. ST/ESA/STAT/SER.M/67?Rev.2. New York, 2007
United Nations – Population Division. Methods for Estimating Adult Mortality. New York, 2002
Wilmoth, J.; Zureick, S.; Canudas-Romo, V.; Inoue, M.; Sawyer, C. (2012). A flexible two-dimensional mortality model for use in indirect estimation. Population Studies, 66(1): 1-28.
Zlotnik H and Hill KH. (1981). "The Use of Hypothetical Cohorts in Estimating Demographic Parameters Under Conditions of Changing Fertility and Mortality." Demography 18(1):103-22.