Embed Size (px)
Citation preview

3_NWRA_GW_focus.doc
National and Regional Water Resource Assessments List of Reports/Documents/Web Sites
(Blue text indicates that a synopsis of primarily
groundwater information is provided on the following pages)
UN Department of Technical Co-operation for Development, Natural Resources/Water Series
1982
No. 4, GROUND WATER IN THE WESTERN HEMISPHERE
1983
No. 9, GROUND WATER IN THE EASTERN MEDITERRANEAN AND WESTERN ASIA
1983
No. 12, GROUND WATER IN THE PACIFIC REGION
1986
No. 15, GROUND WATER IN CONTINENTAL ASIA (CENTRAL, EASTERN, SOUTHERN,
SOUTH-EASTERN ASIA)
1988
No. 18, GROUND WATER IN NORTH AND WEST AFRICA
1989
No. 19, GROUND WATER IN EASTERN, CENTRAL AND SOUTHERN AFRICA
1990
No. 24, GROUND WATER IN EASTERN AND NORTHERN EUROPE
1991
No. 27, GROUND WATER IN WESTERN AND CENTRAL EUROPE
1977
UN, WATER DEVELOPMENT AND MANAGEMENT, Proceedings of the United Nations Water
Conference, Mar del Plata, Argentina, March 1977, includes Mar del Plata Action Plan.
1991
WMO/UNESCO, REPORT ON WATER RESOURCES ASSESSMENT, Progress in the
Implementation of the Mar del Plata Action Plan and a Strategy for the 1990‘s
1992
The World Bank, UNDP, African Development Bank, French Fund for Aid and Cooperation, Mott
MacDonald International et al (1992) Sub-Saharan Africa Hydrological Assessment – West African Countries,
Regional Report, December 1992
Live (since 1993)
FAO Aquastat
1996
WMO, The Adequacy of Hydrological Networks: A Global Assessment, WMO Technical Reports
in Hydrology and Water Resources No. 52, WMO/TD No. 740, Geneva, Shiklomanov, I.A.
1996
Water in southern Africa, SADC, IUCN, Southern African Research and Documentation Center,
Harare, Chenje M, and Johnson P. (eds.)
1997
UN Economic and Social Council, Comprehensive assessment of the fresh water resources of the
world.

3_NWRA_GW_focus.doc
1997
WMO/UNESCO, Assessment of Water Resources and Water Availability in the World, by Igor A.
Shiklomanov, State Hydrological Institute, Russian Federation
1997
WMO/UNESCO, WATER RESOURCES ASSESSMENT, HANDBOOK FOR REVIEW OF
NATIONAL CAPABILITIES
2002
The Chinese National Committee for IUGG, 1999-2002 quadrennial China National Report on
Geodesy and Geophysics to the membership of the International Union of Geodesy and Geophysics.
2003
Republic of Chad/UNDP, Integrated Plan for Chad‘s Water Development and Management, 2003-
2020
2003
UN WATER World Water Development Report 1
Case studies:
Chao Phraya River basin (Thailand)
Greater Tokyo (Japan)
Russian Federation (Lake Peipsi/Chudskoe-Pskovskoe, Estonia)
Lake Titicaca basin (Bolivia, Peru)
Ruhuna basins (Sri Lanka)
Seine-Normandy basin (France)
Senegal River basin (Guinea, Mali, Mauritania, Senegal)
2004
GROUNDWATER RESOURCES OF THE WORLD AND THEIR USE, IHP-VI, Series on
Groundwater No. 6
2005
Water Assessment of Nari River Basin and Water Policy Issues of Pakistan, International
Commission on Irrigation and Drainage (ICID)
2005
Abu Dhabi, Groundwater Assessment, Abu Dhabi
2005
Canada, Canadian Senate, Water in the West: Under Pressure, Fourth Interim Report of the
Standing Senate Committee on Energy, the Environment and Natural Resources
2006
UN WATER World Water Development Report 2
Case studies:
The Autonomous Community of the Basque Country (Spain)
Danube River Basin (Albania, Austria, Bosnia-Herzogovina, Bulgaria, Croatia, the Czech
Republic, Germany, Hungary, Italy, the Former Yugoslav Republic of Macedonia, Moldova, Poland,
Romania, Serbia and Montenegro, the Slovak Republic, Slovenia, Switzerland, Ukraine) Ethiopia
France
Japan
Kenya

3_NWRA_GW_focus.doc
Lake Peipsi (Estonia, Russian Federation)
Lake Titicaca (Bolivia, Peru)
Mali
The State of Mexico Mongolia (Tuul Basin)
La Plata Basin (Argentina, Brazil, Bolivia, Paraguay, Uruguay)
South Africa
Sri Lanka
Thailand
Uganda
2006
UNESCO/GW-MATE/iah,aih
NON-RENEWABLE GROUNDWATER RESOURCES, A guidebook on socially-sustainable
management for water-policy makers, Foster and Loucks
Case studies:
Saudi Arabia aquifers
North Western Sahara Aquifer System
Nubian Sandstone Aquifer System
The Great Artesian Basin, Australia
The Monturaqui-Negrillar-Piopzo Aquifer of Chile
The Jwaneng Northern Wellfield, Botswana
2007
International Water Management Institute, Water for food, Water for life, A Comprehensive
Assessment of water Management in Agriculture
2008
UN Water, Status Report on Integrated Water Resources Management and Water Efficiency Plans
for CSD 16.
Case studies:
Liao River basin (China)
La Cocha Logoon (Columbia)
Morocco Fergana Valley (Central Asia)
Sri Lanka
USA, New York
Kazakhstan Pungwe River (Mozambique/Zimbabwe)
Chile
Uganda
2008
USGS, Ground-Water Availability in the United States
2008
UNESCO/IHP/brgm, Les eaux souterraines dans le monde, by Jean Margat, in French

3_NWRA_GW_focus.doc
2009
UN WATER World Water Development Report 3
Case studies
Africa
Cameroon
Sudan
Swaziland
Tunisia
Zambia
Asia and the Pacific
Bangladesh
Yellow River basin (China)
Pacific islands
Cholistan desert (Pakistan)
Han River basin (Republic of Korea)
Walawe River basin (Sri Lanka)
Aral Sea basin (Uzbekistan)
Europe and North America
Estonia
Vuoksi River basin (Finland and the Russian Federation)
Po River basin (Italy)
Netherlands
Autonomous Community of the Basque Country (Spain)
Istanbul (Turkey)
Latin America and the Caribbean
La Plata River basin (Argentina, Bolivia, Brazil, Paraguay and Uruguay)
Lake Merín basin (Brazil and Uruguay)
2009
Australian Government, Department of the Environment, Water, Heritage and the Arts, National
Groundwater Assessment Initiative
2010
Encyclopedia of Earth, active web site (unsure of initiation date)
2010
UNDP/GEF support for Groundwater Assessment of the Pangani River Basin, Tanzania
2012
UN WATER World Water Development Report 4
Regional Reports planned
Africa
Asia and the Pacific
Europe
Latin America and the Caribbean
Western Asia

3_NWRA_GW_focus.doc
Brief Synopsis of Groundwater Topics in Reports
1977
UN, WATER DEVELOPMENT AND MANAGEMENT, Proceedings of the United Nations Water
Conference, Mar del Plata, Argentina, March 1977, includes Mar del Plata Action Plan. 70 page report ―The Water Resources of Latin America Regional Report‖, E/CONF. 70/A.16, page
721-790. Not reviewed yet.
Thirteen 1- to several-page reports on regional or country water resources, some specifically on
groundwater.
1991
WMO/UNESCO, REPORT ON WATER RESOURCES ASSESSMENT, Progress in the
Implementation of the Mar del Plata Action Plan and a Strategy for the 1990‘s,
Water Resources: availability of information and status of assessment capabilities (as
stated in title, this is not an assessment but an evaluation of the capability to conduct a Water
Resources Assessment)
ECA (Africa) ―In conclusion, due to the general shortfall in financial resources, the needs for improvement
in W R A technology are obvious and wide-ranging. Numerous specific needs can be
identified, such as for the development of groundwater monitoring networks (quantity and
quality), … hydrogeological characteristics, physiographic information (land use, soils,
geomorphology in particular).. . Indeed, there is a general and immediate need for more
effort to be put into virtually all aspects of W R A.‖ Page 23
Key Issues ―Data acquisition. Data collection networks are inadequate, and deteriorating, for
almost all parameters. Resources are urgently needed for rehabilitation, and for extension of
networks to cater for water quality, sediment transport, and groundwater data.‖ Page 25
ESCWA (The Arab States) ―The greatest emphasis is placed on water quantity data, but water quality is neglected; data
collection programmes for ephemeral rivers are far from adequate, and programmes for
groundwater are the least adequate of all.‖ Page 25
―Meteorological data tend to be the most satisfactory, and surface water data are fairly
satisfactory for perennial watercourses. Hydrogeological information is least satisfactory,
although there has been some progress in its provision; physiographic information is fairly
adequate, but soil, land use, and vegetation maps are needed, or need updating.‖ Page 25
―Major areas of need include improved measurement techniques for ephemeral rivers,
groundwater levels and quality, and rainfall characteristics, with an emphasis on
automatic, real-time, or remote sensing technology.‖ Page 26
ECLAC (Latin America and the Caribbean) ―Groundwater observations are practically non-existent in many countries, and water
quality data collection is also lacking.‖ Page 27
―Meteorological information is generally available, in the form of maps and atlases, but this
is not the case for hydrology, and particularly not for water quality or groundwater data.
However, U N E S C O projects on the surface water balance and hydrogeological mapping
have been instrumental in providing coverage.‖ Page 27
―Many countries have benefitted from the programmes of international agencies, for example
through the UNESCO regional projects on hydrogeological mapping and surface water
balance.‖ Page 28
ECE (North America and Europe) ―Water quality data, particularly for groundwater, and especially in central and eastern
Europe, are still insufficient; evapotranspiration and soil moisture data are also inadequate.
― Page 30
―Areal assessments of water resources are well developed in most ECE countries; there are
many "working" maps, sometimes published as hydrological atlases, while hydrogeological
maps are available for m u c h of the Region.‖ Page 30
―International co-operation is essential in shared river basins and aquifers, and has
reached a high standard of effectiveness in basins such as the Rhine, Danube, and others in
North America and Scandinavia.‖ Page 31

3_NWRA_GW_focus.doc
ESCAP (Asia and the Pacific) ―The ESCAP Region contains perhaps the greatest diversity of countries and conditions of
any of the regions, and so generalizations are even more difficult to develop at the regional
scale.‖ Page 31
―Attention has traditionally been focussed on precipitation and surface water data, and the
availability of groundwater, water quality, and other types of data are very
unsatisfactory at the regional scale. There has been little interest in integrated water
resources management or WRA, so that complementary types of data which could be
analysed together are frequently lacking.‖ Page 32
―Availability of water resources information is generally good throughout the Region,
particularly for surface water resources.‖ Page 32
―Many ESCAP countries have benefitted from international assistance, either through donor
or colonial aid, or through agencies of the U N System. Many water resources projects have
been funded, particularly in the Indian and southeast Asian sub-continents, and have
frequently included substantial incorporation of WRA, particularly with a groundwater
element.‖ Page 32
Key Issues ―Meeting user needs. Increasing pressure on water resources requires a greater
range of information, particularly on new water sources (especially groundwater) and water
quality (which is a growing constraint on the usability of water in many countries).‖ Page 34
Global overview ―Hydrological data banks. The efforts of WRA agencies and international agencies focussed
attention on the problem of the scarcity of data for water resource decision-making.
However, the growth that did occur took place disproportionately in the highly developed
regions of the world. More modest growth took place in developing regions, and the total
number of stations remains very low. In fact, most countries fall below the minimum density
guidelines established by WMO (reference 19). The fact is that in many of these countries
where data are needed the most, the networks are static or declining from already low
numbers of stations. Attention must be re-focussed on these regions, for without sufficient
basic data networks in operation, WRA activities cannot be carried out, and the concept of
sustainable development will remain illusory.‖ Page 37
― Suggestions: ―…networks of precipitation, groundwater and water quality stations are
urgently needed, especially in the ECA, ECLAC, and E S C W A Regions, and these
should be planned and co-ordinated with the hydrometric networks;‖ Page 38
Summary key WRA issues of global relevance ―It is striking how similar are the reports from the several regions, the ECE and to a lesser
extent ESCAP excepted. The same key issues were referred to by several of the regional
reports, and this is not an artifact of the procedures used, but of the situation as the regional
experts found it. It is unnecessary to summarize at length but the key points which seem to
have global relevance include:… The lack of data and data collection networks for
variables other than rainfall and surface water—water quality, groundwater, sediment,
water use, and associated information such as physiography and land use.
1992 The World Bank, UNDP, African Development Bank, French Fund for Aid and Cooperation, Mott MacDonald
International et al (1992) Sub-Saharan Africa Hydrological Assessment – West African Countries, Regional Report,
December 1992,
Chapter 2.4 Groundwater resources ―Purpose of this project was to evaluate the status of all existing hydrological data collection systems and to
make recommendations to enhance the performance of these systems, the ultimate aim being to assist the
countries in the establishment or improvement of a sound hydrological database for the purposes of planning
and evaluating water resources development programmes and projects.‖ Page S-1
This report provides a fairly detailed description of aquifers found in the 23 West African countries.
Chapter 2.4.2 Aquifers of the Coastal Basins
Geology and Structure
Aquifer recharge and resources
2.4.3 Aquifers of the Sedimentary Basins
Geology
3_NWRA_GW_focus.doc
Senegalo-Mauritanian Basin
Taoudenit Basin
Iillemmeden Basin
Chad Basin
2.4.4 Discontinuous Basins
Introduction
Distribution
Aquifer properties
Groundwater quality
Recharge
Development Potential
2.5 Comparison Between Water Resources and Future Demands
Chapter 4 Method of Assessment of Data Collection Systems
Chapter 5 Regional Data Collection Situation
Live (since 1993)
FAO Aquastat,
Aquastat is FAO‘s global information system on water and agriculture with a focus on irrigation.
The methodology of Aquastat was designed to fit an objective of developing a consistent basis of
assessment of water resources data in order to facilitate comparison between regions and countries.
Chapter 3 of the Review of World Water Resources by Country… Step 1 of the method is the
―Select the most accurate data sources‖. Also, under Data sources of the same chapter ―A major part
of the data originates from the country surveys carried out for 150 countries within the Aquastat
programme between 1993 and 2000. A compilation of the individual sources by country is available
on the Aquastat Web site (www.fao.org/ag/agl/aglw/aquastat/main/index.htm). Important note – as I
understand the Aquastat structure it considers only renewable groundwater resources, as estimated
from recharge to the aquifers.
Glossary of terminology used
in the water resources survey and in the country water balance sheets
Internal renewable water resources (IRWR) in km
3/year or 10
9m
3/year
Groundwater produced internally:
Long-term annual average groundwater recharge, generated from precipitation within the boundaries of the
country. Renewable groundwater resources of the country are computed either by estimating annual infiltration
rate (in arid countries) or by computing river base flow (in humid countries). [In another FAO document it says
―Depending on the source, the value provide under groundwater resources may indicate either the groundwater
recharge or the groundwater productivity.‖]
Overlap between surface water and groundwater:
Part of the renewable water resources which is common to both surface water and groundwater. It is equal to
groundwater drainage into rivers (typically, base flow of rivers) minus seepage from rivers into aquifers.
External renewable water resources (ERWR) in km3/year or 10
9m
3/year
External renewable groundwater resources Groundwater entering the country or external groundwater
Groundwater leaving the country or outflow into a neighbouring country
Total external renewable water resources
Total natural external renewable water resources (ERWRnatural)
The sum of the total natural external surface water resources and the external groundwater resources.
Total actual external renewable water resources (ERWRactual):
That part of the country's annual renewable water resources which is not generated in the country. It includes
inflows from upstream countries (groundwater and surface water), and part of the water of border lakes or
rivers.
Total renewable water resources (TRWR) in km3/year or 10
9m
3/year
Total natural renewable groundwater:

3_NWRA_GW_focus.doc
The sum of the internal renewable groundwater resources and the total external natural renewable groundwater
resources.
Total actual renewable groundwater:
The sum of the internal renewable groundwater resources and the total external actual renewable groundwater
resources. In general natural and actual external (entering) renewable groundwater resources are considered to
be the same.
Exploitable water resources in km3/year or 10
9m
3/year
Exploitable regular renewable groundwater resources:
Annual average quantity of groundwater that is available with an occurrence of 90 percent of the time. It is the
resource that is offered for groundwater extraction with a regular flow.
Other terms used
Non-renewable water resources: Groundwater bodies (deep aquifers) that have a negligible rate of recharge on the
human time-scale and thus can be considered as non-renewable. While renewable water resources are expressed in
flows, non-renewable water resources have to be expressed in quantity (stock).
1996
WMO, The Adequacy of Hydrological Networks: A Global Assessment, WMO Technical Reports
in Hydrology and Water Resources No. 52, WMO/TD No. 740, Geneva, Shiklomanov, I.A.
Does the ―Comprehensive Freshwater Assessment‖ mentioned in the above report exist?
{…requested by the UN Commission on Sustainable Development (CSD)] No assessments.
1997
WMO/UNESCO, WATER RESOURCES ASSESSMENT, HANDBOOK FOR REVIEW OF
NATIONAL CAPABILITIES
National assessment example (Guatemala) ―The example given has been selected from among the countries of Latin America and the Caribbean that used
the previous edition (1988) of the Handbook as a guide. The report produced in Guatemala in 1993 contains
almost 500 pages and was prepared by Sergio Hernandez, working inside the national hydrological service
(Instituto Nacional de Sismologia, Vulcanologia, Meteorlogia e Hidrologia). The structure of the report
follows almost exactly the chapters and subchapters of the 1988 Handbook.‖ Try to locate a copy of the
Guatemalan report.
Regional assessment example (Sub-Saharan Africa) ―The example chosen is the Sub-Saharan Africa Hydrological Assessment – West African Countries produced
by Mott MacDonald International et al (1992) as one of the contributions to the Sub-Saharan African
Hydrological Assessment Project. The region covered is the West African countries (see Figure A1). The
report is based pm a series of country reports combined to give a regional assessment.‖ Mott McDonald report
synopsis provided above under ―1992”.

3_NWRA_GW_focus.doc
2002
The Chinese National Committee for IUGG, 1999-2002 quadrennial China National Report on
Geodesy and Geophysics to the membership of the International Union of Geodesy and Geophysics.
2.1 GROUNDWATER EXPOITATION, UTILIZATION AND PROBLEMS ―The groundwater is not only an important component of water resources but also the major water supply
source in many cities and north areas of China. It plays an important role in guarantying the people‘s life,
promoting the economy development and improving the environment.
The mean annual amount of our country‘s groundwater resource is 828.8 billion m3, of which 676.2 billion m
3
produced in mountainous areas; 187.3 billion m3 belong to plain areas. There are 727.9 billion m
3 groundwater
is the repeated surface water which occupies 86.7% of the total amount of groundwater resource.
According to the occurrence of groundwater in rocks, the groundwater resource in our country can be divided
into four types: pore water in friable rock, fissured water in bedrock, Karst water and suprapermafrost water.
Among them, pore water in friable rock plays an important role in the exploitation and utilization of
groundwater resource in our country. It is mainly distributed in the plains and the basins, its amount is the
largest and is exploded and used widely. Fissured water in bedrock is mainly distributed in the fracture zone
and weathering zone of bedrock or the pore of clastic rock. It is very difficult to form a concentrated water
supply zone except a few developed areas of the bank water structure. Karst water mainly distributes in Karst
region, in most of the Karst region it is rich of groundwater and generally it‘s the source of water supply.
Precipitation and surface water are the main recharge source of groundwater. The distribution of groundwater
is very uneven in our country. The calculated area of the groundwater resource of the Yellow River, the Huaihe
River, the Haihe River, the Songliao River in north and the Inland occupy 61 percent of the total calculated
area of China. The annual groundwater resource amount in above areas is 255.1 billion m3, only occupies 31
percent of the total groundwater resource amount of China. On the other hand, the calculated area of the
Changjiang River, Zhujiang River in south and some rivers in southeast and southwest occupy 39 percent of
the total calculated area of China, their annual average groundwater resource amount is 573.7 billion m3, which
occupies 69 percent of the total annual groundwater resource amount of China.
2.1.1 Exploitation and Utilization of Groundwater
Compared to other water resource, the groundwater has many advantages. First, it has good quality because it
is filtrated and cleaned in the unsaturated zone in the process of forming groundwater. Second, the investment
of groundwater supply engineering is very little but the efficiency is fast.
It has a long history to exploit and use groundwater in China. Before the mid of 1960s, the exploitation of the
groundwater is relative little. From the mid of 1960s to the end of 1970s, it is the period of developing and
utilizing groundwater in large scale in China. To the end of 1979, the total exploitation amount of groundwater
in whole country reached 40 billion m3. Since 1980, with the rapid development of national economy and the
sharp increasing of water consumption the exploitation amount of groundwater has been up to 109.5 billion m3
in 2001.
According to the statistics, in 2001, the total amount of water supply in whole country is 556.7 billion m3,
among which 445.1 billion m3 is from surface water sources, accounting for 79.9 percent of the total amount;
while 109.5 billion m3 is from groundwater sources, accounting for 19.7 percent; and 2.2 billion m3 is from
other water supply sources, accounting for 0.4%. Groundwater is the important water supply source in north of
China. In Hebei Province the amount of groundwater supply is about three quarters of the total amount; in
Beijing City, Shanxi Province, Henan Province and Shandong Province 50%—70% water supply depends on
groundwater; and in Liaoning Province, Shanxi Province, Inner Mongolia, Heilongjian Province, Tianjing City
and Jilin Province about 30%—50% water supply is from groundwater.
Up to now, nearly 400 cities in China develop groundwater as their water supply source. Accounting to the
incompletely statistics, more than 60 cities regarded groundwater as their mainly water supply source, such as
Shijiazhuang City, Taiyuan City, Hohhot City, Shenyang City, Jinan City, Haikou City, Xi‘an City, Xining City,
Yichuan City, Urumqi City, Lhasa City and so on. Other cities which regarded the groundwater and surface
water as their water supply are as follows: Beijing City, Tianjin City, Dalian City, Harbin City, Nanjing City,
Hangzhou City, Nanchang City, Qingdao City, Zhengzhou City, Wuhan City, Chengdu City, Guiyang City,
Kunmin City, Lanzhou City, Changchun City, Shanghai City and so on.
2.1.2 Problems in the Process of Developing Groundwater
The exploitation and utilization of the groundwater contributes a lot for the national economy development and
increasing people‘s life level. On the other hand, because it is not controlled well the serious over exploitation
in many regions caused many geological problems such as the groundwater depression continually, seawater
invasion, downward of salt-water interface, subsidence of land surface and desertification, etc. According to
the statistics, up to now more than 160 regions have the problem of over exploitation of groundwater in China
and the total area of over exploitation regions is about 180000 km2, among which the area of severely over
exploitation is up to 80000 km2 occupied more than 40% of the total over exploitation area.
3_NWRA_GW_focus.doc
According to the partition of the administration, there are 24 provinces of China exist the problem of
groundwater over-exploitation, among them Hebei Province is the largest one, where over-exploitation area
has achieved 67000 km2, occupies 90% of its plain area.
A series of environmental and geological problem appeared because of the groundwater over-exploitation,
which is as follows:
(a) Regional groundwater depression continually.
Because of the over-exploitation of the groundwater continually and with high intensity in some regions, the
groundwater resource can‘t be recharged in time and the depression cones is enlarged, which even leads to the
draining of the aquifer, reduction of water yield of a single well or discard the wells as useless and the
depletion of the water resource. For instance, in Shijiazhuang City of Hebei Province because of the over
exploitation of groundwater for a long time the depression cone is enlarged every year.
(b) Subsidence of land surface
The over-exploitation of the groundwater not only cause the water level declined greatly, but also lead to land
surface subsidence in some areas mainly with the deep groundwater exploitation. The areas where the
subsidence is very severely are as follows: Tianjin City, Cangzhou City, Xi‘an City and Taiyuan City in north
of China; Shanghai City, Puyang City, Wuxi City and Changzhou City in the south.
(c) Seawater Invasion
Seawater invasion is mainly occurred in the coastal regions of China. The reason is that after the large number
exploitation of the groundwater, arisen the seawater circumfluence. The relatively severe areas are Dalian City
in Liaoning Province, Qinghuangdao City in Hebei Province, Qingdao City in Shandong Province and so on.
(d) Ground collapse
The over-exploitation of the groundwater in bed rock region (mainly in Karst area) will lead to some bad
geological phenomena such as ground collapse and fissure and so on. Ground collapse is occurred widely in
our country but in the south the occurring rate is higher than the north because of the distribution of Karst
water.
(e) Pollution of Groundwater
Over-exploitation of the groundwater not only quickened the infiltration of surface water but also the pollutant
in the surface water so the groundwater is polluted. Once it happened it is difficult to recover. Now the
groundwater resource is polluted very severely in many cities. According to the statistic there are more than
130 big and middle cities whose groundwater is polluted in varied degree and the main pollution source is
industry and living pollution. The groundwater in local agricultural region is also polluted, which is mainly
distributed in the sewage irrigation area of the suburb. Up to now, there is over 20 million mu * farms irrigated
by sewage water that leads to the pollution of groundwater directly and the pesticide and the fertilizer pollute
others.
(f) Soil desertification
The continuous decline of groundwater level will lead to the degeneration of vegetation and destroyed
environment, which is the one reason of soil desertification. This phenomenon has occurred in Inner Mongolia,
northwest of China and some parts of Heibei Province.
2.2 MONITORING AND MANAGEMENT OF GROUNDWATER
2.2.1 Groundwater Monitoring
The groundwater dynamic monitoring began from the 1960s in the departments of Ministry of Water
Resources. After several years‘ hard work we set up a groundwater monitoring network with a certain scale
which provide the evidence for water resource management and reasonable development and utilization of
groundwater. Now there are more than 12000 basic monitoring wells and 10000 uniformed monitoring wells.
The monitoring items include groundwater level, water amount, water quality and water temperature and so
on. In addition, combining the demand of groundwater exploitation and management in the departments of city
construction and land resources, we lay out some groundwater observation wells and the investigate spots near
the areas of water supply and of depression cones in order to monitor groundwater dynamic state.
But the work of groundwater monitor is still weak and it‘s difficult to meet the demand of water resources
management and regulation. Many problems are still existed including the sparse density of observation wells,
lack of monitoring wells in the funnel area and important water sources, the old monitoring equipments, the
laggard observation and transmission method which can‘t ensure the information will be transmitted in time,
and insufficient fund for groundwater monitor.
Currently, we have made ―The Plan of National Groundwater Monitor‖. We are planning to set up some stable
and long term groundwater monitoring stations in the main depression cones and important areas of
groundwater supply and the dynamic observation system for improving the level of groundwater monitor.
2.2.2 Management of Groundwater
On the one side, water resource is seriously short in our country and the over exploitation of groundwater leads
to many environmental and geological disasters. On the other side, the water wasting is very severely.

3_NWRA_GW_focus.doc
Irrigation is the main water consumer, which occupies 70% of the total water consumption in our country.
Because the irrigation method is out of date, most of the channels are soil channels plus the old facilities it is
still the traditional irrigation way in most of areas. In some irrigation areas farmers even still use the flooding
irrigation method, which waste water very serious. The utilization rate of industrial water consumption is not
high either. The water loss through the water transportation pipe and water facilities has reached over 20
percent and the public water waste is very serious.
In order to develop and utilize groundwater more reasonably, reduce the water waste, optimize the distribution
of water resource and improve the water utilization rate, in recent years we did a lot of work on the
groundwater planning and strengthening the legalization of groundwater management, which is useful for
restricting the groundwater over exploitation. Especially on the construction of legalization, we enact Water
Law of People‘s Republic of China, The Executed Rule of Water Using License, Water Resource
Demonstration & Management Rules of the Construction Project and so on. The Water Law revised and passed
on October 29, 2002 shows us we should obey the plans approved on the water activities such as exploitation,
utilization, saving, protection and management; if anyone who against the plan and lead to the river or lake
degeneration, groundwater over exploitation, ground subsidence and water body pollution he would be
responsible for the management. In the area of groundwater over-exploitation, the local government of the
county or above should limit the exploitation of groundwater strictly. In the area of severely over exploitation
we can divide the groundwater into the forbidden exploitation area and the limited exploitation area after
approved by the government of the province, the autonomous region and the municipality directly under the
Central Government. If exploit groundwater in the coastal regions we should take measures to avoid ground
subsidence and seawater invasion after scientific demonstration. The Executed Rule of Water Using License
shows us any water consumer take water from underground should apply the license from water administration
department except living water consumption. The total amount of groundwater consumption can‘t exeed the
total amount of the regional groundwater available and it must accord with the requirement of the overall
arrangement and water-taking layer. Water Resource Demonstration & Management Rules of the Construction
Project shows us for the new, rebuilding or expand construction projects that takes water from the rivers, lakes
and underground directly, the owner of the construction projects must apply the water license, and should carry
out the water resource demonstration and compile the report.
2.3 RESEARCH ON GROUNDWATER ANALYSIS Strengthen the research on groundwater analysis is the basis of the scientific management of groundwater. Recent
years we did a lot of work on groundwater analysis, the details are as follows.
2.3.1 Investigation and Assessment of Groundwater
The first national water resources assessment was carried out at the beginning of 1980s. During this period we
did national groundwater assessment, submitted the results of groundwater assessment and provided important
evidences for groundwater planning and management. But in the past 20 years, both of surface water and
groundwater varied greatly because of human activities. Thus it is necessary for us to hold the national water
resources assessment again. Now we are organizing to do the national water resources planning. The first work
we should do is water resources assessment, which includes the national groundwater assessment. It is
estimated that this work will be finished in two years. At the same time, combining the national land resource
investigation in recent years, we also carried out the initial investigation of groundwater, which has been
finished. Recent years ―Water Resources Bulletin in China‖ is published every year in Ministry of Water
Resources, which shows us the condition of groundwater development and utilization. In additional,
groundwater assessment is also done in many important projects such as Demonstration on the Engineering of
Diverting Water From the South to North, Water Resources Planning in North of China, etc., which provides
some basic information for reconnaissance and planning of engineering.
2.3.2 Prediction of Groundwater Dynamic Analysis
In order to provide groundwater dynamic information to the department concerned in time, Hydrology Bureau
of Ministry of Water Resources is organizing to establish a real time dynamic monitoring system of
groundwater, which provides groundwater monitoring information on time through internet and reflects the
dynamic variation in real time.
Many institutes and experts did a lot of work on the prediction of groundwater analysis.
At present there are many ways to do the dynamic prediction of groundwater level. The main method is to set
up a model of groundwater movement and simulate the process of groundwater movement and predict the
state. Using the traditional groundwater dynamic model we developed a lot of research work in Liaoning
Province, Shandong Province, Jiangsu Province, Inner Mongolia, Xinjiang municipality and Anhui Province.
Recently, we imported some groundwater analysis model from abroad such as MODELFLOW, ASMWIN and
so on. We did some experiments with these models in Anhui Province and Shandong Province and got some
achievements. Because of the spatial variation of the character of groundwater aquifer the parameter of
groundwater is uncertain and some precise physical concept models have a great limitation on expressing the

3_NWRA_GW_focus.doc
interrelation of every part of groundwater system. According to the mapping relation between the groundwater
level and its influence factors, many experts simulate the dynamic variation of the groundwater level with the
ANN model proposed by Dr. Rogers from Standford University. We carry out the experiments in some areas in
Henan Province and Hebei Province and acheive good results.
On the prediction of ground subsidence, through the research of ground subsidence caused by groundwater
over exploitation in Suzhou City of Jiangsu Province, Professor CHEN Chongxi established a mathematic
model accord with the geological condition and subsiding mechanism, ascertained the relative parameters,
predicted the amount of ground subsidence under the groundwater exploitation and proposed some
countermeasures to prevent ground subsidence in groundwater exploitation.
In order to protect the environment, many experts carried out a series of studies on the relationship between
groundwater and ecosystem. According to the research on the vegetation growth and groundwater dynamic
variation in northwest arid region, we think the best embedding depth of groundwater to develop groundwater
is in the depth of 4—5 m, which is benefit for vegetation growth and salinization prevention.
2.3.3 Analysis and Assessment of Groundwater Pollution
In China groundwater pollution is sharply increasing every year because of the surface water pollution,
irrigation with sewage water and unreasonable utilization of groundwater. Groundwater pollution has the
characteristics of point, line and side distribution. The point pollution indicates the local severe pollution
around the city and town or the farm because of the concentrated population, developed industry and feedlot
with middle or large scale in rural areas. The line pollution indicates the groundwater pollution around the river
caused by river pollution. The side pollution means the irrigation with sewage water and the pollution of
misusing fertilizer and pesticide in agriculture.
In recent years, we strengthened the work of water quality monitor and assessment in departments of water
resources and achieved many analysis and assessment results. At the same time in order to protect the safety of
water quality of water supply system, combining the rules of water using license, we constituted the rule of
water quality management of the license of using water which indicates that the water taken from underground
should be inspected and the water quality must meet the demand.
In 2000 according to analysis of groundwater quality done by Ministry of Land Resources in 130 cities and
areas of China, it can be considered the total water quality of groundwater in China is well but in most of the
cities the groundwater is suffered point and side pollution, which results in exceeding standard of some
elements in local regions. The main polluting elements are the degree of mineralization, the total degree of
hardness, sulphate, nitrate, nitrite, ammonia, nitrogen, chlorid, fluorid, pH value, iron and manganese, etc.
According to the pollution degree, the pollution of north cities is much higher than south cities where the
pollution elements are more and exceed the standard rate. Especially in north of China the pollution is most
outstanding.
2003
Republic of Chad/UNDP, Integrated Plan for Chad‘s Water Development and Management, 2003-
2020,
―4 WATER RESOURCES AND DEMAND SATISFACTION
Chad has significant groundwater resources spread throughout the country. These are located in continuous aquifers
covering about 75% of the country and discontinuous ones formed by the bedrock, particularly in the east of the country
with small fractions in the south. Renewable groundwater resources are evaluated at nearly 20 billion m3 a year,
whereas exploitable resources in the major aquifers are estimated at between 260 billion m3 and 540 billion m3.
However, it should be emphasised that based on the current state of knowledge concerning the hydrogeological
systems, it is only possible to discuss the operation of the aquifers in broad outline (in particular with regard to recharge
levels) and describe their approximate characteristics.
Water resources have many functions and uses. While surface water is essential in preserving biodiversity, it also plays
a major role in agriculture, fishing and stock-rearing, key components of food security and also major segments of the
country‘s economy. Groundwater is just as important, as in addition to making a significant contribution to stock-
rearing and agriculture, it is used by nearly 90% of Chadians as drinking water.‖ Page 54
“4.2 Groundwater resources Chad possesses major groundwater reserves. There are vast regions consisting of sedimentary formations (sand and
sandstone), containing continuous aquifers of various forms: unconfined aquifers (often referred to as ―water tables‖),
deep confined or semi-confined and artesian aquifers in certain hydraulic and topographical conditions. Continuous
aquifers represent almost three-quarters of the total surface area of the country. They are distributed over the three main
3_NWRA_GW_focus.doc
geoclimatic zones but are found mainly in the north, west and south of Chad. They include in particular the aquifers of
the Continental Terminal, Paleozoic Sandstones, Nubian Sandstones and Plio-Quaternary water-bearing system of the
Chad basin (Pliocene, Ogolian Sands, Pleistocene, Modji Series). Figure 11 shows the locations of the main
hydrogeological units in Chad. Other regions are less fortunate as their substratum consists of eruptive and/or
metamorphic rocks often dating from the Precambrian, where groundwater can only be found in weathered areas and
fracture systems affecting the bedrock (discontinuous bedrock aquifers). The area concerned by this type of aquifer
represents 340 000 km2, i.e., about a quarter of the total area of Chad. These aquifers are found mainly in the Tibesti
range, the central range (Guéra) and Ouaddaï; they are also found in the south of the country.‖ Page 60
Page 61
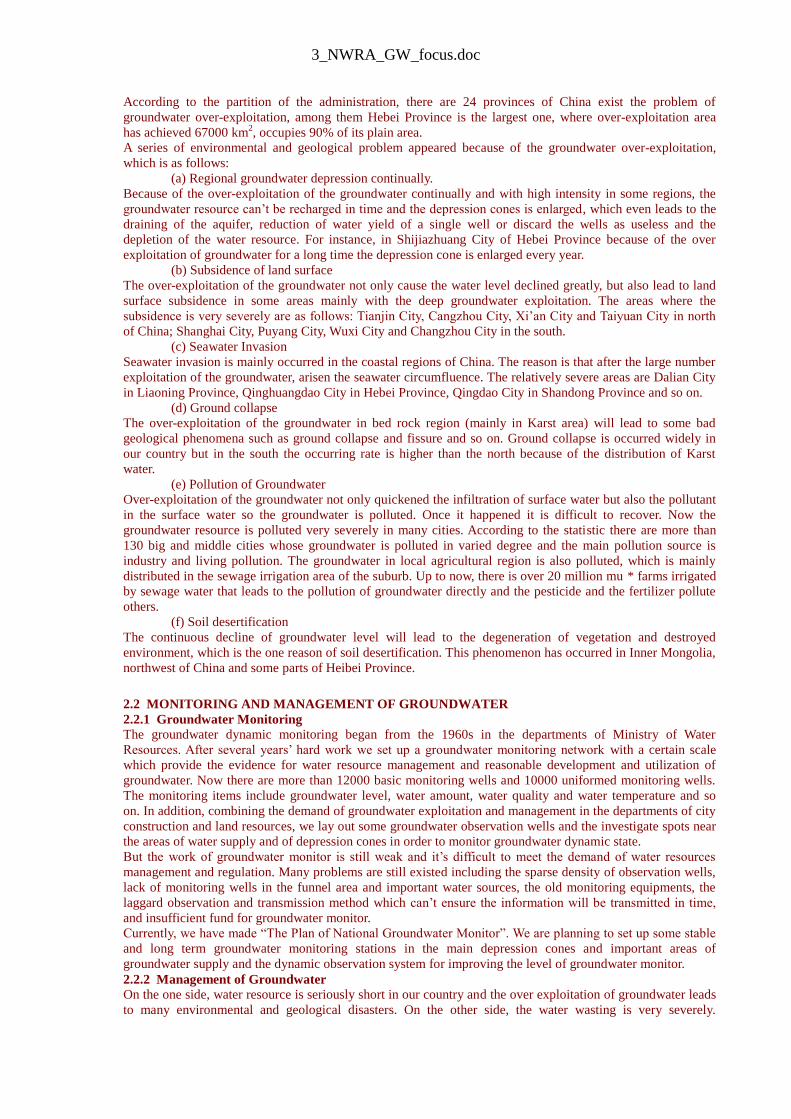
“4.2.1 The aquifers of Chad Tables 9 and 10 summarise the potential of the main aquifers in terms of renewable resources and
exploitable reserves. Table 11 summarises their main characteristics.
The following observations may be made from these tables and figures:
Annually renewable resources are estimated at nearly 20 billion m3. Only the Plio-quaternary and southern
Continental Terminal aquifers are recharged. The aquifers in the Sahelian zone and northern Continental
Terminal are not recharged or at least if there is any recharge it is minimal considering the existing climatic
conditions.
Exploitable reserves are considerable, amounting to between 260 billion and 550 billion m3 of water with
relatively little drawdown of the piezometric surface.‖ Page 62
3_NWRA_GW_focus.doc
―However, these observations should not hide the fact that current hydrogeological and hydrodynamic information
concerning the aquifers of Chad is insufficient to do more than give the main regional outlines of aquifer recharge
conditions and the potential for mobilising water resources. (bold and italics added to this sentence)
There are few and only isolated quantitative data concerning estimated rainfall infiltration into the aquifers, which is
often the main source of recharge. However, generally speaking, it is considered that south of the 500 mm isohyet,
which in Chad includes the Sudanian zone and the southern third of the Sahelian zone, the balance between rainfall and
evapotranspiration is usually positive so that aquifer recharge occurs through the infiltration of rainfall. One study in
fact evaluates the fraction of rainfall infiltrating into the southern Continental Terminal aquifer at between 50 and 150
mm/year, i.e., 5-13% of rainfall.
North of the 500 mm isohyet, in the semi-arid Sahelian zone, the balance between rainfall and evapotranspiration on
predominantly clayey soils is usually negative, which means that the rains do not infiltrate. Water losses through
evaporation from the water table appear to be between 0 and 2 mm/year in these areas, which can be explained by the
strong capillary forces in clayey materials.
In predominantly sandy areas, such as the Ogolian Sands aquifer, where rainfall is of the order of 150-
350 mm/year, infiltration may be of the order of 10-15 mm/year.
In the Sahelian zone, renewable resources in the regional aquifers (Plio-quaternary, discontinuous bedrock aquifers) by
infiltration of rainfall are generally limited to the southern part, between the 10th
and 12th parallels. They are estimated
at 3.5 billion m3/year in the case of the Plio-quaternary aquifers with infiltration of 15 mm/year. In the crystalline
basement area (north), infiltration is estimated at 14 mm/year. In the Saharan zone, with annual rains amounting to less

3_NWRA_GW_focus.doc
than 200 mm and a severely negative balance, it may be assumed that there is no aquifer recharge by infiltration of
rainfall.
4.2.2 Groundwater uses: total figures
Table 12 gives figures for groundwater abstraction for each aquifer and type of use. Abstraction is estimated indirectly,
by estimating the water requirements of each of the subsectors concerned and identifying the origin of the water
supplies.
An annual quantity of nearly 409 million m3 of water is abstracted from groundwater resources to meet the various
types of requirement. The Paleozoic Sandstones aquifer (non-renewable resources) is the one with the highest
abstraction rate, the water being used mainly for agricultural purposes. The Pleistocene and Continental Terminal
aquifers are also used, but mainly to help satisfy human and pastoral water supply requirements. The water currently
abstracted from aquifers in Chad represents only about 2.1% of renewable groundwater resources. However, it
should be noted that the above abstraction figures do not take into account the quantities removed in neighbouring
countries (Nigeria, Cameroon, Niger and Libya), which also exploit these various aquifers.‖ Page 65
―Total current abstraction of all water resources to satisfy the various types of use, without taking into account the
requirements of aquatic ecosystems, was estimated at 1.269 billion m3 in 2000. Of this quantity, 408 million m3 of
water was abstracted from the various aquifers and 861 million m3 was obtained from surface water. This represents
only about 2.8% of the average renewable water resources estimated over the past series of 20 dry years. In overall
terms, therefore, Chad has considerable renewable water resources in comparison with its needs. However, these
resources are distributed over the entire country and are extremely variable and fragile. The aquatic ecosystems,
particularly the large natural flood plains and peripheral areas around the different lakes, require natural annual flooding
by the rivers that supply them in order to guarantee their corresponding ecological, economic and social functions.‖
Page 66
2003
UN WATER World Water Development Report 1
Case studies:
Chao Phraya River basin (Thailand) “Groundwater Aquifer distribution
Hydrogeologically, the Chao Phraya River basin is comprised of seven groundwater sub-basins: Chiangmai-
Lampoon basin, Lampang basin, Payao basin, Prae basin, Nan basin, Upper Chao Phraya basin and Lower Chao Phraya
basin. Within these groundwater sub-basins, water is held in either confined or unconfined aquifers. Eight separate
confined aquifers are located in the Upper Tertiary to Quaternary strata of the Bangkok area. The natural
groundwater within this succession of aquifers is highly confined, creating artesian conditions in each. Ease of
exploitation, as well as the high chemical quality, are the main reasons for the original development of this source.
Groundwater storage and renewable resources have been estimated for each groundwater sub-basin, as shown in
table 16.5.
Recharge, flow and discharge
There are few existing estimates available of groundwater recharge on a regional basis. In an artesian aquifer, as that
beneath Bangkok, storage depletion is seen through a decline in piezometric pressure and a reduction in the area in
which artesian conditions exist. The continued decline in levels indicates that abstraction is not in balance with

3_NWRA_GW_focus.doc
recharge. In unconfined aquifers, abstraction of resources in excess of natural recharge normally leads to a much
lower rate of water level decline than that of confined aquifers.‖ Page 393
Table 16.4: Characteristics of major reservoirs Maximum retention Normal retention Minimum retention Effective storage Reservoir name Sub-basin (Mm3) (Mm3) (Mm3) (Mm3) Bhumiphol Ping 13,456 13,462 3,800 9,662 Sirikit Nan 10,640 9,510 2,850 6,660 Kiew Lom Wang 112 112 4 108 Mae Ngat Ping 325 265 10 255 Mae Kuang Ping 263 263 14 249 Mae Chang Wang 108 NA NA NA Thap Salao Sakae Krang 198 160 8 152 Kra Sieo Tha Chin 363 240 40 201 Pasak Pasak 960 NA NA 785 The two largest dams of the Chao Phraya River basin are Bumiphol and Sirikit; together, they control the runoff from 22 percent of the entire basin. Table 16.5: Groundwater storage and renewable water resource of the sub-basins Groundwater Renewable water storage resources Groundwater basin (million m3) (million m3) Chiangmai-Lampoon 485 97 Lampang 295 59 Chiangrai-Payao 212 42 Prae 160 32 Nan 200 40 Upper Chao Phraya 6,400 1,280 Lower Chao Phraya 6,470 1,294 Total 14,222 2,844 The calculation is based on the assumption that the amount of groundwater stored depends on the change of water level, the area of the aquifer and the storage characteristics, which vary with the geology of each area – unconfined, confined or semi-confined. The Upper and Lower Chao Phraya groundwater basins are by far the largest ones: they store about 90 percent of the overall groundwater resources of the case study area. The table assumes that only 5 percent is renewable each year, a very small amount of the total in the basins.
“Water quality Groundwater quality
The main chemical constituents affecting groundwater quality are sodium and chloride. The average salinity of the
groundwater in the unconfined aquifers shows a general increase in the downstream direction, with the exception of
the Ping catchment whose lowest salinity level is comparatively high for its upper catchment location. The
groundwater with the lowest salinity comes from the Wang catchment. Nitrate concentrations are almost invariably
low in all catchments. The extent to which chemical quality is affected by contamination is not known, except in some
specific areas.‖ Page 394
Greater Tokyo (Japan)
―General Context The enormous water resources needed to supply the cities and maintain the safety degree against drought are difficult to
manage. In addition, groundwater withdrawal is still causing land subsidence.‖ Page 484
―Groundwater resources are widely used in the region. One tenth of the water used to supply Tokyo metropolis is
from groundwater resources. Analyses of the water quality in 1998 show results lower than the standard values,
except for tetrachloroethylene (a product known to carry severe health risks), which exceeded environmental standards
in three out of eighty-seven measurement points (Environmental Bureau of the Tokyo Metropolitan Government,
2000).‖ Page 487
Groundwater resources make up 22.8 percent of total water use inland, and 13.1 percent in seaside areas. Some 45
percent of households and industries, considerably more than agricultures, rely on groundwater. So as to prevent land
subsidence, groundwater withdrawals have been regulated. Limits on withdrawals of groundwater come in the form
of two laws: the Industrial Water Law, which targets groundwater used for industrial purposes, and the Law
Concerning the Regulation of Pumping-up of Groundwater for Use in Buildings, which targets groundwater used for
cooling and other building-related purposes. Groundwater withdrawal in the northern part of the Kanto plain has
decreased from 13.1 bm3 in 1985 to 9.6 bm3 in 1999 (Water Resources Department, MLIT, 2001). As a result, the rate
of land subsidence has stabilized (see figure 22.3).‖ Page 488

3_NWRA_GW_focus.doc
“Box 22.1: Development of indicators GROUNDWATER • Dependence on groundwater inland parts: 22.8% seaside parts: 13.1%
• Groundwater withdrawal: northern part of Kanto plain: 960 million m3
• Degree of dependence of households on underground water: 18.7% ― Page 497
Russian Federation (Lake Peipsi/Chudskoe-Pskovskoe, Estonia)
No Groundwater aspects included in the case study
Lake Titicaca basin (Bolivia, Peru) “Groundwater As can be seen in map 21.3, the main aquifers are located in the middle and lower basins of the Ramis and Coata
Rivers, in the lower basin of Ilave River and in a strip that extends from Lake Titicaca toOruro, bordering the eastern
ridge. The approximate total volume of groundwater that goes into the system is 4 m3/s. Most of this groundwater
comes from tube wells used to supply water to cities. Such is the case of El Alto, Oruro and several other small towns.
Water table morphology shows that groundwater flows follow the direction of water reservoirs, the location of
recharge areas and their base levels. The water tables of Huancané, Ramis, Coata and Parco River basins on the
Peruvian side, and Tiwanacu and Catari River basins on the Bolivian side, drain into Lake Titicaca with average
hydraulic gradients of 1 to 0.1 percent. The optimum yield of aquifers and capacity in the Peruvian sector range from
1 to greater than 100 litres per second, and from 0.3 to 5 litres per second respectively. In the Bolivian sector, optimum
yield ranges from 2 to 75 litres per second and specific capacity from 0.3 to 4 litres per second.‖ Page 470
“Box 22.1: Development of indicators GROUNDWATER • Net recharge = 4 m3/s; 0.89% of total
(see groundwater map for more details)‖
Map 21.3: Distribution of groundwater in the TDPS system
The main aquifers are located in the middle and lower basins of the Ramis and Coata Rivers, in the lower basin of Ilave River and in a
strip that extends from Lake Titicaca to Oruro, bordering the eastern ridge.
Table 21.7: Water use in the TDPS system

3_NWRA_GW_focus.doc
Ruhuna basins (Sri Lanka)
Water Resources “Groundwater
Many people in the basins depend on shallow groundwater for their domestic needs. Studies indicate that seepage
losses from canals and reservoirs have been indispensable for maintaining water levels in shallow wells. Deep
groundwater is concentrated in the fractured and weathered aquifers in hard rock areas and alluvial aquifers. Available
information indicates that 7 to 10 percent of rainfall contributes to groundwater recharge in the hard rock terrain, and
40 percent in the sandy alluvial aquifers (Panabokke et al., 2002). Groundwater accounts for 3 percent of total water
withdrawals (Jayawardane, 2002 and Jayatillake, 2002b) and there is a high vulnerability to declining groundwater
levels and saltwater intrusion in the lower reaches of the basins.‖ Page 419
“Data and information on water resources
The hydrometric network includes sixteen rainfall stations, seven agro-meteorological stations and six water level
stations (are these groundwater levels?). The water level observation network is clearly inadequate to provide sound
information on water resources in the basins. The lack of sufficient regular flow observations have led to a large number
of sporadic attempts by agencies involved with water resources to collect data, mostly in response to the internal
requirements for development projects. The frequency of data collection intensifies during project studies but generally
the frequency and quality of data observation diminish once the project is completed. Integrated Water Resources
Management (IWRM) in the basins clearly suffers from this lack of a consistent, continuous and accurate hydrometric
network. Moreover, data access and data sharing between the different agencies remain limited, restricting the benefits
obtained from even the existing data network.‖ Page 420
Management Challenges: Stewardship and Governance “Cultural background and the value of water
The broad recognition of centuries-old water traditions in Sri Lanka, and the considerable number of people still living
below the poverty line, enhance the importance of water‘s social, environmental, cultural and economic values. For
example, the numerous minor irrigation systems provide water for domestic use, livestock, wildlife, recharge of
groundwater and also for enhancing the village environment. These multiple dimensions that make up the value of
water must be considered equitably in planning, developing and managing water resources.‖ Page 422
“Political set-up: institutions and legislation
Water management responsibilities in the basins lie with institutions at the national and local levels: approximately
forty agencies exist with responsibility or interest in water. These include the sector agencies dealing with domestic
water supply, health and sanitation, agricultural and irrigation services, hydropower generation, groundwater
development and ecosystem management.‖ Page 422
“Finances
Public investment in water resources focused on developing irrigation infrastructure from 1950 until the 1980s. The
emphasis has since shifted towards investments in rehabilitation of existing infrastructure and improvement of water
management. In the year 2000, national investments in agriculture and irrigation remained at about 8.5 percent of the
total capital expenditure. The corresponding figure for the energy and water supply sectors was about 16.5 percent
(Central Bank, 2001). The main investors in urban water supply and sanitation have been the public sector, including
the central government, the National Water Supply and Drainage Board (NWSDB), Provincial Councils and local
authorities. Investments by community-based organizations and private individuals are significant in rural areas.
Additionally, a substantial portion of irrigation and water supply projects are foreign-funded. Two major irrigation
rehabilitation projects and one comprehensive groundwater assessment project are ongoing in the basins and are
funded by independent donors.‖ Page 422
Managing risks
―The government initiated a range of measures to mitigate the impacts of future occurrences of droughts. These include
short-term emergency measures, such as development of groundwater for emergency domestic supplies, medium-
term interventions such as introducing better water management practices; and longer-term studies on the possibility of
interbasin water transfers.‖ Page 423
Identifying Critical Problems and Opportunities “Challenges related to the nature of the resource
Investigations show that groundwater quality is poor in the lower reaches of the basins, i.e. in the dry zone. In several
places, fluoride, hardness, chlorides, sulphate and alkalinity contents are reported to be high, and shallow
groundwater, in areas not recharged by irrigation, is falling in some locations due to increased use of agrowells, that is,
wells supplying water to agriculture. Several water resource development projects are ongoing in the Walawe sub-basin,

3_NWRA_GW_focus.doc
and other proposals are being studied. With scientific investigations and planning, there is a potential for further
development of groundwater.‖ Page 424
Box 18.1: Development of indicators “Challenge areas Sri Lanka indicators
GROUNDWATER • A comprehensive groundwater assessment is being carried out
• Groundwater recharge = 7 to 10% in hard rock terrain
• Groundwater reliance = annual groundwater withdrawals/total annual
withdrawals = 3%
ENSURING KNOWLEDGE • Hydrometric network consists of 19 rainfall stations, 25 agro-meteorological
stations and 6 water level stations
• The existing coverage is considered inadequate for comprehensive water
resources assessment • A considerable amount of data is collected, but not readily accessible‖ Page 426
Jayawardane, D.-S. 2002. ‗Groundwater Indicators.‘ Proceedings of the workshop on the WWAP Sri Lanka Case Study,
7–8 April, 2002, Sri Lanka. Colombo, International Water Management Institute.
Panabokke, C.-R.; Kodituwakku, K.-A.; Karunaratne, G.-R; Pathirana, S.-R. 2002. ‗Groundwater Resources in Ruhunu
River Basins of Sri Lanka‘. An unpublished report prepared for the World Water Assessment Programme.
Seine-Normandy basin (France)
Water Resources Water quality: a mixed balance sheet
―The nitrate situation is, however, worsening. Since 1965, the nitrate concentration in the lower Seine has increased
significantly, even if the rate of progression has slowed since 1989. The same concentrations are also occurring in
groundwater. Today, some 25 percent of the basin‘s groundwater measurement points show more than 40
milligrams (mg) of nitrate per litre; 12 percent show more than 50 mg/litre. But these nitrate rates still are under the
groundwater threshold for producing drinking water (which is 100 mg/litre, while it is 50 mg/litre for surface water).‖
Page 433
―Groundwater is, however, little affected by organic micropollutants other than pesticides. …Pesticides, used not only
in agriculture but also along railways and roads and in gardens, are a serious problem in the Seine- Normandy basin.
Triazines – highly soluble, mobile and persistent organo-nitrogenous compounds – are the most prominent. They are
present in surface water (with peaks in spring), coastal waters and, above all, in groundwater.8 (8. Half of the 371 wells in the monitoring network were contaminated in 1999. Forty percent had triazine concentrations of over 0.1 micrograms per
litre.)‖ Page 434
Readily available water data
―The Seine-Normandy Water Agency (AESN, Agence de l‘Eau Seine-Normandie) and French government services,
together with other public institutions, manage several measurement networks that gather quantitative and qualitative
data on surface water and groundwater. For example, common surface water quality parameters were measured at 441
points in the basin in 2000. Of these, 171 were also analysed for metals and 120 for micropollutants. These points are
sampled six to forty-eight times a year, for determination of more than 150 parameters (for a total of nearly 2 million
data items/year), which vary in time and space with field conditions. The groundwater quality network uses 402 wells
and piezometers to monitor the basin‘s ten major aquifers. Samples are taken twelve to forty-eight times a year for
determination of more than 250 parameters (nearly 3 million data items/year).‖ Page 434
Challenges to Life and Well-Being Stringent health control
―The quality of drinking water is much better now than it was thirty five years ago. Standards are higher and treatment
techniques are much more efficient. Drinking water must satisfy criteria based on Maximum Permissible Doses (MPD).
The European Water Framework Directive (WFD) requires that forty-eight parameters be taken into account, including
microbiology, toxic substances and ‗undesirables‘. The drinking water of more than half of the basin‘s population is
supplied by groundwater. With groundwater, biological standards can be met simply by protecting wells and slightly

3_NWRA_GW_focus.doc
disinfecting the pumped water (except when the water is turbid, which can occur during periods of heavy rainfall in
karst regions, thus depriving about 500,000 people of water for several days each year).‖ Page 436
Agriculture
In the Seine-Normandy basin, irrigation is used to increase crop yield, to improve the quality of the produce, to regulate
production and to grow crops that are very sensitive to water shortages (for example, potatoes for the industrial
production of chips). At present, 394,000 hectares (7 percent of the usable farm area) can be irrigated: this has nearly
doubled since 1988. The quality of the water withdrawn, 90 percent of which is groundwater, is generally very good.
In spite of this sharp increase, irrigation still has little quantitative impact on the resource, except for occasional cases
of overpumping that have been resolved by regulating demand.14
(14. For example, the water level in the Beauce aquifer dropped sharply in 1992 and 1997, causing water use conflicts.)
Non-degradable substances from, or excessive use of, fertilizers, pesticides, liquid manure and other substances spread
on crops or coming from livestock activities end up in rivers and groundwater. .
Industry Industry in the Seine-Normandy basin consumed 1,612 Mm3 of water in 1999, most of which was pumped directly
from rivers, and most of which was used by power plants. The chemical and agro-food industries prefer to use
groundwater, and often treat it before use.
Box 19.1: Development of indicators
“Theme Indicators
ENVIRONMENT: • Maps made using a Quality Evaluation System, based, at least, on the following
QUALITY (ADAPTABLE indicators: BOD5, NH4+, NO3-, P total, suspended particulate matter, pH,
TO GROUNDWATER, conductivity, colour, thermotolerant/ faecal coliform organisms, total chromium,
WATER BODIES AND mercury, lead, DDT op', DDT pp',lindane, endrine, dieldrine, aldrine
COASTAL WATERS)
STATE OF THE • Six maps that indicate the state of the aquatic environment: groundwater levels,
ENVIRONMENT physico-chemical quality of surface water, pesticide content in surface water,
quality of fish populations, quality of coastal waters, maximum nitrate and
pesticide concentrations in groundwater.” Page 443 “Challenge area Seine-Normandy basin indicator
GROUNDWATER • 10 major water tables
• Withdrawals: 1,213 bm3/year
• Volume of underground resources has not yet been accurately assessed
• Piezometric monitoring of groundwater tables; three tables have overrun the
hydric stress threshold over the last ten years, but have been filled up again due
to recent heavy rainfall.‖
ENSURING KNOWLEDGE • For groundwater: 402 boreholes, measured 12 to 48 times per year, on 250
parameters; relating to 10 or so main aquifers, a total surface area of 97,000 km2
and 17 million inhabitants‖ Page 445
Senegal River basin (Guinea, Mali, Mauritania, Senegal)
Water Resources
Groundwater
The deep aquifers are, for the most part, represented by the Maestrichian fossil formation and the Continental Terminal
formation. The alluvial aquifer is the principal shallow aquifer. It is present in all of the flood plain at various depths,
generally less than 2 metres, and has an average thickness of about 25 metres. This aquifer communicates in places
with a discontinuous network of lenticular aquifers in the permeable strata interbedded in the alluvium (see map 4.3 on
the world’s groundwater resources in chapter 4, and map 12.4 on the aquifers in northern Africa in chapter 12).These
aquifers are recharged by the river and by all of the tributaries, distributaries, ponds and lakes in the flood plain. On the
edge of the valley, the aquifers tend to deepen, usually with a steep slope, but this is highly variable from one place to
another. The water level in the alluvial aquifer varies with the seasons and river level, along with the general
hydrological regime in the valley. Since the dams were filled, both the volume and duration of floods and the
geographic distribution of the flooded areas have been disrupted, significantly modifying groundwater recharge and

3_NWRA_GW_focus.doc
the piezometric surface. Reducing the volume of the floods and building dikes significantly reduces the area of natural
recharge zones (infiltration ponds). On the other hand, flow regulation during low water periods (maintenance of a
minimum flow) and irrigation of large surfaces, rice paddies in particular, increases groundwater recharge during part
of the dry season in some areas. Page 453
Water quality
Groundwater in the Senegal River basin is generally salty in areas where there used to be seawater intrusion before the
Diama dam was built. The alluvial aquifer has a relatively homogeneous salinity, whereas the lenticular, fluvio-deltaic
aquifer formations have a slightly more heterogeneous salinity. As a result, there are large and sometimes abrupt
variations, with concentrations rising from 1 or 2 grams (g) per litre to more than 150 g/litre. On average, salinity
decreases as one moves away from the centre of the delta (more than 10 g/litre) towards the edge (10 to 0.15 g/litre).
The aquifers have a higher load in high areas (with an average of 30 g/litre) than in depressions, which are regularly
flooded (13 g/litre). However, the saltiest water is found in depressions such as the Aftout-es-Saheli sebkhas in
Mauritania and the Gandiolais lagoons and Ndiael wetlands in Senegal. The pH values also vary (but not with salinity),
with a high acidity in and depressions influenced by the acid sulphate deposits of the ancient mangroves. The Sodium
Absorption Ratio (SAR)1 of the aquifers is generally high, which means that there is a risk of alcalinization of soil
horizons in contact with these aquifers. Page 454
“Impact of development on the population and on natural resources
More than ten years after the dams were filled in 1986 and 1987 and the structures (dikes, irrigation systems) associated
with the implementation of the OMVS development programme were built, several studies have been carried out,
making it possible to conclude that these interventions are having both positive and negative effects on the basin‘s
population and natural resources.‖
“Principal positive effects
_ Year-round availability of freshwater in sufficient quantities (for agriculture, domestic uses, agro-industry,
groundwater recharge), accompanied by reverse immigration of people who had left to find employment in the
cities;‖ Page 455
Challenges to Life and Well-Being A difficult context
Before the dams were filled in the mid-1980s, activities of the local inhabitants depended directly on rainfall (rain
crops) or on floods (flood recession crops), in particular in the upper basin in Guinea (Fouta Djallon Mountains). But
the dramatic and continuous drop in rainfall during the 1960s and 1970s led to the degradation of almost the entire base
of natural resources (soil erosion, disappearance of vegetation, drying up of surface water, salinity 200 km upstream
from the mouth of the river, drop in the groundwater level, degradation and disappearance of pasture land). Under
these conditions, the local inhabitants could not produce enough to survive and the only alternative was emigration.
Page 456
2004
GROUNDWATER RESOURCES OF THE WORLD AND THEIR USE, IHP-VI, Series on
Groundwater No. 6
Extensive summary of general and specific groundwater information by region and country
including geology, hydrology, water use, and water quality, 22 pages of references. Important body
of work that is too dense to provide a synopsis. Chapter 5 contains most of hydrogeologic
information:
5 Fresh and brackish groundwater resources and their use on continents and in
individual countries
5.1 Groundwater resources and their use in Europe
5.2 Groundwater resources and their use in selected countries in Asia
5.3 Groundwater resources and their use in North America
5.4 Groundwater resources and their use in South America, Central America
and the Caribbean
5.5 Groundwater resources and their use in Africa

3_NWRA_GW_focus.doc
5.6 Groundwater resources and their use in Australia, New Zealand and Papua
New Guinea
From the Conclusion:
―Solving the problems mentioned will absolutely provide for increased effectiveness and rationality of groundwater use
and will make it possible for decision makers to prove modern and prospective projects for the water supply of separate
regions.
Thus, in conclusion, it is reasonable to briefly formulate the main tasks of further scientific and practical investigations
on the problem considered.
These tasks are the following:
to improve the available and to develop new methods for assessing groundwater resources accounting for
natural measures;
to develop and put into practice nature-protecting criteria determining the acceptable impact of groundwater
withdrawal on other components of the environment, and also the acceptable effect of anthropogenic activities
on ground-water resources and quality;
to perfect the available and to develop new methods for predicting changes in groundwater resources and
quality under intensive anthropogenic activities and possible climate changes:
to substantiate the principles of conducting groundwater monitoring in different natural climatic and
anthropogenic conditions as a component of the general monitoring of water resources and the environment;
to improve methods of assessing groundwater vulnerability to pollution in the main aquifers used for water
supply;
to perfect methods of artificial groundwater recharge and to use them more widely in active well fields;
to develop mathematical models of interaction between ground- and marine water in different geologic-
hydrogeologic conditions of the coastal zones and also methods for predicting marine-water intrusion into the
aquifers under intensified groundwater withdrawal by coastal well fields;
to develop and to put into practice legislative norms emphasizing preferred use of fresh groundwater of high
quality primarily for drinking and domestic water supply
Solving these problems will considerably increase the effective use of groundwater.‖ Page 319 (bold added by me)
2005
Water Assessment of Nari River Basin and Water Policy Issues of Pakistan, International
Commission on Irrigation and Drainage (ICID), Country Policy Support Program (CPDP), funded
by Sustainable Economic Development Department, National Policy Environment Division, The
Government of the Netherlands.
The key conclusions emerged from the CPSP study-Pakistan are as follows:
1. ICID‘s BHIWA model for an integrated and comprehensive water assessment at basin level was widely
appreciated during Basin and National Level Consultations. The model may need to be further upgraded to
enable weekly working to suit the climatic settings of Pakistan.
2. Applicability of BHIWA model to larger size basins such as the main Indus basin in Pakistan was an
important point of discussion in view of the need to develop and analyse country level scenarios for future
development of the water resources aimed at food and environment security. A number of other models are
also available and needed to be pooled to establish relative advantages for a specific purpose. It was noted such
an exercise could be taken up in the next phase of CPSP, if feasible.
3. The model has reasonably succeeded in bringing out the current and future challenges in managing water
resources of the selected Nari river basin for agriculture, flood control and domestic and industrial water use.
The necessity of building additional storages was highlighted for multi purpose use namely to prevent mining
of groundwater resources in the middle parts, to augment surface water irrigation supplies and to provide
protection against flash floods in the lower parts and further down in the Kachhi plains. Afforestation /
watershed management in upper reaches as a complementing strategy was also tested. In addition, expansion
of horticulture crops and use of high efficiency methods of irrigation were acknowledged as the short-term
goals to alleviate the problems of water scarcity.
4. The preliminary results of PODIUMSIM available from a separate study project show substantial food
shortages in Business As Usual scenario for the country for year 2025. The potential for vertical growth (land
3_NWRA_GW_focus.doc
productivity per unit of water) besides additional development of balance resources and high efficiency water
use was cited as the major strategies to overcome constraint of water resources. In this context, there is an
urgent need to organize promotional tours/ seminars for popularising use of drip and sprinkler methods in a big
way, particularly in areas with saline groundwater. ICID‘s could assist PANCID in these efforts.
5. It was shown that of the present total water use of 132.8 billion cubic meters, about 92.6% are withdrawn for
irrigated agriculture while domestic and industrial use is 5.4% and 2%, respectively. It was estimated that by
2025 total water requirement in Pakistan will be around 167 billion cubic meters i.e. about 35 billion cubic
meters more than that of the present use. Development of additional water resources and adoption of water
saving irrigation practices was therefore considered as necessary.
6. The national consultation noted the need for analysing and modelling the surface and groundwater
related problems in a better way. Such models, apart from quantifying the surface and groundwater
balances and their interactions, need also to model the water quality, in particular the salinity. Thus, the
overall salt balance, and the phenomena of soil salinity and groundwater salinity would also get
modelled, and the impact of various management strategies, on these aspects, vital to Pakistan, could be
studied.
7. The consultation ended with a positive note as to usefulness of limited activities under CPSP Phase I and the
need to take forward such interactions in the future. More activities are envisaged to extend the experience of
Nari basin to the main Indus system for formulating country level scenarios and testing various policy options.
2005
Abu Dhabi, Groundwater Assessment, Abu Dhabi
Link is broken now, but one page summary from GTZ, the German government
international cooperation enterprise for sustainable development:
―Context - In excess of 90 percent of all water requirements in Abu Dhabi are met by desalinising seawater.
Groundwater reservoirs can provide a valuable complement. GTZ International Services (GYZ IS) was
contracted by Abu Dhabi National Oil company (ADNOC) to investigate the Emirate‘s groundwater resources.
Objective – The project Groundwater Assessment Abu Dhabi had the task of investigation the shallow and
deeper groundwater resources of the Emirate of Abu Dhabi, with a view to determining their quality and
volume and consequently to issuing recommendations on how to protect them sustainably in the long term.
Approach – The expert team put together by GTZ and Dornier Consulting applied the followingmethods and
approaches:
Conduct extensive geophysical sounding operations, measureing compaigns and exploratory drills
Put together a digital terrain model of the entire Emirate
Set up and expand a groundwater monitoring network and develop mathematical models as tools for
future groundwater management
Set up and consolidate a groundwater database with qualitative and quantitative data of more than
15,000 wells, including the establishment of a Geographic Information System (GIS)
Advise national institutions on the establishment of a groundwater management system
Provide courses, seminars and ―on-the-job training‖ fro experts employed by the client, ADNOC, and
by other national institutions.‖
2005
Canada, Canadian Senate, Water in the West: Under Pressure, Fourth Interim Report of the
Standing Senate Committee on Energy, the Environment and Natural Resources
CLOSING THE GAP
―Our lack of understanding of Canada‘s aquifers is symptomatic of the larger problem. Dr. Carey stated
pointedly that ―we do not have the information we require to manage the water resource…even just finding our
major regional aquifers, which ones are used, tapped into, and which are not, and the levels and the quality of
water. [sic]‖ ….. This lack of knowledge is stunning. It prevents progress, as far as water is concerned, on the
Government of Canada‘s sustainability agenda. How can any government decide what to do about a situation
when they don‘t have a good understanding of that situation? As Dr. Carey pointed out, ―We are exploiting our
groundwater aquifers but we have incomplete information about that. I would not call that ‗good management
practice.‘‖ Dr. Carey‘s conclusion was echoed by Dr. Jan Boon of Natural Resources Canada (NRCan) who
acknowledged that: ―Ground water information in Canada is pretty sparse.‖ ― Page 7
3_NWRA_GW_focus.doc
In its 2001 Sustainable Development Strategy (SDS), NRCan committed to generating a national
groundwater database by 2003. This was an excellent and timely initiative. The only problem is that it
wasn’t done. In 2004, NRCan reiterated the commitment, but extended the target date to 2006. NRCan also
now hopes to have about 20% of Canada‘s ―key regional aquifers‖ mapped by 2006. This information will be
collected in the national groundwater database. Twenty percent? This is a pressingly urgent problem. Would
Canadians be satisfied if a government were to announce that it is preparing over the next year or so to obtain
20% of the information on a potential pandemic? On economic projections? Your Committee thinks not. Why
draw the line at 20%? A fragmented analysis of Canada‘s aquifers will leave a huge void in our understanding
and management of groundwater.‖ Pages 8, 9
“RECOMMENDATIONS
Recommendation 1
The Government of Canada should take the necessary steps to ensure that all of Canada‘s major aquifers are
mapped by 2010. This data should be made available in the national groundwater database and supported
by a summary document assessing the risks to groundwater quality and quantity.
Recommendation 2
The Government of Canada should work with industry and with other orders of government to develop a
standard methodology for the collection and reporting of water-related data. The Government of Canada
should take on the responsibility for the creation of a centralized depository for water statistics.
Recommendation 3
The Government of Canada must restore funding for longitudinal water studies. Such studies are essential to
ensuring the sustainability of Canada‘s water resources.
Recommendation 4
The Government of Canada should bolster its support for the National Water Research Institute and the Prairie
Farm Rehabilitation Administration so that these institutions can better address Western Canada‘s growing
water challenges.
Recommendation 5
The Government of Canada should create a National Water Council. This Council, composed of
representatives from industry, research institutes and all orders of government, would be tasked with
identifying the key water issues that require attention from the federal government and proposing strategies for
addressing them.‖ Page 17
2006 UN WATER World Water Development Report 2
Case studies:
The Autonomous Community of the Basque Country (Spain) [2006 full report in
Spanish]. Because the full report is in Spanish, information from the 2006 summary is presented here.
―In parallel to industrial and urban development, the quality of the region‘s water resources and aquatic ecosystems has
constantly degraded. In response to this situation, a network with 360 operational sampling points has been set up in
order to survey the environmental status of all aquatic ecosystems and regional water bodies (rivers, lakes, reservoirs,
transitional waters, coastal waters and groundwater). The data collected from these points is used to assess the current
condition of all water bodies in accordance with the EU‘s Water Framework Directive (WFD) which entered into force
in 2000 (see Box 14.1). In order to comply with the WFD, the Basque Government carried out a detailed study
exclusively on its internal basins, comprising 122 rivers, 4 lakes, 14 transitional water bodies, 44 aquifers and 4
coastal waters, in an effort to characterize the freshwater resources and their associated ecosystems from an
environmental and socio-economic perspective. The Hydraulic Administration of the Autonomous Community of the
Basque Country submitted a detailed study to the EU, in which the economic aspects of water use and the
environmental impact of humans were analysed for each water body and all protected areas were registered.‖ Page 473
Box 14.1 THE EUROPEAN UNION WATER FRAMEWORK DIRECTIVE Abundant and clean water is a given for most of the people living in the European Union (EU). However, many human activities put a pressure on
both water quality and quantity. Polluted water from industry, agriculture and household use causes damage to the environment and affects the health
of those using the same water resources. The EU Water Framework Directive (WFD) came into force on 22 December 2000 and aims to establish a framework for the protection of surface and groundwater, as well as coastal waters.
This directive requires all inland and coastal waters to reach ‗good status‘1 by 2015. The definition of the good water status includes the chemical composition of water and the ecological elements. In order to reach this goal, a river basin structure is established within which certain environmental
targets are set. The most important aspects of the WFD is that it calls for sustainable development, requires the adoption of integrated river basin
3_NWRA_GW_focus.doc
management and links and coordinates all previous water policies, such as the directives on urban waste water treatment, nitrates, bathing or drinking
water into a common framework. Finally, the integration of water policy with other major EU policies (like agriculture, hydropower and navigation, for example) is a prerequisite for successful protection of the aquatic environment.
In 2009, measurement programmes will be established in each river basin district for delivering environmental objectives (article 11). The first river basin management plan for each river basin district, including environmental objectives for each body of surface or groundwater and summaries of
programmes of measures (article 13) will also be published.
Recognizing that water management must respond to local conditions and needs, the WFD, has strong public information and consultation
components that encourage all interested parties to become involved in the production, reviewing and updating of river basin management plans.
1. The values of the biological quality elements for the surface water body type show low levels of distortion resulting from human activity, but
deviate only slightly from those normally associated with the surface water body type under undisturbed conditions. Source: EC, 2000.
Danube River Basin (Albania, Austria, Bosnia-Herzogovina, Bulgaria, Croatia, the
Czech Republic, Germany, Hungary, Italy, the Former Yugoslav Republic of
Macedonia, Moldova, Poland, Romania, Serbia and Montenegro, the Slovak
Republic, Slovenia, Switzerland, Ukraine) [2006 summary only]
“Transboundary and regional aquifers are common in the DRB region. In some cases, groundwater resources
represent as much as 30 percent of the countries‘ total internal renewable water resources. Although aquifers are the
main sources of drinking and industrial water in the DRB region, there is little information concerning the
availability of groundwater or potential extraction capacity in many countries.‖ Page 474
“Ecosystems and transportation Large dikes and disconnected meanders also suppressed the exchange of surface and groundwater, which reduced
the recharge of groundwater utilized for the drinking supply.‖ Page 475
Ethiopia [2006 full report]
3 Water Resources of the Country
3.1 Background on Water Resources Development The total safe yield of groundwater was estimated to 26.1 BCM. It is estimated that 54.4 BCM of surface runoff and
2.6 BCM of ground water could be technically developed for consumptive purposes. The present actual consumption
from surface waters is less than 5%. Therefore its contribution as a promoter of economic development remains limited
at the moment.
3.2 Hydrology
3.2.3 Groundwater Resources
The General geology of Ethiopia comprises the following four groups of country rock:
1) Precambrian lower, middle and upper complexes (23%)
2) Upper Palaeozoic and Mesozoic sediments (25%)
3) Cainozoic sedimentary rocks (20%)
4) Cainozoic volcanic rocks (23%)
In the discharge areas where the quaternary cover is lacustrine sediment or where the underlying rock formation is
Mesozoic sediment rich in some minerals such as evaporates, gypsum, etc the water from overlying quaternary
sediment can be salty either due to upcoming of mineralized water from the underlying stratified rock, due to deep
seated structures that circulate high carbon dioxide water, the evaporation effect or due to the parent material of the
reworked sediments (Quaternary deposits) In the Precambrian rock system limited groundwater resource is available
in the weathered and fractured parts in open and usually young structure zones. Otherwise water storage of
metamorphic rocks is limited due to sealed nature of old microfractures by late hydrothermal fluid precipitates or
alteration minerals related to tectonism and metamorphism, clay end products of most basic metamorphic rocks, which
is less permeable, laminated nature o f rocks, due to low precipitation and high evapotranspiration in areas mostly
covered by metamorphic rocks and other factors. Fractured/tectonized marble gives high discharges in some areas (over
15 l/sec) sometimes.
The volcanics, especially basalts (usually caniozoic age) extending over large parts of the high lands, can transmit or
store water depending on several factors such as extent of weathering , fracture pattern and suitability of
geomorphology and other factors. As rainfall is high in the highland there is an active groundwater regime and the
water from the volcanics (basalts) is mostly good quality water. But as there are sequences of volcanic eruptions
(stratification or volcanics of different composition and/or paleosoil) the permeability nature of the volcanic aquifer is
variable. A lot of springs emerge from the volcanics due to presence of impermeable horizons under permeable layer or
3_NWRA_GW_focus.doc
due to topographic/structural impact and spring development is a good option in such zones. Even at great depth good
quality water can be obtained from basaltic aquifers which show differential weathering and fracturing at each
interflow layers. If wells strike underlying Mesozoic sediments rich in shale or evaporite the quality of water can
deteriorate or if interbeding volcaniclastics show compositional complexities water quality may be poor from wells
drilled into such horizons.
But in the rift the water from volcanic rocks is poor quality (high fluoride content) due to several factors. The main
reasons are the high proportion of acid volcanics which possesses minerals that are sources of fluoride or due high
carbon dioxide pressure in the groundwater due to the thermal effects that cause higher dissolution of minerals and
cation exchange which in turn increase the fluoride content and other factors that result in fluoride content exceeding 10
mg/l of fluoride in the groundwater.
The remnant Palaeozoic and Mesozoic sediments also form aquifers which supply different amount of water.
Mineralogical composition, degree of cementation, fracture and interbedding space, precipitation in the area and
geomorphology variations are some of the causes for the variation of yield of water points from these sediments.
Generally they form moderate yielding aquifers with good quality water.
The groundwater potential of the country is variable from place to place based on several factors such as variation in
geology, nature of structures, recharge condition, nature and duration of precipitation and other factors. Due to
economic reasons test wells or sufficient pumping test data is not available that enables to determine hydraulic
properties of aquifers, other data such as recharge rate estimation are not sufficient to determine the
groundwater potential of the country. However, groundwater is known to be the only or safe water resources to
some areas particularly the lowlands adjacent to or far from recharge areas.
For lack of sufficient hydrogeological data, groundwater potential of the country is not known. However, the
country wide preliminary water resources master plan study estimates it to be 2.6 billion cubic meters, and to
date, only a small fraction of this resource is in use, mainly for local water supply purposes.
3.7 Indicators
Indicators for the chapter are summarized in table 3.5 below: Indicator 2002….2015 1. Annual renewable fresh water
2. Per capita water availability: country wise and basin wise
3. Total non-renewable groundwater resource
4. Temporal and spatial variability of water availability - both surface and groundwater
5. Development potential
6. Annual water use for drinking, industry, agriculture, etc
7. Annual withdrawals as a percent of renewable water resources
8. Annual sediment transport per hectare
9. Annual variability in rainfall
10. Annual variability in runoff
11. Number of MET stations
12. Number of MET stations as percent of WMO standards
13. Number of river gauging stations
14. Number of automatic river gauging stations as percent of total
15. Number gauging stations as percent of WMO standards
16. Groundwater monitoring stations
France [2006 full report – France, 2003 full report – Seine-Normandy basin]
ADOUR GARONNE BASIN WATER AND IRRIGATION
No mention of groundwater
ARTOIS PICARDIE BASIN
WATER AND INDUSTRY “Impacts of industrial development on water resources The environment has long remained a forgotten factor in the Artois Picardie basin. Thus, and up to the seventies,
factories discharged their polluted waters in the rivers and stocked up again with clean water from groundwater which is
abundant in the area. This type of water management led little by little to an appalling situation where the quality and
quantity of both surface waters and ground waters deteriorated rapidly. The level of the carboniferous limestone
groundwater, north of Lille, went down by one metre a year between 1963 and 1993. Pollution caused by toxic metals
has been detected in certain rivers. Many industrial sites still active or abandoned have polluted the ground with
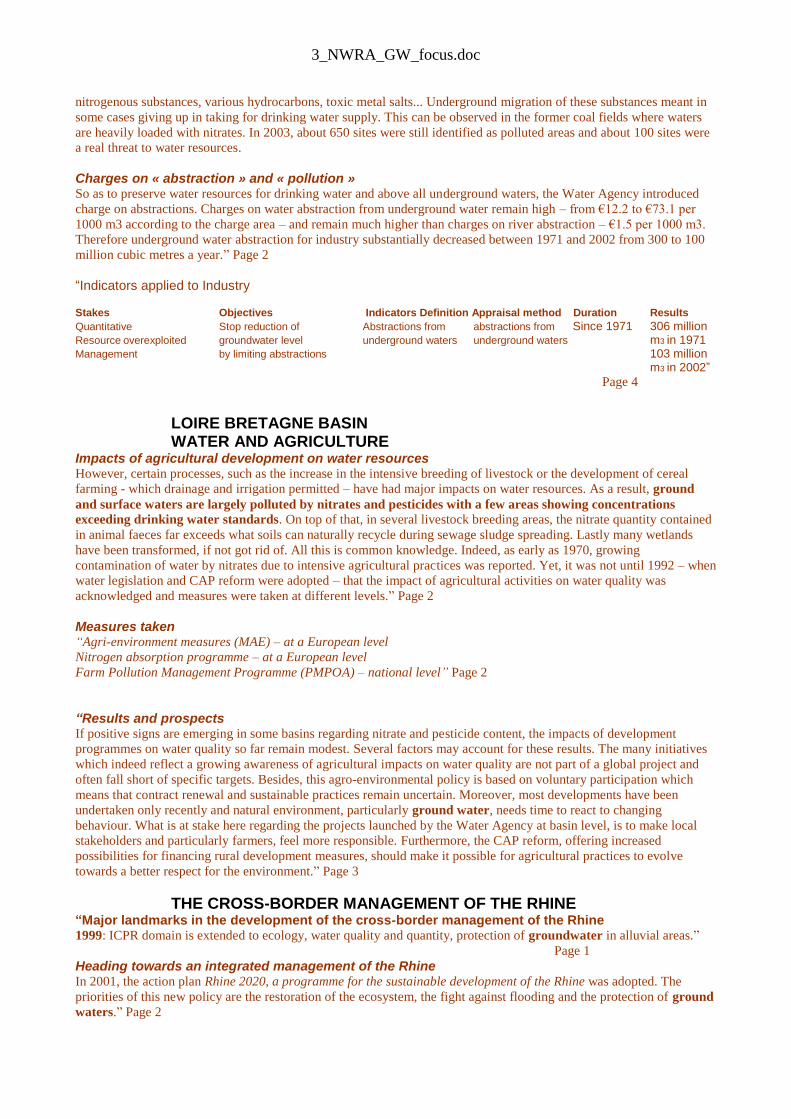
3_NWRA_GW_focus.doc
nitrogenous substances, various hydrocarbons, toxic metal salts... Underground migration of these substances meant in
some cases giving up in taking for drinking water supply. This can be observed in the former coal fields where waters
are heavily loaded with nitrates. In 2003, about 650 sites were still identified as polluted areas and about 100 sites were
a real threat to water resources.
Charges on « abstraction » and « pollution » So as to preserve water resources for drinking water and above all underground waters, the Water Agency introduced
charge on abstractions. Charges on water abstraction from underground water remain high – from €12.2 to €73.1 per
1000 m3 according to the charge area – and remain much higher than charges on river abstraction – €1.5 per 1000 m3.
Therefore underground water abstraction for industry substantially decreased between 1971 and 2002 from 300 to 100
million cubic metres a year.‖ Page 2
“Indicators applied to Industry Stakes Objectives Indicators Definition Appraisal method Duration Results
Quantitative Stop reduction of Abstractions from abstractions from Since 1971 306 million Resource overexploited groundwater level underground waters underground waters m3 in 1971
Management by limiting abstractions 103 million m3 in 2002”
Page 4
LOIRE BRETAGNE BASIN WATER AND AGRICULTURE Impacts of agricultural development on water resources However, certain processes, such as the increase in the intensive breeding of livestock or the development of cereal
farming - which drainage and irrigation permitted – have had major impacts on water resources. As a result, ground
and surface waters are largely polluted by nitrates and pesticides with a few areas showing concentrations
exceeding drinking water standards. On top of that, in several livestock breeding areas, the nitrate quantity contained
in animal faeces far exceeds what soils can naturally recycle during sewage sludge spreading. Lastly many wetlands
have been transformed, if not got rid of. All this is common knowledge. Indeed, as early as 1970, growing
contamination of water by nitrates due to intensive agricultural practices was reported. Yet, it was not until 1992 – when
water legislation and CAP reform were adopted – that the impact of agricultural activities on water quality was
acknowledged and measures were taken at different levels.‖ Page 2
Measures taken “Agri-environment measures (MAE) – at a European level
Nitrogen absorption programme – at a European level
Farm Pollution Management Programme (PMPOA) – national level” Page 2
“Results and prospects If positive signs are emerging in some basins regarding nitrate and pesticide content, the impacts of development
programmes on water quality so far remain modest. Several factors may account for these results. The many initiatives
which indeed reflect a growing awareness of agricultural impacts on water quality are not part of a global project and
often fall short of specific targets. Besides, this agro-environmental policy is based on voluntary participation which
means that contract renewal and sustainable practices remain uncertain. Moreover, most developments have been
undertaken only recently and natural environment, particularly ground water, needs time to react to changing
behaviour. What is at stake here regarding the projects launched by the Water Agency at basin level, is to make local
stakeholders and particularly farmers, feel more responsible. Furthermore, the CAP reform, offering increased
possibilities for financing rural development measures, should make it possible for agricultural practices to evolve
towards a better respect for the environment.‖ Page 3
THE CROSS-BORDER MANAGEMENT OF THE RHINE “Major landmarks in the development of the cross-border management of the Rhine 1999: ICPR domain is extended to ecology, water quality and quantity, protection of groundwater in alluvial areas.‖
Page 1
Heading towards an integrated management of the Rhine In 2001, the action plan Rhine 2020, a programme for the sustainable development of the Rhine was adopted. The
priorities of this new policy are the restoration of the ecosystem, the fight against flooding and the protection of ground
waters.‖ Page 2
3_NWRA_GW_focus.doc
RHONE MEDITERRANEE BASIN WATER AND HYDROELECTRICITY
No mention of groundwater
SEINE NORMANDIE BASIN URBAN WATER “Characteristics of drinking water supply in the basin
• Abstractions and access
Access to drinking water: 100% of the population
Volume of abstractions: 1.5 billion cubic meters, of which only 80% are in fact distributed principally due to loss in the
network; abstractions have been stable for the last 20 years
Water resources used: about 40% of surface waters and 60% of ground waters‖ Page 2
“Improving water quality The Seine Normandy basin has a dense hydrographical network and several ground waters that can all meet users‘
water needs. However, more stringent supply norms and, at the same time, a regular increase of some pollutant
concentrations – particularly nitrates and pesticides – are becoming more and more worrying, all the more so as ground
waters are not easily renewed: in spite of curative action plans, they will not recover their good quality status for many
years.‖ Page 3
Japan [2006 summary only – Japan, 2003 full report – Greater Tokyo] No mention of groundwater in the 2006 summary.
Kenya [2006 full report] Water Resources Management Problems and Challenges
“Climate variability and Water Resources Degradation Groundwater conservation areas are the areas where the groundwater aquifers are threatened with over-exploitation and
therefore no exploitation of such groundwater shall be done without the authority of the Water Resources Management
Authority (WRMA) in accordance with the Water Act 2002 and the conditions thereafter appended to such an
authority.‖ Page 3
“Groundwater depletion: The high demand for water, encroachment on recharge areas, lack of accurate information on groundwater potential and
the poor monitoring of groundwater in use may lead to depletion of groundwater. This in turn could result into a number
of other related problems including falling water tables, seawater intrusion into coastal aquifers, and contamination of
groundwater as in the case of Wajir district where the ground water has become salty due to its depletion. The ground
water depletion has also caused drying up of base flows in springs and rivers and could even result in land subsidence in
some areas.
Inter/Intra Basin Water Transfer: It is clear that water resources (both surface and groundwater) are unevenly distributed spatially in this country.
Increasing human activities especially in urban areas has led to a situation whereby the demand for water is being met
from water abstracted from a different catchment or drainage basin.: Page 6

3_NWRA_GW_focus.doc
Page 10
WATER QUALITY AND POLLUTION CONTROL
“The Reserve Water The groundwater reserve shall also be determined for aquifers that are connected to both surface water and those that
are not connected to surface water and where people are supplied with water from groundwater. Meanwhile the
methods for the determination for groundwater reserves are being developed.‖ Page 14
“General geo-hydrological characteristics
Main groundwater aquifers in Kenya Kenya consists of three major rock types and the major hydro-geological areas are classified as
follows:
• volcanic,
• metamorphic basement and intrusive rocks
• Sedimentary rocks.
The hydro-geological areas of Kenya can be regarded as simplified geological areas. The main groundwater aquifers are
closely linked with the three (3) major rock systems indicated above.‖
Page 39
“Groundwater Development and use The scale of groundwater used is summarized in table 2.6.showing estimates of water abstracted,
whereas the level of groundwater development is as summarized in table 2.7 showing number of
boreholes by use. According to records at the Ministry Headquarters by December 2003, there
were about 14,000 bore holes in Kenya.‖ Page 40

3_NWRA_GW_focus.doc
Spatial variance of water quality
The country is sub-divided into five drainage basins namely Lake Victoria, Rift valley, Tana river, Athi river and Ewaso
Ng‘iro drainage basins. The water quality of each drainage basin is summarized in the table 2.24 below:

3_NWRA_GW_focus.doc
‖Spatial variance of water quality The country is sub-divided into five drainage basins namely Lake Victoria, Rift valley, Tana river, Athi river and Ewaso
Ng‘iro drainage basins. The water quality of each drainage basin is summarized in the table 2.24 below:‖ Page 60
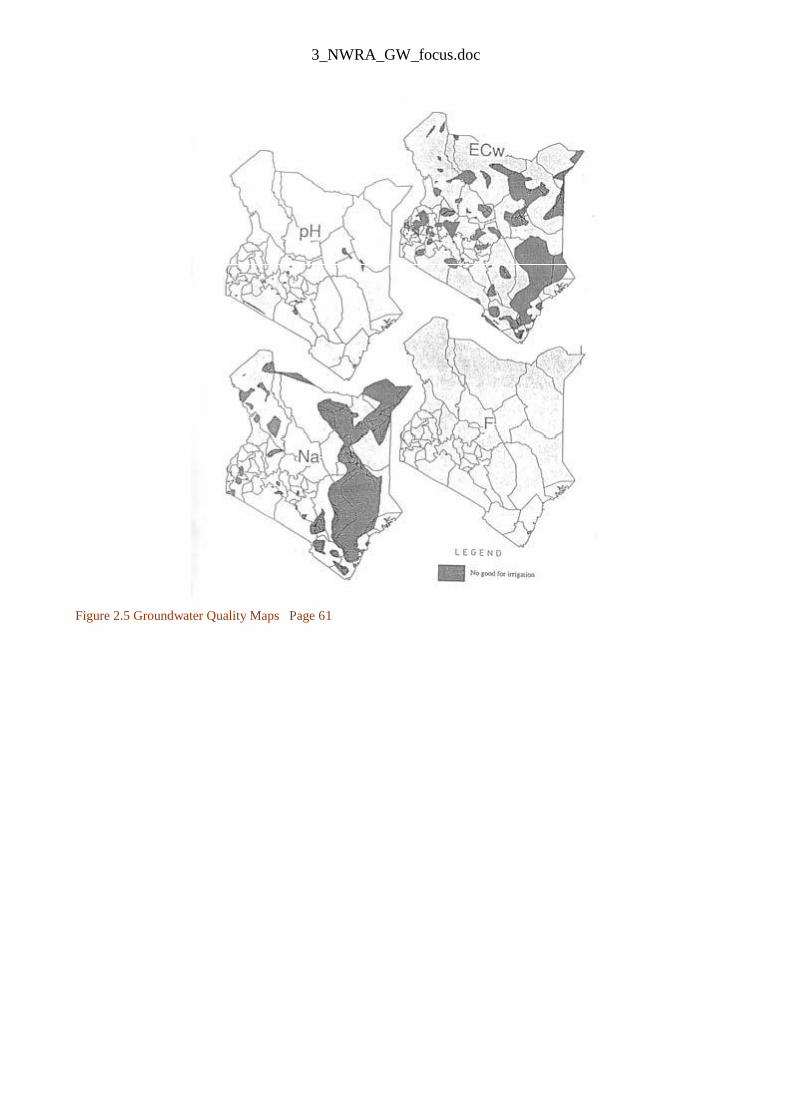
3_NWRA_GW_focus.doc
Figure 2.5 Groundwater Quality Maps Page 61

3_NWRA_GW_focus.doc
Figure 2.6: Comprehensive Groundwater Quality Map Page 62
“Human impacts on water resources
Human impact on the ecology and status of rivers Due to human impact to the ecology, the effect to water resources is:
• Decreased infiltration due to loss of vegetation hence reduced groundwater recharge.
• Lowering of groundwater tables
Environmental impact of dams and reservoirs • Rise in water table due to reservoir impoundments
• Increase in salinity due to irrigation activities.
General overview of pollutants from human impact The country strategy on water resources management has formulated a strategy which if implemented will attempt to
address water pollution control. Water pollution has become a serious problem impacting on the limited resources and
there is an urgent need to implement the proposed pollution control strategy.” Page 67
―Pit latrines and septic tanks located in recharge zones pose a significant risk of contaminating water. Water related
diseases are increasing. ” Page 68

3_NWRA_GW_focus.doc
“Main problems concerning water resources availability. There are four main characteristics concerning water resources availability in Kenya that make it important for proper
management programmes to be put in place.
• The Country has a limited endowment of just 650m3 per capita per year of fresh water. This puts Kenya in a ―water
scarce‖ category and means that the country has significantly less water per capita than its neighbors.
• Water availability is highly variable in space and time. Kenya experiences both floods and droughts.
• The major rivers in Kenya all originate from only five specific mountainous regions. Mismanagement of these few
water towers has effects throughout Kenya.
• Over half of Kenya’s water resources, both ground and surface water are shared with her neighbours. The
consequence is that the water resources need to be managed co-operatively within an agreed framework in order to
avoid tensions and to exploit the benefits of development for all.‖ Page 70
“Problems affecting water resources availability Limited natural endowment of water:
Kenya is classified as a chronically water scarce country in absolute and relative terms. The natural endowment of
renewable fresh water is about 650m3 per capita per year. Not all of the country‘s water resources can be exploited. The
accessible component is known as the safe yield.
The surface-water safe yield is estimated to be about 7.4 billion cubic metres per year, while estimated groundwater
safe yield is estimated at about 1 billion cubic metres per year. At present, the country withdraws less than the safe
yield.
In 1992, the National Water Development Master Plan study estimated the level of withdrawal for surface water as 1.1
billion cubic metres per year whereas groundwater abstraction was estimated at 180 million cubic metres per year.
However, these estimates have not been updated to reflect current water withdrawals.
The data shows that in 1992 approximately six times more water could have been safely abstracted from surface water
resources and approximately five times more water could have been safely abstracted from groundwater
resources. Thus in 1992 only 17% of safe exploitable surface water resources was in use while only 20% of safe
exploitable groundwater was in use.‖ Page 70
“Limited water resource areas Most of Kenya‘s surface water originates in localized catchments in five mountain areas, namely Mt. Kenya, Aberdares,
Mau complex, Mt. Elgon, and Cherangani. These critical sources are commonly referred to as ―Kenya‘s water towers‖
and they support the major sectors of the economy.
In 1992, the National Water Development Master Plan study estimated the level of withdrawal for surface water as 1.1
billion cubic metres per year whereas groundwater abstraction was estimated at 180 million cubic metres per year.
However, these estimates have not been updated to reflect current water withdrawals.
Areas that receive low rainfall and runoff such as Ewaso Ng‘iro basin are largely dependent on groundwater as a
reliable source. In ASAL (Arid and Semi Arid Land) areas, any contamination or over - abstraction of groundwater
has a very serious consequence for residents who are typically some of Kenya’s poorest people. They are highly
vulnerable to droughts, so degradation of groundwater in these areas contributes directly to poverty.
Groundwater is also an important supplementary source in urban centres such as Nairobi, Mombasa, and Nakuru.
Substantial trans-boundary waters About 54% of Kenya‘s water resources are shared with other countries. Through the Lake Victoria Basin, Kenya
provides about 45% of surface water inflows to Lake Victoria, and hence to the upper Nile. Kenya also shares a large
amount of other important surface and groundwater resources with its neighbours - Ethiopia, Sudan, Tanzania
and Uganda.‖ Page 71
“The Role of Irrigation in poverty alleviation and food security
The special role of groundwater Kenya receives an annual average rainfall of 570 mm/year (310 billion m3/year) with a range of from less than 300
mm/year in the drier ASALs to more than 2000 mm/year in the wetter highland areas. Only a small amount of this
water infiltrates into the soil and recharges the groundwater. It represents a considerable resource of generally good
water, which could be exploited for gainful activities. The groundwater is stored in different rock types whose
characteristics largely determine the water quality and the feasibility to abstract the water. For example, the
groundwater quality in Western, Central, Nyanza, and Nairobi Provinces is generally suitable for both domestic and

3_NWRA_GW_focus.doc
irrigation use. However, groundwater salinity increases in the North-eastern Provinces due to evaporite deposits and
in the Coast Province due to seawater intrusion thus rendering such water unsuitable for irrigation use. High fluoride
contents are a particular concern in the Rift Valley, Nairobi and Northeastern Provinces.
The groundwater is normally exploited in form of shallow wells and deep boreholes. By the year 2000, the total
number of boreholes was estimated at 13,000. Groundwater abstraction based on annual utilization rate using 9,400
boreholes was estimated at 137 million cubic meters in 1990. Contrary to the case of boreholes, there are hardly any
records on abstraction rates and sanitary status of the shallow dug wells.
Groundwater is generally considered as an expensive source of water for irrigation principally because of high drilling
costs compared to the low abstraction yields (6-9 cubic meters per hour) and the high operation cost needed to pump
water from high depths below the ground surface. For example, drilling a 200-meter borehole producing 8 m3/hr costs
about K.Shs. 2,000,000. This high cost is an obstacle to groundwater exploitation in the rural areas for domestic,
livestock and irrigation water use. In the arid and semi-arid areas, use of groundwater for irrigation is sometimes
compromised by unsuitable water qualities like high levels of salinity.‖ Page 163
“Economic Development The Government has recognized that, there is the need to accelerate development of the ASAL areas for faster
economic growth. A major input to development of these areas is availing water for livestock, domestic and irrigation
development. Thus the Government‘s target of integrating ASALs in the overall development strategy primarily implies
putting in place mechanisms that would harness the limited water resources in these areas as a basis for pursuing
development endeavours in other sectors. It is instructive to note that in the irrigation subsector out of the estimated
potential of 540,000 hectares, most of which is in the ASAL areas, only 87,350 ha. have been developed. The
groundwater potential is also still underdeveloped with only about 30% having been exploited.‖ Page 175
Page 203

3_NWRA_GW_focus.doc
Lake Peipsi (Estonia, Russian Federation) [2006 summary only, 2003 full report] “Reforms underway
The Joint Lake Peipsi Management Programme, an integrated water resources management tool, is being developed by
both countries in accordance with the requirements of the WFD. When completed, the Estonian-Russian Transboundary
Water Commission will be responsible for its implementation and updating. The programme will take into
consideration both the surface and groundwater resources of the basin as a unity.‖ Page 487
Lake Titicaca (Bolivia, Peru) [2006 summary only, 2003 full report] “The impact of climate change on glaciers
During dry seasons, glaciers are the main source of drinking and irrigation water for many urban dwellers and farmers
living in Peru and Bolivia. However, the climate variability and associated changes in ambient temperatures have
started affecting the tropical glaciers of the region. The loss in volume of these unique tropical glaciers is alarming, and
continuing melting trends will translate into drought for thousands of people. Figure 14.1 illustrates the impact of
climate change on the availability of water resources in the TDPS System. The consequences of glacial melting for local
populations are serious. Acting as reservoirs, glaciers regulate stream flow and diminish seasonal discharge variation.
This effect is vital, especially between September and November, when ice melting (and water demand) is at its
maximum. Discharges in glacier basins are important during those months, since the flows of other rivers in the
Altiplano Basins reach minimum levels.‖ Page 488
(No new mention of groundwater in the 2006 summary but the changes to the tropical glaciers and the development of
offsetting water supplies may affect groundwater resources, so I have included that text here – CPD)
Mali [2006 summary, 2006 full report] The full report is in French so I am able to provide only a synopsis of the 2006 summary.
―Despite its northern desert, Mali has a number of important water resources. Two major rivers – the Niger River and
the Senegal River – run through Mali. These two rivers constitute the majority of Mali‘s perennial surface water
resources, providing the country with 56 billion m3 of water. Important non-perennial surface waters are estimated at a
volume 15 billion m3. Mali also has seventeen large lakes situated near the Niger River, and renewable groundwater
resources from aquifers have been assessed at 66 billion m3. The volume of renewable water resources per capita
per year is 10,000 m3.‖ Page 489
―Currently, 270,000 ha of land is irrigated. Water abstraction for irrigation is about 4.5 billion m3, 98 percent of which
is obtained from surface water resources.‖ Page 490
―Increasing the knowledge base and technical expertise of water resources remains a major challenge in Mali. There has
been limited progress made in the development of strong assessment indicators, namely the density of hydrologic and
hydro-geologic stations, the quality of the information available about the water sector and the quality of the training
and research institutions operating in the sector. Still, some knowledge has been accumulated and monitoring processes
have been established and implemented in several projects. Unfortunately, however, the overall development of
indicators is still fairly limited. Measures are being taken to correct this, but it will take time and money before they
produce concrete results.‖ Page 491
The State of Mexico [2006 summary only]
―Water and land resources
As for groundwater resources, there are nine aquifers in the State of Mexico, six of which are shared with Mexico
City 7 (CAEM, 2004). Since these aquifers are the main source of water supply for the State of Mexico and
Mexico City, they are exploited well beyond their renewal capacity. In general, it is estimated that underground
water resources are overexploited at a rate of 100 percent or more, with the Texcoco aquifer in the Basin of the
Valley of Mexico being overexploited at a rate of more than 850 percent (CAEM, 2004). As a direct consequence, in
many aquifers the hydrostatic pressure has been lost, some springs have dried, and the ground is sinking up to
40 cm per year in some areas of the Valley of Mexico. The intense overexploitation is further aggravated by the fact
that the clayey topsoil in both the Valley of Mexico and the Lerma Valley enhances the runoff of rainwater and
substantially reduces the natural recharge of aquifers. In order to curb the destruction of aquifers, the Federal
Government has forbidden further development. However, unauthorized usage remains a problem.
Water and land resources
Agriculture is the main economic activity in the state, practised over approximately 50 percent of the overall surface
area. Irrigation for agriculture is practised on a smaller scale, covering only 7 percent of the State‘s land surface.
Almost 80 percent of the water used for irrigation is pumped from aquifers.‖ Page 492

3_NWRA_GW_focus.doc
“Water transfer
Water shortage in the State of Mexico is already at an alarmingly critical level. The situation is expected to worsen due
to increasing domestic, industrial and agricultural water demands. Although the state government is constantly pursuing
new mechanisms to slow down urban growth and promote efficient water use, water transfer from other water basins
remains necessary to meet growing demand. Currently, water is transferred from both surface and groundwater
resources to meet the demands of Mexico City and, to a lesser degree, the State of Mexico itself. For example, water is
transferred from the Balsas River Basin to the Lerma River Basin and the Valley of Mexico, mainly to provide the
Federal District‘s potable water supply. Underground water resources of the Alto Lerma System are also
channelled to the Mexico City, causing their overexploitation. The extent of these transfer schemes (i.e. the distance
from which the water is diverted), is also likely to grow, which could trigger disputes over water resources.‖ Page 493
“Water and health
Since underground water resources are exploited on a regular basis, the water wells are sealed to protect the
naturally high quality of groundwater by preventing direct contamination by pollutant leakage. However, human
activities pose a constant threat to groundwater quality. For example, in the State, wastewater is generated
approximately at the rate of 30 m3 per second (m3/s), about 19 percent of which is directly discharged without any kind
of treatment. Solid wastes are disposed of into open pits or partially controlled waste disposal sites. In addition to this is
agricultural pollution, caused by the utilization of wastewater for irrigation and the use of fertilizers and insecticides.
There is no exact data concerning the health consequences of such activities.‖ Page 493
“Water and ecosystems
It is estimated that the forest area was reduced to one-third of its original area. The main causes of deforestation are
stockbreeding, human settlements, road systems and firewood production for domestic use. Deforestation causes the
surface run off to carry greater amount of debris, silting up dams, rivers and channels, reducing the capacity of storage
and evacuation of storm water. The loss of vegetal cover also enhances surface run off, thus reducing the amount of
water of infiltration and severely affecting the recharge of aquifers.‖ Page 493
“Risk management
Urban settlements in the state have experienced high growth rates accompanied by the rapid expansion of informal
settlements. Consequently, people living on settlements that are constructed on slopes, old lacustrine areas, river and
stream banks and beds are highly vulnerable to water and mud floods. Furthermore, the overexploitation of aquifers has
caused differential ground sinkage and impeded the surface run off of storm water. Water and sewer services have also
been either interrupted or completely disconnected due to ground sinkage.‖ Page 494
“Conclusion
Although Mexico has sufficient water resources, the State of Mexico is under severe water shortage stemming from a
very dense population coupled with an accelerated growth of approximately 380,000 thousand inhabitants per year. The
situation is even more critical in the Valley of Mexico, where the Metropolitan Area of Mexico City contains
approximately 20 million inhabitants. The increasing water demands of various sectors have led to 100 percent or more
overexploitation of underground water resources. The effects of the overuse of aquifers are striking: ground has been
sinking up to 40 cm per year; piezometric levels have dropped significantly; aquifers have lost their hydrostatic
pressure; and some springs have dried up. Water and sewer infrastructure has been either disconnected or become
unusable due to sinking ground. This further complicates the challenge of providing the public with safe water and
sanitation services. Although further abstraction of underground water resources is forbidden, illegal utilization
continues to grow.
Because of deforestation, topsoil has lost its ability to retard surface run off, which in turn has reduced the infiltration
rate and recharge of aquifers. Intra-basin water transfer schemes have been implemented to cope with the growing
demand for water, but this unfortunately caused disputes between user groups. The quality of surface and groundwater
resources is decreasing due to domestic, industrial and agricultural pollution.‖ Page 494
Mongolia (Tuul Basin) [2006 summary only] “The amount of renewable groundwater resources has been estimated at 10.8 km3/year. Groundwater resources continue to be a major source of water, especially during winter when many surface water resources are frozen.
Water and ecosystems
Growing urbanization and the mining industry have significantly polluted surface and underground water resources,
which has had a significant impact on associated ecosystems. Furthermore, overuse of groundwater resources has led
to lowering of the groundwater table, which has consequently caused some springs, lakes and their associated

3_NWRA_GW_focus.doc
ecosystems to dry up. Increasing numbers of livestock and uncontrolled grazing practices are also affecting the balance
of ecosystems.‖ Page 495
Water for food
In recent years, climate changes have caused groundwater levels to fall, which has resulted in the drying up of some
wells and springs (NSO, 2000). This has a great impact on animal herders living in remote areas of Mongolia.
Consequently, the risk of livestock losses during the dry periods has increased enormously, and pastures near abundant
water sources have become overused. The increasing number of livestock (from 25 million in 1990 to 30 million in
2000) clearly indicates that the problem is likely to get worse.‖ Page 496
La Plata Basin (Argentina, Brazil, Bolivia, Paraguay, Uruguay) [2007 full report]
3. Water resources in the La Plata Basin
3.1.1. Spatial variance of water availability
3.1.1.2. Groundwater aquifers ―The main aquifer of the La Plata Basin is the Sistema Acuífero Guaraní (Guaraní Aquifer System), which is shared by
Argentina, Brazil, Paraguay and Uruguay. It is one of the largest groundwater reservoirs in the world, taking up an area
of around 1,190,000 km2, which are distributed as Figure 3.4 shows. Water from the aquifer may be extracted at
variable depths –between 50 and 1,500 m. In Argentina, it lies at more than 900 m depth. As a result of its considerable
depth, its temperature ranges between 33ºC and 65ºC. In general, the aquifer has surge pressure, so that when the
ground is drilled up to its depth, water rises naturally and often emerges above ground level (Santa Cruz, 2004).
Although the Guaraní Aquífer has a huge water storage (37,000 km3), the volume that can actually be exploited
estimated as regulation or renewable reserves–, does not exceed 40 to 80 km3/year. This volume is comparable to one
third of the total runoff of the Uruguay River, and is equal to four times the total annual water demand of Argentina
(Santa Cruz, 2004).‖ Page 39
―Brazil is the country that exploits the aquifer more intensively, delivering water either totally or partially to 300-500
cities. Uruguay has 135 public water wells, some of which are used for thermal exploitation. Paraguay has about 200
wells, mainly devoted to human uses. Finally, Argentina has five thermal freshwater wells and one saltwater well in
operation at the beginning of 2000s (Santa Cruz, 2004). The groundwater of the Guaraní System originated in ancient
geologic formations, dated from 200 to 132 million years. After a series of geologic events, which enabled over 1,000-
meterthick rocks to deposit as sediment throughout the area, geologic structures and faults started to originate and
reactivate, altering the established stratigraphic order as well as the original orientations and heights. This was added to
erosive processes acting during several million years. In this virtually final geologic scenario, the more permeable rocks
started to fill with water through infiltration processes; water started to circulate slowly from the upwelling –or recharge
areas–, to the subsidence and confinement –transit and discharge– areas. The largescale onset of this process goes as far
back as 20,000 years ago (Santa Cruz, 2004).
Other aquifers currently exploited in Argentina, Brazil, Paraguay and Uruguay are briefly described below.
- Argentina (source: Mugetti, 2004)
a) Recent Pliocene silts: They can be found in some areas of the provinces of Formosa, Chaco, Salta, Santiago del
Estero and Santa Fe. Free or semi-free layers are exploited, being water quality conditioned by several factors. Average
water depth ranges between 5 m in the East and 35 m in the West. Laterally discontinuous aquifers are developed at
depths of 100 to 200 m in the medium-high permeability strip, with good chemical and hydraulic conditions.‖ Page 40
―b) Puelches and Ituzaingó Formations: This sub-region is divided by the Paraná River, and stretches from the
Northwest of the Province of Formosa to the Samborombón Bay (Province of Buenos Aires). The Ituzaingó formation
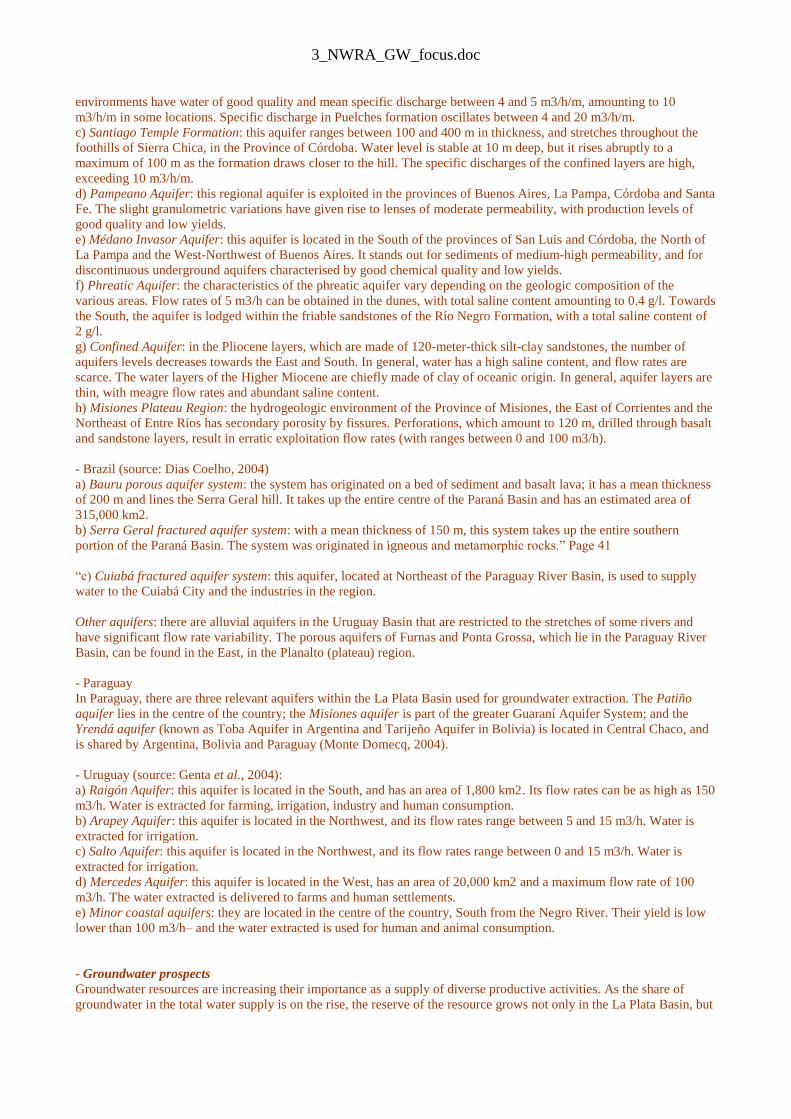
3_NWRA_GW_focus.doc
environments have water of good quality and mean specific discharge between 4 and 5 m3/h/m, amounting to 10
m3/h/m in some locations. Specific discharge in Puelches formation oscillates between 4 and 20 m3/h/m.
c) Santiago Temple Formation: this aquifer ranges between 100 and 400 m in thickness, and stretches throughout the
foothills of Sierra Chica, in the Province of Córdoba. Water level is stable at 10 m deep, but it rises abruptly to a
maximum of 100 m as the formation draws closer to the hill. The specific discharges of the confined layers are high,
exceeding 10 m3/h/m.
d) Pampeano Aquifer: this regional aquifer is exploited in the provinces of Buenos Aires, La Pampa, Córdoba and Santa
Fe. The slight granulometric variations have given rise to lenses of moderate permeability, with production levels of
good quality and low yields.
e) Médano Invasor Aquifer: this aquifer is located in the South of the provinces of San Luis and Córdoba, the North of
La Pampa and the West-Northwest of Buenos Aires. It stands out for sediments of medium-high permeability, and for
discontinuous underground aquifers characterised by good chemical quality and low yields.
f) Phreatic Aquifer: the characteristics of the phreatic aquifer vary depending on the geologic composition of the
various areas. Flow rates of 5 m3/h can be obtained in the dunes, with total saline content amounting to 0.4 g/l. Towards
the South, the aquifer is lodged within the friable sandstones of the Río Negro Formation, with a total saline content of
2 g/l.
g) Confined Aquifer: in the Pliocene layers, which are made of 120-meter-thick silt-clay sandstones, the number of
aquifers levels decreases towards the East and South. In general, water has a high saline content, and flow rates are
scarce. The water layers of the Higher Miocene are chiefly made of clay of oceanic origin. In general, aquifer layers are
thin, with meagre flow rates and abundant saline content.
h) Misiones Plateau Region: the hydrogeologic environment of the Province of Misiones, the East of Corrientes and the
Northeast of Entre Ríos has secondary porosity by fissures. Perforations, which amount to 120 m, drilled through basalt
and sandstone layers, result in erratic exploitation flow rates (with ranges between 0 and 100 m3/h).
- Brazil (source: Dias Coelho, 2004)
a) Bauru porous aquifer system: the system has originated on a bed of sediment and basalt lava; it has a mean thickness
of 200 m and lines the Serra Geral hill. It takes up the entire centre of the Paraná Basin and has an estimated area of
315,000 km2.
b) Serra Geral fractured aquifer system: with a mean thickness of 150 m, this system takes up the entire southern
portion of the Paraná Basin. The system was originated in igneous and metamorphic rocks.‖ Page 41
―c) Cuiabá fractured aquifer system: this aquifer, located at Northeast of the Paraguay River Basin, is used to supply
water to the Cuiabá City and the industries in the region.
Other aquifers: there are alluvial aquifers in the Uruguay Basin that are restricted to the stretches of some rivers and
have significant flow rate variability. The porous aquifers of Furnas and Ponta Grossa, which lie in the Paraguay River
Basin, can be found in the East, in the Planalto (plateau) region.
- Paraguay
In Paraguay, there are three relevant aquifers within the La Plata Basin used for groundwater extraction. The Patiño
aquifer lies in the centre of the country; the Misiones aquifer is part of the greater Guaraní Aquifer System; and the
Yrendá aquifer (known as Toba Aquifer in Argentina and Tarijeño Aquifer in Bolivia) is located in Central Chaco, and
is shared by Argentina, Bolivia and Paraguay (Monte Domecq, 2004).
- Uruguay (source: Genta et al., 2004):
a) Raigón Aquifer: this aquifer is located in the South, and has an area of 1,800 km2. Its flow rates can be as high as 150
m3/h. Water is extracted for farming, irrigation, industry and human consumption.
b) Arapey Aquifer: this aquifer is located in the Northwest, and its flow rates range between 5 and 15 m3/h. Water is
extracted for irrigation.
c) Salto Aquifer: this aquifer is located in the Northwest, and its flow rates range between 0 and 15 m3/h. Water is
extracted for irrigation.
d) Mercedes Aquifer: this aquifer is located in the West, has an area of 20,000 km2 and a maximum flow rate of 100
m3/h. The water extracted is delivered to farms and human settlements.
e) Minor coastal aquifers: they are located in the centre of the country, South from the Negro River. Their yield is low
lower than 100 m3/h– and the water extracted is used for human and animal consumption.
- Groundwater prospects
Groundwater resources are increasing their importance as a supply of diverse productive activities. As the share of
groundwater in the total water supply is on the rise, the reserve of the resource grows not only in the La Plata Basin, but

3_NWRA_GW_focus.doc
also in the whole Latin America, due to the discovery of new sources (Hernández, 2005). The expansion in the use of
groundwater brings along an increment in conflicts, not only due to the expansion process itself, but also between
different types of uses (irrigation, drinking water supply, industries). For example, lack of planning in the distribution of
the exploitation wells produces a physical deterioration of vast depressed areas; this situation would turn even complex
in case of saline intrusion. In other cases, substitution of the groundwater source by a surface one generates a recovery
of the piezometric levels that might affect diverse types of infrastructure (Hernández, 2005). Besides all these problems,
there are additional complications related to socioeconomic and political situations in each country. Lack of
governmental control through regulation entities and efficient public policies, privatisation and/or concession processes
of water services in the countries, lack of research and technical knowledge and the tendency of consider economic
factors rather than social ones, are some of the worst problems related to the use of groundwater in these countries
(Hernández, 2005). Regarding to future prospects, there are no signs of changes towards a sustainable use of
groundwater, tending to solve the most urgent problems. Except for the case of Brazil, where the Agência Nacional de
Aguas, ANA (National Water Agency) has been created, the other countries have not improved much their situations or
they even have gone back, as Argentina, where 20 years ago there used to be major evaluation projects (Hernández,
2005). In spite of this situation, there is an encouraging example in the basin. The Project for Environmental Protection
of the Guaraní Aquifer System, approved by the Global Environmental Facility in 2001 is being carried out by the
countries that share the groundwater system (Hernández, 2005). This project has the environmental protection as its
main goal and it foresees scientific and technical actions in diverse issues of Geology, Hydrogeology, Geophysics,
Geochemistry, Information Systems, Environment, Geothermic Engineering, Sociology, Education, Legislation and
others (Santa Cruz, 2004).‖ Page 42
3.2.3. Extreme events
3.2.3.1. Floods - Water table increases
Increased water tables have been observed in the Pampean region in recent years as a result of both natural and
anthropogenic factors. Higher groundwater levels cause problems to underground infrastructure and increase the
potential of groundwater pollution in both urban and suburban areas. In rural locations, the upwelling of water leads to
floods in large areas used for crop and cattle farming. Despite its association with natural causes –mainly the increase in
rainfall after the 1970s– this trend has also been determined in urban areas by anthropogenic factors, inter alias a
reduced groundwater pumping capacity (caused by water utility companies, industries and other users); infrastructure
developments that obstruct surface water circulation, leading to greater aquifer recharge; a rise in risk water infiltration
rates; and inadequate land management (UNEP, 2004).‖ Page 48
8.1.1. Irrigated land: current use and future projections
8.1.1.1. Water use for irrigation
―- Utilisation of groundwater The use of groundwater has a relatively low participation into the irrigated agriculture, if it is compared with the use of
superficial waters: only a small percentage of the water used in irrigation come from underground sources. The situation
of use of groundwater by each country is presented below.
Groundwater in Argentina was used since the 1950s. Increases in water availability for irrigation have been registered
since then, as well as an extension of the cultivated area and an improvement in irrigation efficiency. At the end of the
century, FAO estimated that around
25.7 of irrigation was made using groundwater sources in the whole country, being the humid and sub-humid areas the
ones with the best groundwater quality (FAO, 2000 a). Meanwhile, only complementary irrigation in Buenos Aires
Province demands groundwater in the La Plata Basin (Mugetti, 2004).
The potential groundwater resource in Bolivia has not been quantified yet. The hydrogeological map of Bolivia shows
that the aquifers with the best possibilities of use are located in the Amazon Basin and in two areas of the La Plata
Basin: the Pantanal-Chaco and the Altiplano hydrogeologic provinces. Most of water springs of these two provinces
provide water to the ―bofedales‖ (cushion peat-bogs) or highland wetlands and most of the lagoons and rivers (Unidad
de Aguas y Suelos, 2005).
Although there is no accurate data related to the amount of groundwater used in irrigation, FAO (2000 b) estimated that
only a small part of producers use wells and filtrating galleries. For example, the participation of groundwater
represents 0.2% of total irrigation in Potosí Department and 0.7% in Santa Cruz Department, considering only water
provided by wells (Unidad de Desarrollo Sostenible y Medio Ambiente, 2002).
Evaluation of groundwater resources is still insufficient in Brazil. ANA estimated that around 80% of the productive
volume of water is located in both the Paraná and the Amazon basins. ANA also indicated that more than 200,000 wells
are used to supply several activities, including irrigation; the major water volume is used in public supply to households
(ANA, 2002).
3_NWRA_GW_focus.doc
Groundwater used in irrigation is still not significant in both Brazilian South and Southeast. A proliferation of small
irrigation areas devoted to fruits and vegetables –cropped at familiar level– are located in both regions, mainly near the
major urban centres. There is only one large irrigation project using mainly groundwater sources in the Verde River
valley, in Minas Gerais State (ANA, 2002).
The use of groundwater in irrigated agriculture is not important either in Paraguay or in Uruguay (FAO, 2000 d; Genta
et al., 2004). Vegetable crops are the only exception in Uruguay, where near 50% of the irrigated agriculture is supplied
by groundwater. The main supply sources are the Raigón aquifer in the South and the Salto aquifer in the North of the
country (FAO, 2000 e).‖ Page 201
9.2. Impact of industry on water quality degradation
―9.2.2. Paraguay River Worthy of special mention is the mining activity in the Bolivian Upper Paraguay Basin. There are tin deposits in the
form of cassiterite or in the form of tin sulphide minerals, related to other metals; the discharges of waters used in
extraction and processing, as well as the erosion and dissolution of mine wastes, contaminate rivers and groundwater.
Information on affected groundwater flow is preliminary; information on polluting emissions towards surface waters as
a result of shaft-mining and acid drainage of open-pit mining activities is not precise. Acid drainage was estimated in
some 4,000,000 m3, related to a total solids load of 643,000 t, of which about 522 t are suspended solids (Crespo
Milliet, 2004).‖ Page 232
11.2 Frequency and amplitude of water related disasters ―- Floods
Flooding is the major risk of natural origin in the La Plata Basin. Floods are triggered by three main factors: natural
increase in water levels over their banks in rainy seasons, disorganised urban sprawl and increased groundwater table
levels (Tucci, 2004).‖ Page 266
Increases in water table: In the last few years, increases in water table levels have been observed in the Pampean
region, which are associated with natural and anthropic factors. In urban and suburban areas, water table levels cause
problems in the underground infrastructure and increase the potential contamination of groundwater. In rural areas, the
shallow depths and the upwelling of waters provoke floods in vast areas devoted to agriculture and livestock activities.
Although this problem is associated with natural causes (mainly, the increase in rainfall after the 1970‘s), there are other
anthropic causes such as: the reduction of groundwater pumping (by water supply service companies, by the industrial
sector and other users), the construction of infrastructure works that obstruct the circulation of superficial water
favouring the recharge the aquifer; the increase in infiltration of irrigation water; the inadequate territorial zoning
(UNEP, 2004).‖ Page 266
South Africa [2006 summary only] “South Africa’s existing water resource availability comprises 77 percent surface water, 9 percent groundwater and 14 percent re-use of return flows.
Water and settlements
The rural population (about 20 million people or 41 percent of the total population) also presents a major challenge for
ensuring sustainable livelihoods. Although groundwater represents only about 9 percent of available water
resources, 74 percent of South African rural communities are dependent entirely on groundwater, while another
14 percent depend partially on it.‖ Page 502
“Water management and risk mitigation
South Africa is also in the process of establishing a comprehensive integrated monitoring framework for water
resources and water services. These various governance initiatives instil an effective, participative and sustainable water
management culture in South Africa.‖ Page 504
Sri Lanka [2006 full report] this report was formatted so that it was very difficult to copy text,
therefore this is more abbreviated that it might be otherwise.
“Sri Lanka is a humid tropical island, situated in the path of two monsoons, the south-west and the north-east monsoons. Despite this, Sri Lanka has extensive areas of water deficit, and a greater part of the country experiences dry spells lasting several months. The wet zone in the west of the country is the only water surplus area in the country. Acute deficits exist in the northern, north-western, north-eastern and south-eastern parts. The availability of surface water in the dry zone, which encompasses nearly 75 % of the land area, is frequently affected by the failure of the

3_NWRA_GW_focus.doc
north-east monsoon. Due to poor aquifer conditions, groundwater too is limited in the dry zone (Jayatillake et al 2005).” Page 1 Geology About 90% of the land consists of pre-Cambrian metamorphic rocks metamorphosed under granulite directions from the
central hill mass. The Mahaweli and amphibolite facies conditions. The geological properties of these formations
influence the occurrence of groundwater, formation of springs and soils. Quaternary sands, sandstones, forest cover was
estimated at 84% of the land area, clays and gravels are present in the coastal areas providing lenses of freshwater.
Groundwater is available in the zones of jointing and fracturing of rock formations (Manchanayake and Madduma
Bandara, 1999). Figure 4 shows location of geological formations and the major rock types.‖ Page 2
Groundwater “Main types of aquifers The groundwater resources in Sri Lanka are considered to be lesser than surface water resources. The estimated
groundwater potential is 7,800 MCM per annum (UNEP, 2005). The demand for groundwater development is specially
for domestic water needs. However, the coastal sand aquifer area in the north-western region is being extensively used
for agriculture. Industrial estates in the wet zone are also heavily dependent on groundwater. Seven main types of
groundwater aquifers have been identified:
1. Shallow karstic aquifer
2. Deep confined aquifer
3. Shallow coastal sand aquifer
4. Alluvial aquifer
5. Shallow regolith aquifer
6. South-western laterite aquifer
7. Miscellaneous types
Figure 19 shows the types of groundwater aquifers present in Sri Lanka. Both the quantity and quality issues have
restricted the use of groundwater resource. Recent studies carried out in the Ruhuna Basins reveal that nearly half the
tested wells contain fluoride levels higher than the permissible levels. The concentrations are higher in the deep tube
wells. In Sri Lanka, groundwater is widely used for domestic, small scale irrigation, industrial and other uses. Based on
studies conducted over the past 50 years, several types of both shallow and deep groundwater aquifers have been
identified. Each of these aquifers has distinct characteristics. Shallow aquifers play an important role in providing
domestic supplies from traditional wells of between 6 and 9 meter depth, and also in discharging water to rivers and
other water bodies during low flow periods. They also support wetlands and native vegetation.‖ Page 21

3_NWRA_GW_focus.doc
“Threats to groundwater Predominantly in the dry zone, shallow groundwater that occurs under the small tank cascade systems is now being
subjected to severe stress of over extraction. The use of this groundwater through large diameter dug wells or agro-
wells for growing high value cash crops has increased at an accelerated pace over the last decade. This shallow
groundwater is very limited in its quantity and is of a very ephemeral nature. If it is over exploited it could lead to long
term desertification which in turn would lead to disastrous ecological consequences in the North and Western provinces
of the country (Weerasinghe et al, 2005).‖ Page 24
Water quality “Groundwater quality In the case of groundwater, agricultural chemicals and chemical properties in the soils affect the water quality. It is
estimated that about 40% of the tube wells constructed during the last decade of the 20th century were abandoned due
to contamination from iron, manganese and fluorides. In the Jaffna peninsula, nitrate concentrations of over 200 mg/l
have been reported. Bacterial pollution from pit latrine soak-ways is also reported in the peninsula (UNEP, 2005).
Over-exploitation of groundwater and the resultant salt-water intrusion has been reported in such areas as Puttalam,
Mannar, Paranthan, Kilinochchi and Mullaitivu. The agricultural chemicals are reported as the cause for high
concentrations of chloride, nitrate and potassium in Kalpitiya Peninsula (UNEP, 2005).‖ Page 25
Data and information on water resources
“Groundwater data There is no baseline groundwater quantity or quality-monitoring program for resource assessment and utilization. Both
the Water Resources Board (WRB) and the National Water Supply and Drainage Board (NWSDB) collect geological
and spatial data on bores, agro-wells and water supply wells which they construct and maintain databases of hydro-
geological information. Both organizations carry out drilling programs and there is opportunity for rationalization of
these activities.‖ Page 27
“System performance In the case of groundwater long-term monitoring of water levels on a seasonal and yearly basis has to be introduced for
assessment and sustainable management decisions. A nationwide groundwater-monitoring program of water level and
water quality data needs to be implemented together with the integration of the available data into a single system. The
absence of water usage data at smaller irrigation systems prevents carrying out important water budget computations of
rational water resources management. (Wijesekera et.al, 2000) ― Page 29
“Based on the information collected, retrieved, analysed and collated in Chapters 1 to 13 of this study, the achievements, issues and challenges in Sri Lanka's Water Sector can be summarized as follows: “Challenge Area Achievements Issues Challenges/Threats
The resource Water resources Lack of a comprehensive Over-exploitation of
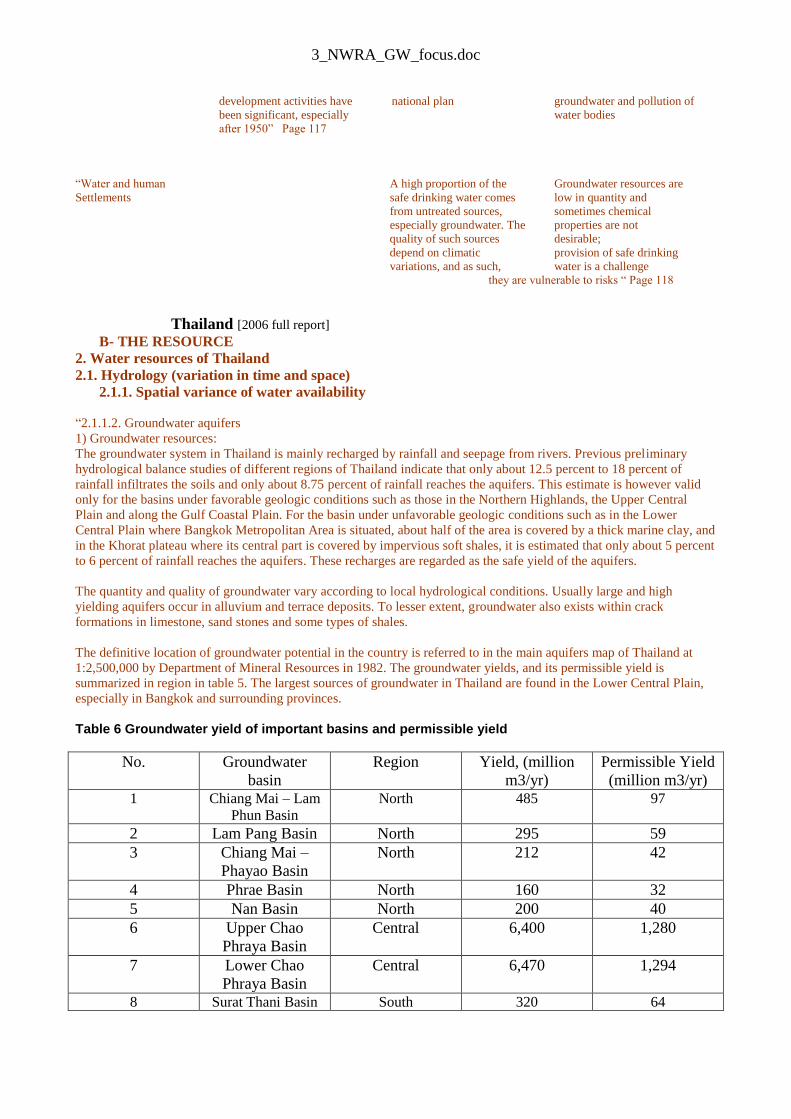
3_NWRA_GW_focus.doc
development activities have national plan groundwater and pollution of
been significant, especially water bodies
after 1950‖ Page 117
―Water and human A high proportion of the Groundwater resources are
Settlements safe drinking water comes low in quantity and
from untreated sources, sometimes chemical
especially groundwater. The properties are not
quality of such sources desirable;
depend on climatic provision of safe drinking
variations, and as such, water is a challenge
they are vulnerable to risks ― Page 118
Thailand [2006 full report]
B- THE RESOURCE
2. Water resources of Thailand
2.1. Hydrology (variation in time and space)
2.1.1. Spatial variance of water availability
―2.1.1.2. Groundwater aquifers
1) Groundwater resources:
The groundwater system in Thailand is mainly recharged by rainfall and seepage from rivers. Previous preliminary
hydrological balance studies of different regions of Thailand indicate that only about 12.5 percent to 18 percent of
rainfall infiltrates the soils and only about 8.75 percent of rainfall reaches the aquifers. This estimate is however valid
only for the basins under favorable geologic conditions such as those in the Northern Highlands, the Upper Central
Plain and along the Gulf Coastal Plain. For the basin under unfavorable geologic conditions such as in the Lower
Central Plain where Bangkok Metropolitan Area is situated, about half of the area is covered by a thick marine clay, and
in the Khorat plateau where its central part is covered by impervious soft shales, it is estimated that only about 5 percent
to 6 percent of rainfall reaches the aquifers. These recharges are regarded as the safe yield of the aquifers.
The quantity and quality of groundwater vary according to local hydrological conditions. Usually large and high
yielding aquifers occur in alluvium and terrace deposits. To lesser extent, groundwater also exists within crack
formations in limestone, sand stones and some types of shales.
The definitive location of groundwater potential in the country is referred to in the main aquifers map of Thailand at
1:2,500,000 by Department of Mineral Resources in 1982. The groundwater yields, and its permissible yield is
summarized in region in table 5. The largest sources of groundwater in Thailand are found in the Lower Central Plain,
especially in Bangkok and surrounding provinces.
Table 6 Groundwater yield of important basins and permissible yield
No. Groundwater
basin
Region Yield, (million
m3/yr)
Permissible Yield
(million m3/yr) 1 Chiang Mai – Lam
Phun Basin North 485 97
2 Lam Pang Basin North 295 59
3 Chiang Mai –
Phayao Basin
North 212 42
4 Phrae Basin North 160 32
5 Nan Basin North 200 40
6 Upper Chao
Phraya Basin
Central 6,400 1,280
7 Lower Chao
Phraya Basin
Central 6,470 1,294
8 Surat Thani Basin South 320 64
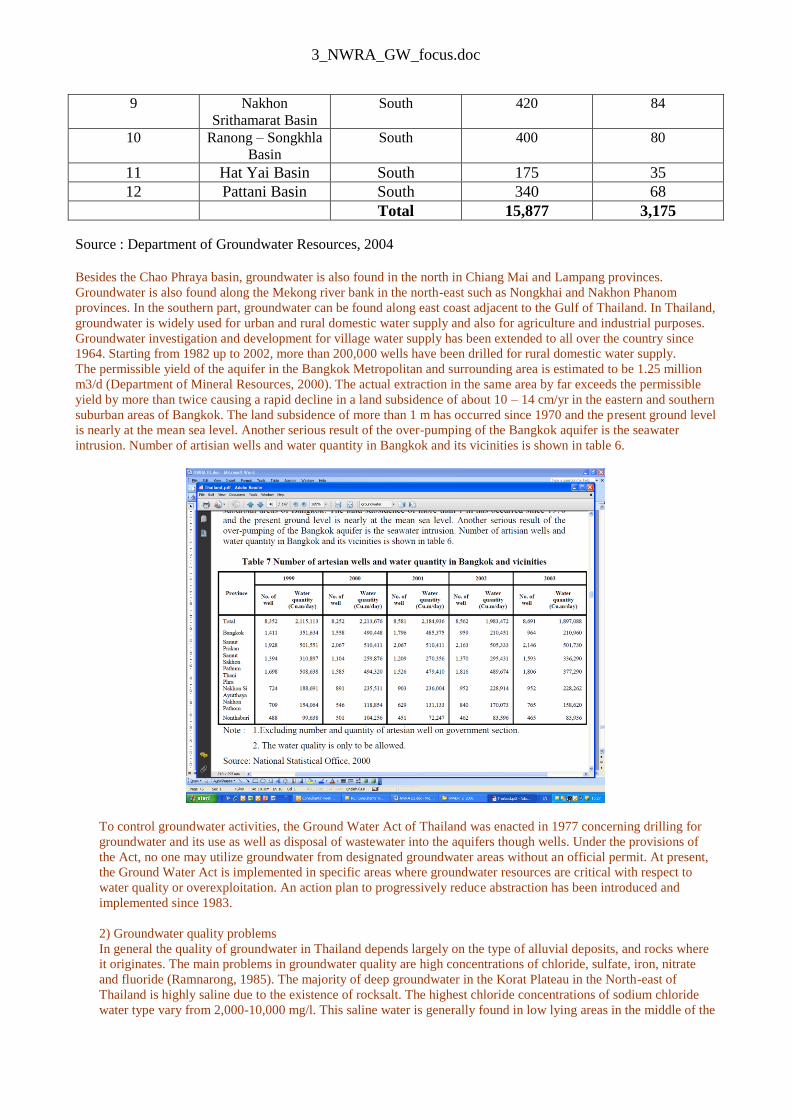
3_NWRA_GW_focus.doc
9 Nakhon
Srithamarat Basin South 420 84
10 Ranong – Songkhla
Basin South 400 80
11 Hat Yai Basin South 175 35
12 Pattani Basin South 340 68 Total 15,877 3,175
Source : Department of Groundwater Resources, 2004
Besides the Chao Phraya basin, groundwater is also found in the north in Chiang Mai and Lampang provinces.
Groundwater is also found along the Mekong river bank in the north-east such as Nongkhai and Nakhon Phanom
provinces. In the southern part, groundwater can be found along east coast adjacent to the Gulf of Thailand. In Thailand,
groundwater is widely used for urban and rural domestic water supply and also for agriculture and industrial purposes.
Groundwater investigation and development for village water supply has been extended to all over the country since
1964. Starting from 1982 up to 2002, more than 200,000 wells have been drilled for rural domestic water supply.
The permissible yield of the aquifer in the Bangkok Metropolitan and surrounding area is estimated to be 1.25 million
m3/d (Department of Mineral Resources, 2000). The actual extraction in the same area by far exceeds the permissible
yield by more than twice causing a rapid decline in a land subsidence of about 10 – 14 cm/yr in the eastern and southern
suburban areas of Bangkok. The land subsidence of more than 1 m has occurred since 1970 and the present ground level
is nearly at the mean sea level. Another serious result of the over-pumping of the Bangkok aquifer is the seawater
intrusion. Number of artisian wells and water quantity in Bangkok and its vicinities is shown in table 6.
To control groundwater activities, the Ground Water Act of Thailand was enacted in 1977 concerning drilling for
groundwater and its use as well as disposal of wastewater into the aquifers though wells. Under the provisions of
the Act, no one may utilize groundwater from designated groundwater areas without an official permit. At present,
the Ground Water Act is implemented in specific areas where groundwater resources are critical with respect to
water quality or overexploitation. An action plan to progressively reduce abstraction has been introduced and
implemented since 1983.
2) Groundwater quality problems
In general the quality of groundwater in Thailand depends largely on the type of alluvial deposits, and rocks where
it originates. The main problems in groundwater quality are high concentrations of chloride, sulfate, iron, nitrate
and fluoride (Ramnarong, 1985). The majority of deep groundwater in the Korat Plateau in the North-east of
Thailand is highly saline due to the existence of rocksalt. The highest chloride concentrations of sodium chloride
water type vary from 2,000-10,000 mg/l. This saline water is generally found in low lying areas in the middle of the

3_NWRA_GW_focus.doc
southern basin of the Korat Plateau such as Nakhon Ratchsima and Chaiyaphum provinces. However, fresh
groundwater is also found in shallow aquifer at higher elevations. The concentration of calcium in the groundwater
of Korat plateau varies from place to place depending on the distribution of the sources of gypsum and calcium
mineral. The concentration of calcium is generally within the limit of drinking water standards.
Dissolved iron in groundwater in consolidated rocks in the North-east and in other parts of the country ranges from
0.3 mg/l to over 100 mg/l. Most of the groundwater especially in the North – east has iron concentrations over the
limit of drinking water standard of the World Health Organization (WHO). High nitrate concentrations in the North
– eastern region are mostly found in shallow aquifers due to heavy use of fertilizers. These concentrations range
from 10mg/l to about 1,180 mg/l. Groundwater in the eastern part of Thailand such in Chonburi province has
significant concentrations of fluoride contents up to 1.5 mg/l exceeding as an essential constituent of drinking water
regarding particularly to the prevention of dental caries in children but excessive concentrations may give dental
fluorosis and skeleton damages.
A study of the hydrochemical data pertaining to groundwater of Bangkok deltaic areas and the peninsular coastal
aquifers reveals that salt water encroachment could be observed in the heavily pumped aquifers. The heavy
pumpage in coastal regions especially in Bangkok and adjacent areas is about 1.3 million m3/d. Such quantity by
far exceeds the natural recharge of the aquifers. The depletion of groundwater due to long-time heavy pumping has
caused rapid decline in peizometric heads to more than 50 m .This decline results in salt-water encroachment
occurs at an alarming rate of 500 m/yr in the 150 m deep aquifer. The chloride concentrations have risen from 10
mg/l to more than 600 mg/l in the past nine years. This results in the abandonment of hundreds of wells in the
southern part of Bangkok and Samut Prakarn provinces.‖ Pages 44-47
“6. Water for food
6.1. Surface area of total cultivated area
6.1.1. Percentage of irrigated land
6.1.1.1. Water used for irrigation
4) Utilization of groundwater
Groundwater is an important source of water supply in Thailand. Public water supplies for one - fifth of the nation's
220 towns and cities and for half of the 700 Sanitary Districts are derived from groundwater. It is estimated that 75
percent of domestic water is obtained from groundwater sources. Groundwater system in Thailand is mainly
recharged by rainfall of about 40,000 million m3. and seepage from the rivers. It was estimated from previous
hydrological balance studies that about 12.5 to 18 percent of rainfall would infiltrate the soils and about 9 percent
of rainfall would reach the aquifers. However, this estimate is valid only for the basins under favorable geologic
conditions such as those in the Northern Highlands, the Upper Central Plain and along the Gulf Coastal Plain. For
the other basins such as those in the Lower Central Plain including Bangkok and in the Khorat Plateau, it was
estimated that only 5-6 percent of rainfall reaches the aquifer. More than 200,000 groundwater well projects were
undertaken by both government and private with total capacity of about 7.55 million m3/day. (2,700 million m.3
/year) It is estimated that 75 percent of domestic water is obtained from groundwater sources.‖ Page 98
“10. Allocation of Water Resources
10.1. Competition for Water within countries
10.1.2. Groundwater use for irrigation The only large-scale groundwater irrigation project in Thailand is at Sukhothai province in the North of the
Country. Rice is the main crop during wet seasons. Field crops such as soya beans, cotton are the main crop during
dry seasons. Groundwater is used to supplement surface water during wet seasons. In dry seasons, irrigation mainly
utilizes groundwater. The amount of groundwater use for irrigation in Sukhothai was between 21.8 – 46.7 million
m3/yr. (Royal Irrigation Department, 2006)‖ Page 132

3_NWRA_GW_focus.doc
Uganda [2006 full report]
3.1 Introduction Despite Uganda‘s being well endowed with significant freshwater resources, the challenges of rapid population
growth, increased urbanization and industrialization, uncontrolled environmental degradation and pollution are
leading to accelerated depletion and degradation of the available water resources.
Direct rainfall is the most important source of water in Uganda. The rainfall pattern greatly influences the local
land use potential and thus the population distribution. The average annual rainfall varies from 900mm in the north-
eastern semi-arid areas of Kotido to 2000mm on Sese islands in Lake Victoria.
3.3.1 Surface Water Hydrology
Most of Uganda lies within the upper part of the White Nile Basin and is nearly wholly drained by the White Nile,
save for a small portion to the northeast that drains into the Just over 15% of the total surface area of Uganda is
covered by open water and there is an annual water supply of 66 Km3 in the form of rain and inflows. The open
water sources are mainly in the form of rivers and lakes. The most prominent hydrological feature in Uganda is
Lake Victoria, which is the second largest fresh water lake in the world. The lake covers an area of 69,000 Km2.
River Nile, which is the only outflow from the lake, has its source at the point where Lake Victoria spills over
Ripon Falls (now submerged due to the construction of the Owen Falls Dam). The 130 Km stretch of the Nile from
Lake Victoria to lake Kyoga is termed the Victoria Nile. Despite Uganda‘s significant water resources, their spatial
and temporal variability often renders many parts of the country water stressed over long periods of the year. The
country encompasses both humid and semi-arid areas and there are not only significant differences between wet
and dry years, but also considerable variations in the onset of rain seasons.
SNOW AND GLACIERS
Snows and glaciers are mostly found in the Rwenzori Mountains whose altitude ranges from 1,700m to 5,109m
(698 km2 above 2,500m). Snowfields and glaciers cover the highest reaches of the mountains. The Rwenzori
Mountains are a vital water catchment area, feeding the economically important Lakes Edward and George, and
constituting the highest and most permanent sources of the River Nile. The Rwenzori Mountains are extremely wet,
with rain falling on most days, including the dryer months (Howard, 1991).
The quality of surface water in Uganda has been deteriorating over time during the last decades. Increasing
urbanization, population growth and anthropogenic activities have resulted in significant deterioration in the quality
of both surface and groundwater in many parts of the country. There are increasing incidences of surface water
pollution from both domestic and industrial waste discharges, and run-off from agricultural fields.
3.4 Groundwater Resources
3.4.1 Geological Formation The geology of Uganda is dominated by crystalline Basement Complex rocks of pre- Cambrian age that underlie
over 90% of the country. These consist of predominantly granites, granitoid gneisses and gneisses, which are
sometimes migmatised. These rocks, normally classified as undifferentiated gneisses and granites, are the oldest in
age and are overlain by the so-called Buganda series and Karagwe–Ankolean series. These are characterised by
pellitic rocks, which have been metamorphosed to form rocks varying from slightly cleaved phyllitic mudstone and
shales to mica schists. Cenozoic rift valley sediments and tertiary and Pleistocene volcanics occur in a few areas
and cover less than 10% of the country. The western part of the country is bounded by the rift valley, which is
underlain by sediments made up of a mixture of sand, silts and clay. Other recent sediments are found in various
places as a result of erosion to valleys and magmatic outflows from volcanic eruptions.
3.4.2 Groundwater Occurrence The occurrence of aquifers in different parts of Uganda is related to the respective geological characteristics of the
areas. The productive aquifers are mainly found in in-situ weathered bedrock, the regolith overlying the bedrock
and in faults and fractures in the basement. The highest yielding wells are found in the weathered- fractured
bedrock where the permeability is rather high and where the storage can be provided by the overlying regolith. The
number and distribution of fractures, and the effective porosity in each geological material control aquifer
characteristics respectively. Figure 3.6 below illustrates the presence of aquifers in granites, gneisses and schists.

3_NWRA_GW_focus.doc
Figure 3.6: Presence of aquifers in granites, gneisses and schists
GROUNDWATER RECHARGE Groundwater recharge varies considerably across the country and is extremely sensitive to land use and the
amount and intensity of precipitation falling in a given area. However, due to inadequate data and resources,
very few groundwater recharge assessments have been carried out in Uganda and thus recharge estimates for
most areas remain unknown. Recharge assessments have recently been carried out in Apac in northern Uganda,
Mbarara in Western Uganda, Wobulenzi in Central Uganda, Nkokonjeru in Eastern Uganda and Hoima in
Midwestern Uganda. The recharge assessment methods used have ranged from soil moisture balance using
spreadsheet and the model, EARTH to water level fluctuation, isotope techniques and hydrograph separation.
Groundwater recharge estimates obtained using the various methods range between 90 and 220 mm per annum
and accounts for between 7 and 20% of the average annual precipitation in Uganda.
From the above figures it can be stated that groundwater recharge in Uganda is quite high compared to current
abstraction volumes and will not be a limiting factor in groundwater development for a few years to come.
However, there is a need to carry out more detailed recharge and water balance studies in the country to ensure
that groundwater development is carried out in a sustainable manner.
GROUNDWATER POTENTIAL The potential of groundwater in various areas of the country is exhibited by presence of deep boreholes,
shallow wells and springs.
a) Deep Boreholes
Deep borehole potential can be assessed by a means of a number of borehole parameters as discussed below.
(i) Regolith Thickness - The regolith in most of Uganda is clayey especially in the upper layers where
relatively low permeability dominates. Medium to high regolith thickness (> 30m) leads to high groundwater
potential through provision of storage for the deeper fractured aquifer. The regolith thickness across the
country can be described as low to medium varying between 20 - 45m.
(ii) Aquifer Yields - The borehole yields in the country vary significantly according to the formation in which
they are drilled and their degree of fracturing and weathering. Borehole yields vary from 0.5 - 12 m3/hr. High
yielding boreholes are normally found in granites and gneisses which are easily fractured while low yielding
boreholes are found in the phyllites and schists which exhibit a medium degree of metamorphism.
Transmissivity values vary from as low as 0.1 m2/day to as high as over 30 m2/day.
(iii) Rest Water Levels - Rest water levels also give an indication of the groundwater potential of an area.
Shallow water levels (<20m) indicate that the aquifer has high potential for yielding groundwater while deeper
water levels indicate the reverse. Rest water levels (static water levels) in the country vary between 1 and 45 m
below ground level.
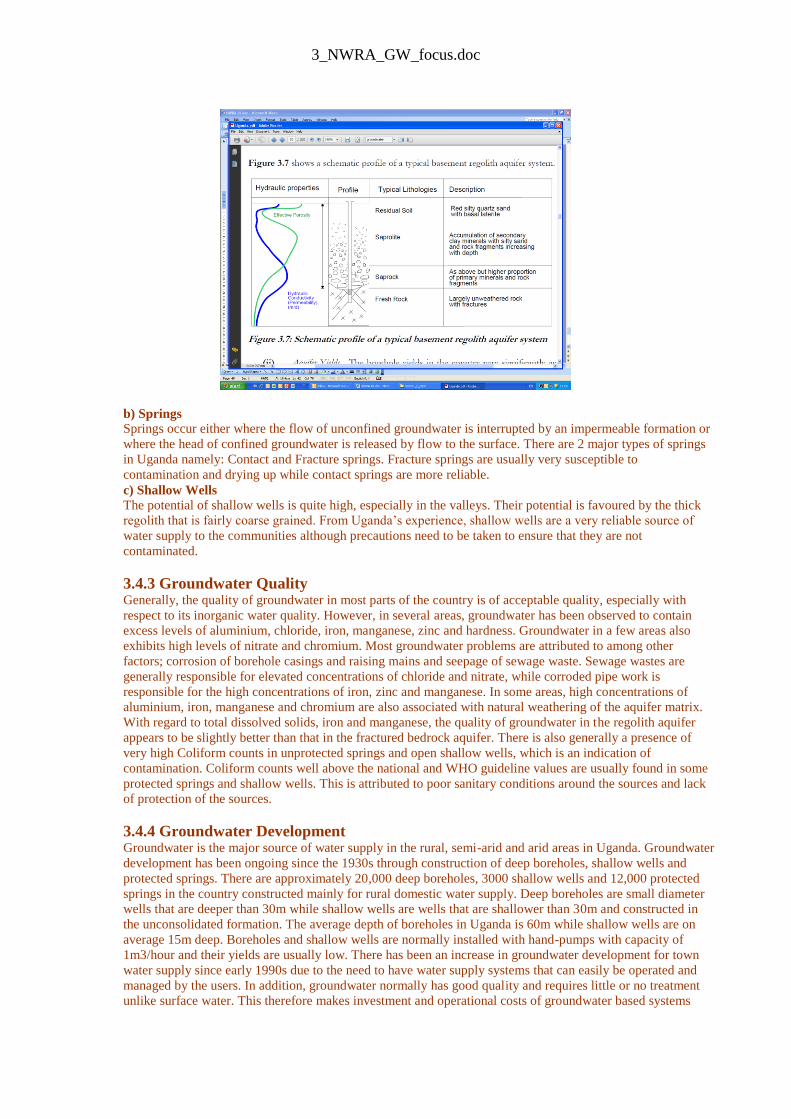
3_NWRA_GW_focus.doc
b) Springs
Springs occur either where the flow of unconfined groundwater is interrupted by an impermeable formation or
where the head of confined groundwater is released by flow to the surface. There are 2 major types of springs
in Uganda namely: Contact and Fracture springs. Fracture springs are usually very susceptible to
contamination and drying up while contact springs are more reliable.
c) Shallow Wells The potential of shallow wells is quite high, especially in the valleys. Their potential is favoured by the thick
regolith that is fairly coarse grained. From Uganda‘s experience, shallow wells are a very reliable source of
water supply to the communities although precautions need to be taken to ensure that they are not
contaminated.
3.4.3 Groundwater Quality Generally, the quality of groundwater in most parts of the country is of acceptable quality, especially with
respect to its inorganic water quality. However, in several areas, groundwater has been observed to contain
excess levels of aluminium, chloride, iron, manganese, zinc and hardness. Groundwater in a few areas also
exhibits high levels of nitrate and chromium. Most groundwater problems are attributed to among other
factors; corrosion of borehole casings and raising mains and seepage of sewage waste. Sewage wastes are
generally responsible for elevated concentrations of chloride and nitrate, while corroded pipe work is
responsible for the high concentrations of iron, zinc and manganese. In some areas, high concentrations of
aluminium, iron, manganese and chromium are also associated with natural weathering of the aquifer matrix.
With regard to total dissolved solids, iron and manganese, the quality of groundwater in the regolith aquifer
appears to be slightly better than that in the fractured bedrock aquifer. There is also generally a presence of
very high Coliform counts in unprotected springs and open shallow wells, which is an indication of
contamination. Coliform counts well above the national and WHO guideline values are usually found in some
protected springs and shallow wells. This is attributed to poor sanitary conditions around the sources and lack
of protection of the sources.
3.4.4 Groundwater Development Groundwater is the major source of water supply in the rural, semi-arid and arid areas in Uganda. Groundwater
development has been ongoing since the 1930s through construction of deep boreholes, shallow wells and
protected springs. There are approximately 20,000 deep boreholes, 3000 shallow wells and 12,000 protected
springs in the country constructed mainly for rural domestic water supply. Deep boreholes are small diameter
wells that are deeper than 30m while shallow wells are wells that are shallower than 30m and constructed in
the unconsolidated formation. The average depth of boreholes in Uganda is 60m while shallow wells are on
average 15m deep. Boreholes and shallow wells are normally installed with hand-pumps with capacity of
1m3/hour and their yields are usually low. There has been an increase in groundwater development for town
water supply since early 1990s due to the need to have water supply systems that can easily be operated and
managed by the users. In addition, groundwater normally has good quality and requires little or no treatment
unlike surface water. This therefore makes investment and operational costs of groundwater based systems
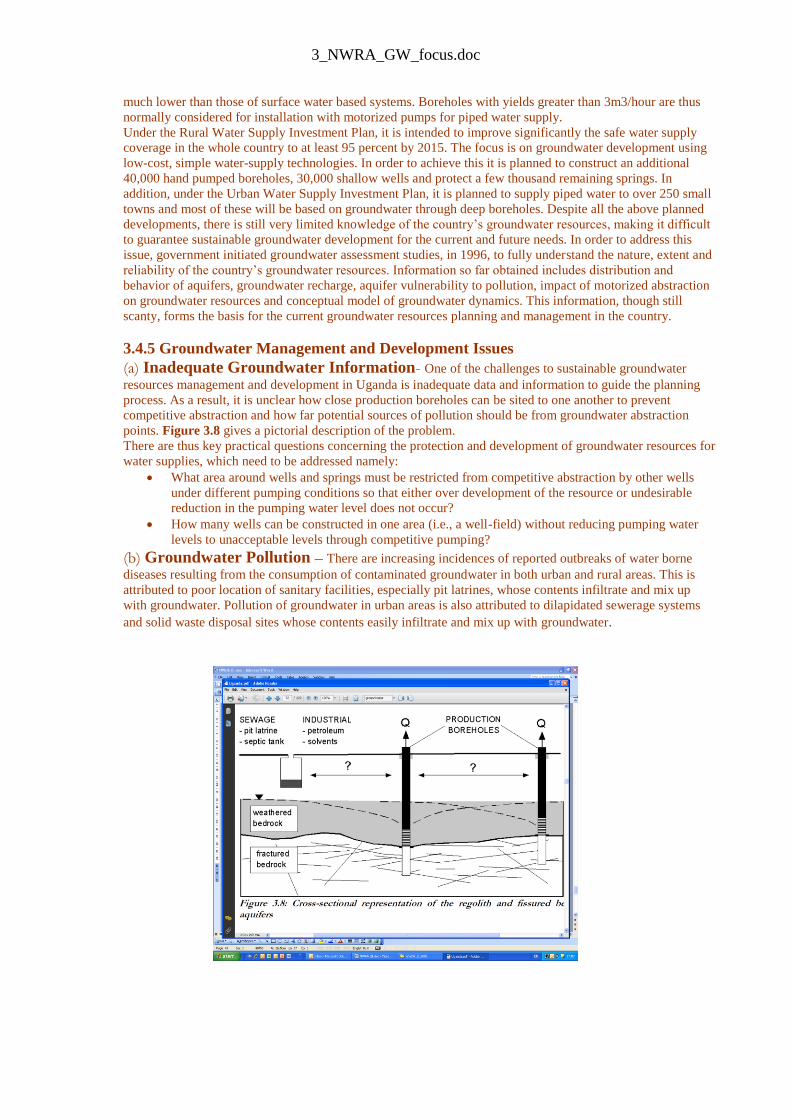
3_NWRA_GW_focus.doc
much lower than those of surface water based systems. Boreholes with yields greater than 3m3/hour are thus
normally considered for installation with motorized pumps for piped water supply.
Under the Rural Water Supply Investment Plan, it is intended to improve significantly the safe water supply
coverage in the whole country to at least 95 percent by 2015. The focus is on groundwater development using
low-cost, simple water-supply technologies. In order to achieve this it is planned to construct an additional
40,000 hand pumped boreholes, 30,000 shallow wells and protect a few thousand remaining springs. In
addition, under the Urban Water Supply Investment Plan, it is planned to supply piped water to over 250 small
towns and most of these will be based on groundwater through deep boreholes. Despite all the above planned
developments, there is still very limited knowledge of the country‘s groundwater resources, making it difficult
to guarantee sustainable groundwater development for the current and future needs. In order to address this
issue, government initiated groundwater assessment studies, in 1996, to fully understand the nature, extent and
reliability of the country‘s groundwater resources. Information so far obtained includes distribution and
behavior of aquifers, groundwater recharge, aquifer vulnerability to pollution, impact of motorized abstraction
on groundwater resources and conceptual model of groundwater dynamics. This information, though still
scanty, forms the basis for the current groundwater resources planning and management in the country.
3.4.5 Groundwater Management and Development Issues
(a) Inadequate Groundwater Information- One of the challenges to sustainable groundwater
resources management and development in Uganda is inadequate data and information to guide the planning
process. As a result, it is unclear how close production boreholes can be sited to one another to prevent
competitive abstraction and how far potential sources of pollution should be from groundwater abstraction
points. Figure 3.8 gives a pictorial description of the problem.
There are thus key practical questions concerning the protection and development of groundwater resources for
water supplies, which need to be addressed namely:
What area around wells and springs must be restricted from competitive abstraction by other wells
under different pumping conditions so that either over development of the resource or undesirable
reduction in the pumping water level does not occur?
How many wells can be constructed in one area (i.e., a well-field) without reducing pumping water
levels to unacceptable levels through competitive pumping?
(b) Groundwater Pollution – There are increasing incidences of reported outbreaks of water borne
diseases resulting from the consumption of contaminated groundwater in both urban and rural areas. This is
attributed to poor location of sanitary facilities, especially pit latrines, whose contents infiltrate and mix up
with groundwater. Pollution of groundwater in urban areas is also attributed to dilapidated sewerage systems
and solid waste disposal sites whose contents easily infiltrate and mix up with groundwater.

3_NWRA_GW_focus.doc
(c) Complex Geology - Groundwater in Uganda occurs in fractures and weathered zones found in
complex geological formations. The complex geology makes understanding of the nature of groundwater
occurrence and movement very difficult. This, in turn, presents a serious challenge to sustainable groundwater
management and development.
(d) Inadequate Technical Capacity - Technical capacity for sustainable groundwater development in
Uganda is limited. The number of hydrogeologists is not only small but also their expertise is low due to the
nature of training they receive. There are currently slightly over 10 hydrogeologists in the country with
postgraduate training in hydrogeology while most of the hydrogeologists (currently over 50) have
undergraduate education in geology where they have only done a hydrogeology course of about 8 hours. This
state of affairs inevitably results in poor quality professional work and hence unsustainable groundwater
development‖ Pages 45-50
2007
International Water Management Institute, Water for food, Water for life, A Comprehensive
Assessment of water Management in Agriculture From the Preface: ―The Comprehensive Assessment of Water Management in Agriculture is a critical
evaluation of the benefits, costs, and impacts of the past 50 years of water development, the water management
challenges communities face today, and the solutions people have developed around the world.‖
Policy action 8 (of 8)
―Deal with tradeoffs and make difficult choices The big tradeoffs
Making difficult choices
2008
USGS, Ground-Water Availability in the United States Useful background on groundwater science and status of groundwater assessment in the US. Provides summaries of 5
regional groundwater assessments as examples of completed assessments.
―… the purpose of this report is to identify the challenges in determining ground-water availability, summarize the
current state of knowledge from a national perspective, and outline an approach for developing the needed
understanding of future water availability. This report is an outgrowth of a pilot study, National Assessment of
Water Availability and Use, that began in 2005 at the request of Congress (Barlow and others, 2002). The report
also builds on regional ground-water availability studies recently undertaken as part of the USGS Ground-Water
Resources Program (Dennehy, 2005). The approach to national ground-water assessment described in the section
―Regional-Scale Approach to National Assessment‖ of this report, is a key element of the water census of the
United States, which has been proposed as a strategic science direction of the USGS (U.S. Geological Survey,
2007), as well as part of the proposed Federal science strategy to meet nationwide water challenges by the National
Science and Technology Council (2007) Subcommittee on Water Availability and Quality.‖ Page 3
From Table of Contents:
What Do We Know About Ground-Water Availability in the United States?
Location and Description of Major Aquifers
Water Use
Changes in Ground-Water Levels and Ground-Water Storage
Recharge
Ground-Water Discharge
Ground-Water Quality
3_NWRA_GW_focus.doc
Regional-Scale Approach to National Assessment
Regional Ground-Water Budgets
Selection of Regional Ground-Water Flow Systems
Regional Studies
Examples of Regional Aquifer Assessments
Middle Rio Grande Basin
California Central Valley Aquifer System
Coastal Plain Aquifer System
Great Lakes Basin
High Plains Aquifer
2008
UN Water, Status Report on Integrated Water Resources Management and Water Efficiency Plans
for CSD 16.
Case studies:
Liao River basin (China) – reportedly a water resources assessment was carried out
La Cocha Logoon (Columbia) – no water resources assessment
Morocco – no water resources assessment
Fergana Valley (Central Asia) – no water resources assessment
Sri Lanka – refers to baseline assessment of water resources made under the Sri
Lanka National Water Development Report (SLNWDR) prepared for WWAP 2
USA, New York – no water resources assessment
Kazakhstan – no water resources assessment
Pungwe River (Mozambique/Zimbabwe) - reportedly ―a large effort was directed
towards improving the knowledge base for the development of the water resources of
the basin through a number of sector studies‖; an assessment of sorts?
Chile – no water resources assessment
Uganda – reportedly ―Strengthening water resources management framework
involving water resources assessment and monitoring networks…‖ but seems to be
primarily for surface water resources at a local catchment scale.
2009 Australian Government, Department of the Environment, Water, Heritage and the Arts, National
Groundwater Assessment Initiative National Groundwater Assessment Initiative
Total funding: $50 million plus applicable GST from the Australian Government.
About the project
Groundwater in Australia is generally poorly understood compared with surface water. However, it makes up
about 32 per cent of our 'sustainable' water resources and currently is under ever increasing pressure due to
increasing extraction to compensate for declining surface water stocks. Given that groundwater is nearly
always connected to surface water, unless we can improve knowledge and understanding of this key resource,
we are at risk of seriously overexploiting it with significant flow on reductions to surface water entitlement
holders and the environment in many systems.
During the recent drought pressure on our groundwater resources has become more severe and the risks of over
extraction of groundwater have increased significantly. Similarly the risk of contamination of groundwater
with lower quality sources has also increased. However, the depth of information and knowledge about
Australia's groundwater resources is still limited.
The Australian Government is funding an ambitious package of projects that will accelerate the assessment of
Australia's groundwater resources and harmonise definitional issues, governance and management practices.
This initiative will focus on:
harmonisation of groundwater definitions, governance and management practices for shared resources
a stocktake of northern Australian groundwater resources
3_NWRA_GW_focus.doc
a national assessment of sites suitable for managed aquifer recharge and recovery focusing on major
urban centres
vulnerability of groundwater dependent ecosystems
specific investigation of groundwater-surface water interconnectivity
strategic aquifer characterisation to remove impediments to delivery of NPWS and NWI, and
a national review of groundwater potential for deep fresh, saline and brackish waters.
Results will be communicated to users via an associated Raising National Water Standards Program
Groundwater knowledge and capacity building project.
Project benefits
This initiative is focused on providing the scientific definitions, management and governance guidelines and
field knowledge that is so vital if we are going to improve the sustainable management of this important
national resource. Expected benefits will be more sustainable environmental management of groundwater
dependent ecosystems, the development of acceptable yield concepts for aquifers that facilitate their long-term
sustainable and productive use, the identification of new resources for a wide range of users and opportunities
to improve urban water management via identification of potential managed aquifer recharge and recovery
sites.
The project advances the National Water Initiative objective of surface and groundwater connectivity.
2010
Encyclopedia of Earth, active web site (unsure of initiation date) Complete listing of countries for ―Water Profiles for _______‖ but spot checking suggests that all entries share
a foundation of the FAO Aqustat database. Many entries have added data and information along with
references for ―further reading‖. The standard FAO citation is:
―Food and Agriculture Organization (Content source); Lori Zaikowski (Topic Editor). 2008. "Water profile of
Swaziland." In: Encyclopedia of Earth. Eds. Cutler J. Cleveland (Washington, D.C.: Environmental
Information Coalition, National Council for Science and the Environment). [First published in the
Encyclopedia of Earth January 3, 2007; Last revised September 2, 2008; Retrieved March 9, 2010].
<http://www.eoearth.org/article/Water_profile_of_Swaziland>
Disclaimer: This article is taken wholly from, or contains information that was originally published by, the
Food and Agriculture Organization. Topic editors and authors for the Encyclopedia of Earth may have edited
its content or added new information. The use of information from the Food and Agriculture Organization
should not be construed as support for or endorsement by that organization for any new information added by
EoE personnel, or for any editing of the original content.”
2010
UNDP/GEF support for Groundwater Assessment of the Pangani River Basin, Tanzania The Pangani Basin Water Board (PBWB) is planning to develop an IWRMD Plan for the entire administrative
basin including Pangani River and other small catchments (Umba, Zigi, Mkulumzi, Msangazi, and Coastal Rivers)
that has a time horizon to 2030 was planned to be undertaken with National Water Sector Development
Programme (WSDP) support. Within the IWRMD planning process there are specific tasks that need to be
undertaken including groundwater assessment. Through the Pangani River Basin Management Project (PRBMP),
the PBWB intends to carry out a groundwater assessment which will then be used within the broader IWRMD
planning process. This document outlines the Terms of Reference (ToR) for carrying out groundwater assessment
to support the process of developing an IWRMD Plan for the Pangani River Basin and its small catchments. The
PRBMP is an initiative of the Government of Tanzania, The International Union for Conservation of Nature
(IUCN), through its Water & Nature Initiative (WANI), the Global Environmental Facility (GEF) through UNDP,
and the European Commission. The Project goal is to mainstream the approaches to deal with the negative effects
of climate change into Integrated Water Resources Management (IWRM) in the Pangani River Basin, in order to
support the equitable provision of freshwater for the environment and for livelihoods for future generations.
1.2 Groundwater Resources Availability in the Basin Volcanic sediments and rocks around Mt. Kilimanjaro and Meru, weathered and fractured metamorphic rocks on
foot hills of Pare and Usambara Mountains and Masai Steppes and sediments and sedimentary rocks i coastal
areas form major aquifers in the basin. High groundwater yields have been witnessed in volcanic and coastal
aquifers (boreholes with yields >100 m3/hr are available with, 88% abstraction is for irrigation). Water quality is
generally good, with exceptions of high fluorides contents in some areas.
3_NWRA_GW_focus.doc
The purpose of the groundwater assessment is to complete an evaluation of groundwater resources in the Pangani
Basin and produce information that can be incorporated into an IWRM plan for the whole basin. Groundwater
resources assessment should be carried out for the whole basin including quantification of potential yields from
the aquifers. A hydrogeological analysis should also be carried out as part of the assignment and should include
classification of hydrogeological characteristics of the basin.
Objectives of the groundwater assessment include:
1. Determine the availability of groundwater, demand for groundwater and its development potential by
considering (but not limited to) the following:
Volume and distribution of available groundwater in the basin;
Groundwater recharge mechanisms in the basin;
Annual safe yield of groundwater;
Groundwater quality and its limitations;
Hydro-geological modeling and mapping;
ironmental and other non-economic factors; and
Protection of potential vulnerable aquifers with consideration of water related risks including climate
change.
2. Design a groundwater management framework which integrates with IWRM planning
3. Build capacity of PBWB and key stakeholders in groundwater assessment and Management
Result 3. Capacity of PBWB to carry out and use information from a groundwater assessment is
strengthened
Output 3.1 PBWB staff have capacity to use information from groundwater assessment to effectively
groundwater sources
Task 3.1.1 Involvement of PBWB in all tasks
Task 3.1.2 Clear documentation of all tasks is produced and presented to PBWO staff
Task 3.1.3 Workshops and workshop reports to present key findings and process with
PBWO and identified stakeholders.
4. Deliverables of groundwater assessment
The main deliverables of the Ground Water Resources Assessment component are soft (editable) and hard copies
of the following:
Result 1 Draft report of groundwater assessment which includes:
Existing data and information on groundwater in the Pangani Basin in compiled and analysed as part of
the groundwater assessment.
Gaps in groundwater information identified and plan produced to ensure completion of groundwater
assessment
A comprehensive hydrogeological report in relation to the tasks under Output 1.3
Pangani Basin Hydrogelogical Map (and detailed report on quantity, quality and pollution conditions)
with the necessary GIS-based data and information for planning, development and management of the
groundwater in the basin;
Groundwater models for respective aquifer systems and well fields
Robust groundwater database
Provide recommendations on:
The protection measures of the associated aquifers;
Groundwater management scenarios;
d of groundwater in different sections of the basin;
-economic benefits from groundwater; and
Consideration of climate change in the management of the groundwater resources
Result 2
Groundwater management framework which provides guidance for integration into IWRM planning
process
Result 3
Comprehensive compilation of documentation to complete all tasks
Workshop reports
Guidance manual if needed