Embed Size (px)
Citation preview
Water Quantity Risk Assessments: Protecting Municipal Drinking Water Supplies
Paul J. Martin, M.Sc., P.Eng.
WATERtech 2012 April 13, 2012
Source Protection - Impetus
• Walkerton Tragedy
• O’Connor Recommendations – Drinking water focused
– Quality Management
– Quantity Management
– Watershed Scale Analysis • Understand Big Picture, manage drinking water
system within natural setting
National Round Table on the Environment and Economy
Source Protection – Generalized Approach
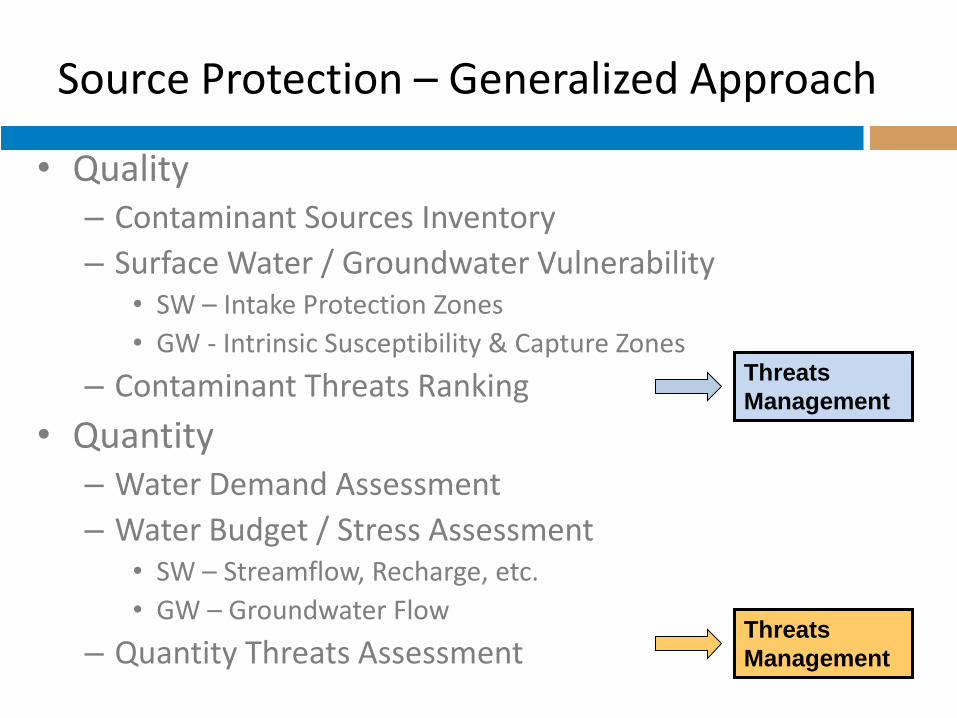
• Quality – Contaminant Sources Inventory
– Surface Water / Groundwater Vulnerability • SW – Intake Protection Zones
• GW - Intrinsic Susceptibility & Capture Zones
– Contaminant Threats Ranking
• Quantity – Water Demand Assessment
– Water Budget / Stress Assessment • SW – Streamflow, Recharge, etc.
• GW – Groundwater Flow
– Quantity Threats Assessment
Threats
Management
Threats
Management
Water Quantity Risk Assessment
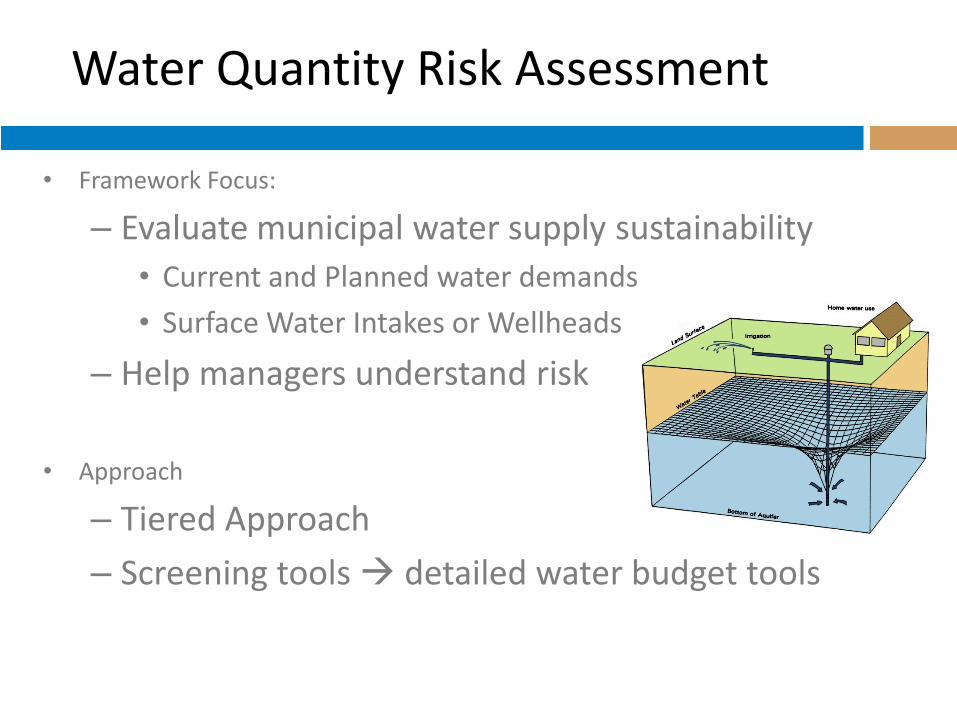
• Framework Focus:
– Evaluate municipal water supply sustainability
• Current and Planned water demands
• Surface Water Intakes or Wellheads
– Help managers understand risk
• Approach
– Tiered Approach
– Screening tools detailed water budget tools
Water Budget – Tiered Assessment Process
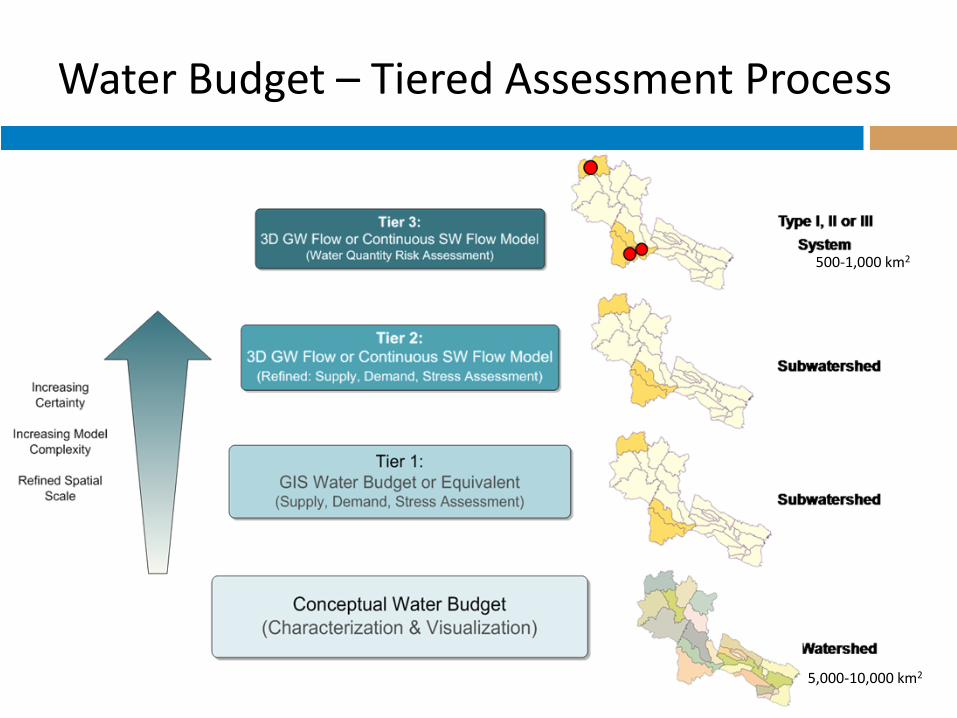
5,000-10,000 km2
500-1,000 km2
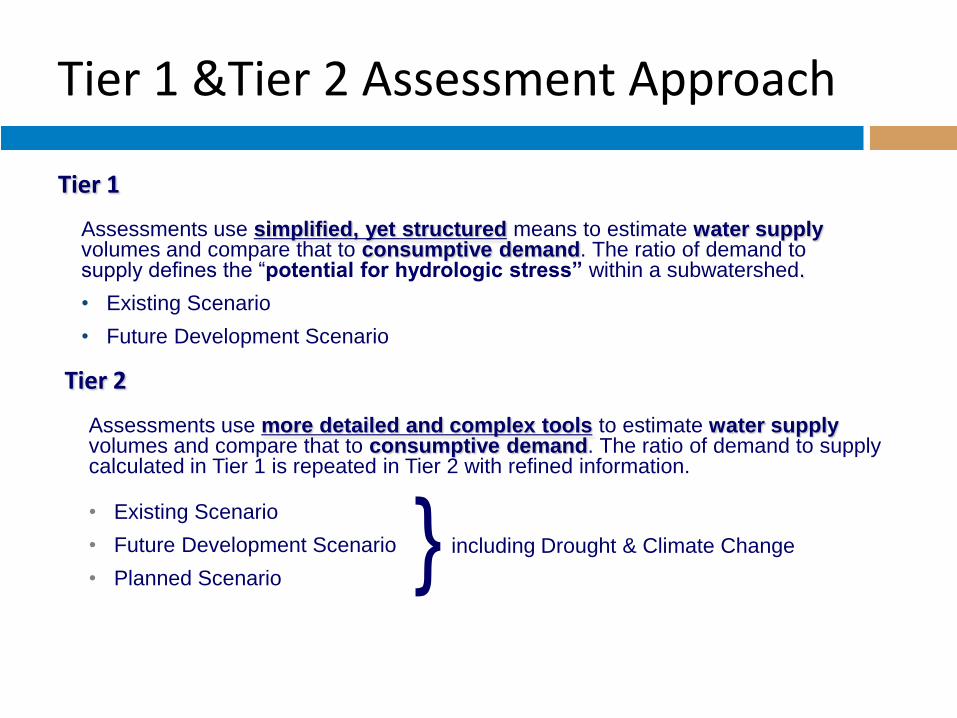
Tier 1 &Tier 2 Assessment Approach
Tier 1
Assessments use simplified, yet structured means to estimate water supply volumes and compare that to consumptive demand. The ratio of demand to supply defines the “potential for hydrologic stress” within a subwatershed.
• Existing Scenario
• Future Development Scenario
Tier 2
Assessments use more detailed and complex tools to estimate water supply volumes and compare that to consumptive demand. The ratio of demand to supply calculated in Tier 1 is repeated in Tier 2 with refined information.
• Existing Scenario
• Future Development Scenario
• Planned Scenario
including Drought & Climate Change }
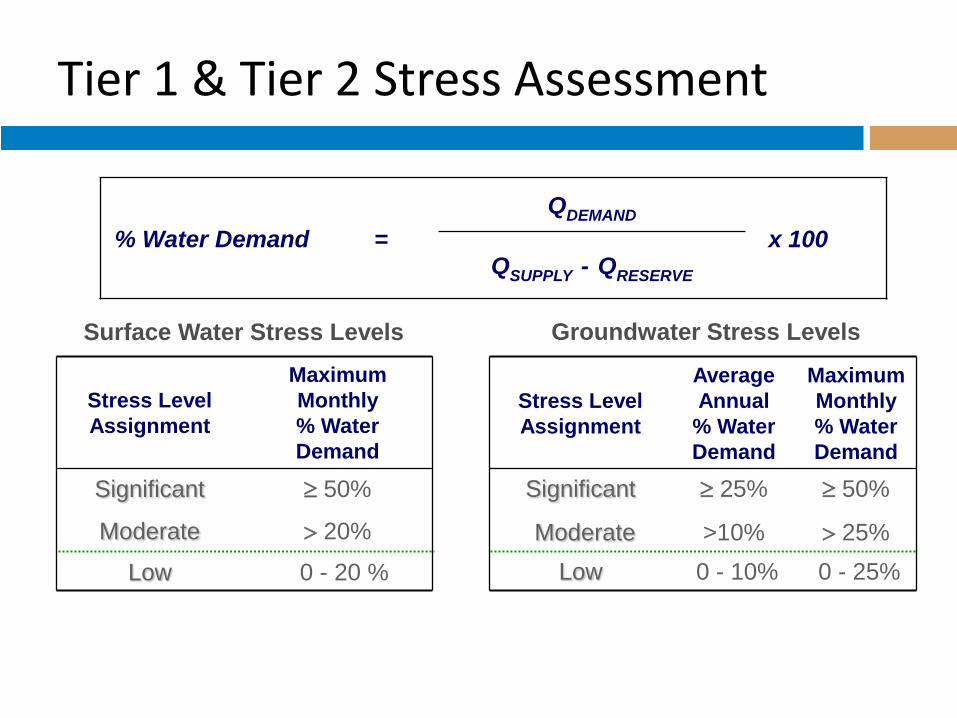
Tier 1 & Tier 2 Stress Assessment
% Water Demand =
QDEMAND
x 100 QSUPPLY - QRESERVE
0 - 20 % Low
> 20% Moderate
50% Significant
Maximum
Monthly
% Water
Demand
Stress Level
Assignment
0 - 25% 0 - 10% Low
> 25% >10% Moderate
50% 25% Significant
Maximum
Monthly
% Water
Demand
Average
Annual
% Water
Demand
Stress Level
Assignment
Groundwater Stress Levels Surface Water Stress Levels
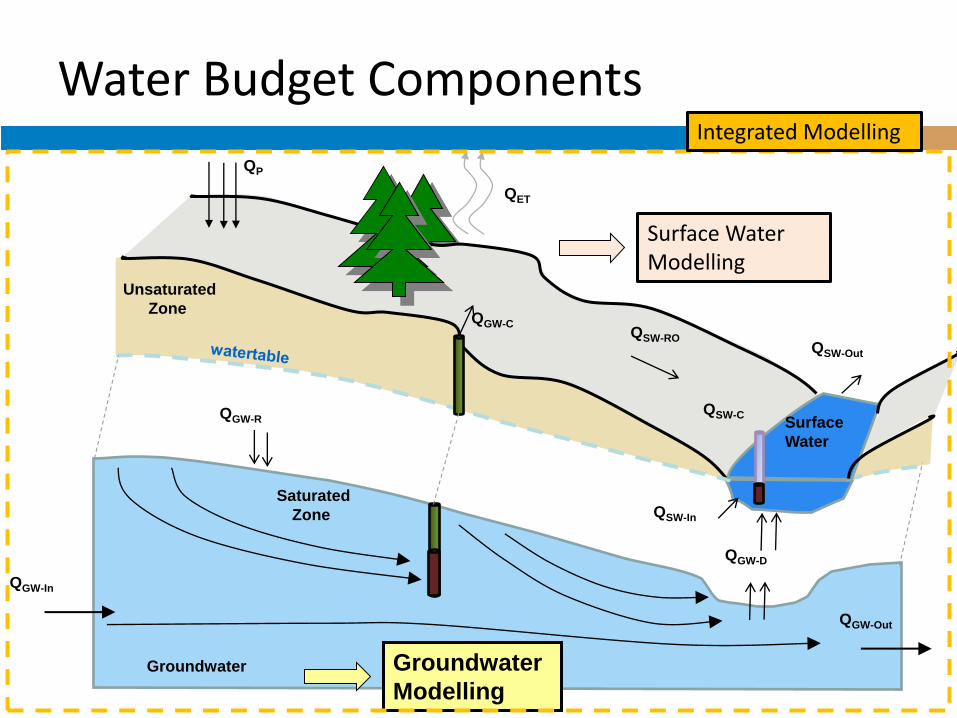
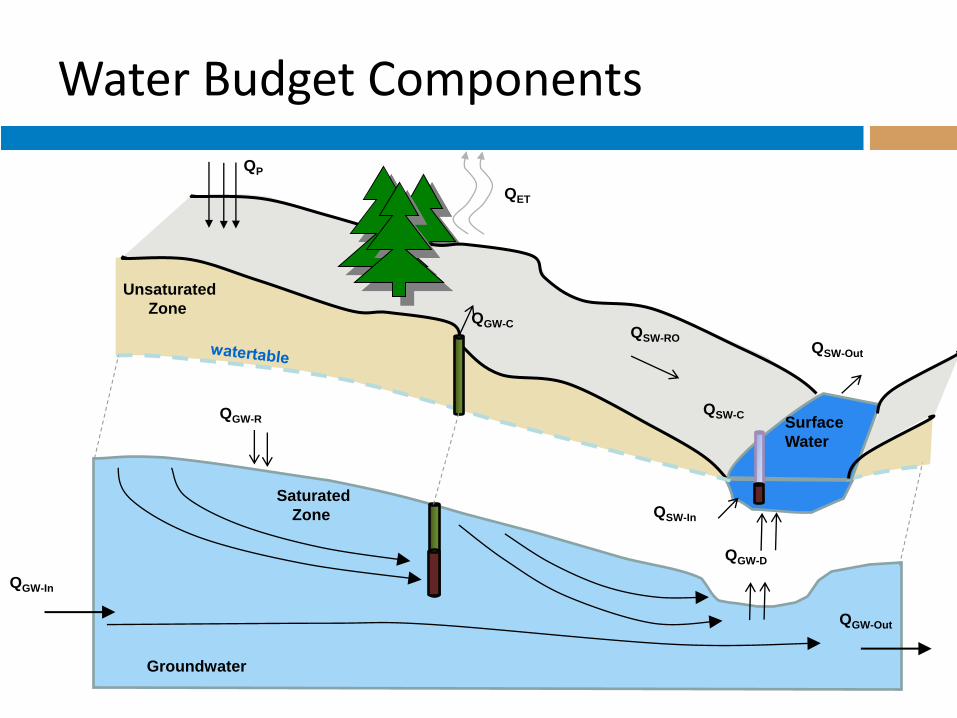
QGW-Out
QGW-In
QGW-R
QGW-D
QGW-C QSW-RO
QSW-C
QSW-In
QSW-Out
QP
QET
Groundwater
Surface
Water
Unsaturated
Zone
Saturated
Zone
Water Budget Components
Groundwater
Modelling
Surface Water Modelling
Integrated Modelling
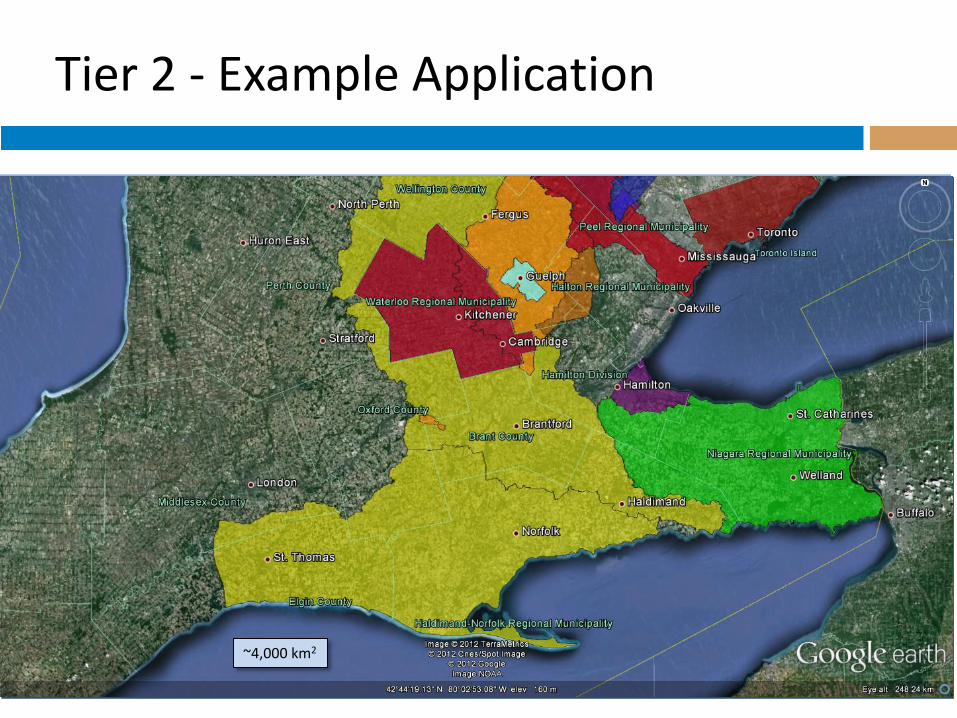
Tier 2 - Example Application
~4,000 km2
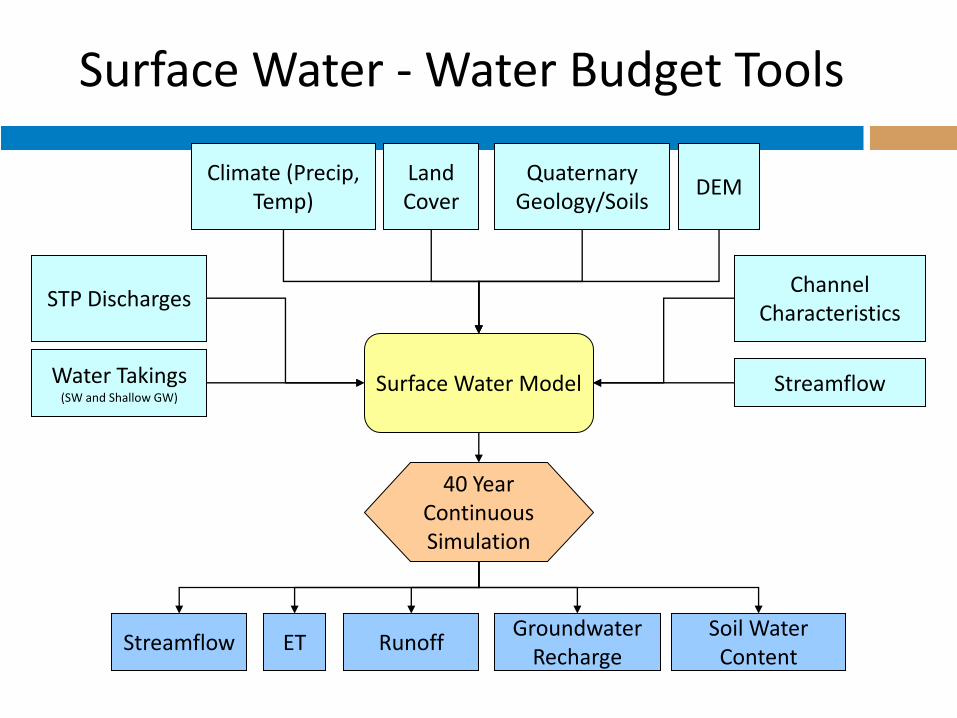
Surface Water - Water Budget Tools
Quaternary Geology/Soils
DEM Land Cover
Channel Characteristics
Climate (Precip, Temp)
STP Discharges
Water Takings (SW and Shallow GW)
Surface Water Model
40 Year Continuous Simulation
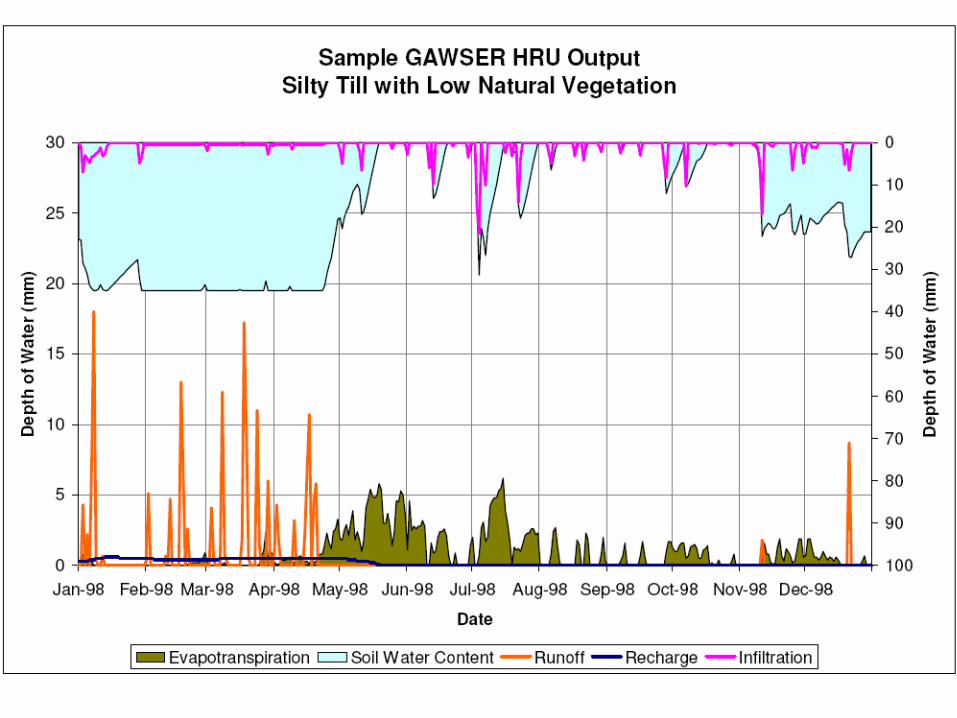
Streamflow ET Runoff Groundwater
Recharge Soil Water
Content
Streamflow
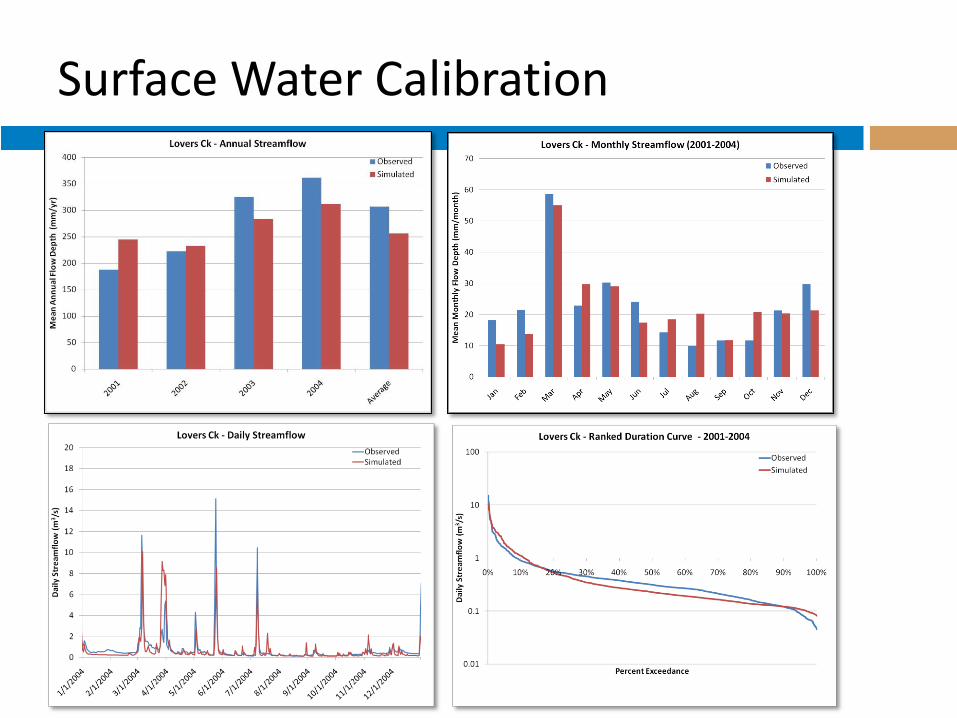
Surface Water Calibration
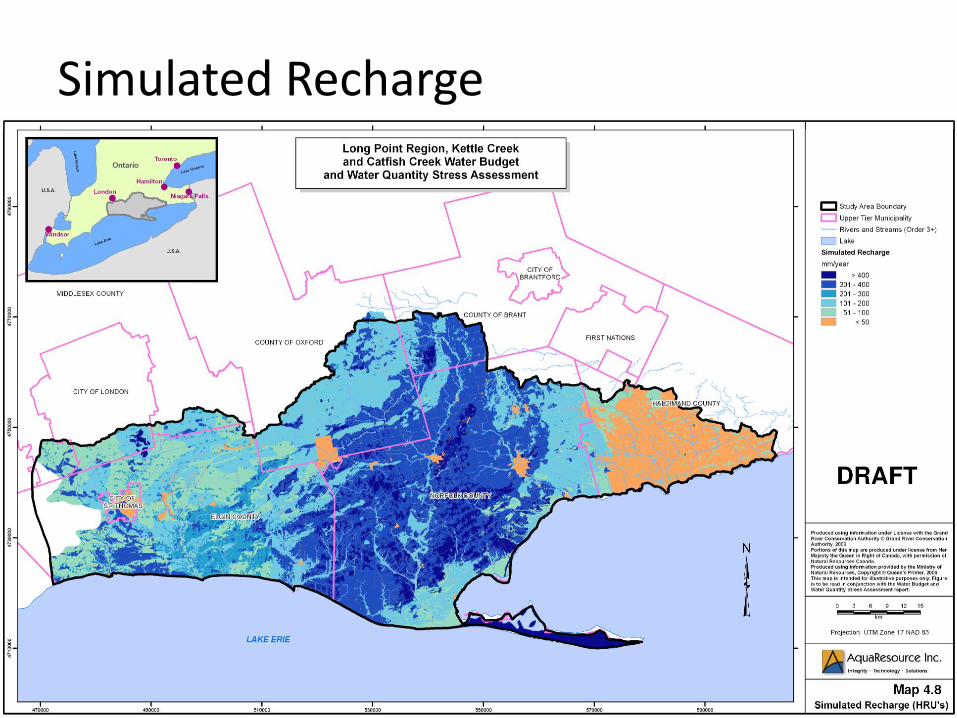
Simulated Recharge
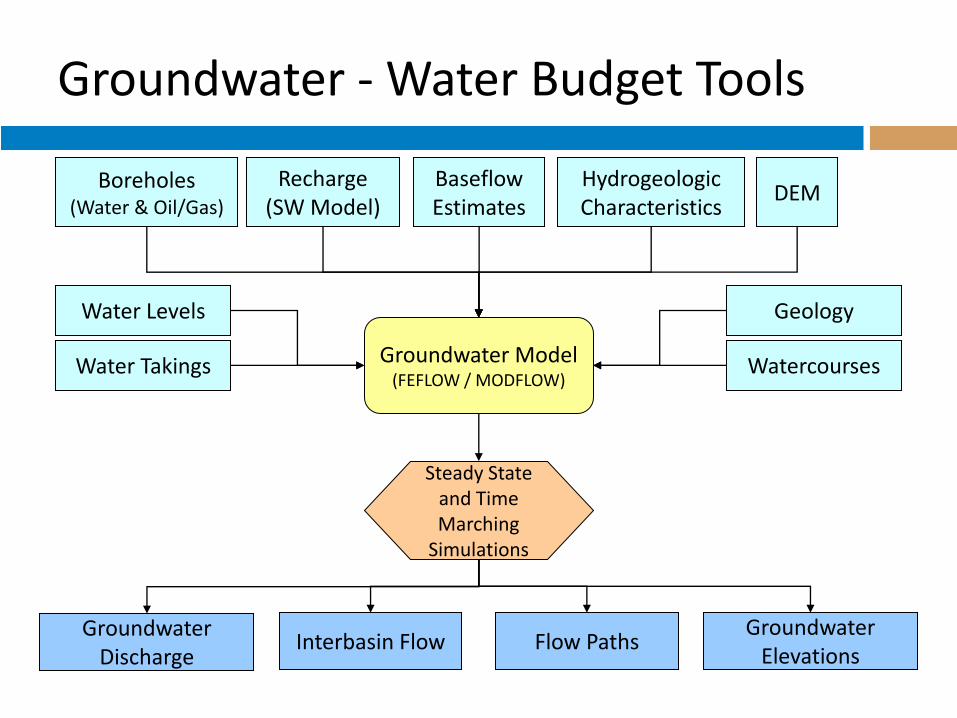
Groundwater - Water Budget Tools
Geology
DEM
Watercourses
Hydrogeologic Characteristics
Recharge (SW Model)
Boreholes (Water & Oil/Gas)
Water Takings Groundwater Model (FEFLOW / MODFLOW)
Steady State and Time Marching
Simulations
Groundwater Discharge
Flow Paths Groundwater
Elevations
Water Levels
Baseflow Estimates
Interbasin Flow
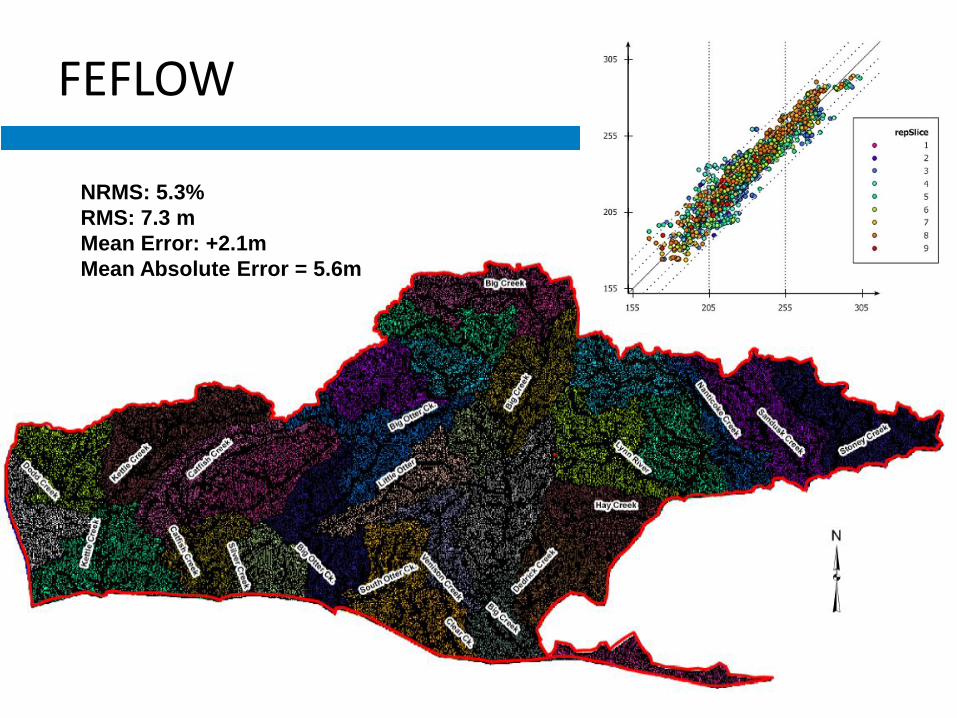
FEFLOW
NRMS: 5.3%
RMS: 7.3 m
Mean Error: +2.1m
Mean Absolute Error = 5.6m
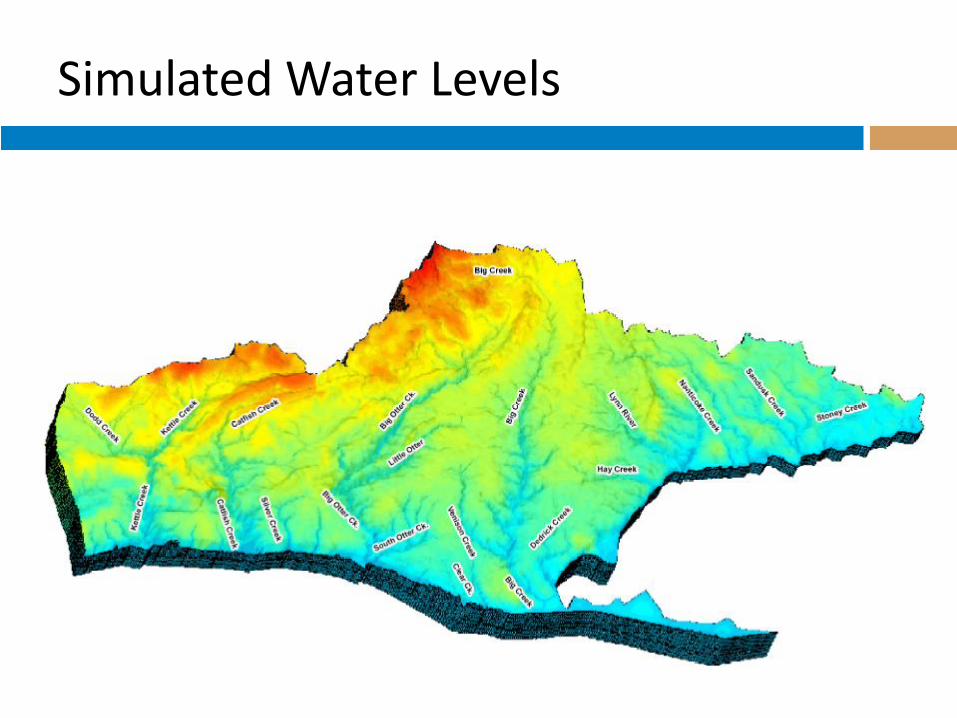
Simulated Water Levels
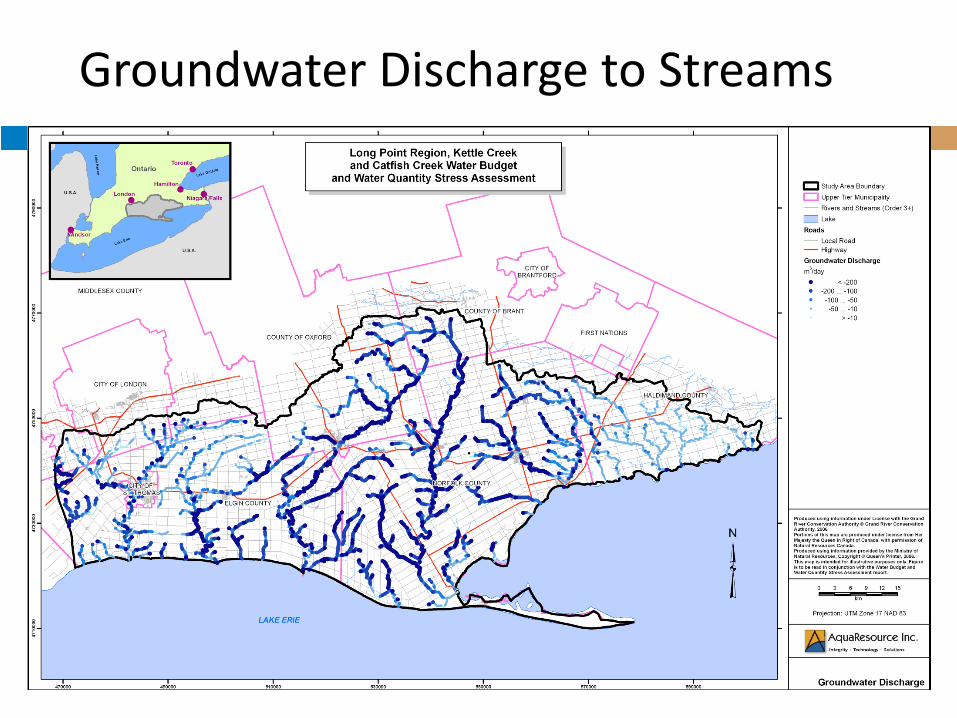
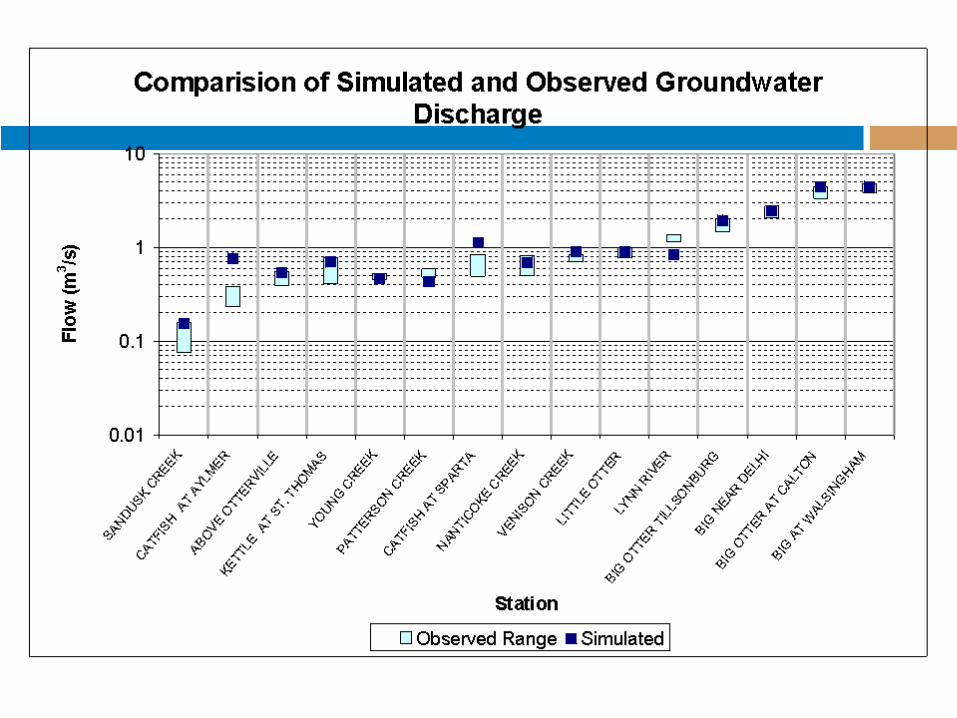
Groundwater Discharge to Streams
QGW-Out
QGW-In
QGW-R
QGW-D
QGW-C QSW-RO
QSW-C
QSW-In
QSW-Out
QP
QET
Groundwater
Surface
Water
Unsaturated
Zone
Saturated
Zone
Water Budget Components
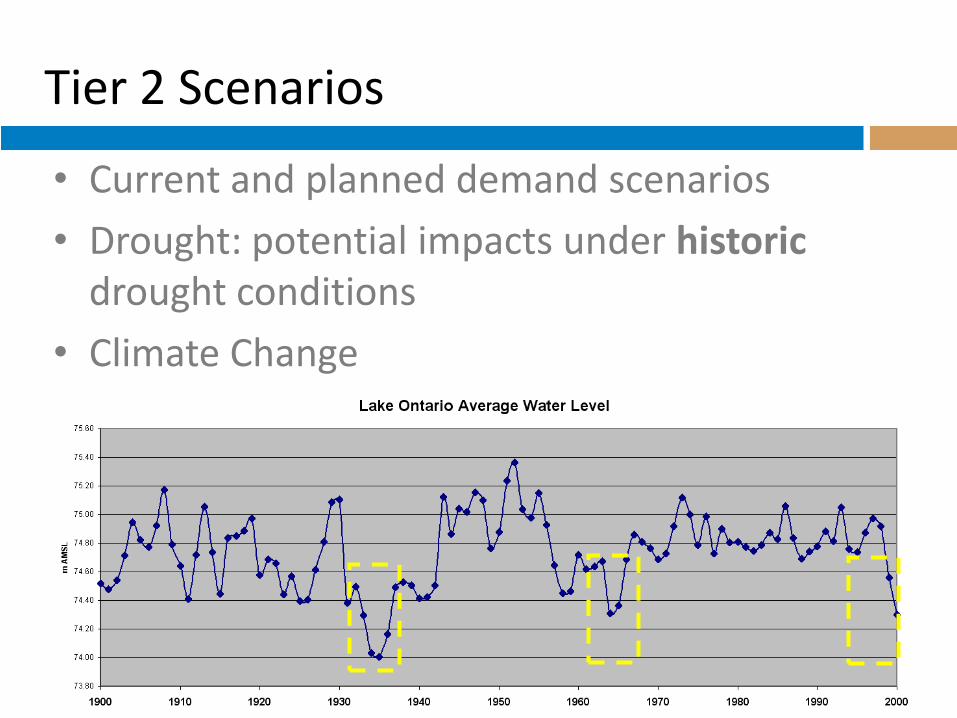
Tier 2 Scenarios
• Current and planned demand scenarios
• Drought: potential impacts under historic drought conditions
• Climate Change
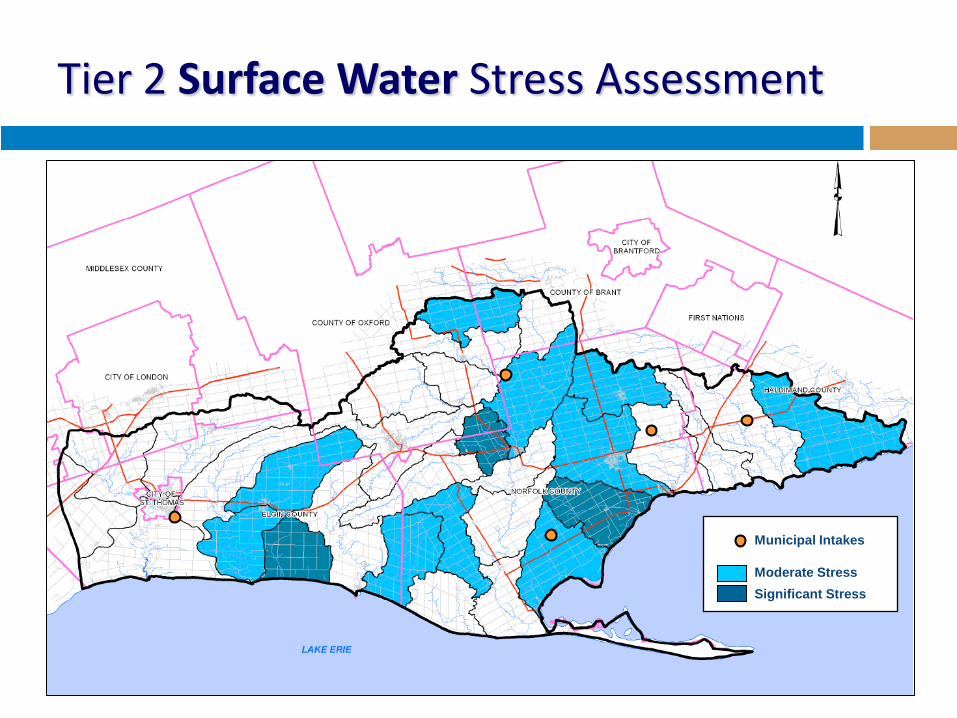
Tier 2 Surface Water Stress Assessment
21
Municipal Intakes
Moderate Stress
Significant Stress
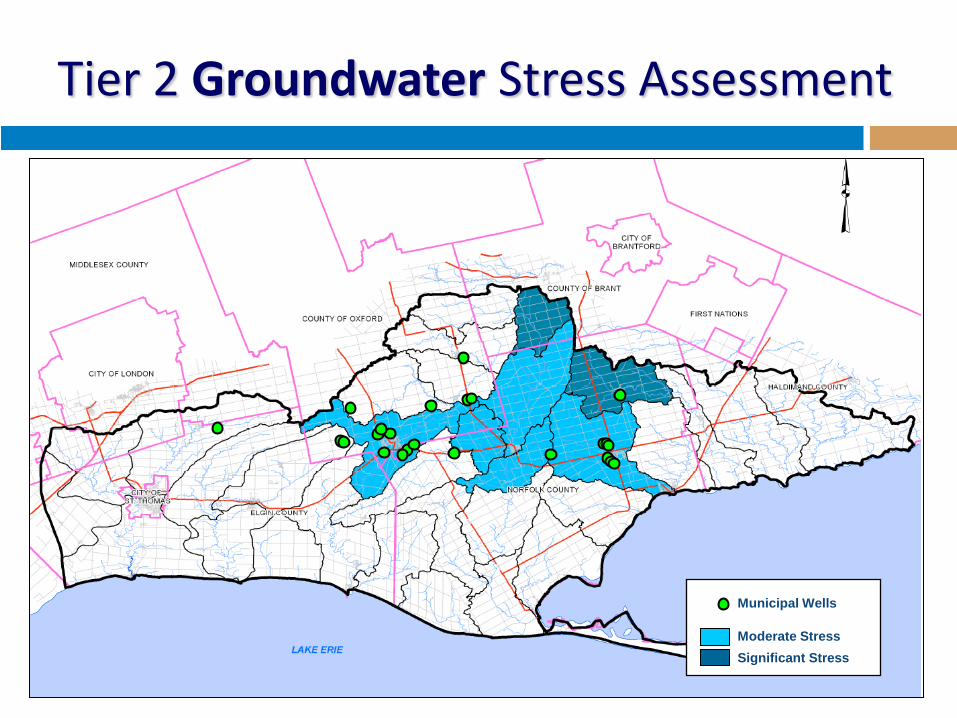
Tier 2 Groundwater Stress Assessment
Municipal Wells
Moderate Stress
Significant Stress
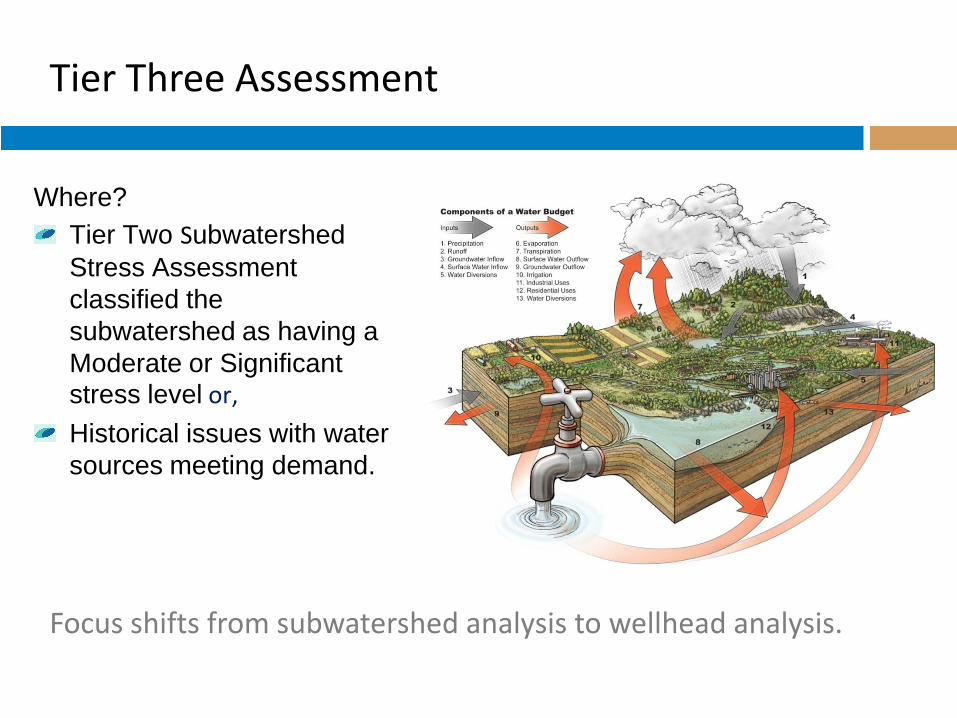
Tier Three Assessment
Focus shifts from subwatershed analysis to wellhead analysis.
Where?
Tier Two Subwatershed
Stress Assessment
classified the
subwatershed as having a
Moderate or Significant stress level or,
Historical issues with water
sources meeting demand.
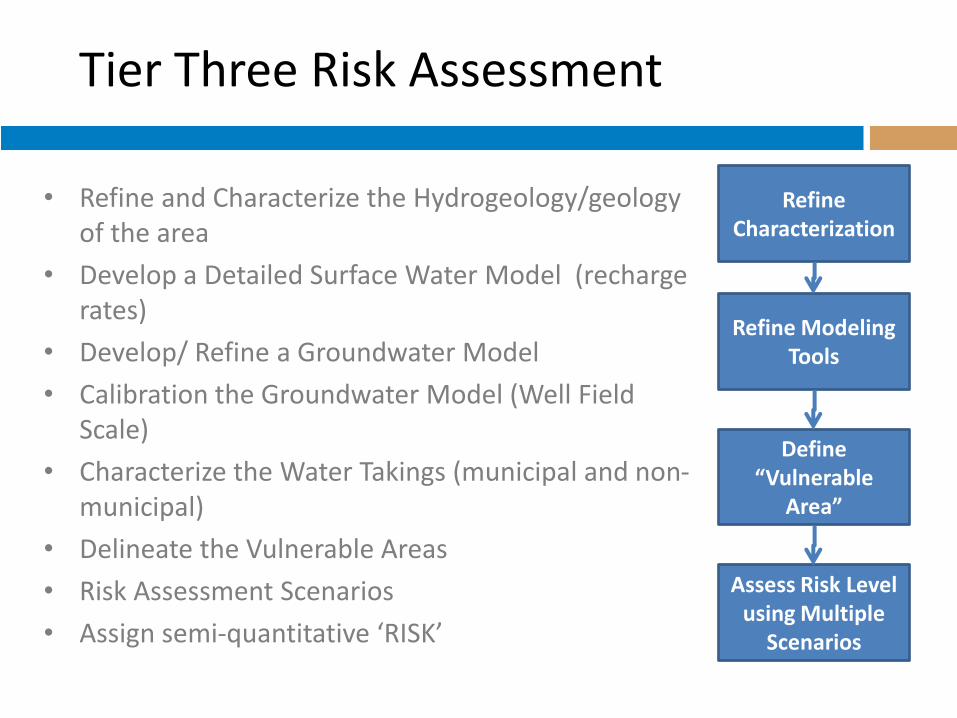
Tier Three Risk Assessment
• Refine and Characterize the Hydrogeology/geology of the area
• Develop a Detailed Surface Water Model (recharge rates)
• Develop/ Refine a Groundwater Model
• Calibration the Groundwater Model (Well Field Scale)
• Characterize the Water Takings (municipal and non-municipal)
• Delineate the Vulnerable Areas
• Risk Assessment Scenarios
• Assign semi-quantitative ‘RISK’
Refine Characterization
Refine Modeling Tools
Define “Vulnerable
Area”
Assess Risk Level using Multiple
Scenarios
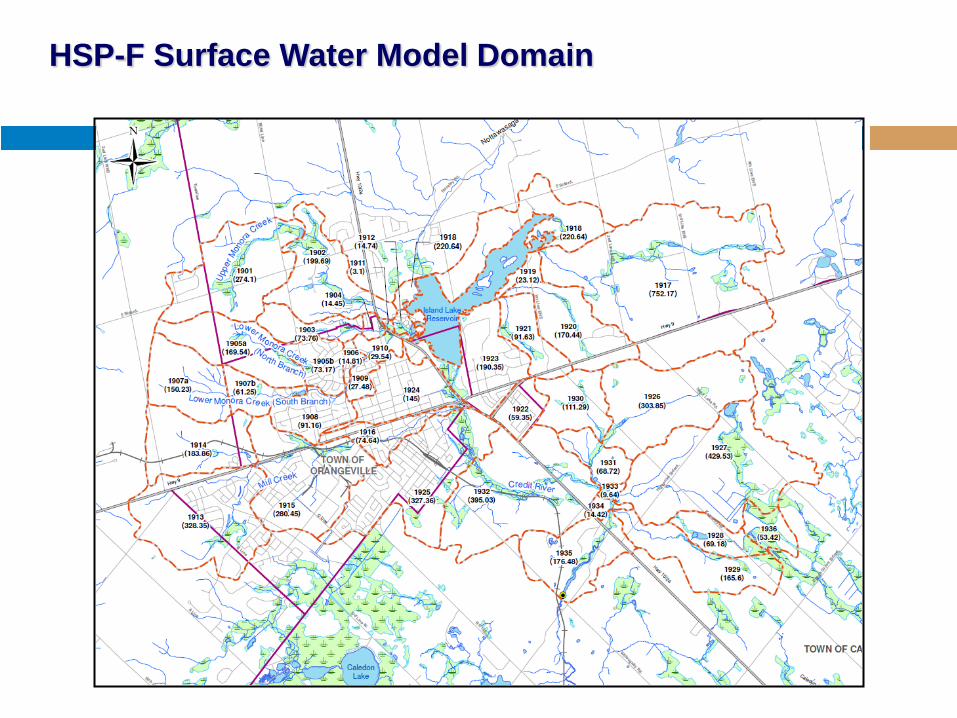
HSP-F Surface Water Model Domain
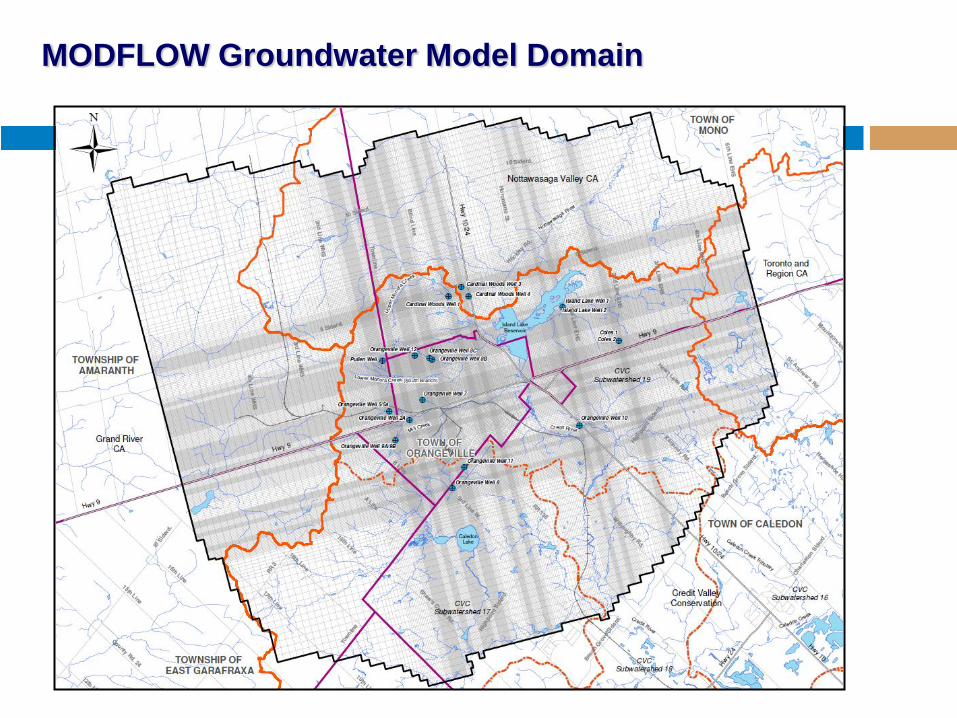
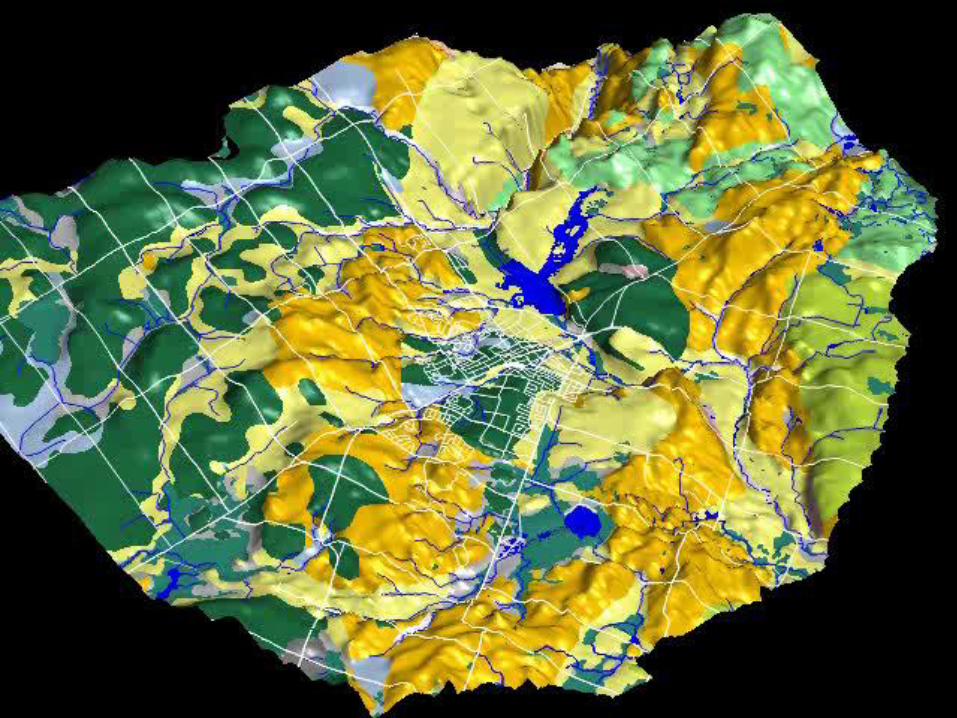
MODFLOW Groundwater Model Domain
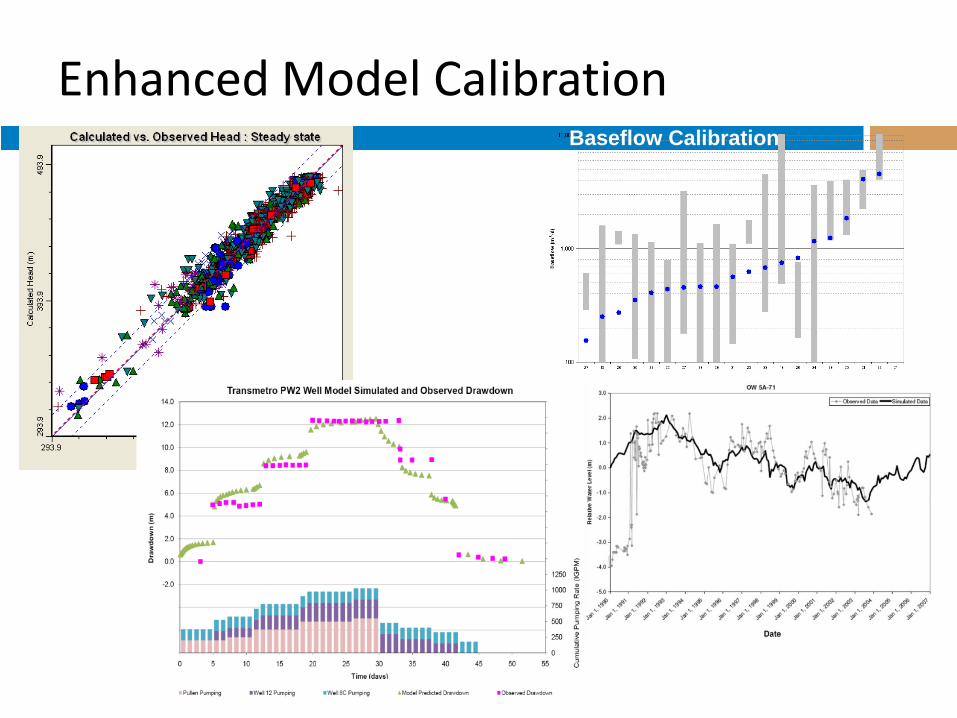
Enhanced Model Calibration Baseflow Calibration
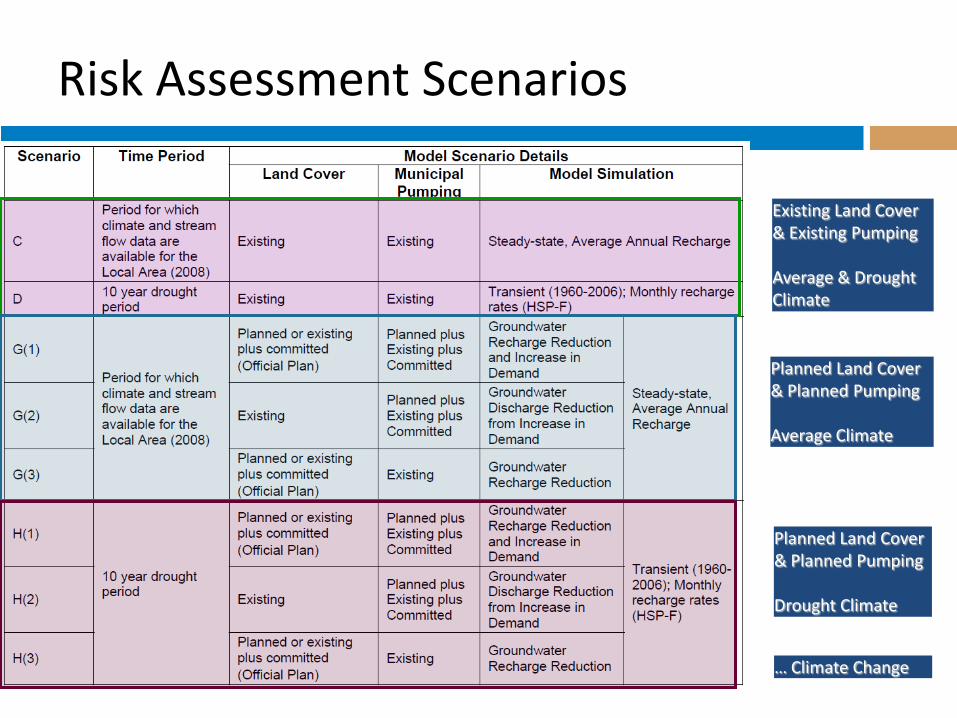
Risk Assessment Scenarios
Existing Land Cover & Existing Pumping Average & Drought Climate
Planned Land Cover & Planned Pumping Average Climate
Planned Land Cover & Planned Pumping Drought Climate
… Climate Change
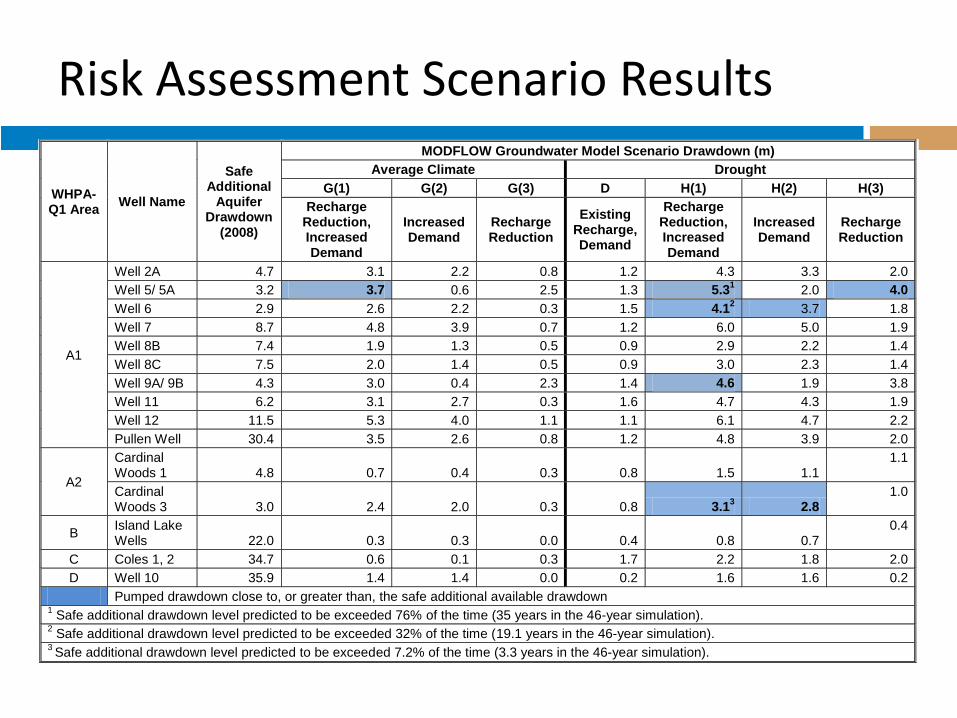
Risk Assessment Scenario Results
WHPA-Q1 Area
Well Name
Safe Additional
Aquifer Drawdown
(2008)
MODFLOW Groundwater Model Scenario Drawdown (m)
Average Climate Drought
G(1) G(2) G(3) D H(1) H(2) H(3)
Recharge Reduction, Increased Demand
Increased Demand
Recharge Reduction
Existing Recharge, Demand
Recharge Reduction, Increased Demand
Increased Demand
Recharge Reduction
A1
Well 2A 4.7 3.1 2.2 0.8 1.2 4.3 3.3 2.0
Well 5/ 5A 3.2 3.7 0.6 2.5 1.3 5.31 2.0 4.0
Well 6 2.9 2.6 2.2 0.3 1.5 4.12 3.7 1.8
Well 7 8.7 4.8 3.9 0.7 1.2 6.0 5.0 1.9
Well 8B 7.4 1.9 1.3 0.5 0.9 2.9 2.2 1.4
Well 8C 7.5 2.0 1.4 0.5 0.9 3.0 2.3 1.4
Well 9A/ 9B 4.3 3.0 0.4 2.3 1.4 4.6 1.9 3.8
Well 11 6.2 3.1 2.7 0.3 1.6 4.7 4.3 1.9
Well 12 11.5 5.3 4.0 1.1 1.1 6.1 4.7 2.2
Pullen Well 30.4 3.5 2.6 0.8 1.2 4.8 3.9 2.0
A2
Cardinal Woods 1 4.8 0.7 0.4 0.3 0.8 1.5 1.1
1.1
Cardinal Woods 3 3.0 2.4 2.0 0.3 0.8 3.1
3 2.8
1.0
B Island Lake Wells 22.0 0.3 0.3 0.0 0.4 0.8 0.7
0.4
C Coles 1, 2 34.7 0.6 0.1 0.3 1.7 2.2 1.8 2.0
D Well 10 35.9 1.4 1.4 0.0 0.2 1.6 1.6 0.2
Pumped drawdown close to, or greater than, the safe additional available drawdown 1 Safe additional drawdown level predicted to be exceeded 76% of the time (35 years in the 46-year simulation).
2 Safe additional drawdown level predicted to be exceeded 32% of the time (19.1 years in the 46-year simulation).
3 Safe additional drawdown level predicted to be exceeded 7.2% of the time (3.3 years in the 46-year simulation).
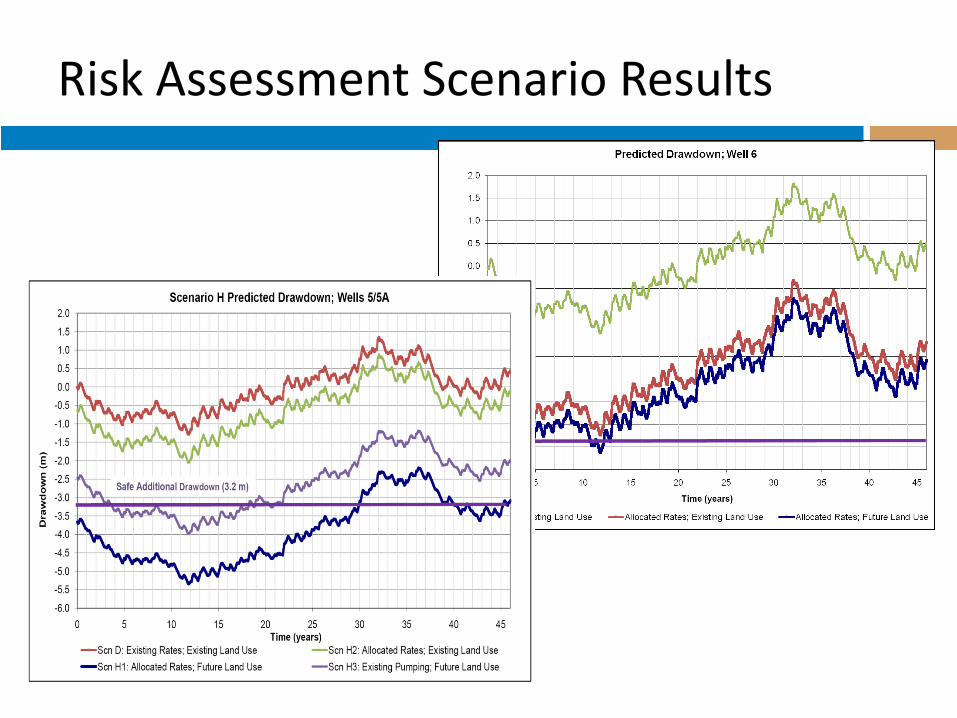
Risk Assessment Scenario Results
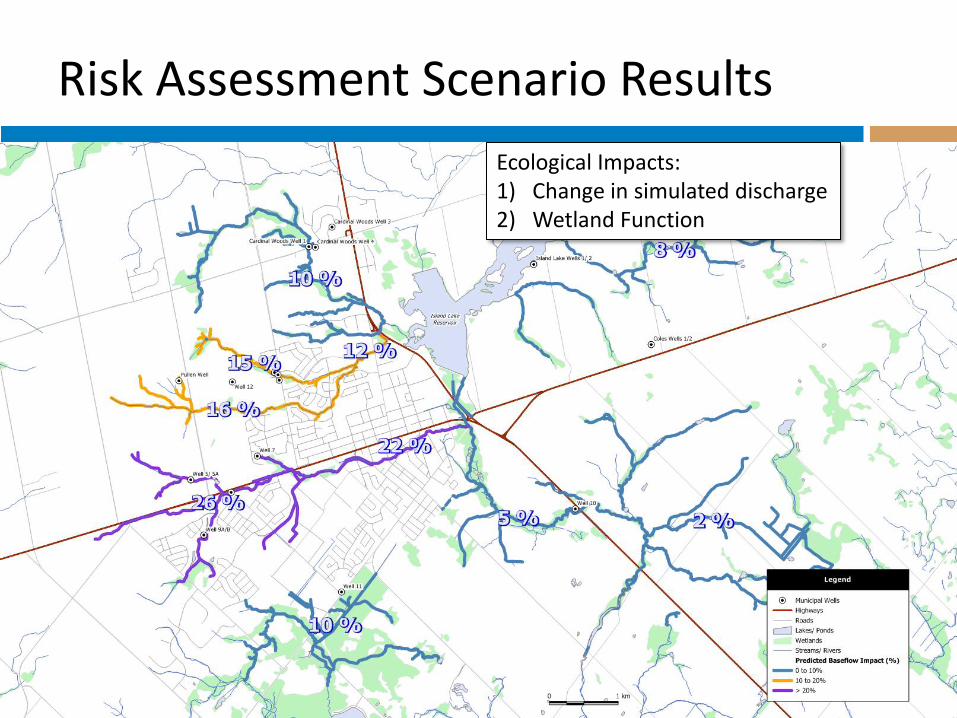
Risk Assessment Scenario Results
Ecological Impacts: 1) Change in simulated discharge 2) Wetland Function
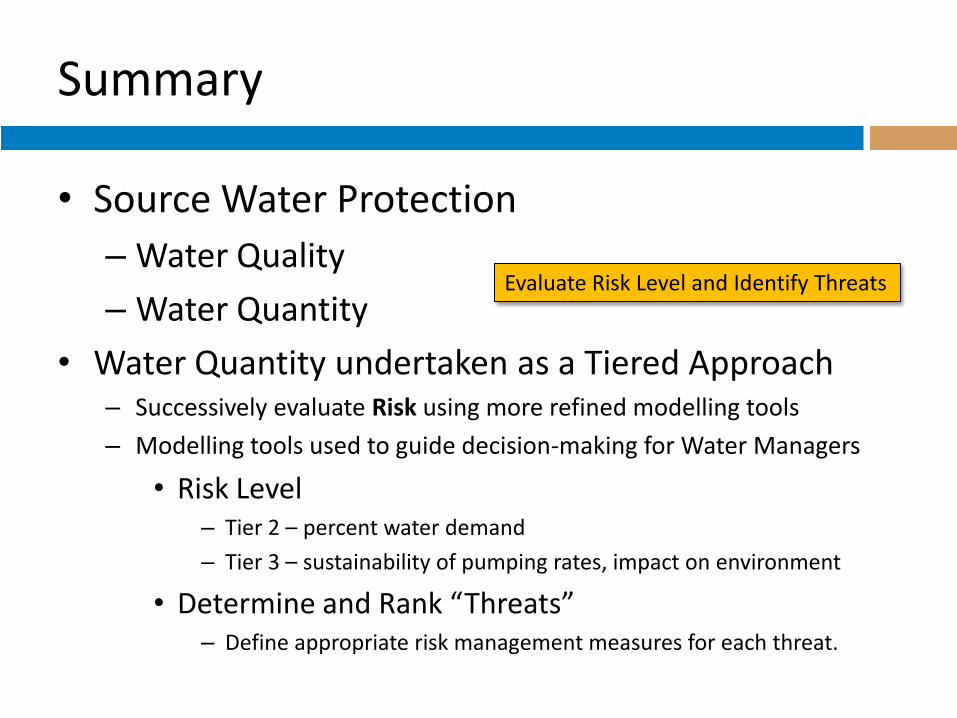
Summary
• Source Water Protection
– Water Quality
– Water Quantity
• Water Quantity undertaken as a Tiered Approach – Successively evaluate Risk using more refined modelling tools
– Modelling tools used to guide decision-making for Water Managers
• Risk Level – Tier 2 – percent water demand
– Tier 3 – sustainability of pumping rates, impact on environment
• Determine and Rank “Threats” – Define appropriate risk management measures for each threat.
Evaluate Risk Level and Identify Threats
Acknowledgements
Co-Authors: – Dave Van Vliet, Sam Bellamy, Paul Chin
• AquaResource, A Division of Matrix Solutions
– Mike Garraway, Ontario Ministry of Natural Resources
• Resource: waterbudget.ca