Embed Size (px)
Citation preview

NATIONAL ANALYSIS OF CEE 2002ENERGY STAR® HOUSEHOLD SURVEY
FINAL REPORT
Prime ContractorThe Cadmus Group, Inc.
SubcontractorsKEMA-XENERGY Consulting Inc.
Nexus Market Research
forENERGY STAR®
Climate Protection Partnerships DivisionU.S. Environmental Protection Agency
Washington, D.C.
Contract No. 68-W-00-124; Work Assignment 2-12Deliverable: April 10, 2003
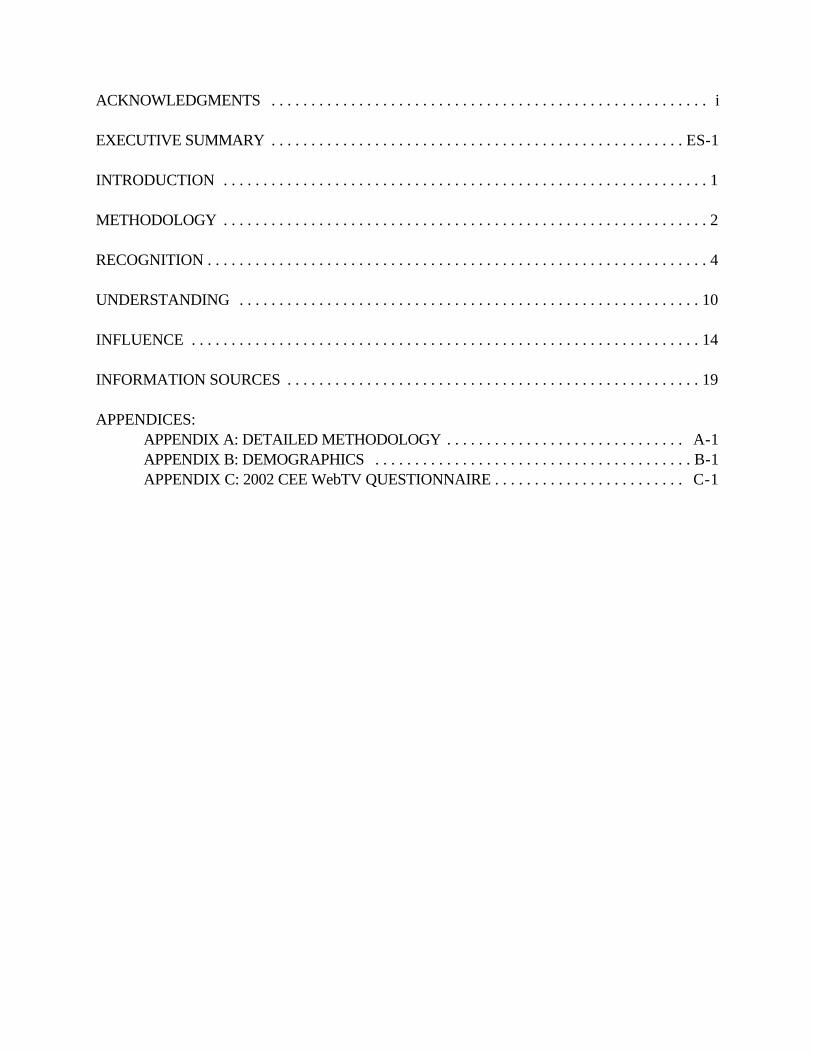
ACKNOWLEDGMENTS . . . . . . . . . . . . . . . . . . . . . . . . . . . . . . . . . . . . . . . . . . . . . . . . . . . . . . . i
EXECUTIVE SUMMARY . . . . . . . . . . . . . . . . . . . . . . . . . . . . . . . . . . . . . . . . . . . . . . . . . . . . ES-1
INTRODUCTION . . . . . . . . . . . . . . . . . . . . . . . . . . . . . . . . . . . . . . . . . . . . . . . . . . . . . . . . . . . . . 1
METHODOLOGY . . . . . . . . . . . . . . . . . . . . . . . . . . . . . . . . . . . . . . . . . . . . . . . . . . . . . . . . . . . . . 2
RECOGNITION . . . . . . . . . . . . . . . . . . . . . . . . . . . . . . . . . . . . . . . . . . . . . . . . . . . . . . . . . . . . . . . 4
UNDERSTANDING . . . . . . . . . . . . . . . . . . . . . . . . . . . . . . . . . . . . . . . . . . . . . . . . . . . . . . . . . . 10
INFLUENCE . . . . . . . . . . . . . . . . . . . . . . . . . . . . . . . . . . . . . . . . . . . . . . . . . . . . . . . . . . . . . . . . 14
INFORMATION SOURCES . . . . . . . . . . . . . . . . . . . . . . . . . . . . . . . . . . . . . . . . . . . . . . . . . . . . 19
APPENDICES:APPENDIX A: DETAILED METHODOLOGY . . . . . . . . . . . . . . . . . . . . . . . . . . . . . . A-1APPENDIX B: DEMOGRAPHICS . . . . . . . . . . . . . . . . . . . . . . . . . . . . . . . . . . . . . . . . B-1APPENDIX C: 2002 CEE WebTV QUESTIONNAIRE . . . . . . . . . . . . . . . . . . . . . . . . C-1

ACKNOWLEDGMENTS
The authors of this study, Miriam Goldberg (KEMA-XENERGY Consulting, Inc.), Valy Goepfrich(KEMA-XENERGY Consulting, Inc.), and Jocelyn Spielman (The Cadmus Group, Inc.) would liketo thank the Consortium for Energy Efficiency (CEE) for making its survey data available for thisanalysis. The following CEE member organizations sponsored the 2002 survey:
• Bonneville Power Administration• KeySpan Energy Delivery New England• Long Island Power Authority• National Grid USA• Northwest Energy Efficiency Alliance• NSTAR Electric & Gas• NYSERDA • Sacramento Municipal Utility District• Southern California Edison• Southern California Gas• Wisconsin Dept. of Administration In addition, we would also like to extend special thanks to the following individuals for theircontributions:
• Marc Hoffman, Executive Director of the Consortium for Energy Efficiency (CEE), and MonicaNevius, CEE’s Research and Evaluation Manager, for making the study data available to EPA forthe national analysis.
• Maureen McNamara of the Environmental Protection Agency ENERGY STAR Program forproject management and oversight of this report.
THE CADMUS GROUP, INC.
Page ES-1
EXECUTIVE SUMMARY
In the fall of 2002, the Consortium for Energy Efficiency (CEE) and a number of its memberssponsored the third national household survey of consumer awareness of ENERGY STAR. Each year,the survey objectives have largely been the same, to collect national data on consumer recognition,understanding, and purchasing influence of the ENERGY STAR label, as well as data on messaging,product purchases, and information sources used by consumers in their purchasing decisions. CEEmembers in New England chose to supplement the national sample in their territories by conductingadditional surveys in Massachusetts. As in the two previous years, CEE and the sponsoring membersmade the survey data publicly available.
This report discusses the results of the CEE 2002 ENERGY STAR Household Survey, building onprior years’ survey information and focusing on the extent to which consumers recognized theENERGY STAR label, understood its intended messages, and used (or were influenced by) the labelon their energy-related purchasing decisions. Research questions of interest included:
• Where do consumers see or hear about the ENERGY STAR label?
• How does increased publicity impact ENERGY STAR label recognition, understanding, andinfluence?
• Which key messages about the ENERGY STAR label are consumers retaining?
• Do consumers demonstrate loyalty to the ENERGY STAR label?
THE CADMUS GROUP, INC.
Page ES-2
Key Findings at the National Level
• Forty-one percent of households recognize (with a visual aid) the ENERGY STAR label.
• Fifty-eight percent of households have a high or general understanding of the label.
• Of households that recognized the ENERGY STAR label and purchased a product in the lasttwelve months, 60 percent purchased an ENERGY STAR product.
• Considering households that recognized the label and those that did not (i.e., all households), 17percent of households knowingly purchased an ENERGY STAR-labeled product in the last twelvemonths.
• For 46 percent of households that knowingly purchased an ENERGY STAR-labeled product, thepresence of the label influenced their purchasing decision “very much” or “somewhat.” For another21 percent of households, the presence of the label influenced their purchasing decision “slightly.”
• Thirteen percent of households that knowingly purchased an ENERGY STAR-labeled productreceived a financial incentive. Ninety-two percent of these households would have been “verylikely” (40 percent) or “somewhat likely” (52 percent) to purchase the labeled product without thefinancial incentive.
• Sixty-three percent of households that knowingly purchased an ENERGY STAR-labeled productwere “very likely” or “somewhat likely” to recommend labeled products to a friend, and another 23percent were “slightly likely.”
Key Findings from Publicity-level Analyses
• A larger proportion of households in high- than in low-publicity areas recognize the ENERGYSTAR label, both with and without a visual aid. High-publicity areas are areas with activeENERGY STAR promotions by a regional program sponsor for two or more years.
• Considering households that recognized (with a visual aid) the label, a larger proportion of thesehouseholds in high- than in low-publicity areas associate the ENERGY STAR label with productsheavily promoted by regional program sponsors.
• A larger proportion of households in high- than in low-publicity areas have at least a generalunderstanding of the ENERGY STAR label.
THE CADMUS GROUP, INC.
Page ES-3
• Considering the messages of the ENERGY STAR label, a larger proportion of households in high-than in low-publicity areas associate the ENERGY STAR label with “a specific product.” Also, asmaller proportion of households in high- than in low-publicity areas associate the label with“energy conservation.”
• A larger proportion of households in high- than in low-publicity areas knowingly purchased anENERGY STAR product within the last 12 months.
• Considering households that knowingly purchased an ENERGY STAR-labeled product, a largerproportion of these households in high- than in low-publicity were at least somewhat influenced bythe label.
• Considering households that recognized (with a visual aid) the label, a larger proportion of thesehouseholds in high- than in low-publicity areas have seen or heard something about ENERGYSTAR on both TV commercials and utility mailings or bill inserts.
Conclusions and Future Directions
This third national study of household awareness of the ENERGY STAR label confirms key findingsfrom the previous years’ surveys: substantial portions of the U.S. households in the surveyed populationrecognize, understand, and are influenced by the ENERGY STAR label; and publicity from activeregional energy efficiency program sponsors increases recognition, understanding, and influence of thelabel.
The overall trend for the 2002 data represents movement in the correct direction. A statisticallymeasurable change or trend in the key indicators (e.g., recognition, understanding or influence of theENERGY STAR label) may only be observable after several years (e.g., more than two years). For achange in awareness between 2001 and 2003 to be statistically significant at the 90 percent confidencelevel, awareness would need to change by at least 4.25 percentage points (assumes the standard errorin 2003 is similar to the standard error in 2002).
In addition, measurable growth in the key indicators, such as recognition, understanding, and influence,is also affected by the survey’s sample methodology, which focuses on respondents in the 57 largestmedia markets (representing 70 percent of TV households). While providing a valuable nationalanalysis, this focus does not capture fully any increases in recognition and understanding in the smallercities, which are well covered by regional programs. This is important to note, because the higherawareness in high publicity areas indicates that regional programs are effectively communicating theENERGY STAR message.
THE CADMUS GROUP, INC.
Page 1
INTRODUCTION
In the fall of 2002, the Consortium for Energy Efficiency (CEE) sponsored the third national householdsurvey of consumer awareness of ENERGY STAR. Each year, the survey objectives have largelybeen the same, to collect national data on consumer recognition, understanding, and purchasinginfluence of the ENERGY STAR label, as well as data on messaging, product purchases, andinformation sources used by consumers in their purchasing decisions. CEE members chose tosupplement the national sample in their territory by conducting additional surveys in Massachusetts. Asin the two previous years, CEE and sponsoring members made the survey data publicly available.
This report discusses the results of the CEE 2002 ENERGY STAR Household Survey, building onprior years’ survey information and focusing on the extent to which consumers recognized theENERGY STAR label, understood its intended messages, and used (or were influenced by) the labelon their energy-related purchasing decisions. Research questions of interest included:
• Where do consumers see or hear about the ENERGY STAR label?
• How does increased publicity impact ENERGY STAR label recognition, understanding, andinfluence?
• Which key messages about the ENERGY STAR label are consumers retaining?
• Do consumers demonstrate loyalty to the ENERGY STAR label?
This report has two parts. Part I includes an Executive Summary, this introduction, a summary ofmethods, key findings in four sections, and three appendices. Appendix A is the DetailedMethodology, Appendix B considers Demographic Information from the 2002 WebTV survey, andAppendix C provides a copy of the 2002 WebTV questionnaire. Part II presents the 2002 WebTVsurvey results by publicity category. In all cases, the results presented are properly weighted to obtainnational estimates.

THE CADMUS GROUP, INC.
Page 2
METHODOLOGY
From August through September 2002, the Consortium for Energy Efficiency (CEE) designed andfielded a household survey to obtain information at the national level on consumer awareness of theENERGY STAR label. The survey was delivered by WebTV and was similar to the 2001 WebTVsurvey. As in the previous two years, CEE and the sponsoring members made the survey data publiclyavailable.
The survey was a national survey. The sampling frame for the survey is all households in the largestNielsen Designated Market Areas (DMAs) that account for approximately 70 percent of U.S.television households. In 2002, the 57 largest DMAs account for approximately 70 percent of U.S.television households. In addition, selected CEE members sponsored more intensive sampling (anoversample) for one state, Massachusetts, which is referred to here as a “sponsor area.” For thesponsor area, the frame was not limited to the large DMAs, but included the entire state. Thus, thecomplete frame for the study was the combination of the largest DMAs and any portion of the sponsorarea that fell outside these DMAs.
As in previous years’ studies, to consider the effect of publicity on national awareness, the DMAs in thecomplete frame were classified by publicity category. The same publicity classification procedure usedlast year was used this year. In both 2001 and 2002, a DMA was classified as high publicity, lowpublicity, or other using the following criteria:
• High publicity: At least two recent years of sustained promotions and publicity from non-federalactivities
• Low publicity: Federal campaign activities only and no significant regional program sponsoractivities
• Other: All other DMAs
This classification procedure identifies three publicity categories and provides clear and verifiabledefinitions. The key working definitions are:
• Recent: The two years of activity must include the time of the survey fielding
• Sustained: The two years of activity must be continuous
THE CADMUS GROUP, INC.
1 During the September 2001 to September 2002 period, EPA launched the first of three new television national PublicService Announcements (PSAs) as part of its Change campaign. The Change campaign also included continued distributionof several radio and print PSAs as a component of its overall outreach strategy.
Page 3
• Significant: In addition to any direct federal publicity efforts1, publicity efforts must include adeliberate and multifaceted regional program sponsor investment in ENERGY STAR programming,such as direct marketing and promotional efforts
These definitions are sufficiently operational to be applicable to future survey efforts, and can bemodified by simply increasing the duration of sustained high publicity.
The sample is stratified by publicity category and sponsor area. The three publicity categories and onesponsor area result in four strata. Households in the largest or parts of the largest DMAs that were notin the sponsor area, were assigned to one of the publicity category strata. Households in the sponsorarea were assigned to the sponsor area stratum. Each publicity category stratum was allocatedapproximately 266 sampling points. The CEE members who funded the oversample for the sponsorarea determined the number of sampling points allocated to their stratum.
This report presents the 2002 survey results at the national level and often by publicity category. Thepublicity category results provide evidence on the effectiveness of EPA’s model to increase awarenessof ENERGY STAR by supporting regional program sponsors. Results are presented on consumerrecognition, understanding, and purchasing influence of the ENERGY STAR label, as well as onmessaging, product purchases, and information sources used by consumers in their purchasingdecisions.

THE CADMUS GROUP, INC.
Page 4
RECOGNITION
In 2002, 41 percent of households recognized the ENERGY STAR label when shown the label (i.e.,aided recognition). Approximately 28 percent of households correctly assessed whether or not theyhad seen or heard of the ENERGY STAR label without first being shown the label (i.e., unaidedrecognition).
For purposes of this analysis, respondents are said to recognize the ENERGY STAR label if they haveseen or heard of the label before the survey. Recognition of the ENERGY STAR label was exploredtwo different ways. “Aided” recognition was measured by showing the label and asking if therespondent had heard of or seen it before. Delivering the survey by WebTV also made it possible tomeasure “unaided” recognition. Unaided recognition was measured by asking this same question, butwithout showing the label. Both methods are useful measurements of label recognition, althoughunaided recognition is more conservative.
Recognition results for both this year’s and last year’s WebTV surveys are summarized in the nexttable. No statistically measurable changes in aided recognition of the ENERGY STAR label werefound between 2002 and 2001. However, unaided recognition is higher this year than last year at a 5percent level of significance (p-value=0.050).
Recognition of the ENERGY STAR Label(Base = All respondents)
WebTV
2002 2001
Aided (n=1,091)
Unaided (n=991)
Aided (n=1,810)
Unaided (n=1,672)
Recognize ENERGY STARlabel 41% 28% 38% 24%
Standard error 2.2% 2.1% 1.3% 1.1%
# of households (millions) 71.22 65.82 69.77 64.23
Note: The unaided recognition results are based on the question ES1: “Have you ever seen or heard of the ENERGYSTAR label?” The aided recognition results are based on two questions. (1) ES3: “Is this the label you have seen orheard of before?,” which is asked if ES1=”yes.” (2) ES6: “Now that you have had the opportunity to see theENERGY STAR label, do you recall seeing or hearing anything about it before this survey?,” which is asked if eitherES1=”no” or ES3=”no.”

THE CADMUS GROUP, INC.
Page 5
57%
42%
27%
13%
0%
10%
20%
30%
40%
50%
60%
***Aided (n=1,091) ***Unaided (n=991)
High PublicityLow Publicity
Recognition by publicity category
Both aided and unaided recognition were higher in high-publicity areas (areas with an active localENERGY STAR program sponsored by a utility, state agency, or other organization for two or morecontinuous years) than in low-publicity areas. Aided, households in high-publicity areas recognized theENERGY STAR label at 57 percent versus 27 percent in low-publicity areas. Unaided recognitionwas 42 percent in high-publicity areas compared with 13 percent in low-publicity areas. Thedifferences in recognition, both aided and unaided, between high-publicity and low-publicity areas werehighly statistically different from zero (p-value < 0.0001).
Recognition of the ENERGY STAR Label by Publicity Category(Base = All respondents)
***High- and low-publicity areas proportions are statistically different from each other at the 1 percent level of significance (p-value<=0.01).
THE CADMUS GROUP, INC.
Page 6
Product associations
Fifty-four percent of households have seen the ENERGY STAR label on refrigerators. Computersand dishwashers were the next most commonly associated products with the label, both at 43 percent,with washing machines not far behind at 37 percent. Windows, room air conditioners, central airconditioners, and televisions were in the 20 to 30 percent range. Products supported by regionalprograms, such as refrigerators, dishwashers, washing machines, and air conditioning equipment, showstrong association with the ENERGY STAR label. The strong association of the label with computersand televisions is probably the combined effect of manufacturer labeling and the prevalence of theseproducts in daily life. Twenty-three percent of households associate the ENERGY STAR label withmicrowave ovens, which do not in fact have an ENERGY STAR specification. However, microwaveovens were the least recognized of all the appliances.
THE CADMUS GROUP, INC.
Page 7
4%
5%
6%
8%
8%
9%
9%
11%
11%
12%
12%
12%
13%
13%
13%
15%
23%
23%
25%
27%
29%
37%
43%
43%
54%
0% 10% 20% 30% 40% 50% 60%
Skylight
Audio product
Roofing material
Thermostat
Scanner
Fax machine
Heat pump
Computer printer
VCR
Copying machine
Newly built home
Furnace/boiler
Insulation
Lighting fixture
Door
Compact florescent light bulb
Television
Microwave oven
Central A/C
Room air conditioner
Window
Washing machine
Dishwasher
Computer or monitor
Refrigerator
Product Association With the ENERGY STAR Label(Base =Recognize label aided, n=455)
Note: Q5(a, b, and c): “Now we’re going to ask you about several groups of products. As you review the list, please select eachof the products, product literature, or packaging on which you have seen the ENERGY STAR label.

THE CADMUS GROUP, INC.
Page 8
Product associations by publicity category
For most products, the proportion of households that associated the product with the ENERGY STARlabel was statistically the same for high- and low-publicity areas. For several products, however, theproportions were statistically different from each other at the 10 percent level of significance or better. A larger proportion of households in high- than in low-publicity areas associated the label withrefrigerators, washing machines, and copy machines. On the other hand, a smaller proportion ofhouseholds in high- than in low-publicity areas associated the ENERGY STAR label with computers. Regional energy efficiency program sponsors promoted refrigerators and washing machines heavily, butthey did not promote computers heavily.
THE CADMUS GROUP, INC.
Page 9
7%
7%
10%
10%
5%
6%
10%
14%
12%
13%
12%
14%
4%
16%
14%
16%
27%
34%
25%
28%
27%
57%
26%
41%
43%
3%
5%
5%
7%
8%
9%
9%
10%
11%
13%
13%
13%
14%
15%
16%
18%
24%
25%
26%
30%
32%
36%
48%
53%
63%
0% 10% 20% 30% 40% 50% 60% 70%
Skylight
Audio product
Heat pump
Roofing material
Scanner
Fax machine
Thermostat
Computer printer
VCR
Furnace/boiler
Insulation
Door
**Copying machine
Lighting fixture
Newly built home
Compact florescent light bulb
Television
Central A/C
Microwave oven
Window
Room air conditioner
**Computer or monitor
***Washing machine
Dishwasher
**Refrigerator
High Publicity
Low Publicity
Product Association With the ENERGY STAR Label by Publicity Category(Base =Recognize label aided, n=455)
***High- and low-publicity areas proportions are statistically different from each other at the 1 percent level of significance (p-value<=0.01).
**High- and low-publicity areas proportions are statistically different from each other at the 5 percent level of significance (p-value<=0.05).

THE CADMUS GROUP, INC.
Page 10
UNDERSTANDING
In 2002, 58 percent of households have at least a general understanding of the ENERGY STAR labelwith 46 percent exhibiting a high degree of understanding. Understanding was probed by askingrespondents what messages came to mind when they saw the ENERGY STAR label. Responses werecategorized, coded appropriately, and further classified as high, general, or no understanding.
The results on understanding of the ENERGY STAR label for both this year’s and last year’s WebTVsurveys are provided in the next table. The proportions of households with at least a generalunderstanding of the ENERGY STAR label were similar between 2002 and 2001, 58 and 56 percentrespectively.
Level of Understanding of the ENERGY STAR Label(Base = All respondents)
Level of Understanding of theENERGY STAR Label
WebTV
2002(n=1,168)
2001(n=1,936)
High understanding 46% 37%
General understanding 12% 19%
No understanding 42% 44%
Total 100% 100%
# of households (millions) 75.39 74.44
Note: The level of understanding of the label are based on two questions. (1) If recognized the label unaided,ES2: “What does the ENERGY STAR label mean to you?” (2) If did not recognize the label unaided,ES4A1: “Type the messages that come to mind when you see the ENERGY STAR label?”

THE CADMUS GROUP, INC.
Page 11
Understanding by publicity category
Understanding of the ENERGY STAR label was greater in high- than in low-publicity areas. Sixty-three percent of households in high-publicity areas had at least a general understanding of the labelcompared with 54 percent of households in low-publicity areas. These two estimates of at least generalunderstanding of the label were significantly different from each other (p-value=0.096).
At Least a General Understanding of the ENERGY STAR Label
by Publicity Category(Base = All respondents)
Publicity Category % Households
High 63%
Low 54%
High-Low 9%
p-value 0.096
Label messaging
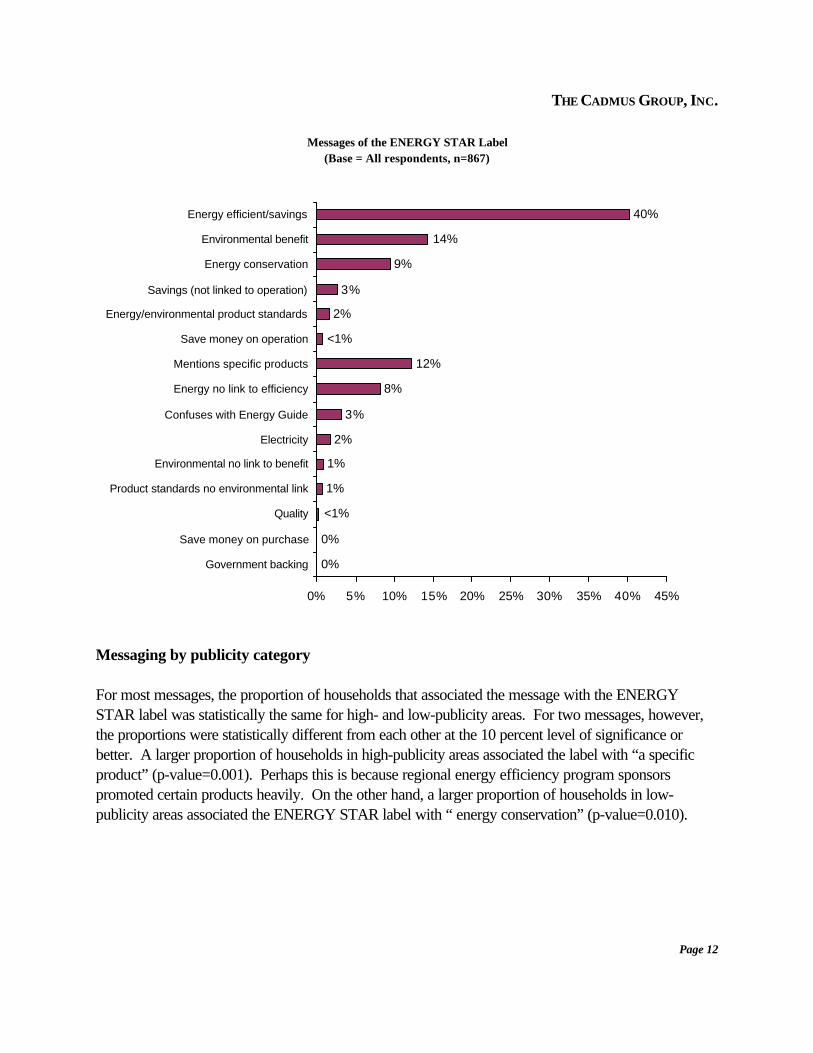
Open-ended responses used to measure understanding are also an indicator of how effectively EPAcommunicates its messages through the ENERGY STAR label. By far the most common messageassociated with the label is “energy efficiency or energy savings.” Forty percent of householdsassociate the ENERGY STAR label with this message. “Environmental benefit” is the second mostcommon message associated with the label, at 14 percent of households. Both of these messages areconsidered high understanding of the ENERGY STAR label.
THE CADMUS GROUP, INC.
Page 12
General Understanding
High Understanding
0%
0%
1%
1%
2%
3%
8%
12%
2%
3%
9%
14%
40%
<1%
<1%
0% 5% 10% 15% 20% 25% 30% 35% 40% 45%
Government backing
Save money on purchase
Quality
Product standards no environmental link
Environmental no link to benefit
Electricity
Confuses with Energy Guide
Energy no link to efficiency
Mentions specific products
Save money on operation
Energy/environmental product standards
Savings (not linked to operation)
Energy conservation
Environmental benefit
Energy efficient/savings
Messages of the ENERGY STAR Label(Base = All respondents, n=867)
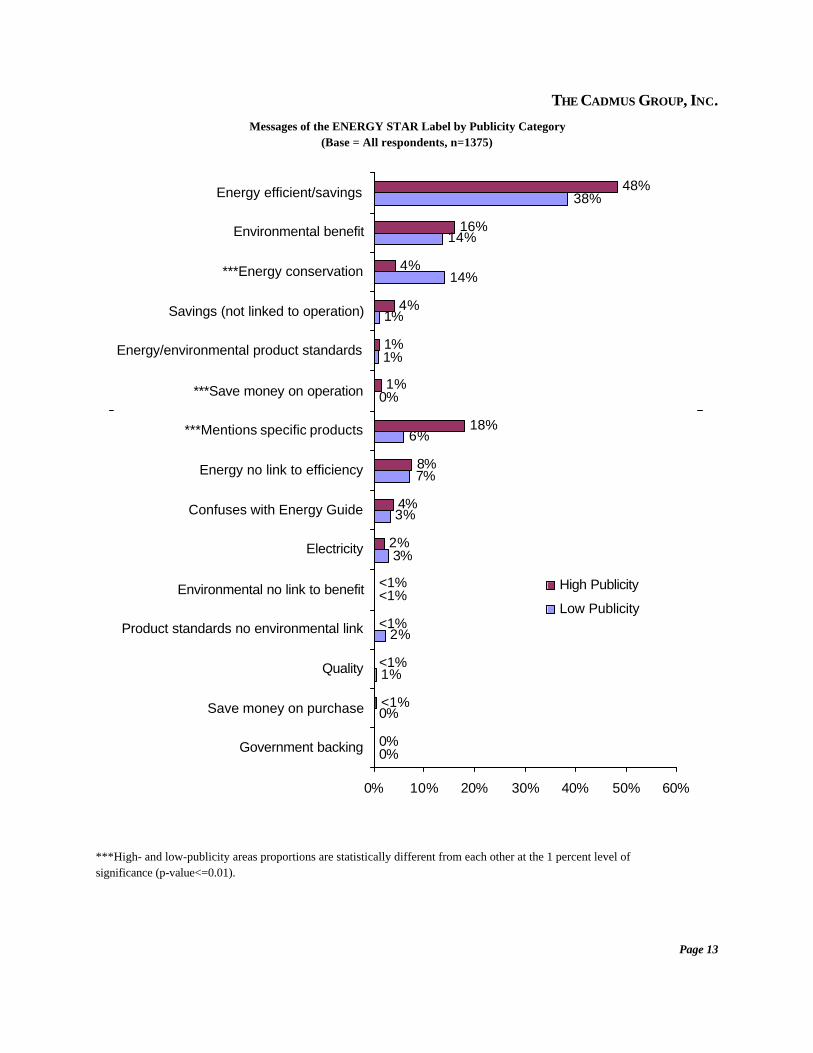
Messaging by publicity category
For most messages, the proportion of households that associated the message with the ENERGYSTAR label was statistically the same for high- and low-publicity areas. For two messages, however,the proportions were statistically different from each other at the 10 percent level of significance orbetter. A larger proportion of households in high-publicity areas associated the label with “a specificproduct” (p-value=0.001). Perhaps this is because regional energy efficiency program sponsorspromoted certain products heavily. On the other hand, a larger proportion of households in low-publicity areas associated the ENERGY STAR label with “ energy conservation” (p-value=0.010).
THE CADMUS GROUP, INC.
Page 13
General Understanding
High Understanding
0%
0%
1%
2%
3%
3%
7%
6%
0%
1%
1%
14%
14%
38%
0%
2%
4%
8%
18%
1%
1%
4%
4%
16%
48%
<1%
<1%
<1%
<1%
<1%
0% 10% 20% 30% 40% 50% 60%
Government backing
Save money on purchase
Quality
Product standards no environmental link
Environmental no link to benefit
Electricity
Confuses with Energy Guide
Energy no link to efficiency
***Mentions specific products
***Save money on operation
Energy/environmental product standards
Savings (not linked to operation)
***Energy conservation
Environmental benefit
Energy efficient/savings
High Publicity
Low Publicity
Messages of the ENERGY STAR Label by Publicity Category(Base = All respondents, n=1375)
***High- and low-publicity areas proportions are statistically different from each other at the 1 percent level of significance (p-value<=0.01).

THE CADMUS GROUP, INC.
Page 14
Understanding by aided recognition
Households that recognize the ENERGY STAR label with a visual aid are more likely to have at least ageneral understanding of the label than those who do not recognize the label. Among households thatrecognize the label, 75 percent have at least a general understanding of the label, compared withhouseholds that do not recognize the label at 47 percent. The 28 percentage point difference betweenthese two proportions was highly statistically different (p-value < 0.0001).
At Least a General Understanding of the ENERGYSTAR Label by Aided Recognition of the Label
(Base = All respondents, n=1,091)
Recognize ENERGY STAR Label Aided
% Households at Least General Understanding
Yes 75%
No 47%
Yes-No 28%
p-value <0.0001
INFLUENCE
The survey provided some information on consumers’ decisions to purchase ENERGY STAR-labeledproducts, including the following:
• The influence of the label on purchasing decisions;
• The role of rebates or financing in decisions to buy ENERGY STAR products;
• The proportion of households, nationally, that recognize the ENERGY STAR label and actuallypurchased a labeled product; and
• The loyalty of ENERGY STAR purchasers.

THE CADMUS GROUP, INC.
Page 15
Influence of the ENERGY STAR label
In 2002, for 21 percent of households that purchased an ENERGY STAR-labeled product, thepresence of the label influenced their purchasing decision “very much.” For 67 percent of households,the presence of the label influenced their purchasing decision to some extent (“very much,” “somewhat,”or “slightly”).
The results on influence of the ENERGY STAR label for this year’s and last year’s WebTV surveysare provided in the following table. The proportions of households for which the ENERGY STARlabel was at least somewhat influential in their purchasing decision were similar between 2002 and2001, 46 and 49 percent respectively.
Influence of the ENERGY STAR Label on Purchasing Decisions(Base = Recognize label aided and ENERGY STAR purchasers)
Response
WebTV
2002(n=141)
2001(n=247)
Very much 21% 23%
Somewhat 25% 25%
Slightly 21% 14%
Not at all 33% 38%
Total 100% 100%
# of households (millions) 7.76 8.15
Note: Q8: “For any ENERGY STAR labeled product(s) you purchased, how much did the presence or
absence of the ENERGY STAR label influence your purchasing decision?”
Influence of the ENERGY STAR label by publicity category
The purchasing decisions of 57 percent of households in high-publicity areas were at least somewhatinfluenced by the ENERGY STAR label, compared to 32 percent of households in low-publicity areas. The difference between these two proportions was significantly different from zero at the 10 percentlevel (p-value=0.082).

THE CADMUS GROUP, INC.
Page 16
Influence of the ENERGY STAR Label on Purchasing Decisions by Publicity Category(Base = Recognize label aided and ENERGY STAR purchasers, n=141)
Publicity Category Very muchVery much or somewhat
Very much, somewhat, or slightly
High 32% 57% 74%
Low 19% 32% 52%
High-Low 13% 25% 22%
p-value 0.312 0.082 0.189
Rebate and financing influence
Thirteen percent of households that purchased an ENERGY STAR-labeled product received rebatesor reduced-rate financing. A very large proportion of these households, 92 percent, would have been“very likely” or “somewhat likely” to purchase the labeled product if financial incentives had not beenavailable.
Influence of Rebates and Financing on Purchasing Decisions(Base = Recognize label aided, ENERGY STAR purchaser, and received an incentive, n=30)
Likelihood Purchase ENERGY STAR Product WithoutFinancial Incentive % Households
Very likely 40%
Somewhat likely 52%
Slightly likely 2%
Not at all likely 6%
Total 100%
# of households (millions) 0.98
Note: Q10: “If rebates or reduced-rate financing had not been available, how likely is it that you would havepurchased the ENERGY STAR-labeled product?”
THE CADMUS GROUP, INC.
Page 17
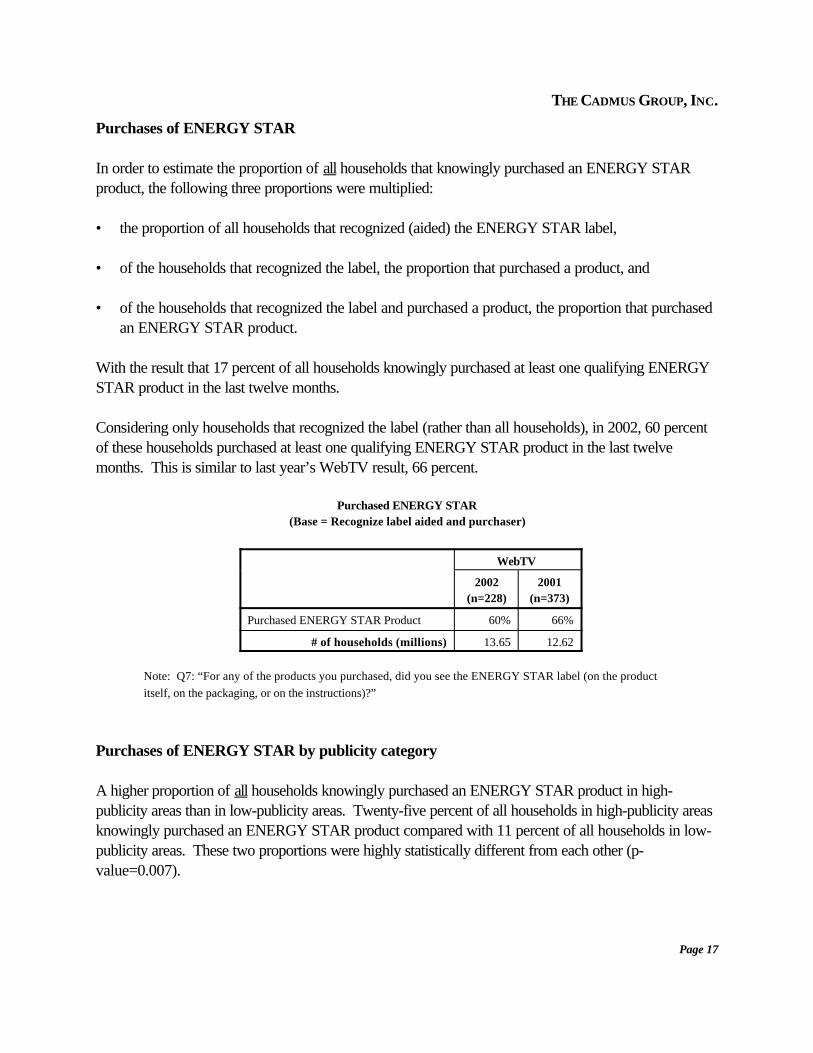
Purchases of ENERGY STAR
In order to estimate the proportion of all households that knowingly purchased an ENERGY STARproduct, the following three proportions were multiplied:
• the proportion of all households that recognized (aided) the ENERGY STAR label,
• of the households that recognized the label, the proportion that purchased a product, and
• of the households that recognized the label and purchased a product, the proportion that purchasedan ENERGY STAR product.
With the result that 17 percent of all households knowingly purchased at least one qualifying ENERGYSTAR product in the last twelve months.
Considering only households that recognized the label (rather than all households), in 2002, 60 percentof these households purchased at least one qualifying ENERGY STAR product in the last twelvemonths. This is similar to last year’s WebTV result, 66 percent.
Purchased ENERGY STAR(Base = Recognize label aided and purchaser)
WebTV
2002(n=228)
2001(n=373)
Purchased ENERGY STAR Product 60% 66%
# of households (millions) 13.65 12.62
Note: Q7: “For any of the products you purchased, did you see the ENERGY STAR label (on the productitself, on the packaging, or on the instructions)?”
Purchases of ENERGY STAR by publicity category
A higher proportion of all households knowingly purchased an ENERGY STAR product in high-publicity areas than in low-publicity areas. Twenty-five percent of all households in high-publicity areasknowingly purchased an ENERGY STAR product compared with 11 percent of all households in low-publicity areas. These two proportions were highly statistically different from each other (p-value=0.007).

THE CADMUS GROUP, INC.
Page 18
National Household Market Penetration of ENERGY STAR Products by Publicity Category(Base = All respondents)
Publicity Category % Households
High 25%
Low 11%
High-Low 13%
p-value 0.007
Loyalty to ENERGY STAR
In 2002, 63 percent of households that purchased an ENERGY STAR-labeled product would be“very likely” or “somewhat likely” to recommend labeled products to a friend. Furthermore, only 14percent of households would be “not at all likely” to recommend ENERGY STAR products to a friend.
The results on loyalty to the ENERGY STAR label for both this year’s and last year’s WebTV surveysare shown in the next table. The proportions of households at least somewhat likely to recommendlabeled products to a friend were similar between 2002 and 2001, 63 and 65 percent respectively.
Loyalty to ENERGY STAR(Base = Recognize label aided and ENERGY STAR purchasers)
Likelihood Recommend ENERGY STAR Products
WebTV
2002 (n=121)
2001 (n=212)
Very likely 39% 33%
Somewhat likely 24% 32%
Slightly likely 23% 18%
Not at all likely 14% 16%
Total 100% 100%
# of households (millions) 6.27 7.08
Note: Q11: “How likely are you to recommend ENERGY STAR-labeled products to a friend?”
THE CADMUS GROUP, INC.
Page 19
2%
3%
4%
5%
5%
7%
8%
8%
18%
20%
21%
31%
41%
56%
<1%
0% 10% 20% 30% 40% 50% 60%
Contractor
TV news feature story
Friend, neighbor, relative, or co-worker
Billboard
Salesperson
Direct mail or circular advertisement
Newspaper or magazine article
Internet
Radio commercial
Yellow EnergyGuide label
Newspaper or magazine advertisement
Utility mailing or bill insert
TV commercial
Displays in stores
Labels on appliances or electronic equipment
INFORMATION SOURCES
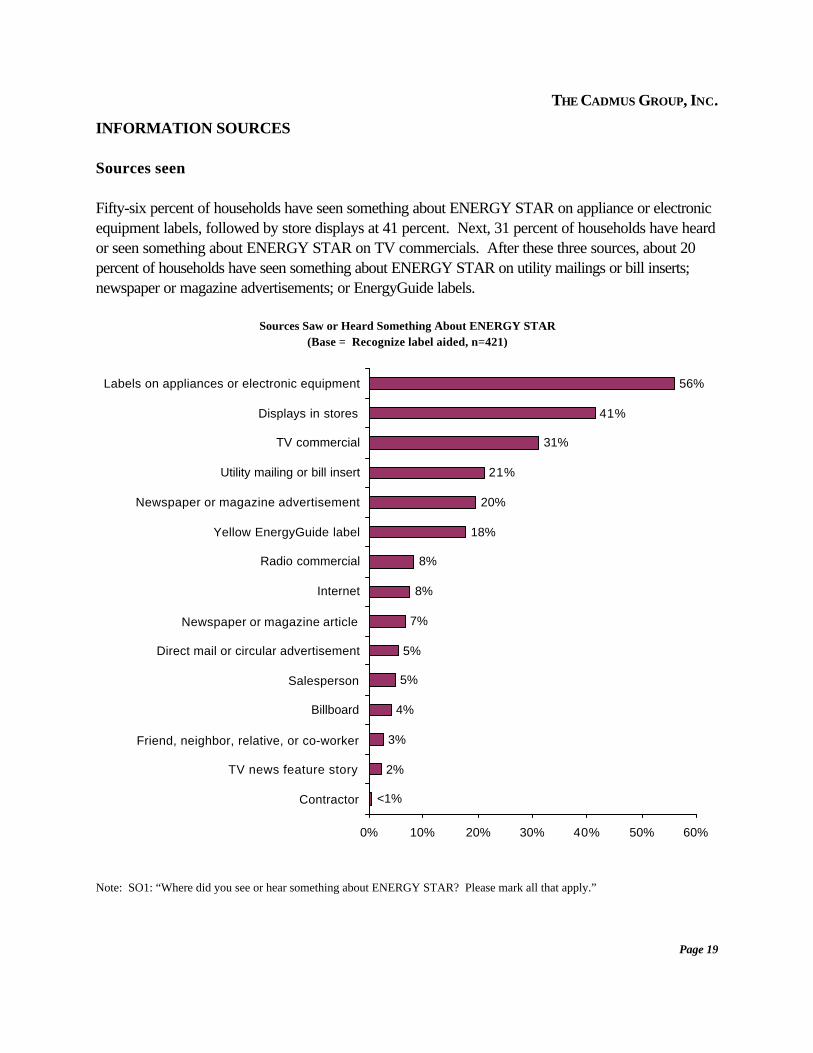
Sources seen
Fifty-six percent of households have seen something about ENERGY STAR on appliance or electronicequipment labels, followed by store displays at 41 percent. Next, 31 percent of households have heardor seen something about ENERGY STAR on TV commercials. After these three sources, about 20percent of households have seen something about ENERGY STAR on utility mailings or bill inserts;newspaper or magazine advertisements; or EnergyGuide labels.
Sources Saw or Heard Something About ENERGY STAR(Base = Recognize label aided, n=421)
Note: SO1: “Where did you see or hear something about ENERGY STAR? Please mark all that apply.”
THE CADMUS GROUP, INC.
Page 20
1%
0%
2%
1%
3%
4%
6%
6%
5%
22%
22%
11%
18%
34%
59%
3%
3%
4%
7%
5%
6%
8%
13%
15%
18%
27%
44%
45%
50%
<1%
0% 10% 20% 30% 40% 50% 60% 70%
Contractor
TV news feature story
Friend, neighbor, relative, or co-worker
Billboard
Salesperson
Direct mail or circular advertisement
Newspaper or magazine article
Internet
Radio commercial
Yellow Energy Guide label
Newspaper or magazine advertisement
***Utility mailing or bill insert
***TV commercial
Displays in stores
Labels on appliances or electronic equipment
High Publicity
Low Publicity
Sources seen by publicity category
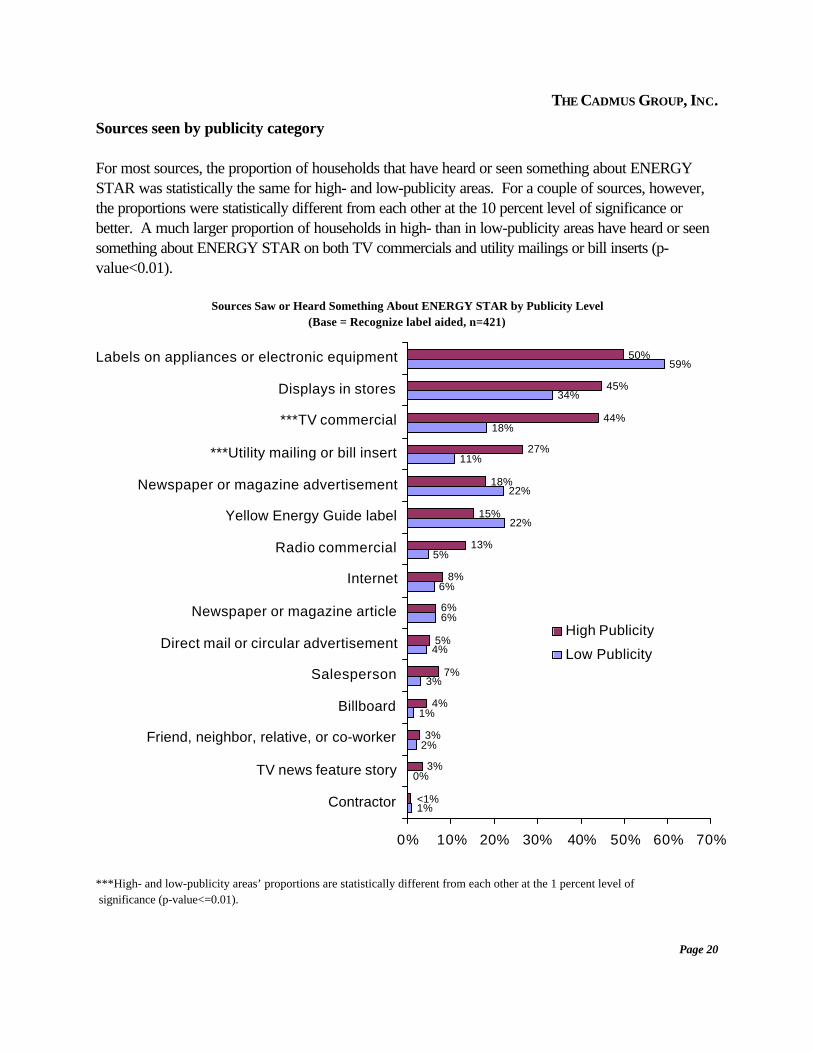
For most sources, the proportion of households that have heard or seen something about ENERGYSTAR was statistically the same for high- and low-publicity areas. For a couple of sources, however,the proportions were statistically different from each other at the 10 percent level of significance orbetter. A much larger proportion of households in high- than in low-publicity areas have heard or seensomething about ENERGY STAR on both TV commercials and utility mailings or bill inserts (p-value<0.01).
Sources Saw or Heard Something About ENERGY STAR by Publicity Level(Base = Recognize label aided, n=421)
***High- and low-publicity areas’ proportions are statistically different from each other at the 1 percent level of significance (p-value<=0.01).
THE CADMUS GROUP, INC.
Page 21
Sources consumers consult for product information
The survey asked about the sources consumers are most likely to use to obtain information aboutproducts covered by the ENERGY STAR program. The question was asked separately for twoproduct groups: (1) heating and cooling products and (2) home appliances, lighting, and homeelectronics. For both product groups, the top four sources were the same: personal acquaintances, consumer magazines, retailers, and the internet. Also, the proportion of households consulting each ofthese sources were similar for both product groups: personal acquaintances at about 60 percent,consumer magazines and retailers between 43 and 50 percent, and the internet at about 30 percent. For both product groups, television was also in the neighborhood of 30 percent and for heating andcooling products so were contractors. The proportion of households consulting the remaining sourcesfor product information were 20 percent or less.

THE CADMUS GROUP, INC.
Page 22
7%
13%
21%
13%
28%
17%
29%
46%
50%
62%
8%
11%
16%
22%
26%
28%
33%
43%
46%
61%
0% 10% 20% 30% 40% 50% 60% 70%
Radio
Other magazines
Newspapers
Utility program
Television
Contractor
Internet
Retailer
Consumer magazines
Friend/neighbor/etc.
Heating and CoolingProducts(a) (n=1,021)
Appliances, HomeElectronics, Lighting(b)(n=1,049)
Product Information Sources Consulted(Base = All respondents)
(a)Q13_1: “Now, please think only about Heating and Cooling Products. Please select the source(s) of information you are mostlikely to use to obtain information about this product type. Please mark all that apply.”(b)Q13_2: “Now, please think only about Home Appliances/Lighting/Home Electronics. Please select the source(s) ofinformation you are most likely to use to obtain information about this product type. Please mark all that apply.”
THE CADMUS GROUP, INC.
Page 23
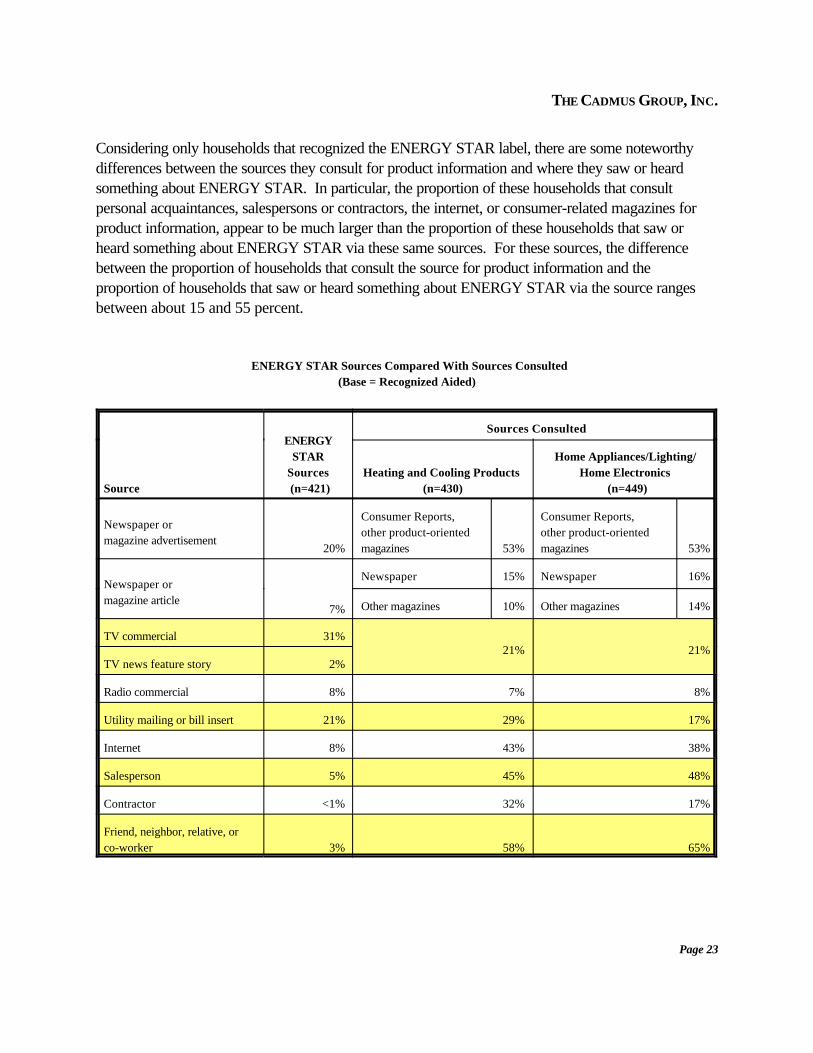
Considering only households that recognized the ENERGY STAR label, there are some noteworthydifferences between the sources they consult for product information and where they saw or heardsomething about ENERGY STAR. In particular, the proportion of these households that consultpersonal acquaintances, salespersons or contractors, the internet, or consumer-related magazines forproduct information, appear to be much larger than the proportion of these households that saw orheard something about ENERGY STAR via these same sources. For these sources, the differencebetween the proportion of households that consult the source for product information and theproportion of households that saw or heard something about ENERGY STAR via the source rangesbetween about 15 and 55 percent.
ENERGY STAR Sources Compared With Sources Consulted(Base = Recognized Aided)
Source
ENERGYSTAR
Sources (n=421)
Sources Consulted
Heating and Cooling Products (n=430)
Home Appliances/Lighting/Home Electronics
(n=449)
Newspaper or magazine advertisement
20%
Consumer Reports,other product-orientedmagazines 53%
Consumer Reports,other product-orientedmagazines
53%
Newspaper or magazine article
7%
Newspaper 15% Newspaper 16%
Other magazines 10% Other magazines 14%
TV commercial 31%21% 21%
TV news feature story 2%
Radio commercial 8% 7% 8%
Utility mailing or bill insert 21% 29% 17%
Internet 8% 43% 38%
Salesperson 5% 45% 48%
Contractor <1% 32% 17%
Friend, neighbor, relative, orco-worker 3% 58% 65%
THE CADMUS GROUP, INC.
Page A-1
APPENDIX A
DETAILED METHODOLOGY
From August through September 2002, the Consortium for Energy Efficiency (CEE) designed andfielded a household survey to obtain information at the national level on consumer awareness of theENERGY STAR label. The survey was delivered by WebTV and was similar to last year’s WebTVsurvey. As in the previous two years, CEE and participating members made the survey data publiclyavailable.
This report discusses the results of the CEE 2002 ENERGY STAR Household Survey, building onprior years’ survey information and focusing on the extent to which consumers recognized theENERGY STAR label, understood its intended messages, and used (or were influenced by) the labelon their energy-related purchase decisions. Research questions of interest included:
• Where do consumers see or hear about the ENERGY STAR label?
• How does increased publicity impact ENERGY STAR label recognition, understanding, andinfluence?
• Which key messages about the ENERGY STAR label are consumers retaining?
• Do consumers demonstrate loyalty to the ENERGY STAR label?
The survey was fielded from September 9 through October 7, 2002.
The remainder of Appendix A discusses the questionnaire design, sampling and weightingmethodologies, and data collection.
1 Questionnaire design
In 2002, CEE conducted the ENERGY STAR survey using a questionnaire designed to be deliveredby WebTV. The 2002 WebTV questionnaire was used in a survey conducted via an interactiveWebTV device in the homes of people who had been randomly recruited and preselected to berepresentative of the population.
The data from this survey may be compared with data collected using the 2001 WebTV questionnaire,for which CEE was also responsible. Sampling for the survey is discussed in Section 2 and datacollection is discussed in Section 3.
THE CADMUS GROUP, INC.
2 The CEE committee plans to continue fielding the WebTV survey in the future in lieu of the mail survey.
Page A-2
The committee had several broad objectives in designing the 2002 questionnaires, including:• To maintain consistency with the CEE 2000 and 2001 mail survey and the 2001 WebTV survey2.
• To fine-tune the questionnaire based on lessons learned from the analysis of the CEE 2000 survey,focusing on achieving the greatest value from the analysis of the CEE 2001 survey.
The 2002 WebTV questionnaire addressed the following:• Respondent recognition of the ENERGY STAR label
• Understanding of, and key messages communicated by, the ENERGY STAR label
• Sources of information about ENERGY STAR
• Products on which respondents have seen the label
• Products that respondents have purchased in the past year
• Products that respondents have purchased on which they have seen the label (or on whosepackaging or instructions they have seen the label)
• Influence of the presence or absence of the label on the purchase decision
• Whether purchases of ENERGY STAR labeled products involved rebates or reduced-ratefinancing
• Likelihood of having purchased ENERGY STAR labeled products in the absence of rebates orreduced-rate financing
• Likely sources of information about product categories
• Demographic questions (most of the demographic questions were not asked in the WebTV survey,because demographic characteristics of the respondents were already on file.)
• Likelihood to recommend ENERGY STAR labeled products to a friend
• Recognition and understanding of the yellow EnergyGuide labelsThe 2002 WebTV questionnaire is very similar to the 2001 WebTV questionnaire. The only differenceis the addition of two questions.
THE CADMUS GROUP, INC.
Page A-3
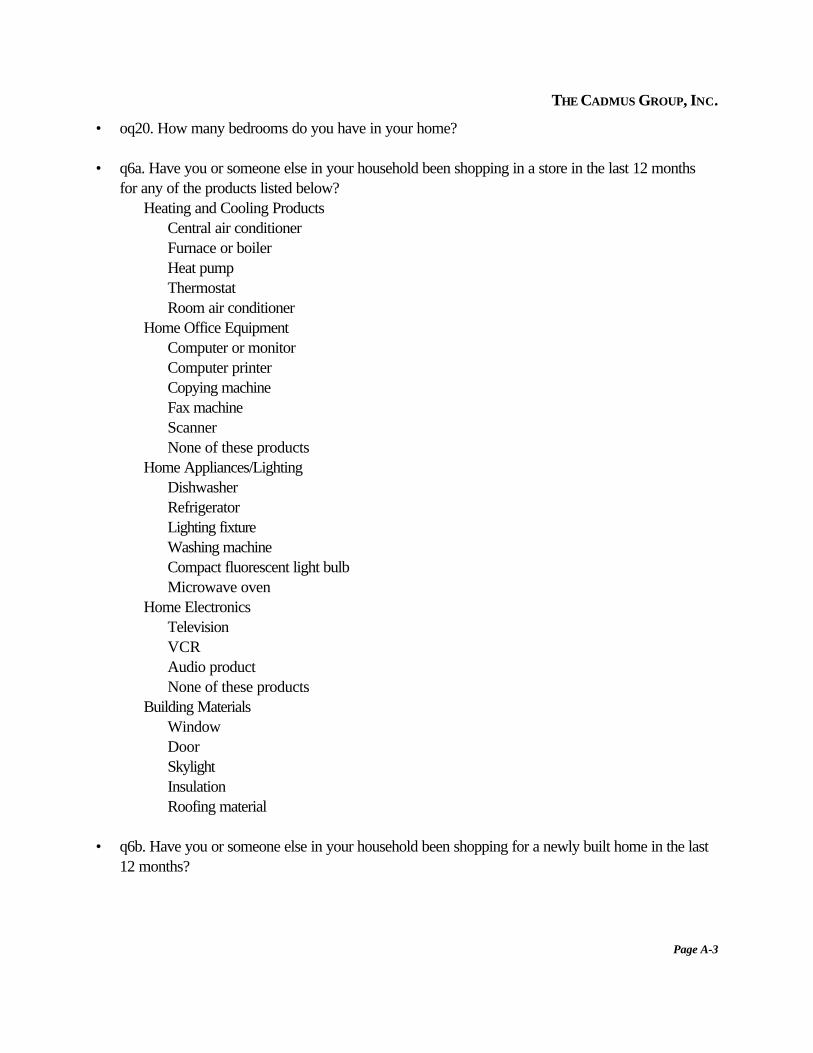
• oq20. How many bedrooms do you have in your home?
• q6a. Have you or someone else in your household been shopping in a store in the last 12 monthsfor any of the products listed below?
Heating and Cooling ProductsCentral air conditionerFurnace or boilerHeat pumpThermostatRoom air conditioner
Home Office EquipmentComputer or monitorComputer printerCopying machineFax machineScannerNone of these products
Home Appliances/LightingDishwasherRefrigeratorLighting fixtureWashing machineCompact fluorescent light bulbMicrowave oven
Home ElectronicsTelevisionVCRAudio productNone of these products
Building MaterialsWindowDoorSkylightInsulationRoofing material
• q6b. Have you or someone else in your household been shopping for a newly built home in the last12 months?

THE CADMUS GROUP, INC.
Page A-4
The interactive format of a WebTV questionnaire allows questions to be asked in a way that is notpossible with a printed questionnaire. On printed questionnaires respondents can see questions inadvance. For example, while the 2000 and 2001 mail questionnaires begin by showing the ENERGYSTAR label and asking about understanding and whether they recognize it before asking otherquestions, respondents can still potentially educate themselves in a limited way about the ENERGYSTAR label by reading the survey before completing it, affecting their responses. The 2001 and 2002WebTV questionnaires (after questions about the yellow EnergyGuide label), however, askrespondents—without showing the label—whether they have ever seen or heard of the ENERGYSTAR label. Responses to this question should thus be comparable to those obtained through atelephone survey.
The WebTV questionnaire then shows the ENERGY STAR label (which is obviously not possible withthe telephone questionnaire) and asks about understanding and recognition. Responses to this questionshould thus be comparable to those obtained through the 2001 mail survey. Other differences betweenthe mail questionnaires and the WebTV questionnaire are that the latter—much like a telephonequestionnaire using computer-assisted telephone interviewing (CATI)—can program lines of questionsbased on responses to earlier questions. For example, WebTV respondents who say they have boughta given product in the past year can then be asked whether that specific product (or its packaging orinstructions) had the ENERGY STAR label.
2 Sampling
2.1 Designated Marketing Areas Publicity Categories
The same publicity classification procedure used last year was used this year. In both 2001 and 2002,a Nielsen Designated Marketing Area ®(DMA) was classified as high publicity, low publicity, or otherusing the following criteria:
• High publicity: At least two recent years of sustained promotions and publicity from non-federalactivities
• Low publicity: Federal campaign activities only and no significant regional program sponsoractivities
• Other: All other DMAs

THE CADMUS GROUP, INC.
3 During the September 2001 to September 2002 period, EPA launched the first of three new television national PublicService Announcements (PSAs) as part of its Change campaign. The Change campaign also included continued distributionof several radio and print PSAs as a component of its overall outreach strategy.
Page A-5
This classification procedure identifies three publicity categories and provides clear and verifiabledefinitions. The key working definitions are:
— Recent: The two years of activity must include the time of the survey fielding— Sustained: The two years of activity must be continuous— Significant: In addition to any direct federal publicity efforts3, publicity efforts must include a
deliberate and multifaceted regional program sponsor investment in ENERGY STARprogramming, such as direct marketing and promotional efforts
These definitions are sufficiently operational to be applicable to future survey efforts, and can bemodified by simply increasing the duration of sustained high publicity. The publicity-level assignmentsare detailed in the table below, followed by a table of supplemental CEE member sponsor areas.
Top 57 Designated Market Areas (Excluding Sponsor Area)
RankDesignated Market Area
(DMA)
# TV Households2002-2003
NOT in Sponsor Area% of US TVHouseholds
PublicityCategory
1 New York 7,282,320 6.8% High2 Los Angeles 5,318,040 5.0% High3 Chicago 3,351,330 3.1% Other4 Philadelphia 2,830,470 2.7% Other5 San Francisco-Oak-San Jose 2,436,220 2.3% High6 Boston (Manchester) 411,207 2.2% High7 Dallas-Ft. Worth 2,195,540 2.1% Other8 Washington, DC (Hagerstown) 2,169,230 2.0% Other9 Atlanta 1,971,180 1.8% Low10 Detroit 1,899,910 1.8% Other11 Houston 1,814,140 1.7% Other12 Seattle-Tacoma 1,659,100 1.6% High13 Tampa-St. Pete (Sarasota) 1,620,110 1.5% Low14 Minneapolis-St. Paul 1,594,740 1.5% Other15 Cleveland-Akron (Canton) 1,528,840 1.4% Other16 Phoenix 1,524,130 1.4% Other17 Miami-Ft. Lauderdale 1,486,860 1.4% Other18 Denver 1,366,250 1.3% Other19 Sacramnto-Stktn-Modesto 1,227,600 1.2% High20 Orlando-Daytona Bch-Melbrn 1,224,470 1.1% Low21 Pittsburgh 1,165,660 1.1% Other22 St. Louis 1,156,370 1.1% Other

THE CADMUS GROUP, INC.
RankDesignated Market Area
(DMA)
# TV Households2002-2003
NOT in Sponsor Area% of US TVHouseholds
PublicityCategory
Page A-6
23 Portland, OR 1,061,080 1.0% High24 Baltimore 1,060,450 1.0% Other25 Indianapolis 1,019,870 1.0% Other26 San Diego 1,004,220 0.9% High27 Hartford & New Haven 980,410 0.9% High28 Charlotte 962,540 0.9% Low29 Raleigh-Durham (Fayetvlle) 929,460 0.9% Low30 Nashville 880,670 0.8% Low31 Milwaukee 860,350 0.8% High32 Cincinnati 854,250 0.8% Low33 Kansas City 852,510 0.8% Other34 Columbus, OH 835,780 0.8% Other35 Greenvll-Spart-Ashevll-And 792,110 0.7% Low36 Salt Lake City 769,230 0.7% Other37 San Antonio 718,730 0.7% Low38 Grand Rapids-Kalmzoo-B.Crk 713,800 0.7% Other39 West Palm Beach-Ft. Pierce 700,850 0.7% Low40 Birmingham (Ann and Tusc) 690,030 0.6% Low41 Norfolk-Portsmth-Newpt Nws 677,610 0.6% Low42 New Orleans 658,830 0.6% Low43 Memphis 653,840 0.6% Low44 Buffalo 639,190 0.6% High45 Oklahoma City 636,970 0.6% Low46 Greensboro-H.Point-W.Salem 634,140 0.6% Low47 Harrisburg-Lncstr-Leb-York 626,660 0.6% Other48 Providence-New Bedford 411,482 0.6% High49 Albuquerque-Santa Fe 620,230 0.6% Low50 Louisville 612,300 0.6% Other51 Jacksonville, Brunswick 587,200 0.6% Low52 Las Vegas 585,440 0.5% Other53 Wilkes Barre-Scranton 580,290 0.5% Low54 Austin 552,060 0.5% Other55 Albany-Schenectady-Troy 477,032 0.5% High56 Little Rock-Pine Bluff 523,810 0.5% Low 57 Fresno-Visalia 519,330 0.5% High
Total 72,916,471 70.4%
Sponsor Area
Sponsor Area Publicity Category Comments
Massachusetts HighIncludes parts of Albany-Schnectady-Troy DMA (Rank 55):Berkshire County; Boston DMA (Rank 6): Barnstable, Dukes; Essex,Middlesex, Nantucket, Norfolk, Plymouth, Suffolk, and WorcestorCounties; Providence-New Bedford (Rank 48): Bristol County

THE CADMUS GROUP, INC.
4 Neither Alaska or Hawaii contained DMAs ranking 57 or below.
Page A-7
H “High” publicity categoryL “Low” publicity categoryO “Other” publicity category CEE sponsor area
HH
H
H
H
H
H
H
HHH
L
L
L
L
L
LL
L L
L
LL
L
L L
L
L L
L
LL
L
L
LL
L
O
O
O
O
O
O
O
OO
OO
OO
O
O
OO
O
H
HH
H
H
H
H
H
H
HHH
L
L
L
L
L
LL
L L
L
LL
L
L L
L
L L
L
LL
L
L
LL
L
O
O
O
O
O
O
O
OO
OO
OO
O
O
OO
O
H
Map of Top 57 Designated Market Areas(DMAs) by Publicity Category4

THE CADMUS GROUP, INC.
Page A-8
2.2 Sample Design
The sample is a national sample. The sampling frame is all households in the largest DMAs that accountfor approximately 70 percent of U.S. television households. In 2002, the 57 largest DMAs account forapproximately 70 percent of U.S. television households. In addition, one CEE member sponsoredmore intensive sampling (an oversample) for their state. This state is referred to as a “sponsor area.” For the sponsor area, the frame was not limited to the large DMAs, but included the entire state. Thus,the complete frame for the study was the combination of the largest DMAs and any portion of thesponsor areas that fell outside these DMAs.
The sample is stratified by publicity category and sponsor area. The three publicity categories and onesponsor area result in four strata. Households in the largest and parts of the largest DMAs that are notin the sponsor area were assigned to one of the publicity category strata. Households in the sponsorarea were assigned to the sponsor area stratum.
Each publicity category was allocated approximately 266 sampling points. The CEE member whofunded the oversample for their sponsor area determined the number of sampling points allocated totheir stratum. A larger sample was selected to receive the survey to allow for nonresponse.
2.3 Weighting Procedures
The weights employed in the analysis are the weights developed by Knowledge Networks, thecompany that provides the WebTV survey service, multiplied by the standard sampling weights. Within each stratum, Knowledge Networks calculates weights to account for differences in the WebTVpanel from the study population and survey nonresponse. That is, the WebTV weights incorporatepost-stratification to account for underlying differences between the recruited panel and the studypopulation, as well as differences in response rates for this particular survey. Both of these adjustmentsare based on geographic and demographic characteristics known for both the population and the panel. These weights are designed to scale up the under-represented groups and scale down the over-represented groups.
The weights provided by Knowledge Networks correct for disproportionate representation within astratum, but do not correct for having higher (lower) overall sampling rates in one stratum than inanother. Therefore, an additional weighting factor is needed to correct for the relative proportions ofthe sampling strata. The additional weighting factor is the ratio of population size to sample size in astratum, that is, the standard sampling weight.

THE CADMUS GROUP, INC.
Page A-9
3 Data Collection
3.1 Survey Implementation
The survey was deployed on September 9 and closed on October 7, 2002.
3.2 Response Rates
For WebTV, the return rate is the ratio of the number completed to the number of panel memberswho were asked to complete the survey. While this number is quite high, it must be adjusted by therecruitment rate, that is, the number of households that agreed to participate in the WebTV panel, as aproportion of the number of households asked to participate. Thus, the WebTV response rate is theproduct of the return rate and the recruitment rate. This product is equivalent to the ratio of the numberof surveys completed to the number of households that were offered the opportunity to be in the study. The WebTV response rate was 42 percent (based on the same recruitment rate as last year, 56percent). This level of response is usual for a WebTV survey.
Survey Response Rate
# Households
Sendout/Requested 1,541
Completed 1,168
Return Rate (Total) 76%
Recruitment Rate 56%
Response Rate 42%

THE CADMUS GROUP, INC.
Page B-1
APPENDIX B
DEMOGRAPHICS The analysis presented in this appendix suggests the weighted survey results are a reasonablerepresentation of the study population, which are all U.S. households. Professional survey and datacollection firms make significant efforts to ensure the rigor of their methods and to produce the highestquality results. However, in any survey effort, the persons who respond to the survey tend to bedifferent from those who do not respond. While Knowledge Networks, the company that maintains theWebTV panel, strives to create a representative panel for its WebTV frame, the respondent base willcontain subjects and their associated biases that are receptive to the WebTV incentive for service tradeoff.
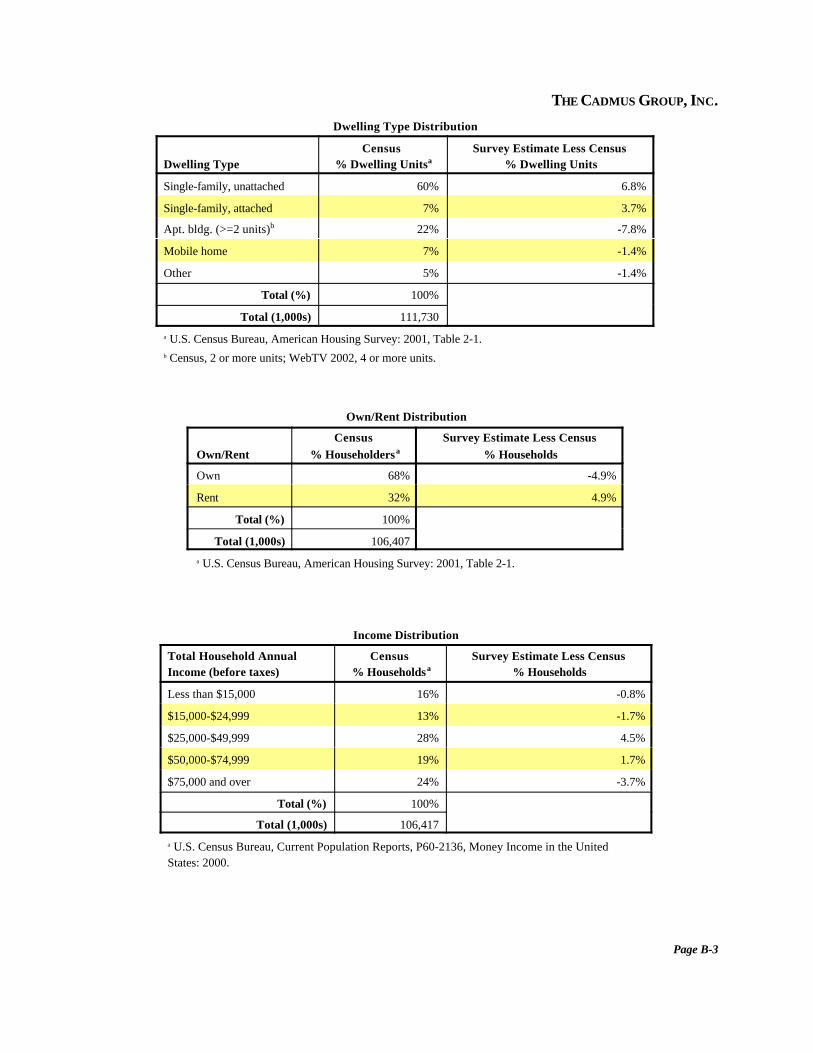
The weights employed in the analysis attempt to account for survey nonresponse and differences in theWebTV panel from the study population. To the extent this effort is successful, the distribution ofvarious demographic characteristics based on the weighted survey data will be similar to the distributionbased on national Census data. For most demographic characteristics, the two distributions are similar. This suggests the weighted survey results are a reasonable representation of the study population. Asummary of the demographic characteristics compared is provided in the table below and the detailedcomparisons are provided in the tables at the end of this appendix.
Summary of Distribution Comparisons
Demographic CharacteristicLargest Difference (Absolute Value):
Survey Estimate Less Census %
Householder/respondent age 75 or older -6.4%
Household annual income $25,000-$49,999 4.5%
Number of persons in household One -11.4%
Householder/respondent gender Female 0.6%
Dwelling type Apt. bldg. -7.8%
Own/rent Rent 4.9%
The largest differences (in absolute value) between the weighted survey data and the national Censusdata concern the number of persons in a household and dwelling type. One-person households are 15percent of households in the weighted survey data compared with 26 percent of U.S. households, for adifference of 11 percent. Households living in apartment buildings are 14 percent of households in theweighted survey data compared with 22 percent of U.S. households, for a difference of about 8percent. Neither the under representation of one-person households nor households living in apartmentbuildings is expected to bias the survey results in a particular direction. For the remaining demographiccharacteristics, the largest differences between the weighted survey data and the national Census datarange between 1 and 6 percent.

THE CADMUS GROUP, INC.
Page B-2
Household Size Distribution
Number of Persons in Household
Census% Dwelling Unitsa
Survey Estimate Less Census % Dwelling Units
One 27% -11.4%
Two 33% 5.5%Three 16% 3.4%Four 15% 0.3%Five or more 10% 2.2%
Total 100%
a U.S. Census Bureau, American Housing Survey: 2001, Table 2-9.
Age Distribution
Householder/Respondent Age
Census % Householdersa
Survey Estimate Less Census % Householders
24 or youngerb 6% 5.1%
25-34 18% 2.0%
35-44 23% 0.6%
45-54 20% 1.5%
55-64 13% -2.6%
65-74 10% -0.3%
75 or older 10% -6.4%
Total (%) 100%
Total (1,000s) 106,407
a U.S. Census Bureau, American Housing Survey: 2001, Table 2-9.b Census, 24 or younger; WebTV 2002, 18-24.
Gender Distribution
Householder/RespondentGender
Census % Householdersa
Survey Estimate Less Census %Householders
Female 51% 0.6%
Male 49% -0.6%
Total (%) 100%
Total (1,000s) 281,422
a U.S. Census Bureau, Census 2000.
THE CADMUS GROUP, INC.
Page B-3
Dwelling Type Distribution
Dwelling TypeCensus
% Dwelling UnitsaSurvey Estimate Less Census
% Dwelling Units
Single-family, unattached 60% 6.8%
Single-family, attached 7% 3.7%
Apt. bldg. (>=2 units)b 22% -7.8%
Mobile home 7% -1.4%
Other 5% -1.4%
Total (%) 100%
Total (1,000s) 111,730a U.S. Census Bureau, American Housing Survey: 2001, Table 2-1.b Census, 2 or more units; WebTV 2002, 4 or more units.
Own/Rent Distribution
Own/RentCensus
% HouseholdersaSurvey Estimate Less Census
% Households
Own 68% -4.9%
Rent 32% 4.9%
Total (%) 100%
Total (1,000s) 106,407a U.S. Census Bureau, American Housing Survey: 2001, Table 2-1.
Income Distribution
Total Household Annual Income (before taxes)
Census % Householdsa
Survey Estimate Less Census % Households
Less than $15,000 16% -0.8%
$15,000-$24,999 13% -1.7%
$25,000-$49,999 28% 4.5%
$50,000-$74,999 19% 1.7%
$75,000 and over 24% -3.7%
Total (%) 100%
Total (1,000s) 106,417a U.S. Census Bureau, Current Population Reports, P60-2136, Money Income in the UnitedStates: 2000.

THE CADMUS GROUP, INC.
Page C-1
APPENDIX C
2002 CEE WebTV QUESTIONNAIRE - final version, 9/06/02
EG1. Have you ever seen or heard of yellowstickers called EnergyGuide labels?
EG2.What information does the EnergyGuide label provide?
ES1. Have you ever seen or heard of theENERGY STAR label?
ES2.What does the ENERGY STAR labelmean to you?
Yes
No Don’t Know
Yes
ES3.Is this the label you have seen or heardof before? [SHOW LABEL]
No Don’t Know

THE CADMUS GROUP, INC.
Page C-2
ES6.Now that you have had the opportunity tosee the ENERGY STAR label, do you recallseeing or hearing anything about it beforethis survey?
ES4a1.Please look at the ENERGY STAR label onthe left. Type the messages that come tomind when you see the ENERGY STARlabel. [SHOW LABEL]
No Don’t Know
SO1.
Where did you see or hear something aboutENERGY STAR? Please mark all that apply.[checkbox]
• Newspaper or magazine advertisement• Newspaper or magazine article• TV commercial• TV news feature story • Radio commercial • Billboard • Utility mailing or bill insert• Direct mail or circular advertisement• Labels on appliances or electronic
equipment• Yellow EnergyGuide label• Displays in stores• Internet• Salesperson• Contractor• Friend, neighbor, relative, or co-worker• Other (please specify) [text box]• Don't know
Yes
Skip to Q6a
THE CADMUS GROUP, INC.
Page C-3
SO2.What did you see or hear aboutENERGY STAR? Please be specific.
Go to Q5a
THE CADMUS GROUP, INC.
Page C-4
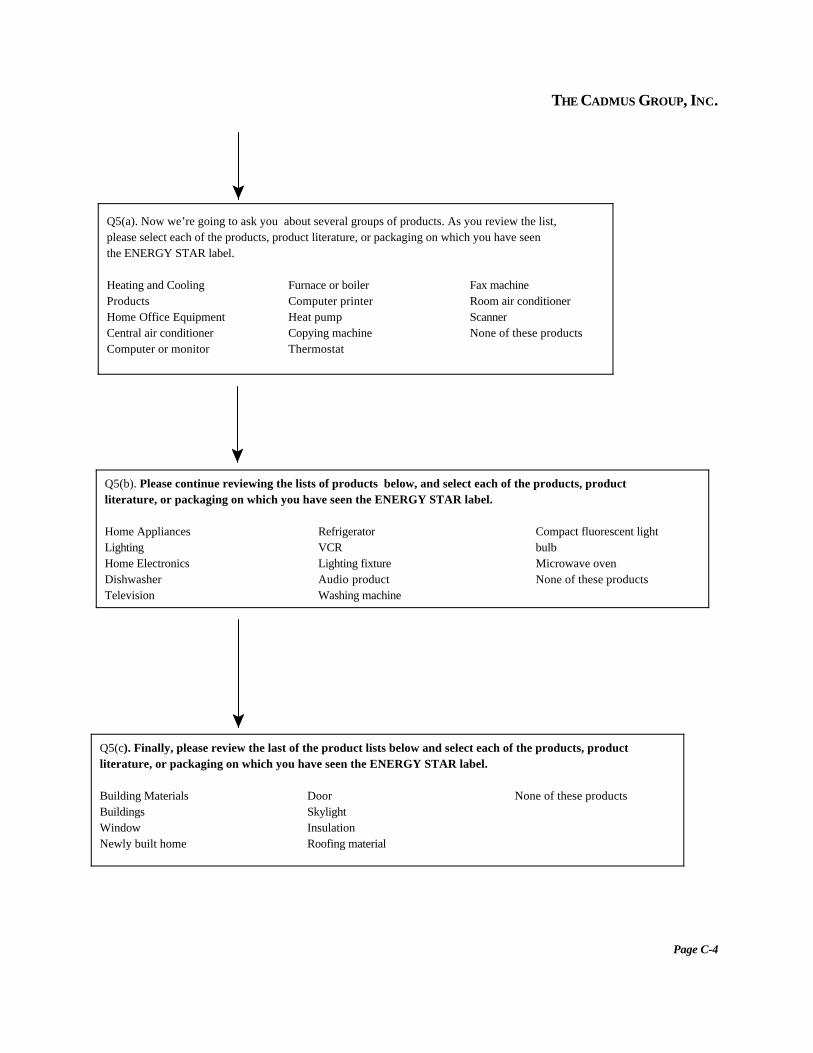
Q5(a). Now we’re going to ask you about several groups of products. As you review the list,please select each of the products, product literature, or packaging on which you have seenthe ENERGY STAR label.
Heating and CoolingProductsHome Office Equipment Central air conditionerComputer or monitor
Furnace or boilerComputer printer Heat pumpCopying machine Thermostat
Fax machine Room air conditioner Scanner None of these products
Q5(b). Please continue reviewing the lists of products below, and select each of the products, productliterature, or packaging on which you have seen the ENERGY STAR label. Home AppliancesLighting Home Electronics Dishwasher Television
RefrigeratorVCR Lighting fixtureAudio product Washing machine
Compact fluorescent lightbulbMicrowave oven None of these products
Q5(c). Finally, please review the last of the product lists below and select each of the products, productliterature, or packaging on which you have seen the ENERGY STAR label. Building Materials Buildings WindowNewly built home
DoorSkylightInsulationRoofing material
None of these products
THE CADMUS GROUP, INC.
Page C-5
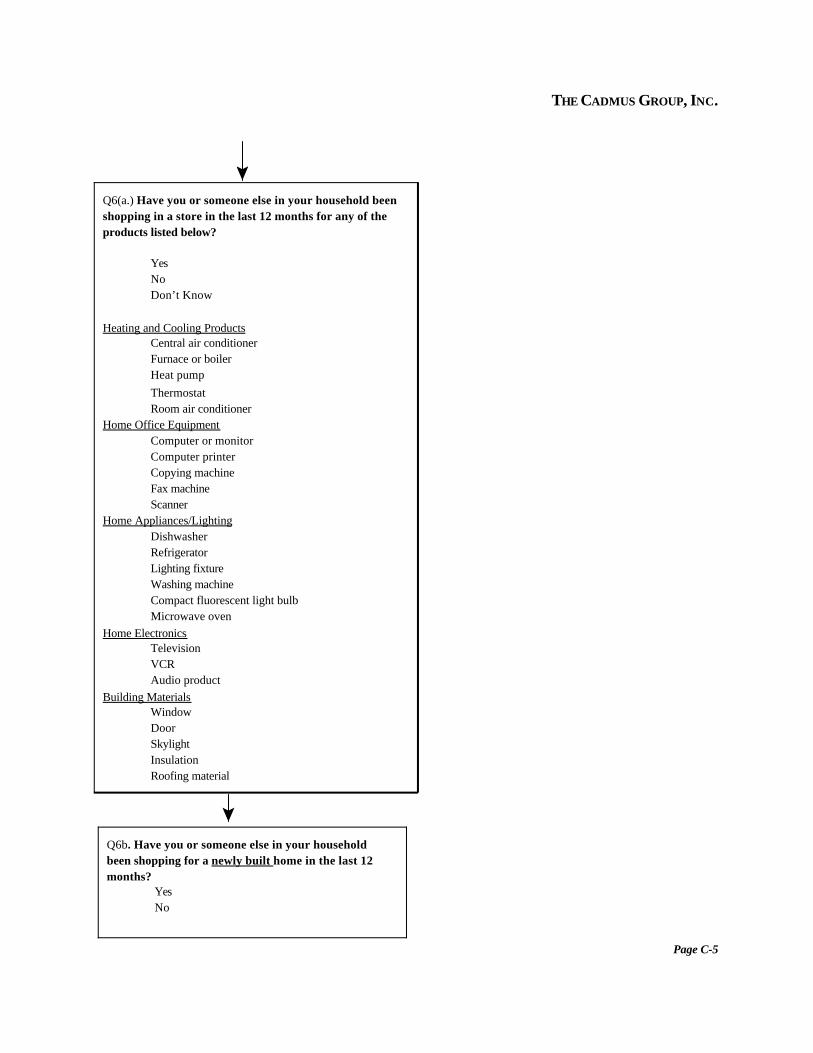
Q6(a.) Have you or someone else in your household beenshopping in a store in the last 12 months for any of theproducts listed below?
YesNoDon’t Know
Heating and Cooling ProductsCentral air conditionerFurnace or boilerHeat pumpThermostatRoom air conditioner
Home Office EquipmentComputer or monitorComputer printerCopying machineFax machineScanner
Home Appliances/LightingDishwasherRefrigeratorLighting fixtureWashing machineCompact fluorescent light bulbMicrowave oven
Home ElectronicsTelevisionVCRAudio product
Building MaterialsWindowDoorSkylightInsulationRoofing material
Q6b. Have you or someone else in your householdbeen shopping for a newly built home in the last 12months?
YesNo

THE CADMUS GROUP, INC.
Page C-6
Q12(a). Please look at each of the groups of products again. Which of these products have youpurchased in the last 12 months? Please check all that apply.
Heating and CoolingProductsHome Office Equipment Central air conditioner
Computer or monitorFurnace or boilerComputer printer Heat pump
Copying machine ThermostatFax machineRoom air conditioner
Q12(b). Please continue reviewing the lists of products below. Which of these products have you purchasedin the last 12 months? Please check all that apply. Home Appliances/LightingHome ElectronicsDishwasherTelevisionRefrigerator
VCRLighting fixtureAudio productWashing machineCompact fluorescent light bulb
Microwave oven None of these products
Q12(c). Finally, please review the last of the product lists below. Which of these products have you purchasedin the last 12 months? Please check all that apply.
Building MaterialsBuildingsWindowNewly built homeDoorSkylight
InsulationRoofing materialNone of these products

THE CADMUS GROUP, INC.
Page C-7
Products purchased
Q7a_1 thru Q7a_3. On which products did you see theENERGY STAR label?
(show only the products they checked off in Q12, withoptions to check for each - “Saw label” “Did not seelabel” “Don’t know”)
Q7. For any of the products you purchased, did you see theENERGY STAR label (on the product itself, on thepackaging, or on the instructions)?
Yes “No” or “Don’t Know”(Skip to Q13a)
No products purchased OR ES6=“No” or “Don’t know”: Skip to Q13a

THE CADMUS GROUP, INC.
Page C-8
Q8. For any ENERGY STAR-labeled product(s) you purchased,how much did the presence or absence of the ENERGY STARlabel influence your purchasing decision?
Very much Somewhat Slightly Not at all Don't know
Q9. Did you receive rebates or reduced-rate financing for anyENERGY STAR-labeled product(s) you purchased?
Q10. If rebates or reduced-rate financing had not been available,how likely is it that you would have purchased the ENERGYSTAR-labeled product? Very likely Somewhat likely Slightly likely Not at all likely Don't know
Yes “No” or “Don’t Know”(Skip to Q11)

THE CADMUS GROUP, INC.
Page C-9
Go to demographic and closing questions.
Q11. How likely are you to recommend ENERGY STAR-labeled products to a friend?
Very likely Somewhat likely Slightly likely Not at all likely Don't know
Q13a. Now, please think only about Heating and Cooling Products. Please select the source(s) of informationyou are most likely to use to obtain information about this product type. Please mark all that apply.
Heating and Cooling Products Consumer Reports and other product-orientedmagazinesAdvice from retailers or salespersons Other magazinesAdvice from contractorsNewspapersAdvice from a friend, neighbor, relative, or co-
worker RadioInternet TelevisionOther ______Electric or gas utilityDon't know
Q13b. Now, please think only about Home Appliances / Lighting / Home Electronics. Please select thesource(s) of information you are most likely to use to obtain information about this product type. Please markall that apply. Home Appliances / Lighting / Home Electronics Consumer Reports and other product-oriented magazinesAdvice from retailers or salespersons Other magazinesAdvice from contractors NewspapersAdvice from a friend, neighbor, relative, or co-worker RadioInternet
TelevisionOther ______Electric or gas utilityDon't know