Embed Size (px)
Citation preview

® FOR 2006 NATIONAL AWARENESS OF ENERGY STARANALYSIS OF CEE HOUSEHOLD SURVEY

TABLE OF CONTENTS
Acknowledgements ................................................................................... iiExecutive Summary ............................................................................. ES-1
Introduction ................................................................................................ 1
Methodology Overview.............................................................................. 2
Key Findings...............................................................................................5
Recognition.................................................................................................................. 5Understanding ........................................................................................................... 11Influence .................................................................................................................... 17Information Sources................................................................................................... 22
Appendix A: Detailed Methodology...................................................... A-1
1 Questionnaire Design ............................................................................................... 12 Sampling................................................................................................................... 83 Data Collection ....................................................................................................... 144 National Analysis .................................................................................................... 15
Appendix B: Demographics .................................................................. B-1
Appendix C: ADDITIONAL QUESTIONS FROM 2006 SURVEY .......... C-1
1 ENERGY STAR Designation .................................................................................... 12 ENERGY STAR Product Satisfaction ....................................................................... 33 Consumer Perceptions ............................................................................................. 54 Purchasing Decisions ............................................................................................. 10
Appendix D: 2006 Survey Questions and Flow Chart ........................ D-1
i
ACKNOWLEDGEMENTS
The U.S. Environmental Protection Agency would like to thank the Consortium for Energy Efficiency (CEE) and its members for making its survey data available for this analysis. The following CEE member organizations sponsored the 2006 survey:
• Cape Light Compact • KeySpan Energy Delivery New England • Long Island Power Authority • National Grid USA • New York State Energy Research & Development Authority • New Jersey Board of Public Utilities • Northeast Utilities (WMECO) • Northwest Energy Efficiency Alliance • NSTAR Electric • Pacific Gas & Electric • Sacramento Municipal Utility District • San Diego Gas & Electric • Southern California Edison • United Illuminating • Unitil Corporation • Xcel Energy
In addition, EPA would like to acknowledge, Monica Nevius for her oversight of CEE data collection efforts; and Miriam Goldberg, Ryan Barry, and Kate Dresher of KEMA Inc., and Jocelyn Spielman and Grant Halloran of The Cadmus Group, Inc. for data analysis and report preparation.
Recommended citation:
EPA Office of Air and Radiation, Climate Protection Partnerships Division. National Awareness of ENERGY STAR® for 2006: Analysis of 2006 CEE Household Survey. U.S. EPA, 2007.
ii

EXECUTIVE SUMMARY
In the fall of 2006, members of the Consortium for Energy Efficiency (CEE) sponsored the seventh national household survey of consumer awareness of ENERGY STAR. Each year, the survey objectives have largely been the same: to collect national data on consumer recognition, understanding, and purchasing influence of the ENERGY STAR label, as well as data on messaging and product purchases. CEE members may choose to supplement the national sample in order to assess label awareness in their local service territories. In 2006, additional surveys were conducted in Massachusetts, the Minneapolis-St. Paul Nielsen Designated Market Area® (DMA), New York state (with the exception of Long Island), the Pacific Northwest (Idaho, Montana, Oregon, Washington), and the United Illuminating service territory in southwestern Connecticut. As in the six previous years, CEE and sponsoring members made the survey data publicly available.
This report discusses the results of the CEE 2006 ENERGY STAR Household Survey, building on prior years’ survey results and focusing on the extent to which consumers recognize the ENERGY STAR label, understand its intended messages, and utilize (or are influenced by) the label in their energy-related purchase decisions. Research questions of interest included:
• Where do consumers see or hear about the ENERGY STAR label?
• How does increased publicity impact consumer ENERGY STAR label recognition, understanding, and influence?
• Which key messages about the ENERGY STAR label are consumers retaining?
• Do consumers demonstrate loyalty to the ENERGY STAR label?
Key Findings at the National Level
• Sixty-eight percent of households recognized the ENERGY STAR label when shown the label.
• Seventy-three percent of households had a high or general understanding of the label’s purpose. Furthermore, the proportion of households that demonstrated a general understanding was small compared with the proportion that demonstrated a high understanding (12 percent versus 61 percent).
• Fifty-seven percent of households associated the ENERGY STAR label with “efficiency or energy savings.”
• Of households that recognized the ENERGY STAR label and purchased a product in a relevant product category within the past 12 months, 66 percent purchased an ENERGY STAR-labeled product.
ES-1

• Among all households, 31 percent knowingly purchased an ENERGY STAR-labeled product in the past 12 months.
• For 63 percent of the households that knowingly purchased an ENERGY STAR-labeled product, the label influenced at least one of their purchase decisions “very much” or “somewhat.” For another 16 percent of these households, the label influenced their purchase decisions “slightly.”
• Twenty-six percent of households that knowingly purchased an ENERGY STAR-labeled product received a financial incentive for doing so. Eighty-three percent of these households would have been “very likely” (57 percent) or “somewhat likely” (26 percent) to purchase the labeled product without the financial incentive.
• Seventy-one percent of households that recognized the label and purchased a product in a category where ENERGY STAR-specified products are an option were likely to recommend ENERGY STAR-labeled products to a friend; 29 percent of these households reported they were "extremely" likely to recommend ENERGY STAR-labeled products.
Key Findings from Publicity-Level Analyses
• A larger proportion of households in high- than in low-publicity areas recognized the ENERGY STAR label, both with and without being shown the label. With a visual aid, 76 percent of households in high-publicity areas recognized the label versus 61 percent in low-publicity areas. (High-publicity areas are areas with an active local ENERGY STAR program that has been sponsored by a utility, state agency, or other organization for two or more continuous years.)
• Among households that recognized the ENERGY STAR label (with a visual aid), a larger proportion in high- than in low-publicity areas associated the label with most of the appliances that are heavily promoted by regional program sponsors.
• A larger proportion of households in high- than in low-publicity areas had at least a general understanding of the label.
• Among households that knowingly purchased an ENERGY STAR-labeled product, a larger proportion in high- than in low-publicity areas reported that their purchase decisions were influenced “very much” or “somewhat” by the ENERGY STAR label.
• Considering only households that recognized the label (with a visual aid), a larger proportion of households in high- than in low-publicity areas heard or saw something about ENERGY STAR via store displays, utility mailings or bill inserts, newspaper or magazine advertisements, direct mail or circular advertisements, salespersons, or radio commercials.
ES-2
Conclusions
This seventh national study of household awareness of the ENERGY STAR label confirms key findings from the previous years’ surveys:
• Substantial portions of U.S. households in the surveyed population recognize, understand, and are influenced by the ENERGY STAR label.
• The proportion of households that exhibit only a general understanding of the label is small (12 percent) compared with the proportion of households that exhibit a high understanding (61 percent).
• Publicity efforts of active regional/local energy efficiency program sponsors increase recognition, understanding, and influence of the label.
ES-3
INTRODUCTION
In the fall of 2006, members of the Consortium for Energy Efficiency (CEE) sponsored the seventh national household survey of consumer awareness of ENERGY STAR. Each year, the survey objectives have largely been the same: to collect national data on consumer recognition, understanding, and purchasing influence of the ENERGY STAR label, as well as data on messaging and product purchases. CEE members may choose to supplement the national sample in order to assess label awareness in their local service territories. To this end, in 2006 additional surveys were conducted in Massachusetts, the Minneapolis-St. Paul Nielsen Designated Market Area® (DMA), New York state (with the exception of Long Island), the Pacific Northwest (Idaho, Montana, Oregon, Washington), and the United Illuminating service territory (southwestern Connecticut). As in the six previous years, CEE and sponsoring members made the survey data publicly available.
This report discusses the results of the CEE 2006 ENERGY STAR Household Survey, building on prior years’ survey results and focusing on the extent to which consumers recognize the ENERGY STAR label, understand its intended messages, and utilize (or are influenced by) the label in their energy-related purchase decisions. Research questions of interest included the following:
• Where do consumers see or hear about the ENERGY STAR label?
• How does increased publicity impact consumer ENERGY STAR label recognition, understanding, and influence?
• Which key messages about the ENERGY STAR label are consumers retaining?
• Do consumers demonstrate loyalty to the ENERGY STAR label?
The remainder of this report summarizes the survey and analysis methodology; provides key findings regarding ENERGY STAR label recognition, understanding, influence, and information sources; and contains appendices presenting detailed survey methodology (Appendix A), demographic information (Appendix B), additional questions from the 2006 survey (Appendix C), and a copy of the 2006 questionnaire (Appendix D). The results presented in this report were in all cases weighted to obtain results applicable at the national level (please refer to Appendix A for details on the weighting methodology).
1
METHODOLOGY OVERVIEW
During September 2006, CEE fielded a questionnaire to obtain information at the national level on consumer awareness of the ENERGY STAR label (please refer to Appendix A for a more detailed outline of the survey methodology). A random sample of households that are members of an Internet/WebTV panel was surveyed. Both the Internet/WebTV panel as a whole and the sample of households completing the survey were selected by random digit dial and recruited by telephone. The panel is designed to be representative of the U.S. population.
The questionnaire was similar to the questionnaires CEE fielded in previous years (in the first year, CEE only fielded a paper survey). As in previous years, CEE and its sponsoring members made the survey data publicly available.
The survey was a national survey. The sampling frame for the survey included all households in the largest Nielsen Designated Market Areas® (DMAs) that together accounted for about 70 percent of U.S. television households. In 2006 this encompassed the 57 largest DMAs. In addition, CEE members may sponsor more intensive sampling (i.e., an oversample) in selected localities, referred to here as sponsor areas. In 2006, the sponsor areas were:
• Massachusetts • Minneapolis-St. Paul DMA • New York state (with the exception of Long Island) • Pacific Northwest (Idaho, Montana, Oregon, Washington) • United Illuminating service territory (southwestern Connecticut)
Sponsor areas are not limited to the 57 largest DMAs. Thus, the complete frame for the study was the combination of the largest DMAs and any portion of the sponsor areas that fell outside the 57 largest DMAs.
To facilitate comparisons across years, the national results were based only on data collected from respondents from the 57 largest DMAs. Data collected from respondents not in the 57 largest DMAs, but in a sponsor area, are not included in this analysis. Some of the 57 largest DMAs are also included in the sponsor areas and therefore were oversampled. The data from these respondents (as well as from the other respondents in the 57 largest DMAs) received an appropriate weight in the analysis in order to generate valid national results and facilitate comparison with data from other years.
As in previous years’ studies, the DMAs in the sampling frame were classified by publicity category so that the effect of publicity on national awareness could be considered. The same publicity classification procedure used in the past 5 years was
2
used this year.1 A DMA was classified as high publicity, low publicity, or other using the following criteria:
• High publicity: Active local ENERGY STAR program recently sponsored by a utility, state agency, or other organization for two or more continuous years. The activities must include sustained promotions and publicity from non-federal sources.
• Low publicity: Federal campaign activities only and no significant regional program sponsor activities.
• Other: All other DMAs.
This classification was designed to provide clear and verifiable definitions. The key working definitions are below:
• Recent: The two years of activity must include the time period during which the survey was in the field.
• Sustained: The two years of activity must be continuous.
• Significant: In addition to any direct federal publicity efforts, publicity efforts must include a deliberate and multifaceted regional program sponsor investment in ENERGY STAR programming, such as direct marketing efforts or the creation and distribution of promotional material.
These definitions were constructed to be sufficiently operational to be applicable to future survey efforts; they can be modified by simply increasing the duration of sustained high publicity.
The sample was stratified by area and within an area by publicity category.2 Each sponsor area is also further stratified by large versus non-large DMA3 as well as any stratification requested by the CEE member funding the oversample.4 The CEE members who fund the oversample for a sponsor area determine the total number of sampling points allocated to the sponsor area as a whole.5 This total number of sampling points is then allocated across publicity categories present in a sponsor area proportional to population. Among the top 57 DMAs, for areas located outside the sponsor area, each publicity category was allocated approximately 333 sampling points.
1 Between September 2005 and 2006, 2 of the 57 largest DMAs changed publicity category: Atlanta and New Orleans. Both changed from “Low” to “Other”. 2 Montana was not stratified by publicity category because 98 percent of Montana households are in low-publicity DMAs and the number of sampling points to be allocated across all of Montana was only 35. 3 Idaho was not further stratified by large versus non-large DMA because 93 percent of Idaho households are in non-large DMAs and the number of sampling points to be allocated across all of Idaho was only 65. 4
5 No CEE member funding an oversample requested additional stratification. The CEE member that funded the Pacific Northwest oversample provided allocation of sample points across
states for Idaho, Montana, Oregon, and Washington.
3
This report presents the 2006 survey results at the national level and by publicity category. The publicity category results provide evidence of the effectiveness of EPA’s model for increasing awareness, understanding, and use of ENERGY STAR by supporting regional energy efficiency program sponsors. Results are presented on consumer recognition, understanding, and purchasing influence of the ENERGY STAR label, as well as on messaging, product purchases, and information sources consumers use in their purchasing decisions.
In this report, the following terminology is used in comparing results across years or sub-categories: (1) The term “significant” implies statistical significance. In other words, differences between proportions that are described as “significant” are at least statistically different at the 10-percent level of significance. In some cases, the p-values are given to provide the exact level of statistical significance. (2) Unless stated otherwise, terms such as “smaller,” “larger,” “increase,” or “decrease” refer to changes that are statistically significant at the 10-percent level or better. (3) The term “similar” implies that there is no statistical difference between the results being compared at the 10-percent level of significance. In other words, the difference between the results is within the bounds that would be expected from chance variation in a random sample.
4
KEY FINDINGS
RECOGNITION
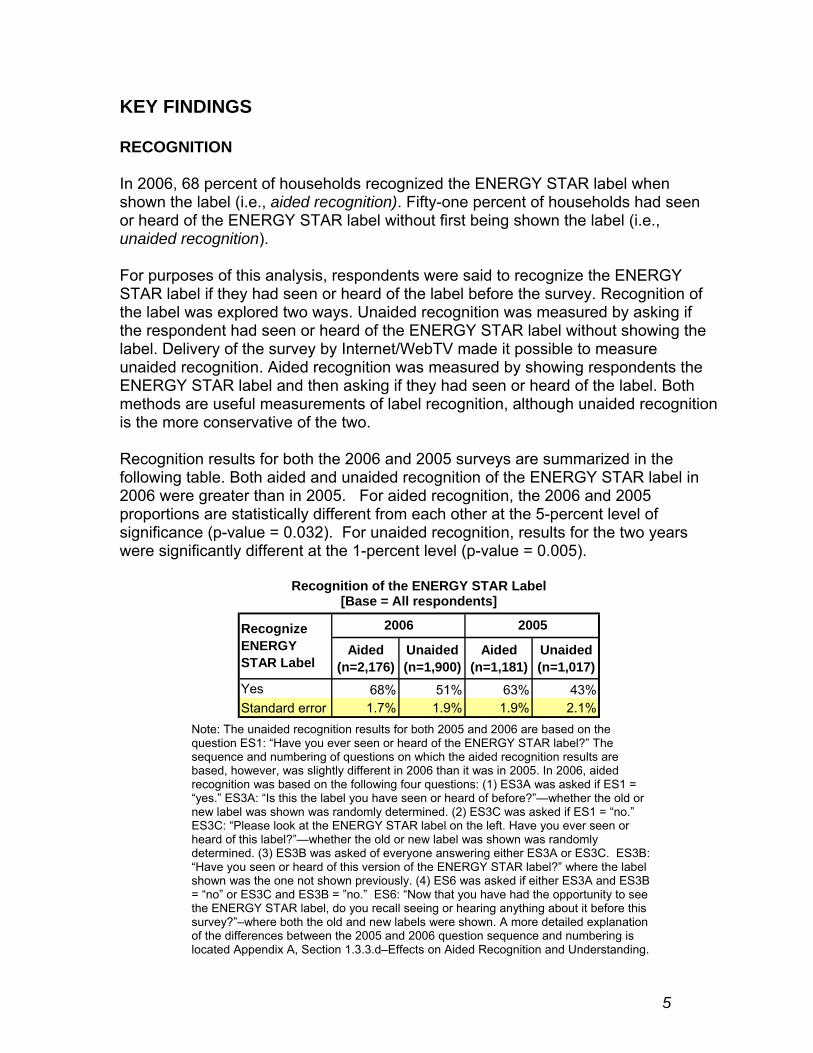
In 2006, 68 percent of households recognized the ENERGY STAR label when shown the label (i.e., aided recognition). Fifty-one percent of households had seen or heard of the ENERGY STAR label without first being shown the label (i.e., unaided recognition).
For purposes of this analysis, respondents were said to recognize the ENERGY STAR label if they had seen or heard of the label before the survey. Recognition of the label was explored two ways. Unaided recognition was measured by asking if the respondent had seen or heard of the ENERGY STAR label without showing the label. Delivery of the survey by Internet/WebTV made it possible to measure unaided recognition. Aided recognition was measured by showing respondents the ENERGY STAR label and then asking if they had seen or heard of the label. Both methods are useful measurements of label recognition, although unaided recognition is the more conservative of the two.
Recognition results for both the 2006 and 2005 surveys are summarized in the following table. Both aided and unaided recognition of the ENERGY STAR label in 2006 were greater than in 2005. For aided recognition, the 2006 and 2005 proportions are statistically different from each other at the 5-percent level of significance (p-value = 0.032). For unaided recognition, results for the two years were significantly different at the 1-percent level (p-value = 0.005).
Recognition of the ENERGY STAR Label [Base = All respondents]
Recognize 2006 2005 ENERGY STAR Label
Aided (n=2,176)
Unaided (n=1,900)
Aided (n=1,181)
Unaided (n=1,017)
Yes Standard error
68% 1.7%
51% 1.9%
63% 1.9%
43% 2.1%
Note: The unaided recognition results for both 2005 and 2006 are based on the question ES1: “Have you ever seen or heard of the ENERGY STAR label?” The sequence and numbering of questions on which the aided recognition results are based, however, was slightly different in 2006 than it was in 2005. In 2006, aided recognition was based on the following four questions: (1) ES3A was asked if ES1 = “yes.” ES3A: “Is this the label you have seen or heard of before?”—whether the old or new label was shown was randomly determined. (2) ES3C was asked if ES1 = “no.” ES3C: “Please look at the ENERGY STAR label on the left. Have you ever seen or heard of this label?”—whether the old or new label was shown was randomly determined. (3) ES3B was asked of everyone answering either ES3A or ES3C. ES3B: “Have you seen or heard of this version of the ENERGY STAR label?” where the label shown was the one not shown previously. (4) ES6 was asked if either ES3A and ES3B = “no” or ES3C and ES3B = ”no.” ES6: “Now that you have had the opportunity to see the ENERGY STAR label, do you recall seeing or hearing anything about it before this survey?”–where both the old and new labels were shown. A more detailed explanation of the differences between the 2005 and 2006 question sequence and numbering is located Appendix A, Section 1.3.3.d–Effects on Aided Recognition and Understanding.
5
Recognition by Publicity Category
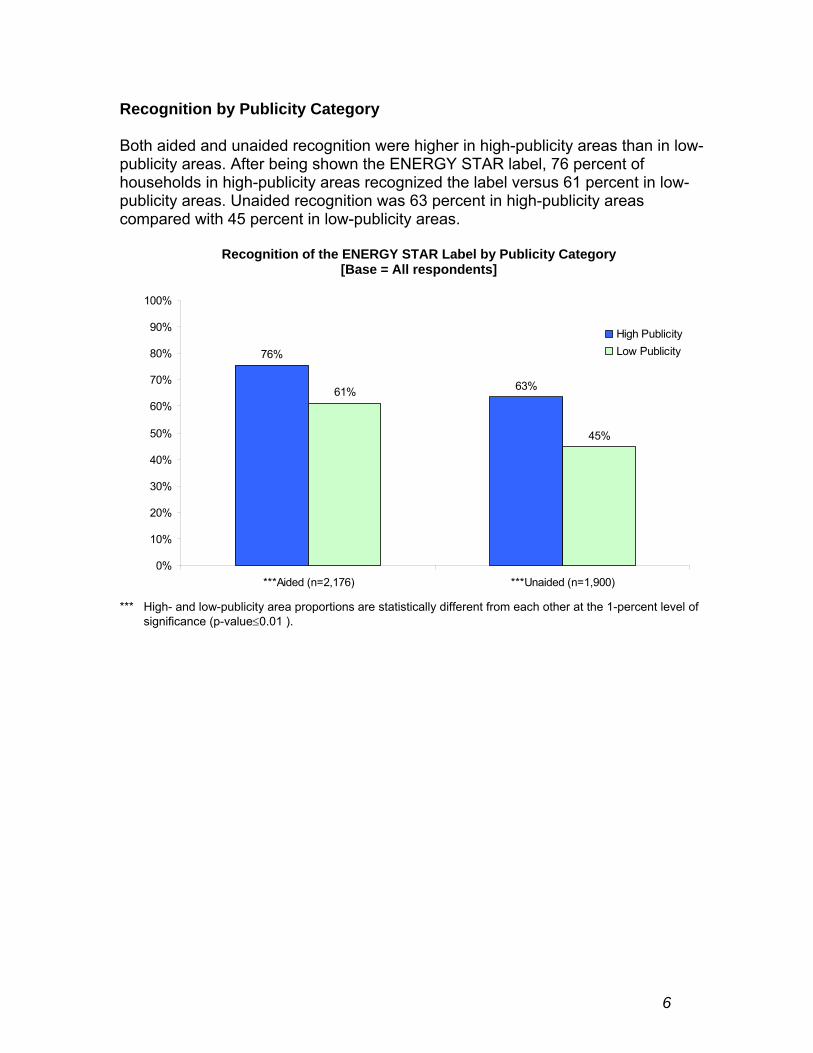
Both aided and unaided recognition were higher in high-publicity areas than in low-publicity areas. After being shown the ENERGY STAR label, 76 percent of households in high-publicity areas recognized the label versus 61 percent in low-publicity areas. Unaided recognition was 63 percent in high-publicity areas compared with 45 percent in low-publicity areas.
Recognition of the ENERGY STAR Label by Publicity Category [Base = All respondents]
100%
90% High Publicity
80% Low Publicity 76%
70% 63% 61%60%
50% 45%
40%
30%
20%
10%
0%
***Aided (n=2,176) ***Unaided (n=1,900)
*** High- and low-publicity area proportions are statistically different from each other at the 1-percent level of significance (p-value≤0.01 ).
6

Product Associations
Households who recognized the ENERGY STAR label indicate strong association between products supported by regional energy efficiency programs (refrigerators, washing machines, dishwashers, compact fluorescent light bulbs, etc.) and the ENERGY STAR label. Seventy-four percent of households had seen the label on refrigerators. At about 60 percent, washing machines and dishwashers were the products next most commonly associated with the ENERGY STAR label. Room and central air conditioners followed with percentages in the mid to low 40s. Thirty-four percent of households associated microwave ovens with the ENERGY STAR label, although they do not in fact have an ENERGY STAR specification (although of all appliances, microwave ovens were the least often associated with the label). Products that showed a significant increase in association with the ENERGY STAR label from 2005 to 2006 were compact fluorescent light bulbs and light fixtures.
Product Association with the ENERGY STAR Label [Base = Recognize label (aided)6]
Ref rigerator
Washing machine
Dishw asher
Central A/C
Room air conditioner
Computer or monitor
9%
9%
12%
12%
13%
17%
19%
29%
34%
37%
37%
45%
58%
63%
74%
10%
10%
11%
13%
15%
17%
21%
22%
29%
43%
Window
Microw ave oven
Furnace/boiler
Television
luorescent light bulb
New ly built home
Door
**Lighting fixture
Insulation
Heat pump
Computer printer
Thermostat
Copying machine
VCR
Skylight
A udio product
Scanner
Fax machine
Roofing material
**Compact f
0% 10% 20% 30% 40% 50% 60% 70% 80% 90% 100%
Note: Q5(a, b, and c): “Now we’re going to ask you about several groups of products. As you review the list, please select each of the products, product literature, or packaging on which you have seen the ENERGY STAR label.” ** 2006 and 2005 proportions are statistically different from each other at the 5-percent level of significance (p-
value≤0.05). The proportion of households in 2006 is larger than in 2005.
6 Respondents were asked about three sets of product groupings: (1) Heating and Cooling Products and Home Office Equipment, (2) Home Appliances/Lighting and Home Electronics, and (3) Building Materials and Buildings. The sample size, n, for each of these sets of product groupings is 1,524; 1,503; and 1,445; respectively.
7
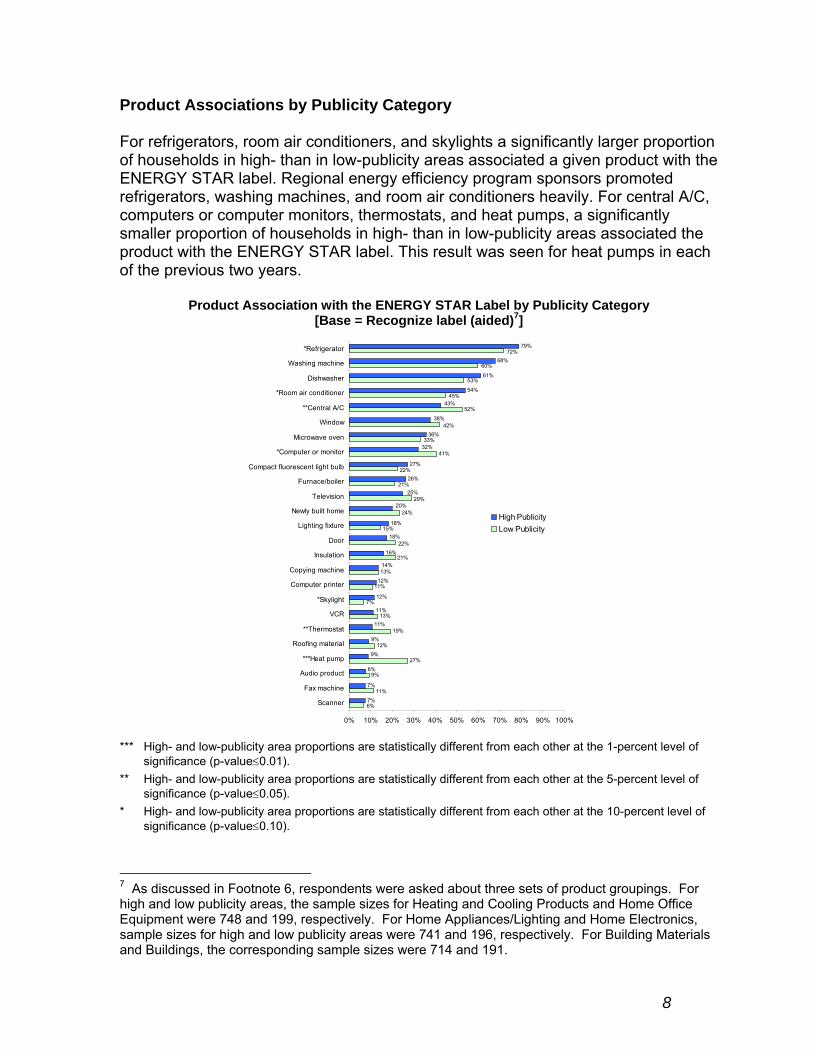
Product Associations by Publicity Category
For refrigerators, room air conditioners, and skylights a significantly larger proportion of households in high- than in low-publicity areas associated a given product with the ENERGY STAR label. Regional energy efficiency program sponsors promoted refrigerators, washing machines, and room air conditioners heavily. For central A/C, computers or computer monitors, thermostats, and heat pumps, a significantly smaller proportion of households in high- than in low-publicity areas associated the product with the ENERGY STAR label. This result was seen for heat pumps in each of the previous two years.
Product Association with the ENERGY STAR Label by Publicity Category [Base = Recognize label (aided)7]
*Refrigerator
Washing machine
Dishwasher
*Room air conditioner
**Central A/C
Window
Microwave oven
*Computer or monitor
Compact fluorescent light bulb
Furnace/boiler
Television
Newly built home
Lighting fixture
Door
Insulation
Copying machine
Computer printer
*Skylight
VCR
**Thermostat
Roofing material
***Heat pump
Audio product
Fax machine
Scanner
9%
7%
7%
54%
79%
6%
7%
15%
42%
53%
8%
9%
9%
20%
Hi icil
27%
12%
19%
13%
11%
13%
24%
41%
52%
12%
16%
18%
26%
27%
36%
61%
68%
11%
21%
22%
29%
21%
22%
33%
45%
60%
72%
11%
11%
12%
14%
18%
25%
32%
38%
43%
gh Publ ty Low Pub icity
0% 10% 20% 30% 40% 50% 60% 70% 80% 90% 100%
*** High- and low-publicity area proportions are statistically different from each other at the 1-percent level of significance (p-value≤0.01).
** High- and low-publicity area proportions are statistically different from each other at the 5-percent level of significance (p-value≤0.05).
* High- and low-publicity area proportions are statistically different from each other at the 10-percent level of significance (p-value≤0.10).
As discussed in Footnote 6, respondents were asked about three sets of product groupings. For high and low publicity areas, the sample sizes for Heating and Cooling Products and Home Office Equipment were 748 and 199, respectively. For Home Appliances/Lighting and Home Electronics, sample sizes for high and low publicity areas were 741 and 196, respectively. For Building Materials and Buildings, the corresponding sample sizes were 714 and 191.
8
7
Product Associations Unprompted
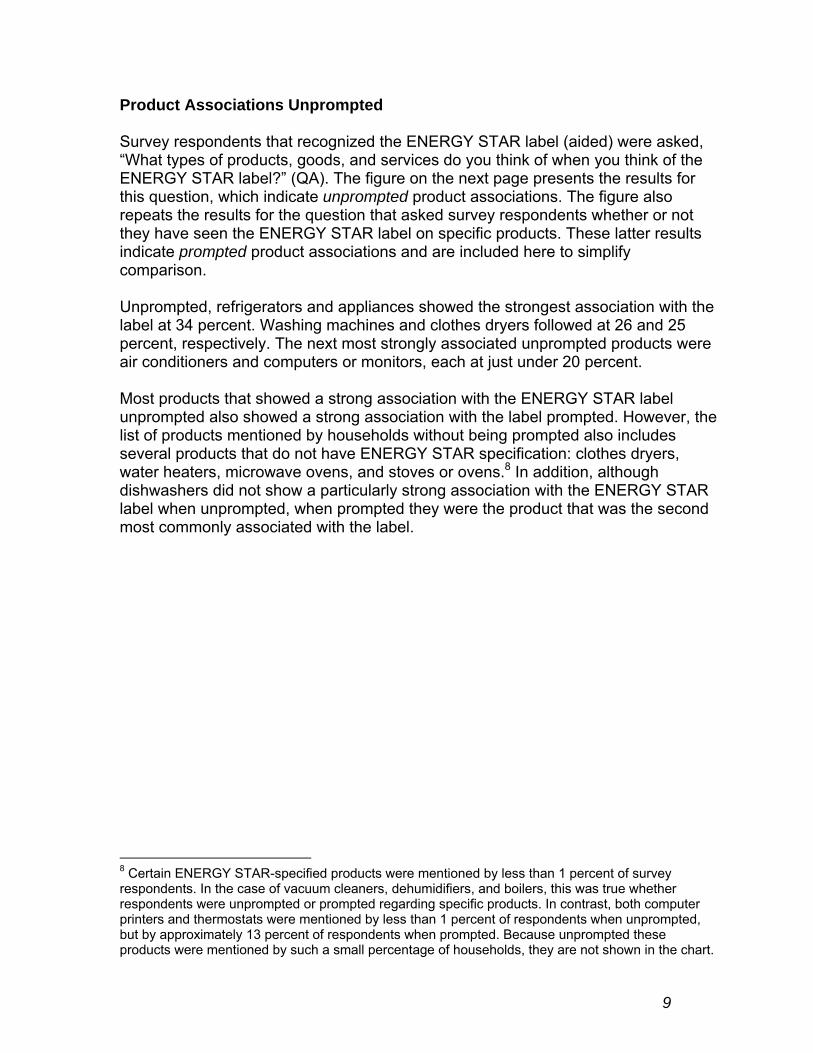
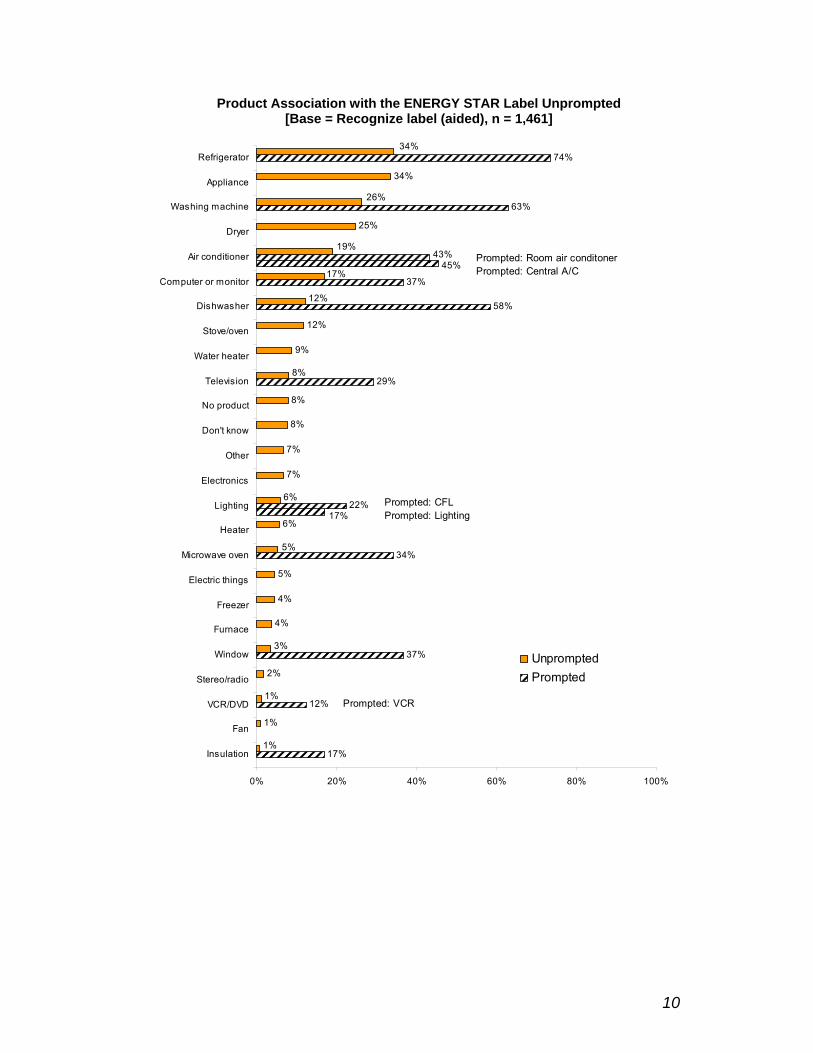
Survey respondents that recognized the ENERGY STAR label (aided) were asked, “What types of products, goods, and services do you think of when you think of the ENERGY STAR label?” (QA). The figure on the next page presents the results for this question, which indicate unprompted product associations. The figure also repeats the results for the question that asked survey respondents whether or not they have seen the ENERGY STAR label on specific products. These latter results indicate prompted product associations and are included here to simplify comparison.
Unprompted, refrigerators and appliances showed the strongest association with the label at 34 percent. Washing machines and clothes dryers followed at 26 and 25 percent, respectively. The next most strongly associated unprompted products were air conditioners and computers or monitors, each at just under 20 percent.
Most products that showed a strong association with the ENERGY STAR label unprompted also showed a strong association with the label prompted. However, the list of products mentioned by households without being prompted also includes several products that do not have ENERGY STAR specification: clothes dryers, water heaters, microwave ovens, and stoves or ovens.8 In addition, although dishwashers did not show a particularly strong association with the ENERGY STAR label when unprompted, when prompted they were the product that was the second most commonly associated with the label.
Certain ENERGY STAR-specified products were mentioned by less than 1 percent of survey respondents. In the case of vacuum cleaners, dehumidifiers, and boilers, this was true whether respondents were unprompted or prompted regarding specific products. In contrast, both computer printers and thermostats were mentioned by less than 1 percent of respondents when unprompted, but by approximately 13 percent of respondents when prompted. Because unprompted these products were mentioned by such a small percentage of households, they are not shown in the chart.
9
8
Prompted
Product Association with the ENERGY STAR Label Unprompted [Base = Recognize label (aided), n = 1,461]
Refrigerator
Appliance
Washing machine
Dryer
Air conditioner
Computer or monitor
Dishwasher
Stove/oven
Water heater
Television
No product
Don't know
Other
Electronics
Lighting
Heater
Microwave oven
Electric things
Freezer
Furnace
Window
Stereo/radio
VCR/DVD
Fan
Insulation 17%
22%
63%
74%
1%
2%
4%
4%
5%
6%
7%
7%
8%
8%
9%
12%
45% 43%
1%
1%
3%
5%
6%
8%
19%
34%
il A/C
i ing
12%
37%
34%
29%
58%
37%
25%
34%
17%
12%
17%
26%
Unprompted Prompted
Prompted: Room air cond toner Prompted: Centra
Prompted: CFL Prompted: L ght
Prompted: VCR
0% 20% 40% 60% 80% 100%
10
UNDERSTANDING
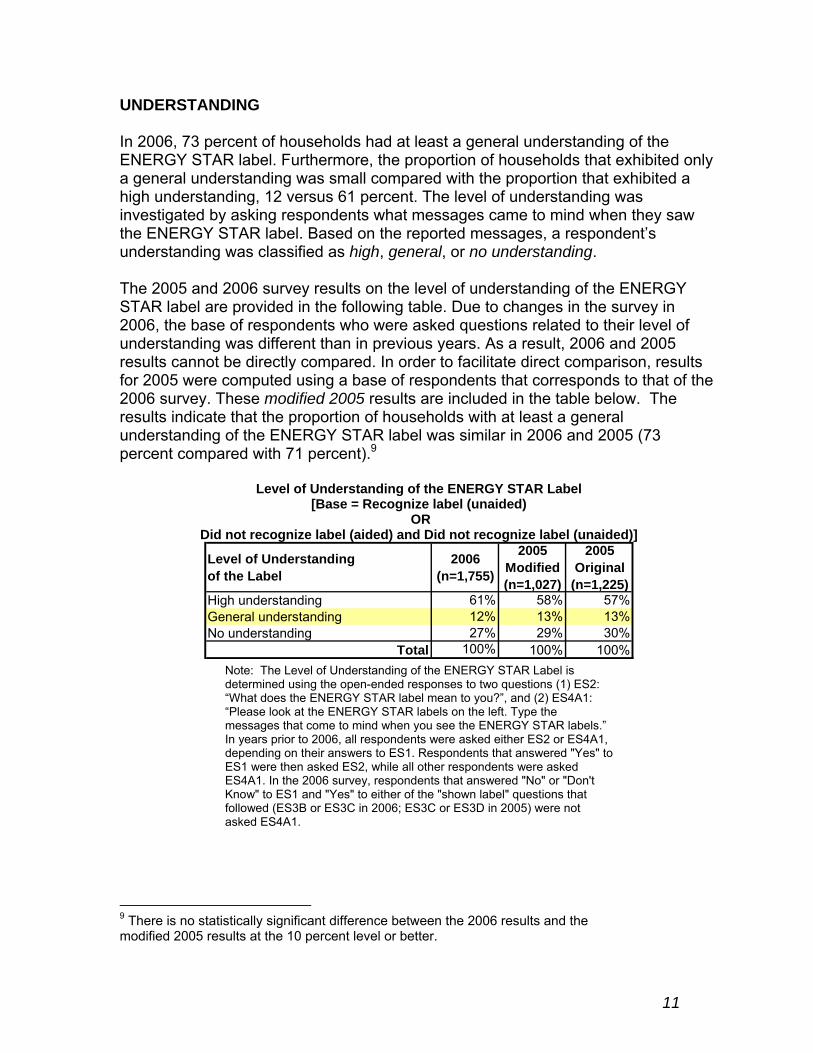
In 2006, 73 percent of households had at least a general understanding of the ENERGY STAR label. Furthermore, the proportion of households that exhibited only a general understanding was small compared with the proportion that exhibited a high understanding, 12 versus 61 percent. The level of understanding was investigated by asking respondents what messages came to mind when they saw the ENERGY STAR label. Based on the reported messages, a respondent’s understanding was classified as high, general, or no understanding.
The 2005 and 2006 survey results on the level of understanding of the ENERGY STAR label are provided in the following table. Due to changes in the survey in 2006, the base of respondents who were asked questions related to their level of understanding was different than in previous years. As a result, 2006 and 2005 results cannot be directly compared. In order to facilitate direct comparison, results for 2005 were computed using a base of respondents that corresponds to that of the 2006 survey. These modified 2005 results are included in the table below. The results indicate that the proportion of households with at least a general understanding of the ENERGY STAR label was similar in 2006 and 2005 (73 percent compared with 71 percent).9
Level of Understanding of the ENERGY STAR Label [Base = Recognize label (unaided)
OR Did not recognize label (aided) and Did not recognize label (unaided)]
Level of Understanding of the Label
2006 (n=1,755)
2005 Modified (n=1,027)
2005 Original
(n=1,225) High understanding General understanding No understanding
61% 12% 27%
58% 13% 29%
57% 13% 30%
Total 100% 100% 100% Note: The Level of Understanding of the ENERGY STAR Label is determined using the open-ended responses to two questions (1) ES2: “What does the ENERGY STAR label mean to you?”, and (2) ES4A1: “Please look at the ENERGY STAR labels on the left. Type the messages that come to mind when you see the ENERGY STAR labels.” In years prior to 2006, all respondents were asked either ES2 or ES4A1, depending on their answers to ES1. Respondents that answered "Yes" to ES1 were then asked ES2, while all other respondents were asked ES4A1. In the 2006 survey, respondents that answered "No" or "Don't Know" to ES1 and "Yes" to either of the "shown label" questions that followed (ES3B or ES3C in 2006; ES3C or ES3D in 2005) were not asked ES4A1.
There is no statistically significant difference between the 2006 results and the modified 2005 results at the 10 percent level or better.
11
9
Understanding by Publicity Category
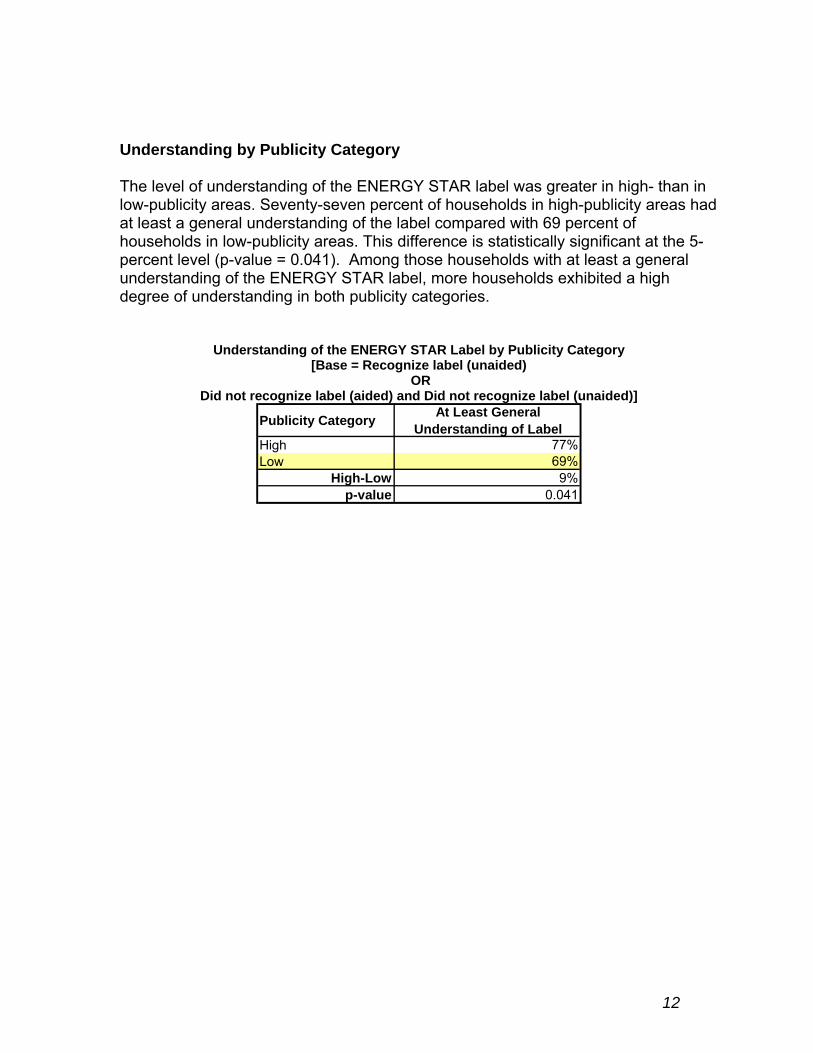
The level of understanding of the ENERGY STAR label was greater in high- than in low-publicity areas. Seventy-seven percent of households in high-publicity areas had at least a general understanding of the label compared with 69 percent of households in low-publicity areas. This difference is statistically significant at the 5percent level (p-value = 0.041). Among those households with at least a general understanding of the ENERGY STAR label, more households exhibited a high degree of understanding in both publicity categories.
Understanding of the ENERGY STAR Label by Publicity Category [Base = Recognize label (unaided)
OR Did not recognize label (aided) and Did not recognize label (unaided)]
Publicity Category At Least General Understanding of Label
High Low
77% 69%
High-Low 9% p-value 0.041
12
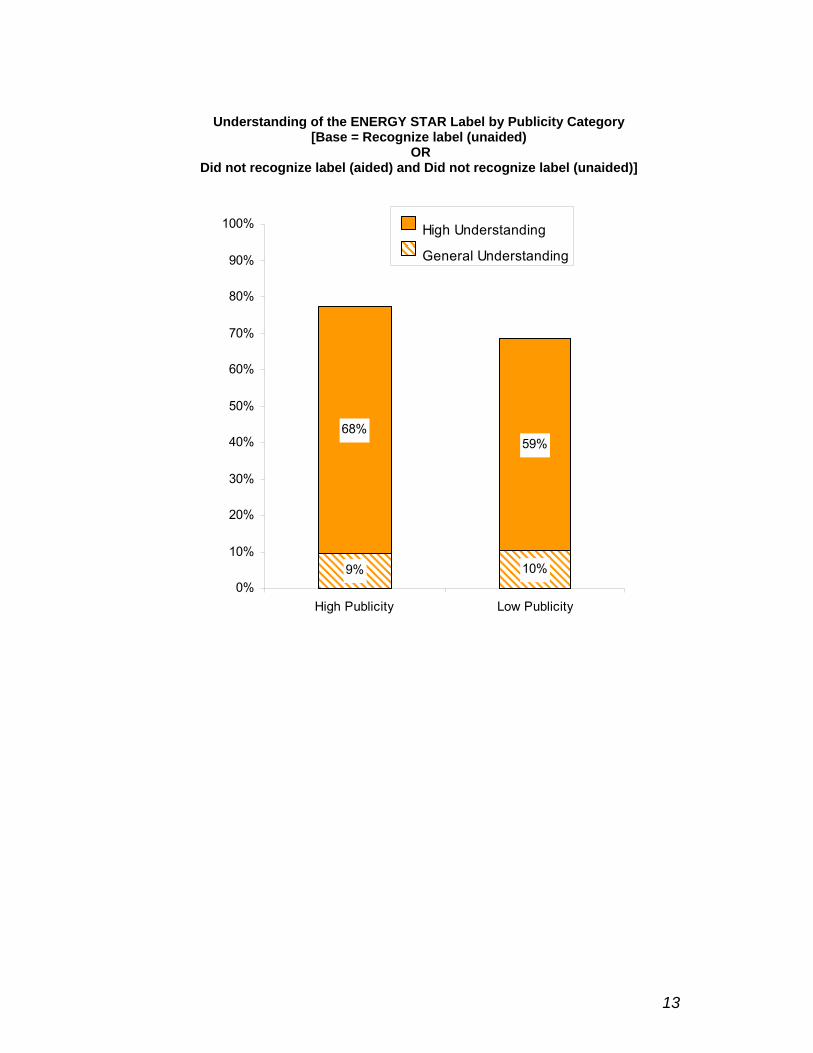
Understanding of the ENERGY STAR Label by Publicity Category[Base = Recognize label (unaided)
OR Did not recognize label (aided) and Did not recognize label (unaided)]
9% 0%
Hi
10%
59% 68%
10%
20%
30%
40%
50%
60%
70%
80%
90%
100% gh Understanding
General Understanding
High Publicity Low Publicity
13
Label Messaging
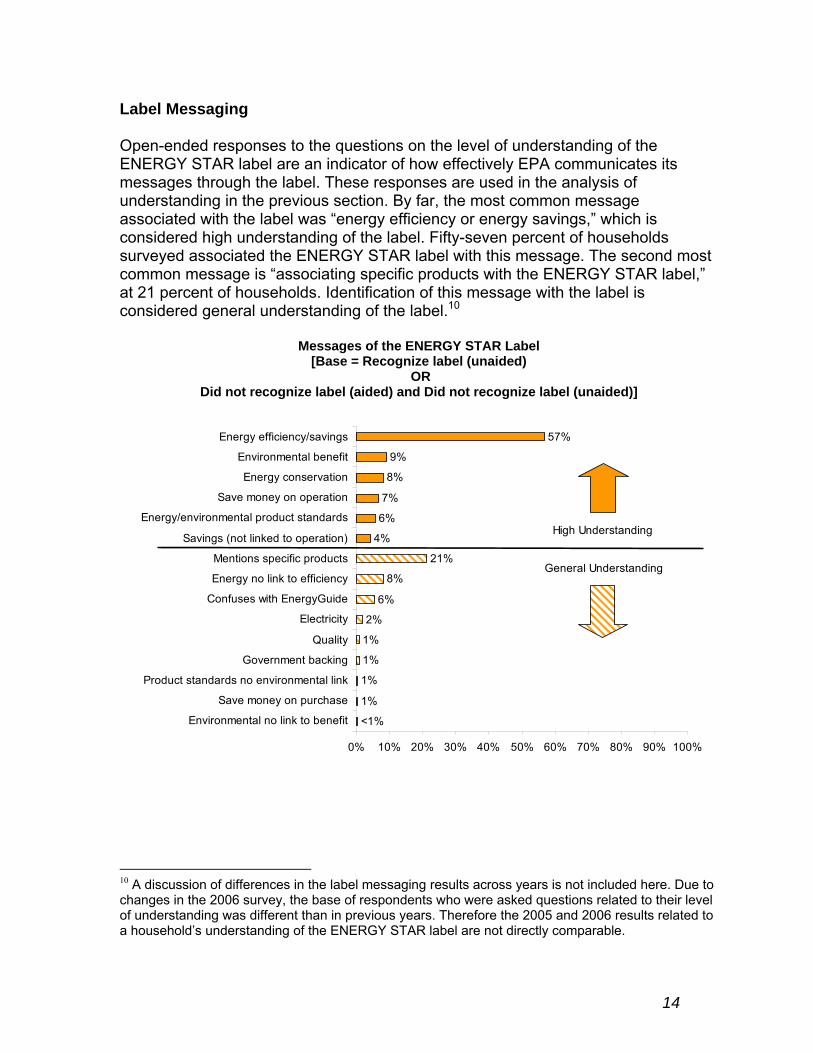
Open-ended responses to the questions on the level of understanding of the ENERGY STAR label are an indicator of how effectively EPA communicates its messages through the label. These responses are used in the analysis of understanding in the previous section. By far, the most common message associated with the label was “energy efficiency or energy savings,” which is considered high understanding of the label. Fifty-seven percent of households surveyed associated the ENERGY STAR label with this message. The second most common message is “associating specific products with the ENERGY STAR label,” at 21 percent of households. Identification of this message with the label is considered general understanding of the label.10
Messages of the ENERGY STAR Label [Base = Recognize label (unaided)
OR Did not recognize label (aided) and Did not recognize label (unaided)]
1%
1%
1%
1%
2%
6%
8%
21%
4%
6%
7%
8%
9%
57%
i i
i link
ing
El
i i
li ici
i ifi
i li ion)
/envi
i
ici ings
Hi ing
l i
<1% Env ronmental no l nk to benefit
Save money on purchase
Product standards no env ronmental
Government back
Quality
ectricity
Confuses w th EnergyGu de
Energy no nk to eff ency
Ment ons spec c products
Sav ngs (not nked to operat
Energy ronmental product standards
Save money on operation
Energy conservation
Env ronmental benefit
Energy eff ency/sav
gh Understand
Genera Understand ng
0% 10% 20% 30% 40% 50% 60% 70% 80% 90% 100%
10 A discussion of differences in the label messaging results across years is not included here. Due to changes in the 2006 survey, the base of respondents who were asked questions related to their level of understanding was different than in previous years. Therefore the 2005 and 2006 results related to a household’s understanding of the ENERGY STAR label are not directly comparable.
14
Messaging by Publicity Category
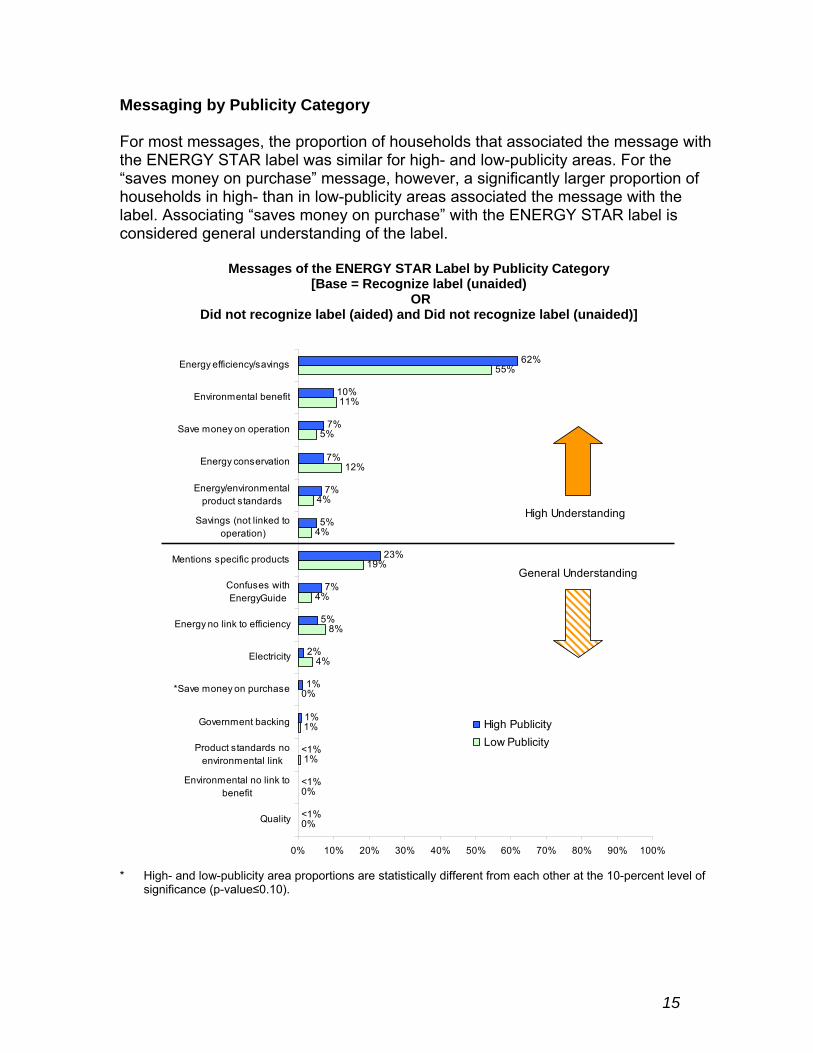
For most messages, the proportion of households that associated the message with the ENERGY STAR label was similar for high- and low-publicity areas. For the “saves money on purchase” message, however, a significantly larger proportion of households in high- than in low-publicity areas associated the message with the label. Associating “saves money on purchase” with the ENERGY STAR label is considered general understanding of the label.
Messages of the ENERGY STAR Label by Publicity Category [Base = Recognize label (unaided)
OR Did not recognize label (aided) and Did not recognize label (unaided)]
0%
0%
1%
1%
0%
4%
8%
4%
19%
4%
4%
5%
11%
55%
1%
1%
2%
5%
7%
5%
7%
7%
7%
10%
i l
i
ing
El
ici
i (
/
ion
i
i
ici / i
Hi iciici
Hi
12%
23%
62%
<1%
<1%
<1%
Quality
Env ronmenta no link to benefit
Product standards no env ronmental link
Government back
*Save money on purchase
ectricity
Energy no link to eff ency
Confuses with EnergyGuide
Mentions s pecific products
Sav ngs not linked to operation)
Energy environm ental product standards
Energy conservat
Save money on operat on
Env ronmental benefit
Energy eff ency sav ngs
gh Publ ty Low Publ ty
gh Understanding
General Understanding
0% 10% 20% 30% 40% 50% 60% 70% 80% 90% 100%
* High- and low-publicity area proportions are statistically different from each other at the 10-percent level of significance (p-value≤0.10).
15
Understanding by Aided Recognition
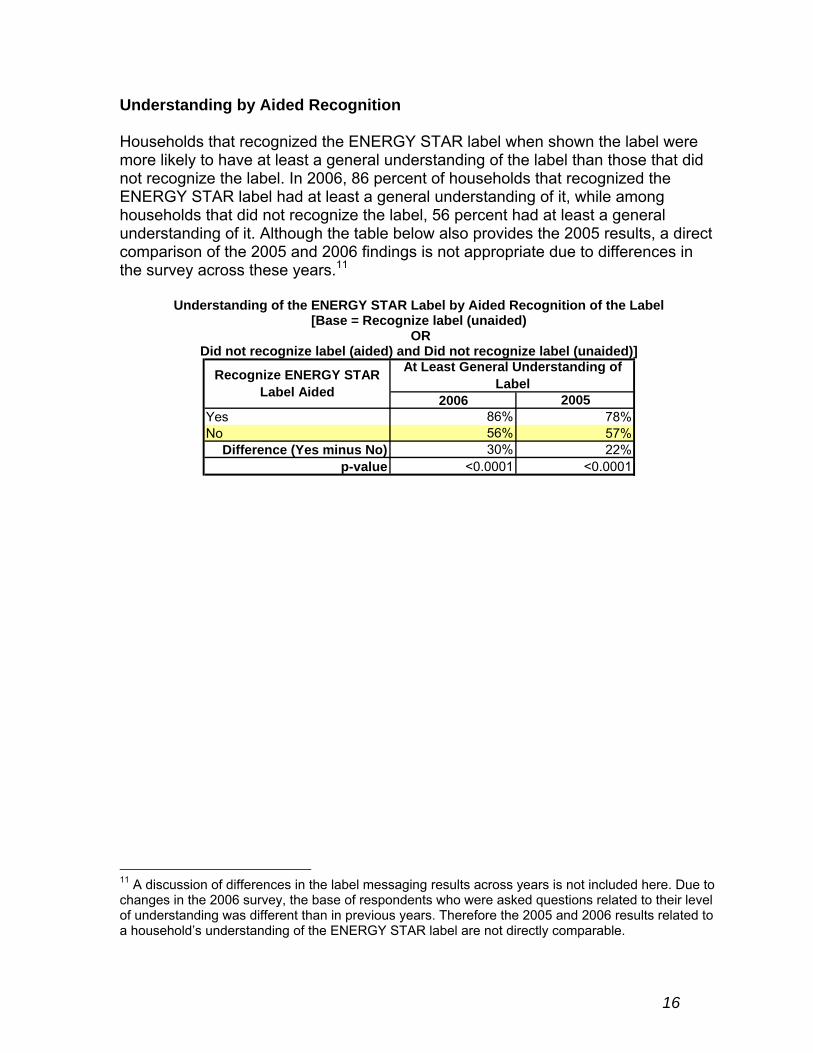
Households that recognized the ENERGY STAR label when shown the label were more likely to have at least a general understanding of the label than those that did not recognize the label. In 2006, 86 percent of households that recognized the ENERGY STAR label had at least a general understanding of it, while among households that did not recognize the label, 56 percent had at least a general understanding of it. Although the table below also provides the 2005 results, a direct comparison of the 2005 and 2006 findings is not appropriate due to differences in the survey across these years.11
Understanding of the ENERGY STAR Label by Aided Recognition of the Label [Base = Recognize label (unaided)
OR Did not recognize label (aided) and Did not recognize label (unaided)]
Recognize ENERGY STAR Label Aided
At Least General Understanding of Label
2006 2005 Yes No
86% 56%
78% 57%
Difference (Yes minus No) 30% 22% p-value <0.0001 <0.0001
A discussion of differences in the label messaging results across years is not included here. Due to changes in the 2006 survey, the base of respondents who were asked questions related to their level of understanding was different than in previous years. Therefore the 2005 and 2006 results related to a household’s understanding of the ENERGY STAR label are not directly comparable.
16
11

INFLUENCE
The survey provided some insight into consumers’ decisions to purchase ENERGY STAR-labeled products, including the following:
• The proportion of households, nationally, that recognized the ENERGY STAR label and knowingly purchased an ENERGY STAR-labeled product
• The influence of the label on purchase decisions
• The role of rebates or financing in decisions to buy ENERGY STAR products
• The loyalty of purchasers to ENERGY STAR products
Purchases of ENERGY STAR Products
In order to estimate the proportion of all households that knowingly purchased an ENERGY STAR product, the following three proportions were multiplied:
• The proportion of all households that recognized the ENERGY STAR label (aided)
• Of the households that recognized the label (aided), the proportion that purchased a product in a product category that has an ENERGY STAR specification
• Of the households that recognized the label (aided) and purchased a product in a relevant category, the proportion that knowingly purchased an ENERGY STAR product
The result is that 31 percent of all households knowingly purchased an ENERGY STAR product in the past twelve months. This proportion is 7 percentage points higher than it was in 2005, at 31 versus 24 percent. This difference is statistically significant at the 5-percent level (p-value = 0.015).
Purchased ENERGY STAR (Base = All respondents)
Purchased 2006 2005 ENERGY STAR product (n=2,176) (n=1,181) Estimate (yes) 31% 24% Standard Error 2.0% 2.1%
An increase in the proportion of all households that knowingly purchased an ENERGY STAR product could be due to an increase in any of the three proportions listed above between 2005 and 2006. A close look at the survey results shows that all three of these proportions increased from 2005 and 2006. In 2006, considering
17
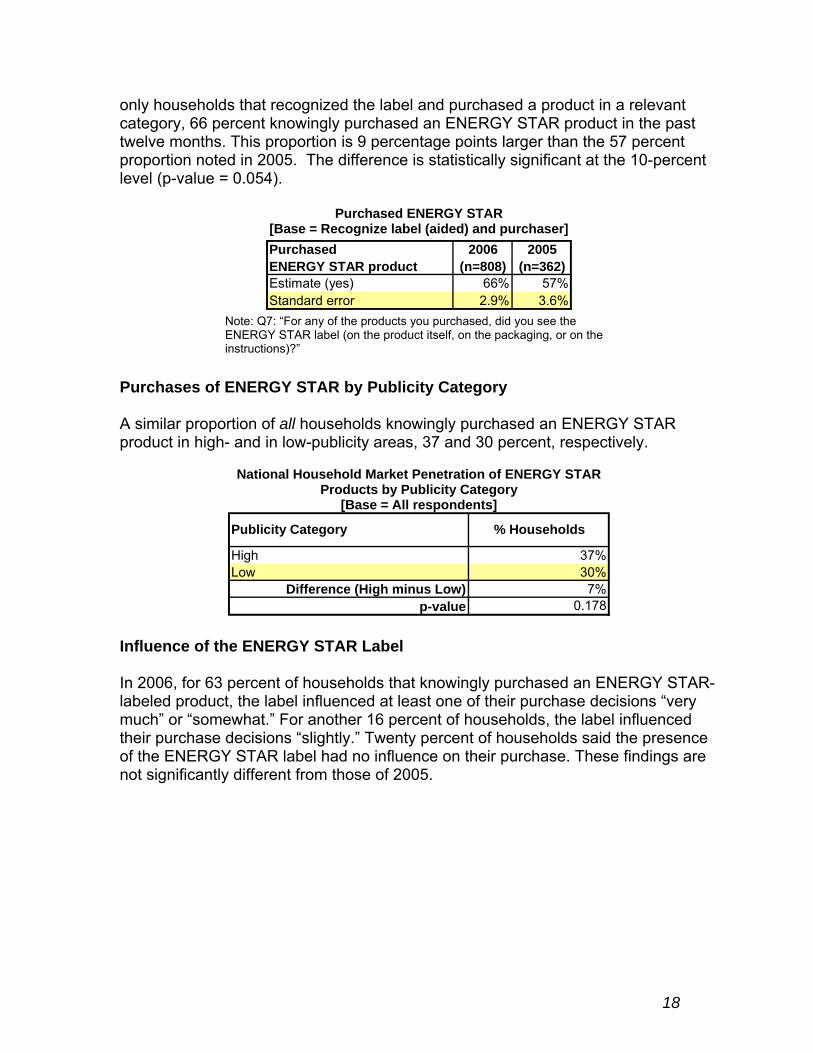
only households that recognized the label and purchased a product in a relevant category, 66 percent knowingly purchased an ENERGY STAR product in the past twelve months. This proportion is 9 percentage points larger than the 57 percent proportion noted in 2005. The difference is statistically significant at the 10-percent level (p-value = 0.054).
Purchased ENERGY STAR [Base = Recognize label (aided) and purchaser] Purchased 2006 2005 ENERGY STAR product (n=808) (n=362) Estimate (yes) 66% 57% Standard error 2.9% 3.6%
Note: Q7: “For any of the products you purchased, did you see the ENERGY STAR label (on the product itself, on the packaging, or on the instructions)?”
Purchases of ENERGY STAR by Publicity Category
A similar proportion of all households knowingly purchased an ENERGY STAR product in high- and in low-publicity areas, 37 and 30 percent, respectively.
National Household Market Penetration of ENERGY STAR Products by Publicity Category
[Base = All respondents]
Publicity Category % Households
High Low
37% 30%
Difference (High minus Low) 7% p-value 0.178
Influence of the ENERGY STAR Label
In 2006, for 63 percent of households that knowingly purchased an ENERGY STAR-labeled product, the label influenced at least one of their purchase decisions “very much” or “somewhat.” For another 16 percent of households, the label influenced their purchase decisions “slightly.” Twenty percent of households said the presence of the ENERGY STAR label had no influence on their purchase. These findings are not significantly different from those of 2005.
18

Influence of the ENERGY STAR Label on Purchase Decisions [Base = Recognize label (aided) and ENERGY STAR purchasers]
Influence of the Label on Purchasing Decisions
2006 (n=524)
Maximum
2005 (n=186)
Maximum Very much 33% 31% Somewhat 30% 32% Slightly 16% 12% Not at all 20% 25%
Total 100% 100% Note: Q8: “For each ENERGY STAR-labeled product you purchased, how much did the ENERGY STAR label influence your purchase decision?”
Influence of the ENERGY STAR Label by Publicity Category
The ENERGY STAR label influenced the purchase decisions of a larger proportion of households in high- than in low-publicity areas. The purchase decisions of 44 percent of households in high-publicity areas were influenced "very much" by the label, compared to 31 percent in low-publicity areas. These proportions are not statistically different from each other at the 10-percent level of significance. However, by adding these proportions to the proportion of households for which the ENERGY STAR label was somewhat influential in their purchase decisions, the proportion of households influenced by the label is larger in high- than in low-publicity areas (75 versus 53 percent).
Maximum Influence of the ENERGY STAR Label on Purchase Decisions by Publicity Category[Base = Recognize label (aided) and ENERGY STAR purchasers, n = 524]
Publicity Category Very much Very much or somewhat
High 44% 75% Low 31% 53%
Difference (High minus Low) 13% 22% p-value 0.124 0.010
19
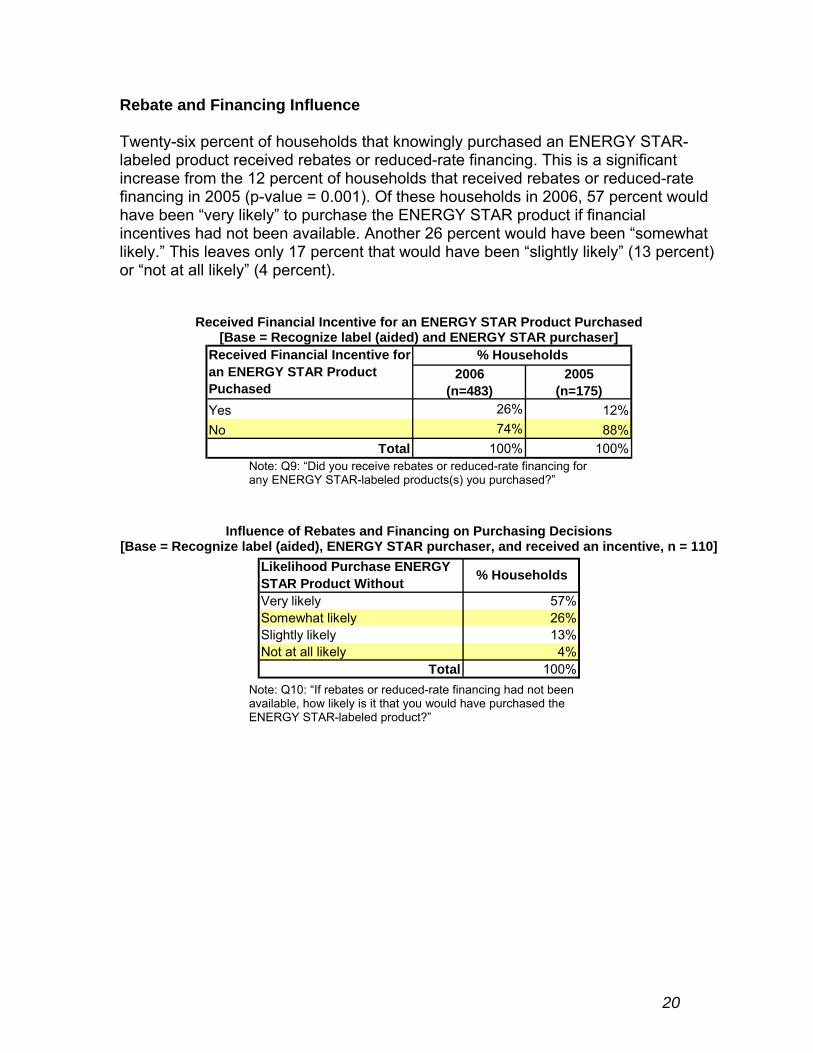
Rebate and Financing Influence
Twenty-six percent of households that knowingly purchased an ENERGY STAR-labeled product received rebates or reduced-rate financing. This is a significant increase from the 12 percent of households that received rebates or reduced-rate financing in 2005 (p-value = 0.001). Of these households in 2006, 57 percent would have been “very likely” to purchase the ENERGY STAR product if financial incentives had not been available. Another 26 percent would have been “somewhat likely.” This leaves only 17 percent that would have been “slightly likely” (13 percent) or “not at all likely” (4 percent).
Received Financial Incentive for an ENERGY STAR Product Purchased [Base = Recognize label (aided) and ENERGY STAR purchaser]
Received Financial Incentive for an ENERGY STAR Product Puchased
% Households 2006
(n=483) 2005
(n=175) Yes No
26% 74%
12% 88%
Total 100% 100% Note: Q9: “Did you receive rebates or reduced-rate financing for any ENERGY STAR-labeled products(s) you purchased?”
Influence of Rebates and Financing on Purchasing Decisions [Base = Recognize label (aided), ENERGY STAR purchaser, and received an incentive, n = 110]
Likelihood Purchase ENSTAR Product Without
ERGY % Households
Very likely 57% Somewhat likely 26% Slightly likely 13% Not at all likely 4%
Total 100% Note: Q10: “If rebates or reduced-rate financing had not been available, how likely is it that you would have purchased the ENERGY STAR-labeled product?”
20
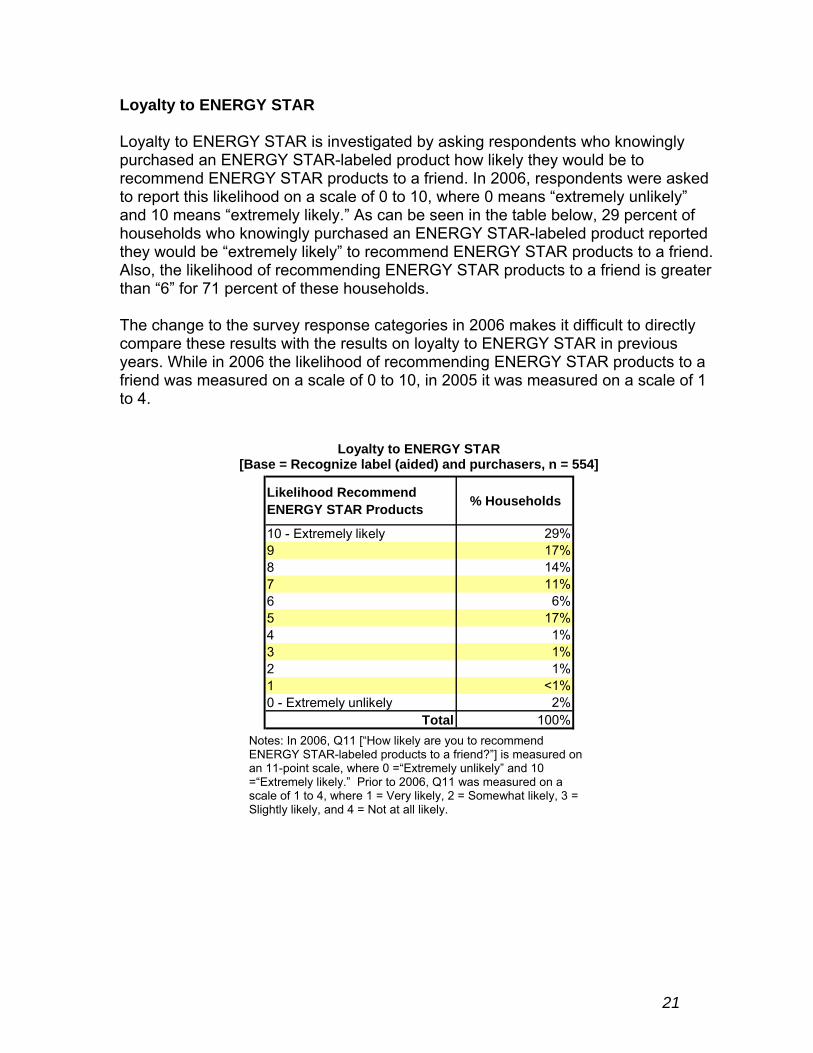
Loyalty to ENERGY STAR
Loyalty to ENERGY STAR is investigated by asking respondents who knowingly purchased an ENERGY STAR-labeled product how likely they would be to recommend ENERGY STAR products to a friend. In 2006, respondents were asked to report this likelihood on a scale of 0 to 10, where 0 means “extremely unlikely” and 10 means “extremely likely.” As can be seen in the table below, 29 percent of households who knowingly purchased an ENERGY STAR-labeled product reported they would be “extremely likely” to recommend ENERGY STAR products to a friend. Also, the likelihood of recommending ENERGY STAR products to a friend is greater than “6” for 71 percent of these households.
The change to the survey response categories in 2006 makes it difficult to directly compare these results with the results on loyalty to ENERGY STAR in previous years. While in 2006 the likelihood of recommending ENERGY STAR products to a friend was measured on a scale of 0 to 10, in 2005 it was measured on a scale of 1 to 4.
Loyalty to ENERGY STAR [Base = Recognize label (aided) and purchasers, n = 554]
Likelihood Recommend ENERGY STAR Products % Households
10 - Extremely likely 29% 9 17% 8 14% 7 11% 6 6% 5 17% 4 1% 3 1% 2 1% 1 <1% 0 - Extremely unlikely 2%
Total 100% Notes: In 2006, Q11 [“How likely are you to recommend ENERGY STAR-labeled products to a friend?”] is measured on an 11-point scale, where 0 =“Extremely unlikely” and 10 =“Extremely likely.” Prior to 2006, Q11 was measured on a scale of 1 to 4, where 1 = Very likely, 2 = Somewhat likely, 3 = Slightly likely, and 4 = Not at all likely.
21
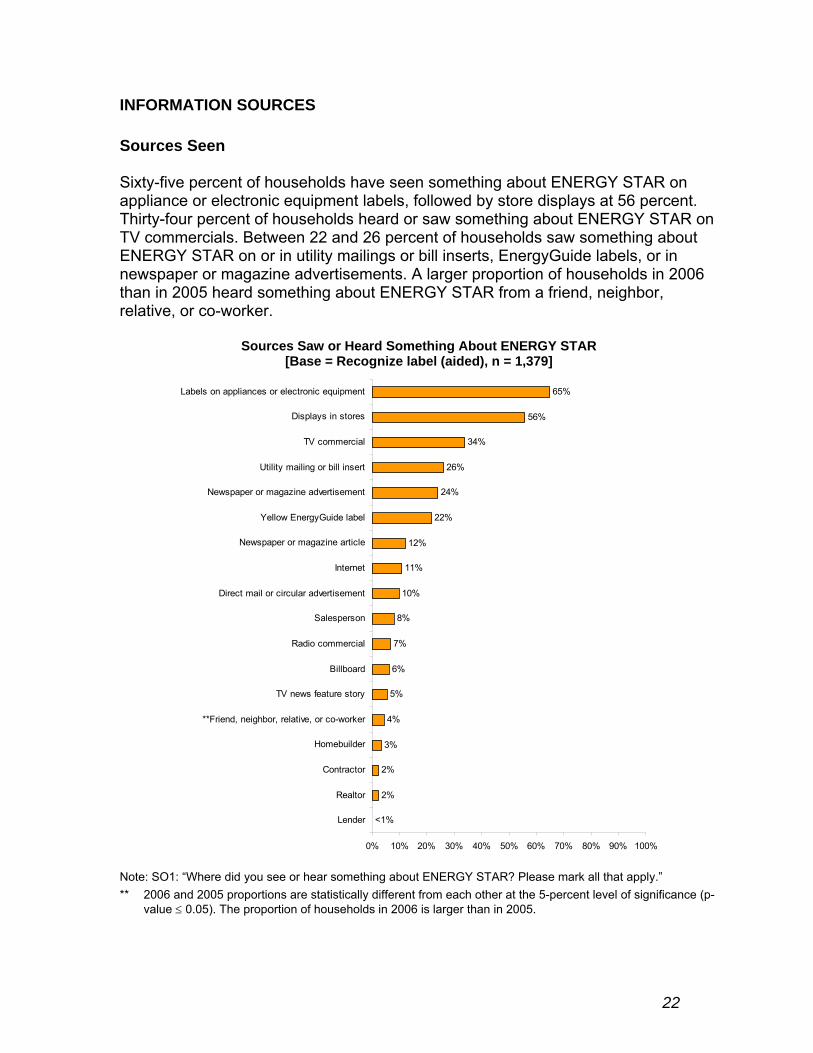
INFORMATION SOURCES
Sources Seen
Sixty-five percent of households have seen something about ENERGY STAR on appliance or electronic equipment labels, followed by store displays at 56 percent. Thirty-four percent of households heard or saw something about ENERGY STAR on TV commercials. Between 22 and 26 percent of households saw something about ENERGY STAR on or in utility mailings or bill inserts, EnergyGuide labels, or in newspaper or magazine advertisements. A larger proportion of households in 2006 than in 2005 heard something about ENERGY STAR from a friend, neighbor, relative, or co-worker.
Sources Saw or Heard Something About ENERGY STAR [Base = Recognize label (aided), n = 1,379]
Labels on appliances or electronic equipment
Displays in stores
TV commercial
Utility mailing or bill insert
Newspaper or magazine advertisement
Yellow EnergyGuide label
Newspaper or magazine article
Internet
Direct mail or circular advertisement
Salesperson
Radio commercial
Billboard
TV news feature story
**Friend, neighbor, relative, or co-worker
Homebuilder
Contractor
Realtor
Lender
2%
2%
3%
4%
5%
6%
7%
8%
10%
11%
12%
22%
24%
26%
56%
65%
34%
<1%
0% 10% 20% 30% 40% 50% 60% 70% 80% 90% 100%
Note: SO1: “Where did you see or hear something about ENERGY STAR? Please mark all that apply.” ** 2006 and 2005 proportions are statistically different from each other at the 5-percent level of significance (p
value ≤ 0.05). The proportion of households in 2006 is larger than in 2005.
22

Sources Seen by Publicity Category
For several sources, the proportion of households that heard or saw something about ENERGY STAR was significantly larger in high- than in low-publicity areas. This was the case for store displays, utility mailings or bill inserts, newspaper or magazine advertisements, direct mail or circular advertisements, salespersons, and radio commercials. Four of these six sources are means of mass communication, and the remaining two involve stores.
Sources Saw or Heard Something About ENERGY STAR by Publicity Category [Base = Recognize label (aided), n = 1,379]
Labels on appliances or electronic equipment
***Displays in stores
TV commercial
***Utility mailing or bill insert
***New spaper or magazine advertisement
Yellow EnergyGuide label
New spaper or magazine article
*Direct mail or circular advertisement
**Salesperson
***Radio commercial
Internet
Billboard
Friend, neighbor, relative, or co-w orker
TV new s f eature story
Homebuilder
Contractor
Realtor
Lender
3%
4%
6%
6%
2%
3%
4%
4%
6%
6%
10%
15%
59%
5%
1%
2%
6%
7%
35%
l
11%
24%
71%
11%
12%
12%
21%
28%
33%
43%
67%
10%
17%
20%
45%
<1% <1%
High Publicity Low Pub icity
0% 10% 20% 30% 40% 50% 60% 70% 80% 90% 100%
*** High- and low-publicity area proportions are statistically different from each other at the 1-percent level of significance (p-value ≤ 0.01).
** High- and low-publicity area proportions are statistically different from each other at the 5-percent level of significance (p-value ≤ 0.05).
* High- and low-publicity area proportions are statistically different from each other at the 10-percent level of significance (p-value ≤ 0.10).
23

APPENDIX A: DETAILED METHODOLOGY
During September and October 2006, the Consortium for Energy Efficiency (CEE) fielded a questionnaire to obtain information at the national level on consumer awareness and understanding of the ENERGY STAR label, the value accrued to the label in the eyes of consumers, satisfaction with labeled products, and other ENERGY STAR-related items. The questionnaire was similar to the Internet/WebTV-based questionnaires fielded in previous years (2001 through 2005). As in the 6 previous years, CEE and its members sponsoring the survey made the survey data publicly available. In 2001, a rigorous comparative analysis of the results obtained via a mail survey versus an Internet/WebTV survey was conducted. The results from the two survey methods were comparable for most major indicators.12 Results from that time frame were also analogous to telephone surveys for aided recognition.13
This report discusses the results of the 2006 CEE ENERGY STAR Household Survey, building on prior years’ survey results and focusing on the extent to which consumers recognized the ENERGY STAR label, understood its intended messages, and utilized (or were influenced by) the label in their energy-related purchase decisions. Research questions of interest included:
• Where do consumers see or hear about the ENERGY STAR label?
• How does increased publicity impact consumer ENERGY STAR label recognition, understanding, and influence?
• Which key messages about the ENERGY STAR label are consumers retaining?
• Do consumers demonstrate loyalty to the ENERGY STAR label?
The survey was fielded from September 19 through October 2, 2006.
The remainder of Appendix A discusses the questionnaire design, sampling and weighting methodologies, data collection, and the national analysis. See Appendix C for survey questions.
1 QUESTIONNAIRE DESIGN
In 2006, CEE conducted the ENERGY STAR survey using a questionnaire designed to be delivered by Internet/WebTV. The survey was conducted via an interactive Internet/WebTV format with a random sample of households that are members of an Internet/WebTV panel. Households were selected to participate in the panel by random digit dial and recruited by telephone. Participants in this survey were then randomly selected from the panel. Only one member per household in the random
12 National Analysis of CEE 2001 ENERGY STAR Household Surveys. U.S. EPA, 2002. 13 Tannenbaum, Bobbi and Shel Feldman. “ENERGY STAR Awareness as a Function of Survey Method.” IEPEC, 2001.
A-1
sample was contacted. Households selected for previous years’ surveys were not eligible to participate in the 2006 survey.
The panel is designed to be representative of the U.S. population. Panel members are provided with an Internet appliance (WebTV) and an Internet service connection. Households that already have Internet service receive other incentives to participate in the panel. Panel members respond to questionnaires administered to them via the Internet and WebTV. They receive no more than three to four short questionnaires each month, and are expected to respond to a certain percentage of them.
Data collected using the 2006 Internet/WebTV questionnaire may in most cases be compared with data collected using the Internet/WebTV questionnaires fielded in previous years, for which CEE was also responsible.
1.1 Survey Objectives
CEE had several broad objectives in designing the 2006 questionnaire, including:
• To maintain consistency with the CEE 2000 and 2001 mail questionnaires and the Internet/WebTV questionnaires fielded in 2001 and subsequent years
• To fine-tune the questionnaire based on lessons learned from prior years’ analyses of the CEE survey while maintaining the ability to analyze the results of the 2006 survey against those from the 2005 CEE survey
The 2006 Internet/WebTV questionnaire addressed the following:
• Respondent recognition of the ENERGY STAR label
• Understanding of and key messages communicated by the ENERGY STAR label
• Products on which respondents have seen the label
• Products that respondents have shopped for or purchased in the past year
• Products that respondents have purchased on which they have seen the label (or on whose packaging or instructions they have seen the label)
• Influence of the presence or absence of the label on the purchase decision
• Whether purchases of ENERGY STAR-labeled products involved rebates or reduced-rate financing
• Likelihood of having purchased ENERGY STAR-labeled products in the absence of rebates or reduced-rate financing
A-2
• Likelihood of recommending ENERGY STAR-labeled products to a friend and other measures of loyalty to the ENERGY STAR label
• Satisfaction with ENERGY STAR-labeled products versus products without the ENERGY STAR label
• Demographic questions (most of the demographic questions were not asked in the Internet/WebTV survey as the demographic characteristics of the respondents were already on file.)
• Recognition and understanding of the yellow Energy Guide labels
1.2 Internet/WebTV Questionnaire
The interactive format of an Internet/WebTV questionnaire allows questions to be asked in a way that is not possible with a printed questionnaire. On printed questionnaires respondents can see questions in advance and may be tempted to read the entire questionnaire before completing it, potentially educating themselves in a limited way about the subject and affecting their responses.
The Internet/WebTV questionnaires (after questions about the yellow Energy Guide label) ask respondents—without showing the ENERGY STAR label—whether they have ever seen or heard of the ENERGY STAR label. Responses to this question should thus be comparable to those obtained through a telephone survey. The Internet/WebTV questionnaires then show the ENERGY STAR label(s) (which is obviously not possible with a telephone survey) and ask again about recognition and understanding. Responses to these questions should thus be comparable to those obtained through a mail survey where respondents are shown the label.
Another difference between a mail questionnaire and an Internet/WebTV questionnaire is that the latter—like a telephone questionnaire using computer-assisted telephone interviewing (CATI)—can program lines of questions based on responses to earlier questions. For example, respondents to an Internet/WebTV questionnaire who say they have bought a given product in the past year can then be asked whether that specific product (or its packaging or instructions) had the ENERGY STAR label.
Thus, the Internet/Web TV survey is able to combine some of the attributes of both print and telephone surveys.
1.3 Changes to 2006 Questionnaire
The 2006 Internet/WebTV questionnaire was very similar to the 2005 questionnaire. Three changes since the 2005 survey are explained below.
A-3

1.3.1 Attitudinal and Purchasing Role Questions Several experimental attitudinal questions from 2005 were dropped or reworded slightly in response to CEE’s own analysis of these questions. The questions in this section were designed to measure consumers’ perceptions of ENERGY STAR-labeled products. Respondents were asked to rate on a five-grade scale how strongly they agreed or disagreed with a series of statements. Changes to this question series were:
• Q16b, “All new products use energy just as efficiently whether or not they have the ENERGY STAR label” was dropped.
• Q16d, “I prefer to purchase ENERGY STAR-labeled products whenever I can” was reworded to “If I cannot find the kind of product I am looking for with an ENERGY STAR label, I will shop elsewhere rather than buy a product that does not qualify for the label.”
• Q16e, “I would not go out of my way to purchase ENERGY STAR-labeled products” was dropped.
• Q16g, “Buying ENERGY STAR-labeled products makes me feel like I'm acting responsibly” was dropped.
• Q16j, “ENERGY STAR-labeled products deliver what they promise” was dropped.
• Q16k, “ENERGY STAR-labeled products do not meet my needs” was dropped.
• Q16m, “I don't find any real difference in performance between products with the ENERGY STAR label and those without the label” was dropped.
• Q16n, “It seems like most products have the ENERGY STAR label these days” was added.
• Q16o, “If I see the ENERGY STAR label, I know I'm getting a more energy-efficient product” was added.
• Q16p, “When I buy a product with the ENERGY STAR label, I can always be sure it's high quality” was added.
In order to gauge the extent to which survey results represent the views and behaviors of household decision makers, a question was added in 2006 asking survey respondents about their role in their household’s purchasing decisions. Q30 asked “Please tell us about your role in your household’s purchasing decisions. For each of the product groups listed below, do you usually make the purchasing decisions, do you share the decision-making equally with another household member, does someone else usually make the decisions but you have some input, or do you have no input in the decision-making?”
A-4
1.3.2 Likelihood of Recommending ENERGY STAR-Labeled Products to a Friend Loyalty to ENERGY STAR is investigated by asking respondents who knowingly purchased an ENERGY STAR-labeled product how likely they would be to recommend ENERGY STAR products to a friend. Two changes were made in the 2006 survey that affect the loyalty to ENERGY STAR question.
• First, the survey response categories in 2006 are different. In 2006, Q11: “How likely are you to recommend ENERGY STAR-labeled products to a friend?” is measured on an 11-point scale (where 0 =“Extremely unlikely” and 10 =“Extremely likely”). Prior to 2006, Q11 was measured on a scale of 1 to 4 (where 1 = “Very likely,” 2 = “Somewhat likely,” 3 = “Slightly likely,” and 4 = “Not at all likely”).
• Secondly, a difference in question sequencing for some respondents in the 2005 and 2006 surveys has resulted in differences in the base of respondents who were asked this question in the two years. In 2006, respondents were asked this question whether or not the product they purchased was an ENERGY STAR product. In 2005, respondents had to have purchased an ENERGY STAR product. The Loyalty to ENERGY STAR results reported in this report are calculated using the same base of respondents who were asked Q11 in 2005.
1.3.3 Aided Recognition As noted following the Recognition of the ENERGY STAR Label table on page 5 of the report, the sequence and numbering of questions on which the aided recognition results are based changed slightly in 2006. This section provides further explanation of these changes. Although there is no effect on the determination of aided recognition, the changes to this sequence do have an effect on the determination of the Level of Understanding of the ENERGY STAR Label table on page eleven of the report.
1.3.3.a. 2006 Survey Method In the 2006 analysis, the determination of aided recognition was based on the responses to four questions. Specifically:
ES3C: Please look at the ENERGY STAR label on the left. Have you ever seen or heard of this label? (Respondents were randomly shown either the old or new ENERGY STAR label. This question was asked to respondents who said they had not seen or heard of or didn’t know whether they had seen or heard of ENERGY STAR.)
ES3A: Is this the label you have seen or heard of before? (Respondents were randomly shown either the old or new ENERGY STAR label. This question was asked to respondents who said they had seen or heard of the ENERGY STAR label.)
A-5
ES3B: Have you seen or heard of this version of the ENERGY STAR label? (In this question, asked after ES3C or ES3A, respondents were shown the label not shown in the previous question.)
ES6: Now that you had the opportunity to see the ENERGY STAR label, do you recall seeing or hearing anything about it before this survey? (This question was asked to respondents who answered “no” or “don’t know” to ES3A and ES3B or to ES3C and ES3B.)
• Respondents who answered ES3A, ES3B, ES3C, or ES6 “yes,” were categorized as recognizing the ENERGY STAR label (aided).
• Respondents who did not answer ES3A, ES3B, or ES3C “yes” and answered ES6 “no,” were categorized as not recognizing the label (aided).
• Respondents who did not answer ES3A, ES3B, or ES3C “yes” and answered ES6 “don’t know” or refused to answer ES6 were not included in the analysis of aided recognition. (Their data were set to missing.)
1.3.3.b. 2005 Survey Method In the 2005 analysis the determination of aided recognition was based on the responses to five questions. Specifically:
ES3A: Is this the label you have seen or heard of before? (Respondents were randomly shown either the old or new ENERGY STAR label. This question was asked to respondents who said they had seen or heard of the ENERGY STAR label.)
ES3B: Have you seen or heard of this version of the ENERGY STAR label? (In this question, asked after ES3A, respondents were shown the label not shown in the previous question.)
ES3C: Please look at the ENERGY STAR label on the left. Have you ever seen or heard of this label? (Respondents were randomly shown either the old or new ENERGY STAR label. This question was asked to respondents who said they had not seen or heard of or didn’t know whether they had seen or heard of ENERGY STAR.)
ES3D: Have you seen or heard of this version of the ENERGY STAR label? (In this question, asked after ES3C, respondents were shown the label not shown in the previous question.)
ES6: Now that you had the opportunity to see the ENERGY STAR label, do you recall seeing or hearing anything about it before this survey? (This question was asked to respondents who answered “no” or “don’t know” to ES3A and ES3B. It was also asked to all respondents who answered ES3C and ES3D.)
A-6
• Respondents who answered ES3A, ES3B, ES3C, ES3D, or ES6 “yes” were categorized as recognizing the ENERGY STAR label (aided).
• Respondents who did not answer ES3A, ES3B, ES3C, or ES3D “yes” and answered ES6 “no,” were categorized as not recognizing the label (aided).
• Respondents who did not answer ES3A, ES3B, ES3C, or ES3D “yes” and answered ES6 “don’t know” or refused to answer ES6 were not included in the analysis of aided recognition. (Their data were set to missing.)
1.3.3.c. Sequence and Numbering Changes In 2006, survey respondents who answered “yes” to question ES1: “Have you ever seen or heard of the ENERGY STAR label?” were asked the same series of questions as in 2005. After being asked ES1, these respondents were subsequently asked ES3A and ES3B, where they were shown each of the versions of the label and specifically asked if they had ever seen or heard of either of them (“Is this the label you have seen or heard of before” and “Have you seen or heard of this version of the ENERGY STAR label?”, respectively).14 If, after being shown both versions of the label, these individuals responded that they had seen or heard of at least one of them, they were considered to recognize the ENERGY STAR label (aided). If, however, these individuals responded that they had not seen or heard of either of the two versions of the ENERGY STAR label,15 they were given one more chance to gain aided recognition status with ES6: “Now that you have had the opportunity to see the ENERGY STAR label, do you recall seeing or hearing anything about it before this survey?”
The series of questions asked of survey respondents who answered “no” to question ES1 in 2006 was different than that asked of respondents who answered “no” in 2005. In 2006, those answering “no” to ES1 were subsequently asked questions ES3C and ES3B (“Please look at the label on the left Have you ever seen or heard of this label?” and “Have you seen or heard of this version of the ENERGY STAR label?”, respectively). Instead of being asked ES3C and ES3B, 2005 survey respondents who answered “no” to question ES1: “Have you ever seen or heard of the ENERGY STAR label?”16 were asked the corresponding questions ES3C and ES3D (“Please look at the label on the left. Have you ever seen or heard of this label?” and “Have you seen or heard of this version of the ENERGY STAR label?”, respectively).17 In 2005, regardless of their responses to these questions, all of the respondents that did not answer “yes” to ES1 were subsequently asked ES6: “Now
14 ES3A and ES3B were asked such that each respondent was asked about each of the two versions of the ENERGY STAR label, but in random order.
Or if they did not know or refused to answer whether they had seen or heard of the either of the labels. 16 In this discussion, references to a “no” response to question ES1 also includes responses of “don’t know” or refused to answer. 17 As with ES3A and ES3B, ES3C and ES3D were asked such that each respondent was asked about each of the two versions of the ENERGY STAR label, but in random order.
A-7
15
that you have had the opportunity to see the ENERGY STAR label, do you recall seeing or hearing anything about it before this survey?”
1.3.3.d. Effects on Aided Recognition and Understanding
The question numbering and sequence changes described in the previous section have no substantive effect on the determination of aided recognition. Despite changes to the numbering and sequence, the 2006 survey collects the same information collected with the 2005 survey to determine aided recognition.
The question numbering and sequence changes described in the previous section do affect the base of respondents used to determine understanding of the ENERGY STAR label. More specifically, the base of respondents who were asked questions related to their Level of Understanding of the ENERGY STAR label is different than in previous years.
The following two questions are used to determine a participant’s level of understanding of the label.
ES4a1: “Please look at the ENERGY STAR labels on the left. Type the messages that come to mind when you see the ENERGY STAR labels. [SHOW LABELS]”
ES2: “What does the ENERGY STAR label mean to you?”
In previous years all respondents were asked either ES4a1 or ES2. However, this year respondents who answered “no” to ES1 and “yes” to either ES3C or ES3B were not asked either of the two understanding questions.
2 SAMPLING
2.1 Designated Marketing Areas’ Publicity Categories
The same publicity classification procedure used in the past 5 years was used in 2006. A Nielsen Designated Marketing Area® (DMA) was classified as high publicity, low publicity, or other using the following criteria:
• High publicity: Active local ENERGY STAR program recently sponsored by a utility, state agency, or other organization for 2 or more continuous years. The activities must include sustained promotions and publicity from non-federal sources.
• Low publicity: Federal campaign activities only and no significant regional program sponsor activities.
• Other: All other DMAs.
A-8
This classification procedure was designed to identify three publicity categories and provide clear and verifiable definitions. The key working definitions are:
• Recent: The 2 years of activity must include the time period during which the survey was in the field.
• Sustained: The 2 years of activity must be continuous.
• Significant: In addition to any direct federal publicity efforts, publicity efforts must include a deliberate and multifaceted regional program sponsor investment in ENERGY STAR programming, such as direct marketing efforts or the creation and distribution of promotional material.
These definitions were constructed to be applicable to future survey efforts; they can be modified by simply increasing the duration of sustained high publicity.
2.2 Sample Design
The sample was a national sample. The sampling frame included all households in the largest DMAs, which together accounted for about 70 percent of U.S. television households. In 2006, this encompassed the 57 largest DMAs. In addition, CEE members may sponsor more intensive sampling (i.e., an over sample) in selected localities, which are referred to here as sponsor areas. In 2006, the sponsor areas were:
• Massachusetts • Minneapolis-St. Paul DMA • New York state (with the exception of Long Island) • Pacific Northwest (Idaho, Montana, Oregon, Washington) • United Illuminating service territory in southwestern Connecticut
Sponsor areas are not limited to the 57 largest DMAs. Thus, the complete frame for the study was the combination of the largest DMAs and any portion of the sponsor areas that fell outside those DMAs.
The sample was stratified by area and within an area by publicity category.18 Each sponsor area is also further stratified by large versus non-large DMA,19 as well as by any stratification requested by the CEE member funding the oversample.20 This sample design resulted in 17 strata.
18 Montana was not stratified by publicity category because 98 percent of Montana households are in low-publicity DMAs and the number of sampling points to be allocated across all of Montana was only 35.
Idaho was not further stratified by large versus non-large DMA because 93 percent of Idaho households are in non-large DMAs and the number of sampling points to be allocated across all of Idaho was only 65. 20 No CEE member funding an oversample requested additional stratification.
A-9
19

The CEE members who fund the oversample for a sponsor area determine the total number of sampling points allocated to the sponsor area as a whole.21 This total number of sampling points is then allocated across publicity categories present in a sponsor area proportional to population. Among the top 57 DMAs located outside the sponsor areas, each publicity category was allocated approximately 333 sampling points. In order to achieve the target number of sampling points, a larger sample was selected to receive the survey to allow for non-response.
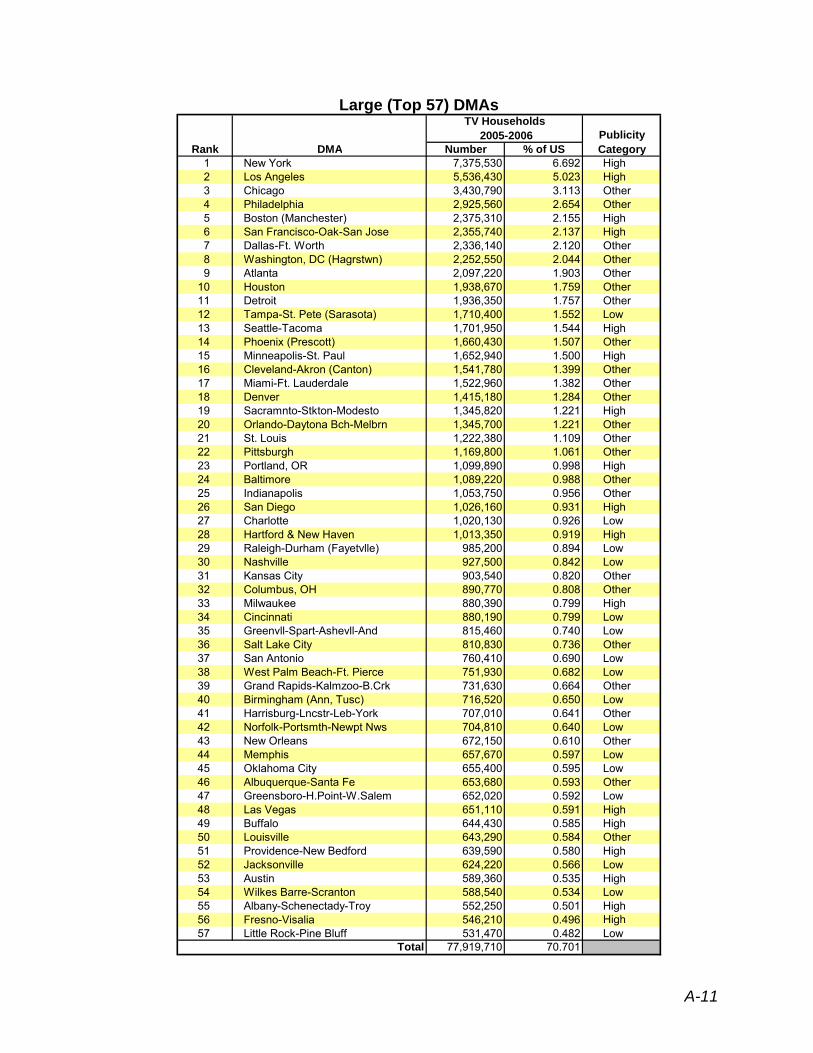
A list of the large DMAs and their publicity category assignments is provided in the table below.22 A list of the DMAs included in the sponsor areas and their publicity category assignments follows. Lastly, the large DMAs and the DMAs in the sponsor areas are shown on a map along with their publicity categories.
21 The CEE member that funded the Pacific Northwest oversample provided allocation of sample points across states for Idaho, Montana, Oregon, and Washington. 22 Between September 2005 and 2006, 2 of the 57 largest DMAs changed publicity category: Atlanta and New Orleans. Both changed from “Low” to “Other”.
A-10
123456789
101112131415161718192021222324252627282930313233343536373839404142434445464748495051525354555657
Large (Top 57) DMAs
Rank DMA
TV Households 2005-2006 Publicity
Category Number % of US New York Los Angeles Chicago Philadelphia Boston (Manchester) San Francisco-Oak-San Jose Dallas-Ft. Worth Washington, DC (Hagrstwn) Atlanta Houston Detroit Tampa-St. Pete (Sarasota) Seattle-Tacoma Phoenix (Prescott) Minneapolis-St. Paul Cleveland-Akron (Canton) Miami-Ft. Lauderdale Denver Sacramnto-Stkton-Modesto Orlando-Daytona Bch-Melbrn St. Louis Pittsburgh Portland, OR Baltimore Indianapolis San Diego Charlotte Hartford & New Haven Raleigh-Durham (Fayetvlle) Nashville Kansas City Columbus, OH Milwaukee Cincinnati Greenvll-Spart-Ashevll-And Salt Lake City San Antonio West Palm Beach-Ft. Pierce Grand Rapids-Kalmzoo-B.Crk Birmingham (Ann, Tusc) Harrisburg-Lncstr-Leb-York Norfolk-Portsmth-Newpt Nws New Orleans Memphis Oklahoma City Albuquerque-Santa Fe Greensboro-H.Point-W.Salem Las Vegas Buffalo Louisville Providence-New Bedford Jacksonville Austin Wilkes Barre-Scranton Albany-Schenectady-Troy Fresno-Visalia Little Rock-Pine Bluff
7,375,530 5,536,430 3,430,790 2,925,560 2,375,310 2,355,740 2,336,140 2,252,550 2,097,220 1,938,670 1,936,350 1,710,400 1,701,950 1,660,430 1,652,940 1,541,780 1,522,960 1,415,180 1,345,820 1,345,700 1,222,380 1,169,800 1,099,890 1,089,220 1,053,750 1,026,160 1,020,130 1,013,350
985,200 927,500 903,540 890,770 880,390 880,190 815,460 810,830 760,410 751,930 731,630 716,520 707,010 704,810 672,150 657,670 655,400 653,680 652,020 651,110 644,430 643,290 639,590 624,220 589,360 588,540 552,250 546,210 531,470
6.692 5.023 3.113 2.654 2.155 2.137 2.120 2.044 1.903 1.759 1.757 1.552 1.544 1.507 1.500 1.399 1.382 1.284 1.221 1.221 1.109 1.061 0.998 0.988 0.956 0.931 0.926 0.919 0.894 0.842 0.820 0.808 0.799 0.799 0.740 0.736 0.690 0.682 0.664 0.650 0.641 0.640 0.610 0.597 0.595 0.593 0.592 0.591 0.585 0.584 0.580 0.566 0.535 0.534 0.501 0.496 0.482
High High Other Other High High Other Other Other Other Other Low High Other High Other Other Other High Other Other Other High Other Other High Low High Low Low Other Other High Low Low Other Low Low Other Low Other Low Other Low Low Other Low High High Other High Low High Low High High Low
Total 77,919,710 70.701
A-11
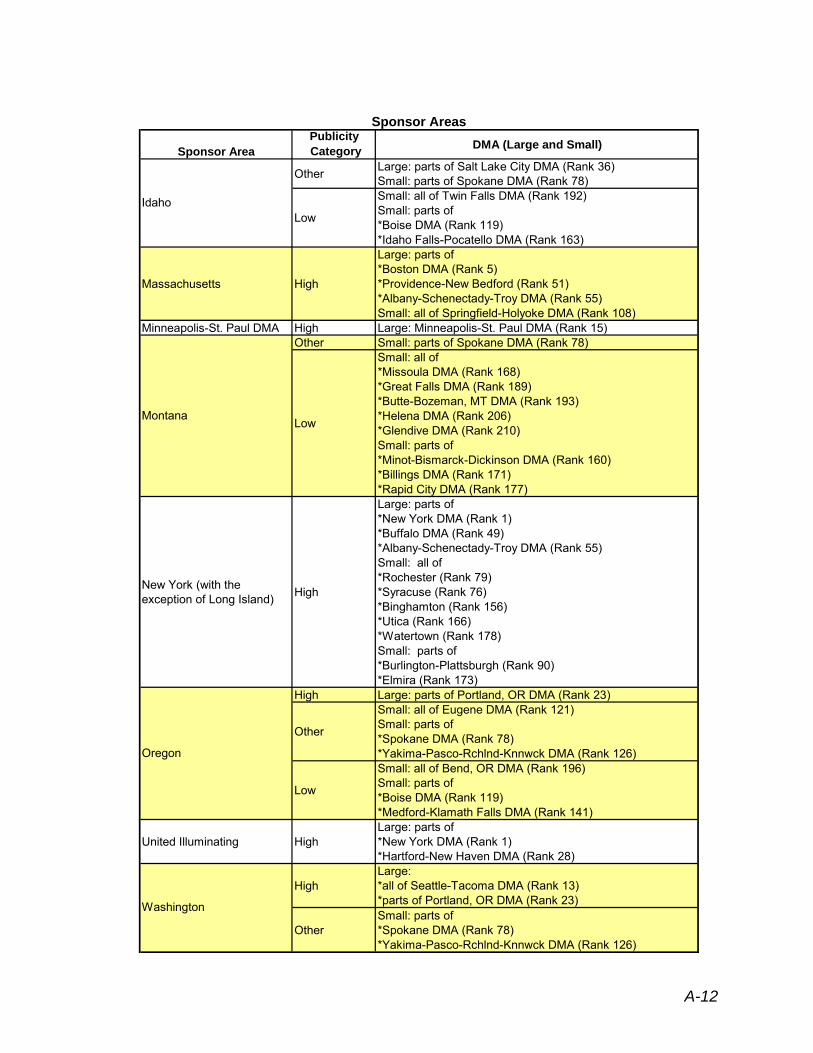
Sponsor Areas
Sponsor Area Publicity Category DMA (Large and Small)
Other Large: parts of Salt Lake City DMA (Rank 36) Small: parts of Spokane DMA (Rank 78)
Idaho Low
Small: all of Twin Falls DMA (Rank 192) Small: parts of *Boise DMA (Rank 119) *Idaho Falls-Pocatello DMA (Rank 163)
Massachusetts High
Large: parts of *Boston DMA (Rank 5) *Providence-New Bedford (Rank 51) *Albany-Schenectady-Troy DMA (Rank 55) Small: all of Springfield-Holyoke DMA (Rank 108)
Minneapolis-St. Paul DMA High Large: Minneapolis-St. Paul DMA (Rank 15) Other Small: parts of Spokane DMA (Rank 78)
Montana Low
Small: all of *Missoula DMA (Rank 168) *Great Falls DMA (Rank 189) *Butte-Bozeman, MT DMA (Rank 193) *Helena DMA (Rank 206) *Glendive DMA (Rank 210) Small: parts of *Minot-Bismarck-Dickinson DMA (Rank 160) *Billings DMA (Rank 171) *Rapid City DMA (Rank 177)
New York (with the exception of Long Island) High
Large: parts of *New York DMA (Rank 1) *Buffalo DMA (Rank 49) *Albany-Schenectady-Troy DMA (Rank 55) Small: all of *Rochester (Rank 79) *Syracuse (Rank 76) *Binghamton (Rank 156) *Utica (Rank 166) *Watertown (Rank 178) Small: parts of *Burlington-Plattsburgh (Rank 90) *Elmira (Rank 173)
High Large: parts of Portland, OR DMA (Rank 23)
Oregon
Other
Small: all of Eugene DMA (Rank 121) Small: parts of *Spokane DMA (Rank 78) *Yakima-Pasco-Rchlnd-Knnwck DMA (Rank 126)
Low
Small: all of Bend, OR DMA (Rank 196) Small: parts of *Boise DMA (Rank 119) *Medford-Klamath Falls DMA (Rank 141)
United Illuminating High Large: parts of *New York DMA (Rank 1) *Hartford-New Haven DMA (Rank 28)
Washington
High Large: *all of Seattle-Tacoma DMA (Rank 13) *parts of Portland, OR DMA (Rank 23)
Other Small: parts of *Spokane DMA (Rank 78) *Yakima-Pasco-Rchlnd-Knnwck DMA (Rank 126)
A-12
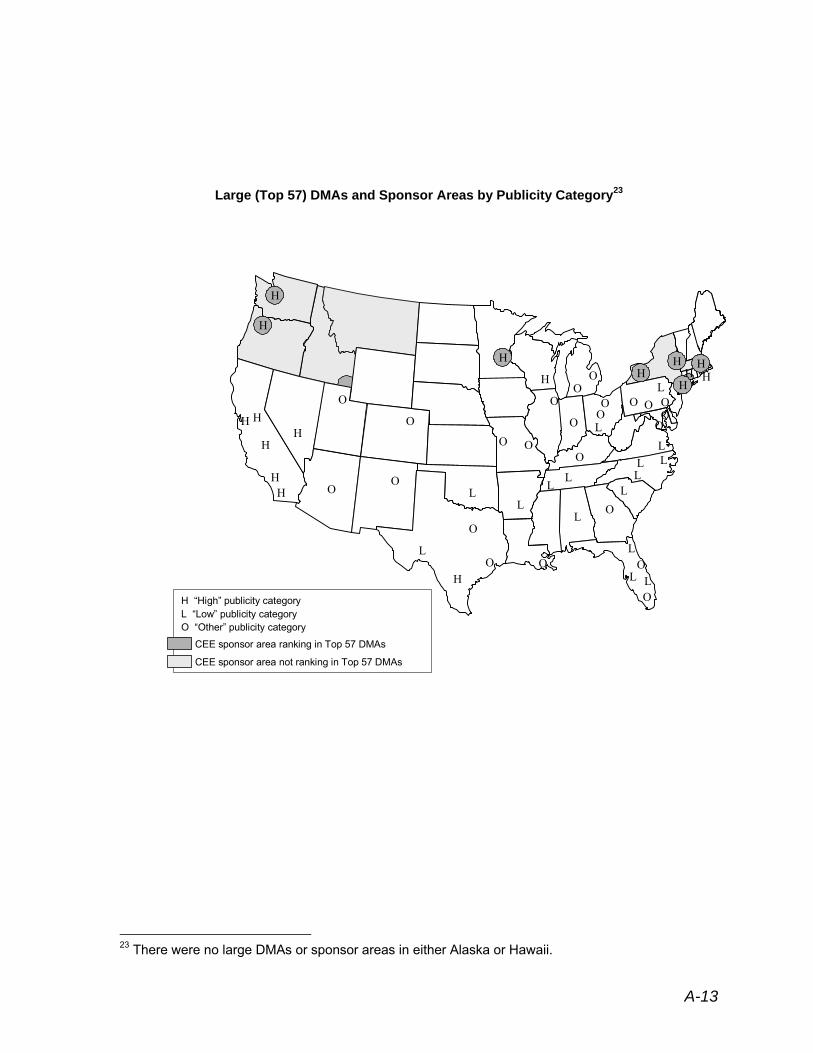
Large (Top 57) DMAs and Sponsor Areas by Publicity Category23
H O
HH
H H
H
O
O
O O
L
L
H O
O
O
L OL
L
L
L L O
O
L L L
L L L
L
O
O O
O O
O L
OO
H
O O
O
O
H
H “High” publicity category L “Low” publicity category O “Other” publicity category
CEE sponsor area ranking in Top 57 DMAs
CEE sponsor area not ranking in Top 57 DMAs
H
O
HH H
H
H
H
H
OH
23 There were no large DMAs or sponsor areas in either Alaska or Hawaii.
A-13
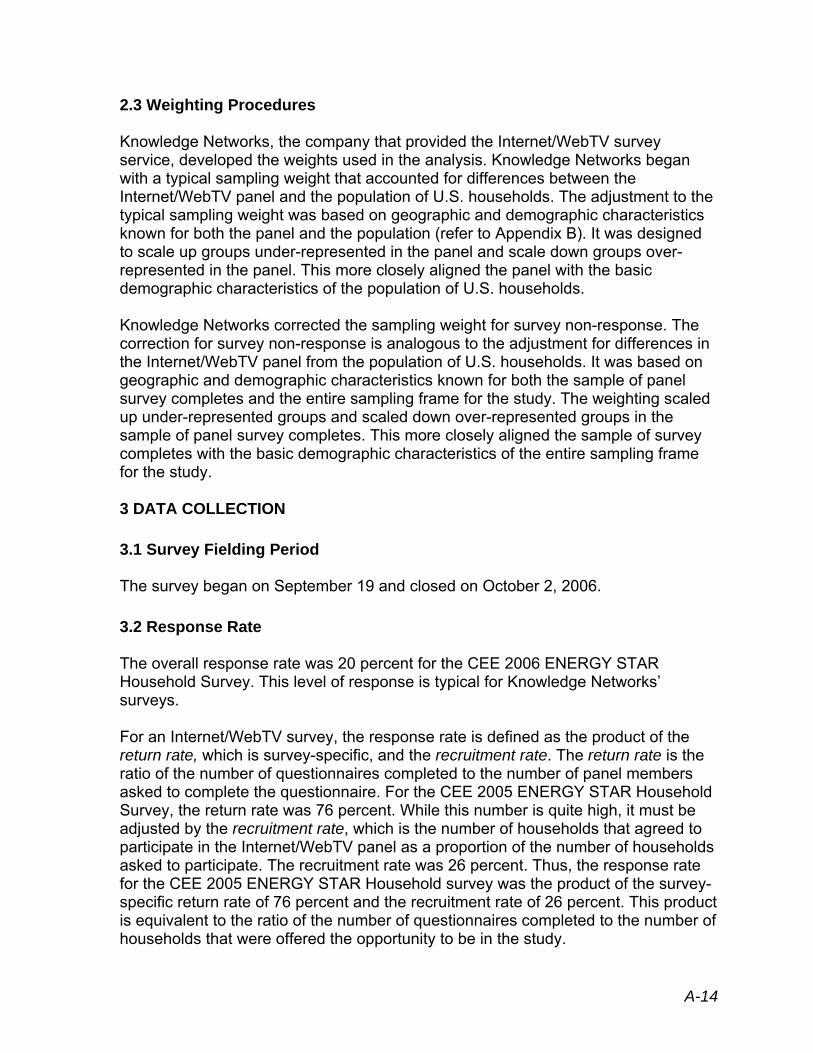
2.3 Weighting Procedures
Knowledge Networks, the company that provided the Internet/WebTV survey service, developed the weights used in the analysis. Knowledge Networks began with a typical sampling weight that accounted for differences between the Internet/WebTV panel and the population of U.S. households. The adjustment to the typical sampling weight was based on geographic and demographic characteristics known for both the panel and the population (refer to Appendix B). It was designed to scale up groups under-represented in the panel and scale down groups overrepresented in the panel. This more closely aligned the panel with the basic demographic characteristics of the population of U.S. households.
Knowledge Networks corrected the sampling weight for survey non-response. The correction for survey non-response is analogous to the adjustment for differences in the Internet/WebTV panel from the population of U.S. households. It was based on geographic and demographic characteristics known for both the sample of panel survey completes and the entire sampling frame for the study. The weighting scaled up under-represented groups and scaled down over-represented groups in the sample of panel survey completes. This more closely aligned the sample of survey completes with the basic demographic characteristics of the entire sampling frame for the study.
3 DATA COLLECTION
3.1 Survey Fielding Period
The survey began on September 19 and closed on October 2, 2006.
3.2 Response Rate
The overall response rate was 20 percent for the CEE 2006 ENERGY STAR Household Survey. This level of response is typical for Knowledge Networks’ surveys.
For an Internet/WebTV survey, the response rate is defined as the product of the return rate, which is survey-specific, and the recruitment rate. The return rate is the ratio of the number of questionnaires completed to the number of panel members asked to complete the questionnaire. For the CEE 2005 ENERGY STAR Household Survey, the return rate was 76 percent. While this number is quite high, it must be adjusted by the recruitment rate, which is the number of households that agreed to participate in the Internet/WebTV panel as a proportion of the number of households asked to participate. The recruitment rate was 26 percent. Thus, the response rate for the CEE 2005 ENERGY STAR Household survey was the product of the survey-specific return rate of 76 percent and the recruitment rate of 26 percent. This product is equivalent to the ratio of the number of questionnaires completed to the number of households that were offered the opportunity to be in the study.
A-14
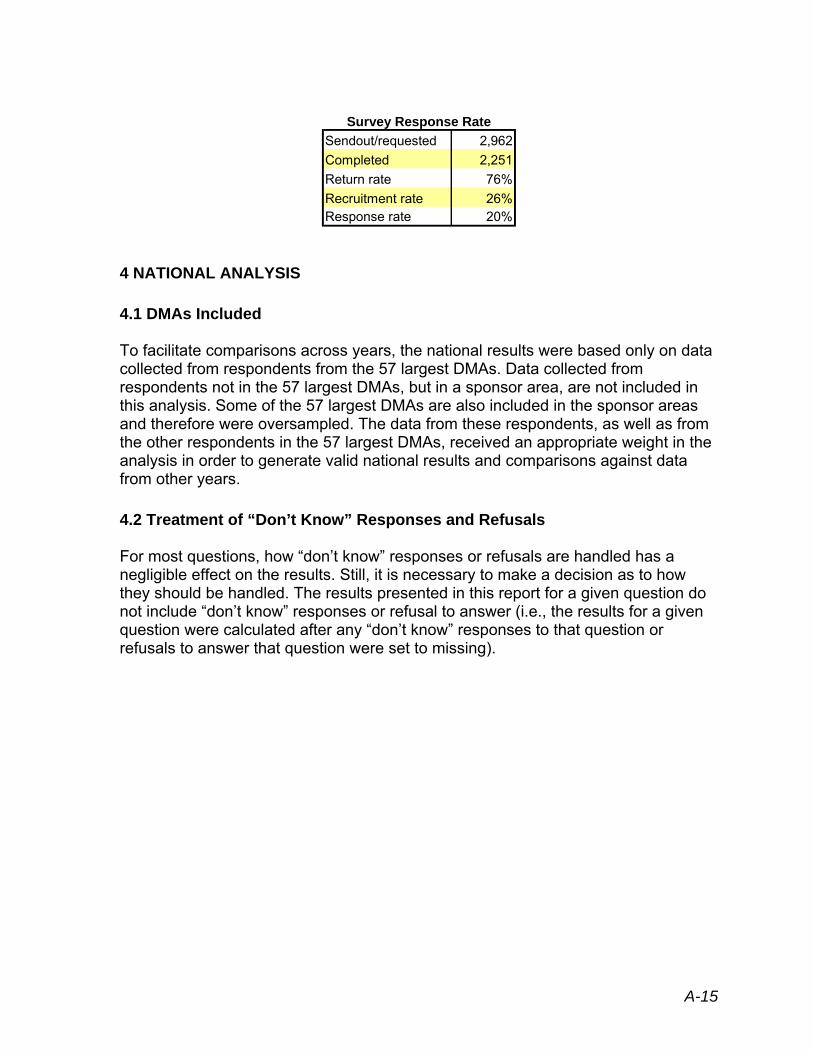
Survey Response Rate Sendout/requested 2,962 Completed 2,251 Return rate 76% Recruitment rate 26% Response rate 20%
4 NATIONAL ANALYSIS
4.1 DMAs Included
To facilitate comparisons across years, the national results were based only on data collected from respondents from the 57 largest DMAs. Data collected from respondents not in the 57 largest DMAs, but in a sponsor area, are not included in this analysis. Some of the 57 largest DMAs are also included in the sponsor areas and therefore were oversampled. The data from these respondents, as well as from the other respondents in the 57 largest DMAs, received an appropriate weight in the analysis in order to generate valid national results and comparisons against data from other years.
4.2 Treatment of “Don’t Know” Responses and Refusals
For most questions, how “don’t know” responses or refusals are handled has a negligible effect on the results. Still, it is necessary to make a decision as to how they should be handled. The results presented in this report for a given question do not include “don’t know” responses or refusal to answer (i.e., the results for a given question were calculated after any “don’t know” responses to that question or refusals to answer that question were set to missing).
A-15
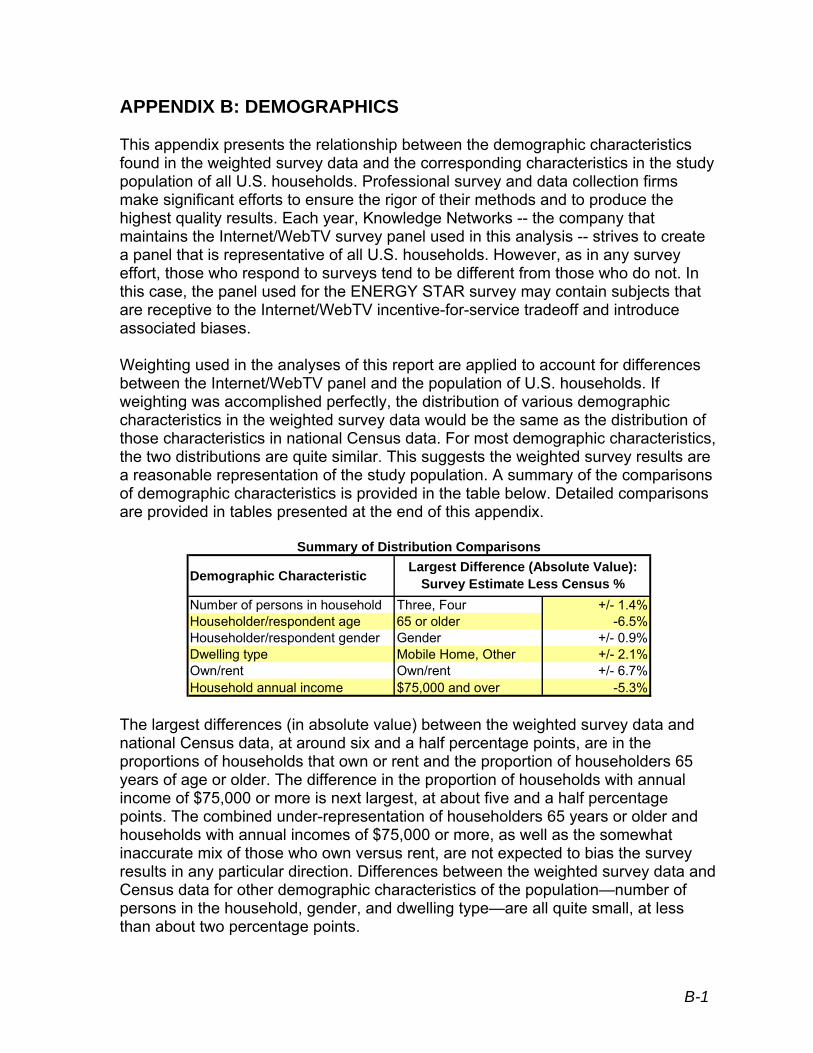
APPENDIX B: DEMOGRAPHICS
This appendix presents the relationship between the demographic characteristics found in the weighted survey data and the corresponding characteristics in the study population of all U.S. households. Professional survey and data collection firms make significant efforts to ensure the rigor of their methods and to produce the highest quality results. Each year, Knowledge Networks -- the company that maintains the Internet/WebTV survey panel used in this analysis -- strives to create a panel that is representative of all U.S. households. However, as in any survey effort, those who respond to surveys tend to be different from those who do not. In this case, the panel used for the ENERGY STAR survey may contain subjects that are receptive to the Internet/WebTV incentive-for-service tradeoff and introduce associated biases.
Weighting used in the analyses of this report are applied to account for differences between the Internet/WebTV panel and the population of U.S. households. If weighting was accomplished perfectly, the distribution of various demographic characteristics in the weighted survey data would be the same as the distribution of those characteristics in national Census data. For most demographic characteristics, the two distributions are quite similar. This suggests the weighted survey results are a reasonable representation of the study population. A summary of the comparisons of demographic characteristics is provided in the table below. Detailed comparisons are provided in tables presented at the end of this appendix.
/
Summary of Distribution Comparisons
Demographic Characteristic
Number of persons in household Three, Four +/- 1.4% Householder/respondent age 65 or older -6.5% Householder/respondent gender Gender +/- 0.9% Dwelling type Mobile Home, Other +/- 2.1% Own rent Own/rent +/- 6.7% Household annual income $75,000 and over -5.3%
Largest Difference (Absolute Value): Survey Estimate Less Census %
The largest differences (in absolute value) between the weighted survey data and national Census data, at around six and a half percentage points, are in the proportions of households that own or rent and the proportion of householders 65 years of age or older. The difference in the proportion of households with annual income of $75,000 or more is next largest, at about five and a half percentage points. The combined under-representation of householders 65 years or older and households with annual incomes of $75,000 or more, as well as the somewhat inaccurate mix of those who own versus rent, are not expected to bias the survey results in any particular direction. Differences between the weighted survey data and Census data for other demographic characteristics of the population—number of persons in the household, gender, and dwelling type—are all quite small, at less than about two percentage points.
B-1
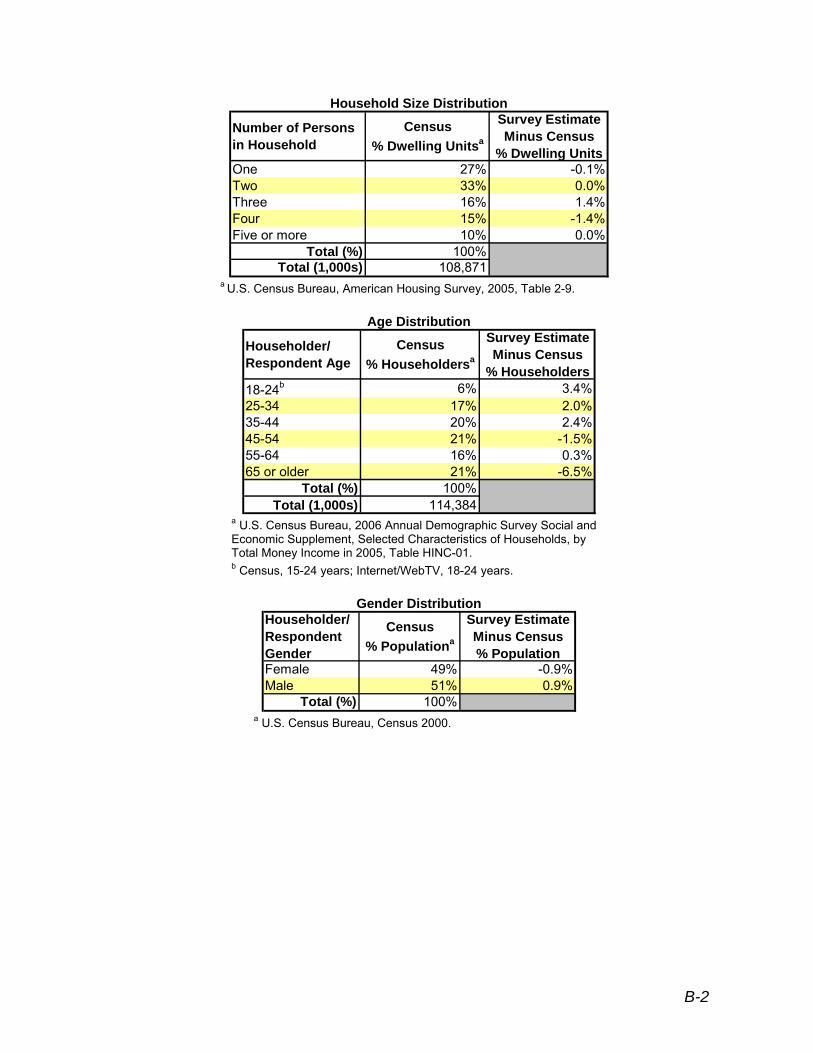
Household Size Distribution
Number of Persons in Household
Census % Dwelling Unitsa
Survey Estimate Minus Census
% Dwelling Units One 27% -0.1% Two 33% 0.0% Three 16% 1.4% Four 15% -1.4% Five or more 10% 0.0%
Total (%) 100% Total (1,000s) 108,871
a U.S. Census Bureau, American Housing Survey, 2005, Table 2-9.
Age Distribution
Householder/ Respondent Age
Census % Householdersa
Survey Estimate Minus Census
% Householders 18-24b 6% 3.4% 25-34 17% 2.0% 35-44 20% 2.4% 45-54 21% -1.5% 55-64 16% 0.3% 65 or older 21% -6.5%
Total (%) 100% Total (1,000s) 114,384
a U.S. Census Bureau, 2006 Annual Demographic Survey Social and Economic Supplement, Selected Characteristics of Households, by Total Money Income in 2005, Table HINC-01. b Census, 15-24 years; Internet/WebTV, 18-24 years.
Gender Distribution Householder/ Respondent Gender
Census % Populationa
Survey Estimate Minus Census % Population
Female 49% -0.9% Male 51% 0.9%
Total (%) 100% a U.S. Census Bureau, Census 2000.
B-2

Dwelling Type Distribution
Dwelling Type Census
% Dwelling Unitsa
Survey Estimate Minus Census
% Dwelling Units
Single-family, unattached 61% -1.1% Single-family, attached 6% 3.4% Apt. bldg. (>=2 units) 22% 0.9% Mobile home 6% -1.4% Other 5% -1.9%
Total (%) 100% Total (1,000s) 111,122
a U.S. Census Bureau, American Housing Survey, 2005, Table 2-1.
Own/Rent Distribution
Own/Rent Census
% Householdsa
Survey Estimate Minus Census % Households
Own Rent
69% 31%
-6.7% 6.7%
Total (%) 100% Total (1,000s) 108,871
a U.S. Census Bureau, American Housing Survey, 2005, Table 2-1.
Income Distribution Total Household Annual Income (before taxes)
Census % Householdsa
Survey Estimate Minus Census % Households
Less than $15,000 15% -1.0% $15,000-$24,999 12% -0.6% $25,000-$49,999 26% 4.1% $50,000-$74,999 18% 2.8% $75,000 and over 28% -5.3%
Total (%) 100% Total (1,000s) 114,384
a U.S. Census Bureau, 2006 Annual Demographic Survey Social and Economic Supplement, Selected Characteristics of Households, by Total Money Income in 2005, Table HINC-01.
B-3

C-1
APPENDIX C: ADDITIONAL QUESTIONS FROM 2006 SURVEY This appendix presents the results of new questions added to the survey in 2005 and 2006 that were not discussed in the main body of the report. 1 ENERGY STAR DESIGNATION Twenty-eight percent of households that recognized the ENERGY STAR label (aided) thought that Underwriters Laboratories decides if a product deserves the label. Twenty-seven percent of households thought the U.S. Government makes this decision, while 24 percent thought product manufacturers make the decision.
Designates ENERGY STAR Product (Base = Recognize label (aided), n=943)
1%
1%
19%
24%
27%
28%
0% 20% 40% 60% 80% 100%
**Retailer/store
Other
Electric and gas utility
Product manufacturer
US government
Underwriters Laboratories
Note: QB: “As far as you know, who decides if a product deserves the ENERGY STAR label?
** 2006 and 2005 proportions are statistically different from each other at the 5-percent level of significance (p-
value≤0.05).
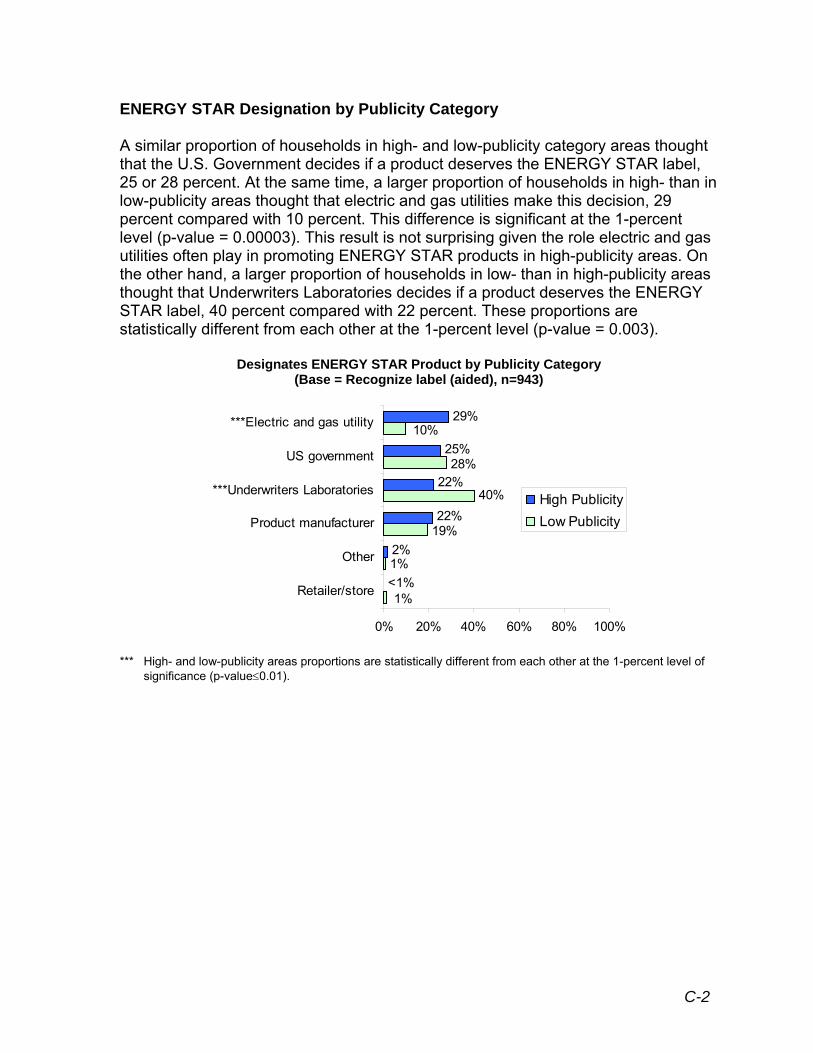
ENERGY STAR Designation by Publicity Category
A similar proportion of households in high- and low-publicity category areas thought that the U.S. Government decides if a product deserves the ENERGY STAR label, 25 or 28 percent. At the same time, a larger proportion of households in high- than in low-publicity areas thought that electric and gas utilities make this decision, 29 percent compared with 10 percent. This difference is significant at the 1-percent level (p-value = 0.00003). This result is not surprising given the role electric and gas utilities often play in promoting ENERGY STAR products in high-publicity areas. On the other hand, a larger proportion of households in low- than in high-publicity areas thought that Underwriters Laboratories decides if a product deserves the ENERGY STAR label, 40 percent compared with 22 percent. These proportions are statistically different from each other at the 1-percent level (p-value = 0.003).
Designates ENERGY STAR Product by Publicity Category (Base = Recognize label (aided), n=943)
***Electric and gas utility
US government
***Underwriters Laboratories
Product manufacturer
Other
Retailer/store 1%
1%
10%
2%
Hi iciici
40%
29%
19%
28%
<1%
22%
22%
25%
gh Publ ty Low Publ ty
0% 20% 40% 60% 80% 100%
*** High- and low-publicity areas proportions are statistically different from each other at the 1-percent level of significance (p-value≤0.01).
C-2
2 ENERGY STAR PRODUCT SATISFACTION
Household satisfaction with a given product in a product category that has an ENERGY STAR specification does not appear to vary based on whether or not the product had an ENERGY STAR label (p-value ≥ 0.10). On a scale of 1 to 5, where 1 means “very dissatisfied” and 5 means “very satisfied,” products with and without the ENERGY STAR label had an average satisfaction rating of 4.3. At the 10-percent level of significance, no product with the ENERGY STAR label received a higher satisfaction rating compared with products without the label. Households that purchased a skylight, copying machine, washing machine, scanner, or thermostat without the label were more satisfied than their counterparts that knowingly purchased models with the label.
Three product satisfaction results increased dramatically in 2006 for households that knowingly purchased a product with the ENERGY STAR label. The average satisfaction rating of a compact fluorescent light bulb, furnace or boiler, or a newly built home for households in 2006 that knowingly purchased ENERGY STAR rated models were statistically different from those reported in 2005. The 2005 to 2006 increases were:
• compact fluorescent light bulb from 3.6 to 4.4 (p-value = 0.013),
• furnace or boiler 3.6 to 4.6 (p-value = 0.075), and
• newly built home 3.7 to 4.6 (p-value = 0.092).
C-3

ENERGY STAR vs. Non-ENERGY STAR Product Satisfaction (Bases = Recognize label aided and purchased specified product)
*** ENERGY STAR and Non-ENERGY STAR product proportions are statistically different from each other at the 1-percent level of significance (p-value≤0.01).
** ENERGY STAR and Non-ENERGY STAR product proportions are statistically different from each other at the 5-percent level of significance (p-value≤0.05).
* ENERGY STAR and Non-ENERGY STAR product proportions are statistically different from each other at the 10-percent level of significance (p-value≤0.10).
C-4

3 CONSUMER PERCEPTIONS
Survey respondents that recognized the ENERGY STAR label (aided) were asked to indicate how strongly they agree or disagree with a number of attitudinal statements about ENERGY STAR-labeled products.24 The statements were shown to respondents in random order.
For purposes of discussion the statements are grouped into three categories:
• Environmental and social responsibility messaging
• Purchasing preference
• Product attributes and performance
The 2006 survey results indicate that households generally agree with positive statements about the ENERGY STAR label and disagree with negative statements about the label.25 Few statements elicit strong agreement or strong disagreement among substantial proportions of households, In contrast, a number of statement generated neutral responses from a sizeable proportion of households expressed neutrality toward a number of statements. A more detailed discussion of the findings regarding the attitudinal statements is provided below
24 These statements are numbered Q16a through Q16p in the survey. Several experimental attitudinal questions from 2005 were dropped or reworded slightly in response to CEE’s own analysis of these questions. A detailed explanation of these changes is provided in Appendix A, Section 1.3.1 Attitudinal and Purchasing Role Questions. 25 In this discussion, the term “agree” is used to correspond to survey responses of “strongly agree” or “somewhat agree.” Similarly, the term “disagree” corresponds to survey responses of “strongly disagree” or “somewhat disagree.”
C-5
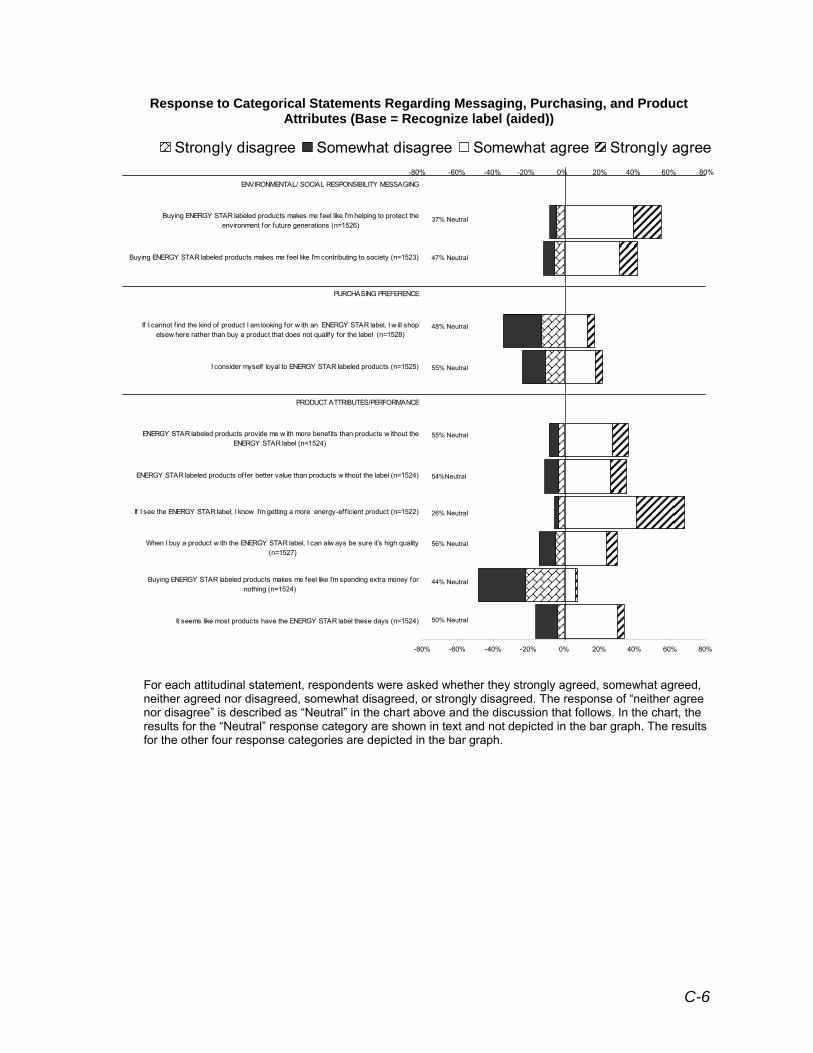
Response to Categorical Statements Regarding Messaging, Purchasing, and Product Attributes (Base = Recognize label (aided))
Strongly disagree Somewhat disagree Somewhat agree Strongly agree
I li l ( )
i l lii
i l i i(
l I i ici (
l l i (
l l i i i i label (
I /
i lf l l l (
I f i i looki i li (
i l li ibuti i (
i l li lpienvi ions (
I / IBILI ING
l
l
l
l
l
l
l
l
l
lt seems ke most products have the ENERGY STAR abel these days n=1524
Buy ng ENERGY STAR abeled products makes me feel ke I'm spending extra money for noth ng (n=1524)
When I buy a product w th the ENERGY STAR abel, I can alw ays be sure t’s high qual ty n=1527)
If I see the ENERGY STAR abel, I know ’m gett ng a more energy-eff ent product n=1522)
ENERGY STAR abeled products offer better va ue than products w thout the label n=1524)
ENERGY STAR abe ed products prov de me w th more benef ts than products w thout the ENERGY STAR n=1524)
PRODUCT ATTRBUTES PERFORMANCE
I cons der myse oya to ENERGY STAR abeled products n=1525)
If cannot nd the knd of product I am ng for w th an ENERGY STAR abel, I w ill shop elsew here rather than buy a product that does not qual fy for the label n=1528)
PURCHASING PREFERENCE
Buy ng ENERGY STAR abeled products makes me feel ke I'm contr ng to soc ety n=1523)
Buy ng ENERGY STAR abeled products makes me feel ke I'm he ng to protect the ronment for future generat n=1526)
ENV RONMENTAL SOCIAL RESPONS TY MESSAG
-80% -60% -40% -20% 0% 20% 40% 60% 80%
37% Neutra
47% Neutra
48% Neutra
55% Neutra
55% Neutra
54%Neutra
26% Neutra
56% Neutra
44% Neutra
50% Neutra
-80% -60% -40% -20% 0% 20% 40% 60% 80%
For each attitudinal statement, respondents were asked whether they strongly agreed, somewhat agreed, neither agreed nor disagreed, somewhat disagreed, or strongly disagreed. The response of “neither agree nor disagree” is described as “Neutral” in the chart above and the discussion that follows. In the chart, the results for the “Neutral” response category are shown in text and not depicted in the bar graph. The results for the other four response categories are depicted in the bar graph.
C-6
3.1 Environmental and Social Responsibility Messaging
The development of the environmental and social responsibility messaging of the ENERGY STAR label has been a strong focus of the national ENERGY STAR education campaign. In the 2006 survey, two statements addressed the label’s messaging in these areas: “Buying ENERGY STAR labeled products makes me feel like I’m helping to protect the environment for future generations” and “Buying ENERGY STAR labeled products makes me feel like I’m contributing to society”.
Of the ten statements that explore consumer attitudes toward the ENERGY STAR label and products, these two ranked second and third in terms of the proportion of households who agree with the statements. Of households that are recognize the ENERGY STAR label, 55 percent either strongly or somewhat agree with the statement that by buying ENERGY STAR labeled products they feel they are helping protect the environment. This is similar to the proportion of ENERGY STAR aware households that agreed with the statement in 2005. Forty-two percent of ENERGY STAR aware households strongly or somewhat agree that by purchasing ENERGY STAR products they feel they are contributing to society. This is also similar to the 2005 findings.
3.2 Purchasing Preferences
Increasing consumers’ preferences for purchasing ENERGY STAR-labeled products is also an intended outcome of the national campaign. In the 2006 survey, two separate statements were included to investigate households’ views of their purchasing preferences with respect to ENERGY STAR-labeled products. New in 2006 was the statement “If I cannot find the kind of product I am looking for with an ENERGY STAR label, I will shop elsewhere rather than buy a product that does not qualify for the label.” Seventeen percent of households either strongly or somewhat agree with this statement. Twice as many households (34 percent) either strongly or somewhat disagree. However, the largest proportion of households—nearly 50 percent --are neutral in their level of agreement or disagreement with this statement of their purchasing behavior.
In 2006, 22 percent of households agree with the second statement addressing households’ views of their purchasing preferences: “I consider myself loyal to ENERGY STAR products”. This is a nearly equivalent to the proportion of households that agreed with this statement in 2005.
3.3 Product Attributes and Performance
A third goal of the national ENERGY STAR education campaign has been to inform consumers that ENERGY STAR qualifying products are more efficient than nonqualifying models. The degree to which this goal is being accomplished is addressed in the 2006 survey by asking respondents their level of agreement or disagreement with the statement “If I see the ENERGY STAR label, I know I’m getting a much
C-7
more energy-efficient product.” Nearly 70 percent of respondents either strongly or somewhat agree with this statement. This indicates a high perception among consumers that the ENERGY-STAR label indicates superior performance with respect to energy efficiency relative to products without the label. The 2006 results cannot be directly compared with those of 2005 due to changes in the approach to investigating household’s perceptions of the label as an indicator of a product’s energy efficiency performance through attitudinal questions. However, like the 2006 results, the 2005 results suggested that a larger proportion of households perceived ENERGY STAR qualifying products as using energy more efficiently than nonqualifying products than the proportion of households that did not.
In 2006, perceptions of product quality were also directly addressed. Survey respondents were asked the level at which they agreed or disagreed with the statement “When I buy a product with the ENERGY STAR label, I can always be sure it’s high quality.” While the results show that 30 percent of households either strongly or somewhat agree with this statement—twice as many as those who strongly or somewhat disagree—the majority (56 percent) are neutral. This can be interpreted as suggesting that consumers do not have strong feelings regarding the ENERGY STAR label as a indicator of product quality. This question was also new in 2006, so it is not yet possible to ascertain whether or how these perceptions may be changing over time.
A number of attitudinal statements were included in the 2006 survey to measure consumers’ perceptions of ENERGY STAR product value. Two such statements are “ENERGY STAR products provide me with more benefits than products without the ENERGY STAR label” and “ENERGY STAR-labeled products offer better value than products without the label.” The results show that over a third of households (37 percent and 36 percent, respectively) either strongly or somewhat agree with these statements. They also indicate that the majority of households are neutral (55 percent and 54 percent, respectively). These findings are very similar to those of 2005, suggesting continued potential for increasing consumers’ perceptions of the value of ENERGY STAR products relative to products without the label.
The results related to the statement “Buying ENERGY STAR-labeled products makes me feel like I’m spending extra money for nothing” provide additional information on perceptions of product value. Here, nearly half (48 percent) of all households who recognize the ENERGY STAR label strongly or somewhat disagree with the statement, while 44 percent of households are neutral. Only 8 percent agree. Compared to 2005, these results show a significant increase in the proportion of households who disagree with this statement (p-value = 0.040) and a significant decrease in the proportion who are neutral (p-value = 0.070). While this finding does not address consumers views of the value of ENERGY STAR products relative to products without the label, it does indicate significant changes across these two years in consumers perceptions that extra money spent on ENERGY STAR-labeled products corresponds to some additional product attribute.
C-8
3.4 Consumer Perceptions by Publicity Category
The 2006 results also suggest that local and regional efforts to publicize ENERGY STAR have been successful in affecting consumers’ perceptions of the label. For nearly all of the attitudinal statements, the level of consumers’ agreement or disagreement is significantly different in high and low publicity areas in the expected direction. For example, with respect to the environmental and social messaging of the ENERGY STAR label, a significantly higher proportion of consumers in high than in low publicity areas strongly or somewhat agree with the statements that buying ENERGY STAR-labeled products makes them feel like they are helping protect the environment and contributing to society. Similarly, a significantly higher proportion of households in high than in low publicity areas strongly or somewhat disagree with the statement that buying ENERGY STAR-labeled products makes them feel like they are spending extra money for nothing.
C-9
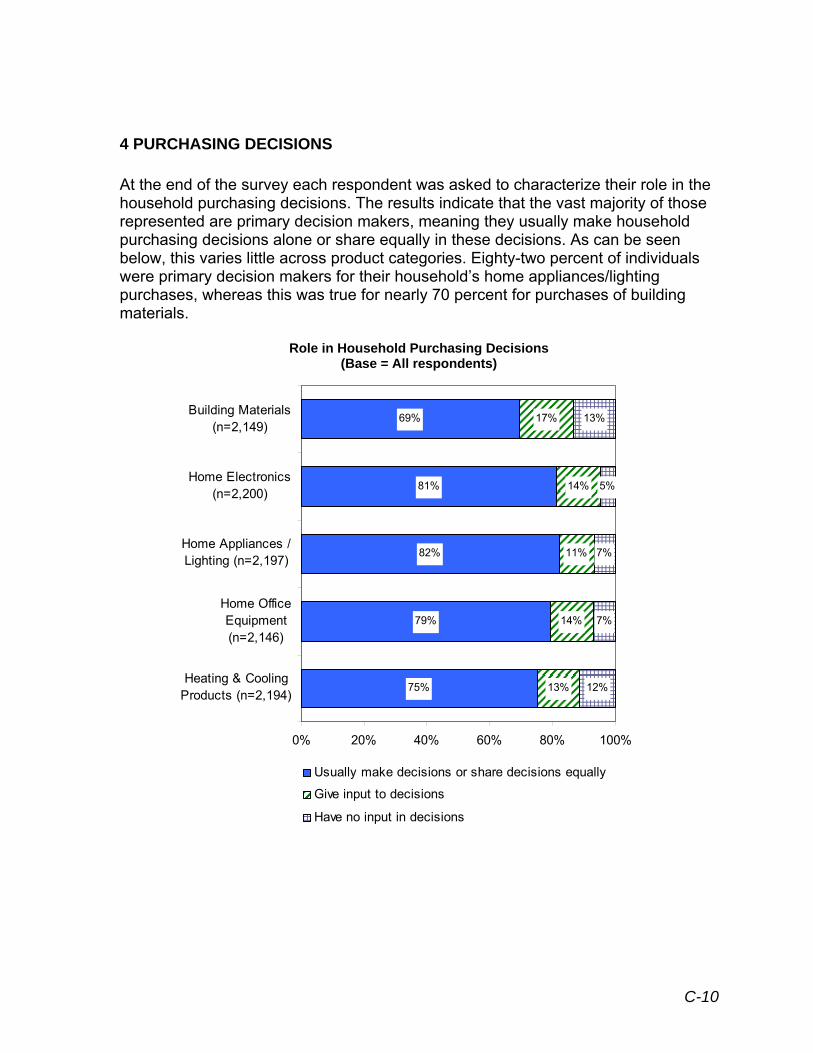
4 PURCHASING DECISIONS
At the end of the survey each respondent was asked to characterize their role in the household purchasing decisions. The results indicate that the vast majority of those represented are primary decision makers, meaning they usually make household purchasing decisions alone or share equally in these decisions. As can be seen below, this varies little across product categories. Eighty-two percent of individuals were primary decision makers for their household’s home appliances/lighting purchases, whereas this was true for nearly 70 percent for purchases of building materials.
Role in Household Purchasing Decisions (Base = All respondents)
Building Materials (n=2,149)
Home Electronics (n=2,200)
Home Appliances / Lighting (n=2,197)
Home Office Equipment (n=2,146)
Heating & Cooling Products (n=2,194)
75%
79%
82%
81%
69%
13%
14%
11%
14%
17%
12%
7%
7%
5%
13%
0% 20% 40% 60% 80% 100%
Usually make decisions or share decisions equally
Give input to decisions
Have no input in decisions
C-10
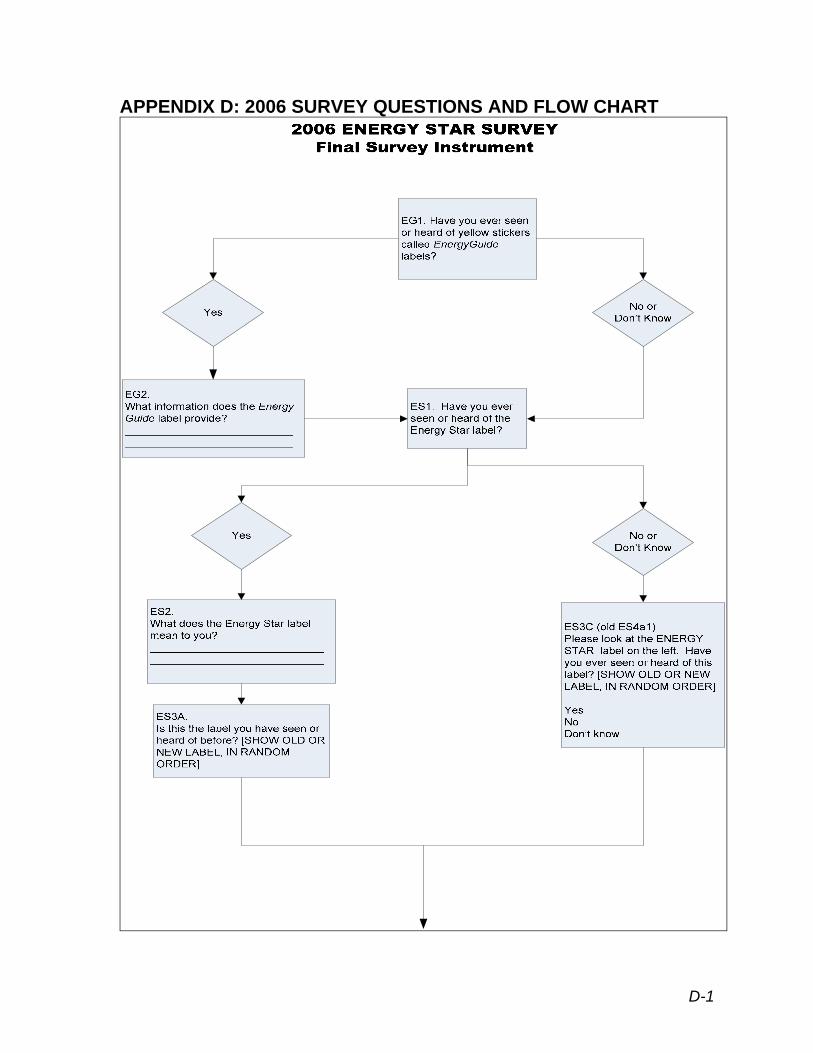
APPENDIX D: 2006 SURVEY QUESTIONS AND FLOW CHART
D-1
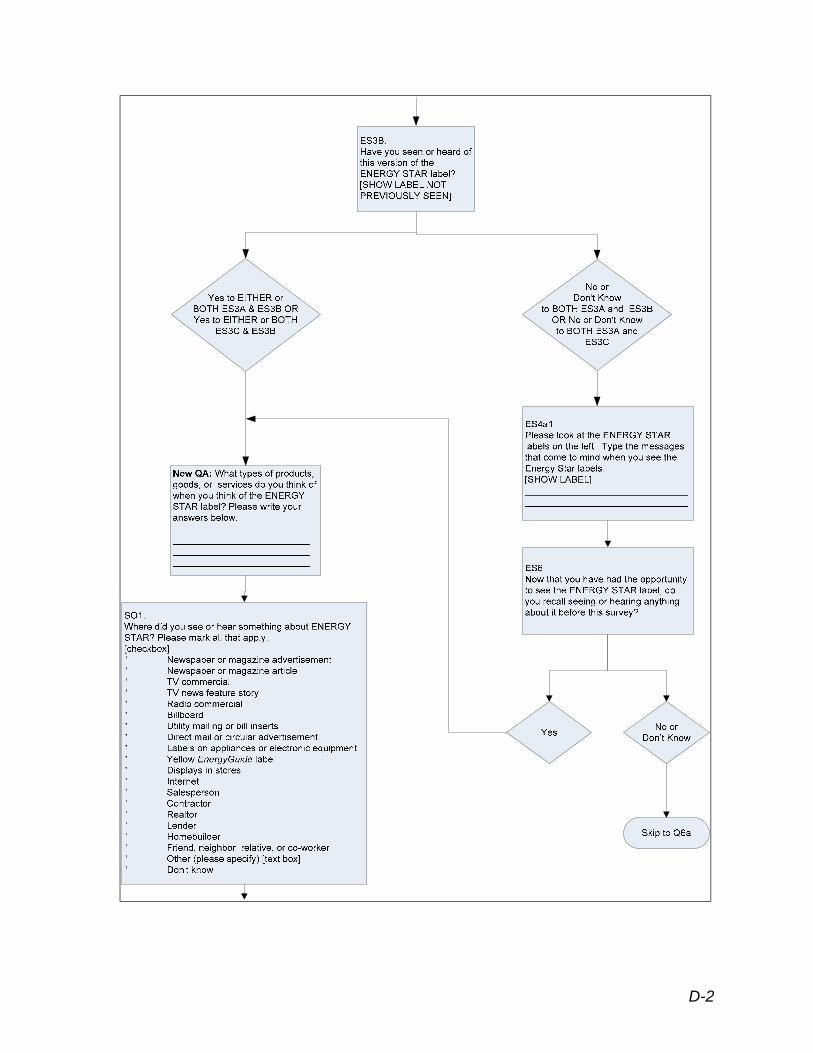
D-2
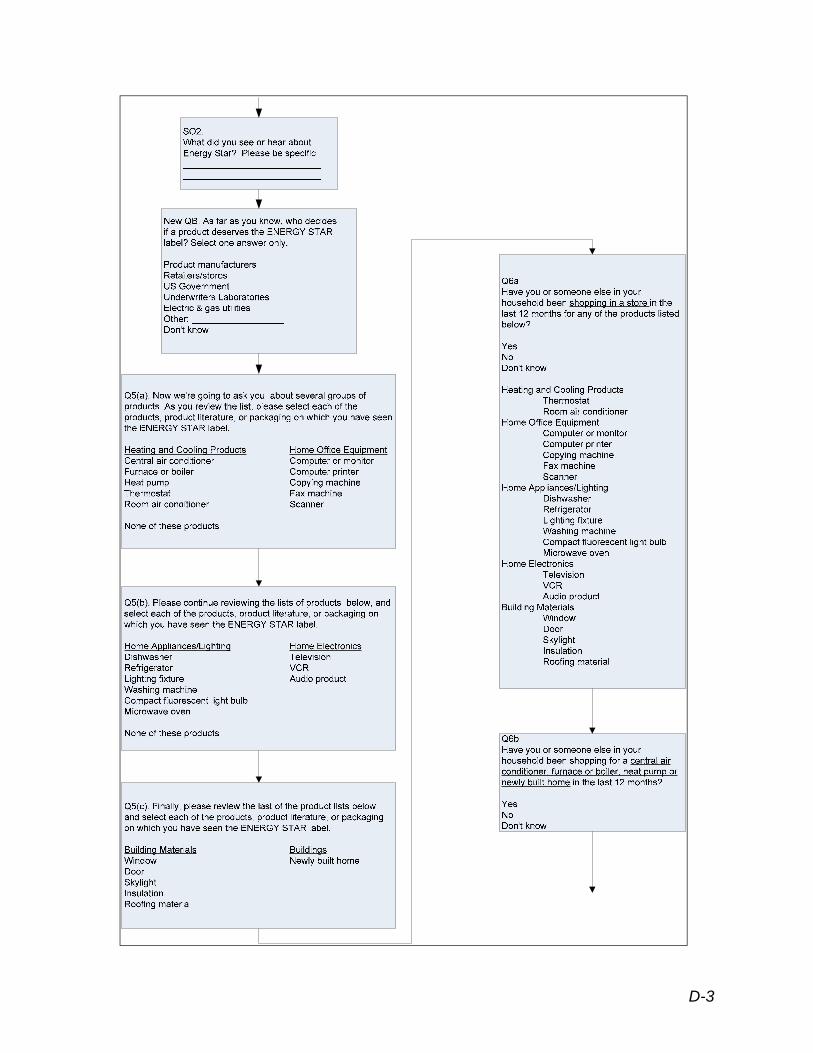
D-3
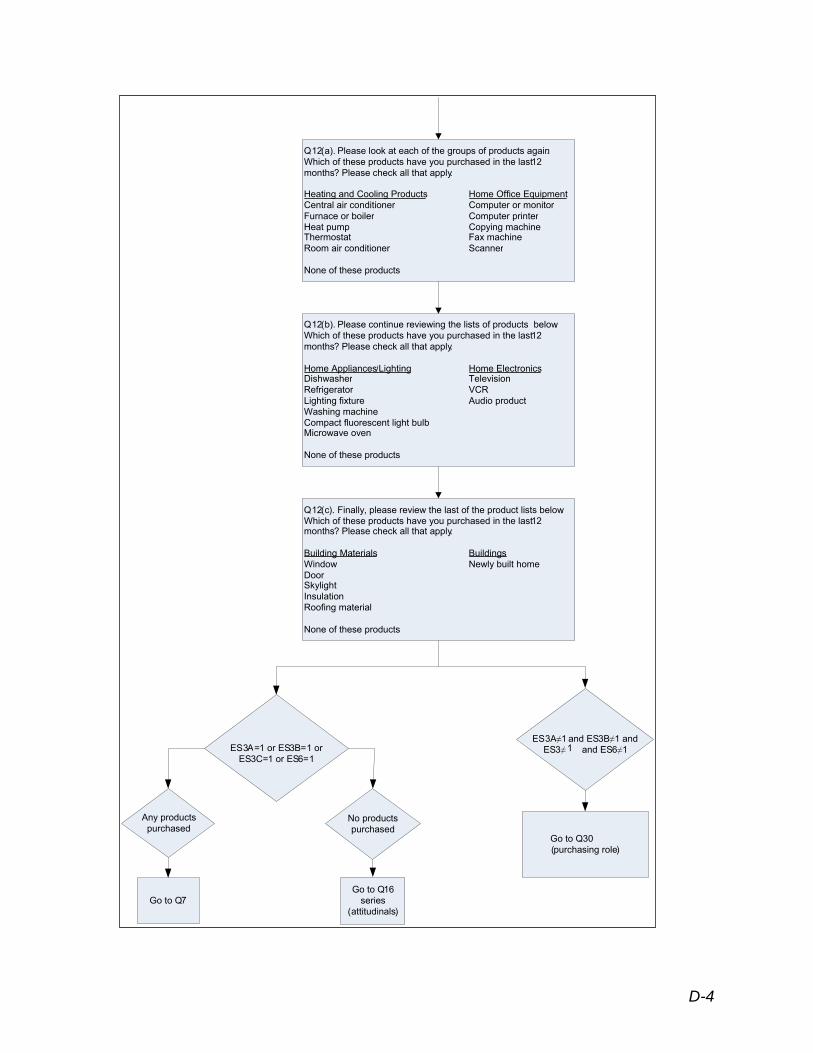
(a) . i
.
r r r r
Heat pump
r Scanner
(b) i below. i
.
li /Lighting Di r Television
r VCR A
(c) i w. i
.
ls Window NewlDoor
l
AA≠ ≠1 and ≠ 1 ≠1
A
( )
Go to Q30 ( i le)
Q12 . Please look at each of the groups of products againWh ch of these products have you purchased in the last 12 months? Please check all that apply
Heating and Cooling Products Home Office Equipment Central air conditione Computer or monitoFurnace or boile Computer printe
Copying machine Thermostat Fax machine Room air conditione
None of these products
Q12 . Please continue rev ewing the lists of products Wh ch of these products have you purchased in the last12 months? Please check all that apply
Home App ances Home Electronics shwashe
RefrigeratoLighting fixture udio product Washing machine Compact fluorescent light bulb Microwave oven
None of these products
Q12 . Finally, please rev ew the last of the product lists beloWh ch of these products have you purchased in the last12 months? Please check all that apply
Building Materia Buildings y built home
Skylight Insulation Roofing materia
None of these products
ES3 =1 or ES3B=1 or ES3C=1 or ES6=1
ES3 1 and ES3BES3 and ES6
No products purchased
ny products purchased
Go to Q16 series
attitudinalsGo to Q7
purchas ng ro
D-4

D-5
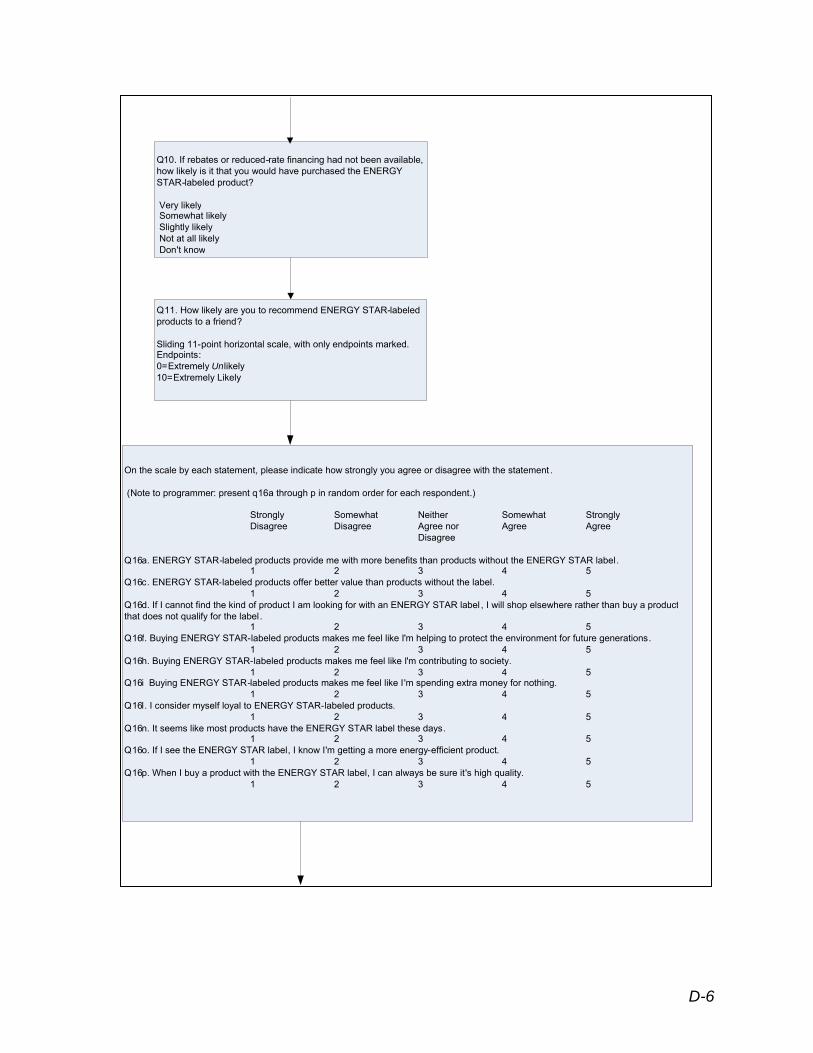
l
y
w
l i
Unlikely
i
( )
Strongly r Strongly Disagree Disagree A r Agree Agree
Disagree
l i i1 2 3 4 5
l i1 2 3 4 5
i l t l .
1 2 3 4 5 f i l
1 2 3 4 5 i
1 2 3 4 5 i i l
1 2 3 4 5 l l
1 2 3 4 5
1 2 3 4 5 Q
1 2 3 4 5 i1 2 3 4 5
Q10. If rebates or reduced-rate financing had not been available, how likely is it that you would have purchased the ENERGY STAR- abeled product?
Very likel Somewhat likely Slightly likely Not at all likely Don't kno
Q11. How likely are you to recommend ENERGY STAR-labeled products to a friend?
Sliding 11-point horizontal sca e, w th only endpoints marked. Endpoints: 0=Extremely 10=Extremely Likely
On the scale by each statement, please indicate how strongly you agree or disagree w th the statement .
Note to programmer: present q16a through p in random order for each respondent.
Somewhat Neithe Somewhat gree no
Q16a. ENERGY STAR- abeled products provide me w th more benefits than products w thout the ENERGY STAR label.
Q16c. ENERGY STAR- abeled products offer better value than products w thout the label.
Q16d. If I cannot find the kind of product I am looking for w th an ENERGY STAR label , I will shop e sewhere rather than buy a producthat does not qualify for the labe
Q16 . Buy ng ENERGY STAR- abeled products makes me feel like I'm helping to protect the environment for future generations.
Q16h. Buy ng ENERGY STAR-labeled products makes me feel like I'm contributing to society.
Q16 Buy ng ENERGY STAR- abeled products makes me feel like I'm spending extra money for nothing.
Q16 . I consider myself loyal to ENERGY STAR- abeled products.
Q16n. It seems like most products have the ENERGY STAR label these days.
16o. If I see the ENERGY STAR label, I know I'm getting a more energy-efficient product.
Q16p. When I buy a product w th the ENERGY STAR label, I can always be sure it's high quality.
D-6
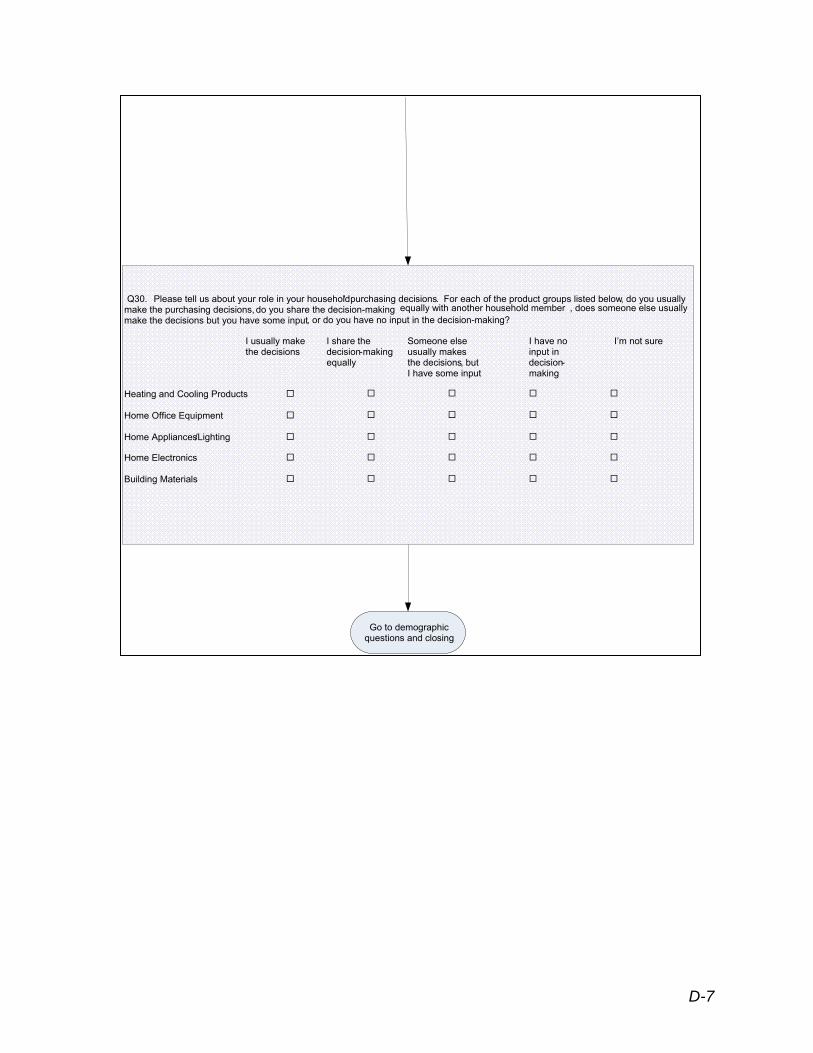
D-7
Go to demographic questions and closing
Please tell us about your role in your household' purchasing decisions. For each of the product groups listed below , do you usually make the purchasing decisions, do you share the decision-making equally with another household member , does someone else usually make the decisions but you have some input , or do you have no input in the decision-making?
I usually make I share the Someone else I have no I’m not surethe decisions decision-making usually makes input in
equally the decisions, but decision-I have some input making
Heating and Cooling Products � �
�
�
�
�
�
�
�
�
�
�
�
�
�
�
��
�
�
�
Home Office Equipment � Home Appliances/Lighting � Home Electronics � Building Materials �
Q30.