Embed Size (px)
Citation preview

4E3
NATIONAL ADVISORY COMMITTEE
FOR AERONAUTICS
TECHNICAL NOTE 3850
EXPERIMENTAL INVESTIGATION ON THE LANGLEY HELICOPTER TEST
TOWER OF COMPRESSIBILITY EFFECTS ON A ROTOR
HAVING NACA 632-015 ,MRFOIL SECTIONS
By James P. Shivers and Paul J. Carpenter
Langley Aeronautical LaboratoryLangley Field, Va.
Washington
December 1956 tJBRARY COPYDEC 71956
tMGLEY AERONAUTICAL LAfNJRATORLIBRARY NACA
MNCLEY FIELD, VIRGINIA

●
rWTIOW ADVISORY COMM13TEE F6R =OIWTICS
TECHNICAL NOTE 38x
-.. EXPERIMENTAL INVESTIGATION ON THE LANGLEY ECELICOFTERTEST
TOWER OF COMPRESSIBILITY EFFECTS ON A ROTOR
HAWG NACA 632-015 AIRFOIL SECTIONS
By Jsmes P. Shivers and Paul J. Carpenter
SUMMARY .
An investigation has been conducted on the Langley helicopter testtower to determine experimentally the effects of compressibili~ on thehovering performance amd the blade pitching moments of a helico~er rotorhaving NACA 632-(u airfoil sections. Data sre presented for blade tip
~ch numbers from O.31 to 0.71.
The results show that the rotor having NACA 632-015 airfoil sections
can operate at much higher mean blade lift coefficients before encountering.compressibility losses thsa were indicated from previous tests of rotorshaving NACA 23015 airfoil sections. At a tip Mach nuniberof 0.71, mean
. blade 13ft coefficients of about 0.6 were reached without any appreciablecompressibility losses.
The results show that the two-dimensional airfoil-section data pro-vide a reasonable basis for predicting the onset of compressibility lossesand that the differences in Mach nuniberfor drag divergence between air-foils shown by two-dimensional data are realized in actual rotor tests.
INTRODUCTION
One method of meeting the reqxi.rementsof increased helicopter speedsand higher disk loadings is by increasing the rotor-bhde tip Mach num-ber. Design studies of helicopters with rotor tip speeds in the highsubsonic Wch number range and with high blade loadings have emphasizedthe need for experimental rotor performance and blade pitching-momentdata on rotors operating in the region of compressibility effects.
Some initial data on the effects of compressibility on rotor hovering.performance have been obtained with rotor blades having NACA 23015 air-foil sections (ref. 1). The objective of that investigation was the
.

.— —
2 NACA TN 3850
determination of the effects of compressibility for that rotor and the.—
extent to which the compressibilitydrag rise could be predicted fromavailable two-dimensional-airfoil-sectiondata. w
The present investigation,which is an extension of that of ref-erence 1, was conducted with a rotor having NACA 632-01~ airfoil sections.
The purpose of this investigation was to determine the effects of com-pressibility on rotor performance and the-extent to which the onset ofcompressibility drag rise could be predicted-for a rotor blade havingthe same thickness ratio as that of reference 1 but with a chordwisethickness distribution more favorable for high-tip-speed performance.Wsmuch as no high-speed two-dimensional section drag data for the NACA632-01~ airfoil were available~ unpublished two-dimensional section data
for the NACA 6~-015 airfoil were used to make a comparison with the
experimental rotor drag divergence. (These data rematn unpublished sincethey include an undetermined tare in the section drag coefficient andthe max:hnumlift coefficients are uncertain.) This particular rotor wasselectec~for st@--because the NACA 632-015 airfoil is one of those con-
.-
sidered for low-pressure pressure-jet application wherein the rotor ~blades nust meet the dual reqtiements of operating at high tip speedsand yet have large internal volume for air ducts. Also, compressibilitylosses c:anbe studied at lower tip speeds thsm for thinner sections; thus,some ofYthe structural problems encountered in tests at high tip speeds -
are alleviated.
The rotor blades were tested on the Langley helicopter test tower.
over a tip Wch numiberrange from 0.31 to 0.71 (disk loading up to 7 poundsper sqzsre foot) with a corresponding blade tip Reynolds number range
. —from 2.1.9x IOb to 4.96x 1.06. Inasmuch as the rotor-blade leqd~_ edgemay becctie”rough in field service due–to abrasions or to ‘theaccumula-
—.
tion of foreign particles, such as bug spatters, the tests were repea~for three tip Mach numbers (O.~j 0.62, and 0.77-) with NACA standardleading-edge roughness.
Dra~and lifticurves as a function of blade angle of attack ~d.—.—
Mach nuaber were synthesized by using the rotor experimental data andunpublished data on the NACA 642-015 airfofi. Such Information shouldbe useful in predicting the onset of compressibilitypow& losses andtheir rate of growth for rotors having similar airfoils.
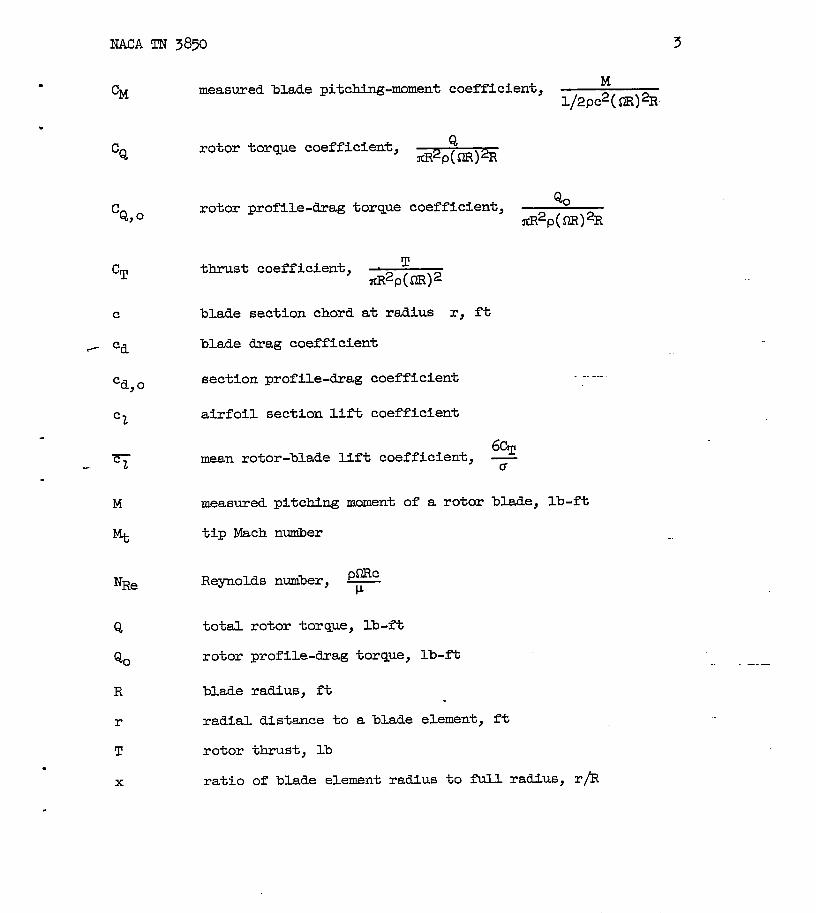
SYMBOLS
a
b
.slope of section-lift-coefficientcurve as a function of-sectionangle of attack (radian measure), assumed to be 5.73
.
number of blades per rotor
NACA ~ 3850
.CM
w
CQ
CQ,O
CT
c
~. cd
cd,O
c1
.
F.
M
%
‘Re
Q
Q.
R
r
T.
x
.
measured blade pitching-moment
rotor
rotor
torque coefficient,
profile-drag torque
3
coefficient, M
l/2pcqm)%
Qmzp(m)%
Qocoefficient, ~2p(~)2R
Tthrust coefficient, —YcR2p(m)2
blade section chord at radius r, ft
blade drag coefficient
section profile-drag coefficient
airfoil section lift coefficient
6%mean rotor-blade lift coef~icient,
T
measured pitching moment of a rotor blade, lb-ft
tip Mach nuuiber
pmcReynolds nuniber, ~
total rotor torque, lb-ft
rotor profile-drag torque, Ib-fi
blade radius, f%
radial distance to a blade element, ft
rotor
ratio
thrust, lb
of blade element radius to full radius, r/R

4- ““” NACA TN 3850
a angle of attack, deg
‘% :-blade section angle of-attack, deg
e blade-section pitch angle measured from line of zero lift,radians
P coefficient of viscosity, slugs/ft-sec
P mass densit~of air, sWgs/cu ft
Cs rotor solidity, bc/fiR,0.0374
ax rotor solidity at spanwise station x
,.
. .-
.-
,—.—
inflow angle at blade element, *~~ -$, radians
.
Q rotor angular velocity, radian/see
Subscript:
t rotor tip
APPARATUS AND TEST MBTHODS._
ver-Modi-
The “investigationreported herein was conducted on the modifiedsion of the Langley helicopter test tower described in reference ?.fication consisted of enlarging the working area at the base of the tower1and repowering with a S,000-horsepower variable-frequency electric drivemotor. Vhe rotor, as tested, was a fully articulated twb-bide rotor with
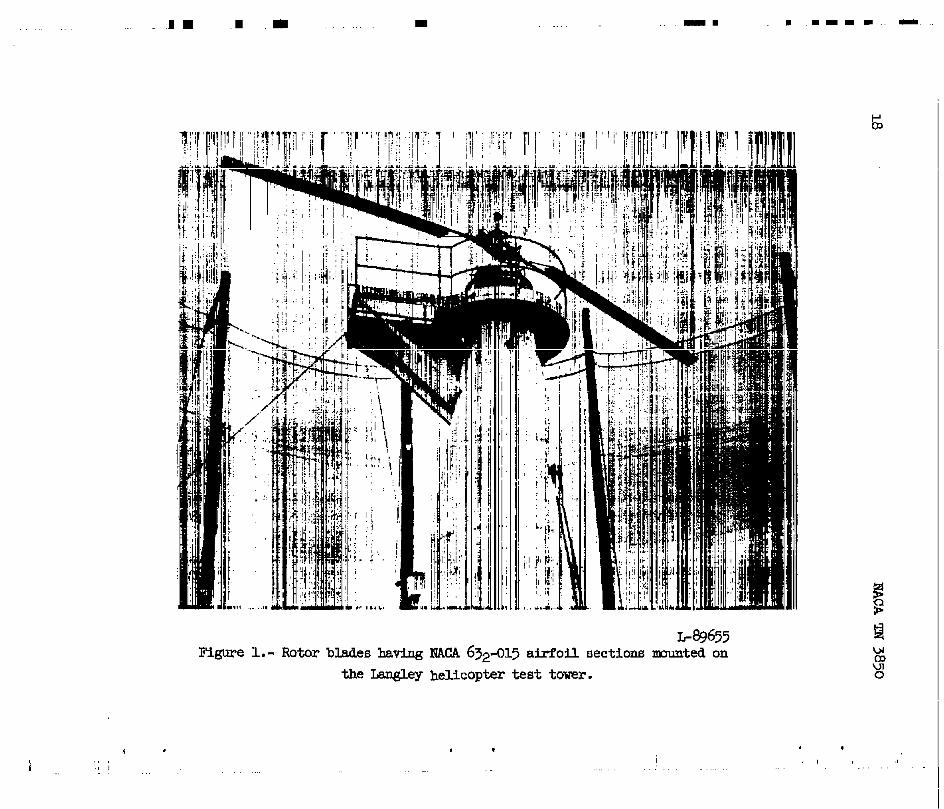
, the flapping hinge located on the center line “ofrotation-~d the &ag ‘-hinge 12 inches outboard of the center line. A photograph of the rotorinstallation on the Langley helicopter test tower is presented in figure 1.
Rotor Blades
The rotor blades used in the investigation were-of au-metal con- ‘“”struction and had NACA 632-015 airfoil sections. The rotor blades were
.-
of rectangular plan form with a chord of 13 inches, a radius of L8.41 feet,a solidity of 0.0374, and had 6.5° of linear negative twist between the-center of’rotation and the blade tip. A single rotor blade as tested
.
weighed 60 pounds and had a spanwise center of gravity at-h8.2 percent of. .

NACA TN 3850 5
. the radius and a chordwise centerof gravity at 26.8 percent chord fromthe leading edge. The pitch axis of the rotor blade was located at10.3 percent chord frcm the leading edge.
.
The main spar was a tubular-steel D-section located at the leadingedge of the airfoil. The outside of the airfoil was formedby a singlewrapping of statnless-steel skin cemented together at the trailing edge.The resrward 75 percent of the airfoil skin was reinforced with chord-wise hat sections bonded internally to the s{&less-steel skin a?.idto
--.—_
the main spar.
The rotor blade was a factory production model and detiated slightly.from a true NACA 632-015 airfoil section; however, the airfoil was smooth
and free from flat spots over most of the blade span in the sxea extendingback to about 20 percent of its chord. A convenient indication of relativesmoothness of the rotor-blade surfaces Is given by the zero-lift profile-drag coefficient. The present production blade of which the skin surfaceis hereinafter referred to as ‘*smooth”had a zero-lift drag coefficientof 0.0086. With stsndard NACA leading-edge roughness, the drag coeffi-cient at zero lift increased to about 0.012. If the blade had had anaerodynamically smooth surface, the drag coefficient would be expectedto be about 0.005.
. Tests were also made with leading-edge roughness added to the for-ward 8 percent of the blade chord over the entire blade span. The leading-edge roughness was standsrd NACA leading-edge roughness used inwind-ttiel
. airfoil tests (ref. 3). The roughness consisted of O.011-inch-diameterCarborundum particles applied over a surface length corresponding to8 percent of the chord back from the leading edge on the upper and laier”–surfaces. The particles covered from 5 to 10 percent of this area.
A resistance-type strain gage, mounted on the rotor-blade main sparat about the 20-percent-radius station, was used to monitor the bladestresses so that the test conditions would not exceed the estimated yieldstress of the blade-spsr material.
Test Methods and Accuracy
The test procedure was to set a given tip Mach number and then varythe blade pitch through a range from zero thrust to the point where anincrease in blade pitch did not increase rotor thrust, except in thehigh-tip-speed range where the blade stresses limited the allowable pitchrange. At each pitch setting, data were recorded both from visual dialreadings and on an oscillograph. Quantities measured were rotor thrust,rotor torque, blade pitch angle, blade pitching moment, rotor shaft rota-tional speed, blade drag @e, and blade flapping angle. The range of
.

6 NACA TN 3850,,
test ccmditions was chosen to exceed the tip Mach nunibercorrespondingto the force break in order to establish the rate of increase o~com.pressibility losses with tip angle of attack and Mach number.
.-.——
.—
.-.
The estimated accuracies of the basic qwntities measured duringthe tests are as foElows: rotor thrustj=@O pounds; rotor torque,*5O foct-pounds; rotor rotational speed, *1 revolution per tiutej and
all angular measurements, M.2°. The overall accuracy ofithe plottedresults is believed to be within *3 percent.
METHOD OF A.NA.LYSIS
In order to show the onset enlrate of growth of the compressibilitydrag rise and drag increase due to blade stall past the blade sectionmaximum lift, that part of the power affected by these losses had to beisolated. An analysis of the problem indicates that the profile-dragpower and, hence, the profile-drag torque coefficient would be chief~-affecte~.
A convenientimethodof showing the rate of growth of profile torquelosses for the range of tip Mach nunibersinvestigated is to use a ratioof profille-dragtorque coefficient deduced from the test results to thatcalculated by using conventional strip analysis and to plot the resulting
cQ)o(measured)ratios as a function of the blade-tip angle of--attack.
6Q,o(calculated)The assumption used in obtaining the calculated CQ,O at a given rotor
~ was the conventional airfoil drag polar
—
.
.
Cd,o = 0.0087 - 0.0216%.+ o.-2
and a l:lnearHft-coefficient
Th:Lsdrag polar has beenand experience has shown that-
slope .. ----
cl ‘=%
used.in several smalyses (refs. 4–to 7)it is a good a-pproximation.ofthe law-
speed profile drag of well-built, seml&ooth-~lades below the sectionmaximum lift. The measured rotor profile-drag torque coefficients weredetermined by subtracting a calculated induced torque coefficient-fromthe measured torque coefficient.
The data were plotted as a function of tipas the tip-section angle of attack and tip Machthe compressibility losses.
—
—
angle of attack inasmch -nuder are an index of
.-

NACA TN 38x 7..
.The rotor-blade-tip angles of attack were determined by first
plotting the rotor thrust coefficient as a function of measured rotor-tip pitch angle.. Secondly, a calculated tip inflow angle ~ was -
obtained from strip enalysis and was plotted as a function of calculatedrotor thrust coe~ficient. At a given experimental rotor thrust coeffi-cient, the tip angle of attack was obtained by subtracting the calculatedinflow angle qt obtained at the same thrust coefficient from the meas-
ured tip pitch angle 0.
The measured blade pitching moments consisted of nmments due to aero-~C and ~SS forces a~, since they were small, no attempt has beenmade to separate them into individual components. The measured momentshave been reduced to nondimensional coefficients.
The blade pitching moments were obtained by measuring the forces inthe blade pitch controls. At zero lift, the moments are those about thepitch axis which is located 10.5 percent from the chord leading edge.As the lift is increased, another moment appears which is a moment aboutthe blade center of gravity and is equal to the product of the bladelift and the distance between the center of gravity and the aerodynamiccenter. There also exists a moment due to centrifugal forces which actsto restore the blade section to flat pitch, but it is small and has beenignored.
No attempts were made to obtain the blade aerodynamic moment by. subtracting the moment due to the displacement of the center of grav%ty
from the aero~c center. Ihasmuch as the aerodynamic-center posi-------.-
tion, especially with respect to high tip speeds, is not precisely ~0’wBand the position of the aerodynamic center tith respect to the bladecenter of gravity has a very powerful effect on the blade pitchingmoment, no correction to the data has been ~de. Thus, more signlfic=ceshould be attached to the presence or absence of abrupt changes ofpitching-moment slopes rather than to the actual values.
RESULTS AND DISCUSSION
The basic hovering performance and rotor blade pitching-momentcurves are presented first. From these basic curves, a detailed anal-ysis of the effects of compressibility and stall are presented, togethertith a comparison of the test rotor blades wtth the rotor of reference 1.Synthesized rotor-blade airfoil data that can be used to predict high-tip-speed performance of rotors having similar airfoil sections are also
. shown.
.
8 NACATN 38x
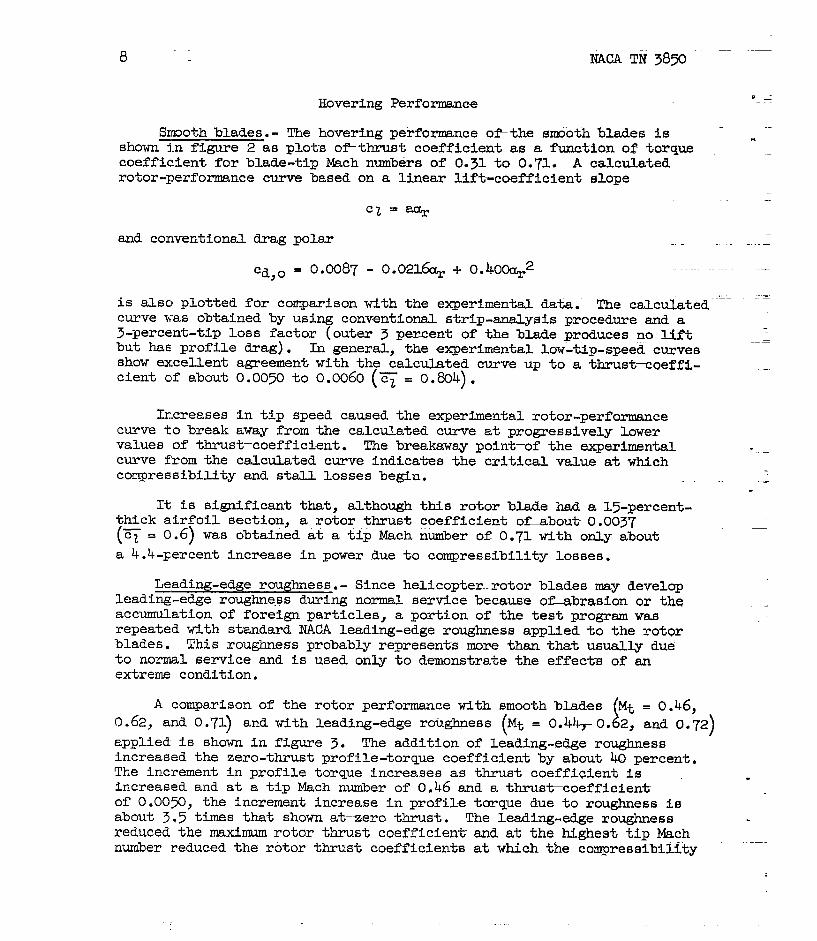
Hovering PerformanceP_;
&moth blades.- T!hehovering performmce ofithe smooth blades is-—
shown in figure 2 as plot-so~thrust coefficient as a -tion of torque.
coefficient for blade-tip lkch numbers of 0.31 to 0.71. A calculatedrotor-performance curve based on a linear lift-coefficient slope
Cl=s+
and conventional drag polar
cd, O = 0.0087 - o.021~ -1-o.koocl#
is al.SCIplotted for comparison with the experimental dati.” The c~c~ted “curve was obtained by using conventional strip-analysisprocedure and a3-percent-tip loss factor (outer 3 percent of the blade produces no 4ftbut haE profile drag). k general, the experimental low-tip-speed curves
—
show ex.cel.lentagreement with the calculated curve up to a thrustmoeffj.-cient c,fabout 0.0050 to 0.0060 (~= 0.804).
—.
Ir.creasesin tip speed caused the experimental rotor-performancecurve to break away from the calculated curve atiprogressively lowervalues of thrust-coefficient. The breakaway point–of the experimental .curve fyom the calculated curve indicates the critical value at whichcompressibilityand stall losses begin. -.
.-.
It is significant that, although this rotor blade had a 15-percent-thick airfoil section, arotor thrust coefficient otibout 0.0037
(q= 0.6) was obtained at a tip Mach nuniberof 0.71 with only about
a 4.4-~ercent increase in power due to compressibility losses.
Leading-edge roughness.- Since helicopter--rotorblades may developleadi~-edge roughness during normal service because o~brasion or theaccumulation of foreign particles, a portion of the test program wasrepeated with standard NACA leading-edge roughness applied to the rotorblades. ‘l!hisroughness probably represents more than that usually dueto normal service and is used only to demonstrate the effect-sof anextreme condition.
A comparison of the rotor performance with smooth blades ~ . 0.46,0.62, and 0.71) and with leading-edge roughness i(Mt = 0.44r0. 2, and 0.72)
applied is shown in figure 3. The addition of leading-ewe roughnessincreased the zero-thrust profile-torque coefficient by about 40 percent.The increment in profile torque increases as thrust coefficient isincreased and at a tip Mach number of 0,46 and a thrustioefficient
.
of 0.0050, the increment increase in profile torque due to roughness ieabout 3,5 times that shown at–zero thrust. The leading-edge roughnessreduced the maximum rotor thrust coefficient”and at the highest tip Machnumber reduced the rotor thrust coefficients at which the coqpressibil~ty

NACA TN 3@0 ,
. drag rise sterted to occur. _Forthe rotor thrust coefficient forless.
9
example, at a tip Mach number of 0.71,compressibility drag rise is about 0.001
than that shown for the smooth blades.
Rotor Blade Pitching Moments
Rotor-blade pitching-moment data are necessary to determine therotor control forces and sre important in blade vibration and stabilityanalyses.
Smooth blades.- A comparison of the blade pitching-moment character-istics for tip ~ch nunibersof 0.31 to 0.71 for the rotor tested in thesmooth condition as a function of rotor thrust coefficient is shown infigure 4. The pitching-moment data represent the .meas~ed rotor blademoments about the blade pitch axis and include both aerodynamic andblade mass forces.
The moments shown at zero rotor thrust coefficient are presumbl.ydue to deviations of the airfoil from a truly symmetrical section. Thechange in blade moments as thrust is increased msy be psrtly due to devi-ation from true airfoil contour but probably is largely caused by thedisplacement of the blade aerodynamic cerrterfrom the blade center of
. gravity. As mentioned previously, the blade aerodynamic center is notprecisely known. Since the position of the aerodyusmic center withrespect to the center of gravity has a very powerful effect on bbiie
. pitching moments and since the actual measured moments sre small (-10 ft-lbto 90 ft-lb), it appears more logical to present the total measuredmoments about the pitch axis of the blade.
(At the lower tip Mch numbers below ~ = O.~), the pitching mamentsare negative (that is, nose down) throughout the thrust-coefficient range.At the higher thrust coefficient, the pitching-moment curve slope reverses;this reversal indicates a rearward shift in center of pressure due toblade stall. The effect of increasing the tip Mach number was to shiftthe center of pressure forwsrd sM@tly ~d thus pr~uce nose-uP rn~~ntsand to decrease the thrust coefficient at which the pitching-mbment curveslope reverses.
The point at which c@ressibility or stall begins.to increase therotor power requirement is noted by a tick on the curves (fig. 4). Itis significant that, although the tip of the blade is encountering com-pressibility losses, the reversal in slope of the bl~e pitchix-~ntcurve is delayed well beyond the onset of compressibility losses. Thischaracteristic is also shown by the unpublished data on the two-
. dimensional NACA &2-015 airfoil.section. At the higher tip Mach num-
bers, rotor data were not obtained at a high enough thrust coefficientto determine the pitching-moment reversal. (Allowable blade bending ,
-
10 NACATN 3850
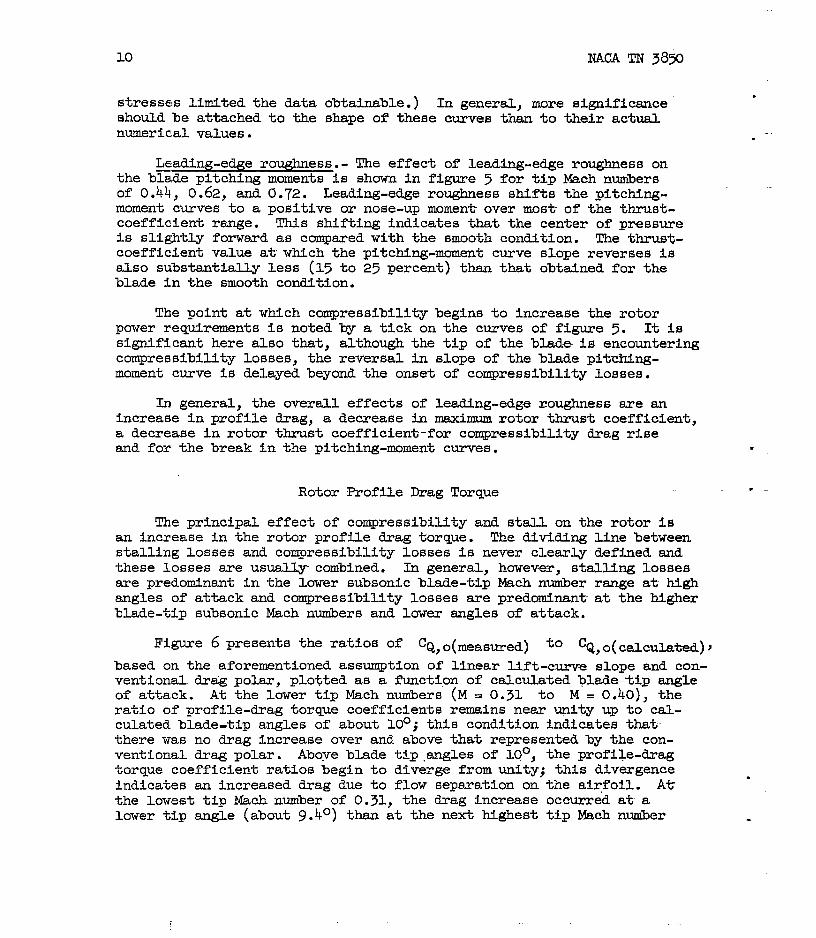
stresses limited the data obtainable.) In general, more significanceshould be attached to the shape of’these curves than to their actualnumerical values.
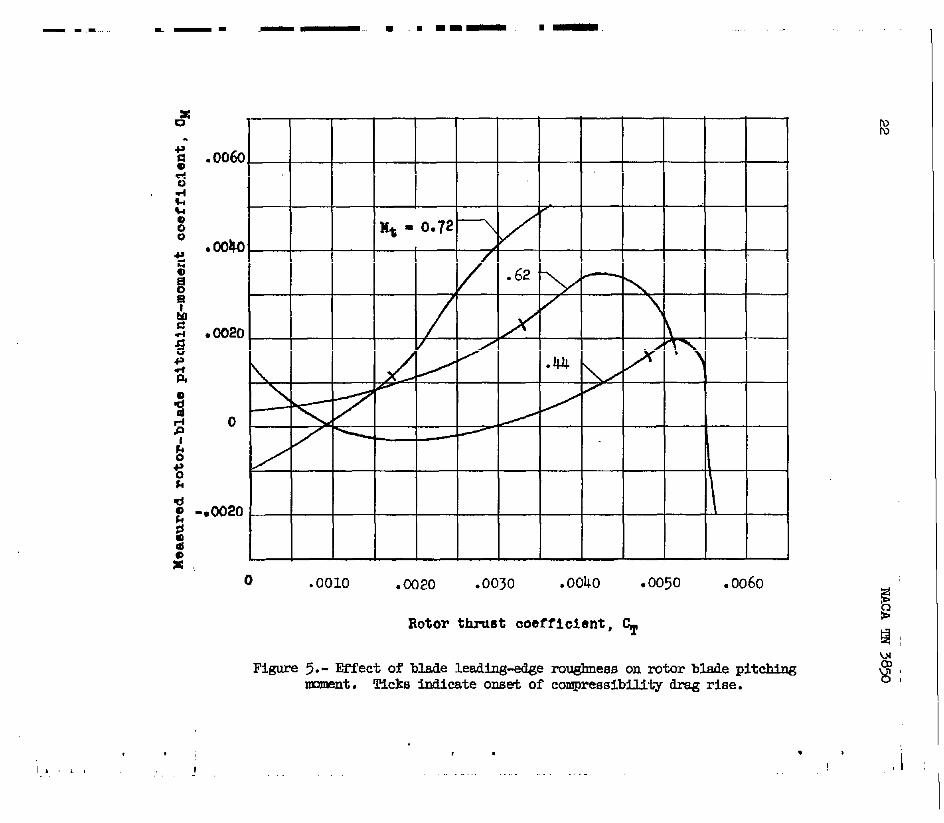
~eading-edge roughness.- The effect of leading-edge roughness onthe blade pitching moments is shown in figure 5 for tip Wch numbersof 0.44, 0.62, M 0.72. Leading-edge roughness shifts the pitching-moment curves to a positive or nose-up moment over most-of the thrust-coeffici.entrange. This shif%ing indicates that the center of pressureis slightly forward as compared with the smooth condition. The thrust-coefficient value at-which the pitching-moment curve slope reverses isalso substantially less (15 to 25 percent) than that obtained for theblade in the smooth condition.
.
-.
The point at which compressibilitybegins to increase the rotorpower requirements is noted by a tick on the curves of figure 5. It i~significant here also that, although the tip of the blade is encounteringcompressibility losses, the reversal in slope of the blade pit&ing-moment curve is delayed beyond the onset of compressibility losses.
In general, the overall effects of leading-edge roughness are anincrease in profile drag, a decrease in maximum rotor thrust coefficienta decrease in rot-orthrust coefficient-for compressibility drag risesmd for the break in the pitching-moment curves. .
Rotor Profile Drag Torque ,—
The principal effect of compressibility and stall on the rotor isan increase in the rotor profile drag torque. The dividing line betweenstalling losses and compressibility losses is never clearly defined andthese losses are usually combined. In general, however, stalling lossesare predominant in the lower subsonic blade-tip Mach nuniberrsnge at-highangles of attack and compressibilitylosses are predominant-at the higherblade-tip subsonic Mach nuuibersand lower sngles of attack.
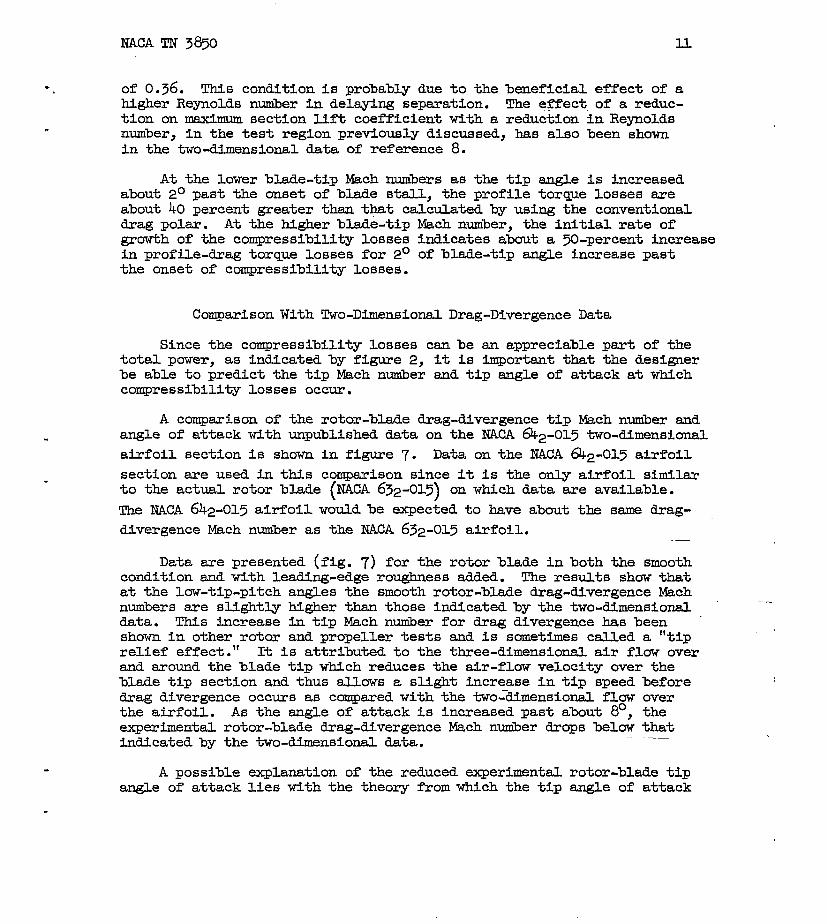
Figure 6 presents the ratios of cQ,o(measured) ‘0 cQ,o(calculated)}based on the aforementioned assumption of linear lift-curve slope and con-ventional.drag polar, plotted as a function of calculated blad+tip singleof attack. At the lower tip Mach nunibers(M. 0.31 to M= 0.40), theratio of profile-drag torque coefficients remains near unity up to cal-culated blade-tip angles of about 10°; this condition indicates that-there was no drag increase over and above that represented by the con-ventional drag polar. Above blade tip.angles of 10°, the profile-dragtorque coefficient ratios begin to diverge from unity; this divergenceindicates an increased-drag due to flow separation on the airfoil. Atthe lowest tip Mxh number of 0.31, the drag increase occurred at-alower tip angle (about 9.4°) than at the next highest tip hch number
.
l!wcflm 3850 IL
. d 0.36. This condition is.probably due to the beneficial effect of ahigher Reynolds nuder in delaying separation. The effect of a_reduc-tion on maximum section lift coefficient with a reduction in Reynolds
. number, in the test region previously discussed, has also been shownin the two-dimensional data of reference 8.
At the lower blade-tip Mach ntiers as the tip angle is increasedabout 2° past the onset of blade stall, the profile torque losses areabout 40 percent greater than that calculated by using the conventionaldrag polar. At the higher blade-tip Mach number, the initial rate ofgrowth of the compressibility losses indicates about a ~-percent increasein profile-drag torque losses for 2° of blade-tip angle increase pastthe onset of compressibility losses.
Comparison With Two-Dimensional Drag-Divergence Data
Since the compressibility losses can be an appreciable part of thetotal power, as indicatedby figure 2, it is important that the desi~erbe able to predict the tip Mach nuniberand tip angle of attack at whichcompressibility losses occur.
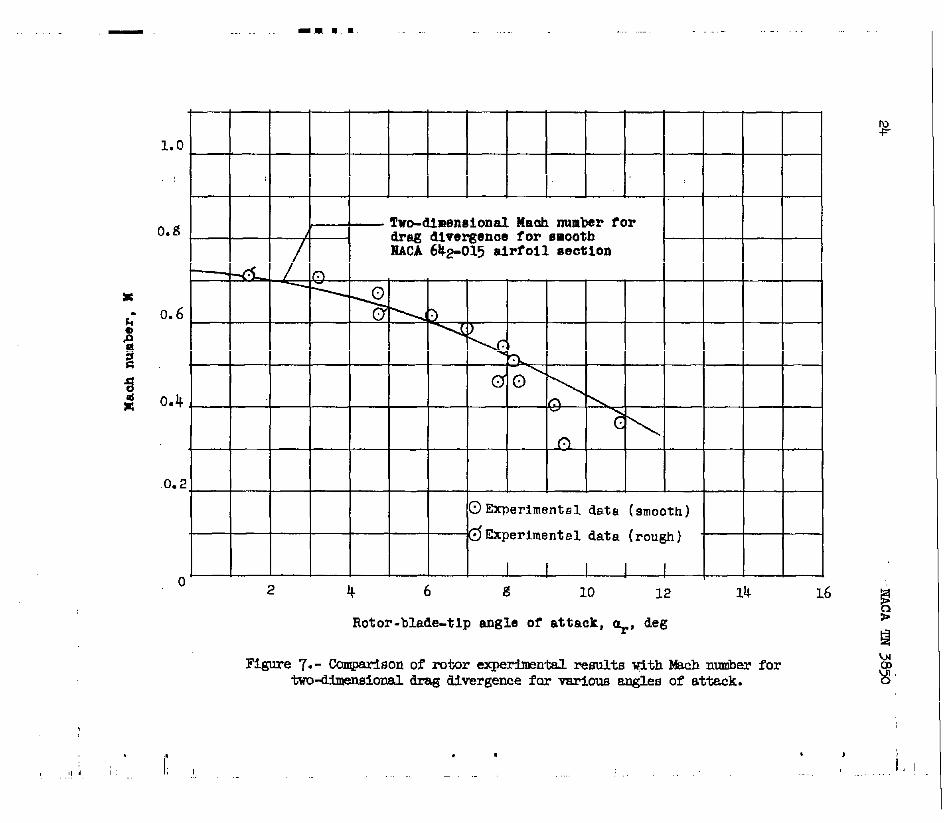
A comparison of the rotor-blsde drag-divergence tip Wch number and. angle of attack with unpublished data on the NACA 642-015 two-dimensional
airfoil section is shown in figure 7. Data on the NACA @2-015 airfoil
. section are used in this comparison since it is the only airfoil similarto the actual rotor blade (NACA 632-015) on which data are available.
‘lheNACA 642-o15 airfoil wouldbe expected to have about the same drag-
divergence Mach number as the NACA 632-015 airfoil.
Data sre presented (fig. 7) for the rotor blade in both the smoothcondition and with leading-edge roughness added. The results show thatat the low-tip-pitch angles the smooth rotor-blade drag-divergence Machnumbers are slightly higher thsn those indicated by the two-dimensional ‘“-data. This increase in tip Wch nuder for drag divergence has beenshown in other rotor and propeller tests and is somet-s called a “tiprelief effect.” It is attributed to the three-dimensional air flow overand around the blade tip which reduces the air-fluw velocity over theblade tip section and thus allows a slight increase in tip speed beforedrag divergence occurs as compared with the two~timensional flow overthe airfoil. As the mgle of attack is increased past about 8°, theexperimental rotor-blade drag-divergence Mach nuuiberdrops below thatindicated by the two-dimensional data.
A possible explanation of the reduced experimental rotor-blade tipangle of attack lies with the theory from which the tip angle of attack

12
is calculated. The calculation does not-bution of the induced flow (when loss ofestimate the rotor-blade angle of attack.
NACATN 38X ““ —
i ~.’take into account-the redistri-lift-occurs) and thus may under-Another factor is intr-&luced .
because-of the blade twist which caused the calculated maximum bladeangle cf attack to occur inboard at about x percent of the blade radtus.Thus, the tip angle of attack is somewhat lower than that section of theblade causing the drag rise.
--
The flagged synibols(fig. 7) indicate--thel&ch number for drag diver-gence of the rotor with leading-edge roughness added and show the reduc-tion in tip angle of attack at which compressibility drag losses occurfor this condition.
Ih general, the comparison of the rotor-blade drag-divergence Machnumber ‘riththat-btdned from two-dimensional airfoil tests providesthe des.fgnerwith a basis on which to predict-the onset of compressi-bility :Losses.
Comparison of Rotor Blades Having NACA 632-015 Airfoil Sections
With Those Having NACA 23015-Airfoil Sections
The high-tip-speed performance of the present rotor is comparedtith ths,tobtained for a rotor having NACA 2X15 airfoil sections. Sugha comparison would be expected to demonstrate the superior performanceat-high rotor tip speeds that may be obtained with rotors having air-foils with more favorable pressure distributions at moderately high sub-sonic Nklchnumbers. It is therefore pertinent to examine the alrfoil-section characteristics of each rotor to determine the general.magnitudeof the high-tip-speed rotor performance differences that might beexpected..
Two-dimensio@ airfoil drag divergence.- In figure 8 the two-dimen~mal airfoil section lift coefficient is plotted as a functionof Mach number for drag divergence for the two airfoils, the NACA 23015(ref’.9) and the NACA @2-015 (unpublished NACA data used in the absence
of NACA 632-015 airfoil-section data). The results show that for Mach
numbers “between0.52 and 0.70 the section lift coefficients for dragdivergence of the NACA &2-015 airfoil are substantially higher them
those shown for the NACA 23015 airfoil. For cxgample,at-a tip Mach num-ber of 0.60, the NACA 642-015 airfoil can operate at about 0.3 section
lift coefficient-higher before drag divergence occurred than the NACA23015 ai:rfoilcan. This result represents an increase in the lift-coeffi-cient of a little over ~ percent. At a constant CZ of-about 0.6, the
Mach number for drag divergence for the NACA 632-015 airfoil is about
.
.

mm m 3850 13
.15 percent ~eater than that for t~e NACA 23015 airfoil. At the verylow section lift coefficients (O to 0.21), the two airfoils have simllsrMach nuuibersfor drag divergence. Above CZ . 1.0, the NACA 2X15 air-
foil appears to be superior to the NACA @t2-015 airfoil, but the data
range is insufficient to establish the trend clearly.
Rotor comparison.- !Therotor blades having NACA 23015 airfoil sec-tions, used in the previous tests of reference, had a ratio of tip chordto root chord of 0.54 and & linear washout. The rotor blades havingNACA 632-015 airfoil sections, used in present tests, had a rectangular
plan form and 6.5° of linear washout. Before these rotors can be com-pared, it is necessary to examine ftrst the effects of Mst and. taperon the rotor perfo~ce.
The effect of blade twist is to reduce the tip angle of attack fora given rotor thrust and rotational speed. The effect of taper (tipchord less than root chord) is to increase the tip angle of attack fora given thrust and rotational speed. Calculations indicate that thiseffect is not too powerful in that, for rotors of the ssme solidity and ‘-at a blade mean lift coefficient of about 0.3, a ratio of tip chord toroot chord of 0.5 increases the tip angle of attack by only about 0.3°over that for the blade of rectangular plan form. The change in tip
. angle of attack for the blades with -8° of twist and those with -6.50of twist is also about 0.3°. Consequently, at a given mesn lift coeffi-cient, the rotor blades having NACA 23015 airfoil sections, a taper ratio
. of o.%, and -8° of twist will have about the same tip section angle ofattack as the rotor blades having NACA 632-015 airfoil sectionsj rectsn-
gdarPw fo~, and @ -6.5° of twist.
b any comparison of performance of rotor blades, however, the.rotor-blade surface condition snd contour accuracy will have an importantbearing on the rotor characteristics. The leading-edge radius of therotor having NACA 23015 airfoil sections was about 10 percent larger thanthat of the true airfoil and its oversize may have resulted in a decreasedtip Mach number for drag divergence for that rotor. The leading edge ofthe rotor having the NACA 632-01-5airfoil section, on the other hand,
-—
was very close to that of the true airfoil. Figure 9 shows a comp=isonof the profile-torque compressibility losses between the rotor havingNACA 23015 airfoils and the one having an NACA 632-015 airfoil as curves
CQ,O(llleof profile torque ratios
asured) plotted as a function of
cQ>o(csJ-ctiata~e resflts show that at a tiProtor-blade mean lift coefficient q.
. Mch nuniberof 0.69 the rotor haviu WCA 632-01-5~rfoil sections Can
operate at about a 60 percent higher rotor-blade mean lift coefficientwithout compressibility losses than can either of the rotors having —
14
NACA23015 airfoil sections.cient for drag divergence of
NACAm 385)
Thus, the increase in section lift coeffi-the NACA 632-015 airfoil as compaed with
the NACW 23015 airfoil that was shown in figure 8 is substantiatedbythe measured rotor performance.
The rate of growth of the compressibility losses of the NACA632-015 rotor blades ”withmean lift coefficient following drag diver-gence is much less than the rate of growth for the NACA 23015 rotor. A%
.—
a blade mean lift–coeffi”cientO.n beyond the onset of compressibilitylosses, the profile-drag torque losses for the NACA 632-015 rotor are
about twice that calculated without compressibility effects. For thesame ccmdition, the NACA 23015 rotor blade has compressibility lossesnearly three times that calculated. Most of this improvement shown bythe NACA 632-015 rotor blade is believed to be due to the higher air-
foil lift coefficient obtained before drag divergence.
Synthesized Characteristics of the NACA 632-015 Airfoil
Section for Rotor Performance Calculations
Inasmuch as there were no experimental data available-on the high-speed characteristics of the two-dimensional NACA 632-015 airfoil sec- .
tion, rotor-blade airfoil-section drag and lift curves as a function ofMach number were synthesized from the experimental rotor performance.
—
The ob:ect of such work was to present airfoil data that could be used.
in predicting the high-tip-speed performance of rotors having similarairfoils. The drag and lift curves herein we based, to a large extent,on unpublished wind-tunnel data on the high-speed characteristics forthe twc}-dimensionalNACA 642-015 airfoil section. It is believed, huw-
ever, that the-generel shape of the section-drag-coefficientcurves asa function of Mach number and the &’ag-divergence Wch numbers sxe cor-rect bUt that the section drag Coefficients are Somewhak high.
In figure 10 the synthesized drag coefficients for the rotor-bladeNACA 6?!2-015airfoil section ere plotted as a function of Mach number
for blsde angles of attack from 0° to 14° and were obtained by sub-tracting an increment determined by trial and error from the unpublisheddrag data on the NACA 642-015 airfoil section. The resulting curves
retain the general shape of the variation of drag with lkch number asthat fcm the unpublished data. The procedwe was repeated until thecorrected data would accurately predict the-relationship to ~ or ~
over the tip Mach number range of 0.31 to 0.71 covered in the investi-gation. No attempt was made to correlate ~ or CQ with the measured
.
blade pitch angle e.
——

NACATN 3850 15
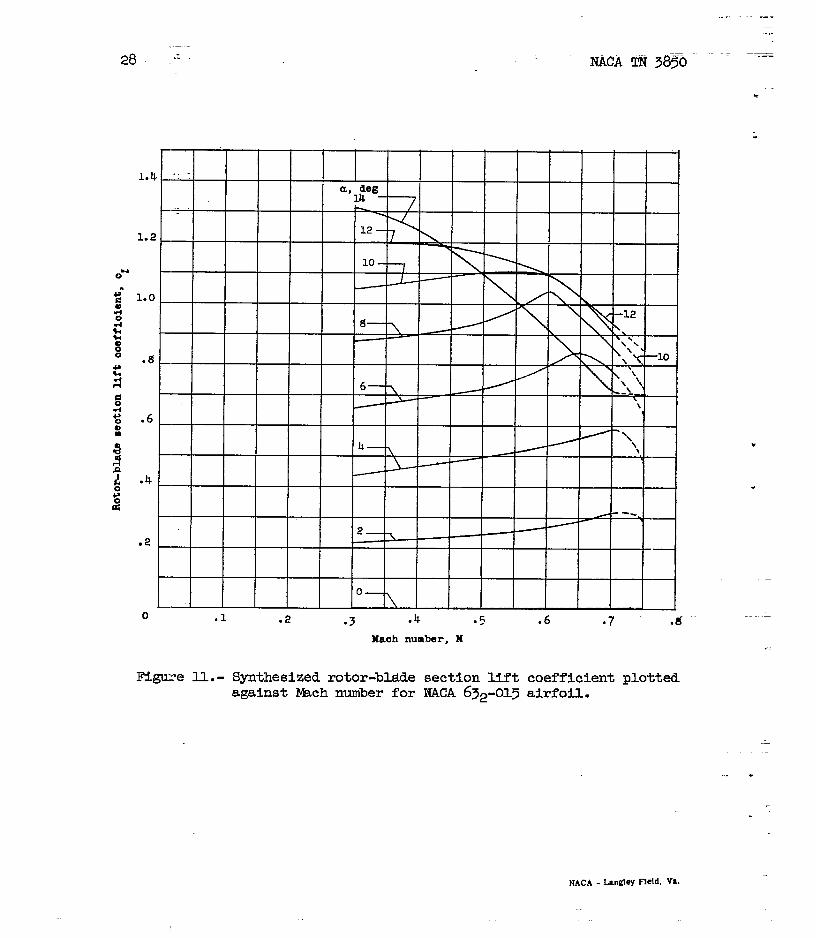
.The synthesized lift coefficient for the rotor-blade NACA 632-015
airfoil section is plotted in figure l.1as a function of Mach number for. angles of attack from 0° to lko. The rotor-blade section-lift-coefficient
curves were identical to the unpublished ld.ft-coefficientdata on theNACA 642-015 airfoil section except that the ti_lift-Coefficient _
values were increased to predict accurately the actual experimental rotorperformance. Drag and lift curves are presented for Mach numbers up to0.75 but beyond a Mach nuniberof O.~ the curves are dashed to indicatetheir provisional.nature.
Generally, the use of the wind-tunnel data on the two-dimensionalairfoil section to calculate the increase in rotor power due to compress-ibility effects results in overestimating the power requirements. Thiseffect is often referred to as a “tip relief effect” wherein the rotoror propeller blade.does not experience the same drag, as indicated bytwo-dimensional data, because of the re~eving effect of the air flowingover and around the blade tips. Ih figures 10 and 11 the “tip reliefeffect” is already included in the data since the curves were based onthe experimental rotor performance. When the rotor performance is cal-culated by using the data shown in figures 10 and 1.1,the usual low-speedassumptions, that the outer 3 percent of the blade radius produces nolift but has profile drag, still apply.
CONCLUSIONS
AS a result of the high-tip-speed tests, the effect of co~ressi-bility on the hovering performance and blade pitching-moment character-istics of a rotor blade having NACA 632-015 airfoil sections has been
determined experimentally over a tip Mach nurriberrange from 0.31 to 0.71.The performance of the test rotor has been compared with that obtainedpreviously with rotor blades having NACA 2x15 airfoil sections.
The most significant conclusion is that the differences in Mach num-ber for drag divergence between airfoils shuwn by two-dimensional datasre realized in actual rotor tests. This result then shows that itshould be possible to calculate the onset of compressibility drag riseof other rotors based on their two-dimensional section data.
Another important conclusion is that, even though the rotor of thepresent test had a 15-percent-thick airfoil section, it could operateat a tip Mach number of 0.7 and mean blade lift coefficients of up toabout 0.6 before encountering any appreciable compressibility losses.At a tip Mach nuuiberof 0.69 the rotor having NACA 632-015 airfoil sec-
tions, with a thickness distribution developed for more favorable high-tip-speed performance, could reach a 60 percent higher rotor-blade mean

16 NACA TN 38x
lift cc)efficientwithout any compressibilitylosses as compare&with the.
rotor having NACA 23015 airfoil.sections. Some Small ~art of-thisimprove~nt in performance may be attributable to the more accurate con-stmctj.on of the WM 632-OIS rotor blades.
._-.
The data also show that the reversal in slope o~tk blsde pitching-moment curve is delayed beyond the onset of compressibilitylosses.
S~mthesized drag and lift characteristic curves for the rotor-bladeairfoil.section are presented for predicting the high-tip-speed perform-” “~ante of’rotors having similar airfoils. —
Langley Aeronautical =boratory,National Advisory Committee for Aeronautics,
Langley Field, Vs., August 2, 1956...
●
.
*...
NACA TN 3850 17
. REFERENCES.- —
. 1. Carpenter, Paul J.: Effects of Compressibility on the Performanceof h Full-Scale Helicopter Rotors.(SupersedesNACA ZN2277.)
NACA Rep. 1078, 1952.
2. Carpenter, Paul J.: Effect of Wind Veloci@ on Performance of Heli-copter Rotors As Investigated With the Langley Helicopter Apparatus.
~ NACATN 1698, 1948.
3. Abbott, ha H., Von Doenhoff, Albert E., and Stivers, Lo~s S., ~rc:of Airfoil Data. NACA Rep. 824, 1945. (Supersedes WCA
Lv@ .)
4. Gessuw, Alfred: Effect of Rotor-Blade Twist and Plan-Form Taper onHelicopter Hovering Performance. NACA TN 1542, 1948.
5. (%SSOW, Alfred, and~ers, G- C., Jr.: FIJ@t Tests of a He~-copter in Autorotation, bcluding a comparison With Theory. NACATN L267, Igky.
6. Gustafson, F. B., and GesscYK,Alfred: Effect. Helicopter Hovering Performance and Maximum
WR L-97, 1946. (Formerly NACA ARR L6A16.)
7. Bailey, F. J., Jr.: A Simplified Theoretical
of Rotor-Tip Speed onForward Speed. NACA
Method of Determiningthe Characteristics of a Lifting Rotor in Forwsrd Flight. NACA -Rep. 716, 1941.
8. Loftin, Laurence K., Jr., and Smitn, _lton A.: Aero~cCharacteristics of 15 NACA Airfoil Sections at Seven Reynolds Num-
bers IYomO.7 x 106 to 9.0 x 10⁶. NACATN 1945, 1949.
9. Graham, Donald J., Nitzberg, Gerald E., and Olson, Robert N.: ASystematic Investigation of Pressure Distributions at High SpeedsOver Five Representative NACA Low-Drag snd Conventional AirfoilSections. NACA Rep. 832, 1945.
,
L-@655me l.- Rotor blades hmclng NACA 632-01.~ afiofl sections munted on
the Langley &).icopter test tower.

NACA TN 3850 19
.
.
.
+.
. Ootio
/‘/
/ ‘.0070 / ~
/Oaloul.ate~ ~ /
.0060
.0050
.. .-
0
c8 I I I I I I-@-’ IllH’
i
ER~t-.nl,f+ ~o.31 2.19x lc$
g?;::$ 2.57
2.6.sn.h~ 3.25 t--H
. w-u 1
.0030
.0020
.0010
0 w.00010 .00020 .00030 .00040 .0W50 .00060 .00070 .Qooao
Rotor torqueooerrlalent,Ca
Figure 2.- Hovering performance of rotor blades having WCA 632-015
airfoil sections. u = 0.0374. Calculated curve based on
Cd,o =0.0087 - 0.021~ + 0.4~2 and cz ‘~.
—.

.0070;
.CXm.
.0050
4’.
2.22 .0010.h64e0
i
.0030
+h
i.O02Q,
.0010.
0
~tor torqtt~ ooeffi!3iWIt, CQ
Figure 3.- EY?fect of blade MefMg+ige roughness on rctor hovering’
performance.
r
1,
.I
nlo
,.

J
f
/
-.62
f !
.67—
jf~ . &71-/ / /59
/8
,* 54
/1 1
/r
-.50‘.46
/ /
i
/k
1=
—
‘
—
-
—
- ~ .31
~\
\ / ~ w
\’ 1’
to .0010 .0020 .0030 . Ooko ● 0050
Rotor thrust Ooeffioient#.CT
Figure 4.- Pitcbingmomentsof rotorblades having
sections(snmoth). Ticks indicatethe onset ofrise.
.0060 .0070 ,0080
N&CA 632-015airfoil
compressibilitydrag
—..
2
. O06Q
/~ = 0.7P -1
.0040
.62 y ~
/ 1
● 0020/
.44
—o
,.0020
0 .0010 .0320 .0030 .0040
\
\
I
● 0050 .0060
Rotor thrust coefflclent, ~
Figure 5.- Effect of blade Ieadhg-edge roughnees on rotor blade pitching
mment. Ticks indicate onset of conpressibili~ dmg rise.
,,
1,, ,.. I
.
.
.I ,i :

I & *
-1
, I
7
5.0,
4.0. .54-7 ~.50
●59-\
3.0./ $
/I
A
.67 I /2.0.
“’-.31
~ IIt= 0.71
\ //
*~ =’ ~
1.0,
0 2 h 6 g 10 12 14 16 M
Rotor-blade-tip angle of attaok, ar, dog
Figure6.- l!fYectof tip augle of attack and Wch number on profile-drag
torque .
1.0
r Two-dlmenaj.onal Hamh nmmber foro.g t drag dlvergenoe for smooth
lJACA 642-01~ airfoil aectlon
-Q
0.6 3)
m
U 0’ \0.4 , n
n
0.2
~ Experimental data (emooth)
~Experlmentel data (rough)
I I I I I. &u
2 4 6 s 10 12 14
Rotor.blade-tlp angle of attack, ~, deg
Figure 7.- (!mparisonor rotor experlmntal resultstithlkchnumber fortwo~slcmal drag divergenceforvarioua anglesof attack.
[l.. ,
:,,,,,:
16

, , # ,%’
t 1
-as!
.4\
.2
11 , , , 1 1 , 1 1 1 1 1 I
o .2 .4 .6 .?4 1.0 1.2
Section lift ooeffiolent, o2
Figure 8.- Vsriat5.on of Mach numbsr for drag divergence with lift coeffi-
cient for NACA 642-015ail lWCA 23015airfoilsections.h’

j.o
2.0
Lo
Rotor having HACA 23015 —airfoilwith no Wi#t; \
Rotor hating lIAOA2~15
tip Mach number - O.@airfoi 1 with -#J twist;tip Maoh Inmtmr- o.6g
\ ()?
Z-Rotor bVi~
[ . I?ACA 63+15
/ E!iFfOil with
v ‘ /-6.50 twi,nt
f/
\/
Jq -0.71 $ = 0.67
/
6> f’/
w d~
u/
v
,. I
o .1 .2 .3 .4 .5 .6 ●7
Elotofiblmleman lift ooeffioi~nt,%Z
l!lgure9.- Comparisonof pro~fle-dragtorque increasehavlag 1~-percen-b-tick-oils.
.
.U *9 1.0
for three rotors
,’ 1
i,

NACA TN 3850 27
.
.
Figure 10.- Synthesized rotor-blade section drag coefficient plottedagainst Mach number for NAcA 632-015 airfoil.
-----
.-.
28 .’
--
1.4.-::a, degI&
.“ \\
1.2 __ _ _ _ _ _ _12—
10—o- ~ —
1.0—
\\
E— \~ ‘ \
\ ‘\:\
.8 \ x y — 10
~ - 4.6
,
11—,-\
— ~\\
~ ~.4
~
/ --.
2—7.2
/ ~
-.o—
0 .1 .2 .3 .4 .5Maoh number,H
Synthesized rotor-bldde section liftagainst Mch number for NACA 632-01-5
t.
.
.6 .7 .$
coefficient plottedairfofl.
-.
.:
.—
.
NACA .ung[eyFleld, v~.


![Electrifying the High School Student Pipeline Marc E ......[3] K. Afridi, “Wireless Charging of Electric Vehicles,” Frontiers of Engineering: Reports on LeadingEdge Engineering](https://img.pdfslide.us/doc/110x75/5ed7972b67b53e06555d31ee/electrifying-the-high-school-student-pipeline-marc-e-3-k-afridi-aoewireless.jpg)