Embed Size (px)
Citation preview

Copyright reserved Please turn over
This annexure consists of 11 pages.
GEOGRAPHY P1
NOVEMBER 2016
ANNEXURE
NATIONAL SENIOR CERTIFICATE
GRADE 12
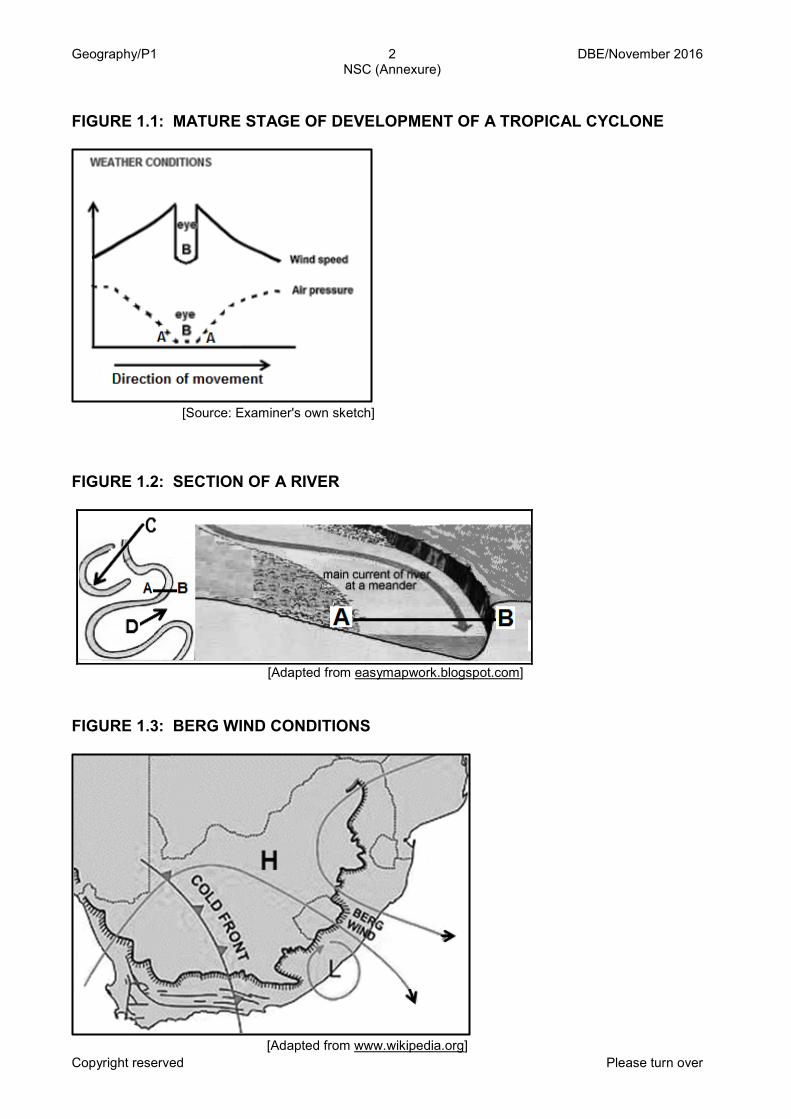
Geography/P1 2 DBE/November 2016 NSC (Annexure)
Copyright reserved Please turn over
FIGURE 1.1: MATURE STAGE OF DEVELOPMENT OF A TROPICAL CYCLONE
[Source: Examiner's own sketch]
FIGURE 1.2: SECTION OF A RIVER
[Adapted from easymapwork.blogspot.com] FIGURE 1.3: BERG WIND CONDITIONS
[Adapted from www.wikipedia.org]
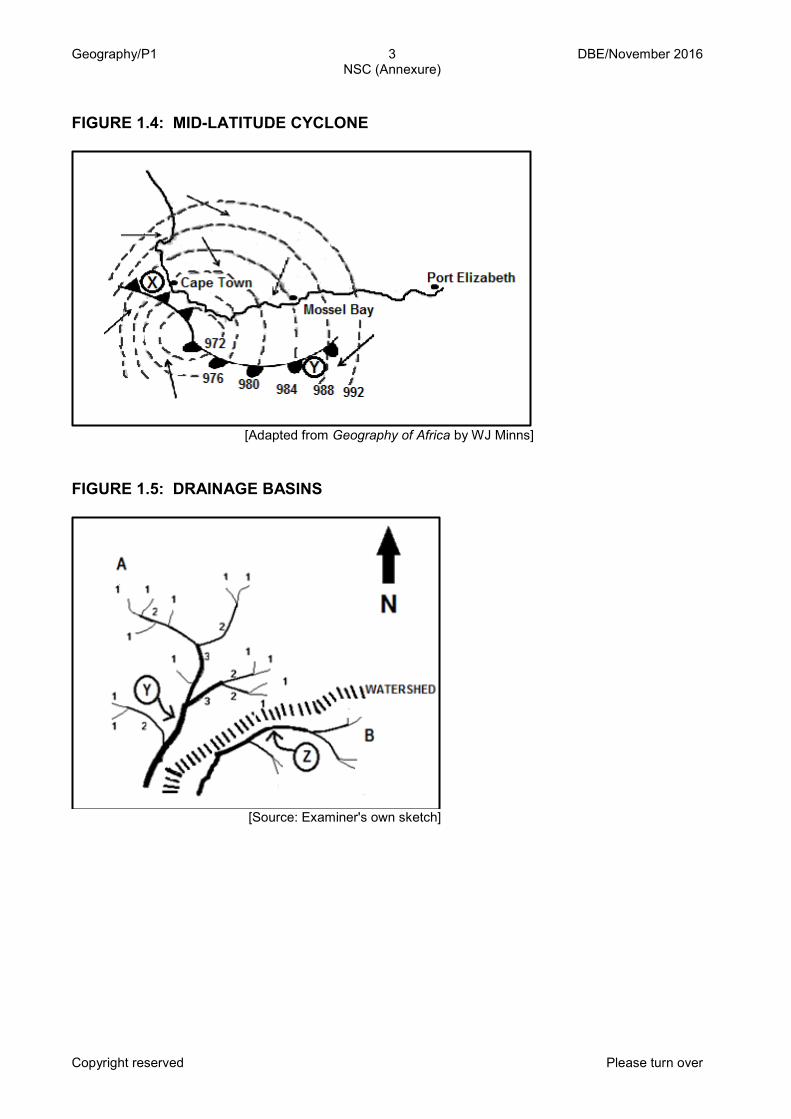
Geography/P1 3 DBE/November 2016 NSC (Annexure)
Copyright reserved Please turn over
FIGURE 1.4: MID-LATITUDE CYCLONE
[Adapted from Geography of Africa by WJ Minns] FIGURE 1.5: DRAINAGE BASINS
[Source: Examiner's own sketch]
Geography/P1 4 DBE/November 2016 NSC (Annexure)
Copyright reserved Please turn over
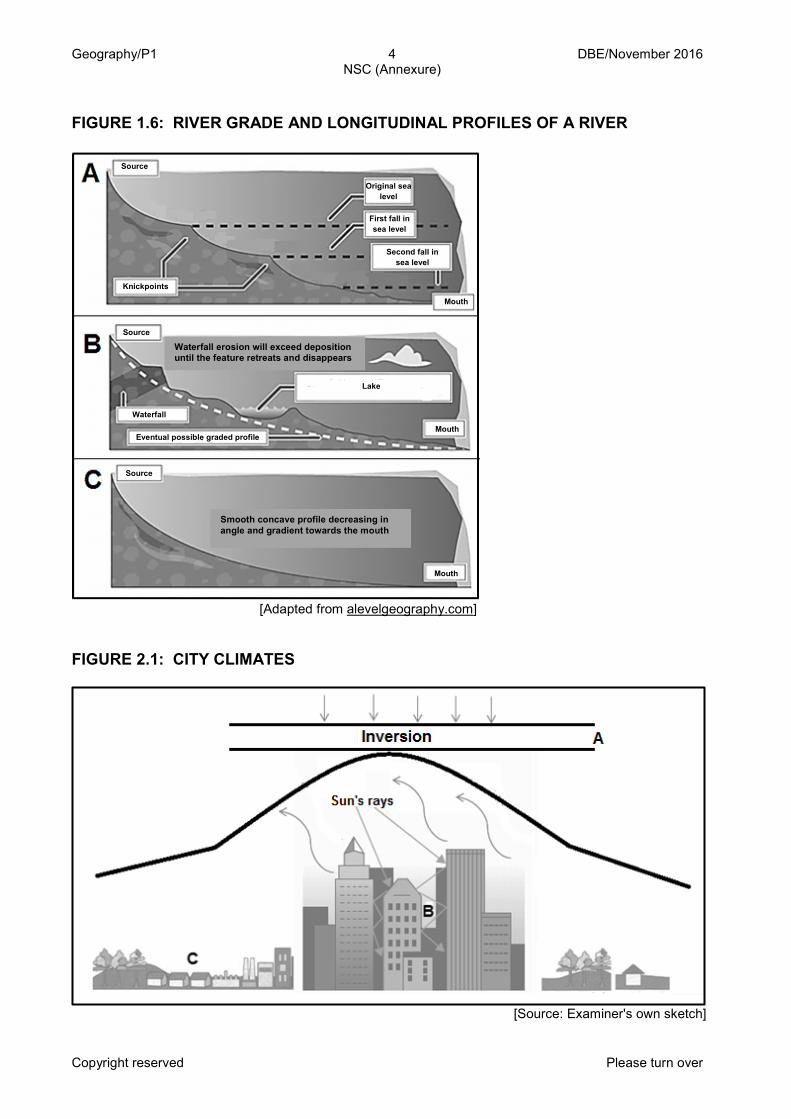
FIGURE 1.6: RIVER GRADE AND LONGITUDINAL PROFILES OF A RIVER
[Adapted from alevelgeography.com] FIGURE 2.1: CITY CLIMATES
[Source: Examiner's own sketch]
Source
Source
Source
Original sea level
First fall in sea level
Second fall in sea level
Knickpoints
Mouth
Mouth
Mouth
Waterfall
Lake
Eventual possible graded profile
Smooth concave profile decreasing in angle and gradient towards the mouth
Waterfall erosion will exceed deposition until the feature retreats and disappears
Geography/P1 5 DBE/November 2016 NSC (Annexure)
Copyright reserved Please turn over
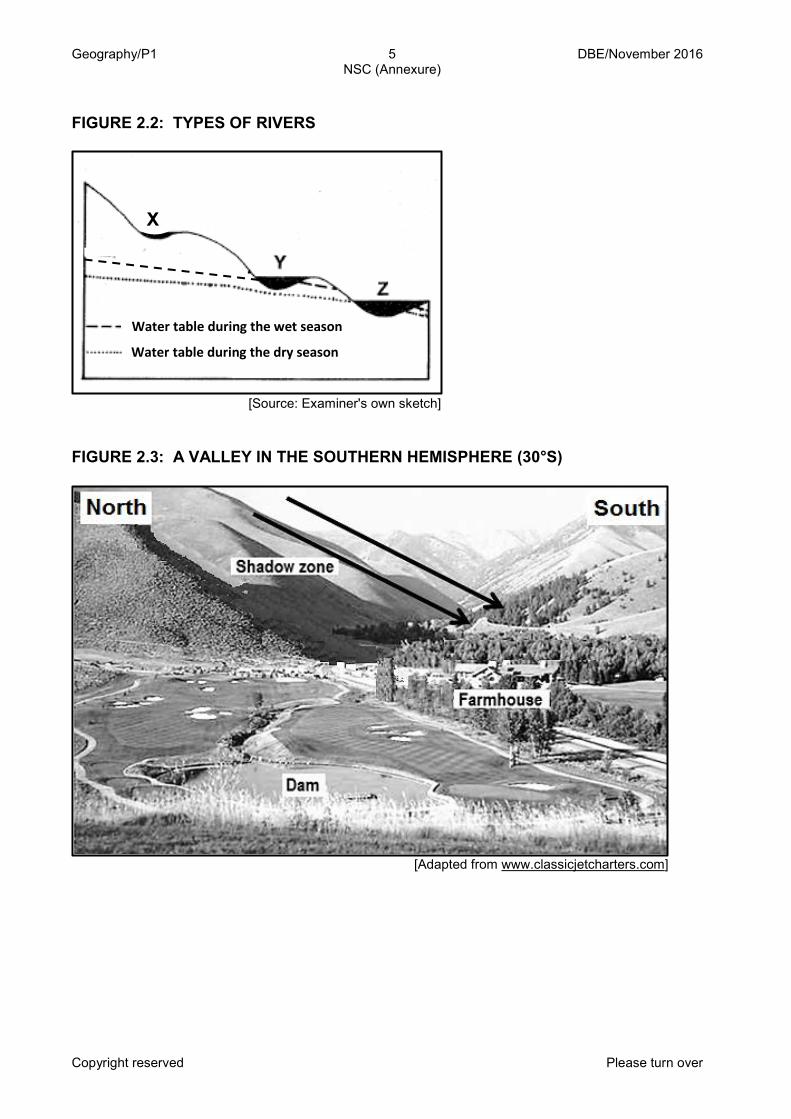
FIGURE 2.2: TYPES OF RIVERS
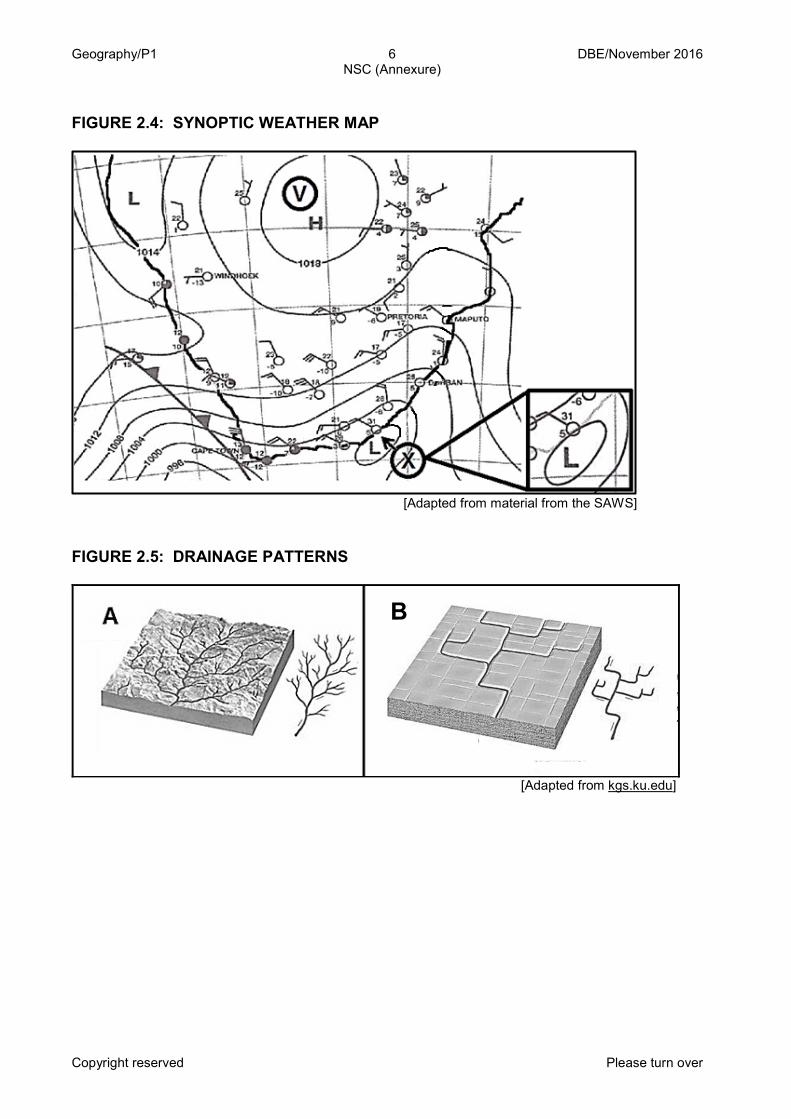
[Source: Examiner's own sketch] FIGURE 2.3: A VALLEY IN THE SOUTHERN HEMISPHERE (30°S)
[Adapted from www.classicjetcharters.com]
Water table during the wet season
Water table during the dry season
X
Geography/P1 6 DBE/November 2016 NSC (Annexure)
Copyright reserved Please turn over
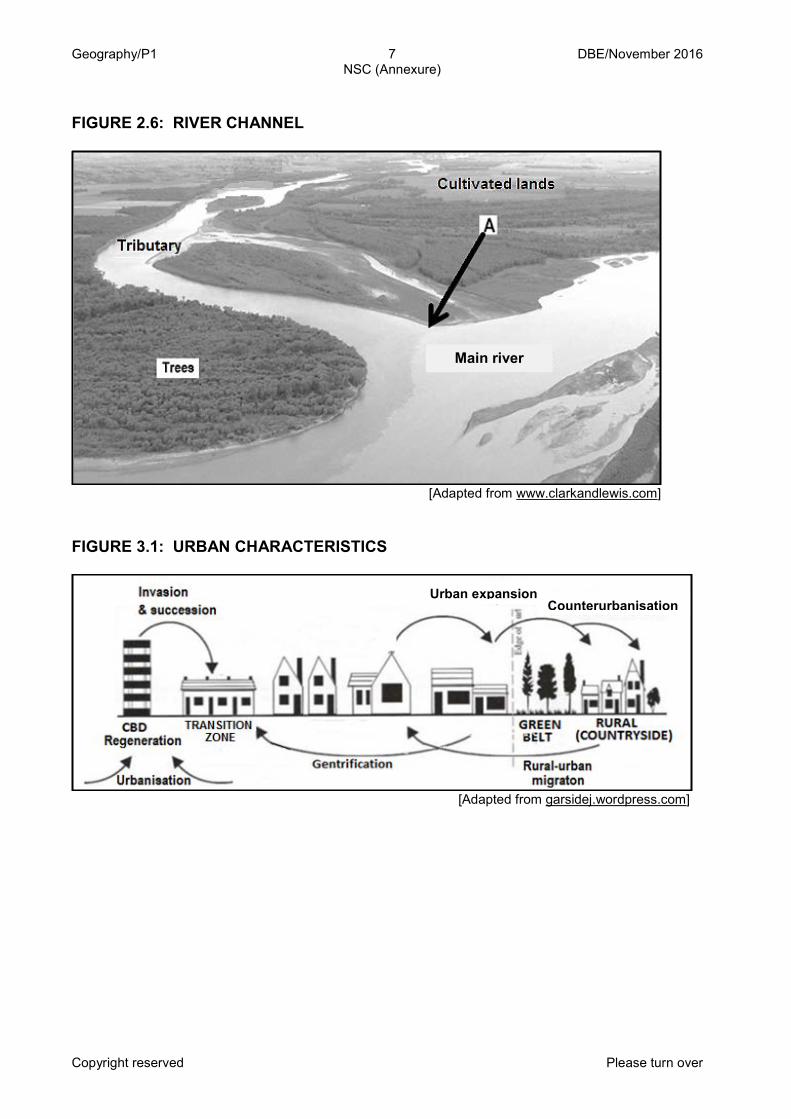
FIGURE 2.4: SYNOPTIC WEATHER MAP
[Adapted from material from the SAWS] FIGURE 2.5: DRAINAGE PATTERNS
[Adapted from kgs.ku.edu]
B B
B
Geography/P1 7 DBE/November 2016 NSC (Annexure)
Copyright reserved Please turn over
FIGURE 2.6: RIVER CHANNEL
[Adapted from www.clarkandlewis.com] FIGURE 3.1: URBAN CHARACTERISTICS
[Adapted from garsidej.wordpress.com]
Main river
Urban expansion Counterurbanisation
Geography/P1 8 DBE/November 2016 NSC (Annexure)
Copyright reserved Please turn over
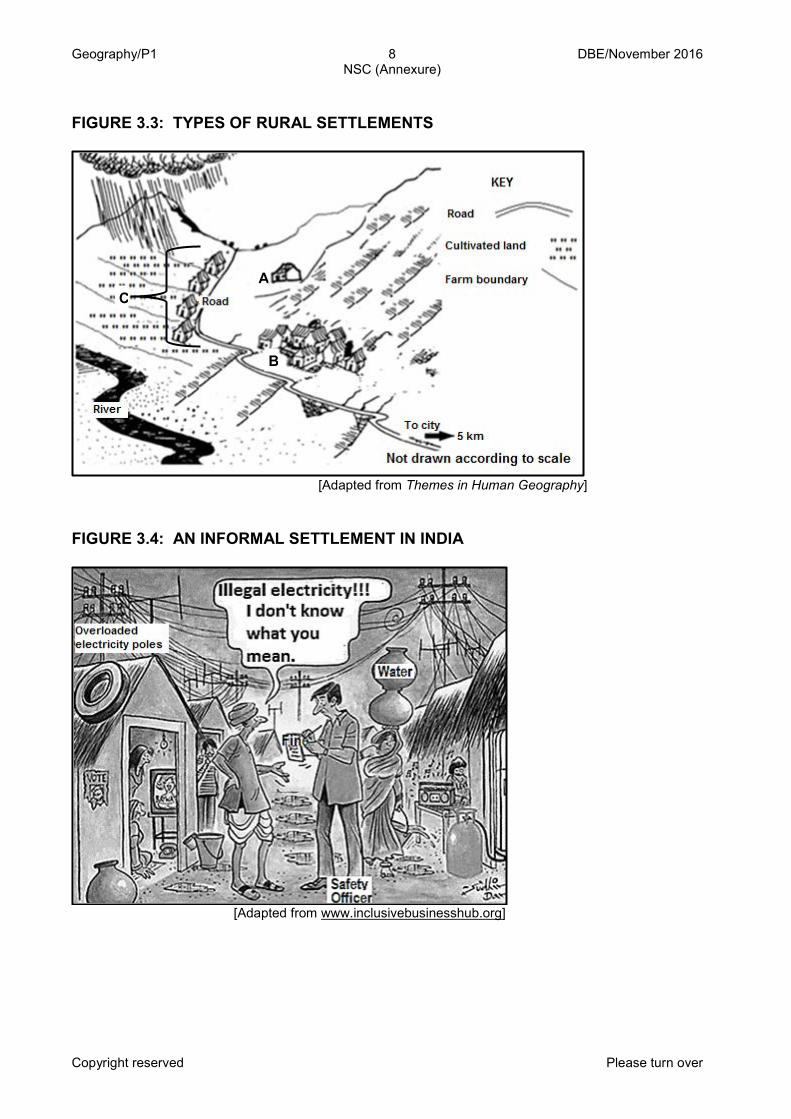
FIGURE 3.3: TYPES OF RURAL SETTLEMENTS
[Adapted from Themes in Human Geography] FIGURE 3.4: AN INFORMAL SETTLEMENT IN INDIA
[Adapted from www.inclusivebusinesshub.org]
A
B
C
Geography/P1 9 DBE/November 2016 NSC (Annexure)
Copyright reserved Please turn over
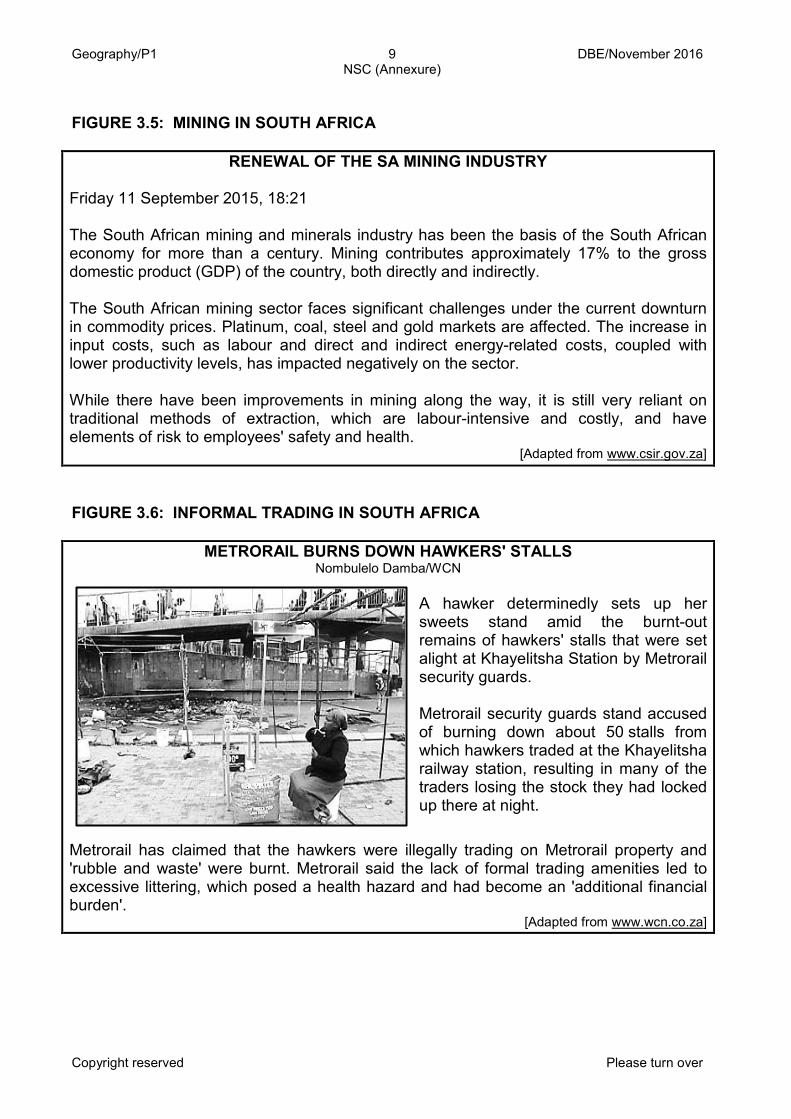
FIGURE 3.5: MINING IN SOUTH AFRICA
RENEWAL OF THE SA MINING INDUSTRY
Friday 11 September 2015, 18:21 The South African mining and minerals industry has been the basis of the South African economy for more than a century. Mining contributes approximately 17% to the gross domestic product (GDP) of the country, both directly and indirectly. The South African mining sector faces significant challenges under the current downturn in commodity prices. Platinum, coal, steel and gold markets are affected. The increase in input costs, such as labour and direct and indirect energy-related costs, coupled with lower productivity levels, has impacted negatively on the sector. While there have been improvements in mining along the way, it is still very reliant on traditional methods of extraction, which are labour-intensive and costly, and have elements of risk to employees' safety and health.
[Adapted from www.csir.gov.za]
FIGURE 3.6: INFORMAL TRADING IN SOUTH AFRICA
METRORAIL BURNS DOWN HAWKERS' STALLS Nombulelo Damba/WCN
A hawker determinedly sets up her sweets stand amid the burnt-out remains of hawkers' stalls that were set alight at Khayelitsha Station by Metrorail security guards. Metrorail security guards stand accused of burning down about 50 stalls from which hawkers traded at the Khayelitsha railway station, resulting in many of the traders losing the stock they had locked up there at night.
Metrorail has claimed that the hawkers were illegally trading on Metrorail property and 'rubble and waste' were burnt. Metrorail said the lack of formal trading amenities led to excessive littering, which posed a health hazard and had become an 'additional financial burden'.
[Adapted from www.wcn.co.za]
Geography/P1 10 DBE/November 2016 NSC (Annexure)
Copyright reserved Please turn over
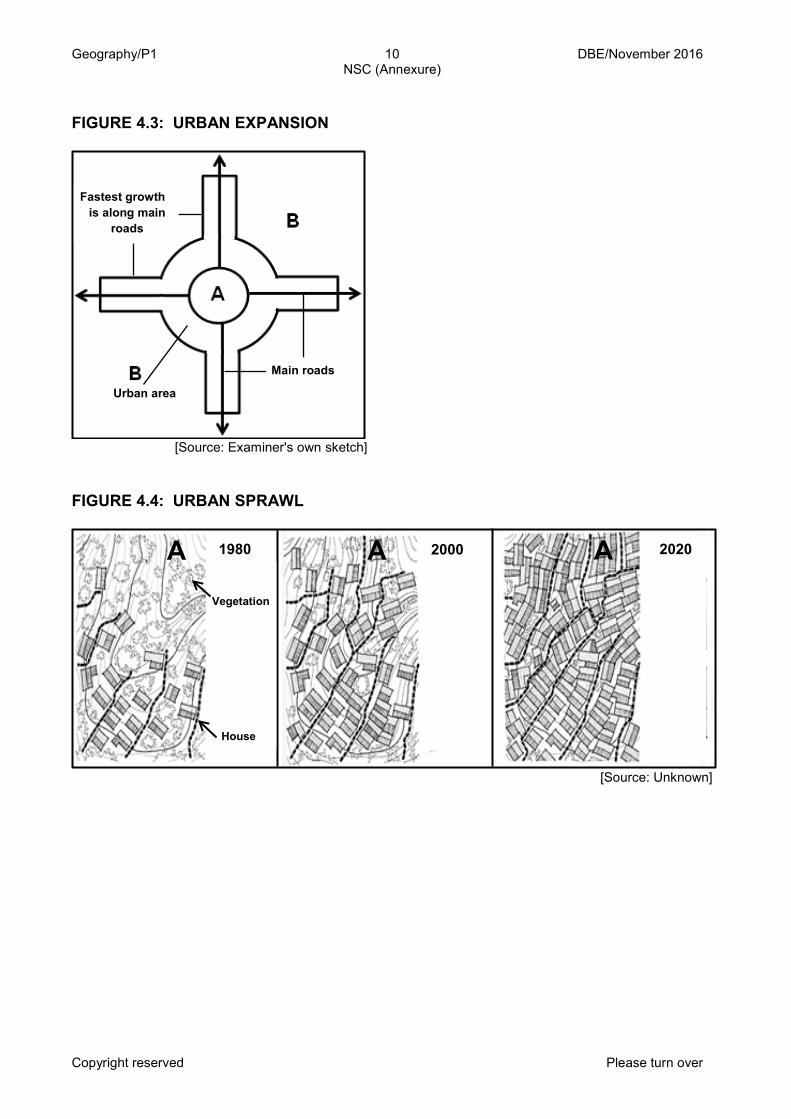
FIGURE 4.3: URBAN EXPANSION
[Source: Examiner's own sketch] FIGURE 4.4: URBAN SPRAWL
[Source: Unknown]
Urban area
Fastest growth is along main
roads
Main roads
2020 1980 A A
Vegetation
House
2000 A
Geography/P1 11 DBE/November 2016 NSC (Annexure)
Copyright reserved
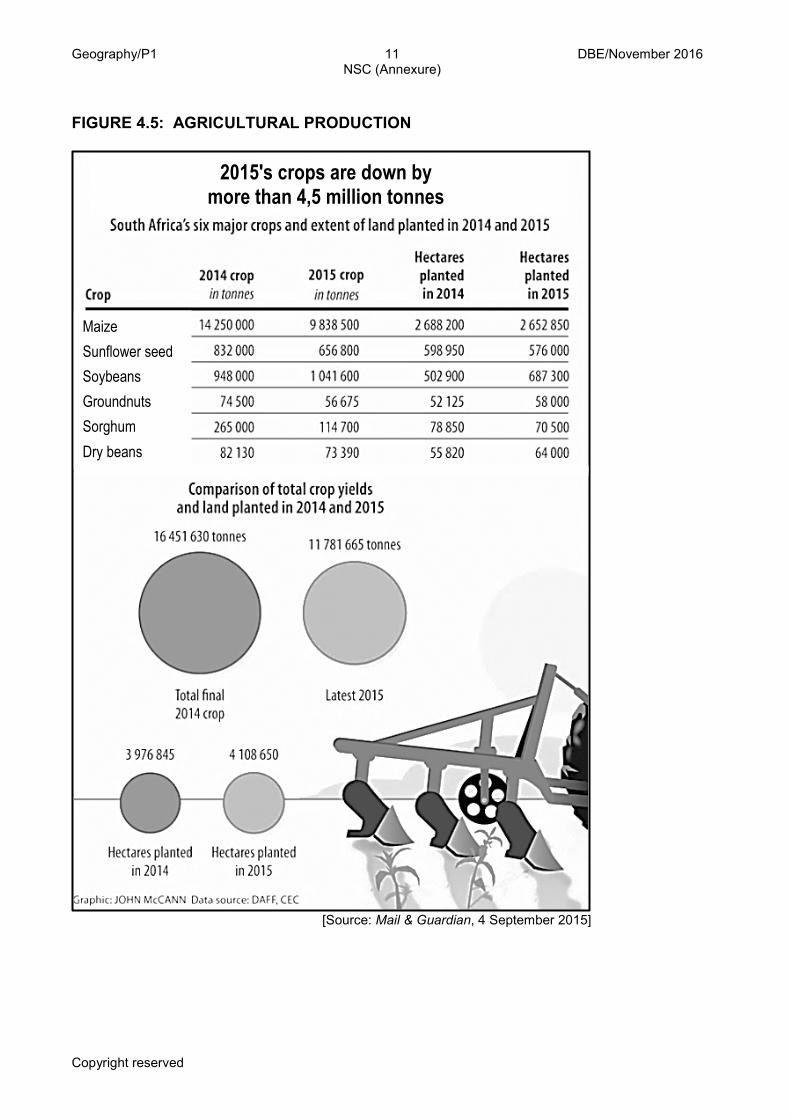
FIGURE 4.5: AGRICULTURAL PRODUCTION
[Source: Mail & Guardian, 4 September 2015]
2015's crops are down by more than 4,5 million tonnes
Maize Sunflower seed Soybeans Groundnuts Sorghum Dry beans