Embed Size (px)
DESCRIPTION
Nasty data … When killer data can ruin your analyses. JENA GRADUATE ACADEMY Dr. Friedrich Funke. Learning Objectives. What will you have learnt today? Why to inspect your data Why data become nasty - PowerPoint PPT Presentation
Citation preview

JENA GRADUATE ACADEMY Dr. Friedrich Funke
JENA GRADUATE ACADEMY Dr. Friedrich Funke
JENA GRADUATE ACADEMY Dr. Friedrich Funke
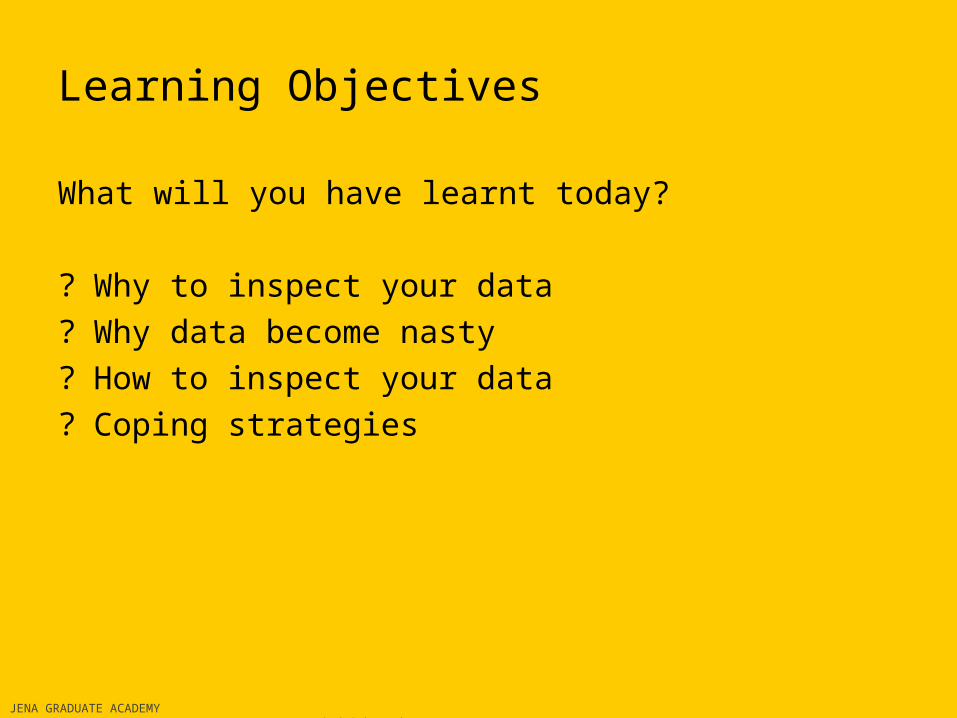
Learning Objectives
What will you have learnt today?
? Why to inspect your data? Why data become nasty? How to inspect your data? Coping strategies

JENA GRADUATE ACADEMY Dr. Friedrich Funke
Why to inspect your data?
Assumptions of parametric tests (e.g. ANOVA)
The error terms are…• randomly, independently, and normally
distributed, • with a mean of zero and• a common variance
(homoscedasticity)

JENA GRADUATE ACADEMY Dr. Friedrich Funke
Why to inspect your data?
Basic statistical method – Ordinary least squares (OLS)

JENA GRADUATE ACADEMY Dr. Friedrich Funke
Where are we?
? Why to inspect your data violation of assumptions
? Why data become nasty? How to inspect your data? Coping strategies

JENA GRADUATE ACADEMY Dr. Friedrich Funke
Where are we?
? Why to inspect your data violation of assumptions
? Why data become nasty? How to inspect your data? Coping strategies• Input errors (55 instead of 5)
• dropout/non-response• human nature keeps the game interesting

JENA GRADUATE ACADEMY Dr. Friedrich Funke
Am I allowed to alter my data?
• It is unethical to alter data for any reason.Or• Data points should be removed
if they are outliers and there is a identifiable reason for invalidity.
Or• Data points should be removed
if they are outliers. Extremity is reason enough.
29%
67%
4%

JENA GRADUATE ACADEMY Dr. Friedrich Funke
Am I allowed to alter my data?
• It is unethical to alter data for any reason
• It is unethical to alter data for any reason
• A good model for most data is better than a poor model for all of your data.

JENA GRADUATE ACADEMY Dr. Friedrich Funke
Where are we?
? Why to inspect your data violation of assumptions
? Why data become nasty? How to inspect your data? Coping strategies

JENA GRADUATE ACADEMY Dr. Friedrich Funke
Graphical data screening
JENA GRADUATE ACADEMY Dr. Friedrich Funke
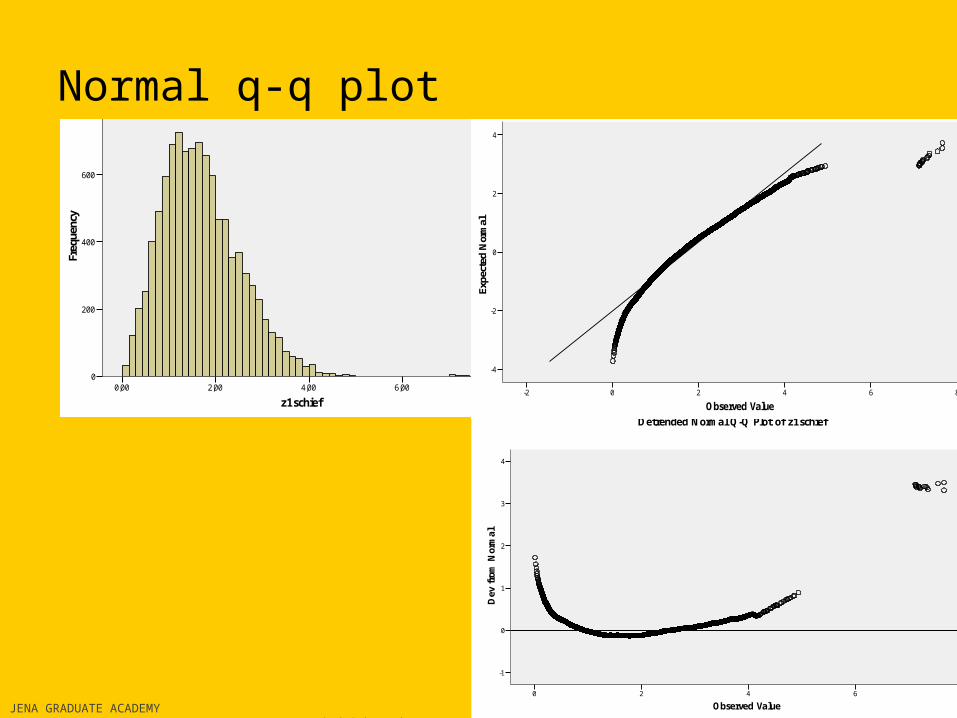
Normal q-q plot
z1schief8,006,004,002,000,00
Freq
uenc
y
800
600
400
200
0
Observed Value86420-2
Expe
cted
Nor
mal
4
2
0
-2
-4
Normal Q-Q Plot of z1schief
Observed Value86420
Dev
fro
m N
orm
al
4
3
2
1
0
-1
Detrended Normal Q-Q Plot of z1schief

JENA GRADUATE ACADEMY Dr. Friedrich Funke
Test on normality
• Access e.g. via EXPLORE
Tests of Normality
.051 10000 .000
.008 10000 .200*
.043 10000 .000
.064 104 .200* .985 104 .280
z1schief
z1
cauchy
z1MCAR10
Statistic df Sig. Statistic df Sig.
Kolmogorov-Smirnova
Shapiro-Wilk
This is a lower bound of the true significance.*.
Lilliefors Significance Correctiona.

JENA GRADUATE ACADEMY Dr. Friedrich Funke
My data are skewed – what shall i do?
• Transformed variables are difficult to interpret• Scales are often arbitrary no problem of
interpretation
• Find a transformation that produces the prettiest picture and skewness and kurtosis near 0 (iterative)
JENA GRADUATE ACADEMY Dr. Friedrich Funke
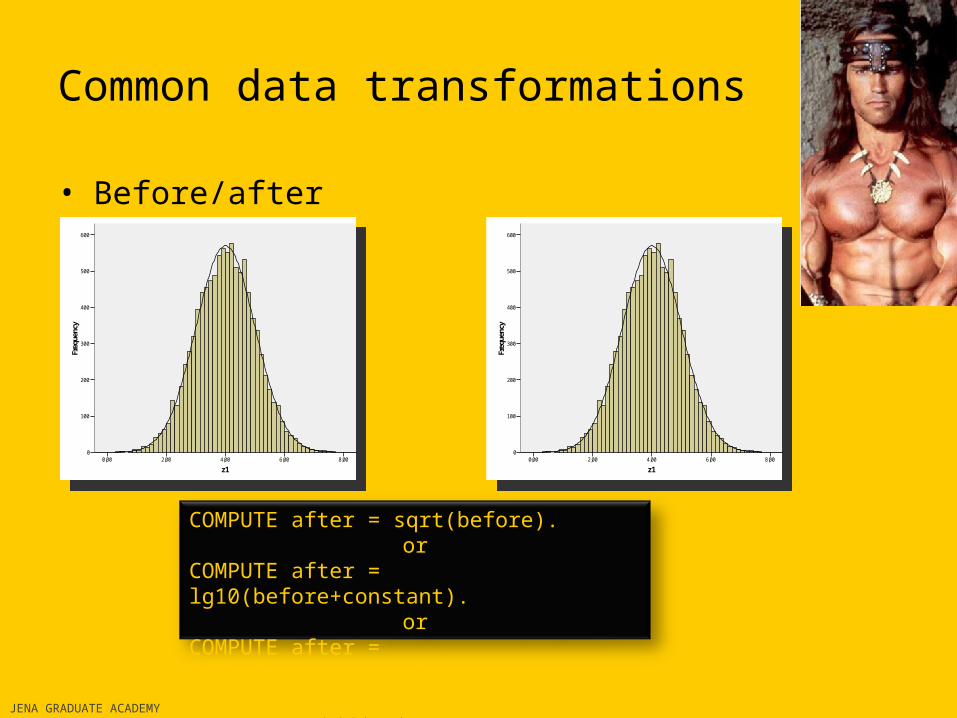
Common data transformations
• Before/after
z1_skew_pos60,0050,0040,0030,0020,0010,000,00
Freq
uenc
y
600
500
400
300
200
100
0z1_skew_pos
60,0050,0040,0030,0020,0010,000,00
Freq
uenc
y
600
500
400
300
200
100
0
z18,006,004,002,000,00
Freq
uenc
y
600
500
400
300
200
100
0z1
8,006,004,002,000,00
Freq
uenc
y
600
500
400
300
200
100
0
z18,006,004,002,000,00
Freq
uenc
y
600
500
400
300
200
100
0z1
8,006,004,002,000,00
Freq
uenc
y
600
500
400
300
200
100
0
COMPUTE after = sqrt(before).or
COMPUTE after = lg10(before+constant).
orCOMPUTE after = 1/(before+constant).

JENA GRADUATE ACADEMY Dr. Friedrich Funke
Common data transformations
• Add a constant to make the smallest value > 1• For left-skewed variables reverse the variables
(reversed = max+1-old_var)
z1_skew_pos60,0050,0040,0030,0020,0010,000,00
Freq
uenc
y
600
500
400
300
200
100
0z1_skew_pos
60,0050,0040,0030,0020,0010,000,00
Freq
uenc
y
600
500
400
300
200
100
0
z18,006,004,002,000,00
Freq
uenc
y
600
500
400
300
200
100
0z1
8,006,004,002,000,00
Freq
uenc
y
600
500
400
300
200
100
0

TO BE COMPLETED WITH RESIDUAL ANALYSIS

JENA GRADUATE ACADEMY Dr. Friedrich Funke
Rules of thumb
• Studentized deleted residuals with an absolute value greater than 2 deserve a look (greater than 4, alarm bells)
• Cook's D problematic if D. One recommendation is to consider values to be large which exceed 4/PAn.
• Another suggested rule is to consider any value greater than 1 or 2 as indicating that an observation requires a careful look.
• Finally, some researchers look for gaps between the D values.

JENA GRADUATE ACADEMY Dr. Friedrich Funke
Checklist For Screening Data
1. Inspect univariate descriptive statistics for accuracy of input a. out-of-range values, be aware of measurement scalesb. plausible means and standard deviationsc. coefficient of variation
2. Evaluate amount and distribution of missing data: deal with problem
3. Independence of variables
4. Identify and deal with nonnormal variables a. check skewness and kurtosis, probability plotsb. transform variables (if desirable)c. check results of transformations
5. Identify and deal with outliers a. univariate outliersb. multivariate outliers
6. Check pairwise plots for nonlinearity and heteroscedasticity
7. Evaluate variables for multicollinearity and singularity
8. Check for spatial autocorrelationAdapted from Tabachnick & Fidell

JENA GRADUATE ACADEMY Dr. Friedrich Funke
Best practice flow chart
Plausible range, missing, normality, outliers, homoscedascity
Plausible range, missing, normality, outliers, homoscedascity
Pairwise linearity (differential skewness?)Pairwise linearity (differential skewness?)
Studentized deleted residuals, leverage, Cooks‘s D …Studentized deleted residuals, leverage, Cooks‘s D …
e.g. squareroot, lg10, arcsin e.g. squareroot, lg10, arcsin

JENA GRADUATE ACADEMY Dr. Friedrich Funke
Take home message
• Detecting nasty data is important
• Knowing how to handle them is better
• Understanding WHY they are there is most important

JENA GRADUATE ACADEMY Dr. Friedrich Funke
Francis Bacon in Novum Organum:
»For whoever knows the ways of Nature will more easily notice her deviations; and, on the other hand, whoever knows her deviations will more accurately describe her ways «