Embed Size (px)
Citation preview
Q2 2018 Earnings – All Results are Unaudited
MylanNasdaq’s 39th London Conference
December 4, 2018
2
This document contains confidential and proprietary information of Mylan N.V. Unauthorized use,
duplication, dissemination or disclosure to third parties is strictly prohibited. © 2016
2018 Investor Day
2Mylan N.V. © 2018
Forward-Looking StatementsThis presentation contains “forward-looking statements.” These statements are made pursuant to the safe harbor provisions of the Private Securities Litigation Reform
Act of 1995. Such forward-looking statements may include, without limitation, statements about Mylan’s future operations, anticipated business levels, future earnings,
planned activities, anticipated growth, market opportunities, strategies, competition, and other expectations and targets for future periods. These may often be identified
by the use of words such as “will,” “may,” “could,” “should,” “would,” “project,” “believe,” “anticipate,” “expect,” “plan,” “estimate,” “forecast,” “potential,” “pipeline,” “intend,”
“continue,” “target” and variations of these words or comparable words. Because forward-looking statements inherently involve risks and uncertainties, actual future
results may differ materially from those expressed or implied by such forward-looking statements. Factors that could cause or contribute to such differences include, but
are not limited to: actions and decisions of healthcare and pharmaceutical regulators; failure to achieve expected or targeted future financial and operating performance
and results; uncertainties regarding future demand, pricing and reimbursement for our products; any regulatory, legal, or other impediments to Mylan’s ability to bring new
products to market, including, but not limited to, where Mylan uses its business judgment and decides to manufacture, market, and/or sell products, directly or through
third parties, notwithstanding the fact that allegations of patent infringement(s) have not been finally resolved by the courts (i.e., an “at-risk launch”); success of clinical
trials and Mylan’s ability to execute on new product opportunities; any changes in or difficulties with our manufacturing facilities, supply chain or inventory or our ability to
meet anticipated demand; the scope, timing, and outcome of any ongoing legal proceedings, including government investigations, and the impact of any such
proceedings on our financial condition, results of operations, and/or cash flows; the ability to meet expectations regarding the accounting and tax treatments of
acquisitions, including Mylan’s acquisition of Mylan Inc. and Abbott Laboratories’ non-U.S. developed markets specialty and branded generics business; changes in
relevant tax and other laws, including but not limited to changes in the U.S. tax code and healthcare and pharmaceutical laws and regulations in the U.S. and abroad; any
significant breach of data security or data privacy or disruptions to our information technology systems; the ability to protect intellectual property and preserve intellectual
property rights; the effect of any changes in customer and supplier relationships and customer purchasing patterns; the ability to attract and retain key personnel; the
impact of competition; identifying, acquiring, and integrating complementary or strategic acquisitions of other companies, products, or assets being more difficult, time-
consuming or costly than anticipated; the possibility that Mylan may be unable to achieve expected synergies and operating efficiencies in connection with strategic
acquisitions or restructuring programs within the expected time-frames or at all; uncertainties and matters beyond the control of management, including but not limited to
general political and economic conditions and global exchange rates; and inherent uncertainties involved in the estimates and judgments used in the preparation of
financial statements, and the providing of estimates of financial measures, in accordance with accounting principles generally accepted in the United States of America
(“U.S. GAAP”) and related standards or on an adjusted basis. Historical performance is not indicative of future results. For more detailed information on the risks and
uncertainties associated with Mylan’s business activities, see the risks described in Mylan’s Annual Report on Form 10-K for the year ended December 31, 2017, as
amended, and our other filings with the Securities and Exchange Commission (the “SEC”). You can access Mylan’s filings with the SEC through the SEC website at
www.sec.gov or through our website, and Mylan strongly encourages you to do so. Mylan routinely posts information that may be important to investors on our website at
investor.mylan.com, and we use this website address as a means of disclosing material information to the public in a broad, non-exclusionary manner for purposes of the
SEC’s Regulation Fair Disclosure (Reg FD). The contents of our website are not incorporated into this presentation. Mylan undertakes no obligation to update any
statements herein for revisions or changes after the date of this presentation.
At Mylan,We are committed to setting new standards in healthcare.
Working together around the world to provide 7 billion people
access to high quality medicine, we:
• Innovate to satisfy unmet needs
• Make reliability and service excellence a habit
• Do what’s right, not what’s easy
• Impact the future through
passionate global leadership
4
This document contains confidential and proprietary information of Mylan N.V. Unauthorized use,
duplication, dissemination or disclosure to third parties is strictly prohibited. © 2016
2018 Investor Day
4Mylan N.V. © 2018
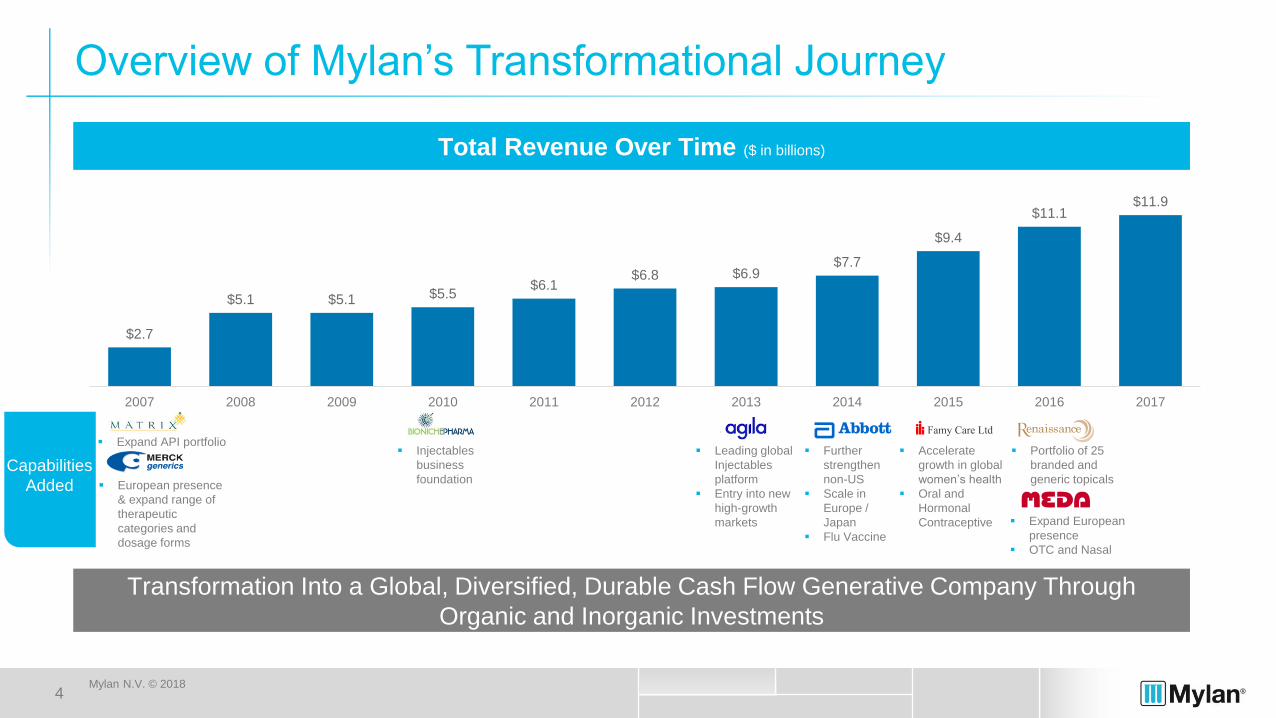
Overview of Mylan’s Transformational Journey
Capabilities
Added
▪ Leading global
Injectables
platform
▪ Entry into new
high-growth
markets
Total Revenue Over Time ($ in billions)
Transformation Into a Global, Diversified, Durable Cash Flow Generative Company Through
Organic and Inorganic Investments
▪ Further
strengthen
non-US
▪ Scale in
Europe /
Japan
▪ Flu Vaccine
▪ Accelerate
growth in global
women’s health
▪ Oral and
Hormonal
Contraceptive ▪ Expand European
presence
▪ OTC and Nasal
▪ European presence
& expand range of
therapeutic
categories and
dosage forms
▪ Portfolio of 25
branded and
generic topicals
▪ Injectables
business
foundation
▪ Expand API portfolio
$2.7
$5.1 $5.1 $5.5$6.1
$6.8 $6.9$7.7
$9.4
$11.1$11.9
2007 2008 2009 2010 2011 2012 2013 2014 2015 2016 2017

5
This document contains confidential and proprietary information of Mylan N.V. Unauthorized use,
duplication, dissemination or disclosure to third parties is strictly prohibited. © 2016
2018 Investor Day
5Mylan N.V. © 2018
Our Differentiated Business Model
ACCESS is our core purpose.
The more diversification
we achieve through driving
access, the more
it enhances the
DURABILITYof our business model.
To drive access, Mylan has
built tremendous
DIVERSIFICATIONinto our commercial, operational
and scientific platforms.
6
This document contains confidential and proprietary information of Mylan N.V. Unauthorized use,
duplication, dissemination or disclosure to third parties is strictly prohibited. © 2016
2018 Investor Day
6Mylan N.V. © 2018
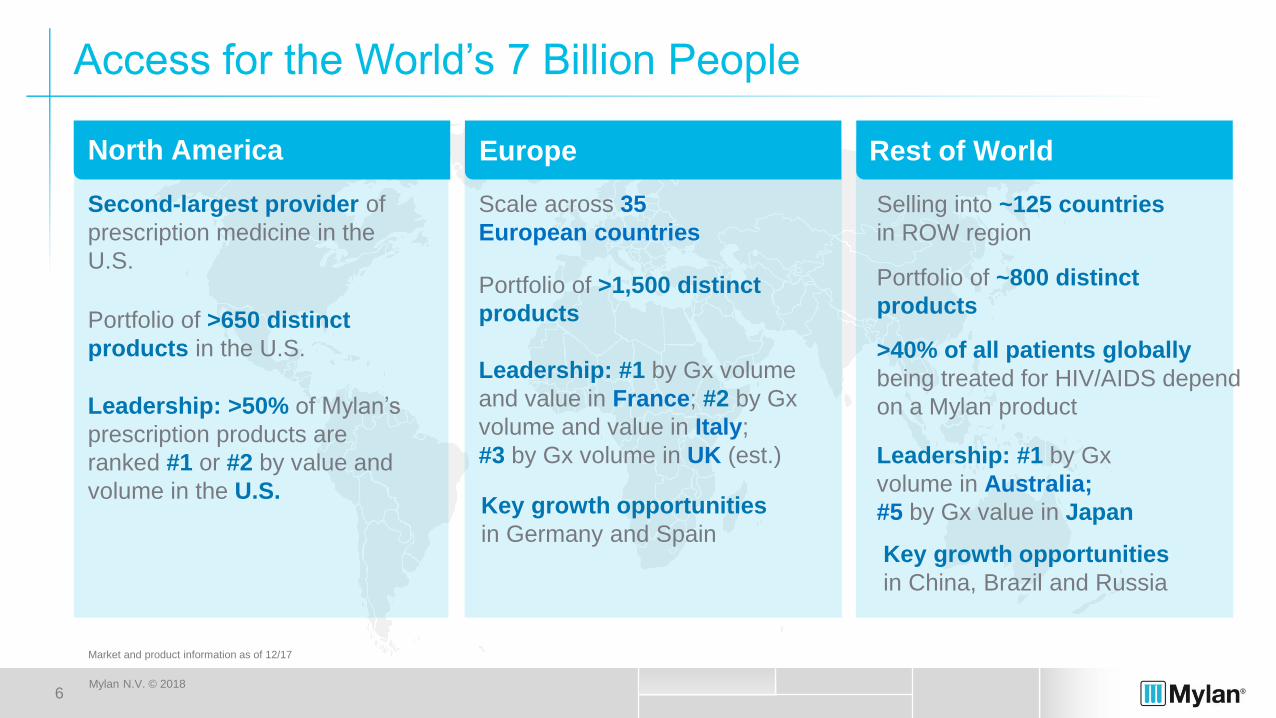
Access for the World’s 7 Billion People
North America Europe Rest of World
Scale across 35
European countries
Portfolio of >1,500 distinct
products
Leadership: #1 by Gx volume
and value in France; #2 by Gx
volume and value in Italy;
#3 by Gx volume in UK (est.) Leadership: #1 by Gx
volume in Australia;
#5 by Gx value in Japan
Selling into ~125 countries
in ROW region
Portfolio of ~800 distinct
products
Second-largest provider of
prescription medicine in the
U.S.
Portfolio of >650 distinct
products in the U.S.
Leadership: >50% of Mylan’s
prescription products are
ranked #1 or #2 by value and
volume in the U.S.
>40% of all patients globally
being treated for HIV/AIDS depend
on a Mylan product
Key growth opportunities
in Germany and SpainKey growth opportunities
in China, Brazil and Russia
Market and product information as of 12/17

7
This document contains confidential and proprietary information of Mylan N.V. Unauthorized use,
duplication, dissemination or disclosure to third parties is strictly prohibited. © 2016
2018 Investor Day
7Mylan N.V. © 2018
Diversification Across Products, Markets and Channels
Products
Markets
Channels
Access

8
This document contains confidential and proprietary information of Mylan N.V. Unauthorized use,
duplication, dissemination or disclosure to third parties is strictly prohibited. © 2016
2018 Investor Day
8Mylan N.V. © 2018
Diversification Across Franchises
Current Products 2,000
Pipeline Products 400
700
100
350
400
1,250
200
400
200
60
30
700
150
400
50
500
150
800
700
>7,500 Products
>2,500 Pipeline Products*
Across many growing
franchises, geographies,
and businesses
*Product is by product/dosage form/country basis, “All Other” franchise not shown. Current products taken from internal data. Product information as of 12/17.
Current Products
Pipeline Products
Current Products
Pipeline Products
9
This document contains confidential and proprietary information of Mylan N.V. Unauthorized use,
duplication, dissemination or disclosure to third parties is strictly prohibited. © 2016
2018 Investor Day
9Mylan N.V. © 2018
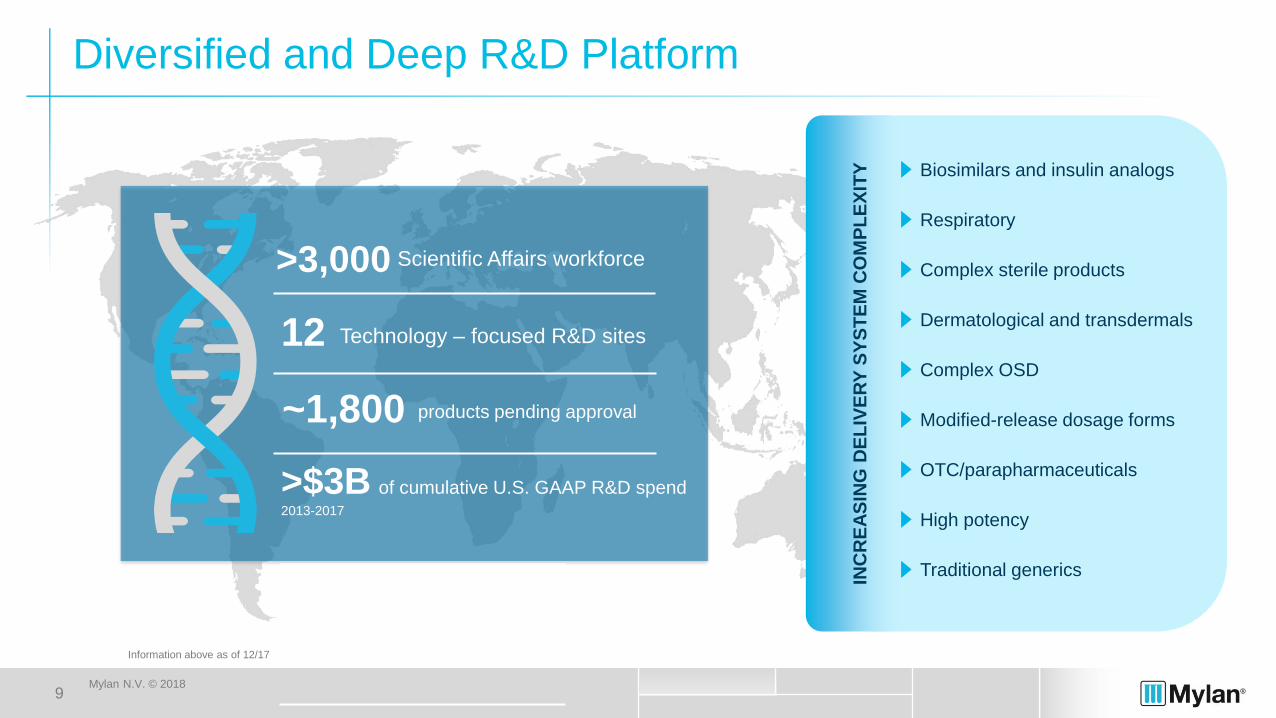
Diversified and Deep R&D Platform
INC
RE
AS
ING
DE
LIV
ER
Y S
YS
TE
M C
OM
PL
EX
ITY Biosimilars and insulin analogs
Respiratory
Complex sterile products
Dermatological and transdermals
Complex OSD
Modified-release dosage forms
High potency
Traditional generics
OTC/parapharmaceuticals
>3,000
12
~1,800
>$3B of cumulative U.S. GAAP R&D spend 2013-2017
Technology – focused R&D sites
products pending approval
Scientific Affairs workforce
Information above as of 12/17
10
This document contains confidential and proprietary information of Mylan N.V. Unauthorized use,
duplication, dissemination or disclosure to third parties is strictly prohibited. © 2016
2018 Investor Day
10Mylan N.V. © 2018
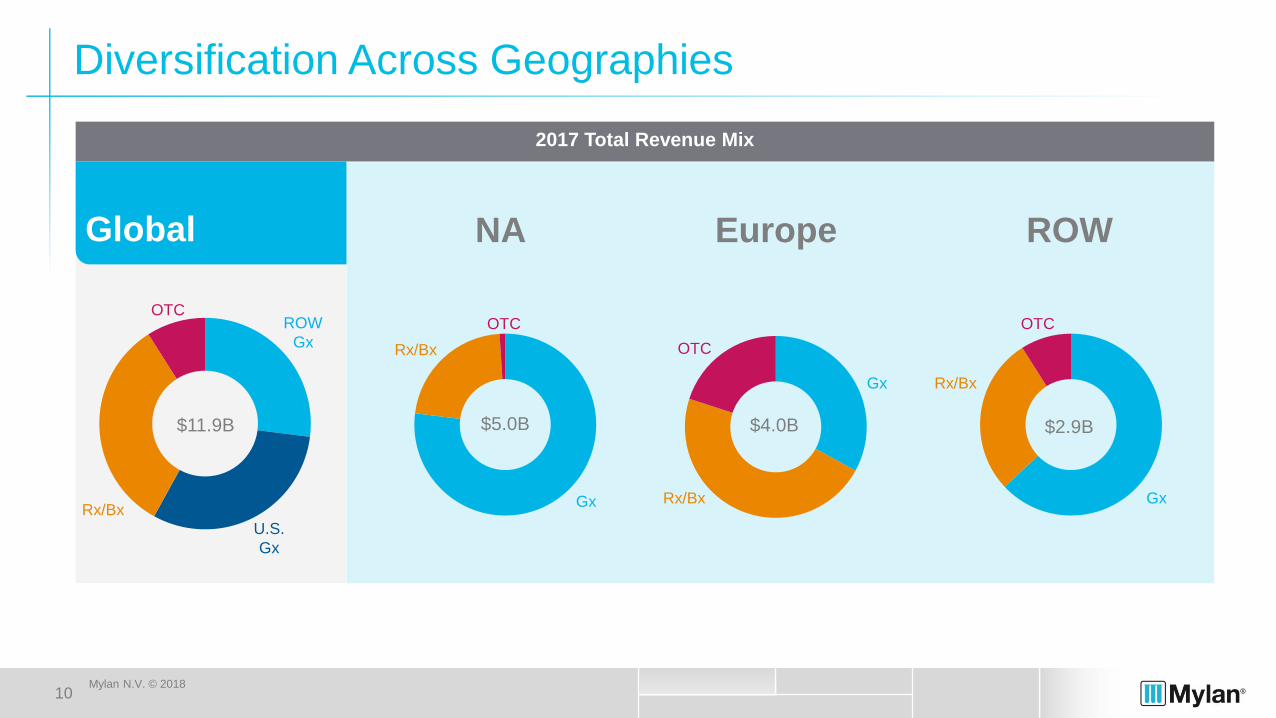
Diversification Across Geographies
Global NA Europe ROW
2017 Total Revenue Mix
Rx/Bx
OTCROW
Gx
U.S.
Gx
$5.0B
Gx
Rx/Bx
OTC
$4.0B $2.9B
Gx
OTC
Rx/Bx
Rx/Bx
OTC
Gx
$11.9B
11
This document contains confidential and proprietary information of Mylan N.V. Unauthorized use,
duplication, dissemination or disclosure to third parties is strictly prohibited. © 2016
2018 Investor Day
11Mylan N.V. © 2018
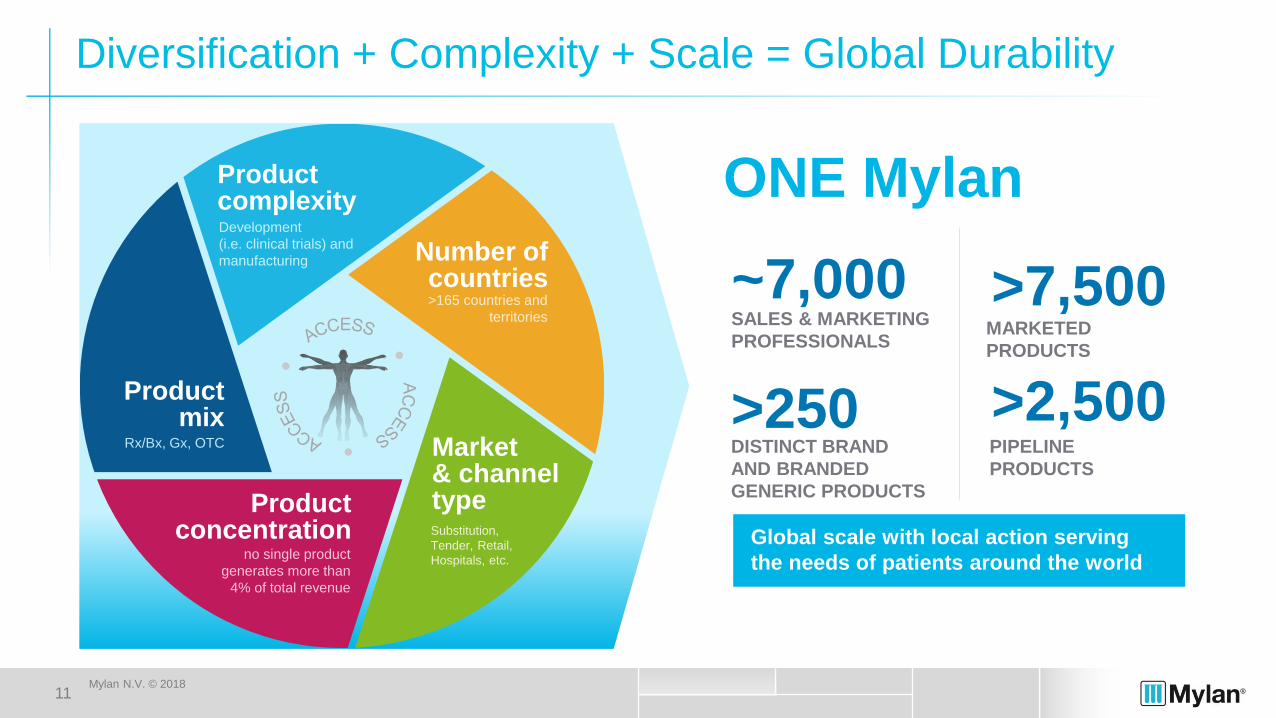
Product complexity
Market & channel type
Product mix
Number of countries
Productconcentration
Development
(i.e. clinical trials) and
manufacturing
Rx/Bx, Gx, OTC
no single product
generates more than
4% of total revenue
>165 countries and
territories
Diversification + Complexity + Scale = Global Durability
SALES & MARKETING
PROFESSIONALS
~7,000
>250DISTINCT BRAND
AND BRANDED
GENERIC PRODUCTS
MARKETED
PRODUCTS
>7,500
>2,500PIPELINE
PRODUCTS
ONE Mylan
Global scale with local action serving
the needs of patients around the world
Substitution,
Tender, Retail,
Hospitals, etc.
12
This document contains confidential and proprietary information of Mylan N.V. Unauthorized use,
duplication, dissemination or disclosure to third parties is strictly prohibited. © 2016
2018 Investor Day
12Mylan N.V. © 2018
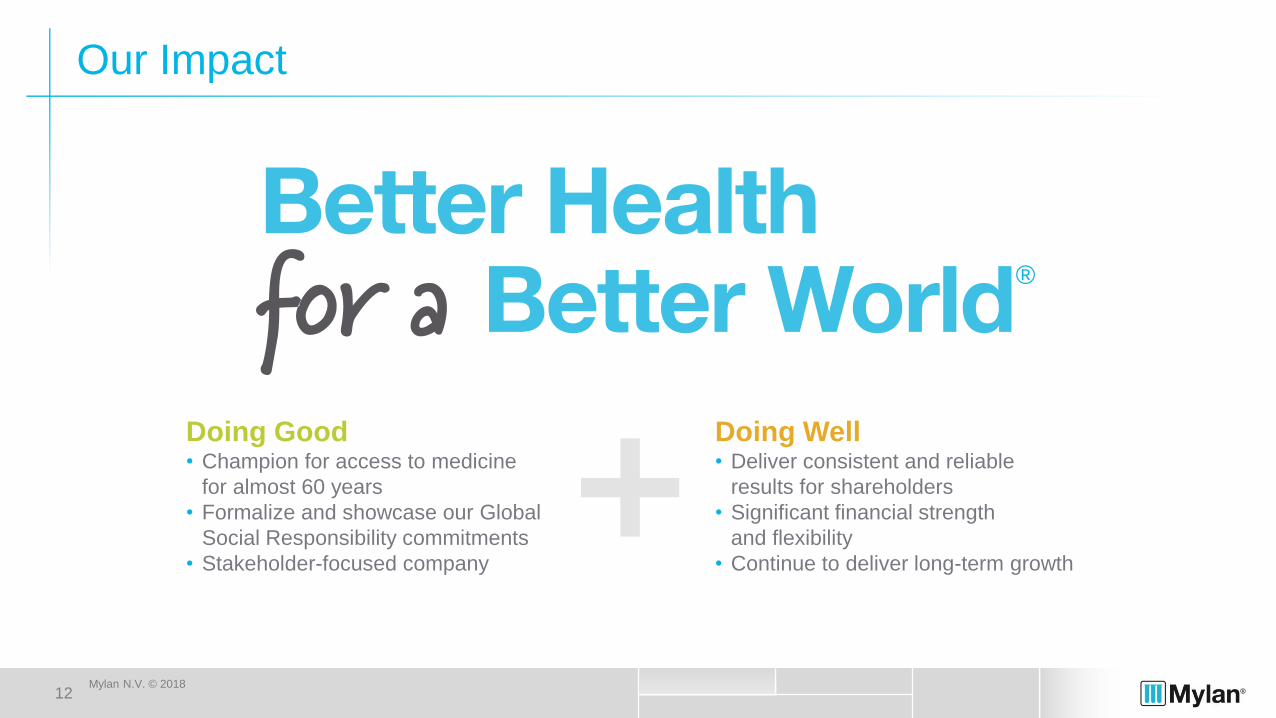
Our Impact
Doing Good• Champion for access to medicine
for almost 60 years
• Formalize and showcase our Global
Social Responsibility commitments
• Stakeholder-focused company
Doing Well• Deliver consistent and reliable
results for shareholders
• Significant financial strength
and flexibility
• Continue to deliver long-term growth
®

13
This document contains confidential and proprietary information of Mylan N.V. Unauthorized use,
duplication, dissemination or disclosure to third parties is strictly prohibited. © 2016
2018 Investor Day
13Mylan N.V. © 2018
Segment
Overview

14
This document contains confidential and proprietary information of Mylan N.V. Unauthorized use,
duplication, dissemination or disclosure to third parties is strictly prohibited. © 2016
2018 Investor Day
14Mylan N.V. © 2018
Du
rab
ility
North America – Maintaining and Strengthening Our Leadership
Robust complex product launches
One of industry’s broadest pipelines
Portfolio of >650 distinct products in the U.S.
Prudent managing of portfolio
2nd largest provider of prescription medicine in the U.S. at >316M prescriptions(1)
• Ability to execute on customer/market opportunities
• Long-term customer relationships
• Strong position across key therapeutic franchises
(e.g. Respiratory)
• Strategically focused sales force teams building
product and brand equity
Differentiated Capabilities
(1) Based on IQVIA NSP data for 12 months ended 12/17
(2) IQVIA 2018 and Beyond: Outlook and Turning Points
$467B Prescription Market Value(2)
Generics account for 89% of prescriptions dispensed but only 26% of total drug costs(3)
57 ANDA approvals in 2017(4)
Over the last 5 years, Mylan launched more generic products than any other company(5)
In the U.S., >50% of Mylan’s prescription products are ranked #1 or #2 by value
and volume(1)
(3) Source is AAM
(4) Source: https://www.accessdata.fda.gov/scripts/cder/daf/index.cfm
(5) IQVIA NSP generic Rx calendar years 2013-2017
2017 Total Revenues
$5.0B
Gx
Rx/Bx
OTC

15
This document contains confidential and proprietary information of Mylan N.V. Unauthorized use,
duplication, dissemination or disclosure to third parties is strictly prohibited. © 2016
2018 Investor Day
15Mylan N.V. © 2018
Europe – A Diversified Platform
Scale across 35 European countries
No single product greater than 4.5% of European Net Sales
Cover all major therapeutic areas with many leading brands(1)
Portfolio of >1,500 distinct branded, generic and OTC products
Most of the top European markets are outpacing market growth
Dura
bili
ty
~2,500SALES FORCE
(1) Based on IQVIA MIDAS data for 12 months ended 12/17
2017 Total Revenues
$4.0B
Gx
OTC
Rx/Bx
Diffe
ren
tia
ted
Ca
pa
bili
tie
sExpertise in Rx, Gx and OTC
KOL networks in key therapeutic areas
Existing leadership in key therapeutic areas
Vertically integrated global supply chain
Strong presence in national and European associations
16
This document contains confidential and proprietary information of Mylan N.V. Unauthorized use,
duplication, dissemination or disclosure to third parties is strictly prohibited. © 2016
2018 Investor Day
16Mylan N.V. © 2018
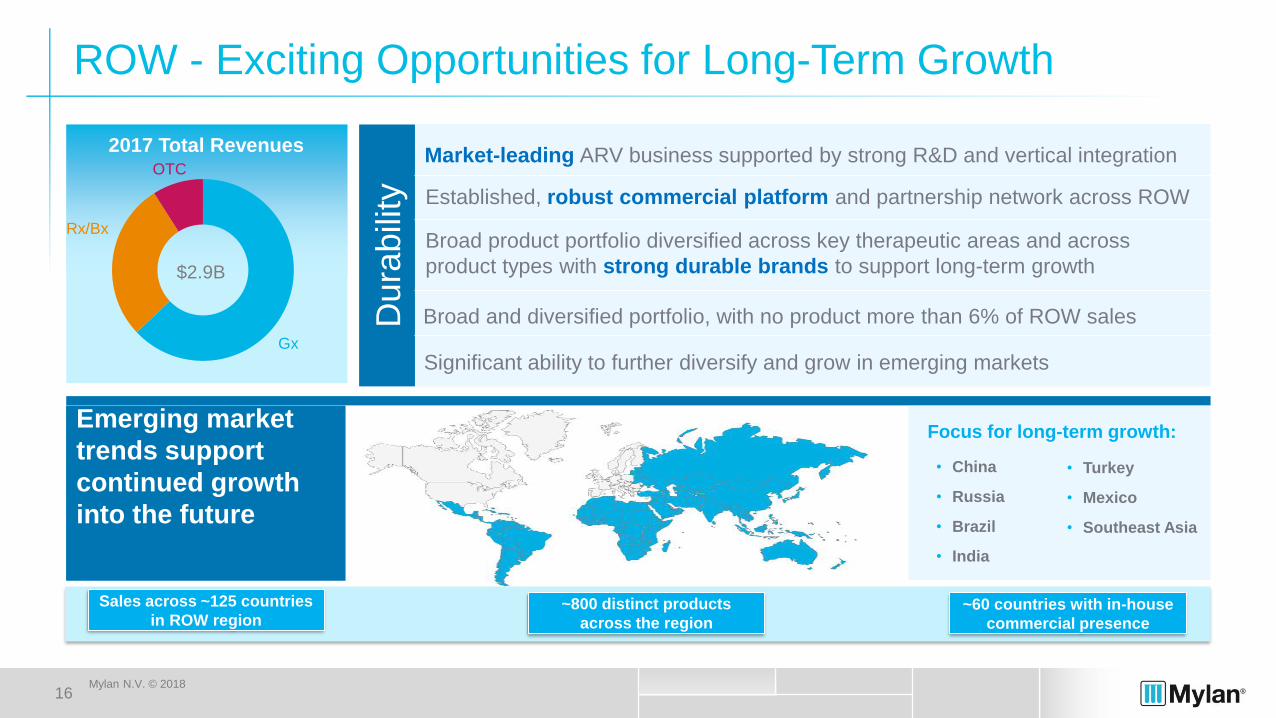
ROW - Exciting Opportunities for Long-Term Growth
2017 Total Revenues
Du
rab
ility
Market-leading ARV business supported by strong R&D and vertical integration
Established, robust commercial platform and partnership network across ROW
Broad and diversified portfolio, with no product more than 6% of ROW sales
Significant ability to further diversify and grow in emerging markets
Broad product portfolio diversified across key therapeutic areas and across
product types with strong durable brands to support long-term growth
Emerging market
trends support
continued growth
into the future
(1) (1)
• China
• Russia
• Brazil
• India
• Turkey
• Mexico
• Southeast Asia
Focus for long-term growth:
Sales across ~125 countries
in ROW region~800 distinct products
across the region
~60 countries with in-house
commercial presence
$2.9B
Rx/Bx
OTC
Gx

17
This document contains confidential and proprietary information of Mylan N.V. Unauthorized use,
duplication, dissemination or disclosure to third parties is strictly prohibited. © 2016
2018 Investor Day
17Mylan N.V. © 2018
Financial Durability
and Diversification
18
This document contains confidential and proprietary information of Mylan N.V. Unauthorized use,
duplication, dissemination or disclosure to third parties is strictly prohibited. © 2016
2018 Investor Day
18Mylan N.V. © 2018
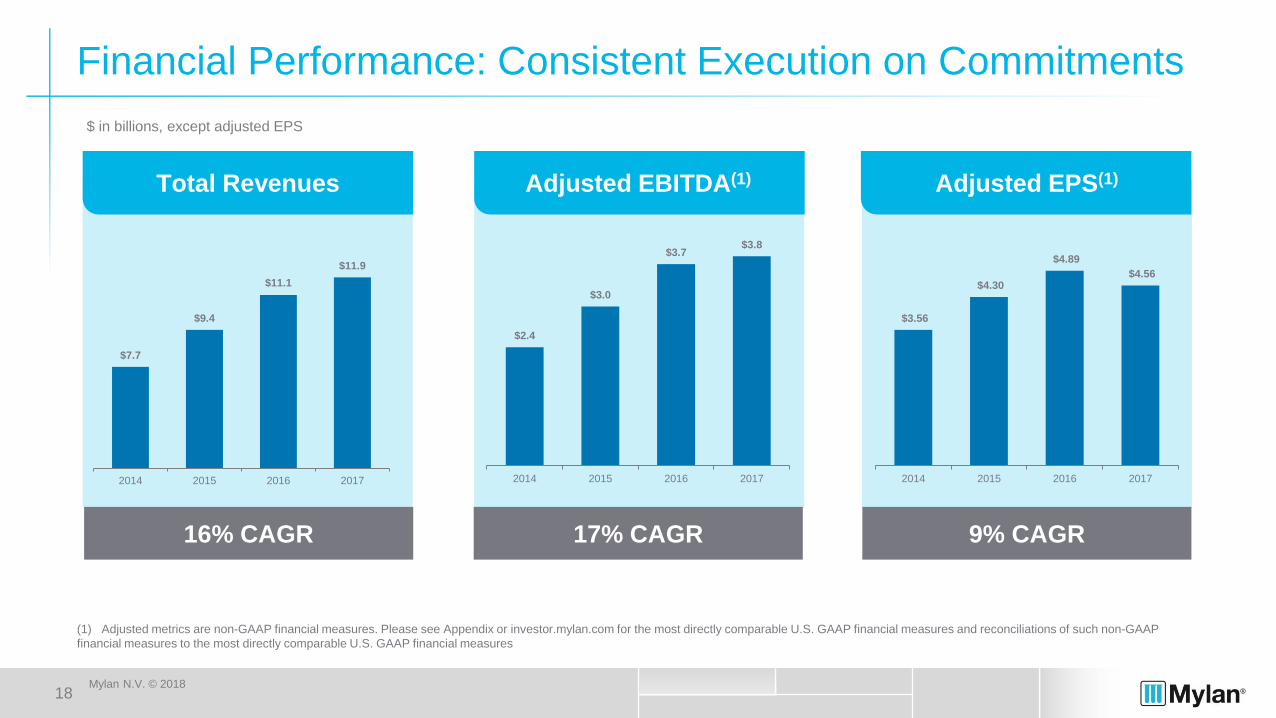
Financial Performance: Consistent Execution on Commitments
9% CAGR17% CAGR16% CAGR
Adjusted EPS(1)Adjusted EBITDA(1)Total Revenues
$7.7
$9.4
$11.1
$11.9
2014 2015 2016 2017
$2.4
$3.0
$3.7$3.8
2014 2015 2016 2017
$3.56
$4.30
$4.89
$4.56
2014 2015 2016 2017
(1) Adjusted metrics are non-GAAP financial measures. Please see Appendix or investor.mylan.com for the most directly comparable U.S. GAAP financial measures and reconciliations of such non-GAAP
financial measures to the most directly comparable U.S. GAAP financial measures
$ in billions, except adjusted EPS
19
This document contains confidential and proprietary information of Mylan N.V. Unauthorized use,
duplication, dissemination or disclosure to third parties is strictly prohibited. © 2016
2018 Investor Day
19Mylan N.V. © 2018
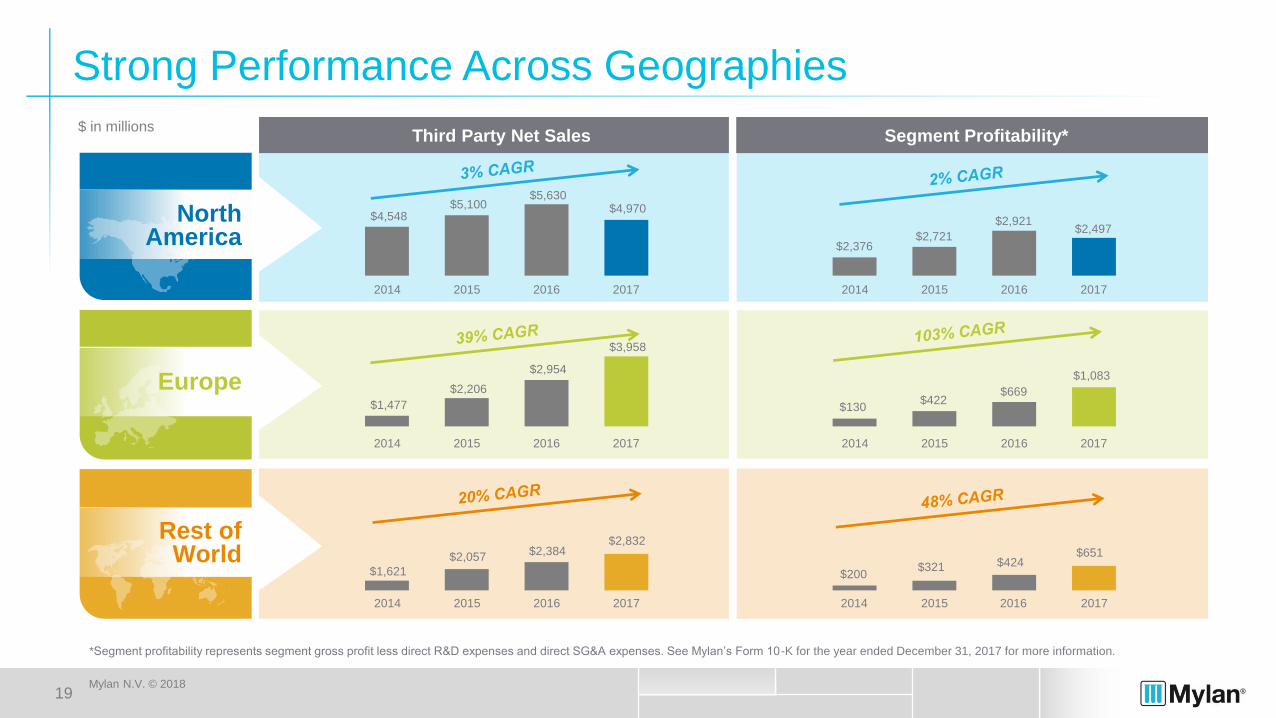
Strong Performance Across Geographies
Third Party Net Sales Segment Profitability*$ in millions
*Segment profitability represents segment gross profit less direct R&D expenses and direct SG&A expenses. See Mylan’s Form 10-K for the year ended December 31, 2017 for more information.
North America
Europe
Rest of World
2017201620152014
$4,970$5,630
$5,100$4,548
2017201620152014
$3,958
$2,954
$2,206
$1,477
2017201620152014
$2,832$2,384
$2,057
$1,621
2017201620152014
$1,083
$669$422
$130
2017201620152014
$651$424$321
$200
2017201620152014
$2,497$2,921
$2,721$2,376

20
This document contains confidential and proprietary information of Mylan N.V. Unauthorized use,
duplication, dissemination or disclosure to third parties is strictly prohibited. © 2016
2018 Investor Day
20Mylan N.V. © 2018
Strong and Consistent Cash Flow and
Returns on Invested Capital (ROIC)
2014 – 2017 Average
(1) Adjusted metrics are non-GAAP financial measures. Please see Appendix or investor.mylan.com for the most directly comparable U.S. GAAP financial measures and reconciliations of such non-GAAP financial
measures to the most directly comparable U.S. GAAP financial measures.
(2) Weighted average cost of capital (WACC) is calculated as the company's weighted average cost of debt and equity, using end of period notional debt and market capitalization for respective weights. Cost of debt
is based on the estimated cost of the company’s long term unsecured debt, net of tax benefit, as determined by third party pricing. Cost of equity is calculated as the risk free rate (10 Year U.S. treasury bond)
plus the company’s modified beta multiplied by the market risk premium (expected U.S. market return - risk free rate). See appendix for 2014- 2017 average calculation.
Adjusted Free Cash Flow(1)(approximate $ in billions)
$0.9
$1.9$2.1
$2.6
Committed to retain ample financial flexibility to maintain strong balance sheet and invest in the right future
opportunities
2014 2015 2016 2017
WACC(2) and ROIC(1)
~8%
~14%
WACC
ROIC

21
This document contains confidential and proprietary information of Mylan N.V. Unauthorized use,
duplication, dissemination or disclosure to third parties is strictly prohibited. © 2016
2018 Investor Day
21Mylan N.V. © 2018
2013 2014 2015 2016 2017
Growth Achieved with Balance Sheet Discipline
(1) Leverage ratio refers to total notional debt to Credit Agreement Adjusted EBITDA leverage ratio, which is a non-GAAP financial measures. Please see the Appendix or investor.mylan.com
for the most directly comparable U.S. GAAP financial measures and reconciliations of such non-GAAP financial measures to the most directly comparable U.S. GAAP financial measures.
(2) This target does not reflect Company guidance.
Committed to investment grade rating and long-term average leverage ratio target of ~3.0x(2)
Leverage Ratio(1)
2014 2015 2016 20172013
3.5x
2.8x
2.4x
3.8x 3.8x
22
This document contains confidential and proprietary information of Mylan N.V. Unauthorized use,
duplication, dissemination or disclosure to third parties is strictly prohibited. © 2016
2018 Investor Day
22Mylan N.V. © 2018
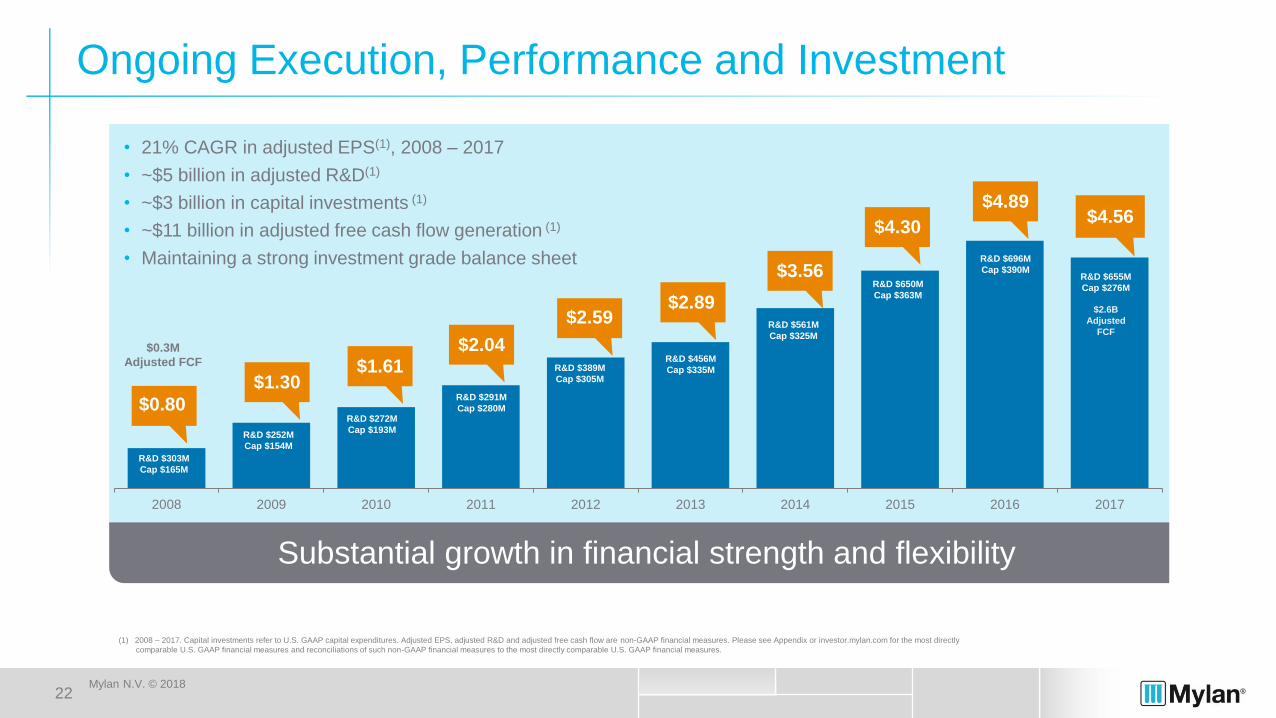
Ongoing Execution, Performance and Investment
2008 2009 2010 2011 2012 2013 2014 2015 2016 2017
$0.80
$1.30$1.61
$2.04
$2.59$2.89
$4.30
$3.56
$4.89
$0.3M
Adjusted FCF
R&D $303M
Cap $165M
R&D $252M
Cap $154M
R&D $272M
Cap $193M
R&D $291M
Cap $280M
R&D $389M
Cap $305M
R&D $456M
Cap $335M
R&D $561M
Cap $325M
R&D $650M
Cap $363M
R&D $696M
Cap $390MR&D $655M
Cap $276M
Substantial growth in financial strength and flexibility
$4.56
$2.6B
Adjusted
FCF
• 21% CAGR in adjusted EPS(1), 2008 – 2017
• ~$5 billion in adjusted R&D(1)
• ~$3 billion in capital investments (1)
• ~$11 billion in adjusted free cash flow generation (1)
• Maintaining a strong investment grade balance sheet
(1) 2008 – 2017. Capital investments refer to U.S. GAAP capital expenditures. Adjusted EPS, adjusted R&D and adjusted free cash flow are non-GAAP financial measures. Please see Appendix or investor.mylan.com for the most directly
comparable U.S. GAAP financial measures and reconciliations of such non-GAAP financial measures to the most directly comparable U.S. GAAP financial measures.

23
This document contains confidential and proprietary information of Mylan N.V. Unauthorized use,
duplication, dissemination or disclosure to third parties is strictly prohibited. © 2016
2018 Investor Day
23Mylan N.V. © 2018
Appendix

24
This document contains confidential and proprietary information of Mylan N.V. Unauthorized use,
duplication, dissemination or disclosure to third parties is strictly prohibited. © 2016
2018 Investor Day
24Mylan N.V. © 2018
Non-GAAP Financial Measures
This presentation includes the presentation and discussion of certain financial information that differs from what is reported under accounting U.S. GAAP. These non-GAAP financial
measures, including, but not limited to, adjusted EBITDA, adjusted EPS, adjusted R&D, adjusted free cash flow, ROIC, WACC and leverage ratio are presented in order to
supplement investors' and other readers' understanding and assessment of the financial performance of Mylan N.V. (“Mylan” or the “Company”). In the presentation and this
Appendix, Mylan has provided reconciliations of such non-GAAP financial measures to the most directly comparable U.S. GAAP financial measures. Investors and other readers are
encouraged to review the related U.S. GAAP financial measures and the reconciliations of the non-GAAP measures to their most directly comparable U.S. GAAP measures set forth
below, and investors and other readers should consider non-GAAP measures only as supplements to, not as substitutes for or as superior measures to, the measures of financial
performance prepared in accordance with U.S. GAAP.
25
This document contains confidential and proprietary information of Mylan N.V. Unauthorized use,
duplication, dissemination or disclosure to third parties is strictly prohibited. © 2016
2018 Investor Day
25Mylan N.V. © 2018
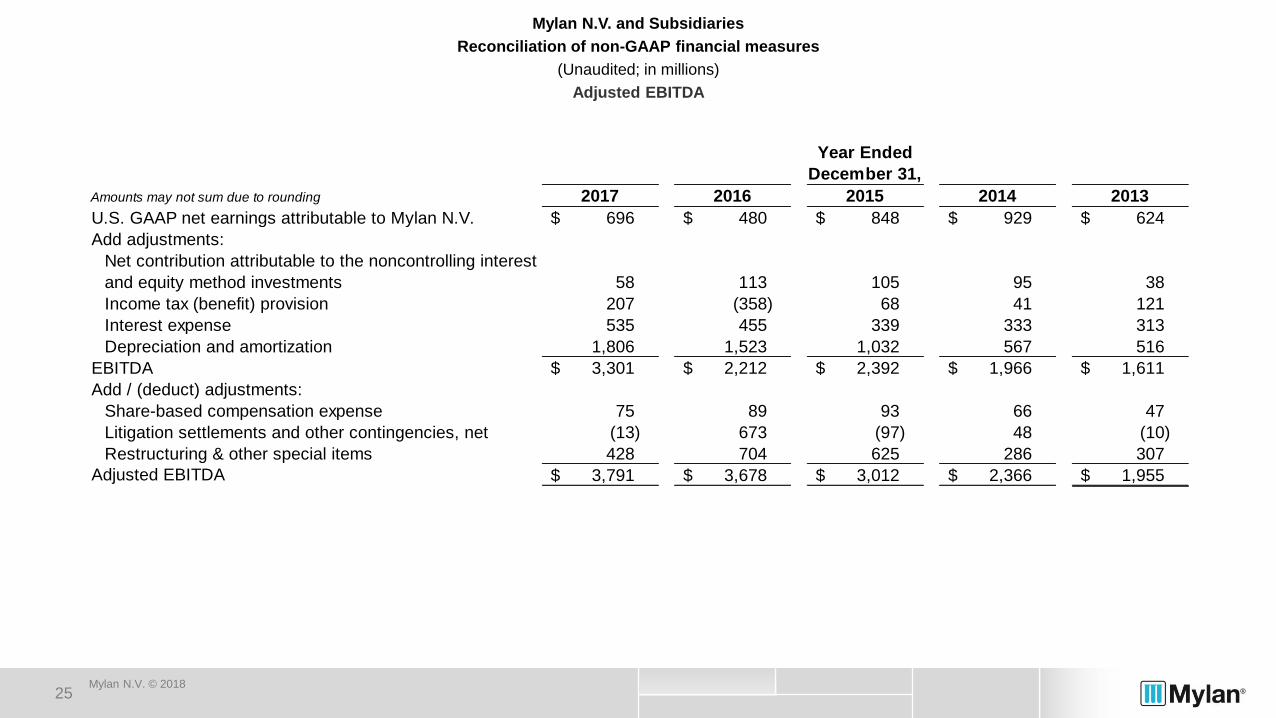
Mylan N.V. and Subsidiaries
Reconciliation of non-GAAP financial measures
(Unaudited; in millions)
Adjusted EBITDA
Amounts may not sum due to rounding 2017 2016 2015 2014 2013
U.S. GAAP net earnings attributable to Mylan N.V. 696$ 480$ 848$ 929$ 624$
Add adjustments:
Net contribution attributable to the noncontrolling interest
and equity method investments 58 113 105 95 38
Income tax (benefit) provision 207 (358) 68 41 121
Interest expense 535 455 339 333 313
Depreciation and amortization 1,806 1,523 1,032 567 516
EBITDA 3,301$ 2,212$ 2,392$ 1,966$ 1,611$
Add / (deduct) adjustments:
Share-based compensation expense 75 89 93 66 47
Litigation settlements and other contingencies, net (13) 673 (97) 48 (10)
Restructuring & other special items 428 704 625 286 307
Adjusted EBITDA 3,791$ 3,678$ 3,012$ 2,366$ 1,955$
Year Ended
December 31,
26
This document contains confidential and proprietary information of Mylan N.V. Unauthorized use,
duplication, dissemination or disclosure to third parties is strictly prohibited. © 2016
2018 Investor Day
26Mylan N.V. © 2018
Mylan N.V. and Subsidiaries
Reconciliation of non-GAAP financial measures
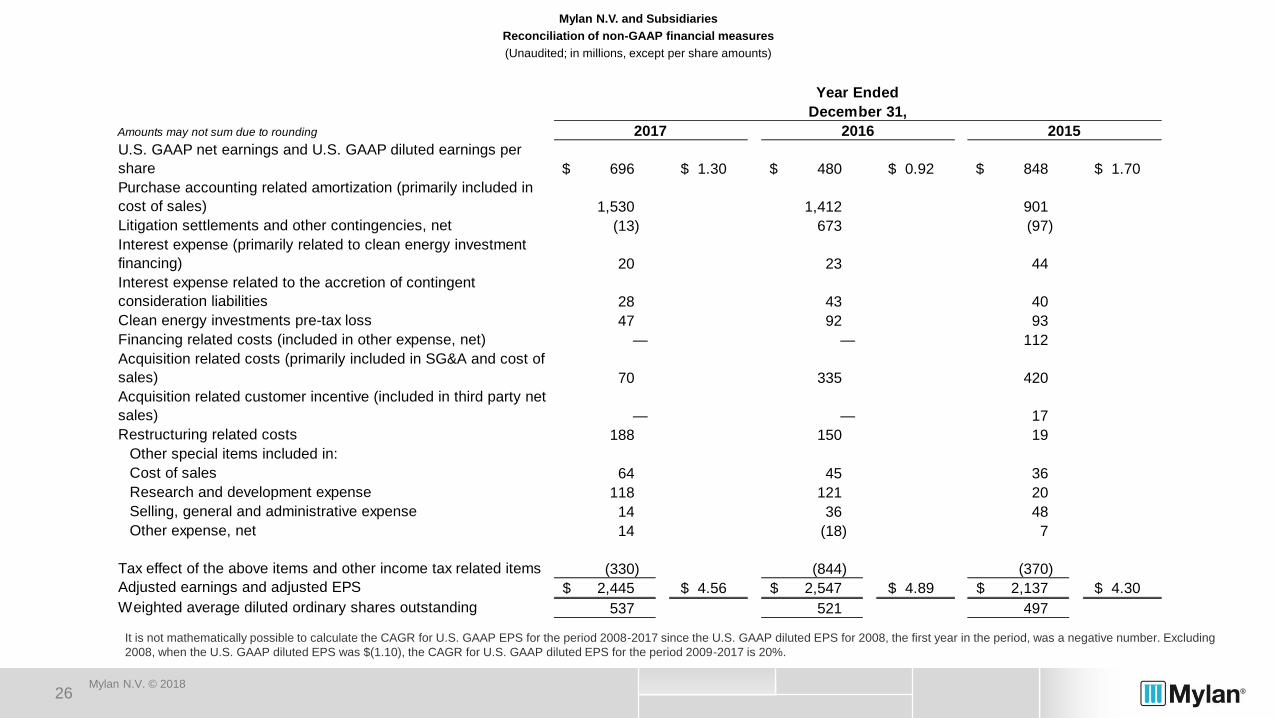
(Unaudited; in millions, except per share amounts)
It is not mathematically possible to calculate the CAGR for U.S. GAAP EPS for the period 2008-2017 since the U.S. GAAP diluted EPS for 2008, the first year in the period, was a negative number. Excluding
2008, when the U.S. GAAP diluted EPS was $(1.10), the CAGR for U.S. GAAP diluted EPS for the period 2009-2017 is 20%.
Amounts may not sum due to rounding
U.S. GAAP net earnings and U.S. GAAP diluted earnings per
share 696$ 1.30$ 480$ 0.92$ 848$ 1.70$
Purchase accounting related amortization (primarily included in
cost of sales) 1,530 1,412 901
Litigation settlements and other contingencies, net (13) 673 (97)
Interest expense (primarily related to clean energy investment
financing) 20 23 44
Interest expense related to the accretion of contingent
consideration liabilities 28 43 40
Clean energy investments pre-tax loss 47 92 93
Financing related costs (included in other expense, net) — — 112
Acquisition related costs (primarily included in SG&A and cost of
sales) 70 335 420
Acquisition related customer incentive (included in third party net
sales) — — 17
Restructuring related costs 188 150 19
Other special items included in:
Cost of sales 64 45 36
Research and development expense 118 121 20
Selling, general and administrative expense 14 36 48
Other expense, net 14 (18) 7
Tax effect of the above items and other income tax related items (330) (844) (370)
Adjusted earnings and adjusted EPS 2,445$ 4.56$ 2,547$ 4.89$ 2,137$ 4.30$
Weighted average diluted ordinary shares outstanding 537 521 497
December 31,
2016 2015
Year Ended
2017

27
This document contains confidential and proprietary information of Mylan N.V. Unauthorized use,
duplication, dissemination or disclosure to third parties is strictly prohibited. © 2016
2018 Investor Day
27Mylan N.V. © 2018
Mylan N.V. and Subsidiaries
Reconciliation of non-GAAP financial measures
(Unaudited; in millions, except per share amounts)
Amounts may not sum due to rounding
U.S. GAAP net earnings attributable to Mylan N.V. and
U.S. GAAP diluted EPS 929$ 2.34$ 624$ 1.58$ 641$ 1.52$
Purchase accounting related amortization (primarily
included in cost of sales) 419 371 391
Litigation settlements, net 48 (10) (3)
Interest expense (primarily related to clean energy
investment financing) 46 38 36
Accretion of contingent consideration liability and other fair
value adjustments 35 35 39
Clean energy investments pre-tax loss 79 22 17
Financing related costs (included in other (income)
expense, net) 33 73 —
Acquisition related costs (primarily included in cost of sales
and selling, general and administrative expense) 140 50 —
Restructuring related costs 10 — —
Other special items included in:
Cost of sales 41 49 66
Research and development expense 18 52 12
Selling, general and administrative expense 61 71 105
Other (income) expense, net (11) 25 (1)
Tax effect of the above items and other income tax related
items (432) (260) (216)
Adjusted net earnings attributable to Mylan N.V. and
adjusted diluted EPS 1,416$ 3.56$ 1,140$ 2.89$ 1,087$ 2.59$
Weighted average diluted common shares outstanding 398 395 420
Year Ended December 31,
2014 2013 2012

28
This document contains confidential and proprietary information of Mylan N.V. Unauthorized use,
duplication, dissemination or disclosure to third parties is strictly prohibited. © 2016
2018 Investor Day
28Mylan N.V. © 2018
Mylan N.V. and Subsidiaries
Reconciliation of non-GAAP financial measures
(Unaudited; in millions, except per share amounts)
Amounts may not sum due to rounding
U.S. GAAP net earnings (loss) attributable to Mylan N.V.
and U.S. GAAP diluted EPS 537$ 1.22$ 224$ 0.68$ 94$ 0.30$ (335)$ (1.10)$
Purchase accounting related amortization (primarily
included in cost of sales) 365 309 283 489
Goodwill impairment charges — — — 385
Bystolic revenue — — — (468)
Litigation settlements, net 49 127 226 17
Interest expense (primarily related to clean energy
investment financing) 49 60 43 30
Financing related costs (included in other (income)
expense, net) 34 37 — —
Acceleration of deferred revenue — — (29) —
Non-controlling interest — — 9 —
Other special items included in: —
Cost of sales 8 7 33 53
Research and development expense 4 10 22 14
Selling, general and administrative expense 45 63 49 89
Other (income) expense, net — 1 (13) 1
Tax effect of the above items and other income tax related
items (198) (253) (273) (31)
Preferred dividend — 122 139 —
Adjusted net earnings attributable to Mylan N.V. and
adjusted diluted EPS 893$ 2.04$ 707$ 1.61$ 583$ 1.30$ 244$ 0.80$
Weighted average diluted common shares outstanding 439 438 450 304
Year Ended December 31,
2011 2010 2009 2008

29
This document contains confidential and proprietary information of Mylan N.V. Unauthorized use,
duplication, dissemination or disclosure to third parties is strictly prohibited. © 2016
2018 Investor Day
29Mylan N.V. © 2018
Mylan N.V. and Subsidiaries
Reconciliation of non-GAAP financial measures
(Unaudited; in millions)
Notional Debt to Credit Agreement Adjusted EBITDA Leverage Ratio and Target Leverage Ratio
Notional Debt to Credit Agreement Adjusted EBITDA Leverage Ratio
The stated non-GAAP financial measure notional debt to Credit Agreement Adjusted EBITDA leverage ratio is based on the sum of (i) Mylan's adjusted EBITDA for the specified year and (ii) certain adjustments permitted to
be included in Credit Agreement Adjusted EBITDA for the specified year pursuant to the Company's revolving credit facility or term credit facility in place from time to time (together, the "Credit Agreements") as compared to
Mylan's total debt at notional amounts.
Adjusted EBITDA for the year ended December 31, 2016 is based on the sum of (i) $3,678 million of the year ended December 31, 2016 adjusted EBITDA (unaudited) for Mylan, (ii) $336 million adjusted EBITDA (unaudited)
for the period of January 1, 2016 to the date of acquisition (translated from SEK to USD at an average exchange rate of 0.119) for Meda1 and (iii) $34 million adjusted EBITDA (unaudited) for the period of January 1, 2016 to
the date of acquisition for Renaissance. The stated measures represent an aggregation of Mylan figures, Renaissance figures derived from financial information prepared in accordance with U.S. GAAP and Meda figures
derived from financial information prepared in accordance with IFRS as issued by the IASB and does not reflect pro forma adjustments (including the elimination of transactions between Mylan and Meda and Mylan and
Renaissance). For the years ended December 31, 2017, 2016, 2015, 2014 and 2013, all amounts presented below are derived from Mylan's historical financial statements.
Amounts may not sum due to rounding 2017 2016 2015 2014 2013
Mylan N.V. Adjusted EBITDA 3,791$ 3,678$ 3,012$ 2,366$ 1,955$
Add:
Other adjustments including estimated synergies 118 — — — —
Pro-forma impact of acquisitions — 370 — — —
Credit Agreement Adjusted EBITDA 3,909 4,048 3,012 2,366 1,955
Reported debt balances:
Long-term debt, including current portion 14,615 15,426 7,294 8,104 7,587
Short-term borrowings 47 46 — 331 440
Total reported debt balances 14,661 15,473 7,294 8,435 8,026
Add / (deduct):
Net discount on various debt issuances 37 41 8 19 55
Deferred financing fees 75 92 38 34 —
Conversion feature of cash convertible notes — — — (1,854) (1,303)
Fair value of hedged debt (15) (26) (36) (30) (4)
Total debt at notional amounts 14,758$ 15,579$ 7,304$ 6,604$ 6,774$
Notional debt to Credit Agreement Adjusted EBITDA Leverage Ratio 3.8x 3.8x 2.4x 2.8x 3.5x
Year Ended
December 31,
Long-term average debt-to-adjusted EBITDA leverage target of ~3.0x
The stated forward-looking non-GAAP financial measure, targeted long term average leverage of ~3.0x
debt-to-Credit Agreement Adjusted EBITDA, is based on the ratio of (i) targeted long-term average debt, and (ii) targeted long-term Credit Agreement Adjusted EBITDA. However, the Company has not quantified future
amounts to develop the target but has stated its goal to manage long-term average debt and adjusted net earnings and EBITDA over time in order to generally maintain the target. This target does not reflect Company
guidance.
.
30
This document contains confidential and proprietary information of Mylan N.V. Unauthorized use,
duplication, dissemination or disclosure to third parties is strictly prohibited. © 2016
2018 Investor Day
30Mylan N.V. © 2018
Mylan N.V. and Subsidiaries
Reconciliation of non-GAAP financial measures
(Unaudited; in millions)
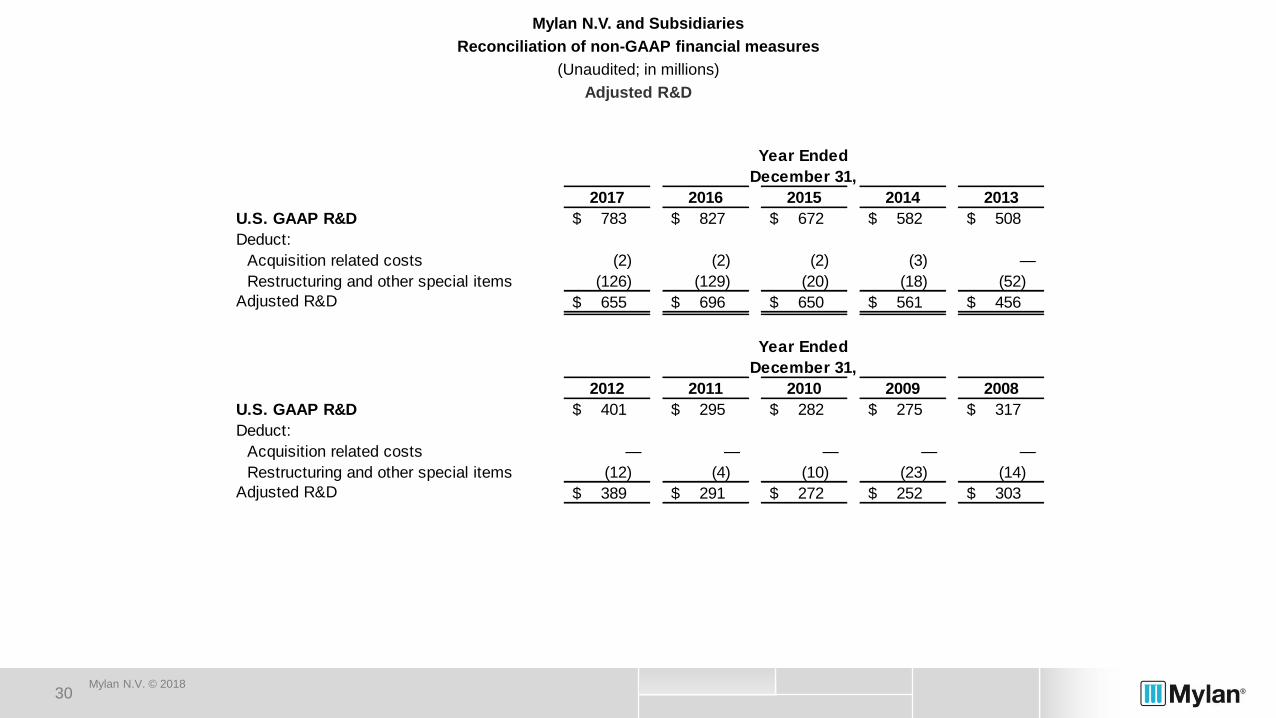
Adjusted R&D
2017 2016 2015 2014 2013
U.S. GAAP R&D 783$ 827$ 672$ 582$ 508$
Deduct:
Acquisition related costs (2) (2) (2) (3) —
Restructuring and other special items (126) (129) (20) (18) (52)
Adjusted R&D 655$ 696$ 650$ 561$ 456$
2012 2011 2010 2009 2008
U.S. GAAP R&D 401$ 295$ 282$ 275$ 317$
Deduct:
Acquisition related costs — — — — —
Restructuring and other special items (12) (4) (10) (23) (14)
Adjusted R&D 389$ 291$ 272$ 252$ 303$
Year Ended
December 31,
Year Ended
December 31,
31
This document contains confidential and proprietary information of Mylan N.V. Unauthorized use,
duplication, dissemination or disclosure to third parties is strictly prohibited. © 2016
2018 Investor Day
31Mylan N.V. © 2018
Mylan N.V. and Subsidiaries
Reconciliation of non-GAAP financial measures
(Unaudited; in millions)
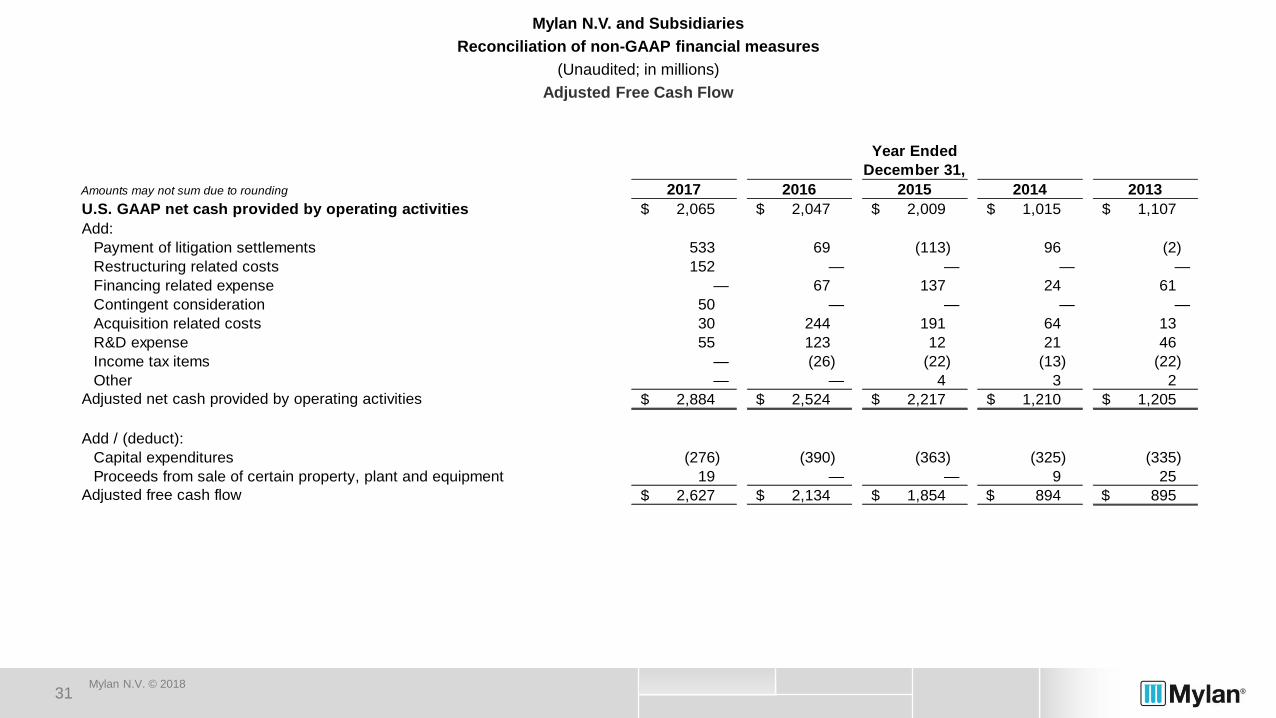
Adjusted Free Cash Flow
Amounts may not sum due to rounding 2017 2016 2015 2014 2013
U.S. GAAP net cash provided by operating activities 2,065$ 2,047$ 2,009$ 1,015$ 1,107$
Add:
Payment of litigation settlements 533 69 (113) 96 (2)
Restructuring related costs 152 — — — —
Financing related expense — 67 137 24 61
Contingent consideration 50 — — — —
Acquisition related costs 30 244 191 64 13
R&D expense 55 123 12 21 46
Income tax items — (26) (22) (13) (22)
Other — — 4 3 2
Adjusted net cash provided by operating activities 2,884$ 2,524$ 2,217$ 1,210$ 1,205$
Add / (deduct):
Capital expenditures (276) (390) (363) (325) (335)
Proceeds from sale of certain property, plant and equipment 19 — — 9 25
Adjusted free cash flow 2,627$ 2,134$ 1,854$ 894$ 895$
Year Ended
December 31,
32
This document contains confidential and proprietary information of Mylan N.V. Unauthorized use,
duplication, dissemination or disclosure to third parties is strictly prohibited. © 2016
2018 Investor Day
32Mylan N.V. © 2018
Mylan N.V. and Subsidiaries
Reconciliation of non-GAAP financial measures
(Unaudited; in millions)
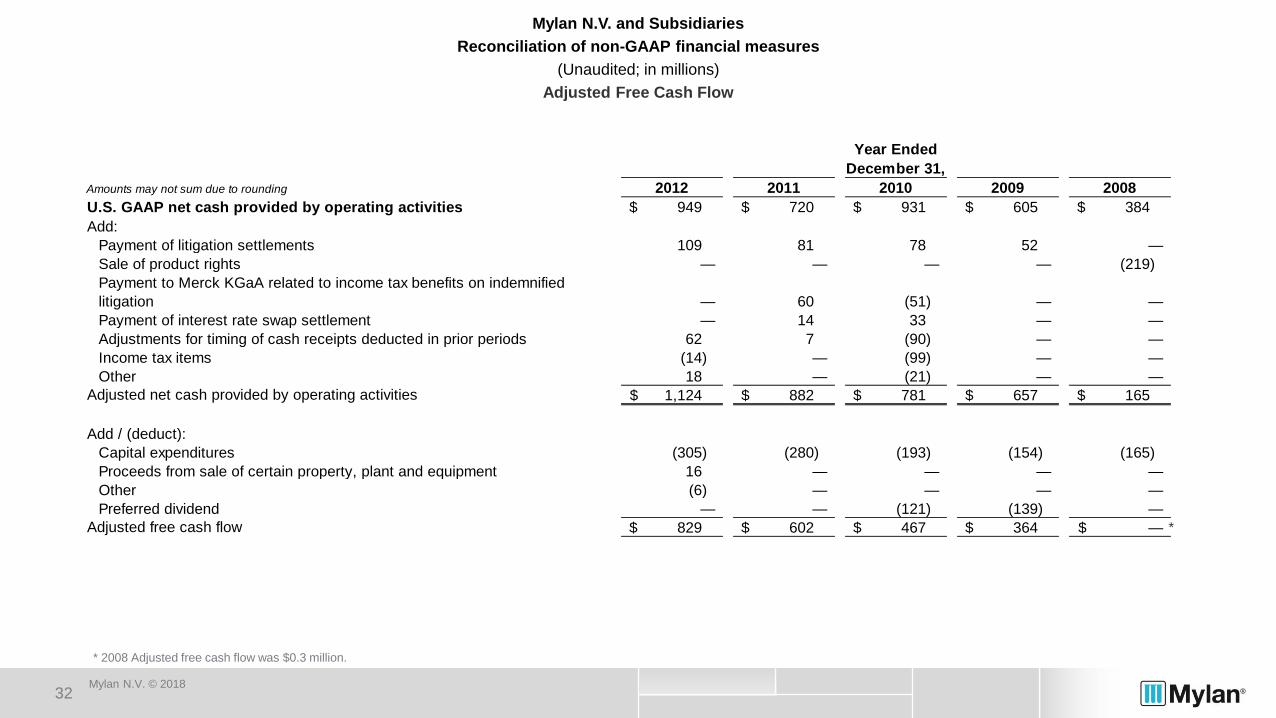
Adjusted Free Cash Flow
* 2008 Adjusted free cash flow was $0.3 million.
*
Amounts may not sum due to rounding 2012 2011 2010 2009 2008
U.S. GAAP net cash provided by operating activities 949$ 720$ 931$ 605$ 384$
Add:
Payment of litigation settlements 109 81 78 52 —
Sale of product rights — — — — (219)
Payment to Merck KGaA related to income tax benefits on indemnified
litigation — 60 (51) — —
Payment of interest rate swap settlement — 14 33 — —
Adjustments for timing of cash receipts deducted in prior periods 62 7 (90) — —
Income tax items (14) — (99) — —
Other 18 — (21) — —
Adjusted net cash provided by operating activities 1,124$ 882$ 781$ 657$ 165$
Add / (deduct):
Capital expenditures (305) (280) (193) (154) (165)
Proceeds from sale of certain property, plant and equipment 16 — — — —
Other (6) — — — —
Preferred dividend — — (121) (139) —
Adjusted free cash flow 829$ 602$ 467$ 364$ —$
Year Ended
December 31,

33
This document contains confidential and proprietary information of Mylan N.V. Unauthorized use,
duplication, dissemination or disclosure to third parties is strictly prohibited. © 2016
2018 Investor Day
33Mylan N.V. © 2018
Mylan N.V. and Subsidiaries
Reconciliation of non-GAAP financial measures
(Unaudited; in millions)
Adjusted Pre-tax Income and Adjusted Interest Expense
Amounts may not sum due to rounding 2017 2016 2015 2014
Adjusted net earnings attributable to Mylan N.V. 2,445$ 2,547$ 2,137$ 1,416$
Add / (Deduct):
Tax effect of non-GAAP adjustments and other income tax
related items 330 844 370 432
U.S. GAAP reported income tax (benefit) provision 207 (358) 68 45
Adjusted pre-tax income 2,982$ 3,033$ 2,575$ 1,893$
Amounts may not sum due to rounding 2017 2016 2015 2014
U.S. GAAP interest expense 535$ 455$ 339$ 333$
Deduct:
Interest expense related to clean energy investments (12) (14) (16) (16)
Accretion of contingent consideration liability (28) (41) (38) (35)
Acquisition related costs (0) (46) (57) -
Non-cash interest - - (29) (30)
Other special items (7) (10) - -
Adjusted interest expense 487$ 343$ 199$ 252$
Year Ended
December 31,
Year Ended
December 31,
34
This document contains confidential and proprietary information of Mylan N.V. Unauthorized use,
duplication, dissemination or disclosure to third parties is strictly prohibited. © 2016
2018 Investor Day
34Mylan N.V. © 2018
Mylan N.V. and Subsidiaries
Reconciliation of non-GAAP financial measures
(Unaudited; in millions)
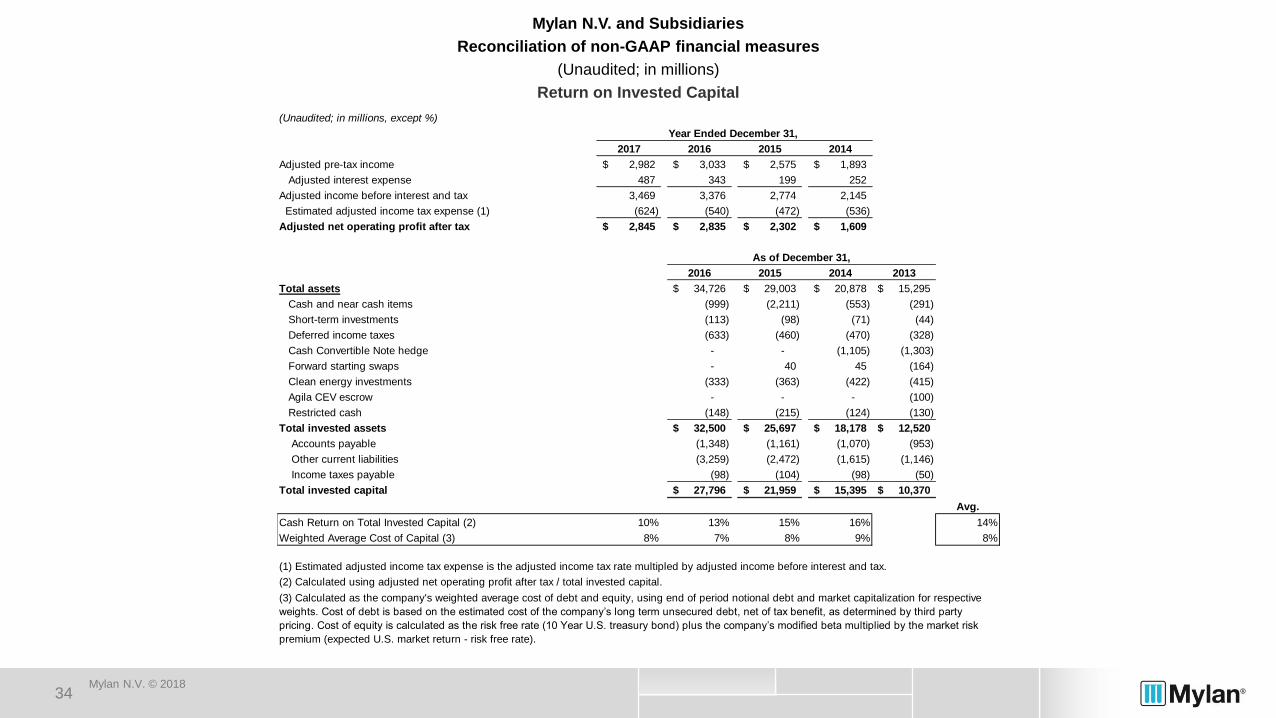
Return on Invested Capital
(Unaudited; in millions, except %)
2017 2016 2015 2014
Adjusted pre-tax income 2,982$ 3,033$ 2,575$ 1,893$
Adjusted interest expense 487 343 199 252
Adjusted income before interest and tax 3,469 3,376 2,774 2,145
Estimated adjusted income tax expense (1) (624) (540) (472) (536)
Adjusted net operating profit after tax 2,845$ 2,835$ 2,302$ 1,609$
2016 2015 2014 2013
Total assets 34,726$ 29,003$ 20,878$ 15,295$
Cash and near cash items (999) (2,211) (553) (291)
Short-term investments (113) (98) (71) (44)
Deferred income taxes (633) (460) (470) (328)
Cash Convertible Note hedge - - (1,105) (1,303)
Forward starting swaps - 40 45 (164)
Clean energy investments (333) (363) (422) (415)
Agila CEV escrow - - - (100)
Restricted cash (148) (215) (124) (130)
Total invested assets 32,500$ 25,697$ 18,178$ 12,520$
Accounts payable (1,348) (1,161) (1,070) (953)
Other current liabilities (3,259) (2,472) (1,615) (1,146)
Income taxes payable (98) (104) (98) (50)
Total invested capital 27,796$ 21,959$ 15,395$ 10,370$
Avg.
Cash Return on Total Invested Capital (2) 10% 13% 15% 16% 14%
Weighted Average Cost of Capital (3) 8% 7% 8% 9% 8%
Year Ended December 31,
(2) Calculated using adjusted net operating profit after tax / total invested capital.
As of December 31,
(1) Estimated adjusted income tax expense is the adjusted income tax rate multipled by adjusted income before interest and tax.
(3) Calculated as the company's weighted average cost of debt and equity, using end of period notional debt and market capitalization for respective
weights. Cost of debt is based on the estimated cost of the company’s long term unsecured debt, net of tax benefit, as determined by third party
pricing. Cost of equity is calculated as the risk free rate (10 Year U.S. treasury bond) plus the company’s modified beta multiplied by the market risk
premium (expected U.S. market return - risk free rate).

Q2 2018 Earnings – All Results are Unaudited