Embed Size (px)
Citation preview

NASA Explorer SchoolsEvaluation Brief 2
A Program in the Making:Evidence from
Summer 2003 Workshops
Victor HernandezSteven McGeeJennifer KirbyDebbie Reese
Judy Martin
NASA-sponsored Classroom of the Future
Center for Educational Technologies®
Wheeling Jesuit University
NES/EB2/2-2004
The NASA-sponsored Classroom of the Future (COTF) program is helping to bridgethe gap between America's classrooms and the expertise of NASA scientists, whohave advanced the frontiers of knowledge in virtually every field of science over thelast 40 years. The COTF program is administered by the Erma Ora Byrd Center forEducational Technologies® at Wheeling Jesuit University in Wheeling, WV.
The COTF serves as the National Aeronautics and Space Administration's (NASA's)premier research and development program for educational technologies. In thiscapacity the COTF develops and conducts research on technology-based learningmaterials that challenge students to solve problems by using datasets and otherinformation resources provided by the five strategic enterprises of NASA: AerospaceTechnology, Human Exploration and Development of Space, Earth Science, SpaceScience, and Biological and Physical Research.
The authors of this report are all members of the COTF’s research and evaluationteam. Victor Hernandez and Steven McGee are senior educational researchers,Jennifer Kirby is assistant educational researcher, Debbie Reese is educationalresearcher, and Judy Martin serves as implementation research coordinator.
Table of Contents
EXECUTIVE SUMMARY 1
BACKGROUND 2
The NASA Explorer Schools Program 2
School Strategic Plans and Program Supports 2
NES Program Objectives 3
NES Evaluation Plan 3
EVALUATION OF SUMMER 2003 WORKSHOPS 5
About the Summer Workshops 5
Evaluation Approach 7
Data Collection Strategies 7
Analysis 8
FINDINGS 9
What Is the Profile of NES Designated Schools? 9
What Are the Top Target Academic Standards of NES Participants? 10
What Are the Initial Perspectives on Instructional Practices? 11
Who Participated and What Did They Get from the Experience? 12
What Were the Participants’ Perspectives on Summer Workshops? 16
SEEKING AND SUSTAINING COHERENCE 21
REFERENCES 24
NES Evaluation Brief 2: A Program in the Making 1
NES Evaluation Brief 2: A Program in the Making
Evidence from Summer 2003 Workshops
Executive Summary
In 2003 the NASA Explorer School (NES) program was launched nationally with theparticipation of 50 school teams. Designed as a three-year partnership with schools,the goal of the NES program is to help middle schools improve teaching and learningin science, technology, engineering, and math through significant structural (e.g.,professional development, stipends) and curricular supports based on NASA’sresources. During the summer NES school teams kicked off the program by attendinga professional development residence program lasting one week with all expensespaid at one of the 10 NASA field centers.
The research and evaluation team of the Classroom of the Future is conducting theevaluation of the NES program. The goal of the evaluation is to document the designdecisions that NASA and participating schools make throughout the program as wellas the impact of those design decisions on the program objectives. The purpose ofthis brief is to provide an update on program progress with primary emphasis on thesummer 2003 workshops. Below is a summary of major conclusions:
The NES program selected school teams from urban, suburban, and ruralareas with substantial representation of traditionally underserved students.This would allow the program to channel resources and supports to targetedschools and teachers as called for in the NES objectives.
A review of the top priorities related to science, mathematics, geography,and educational technology indicated a close alignment with the spirit of theNES objectives and with NASA's core resources.
Baseline data on perspectives and beliefs about teaching, learning, andtechnology suggest that NES participants are primed for professional growththrough participation in the program.
The NES program appears to be well positioned in meeting the criteria ofhigh-quality professional development both in terms of structural and corefeatures. However, more evidence is needed to document the quality ofthese features.
Feedback provided by workshop participants on the overall NES program andworkshop experiences was highly positive.
In general, the results are both promising and tentative—promising becausethe program is well positioned in the target school teams and for its potentialalignment with high-quality features of professional development, yettentative because the evidence at this point is not sufficient to make definiteclaims about the quality of program/workshop features.
NES Evaluation Brief 2: A Program in the Making 2
Background
The NASA Explorer Schools ProgramThrough the NES program middle schools from around the nation have entered intoa unique three-year partnership with NASA to bring exciting opportunities toeducators, students, and families through sustained professional development,exciting student learning opportunities, integration of technology, and involvement ofparents.
Fifty school-based teams of five people were selected in 2003. Throughout the three-year commitment NES educator and administrator teams, working along with NASApersonnel and other educational partners, will become involved in the excitement ofNASA research, discoveries, and missions through participation in engaging NASAlearning adventures and scientific challenges.
The 2003 NES program is focused on NASA content at the 5-8 grade levels. Materialswill target appropriate, grade-specific concepts from national education standards.During the school year schools will have access to all of NASA's educationalresources. In addition, schools will be supported by customized resources and eventsgeared specifically for the Explorer Schools. These resources and events will engagestudents and parents in authentic activities related to NASA's unique mission.
In July 2003 NES educator/administrator teams kicked off the program by attendinga professional development residence program lasting one week with all expensespaid at one of the 10 NASA field centers.
School Strategic Plans and Program SupportsDesignation as a NASA Explorer School indicates an ongoing relationship with NASAthrough a mutual agreement for sustained involvement by educator/administratorteams in professional development and student participation in challenges andinvestigations. The school strategic plan informs this relationship and outlines how itsimplementation meets the school's local needs. The strategic plan is instrumental inoutlining what programs and services NASA should provide to the school during thethree-year partnership.
The strategic plan developed in the first year by each school team will outline thespecific local needs relative to the six NES program objectives. The plan will alsodescribe how the whole school (not just the NES team) will reorganize to addressthese local needs. The schools will receive grants of up to $10,000 to assist with theimplementation of the strategic plan. Each NES team member will receive a $500stipend for implementing the team's strategic plan during the 2004-2005 school year.The schools will submit progress reports on their strategic plan and provide feedbackto the evaluation team via video or phone conference focus groups.
During the summer 2003 workshop the team learned about NASA content, resources,and programs. The teams also began to develop their strategic plan to meet theirspecific needs. The teams further refined strategic plans during fall 2003. The finalstrategic plan and application for grant funds were submitted to NASA in October2003. NASA and other educational partners will work with the school to implementthe strategic plan for the remainder of the three-year partnership.
NES Evaluation Brief 2: A Program in the Making 3
NES Program ObjectivesWhile the NASA education programs have enjoyed wide-scale success for decades,the NES program represents a significant reorganization of NASA's educationofferings and school supports. NASA's organizational focus for the NES program is tocreate a structure within which previously independent programs will be integratedaround a common set of objectives. This integration will benefit from NASA'sdecentralized management structure. Each NASA field center will uniquely organizeits local resources to meet the needs of the five schools it is supporting. In turn, eachof the 50 school teams will uniquely organize its local resources and take advantageof NASA resources to address the NES program objectives. Under this organizationaldesign the objectives of the NES program seek to help school teams increase:
1. Student ability to apply science, mathematics, technology concepts.
2. Student knowledge about careers in science, mathematics, and technology.
3. Student interest in and participation in science, mathematics, andtechnology.
4. Active participation and professional growth of educators in science,mathematics, and technology.
5. Family involvement in student learning.
6. Academic assistance for and technology use by educators in schools withhigh populations of underserved students.
While a variety of programs across the nation share similar objectives, the NESprogram addresses these objectives in a way that only NASA can. The contribution ofNASA-unique opportunities to the NES program will provide a measurable impact onthe NES objectives that goes beyond the impact of other programs available totypical schools located in the same region as the Explorer Schools.
NES Evaluation PlanThe core evaluation question is focused on whether participation in the NES programleads to accomplishment of the program objectives. A key objective of the evaluationis to document the design decisions that NASA and participating schools makethroughout the program as well as the impact of those design decisions on theprogram objectives. This information will be fed back to the program participants andNASA education personnel to inform their design decisions throughout the program.This second report in the NES Evaluation Briefs series is the first to provide formativeinformation about activities conducted during the first year of the program.1
The evaluation is guided by a hybrid evaluation design. The process of documentingdesign decisions and using evaluation information to inform design decisions is thehallmark of a recent advancement of educational research called design experiment(Brown, 1992; Cobb, Confrey, diSessa, Lehrer, & Shauble, 2003). The designexperiment approach is focused on the schools participating in the NES program. By
1 For a detailed description of the overall evaluation plan, see NES Evaluation Brief 1 (McGee,
Hernandez, & Kirby, 2003).

NES Evaluation Brief 2: A Program in the Making 4
explicitly linking the design rationale with the objectives, the design experimentapproach moves beyond mere formative assessment. A design experiment providesevidence on both whether a program works and why it works. The designexperiment methodology will be combined with a scientific-based research (SBR)methodology to compare a given implementation year to a comparison group tomeasure the effect of the program for a given year. The What Works ClearinghouseStudy Design and Implementation Assessment Device will guide the design ofcomparative studies of program effectiveness.
Design Experiment Data CollectionThe primary means of documenting the design of the program at each field centerand at each school is through the formal design documents produced by eachorganization. Strategic plans and progress reports produced by field centers andenterprises will be documented to determine the nature and extent of schoolsupports and how they organize resources, events, and personnel to meet each ofthe six objectives. The evaluation team will complement these strategies with sitevisits at selected NASA workshops and videoconference focus groups with fieldcenter personnel. To document the design and implementation of summerworkshops, reviews of related materials and any internal planning documents will beconducted. Through the focus group the evaluation team will discuss how NASAresources are being used and clarify outstanding issues within the strategic plans.The evaluation team will also document the use of NASA's extensive online resourcesby the Explorer Schools.
Data from NASA’s evaluation database, NEEIS, serves as the basis for documentingparticipant perceptions of the NES program activities. To this end, strategic plans andimplementation reports will be accessed through NEEIS.
Scientifically Based Research Data CollectionWorking with NASA field center program staff, SBR data collection will includeidentification of existing measures or the development of new measures of each ofthe six program objectives. For objective one related to student learning, acombination of state assessment data as well as the collection of new assessmentdata from existing test banks of high-quality items will be used. For objectives twoand three related to knowledge of careers and student interest, existing careerawareness and interest surveys will be customized. For objective four and six relatedto teacher professional growth and increased technology use by schools withunderserved students, an adapted version of the Teaching, Learning, and Computingsurvey will be used. For objective five related to family involvement, existing metricsof family involvement will be customized.
All measures will be collected in NES schools at each of the targeted (4th-9th) gradelevels. We will also identify and use relevant state data available through the stateinformation systems. The unit of analysis will be the school level. Performance ofExplorer Schools will be compared to performance at comparison schools.
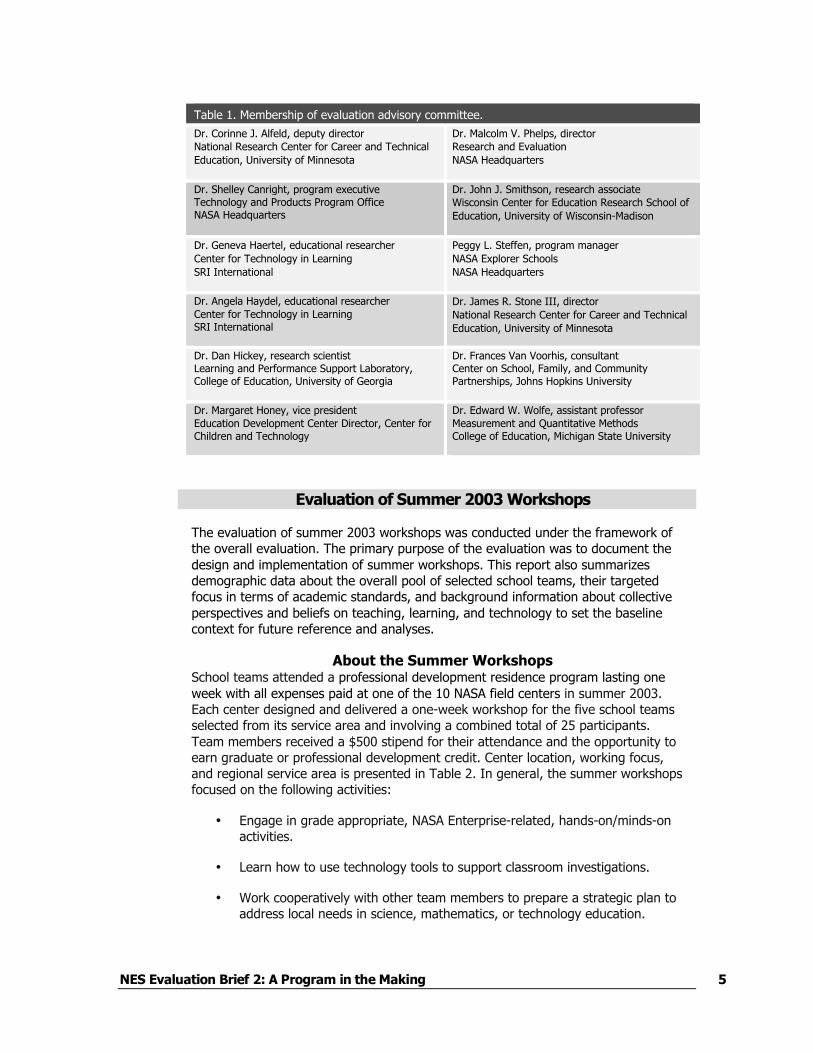
Evaluation Advisory CommitteeAn advisory group for the scientifically based research component will provide inputon the evaluation design and implementation. The committee includes scholars whohave made substantial contributions to the body of knowledge in areas relevant tothe evaluation of the NES program. The list of committee members is provided inTable 1.
NES Evaluation Brief 2: A Program in the Making 5
Evaluation of Summer 2003 Workshops
The evaluation of summer 2003 workshops was conducted under the framework ofthe overall evaluation. The primary purpose of the evaluation was to document thedesign and implementation of summer workshops. This report also summarizesdemographic data about the overall pool of selected school teams, their targetedfocus in terms of academic standards, and background information about collectiveperspectives and beliefs on teaching, learning, and technology to set the baselinecontext for future reference and analyses.
About the Summer WorkshopsSchool teams attended a professional development residence program lasting oneweek with all expenses paid at one of the 10 NASA field centers in summer 2003.Each center designed and delivered a one-week workshop for the five school teamsselected from its service area and involving a combined total of 25 participants.Team members received a $500 stipend for their attendance and the opportunity toearn graduate or professional development credit. Center location, working focus,and regional service area is presented in Table 2. In general, the summer workshopsfocused on the following activities:
• Engage in grade appropriate, NASA Enterprise-related, hands-on/minds-onactivities.
• Learn how to use technology tools to support classroom investigations.
• Work cooperatively with other team members to prepare a strategic plan toaddress local needs in science, mathematics, or technology education.
Table 1. Membership of evaluation advisory committee.
Dr. Corinne J. Alfeld, deputy directorNational Research Center for Career and TechnicalEducation, University of Minnesota
Dr. Malcolm V. Phelps, directorResearch and EvaluationNASA Headquarters
Dr. Shelley Canright, program executiveTechnology and Products Program OfficeNASA Headquarters
Dr. John J. Smithson, research associateWisconsin Center for Education Research School ofEducation, University of Wisconsin-Madison
Dr. Geneva Haertel, educational researcherCenter for Technology in LearningSRI International
Peggy L. Steffen, program managerNASA Explorer SchoolsNASA Headquarters
Dr. Angela Haydel, educational researcherCenter for Technology in LearningSRI International
Dr. James R. Stone III, directorNational Research Center for Career and TechnicalEducation, University of Minnesota
Dr. Dan Hickey, research scientistLearning and Performance Support Laboratory,College of Education, University of Georgia
Dr. Frances Van Voorhis, consultantCenter on School, Family, and CommunityPartnerships, Johns Hopkins University
Dr. Margaret Honey, vice presidentEducation Development Center Director, Center forChildren and Technology
Dr. Edward W. Wolfe, assistant professorMeasurement and Quantitative MethodsCollege of Education, Michigan State University

NES Evaluation Brief 2: A Program in the Making 6
• Design a customized professional development plan to support theimplementation of the local action plan, using distance learning andidentified state content experts.
• Discover new avenues for collaborative learning through advancededucational technologies and strategies.
• Strengthen and increase knowledge about problem-based learning and theinquiry process.
• Explore NASA educational materials and develop a strategic plan to supporttheir incorporation in local/state curricular needs.
• Learn real-world and practical applications of science, technology,engineering, and mathematics (STEM) and geography from NASA scientists,researchers, and engineers in NASA applied research facilities.
Table 2. Location, service area, and focus of NASA field centers.
Field Center Service Area Focus
Ames ResearchCenter, California
AK, Northern CA,HI, ID, MT, NV,OR, UT, WA, WY
Information technology, astrobiology (the study of the origin,evolution, and distribution of life in the universe) and aviationoperations, capacity, and safety issues
Dryden FlightResearch Center,California
AZ, Southern CA Breakthrough technology and scientific advances throughflight research and concept validation
Glenn ResearchCenter at LewisField, Ohio
IL, IN, MI, MN,OH, WI
Aeropropulsion technologies, aerospace power, microgravityscience, electric propulsion, and communications technologiesfor aeronautics, space, and aerospace applications
Goddard SpaceFlight Center,Maryland
CT, DE, DC, ME,MD, MA, NH, NJ,NY, PA, RI, VT
Earth and space science (including climate change and ozoneresearch), astronomy (including the Hubble Space Telescopeand Compton Gamma Ray Observatory), solar physics
Jet PropulsionLaboratory,California
CA Planetary science and exploration
Johnson SpaceCenter, Texas
CO, KS, NE, NM,ND, OK, SD, TX
Human space flight, space shuttle missions, space station,mission control, lunar samples
Kennedy SpaceCenter, Florida
FL, GA, PR, VI Spaceport operations, spaceport design and systemsdevelopment, and spaceport and range technology andscience.
Langley ResearchCenter, Virginia
KY, NC, SC, VA,WV
Aviation safety, quiet aircraft technology, small aircrafttransportation, and aerospace vehicles system technology
Marshall SpaceFlight ResearchCenter, Alabama
AL, AR, IA, LA,MO, TN
Advanced X-Ray Astronomy Facility, space shuttle mainengines, the Spacelab program, and microgravity research.
Stennis SpaceCenter, Mississippi
MS Space shuttle main engine testing, geographic informationsystems, small spacecraft technology, commercial remotesensing. testing and flight certifying rocket propulsionsystems
NES Evaluation Brief 2: A Program in the Making 7
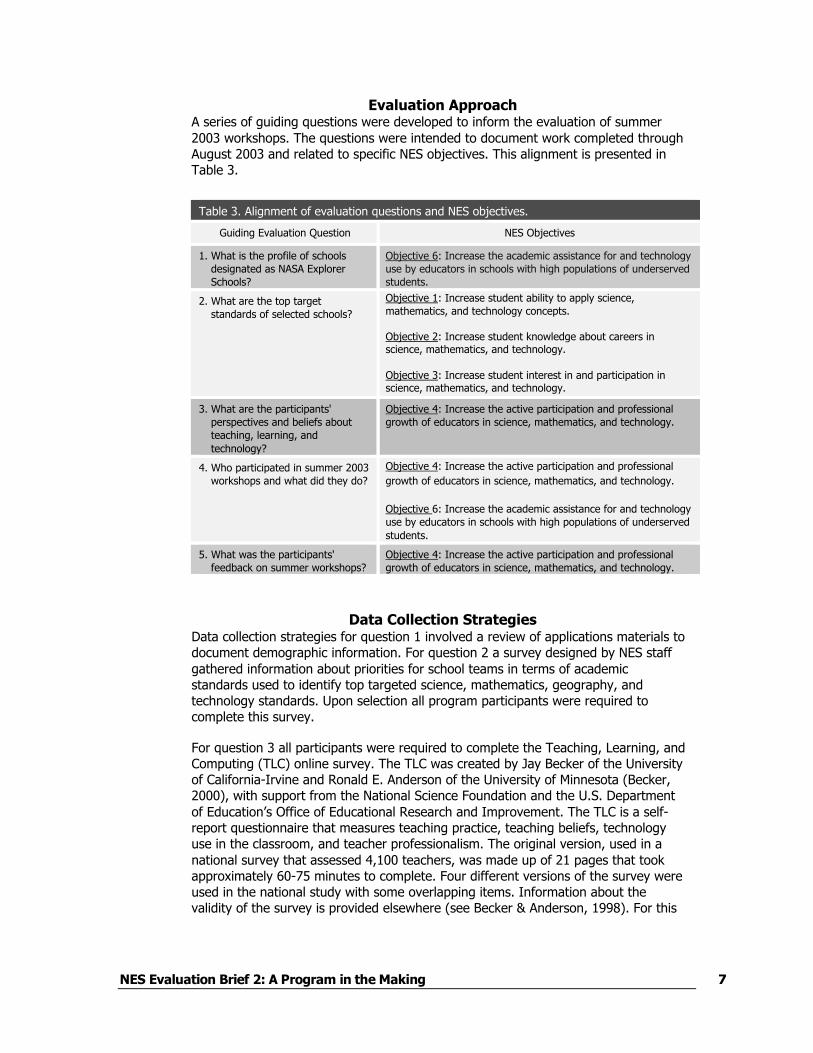
Evaluation ApproachA series of guiding questions were developed to inform the evaluation of summer2003 workshops. The questions were intended to document work completed throughAugust 2003 and related to specific NES objectives. This alignment is presented inTable 3.
Table 3. Alignment of evaluation questions and NES objectives.
Guiding Evaluation Question NES Objectives
1. What is the profile of schoolsdesignated as NASA ExplorerSchools?
Objective 6: Increase the academic assistance for and technologyuse by educators in schools with high populations of underservedstudents.
2. What are the top targetstandards of selected schools?
Objective 1: Increase student ability to apply science,mathematics, and technology concepts.
Objective 2: Increase student knowledge about careers inscience, mathematics, and technology.
Objective 3: Increase student interest in and participation inscience, mathematics, and technology.
3. What are the participants'perspectives and beliefs aboutteaching, learning, andtechnology?
Objective 4: Increase the active participation and professionalgrowth of educators in science, mathematics, and technology.
4. Who participated in summer 2003workshops and what did they do?
Objective 4: Increase the active participation and professionalgrowth of educators in science, mathematics, and technology.
Objective 6: Increase the academic assistance for and technologyuse by educators in schools with high populations of underservedstudents.
5. What was the participants'feedback on summer workshops?
Objective 4: Increase the active participation and professionalgrowth of educators in science, mathematics, and technology.
Data Collection StrategiesData collection strategies for question 1 involved a review of applications materials todocument demographic information. For question 2 a survey designed by NES staffgathered information about priorities for school teams in terms of academicstandards used to identify top targeted science, mathematics, geography, andtechnology standards. Upon selection all program participants were required tocomplete this survey.
For question 3 all participants were required to complete the Teaching, Learning, andComputing (TLC) online survey. The TLC was created by Jay Becker of the Universityof California-Irvine and Ronald E. Anderson of the University of Minnesota (Becker,2000), with support from the National Science Foundation and the U.S. Departmentof Education’s Office of Educational Research and Improvement. The TLC is a self-report questionnaire that measures teaching practice, teaching beliefs, technologyuse in the classroom, and teacher professionalism. The original version, used in anational survey that assessed 4,100 teachers, was made up of 21 pages that tookapproximately 60-75 minutes to complete. Four different versions of the survey wereused in the national study with some overlapping items. Information about thevalidity of the survey is provided elsewhere (see Becker & Anderson, 1998). For this
NES Evaluation Brief 2: A Program in the Making 8
evaluation four versions of the TLC were combined into one questionnaire, takingless than 60 minutes to complete. The final TLC questionnaire consists of fiveconstructs: technical skill (TS), constructivist teaching strategies (CTS), attitudetoward technology (ATT), constructivist teaching philosophy (CTP), and constructivistuses of technology (CUT).
Data collection strategies for question 4 consisted of two components. First, NEEISdata was used to profile overall participation in summer workshops. Second, summerworkshop agendas were collected to gather data on important factors associatedwith effective professional development. Finally, for question 5 NEEIS data was usedto document the evaluative perspectives of participants on key elements of summerworkshops.
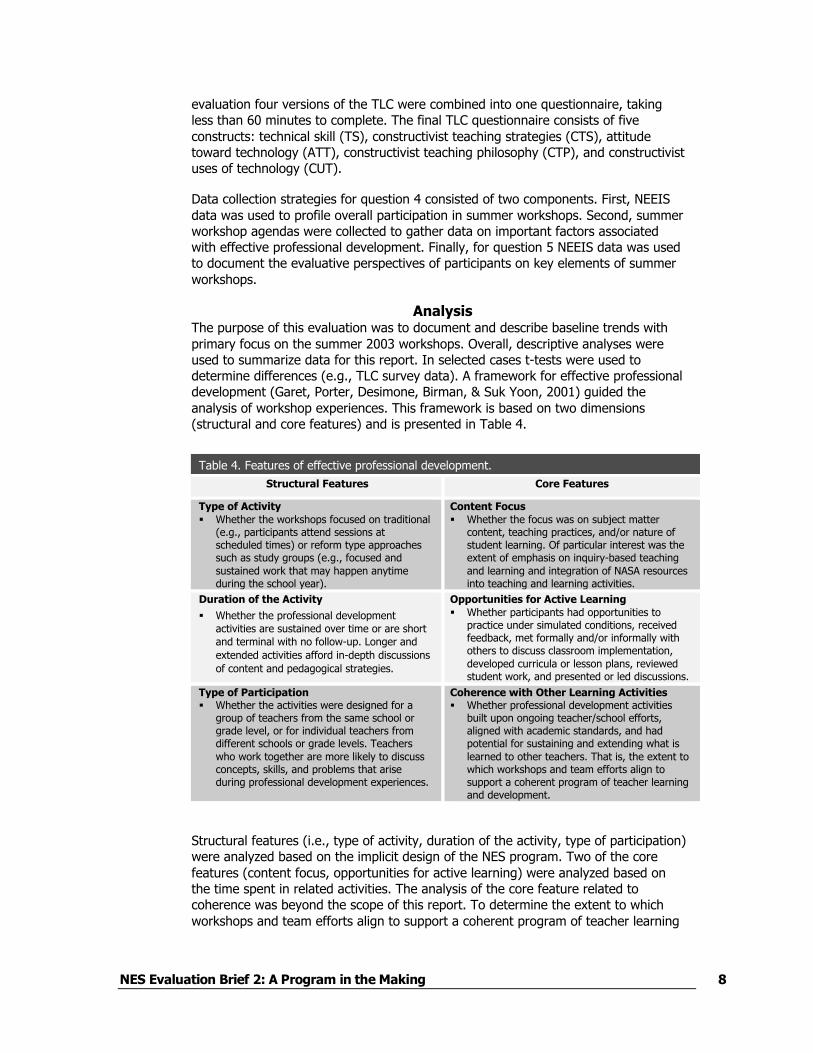
AnalysisThe purpose of this evaluation was to document and describe baseline trends withprimary focus on the summer 2003 workshops. Overall, descriptive analyses wereused to summarize data for this report. In selected cases t-tests were used todetermine differences (e.g., TLC survey data). A framework for effective professionaldevelopment (Garet, Porter, Desimone, Birman, & Suk Yoon, 2001) guided theanalysis of workshop experiences. This framework is based on two dimensions(structural and core features) and is presented in Table 4.
Table 4. Features of effective professional development.
Structural Features Core Features
Type of Activity Whether the workshops focused on traditional
(e.g., participants attend sessions atscheduled times) or reform type approachessuch as study groups (e.g., focused andsustained work that may happen anytimeduring the school year).
Content Focus Whether the focus was on subject matter
content, teaching practices, and/or nature ofstudent learning. Of particular interest was theextent of emphasis on inquiry-based teachingand learning and integration of NASA resourcesinto teaching and learning activities.
Duration of the Activity
Whether the professional developmentactivities are sustained over time or are shortand terminal with no follow-up. Longer andextended activities afford in-depth discussionsof content and pedagogical strategies.
Opportunities for Active Learning Whether participants had opportunities to
practice under simulated conditions, receivedfeedback, met formally and/or informally withothers to discuss classroom implementation,developed curricula or lesson plans, reviewedstudent work, and presented or led discussions.
Type of Participation Whether the activities were designed for a
group of teachers from the same school orgrade level, or for individual teachers fromdifferent schools or grade levels. Teacherswho work together are more likely to discussconcepts, skills, and problems that ariseduring professional development experiences.
Coherence with Other Learning Activities Whether professional development activities
built upon ongoing teacher/school efforts,aligned with academic standards, and hadpotential for sustaining and extending what islearned to other teachers. That is, the extent towhich workshops and team efforts align tosupport a coherent program of teacher learningand development.
Structural features (i.e., type of activity, duration of the activity, type of participation)were analyzed based on the implicit design of the NES program. Two of the corefeatures (content focus, opportunities for active learning) were analyzed based onthe time spent in related activities. The analysis of the core feature related tocoherence was beyond the scope of this report. To determine the extent to whichworkshops and team efforts align to support a coherent program of teacher learning

NES Evaluation Brief 2: A Program in the Making 9
and development requires a long-term perspective that will unfold throughout thethree-year participation of the teachers.
Using workshop agendas as the basis for the analysis, a team of two researchersconducted an initial review of the agendas. Preliminary results were shared with fieldcenter staff during a retreat in fall 2003. With input from field center staff, thedefinition of core features was clarified. To ensure the accuracy of the analysis, theresearch and evaluation team requested field center staffs to review, verify, and/orrecode summer workshop agendas.
Findings
The presentation of findings is organized around the guiding evaluation questions forthe 2003 summer workshops. First, a brief description of the overall participation inthe NES program is provided to set the context for this report. Next, we present asummary of top academic standards identified by NES school teams as targetedpriorities. This is followed by an analysis of baseline Teaching, Learning, andComputing survey data, and by a description of participation in summer workshopsand focus of professional development activities. Finally, a summary of evaluativeperspectives based on NEEIS data is presented.
What Is the Profile of NES Designated Schools?Based on selected demographic indicators, having school teams designated as NASAExplorer Schools clearly puts the program in a position to support work related toObjective 6 (increase the academic assistance for and technology use by educators inschools with high populations of underserved students).
A total of 430 applications were submitted for consideration to participate in the NESprogram. Of these, 50 school teams were selected, representing 30 states; 61schools; 250 educators, including teachers and administrators; and 35,220 students.Some school teams represent partnership between an elementary, middle, or highschool or any combination thereof based on their particular school composition andlocal needs.
The typical school team includes an administrator (decision maker who serves as achange agent within the school) who will work with and empower the team and 3-4full-time classroom educators who provide regular or special education instruction inscience, mathematics, or technology at the 5-8 grade level. Also, the team mayinclude resource, content specialist, or other educators as determined by overallteam needs. In some cases a school team also includes someone from a localinformal education sector, a higher education institution, a parent association, or alocal business leader who would partner with the Explorer School team. A keyrequirement is that all teachers on the team must be certified/licensed by their statedepartment of education and have a minimum of three years of teachingexperience.Considering all school teams, 58 percent of the teams can be identified ashigh-poverty, high-minority schools. Further, 62 percent of the participating schoolsare located in high-poverty areas and typically report more than 50 percent minority
NES Evaluation Brief 2: A Program in the Making 10
enrollment annually.2 In terms of location, 46 percent of the school teams arelocated in urban areas, 10 percent in suburban locations, and 44 percent in ruralcommunities.
What Are the Top Target Academic Standards of NES Participants?Once school teams were selected, it was important for NES staff to determine whatthe school teams were trying to accomplish through their participation in the NESprogram and gauge the alignment with two key NES objectives: Objective 1(increase student ability to apply science, mathematics, and technology concepts),and Objective 2 (increase student interest in and participation in science,mathematics, and technology). This was achieved by asking school teams to identifytheir top target academic standards. A review of the top priorities related to science,mathematics, geography, and educational technology indicated a close alignmentwith the two academic objectives of the NES program. The top priorities wererepresented by standards selected as an important focus for school teamparticipation by at least 25 percent of all program participants.
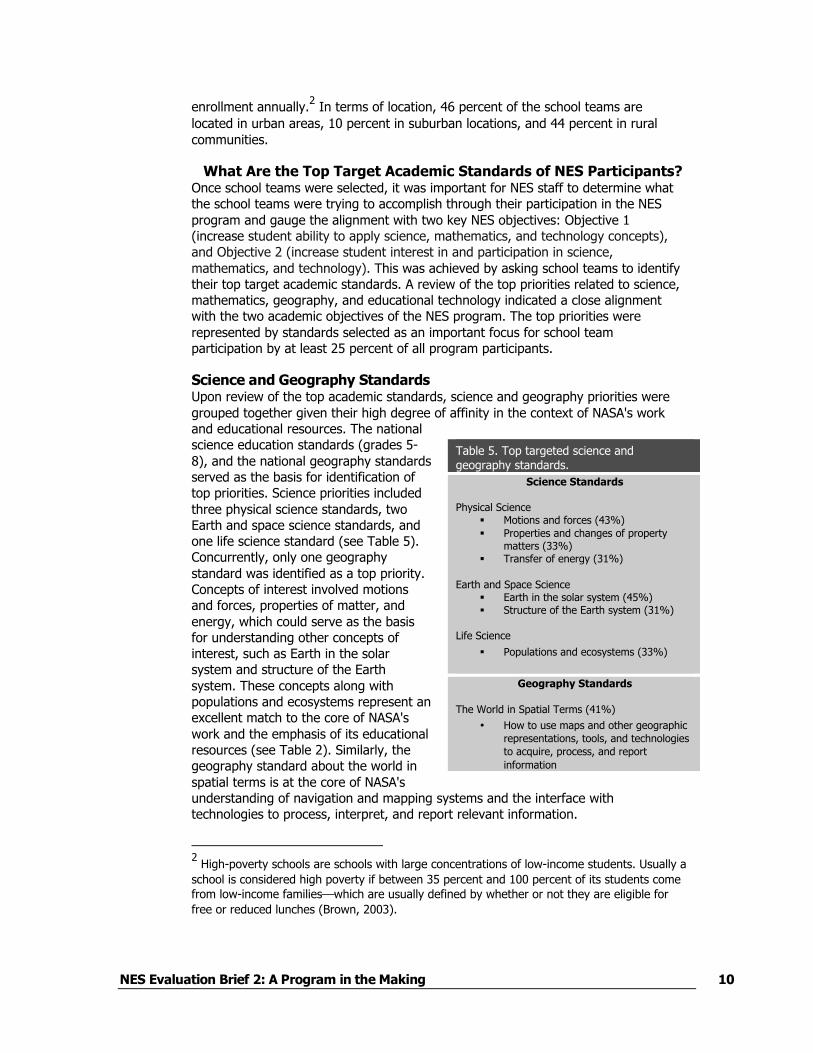
Science and Geography StandardsUpon review of the top academic standards, science and geography priorities weregrouped together given their high degree of affinity in the context of NASA's workand educational resources. The nationalscience education standards (grades 5-8), and the national geography standardsserved as the basis for identification oftop priorities. Science priorities includedthree physical science standards, twoEarth and space science standards, andone life science standard (see Table 5).Concurrently, only one geographystandard was identified as a top priority.Concepts of interest involved motionsand forces, properties of matter, andenergy, which could serve as the basisfor understanding other concepts ofinterest, such as Earth in the solarsystem and structure of the Earthsystem. These concepts along withpopulations and ecosystems represent anexcellent match to the core of NASA'swork and the emphasis of its educationalresources (see Table 2). Similarly, thegeography standard about the world inspatial terms is at the core of NASA'sunderstanding of navigation and mapping systems and the interface withtechnologies to process, interpret, and report relevant information.
2 High-poverty schools are schools with large concentrations of low-income students. Usually a
school is considered high poverty if between 35 percent and 100 percent of its students comefrom low-income familieswhich are usually defined by whether or not they are eligible forfree or reduced lunches (Brown, 2003).
Table 5. Top targeted science andgeography standards.
Science Standards
Physical Science Motions and forces (43%) Properties and changes of property
matters (33%) Transfer of energy (31%)
Earth and Space Science Earth in the solar system (45%) Structure of the Earth system (31%)
Life Science
Populations and ecosystems (33%)
Geography Standards
The World in Spatial Terms (41%)
• How to use maps and other geographicrepresentations, tools, and technologiesto acquire, process, and reportinformation

NES Evaluation Brief 2: A Program in the Making 11
Mathematics StandardsThe principles and standards for school mathematics (grades 6-8), served as thesource for identification of top priorities. A significant number of NES participantsidentified two middle school mathematics standards as top priority: data analysis andprobability (31 percent) and problem solving (37 percent). The standard of dataanalysis and probability is about the formulation of questions that can be addressedwith data and the collection, organization, and display of relevant data to answerthem. Problem solving calls for the application and adaptation of a variety ofappropriate strategies to solve problems. The common denominator is a focus onconducting investigations as scientists answer questions and problems that matterand are relevant to students. Clearly, these standards hit the essential nature ofNASA's work and provide rich ground for alignment with its educational resources.
Educational Technology StandardsNES participants were asked to identify top priorities for educational technologystandards based on two sources: standards for technological literacy and nationaleducational technology standards. The design standard was clearly identified as a toppriority on both sources at similar rates (39 percent based on standards fortechnological literacy and 35 percent based on the national educational technologystandards). Although this standard shares the same label, its emphasis differsdepending on the source. The standards for technological literacy call for thedevelopment of student understanding of the role of troubleshooting, research anddevelopment, invention and innovation, and experimentation in problem solving.From the national educational technology standards perspective, the goal of thedesign standard is to develop, publish, and present products using technologyresources that demonstrate and communicate curriculum concepts to audiencesinside and outside the classroom.
NES participants also identified a second standard from the national educationaltechnology standards as a top priority. The standard related to collaboration waschosen by 41 percent of NES participants. The emphasis of this standard is forstudents to collaborate with peers, experts, and others using telecommunicationsand collaborative tools to investigate curriculum-related problems, issues, andinformation and to develop solutions or products for audiences inside and outside theclassroom.
What Are the Initial Perspectives on Instructional Practices?The Teaching, Learning, and Computing Teacher’s Survey (Becker, 2000) is a self-report questionnaire that yields data on five constructs aligned with constructivistprinciples for teaching and learning. Constructivist ideas have emerged from recentresearch about how the human brain works and what is known about how learningoccurs. Constructivist principles predicate teaching and learning based on thepremise that learning is about knowledge construction rather than reproduction. Tothis end, students learn by building upon what they already know. Constructivism isgrounded on the notion that learning is affected by the context in which an idea istaught as well as by students' beliefs and attitudes (Caine & Caine, 1991).
The scale used to gauge constructivist perspectives and beliefs ranged from 1 (verytraditional) to 5 (very constructivist). A one-sample t-test of the means wasconducted to determine differences in comparison to the midpoint (3 = transitional).The results are presented in Table 6.

NES Evaluation Brief 2: A Program in the Making 12
Initial constructivist uses of technology showed significant differences indicating thatparticipants are somewhat limited in their use of technology to support constructivistlearning. Constructivist teachingstrategies were reported at thetransitional level suggestingparticipants’ motivation to improveteaching practices throughparticipation in the NES program.Constructivist teaching philosophyand technical skills were significantlydifferent from the transitional pointsuggesting that participants aresomewhat open to constructivistideas and somewhat comfortablewith technology skills. At the sametime, participants showed arelatively high attitude towardtechnology, which reinforces the potential underlying motivation to participate in theNES program.
Who Participated and What Did They Get from the Experience?The analysis of the summer workshops had two components. First, demographicindicators were summarized to profile participation. Second, the focus of theworkshops was analyzed to describe the nature of the professional developmentactivities provided to NES participants.
Indicators of ParticipationData collected from 222 participants (89 percent of all NES participants) indicated aprominent representation of females (72 percent) compared to males (28 percent).The common denominator across all participants (100 percent) was the underlyingmotivation to participate (to increaseknowledge of science, technology,engineering, and math and/or geography),which was in direct alignment with toptargeted academic standards identified byNES participants. As Table 7 shows, themajority of workshops participants were ofCaucasian descent (72 percent) followedby a large group of African-Americaneducators (18 percent). Other minoritygroups accounted for only 10 percent ofoverall participation. The majority ofparticipants reported a master's degree(60 percent), while about a third declaredto hold a baccalaureate degree. Further, athird of all workshop participants reportedteaching all subjects, while 28 percentindicated teaching general science. Asexpected, those who teach in particularareas of instruction (Earth science, lifesciences, mathematics, physical science)
Table 6. Indicators of constructivist perspectives.
Variable N Mean StandardDeviation
Constructivist Uses ofTechnology
115 2.53** .883
ConstructivistTeaching Philosophy
127 3.72** .517
ConstructivistTeaching Strategies
115 3.11 .652
Technical Skill 119 3.32** .687
Attitude TowardTechnology
120 4.12** .555
**Test value = 3, p <.001
Table 7. Demographic indicators.
Ethnicity
72% Caucasian/White
18% African American/Black
10% Other: Asian, Hispanic, Native
American, Pacific Islander
Education
60% Master's degree
35% Baccalaureate degree
5% Other: associate degree, doctorate
Areas of Instruction (15% and greater)
33% All subjects
28% General science
19% Earth science
19% Life sciences
17% Mathematics
15% Physical science

NES Evaluation Brief 2: A Program in the Making 13
were represented at lower and comparable rates ranging between 15-19 percent.Collectively, areas of instruction appear to support the choice of top target academicstandards.
Structural Features of WorkshopsThe analysis of structural features (type of activity, duration of the activity, and typeof participation) was based on categories identified by Garet and associates (2001).
Type of activity. According to Garet and colleagues, traditional forms of professionaldevelopment activities include within-district workshops, course for college credit,out-of-district workshops, and out-of-district conferences. Reform type of activitiesinclude teacher study groups, teacher collaboratives or networks, committees,mentoring, internships, and resource centers. Taking in isolation, the workshopsappeared to share some traditional elements across the board (e.g., participantsattend sessions at scheduled times). However, in the context of the three-yearcommitment of the NES program, focus on school teams, and commitment forcontinued support, the workshops clearly fall into the reform type. This is furtherreinforced by its emphasis on teacher collaboration, networking approaches, studygroups, use of resource centers (e.g., field center support, NASAproducts/resources), and follow-up professional development activities that mayhappen anytime during the following school years.
Duration of the activity. To characterize duration of professional developmentactivities, we evaluated two aspects of duration: the total number of contact hoursand the period of time in days. Research indicates that longer and extendedprofessional development activities allow for more thoughtful discussions of contentand pedagogical strategies. Concurrently, whether professional developmentactivities are extended over time or are short and terminal with no follow-up wouldhinder or facilitate teacher growth. In the context of a three-year commitment, allworkshops were conducted over a full week with expected follow-up support by fieldcenter staffs and subsequent professional development to be arranged by theparticipants (e.g., attendance at fall and spring conferences). By comparison thetrend reported for span of traditional activities is 2-4 days, and nine months or morefor reform-type activities. Further, the number of contact hours for NES workshopsranged from 34 to 77, with an average of 43 hours. The range suggests a widevariability in duration across field centers. The average duration, on the other hand,suggests an intense immersion in workshop activities when compared to the averagenumber of contact hours for reform-type activities (35 hours) and traditionalactivities (23 hours) documented in related literature (Garet et al., 2001).
Type of participation. The literature on professional development documents thebenefits of activities designed for groups of teachers from the same school,department, or grade level. Teachers who are provided with opportunities to worktogether are more likely to report more productive experiences (Newmann &Associates, 1996; Talbert & McLaughlin, 1993). In this case it was important todetermine whether the activities were designed for a group of teachers from thesame school or grade level or for individual teachers from different schools or gradelevels. This is a feature where the NES program is particularly strong. Central to itsdesign, the NES program calls for participation of school teams focusing on middlegrades and with particular emphasis on science, mathematics, geography, andtechnology curricula. A staple expectation is for school teams to work together over athree-year period, serving as the nucleus for sharing ideas and extending efforts
NES Evaluation Brief 2: A Program in the Making 14
schoolwide. Under this design the workshops provided initial opportunities for schoolteams to develop/refine strategic plans, identify resources needed, and think aboutfurther individual and team professional development.
Core Features of WorkshopsUsing workshop agendas as the basis for analysis, three core features found to beindicators of effective professional development were examined. These featuresincluded content focus, opportunities for active learning, and coherence with otheractivities (Garet et al., 2001).
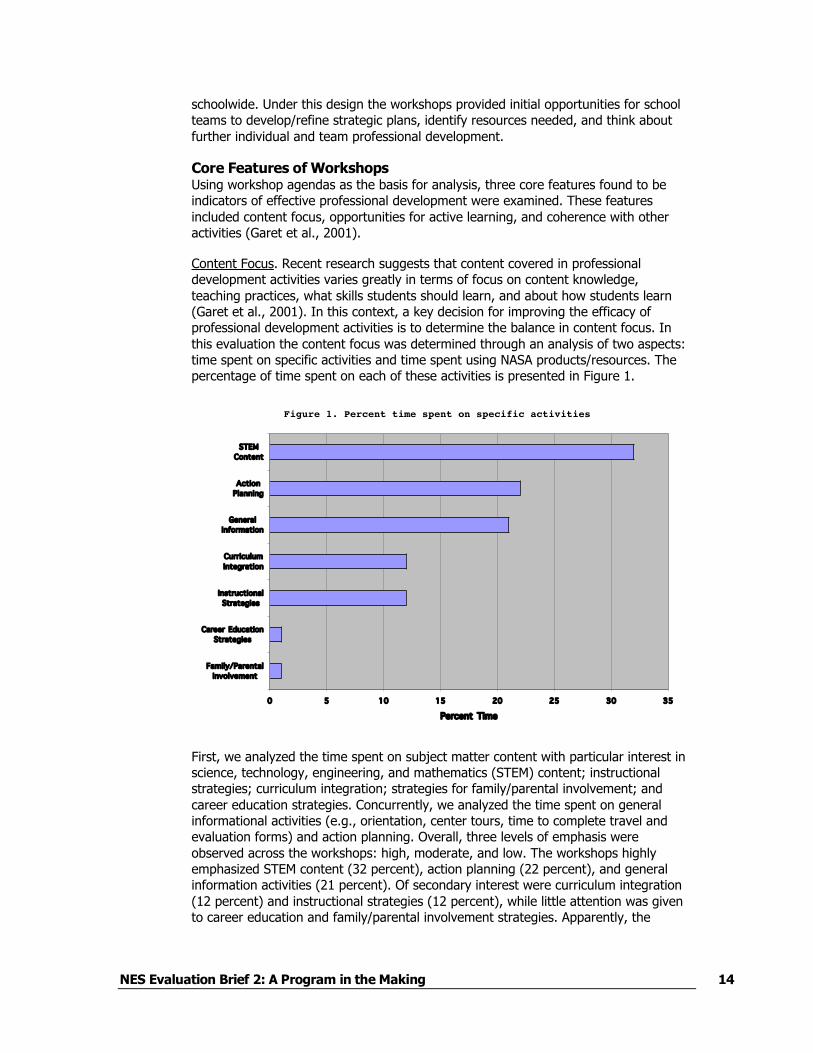
Content Focus. Recent research suggests that content covered in professionaldevelopment activities varies greatly in terms of focus on content knowledge,teaching practices, what skills students should learn, and about how students learn(Garet et al., 2001). In this context, a key decision for improving the efficacy ofprofessional development activities is to determine the balance in content focus. Inthis evaluation the content focus was determined through an analysis of two aspects:time spent on specific activities and time spent using NASA products/resources. Thepercentage of time spent on each of these activities is presented in Figure 1.
Figure 1. Percent time spent on specific activities
0 5 10 15 20 25 30 35
Family/ParentalInvolvement
Career EducationStrategies
InstructionalStrategies
CurriculumIntegration
GeneralInformation
ActionPlanning
STEMContent
Percent Time
First, we analyzed the time spent on subject matter content with particular interest inscience, technology, engineering, and mathematics (STEM) content; instructionalstrategies; curriculum integration; strategies for family/parental involvement; andcareer education strategies. Concurrently, we analyzed the time spent on generalinformational activities (e.g., orientation, center tours, time to complete travel andevaluation forms) and action planning. Overall, three levels of emphasis wereobserved across the workshops: high, moderate, and low. The workshops highlyemphasized STEM content (32 percent), action planning (22 percent), and generalinformation activities (21 percent). Of secondary interest were curriculum integration(12 percent) and instructional strategies (12 percent), while little attention was givento career education and family/parental involvement strategies. Apparently, the
NES Evaluation Brief 2: A Program in the Making 15
design strategy was primarily twofold: (a) to provide as much content coverage aspossible, to allow school teams to develop and/or refine strategic plans, and toprovide participants with information about NASA and field center resources; and (b)to show some connections to curriculum and instruction.
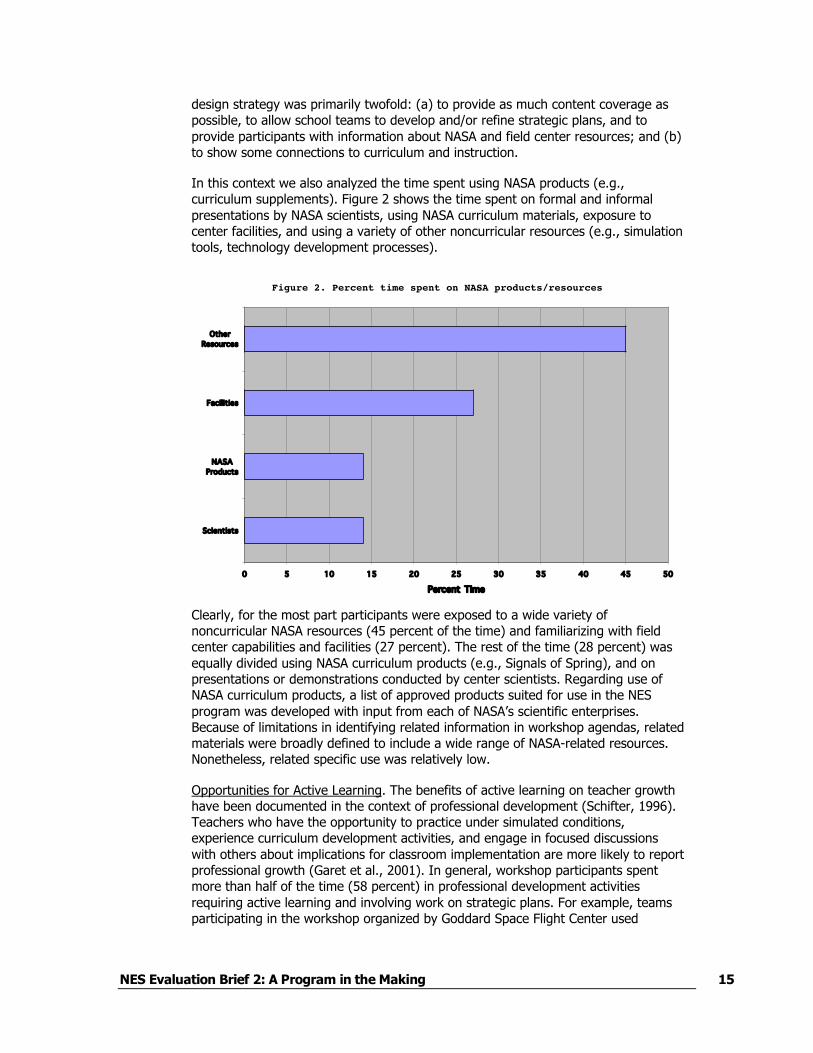
In this context we also analyzed the time spent using NASA products (e.g.,curriculum supplements). Figure 2 shows the time spent on formal and informalpresentations by NASA scientists, using NASA curriculum materials, exposure tocenter facilities, and using a variety of other noncurricular resources (e.g., simulationtools, technology development processes).
Clearly, for the most part participants were exposed to a wide variety ofnoncurricular NASA resources (45 percent of the time) and familiarizing with fieldcenter capabilities and facilities (27 percent). The rest of the time (28 percent) wasequally divided using NASA curriculum products (e.g., Signals of Spring), and onpresentations or demonstrations conducted by center scientists. Regarding use ofNASA curriculum products, a list of approved products suited for use in the NESprogram was developed with input from each of NASA’s scientific enterprises.Because of limitations in identifying related information in workshop agendas, relatedmaterials were broadly defined to include a wide range of NASA-related resources.Nonetheless, related specific use was relatively low.
Opportunities for Active Learning. The benefits of active learning on teacher growthhave been documented in the context of professional development (Schifter, 1996).Teachers who have the opportunity to practice under simulated conditions,experience curriculum development activities, and engage in focused discussionswith others about implications for classroom implementation are more likely to reportprofessional growth (Garet et al., 2001). In general, workshop participants spentmore than half of the time (58 percent) in professional development activitiesrequiring active learning and involving work on strategic plans. For example, teamsparticipating in the workshop organized by Goddard Space Flight Center used
Figure 2. Percent time spent on NASA products/resources
0 5 10 15 20 25 30 35 40 45 50
Scientists
NASAProducts
Facilities
OtherResources
Percent Time
NES Evaluation Brief 2: A Program in the Making 16
technological parameters of satellites, satellite tools, and data collection to simulate aremote sensing program implementation. The teams used this information togenerate ideas about the use of real-world data and analyses and generate ideas forusing other data sets in the classroom. To this end, across all workshops participantswere afforded daily opportunities to meet as a team and work on strategic plans (22percent of the time).
What Were the Participants’ Perspectives on Summer Workshops?Based on NEEIS data, an analysis of the participants’ perspectives on the contentand quality of professional experiences was conducted. What follows is a descriptivesummary of perspectives on how participants viewed the workshops, what theylearned, potential impact, and how they rated overall quality.
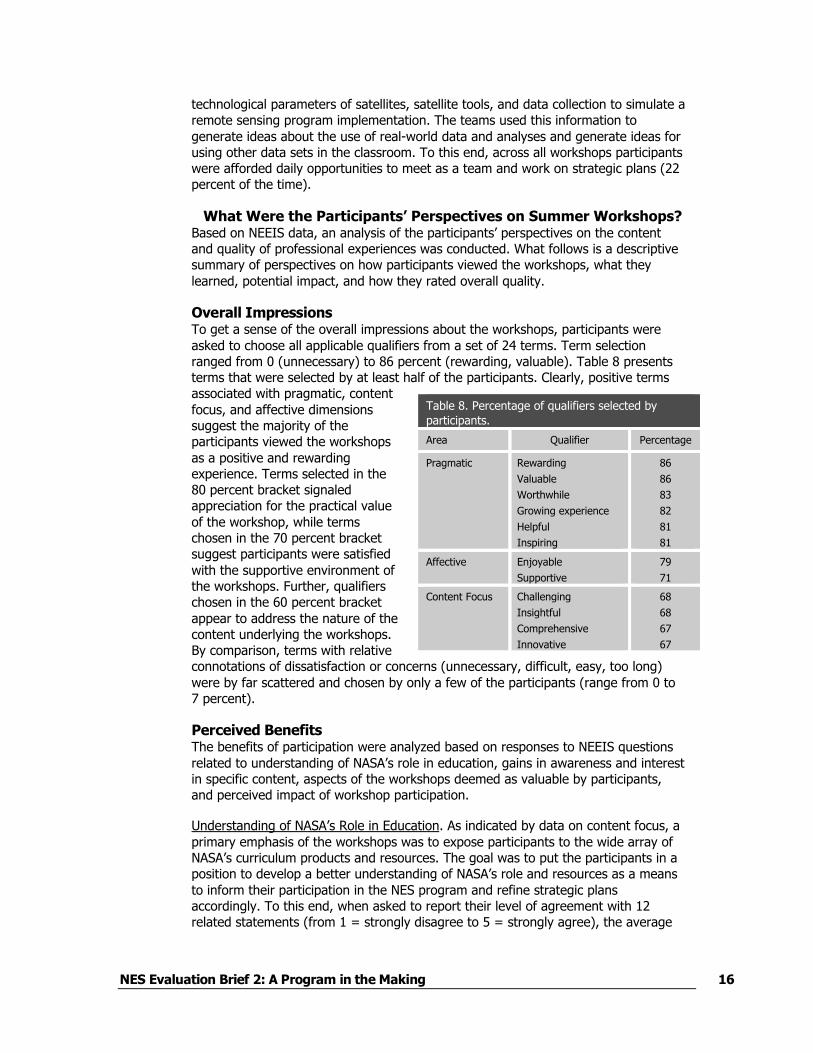
Overall ImpressionsTo get a sense of the overall impressions about the workshops, participants wereasked to choose all applicable qualifiers from a set of 24 terms. Term selectionranged from 0 (unnecessary) to 86 percent (rewarding, valuable). Table 8 presentsterms that were selected by at least half of the participants. Clearly, positive termsassociated with pragmatic, contentfocus, and affective dimensionssuggest the majority of theparticipants viewed the workshopsas a positive and rewardingexperience. Terms selected in the80 percent bracket signaledappreciation for the practical valueof the workshop, while termschosen in the 70 percent bracketsuggest participants were satisfiedwith the supportive environment ofthe workshops. Further, qualifierschosen in the 60 percent bracketappear to address the nature of thecontent underlying the workshops.By comparison, terms with relativeconnotations of dissatisfaction or concerns (unnecessary, difficult, easy, too long)were by far scattered and chosen by only a few of the participants (range from 0 to7 percent).
Perceived BenefitsThe benefits of participation were analyzed based on responses to NEEIS questionsrelated to understanding of NASA’s role in education, gains in awareness and interestin specific content, aspects of the workshops deemed as valuable by participants,and perceived impact of workshop participation.
Understanding of NASA’s Role in Education. As indicated by data on content focus, aprimary emphasis of the workshops was to expose participants to the wide array ofNASA’s curriculum products and resources. The goal was to put the participants in aposition to develop a better understanding of NASA’s role and resources as a meansto inform their participation in the NES program and refine strategic plansaccordingly. To this end, when asked to report their level of agreement with 12related statements (from 1 = strongly disagree to 5 = strongly agree), the average
Table 8. Percentage of qualifiers selected byparticipants.
Area Qualifier Percentage
Pragmatic Rewarding
Valuable
Worthwhile
Growing experience
Helpful
Inspiring
86
86
83
82
81
81
Affective Enjoyable
Supportive
79
71
Content Focus Challenging
Insightful
Comprehensive
Innovative
68
68
67
67
NES Evaluation Brief 2: A Program in the Making 17
rating was 4.6. Statements that received a rating recognized as exemplary (4.7 orhigher average rating) included appreciation for using NASA resources to offer theNES program (4.9 average rating) and better understanding of NASA’s mission andsupport for education (4.8 average rating). As a result, participants reported theylearned more about careers related to NASA (4.7 average rating).
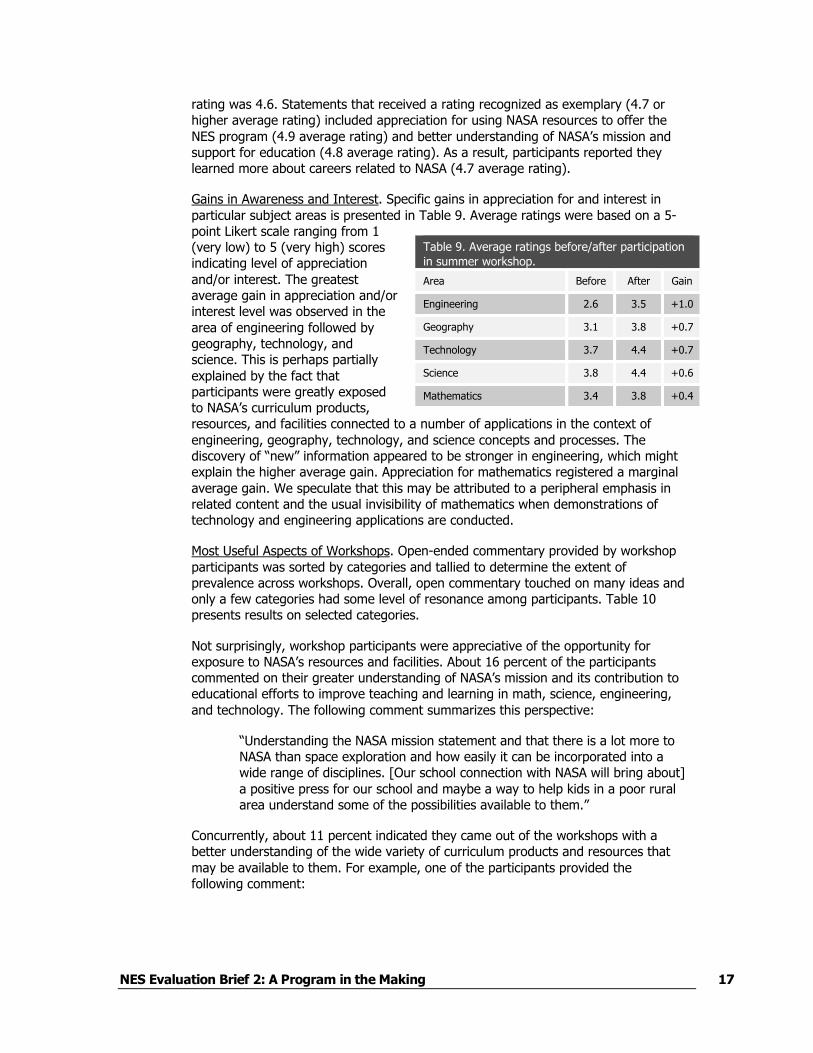
Gains in Awareness and Interest. Specific gains in appreciation for and interest inparticular subject areas is presented in Table 9. Average ratings were based on a 5-point Likert scale ranging from 1(very low) to 5 (very high) scoresindicating level of appreciationand/or interest. The greatestaverage gain in appreciation and/orinterest level was observed in thearea of engineering followed bygeography, technology, andscience. This is perhaps partiallyexplained by the fact thatparticipants were greatly exposedto NASA’s curriculum products,resources, and facilities connected to a number of applications in the context ofengineering, geography, technology, and science concepts and processes. Thediscovery of “new” information appeared to be stronger in engineering, which mightexplain the higher average gain. Appreciation for mathematics registered a marginalaverage gain. We speculate that this may be attributed to a peripheral emphasis inrelated content and the usual invisibility of mathematics when demonstrations oftechnology and engineering applications are conducted.
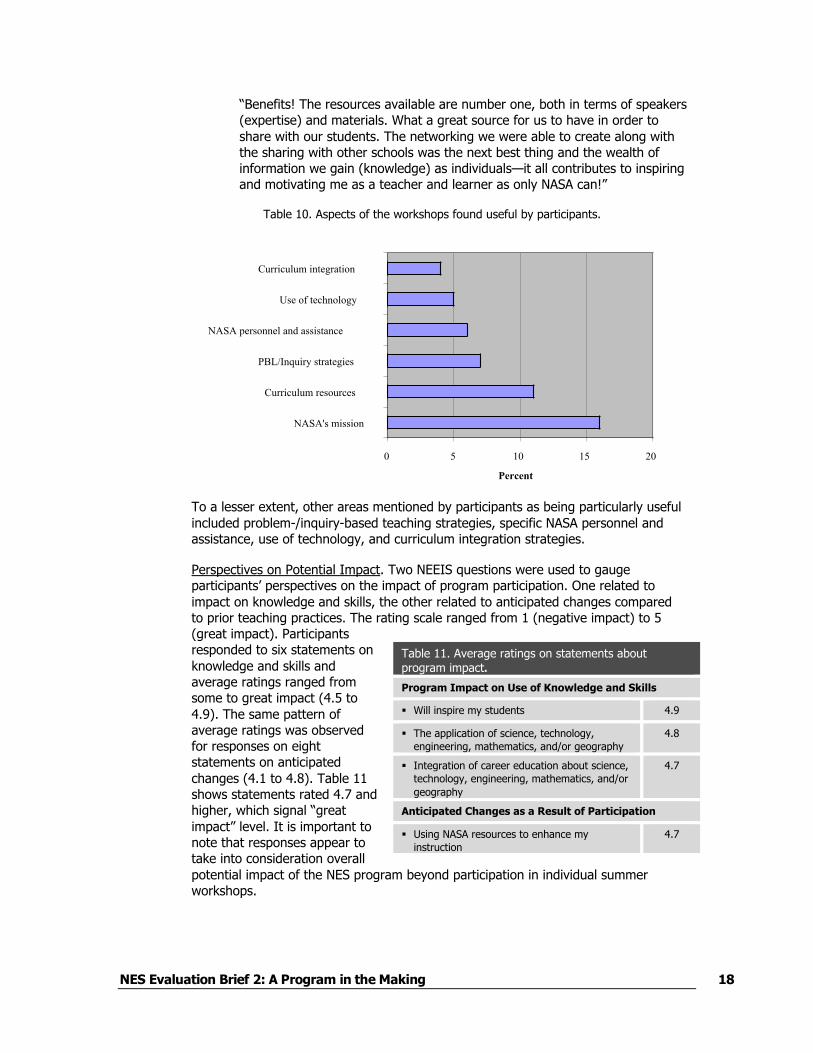
Most Useful Aspects of Workshops. Open-ended commentary provided by workshopparticipants was sorted by categories and tallied to determine the extent ofprevalence across workshops. Overall, open commentary touched on many ideas andonly a few categories had some level of resonance among participants. Table 10presents results on selected categories.
Not surprisingly, workshop participants were appreciative of the opportunity forexposure to NASA’s resources and facilities. About 16 percent of the participantscommented on their greater understanding of NASA’s mission and its contribution toeducational efforts to improve teaching and learning in math, science, engineering,and technology. The following comment summarizes this perspective:
“Understanding the NASA mission statement and that there is a lot more toNASA than space exploration and how easily it can be incorporated into awide range of disciplines. [Our school connection with NASA will bring about]a positive press for our school and maybe a way to help kids in a poor ruralarea understand some of the possibilities available to them.”
Concurrently, about 11 percent indicated they came out of the workshops with abetter understanding of the wide variety of curriculum products and resources thatmay be available to them. For example, one of the participants provided thefollowing comment:
Table 9. Average ratings before/after participationin summer workshop.
Area Before After Gain
Engineering 2.6 3.5 +1.0
Geography 3.1 3.8 +0.7
Technology 3.7 4.4 +0.7
Science 3.8 4.4 +0.6
Mathematics 3.4 3.8 +0.4
NES Evaluation Brief 2: A Program in the Making 18
“Benefits! The resources available are number one, both in terms of speakers(expertise) and materials. What a great source for us to have in order toshare with our students. The networking we were able to create along withthe sharing with other schools was the next best thing and the wealth ofinformation we gain (knowledge) as individuals—it all contributes to inspiringand motivating me as a teacher and learner as only NASA can!”
Table 10. Aspects of the workshops found useful by participants.
To a lesser extent, other areas mentioned by participants as being particularly usefulincluded problem-/inquiry-based teaching strategies, specific NASA personnel andassistance, use of technology, and curriculum integration strategies.
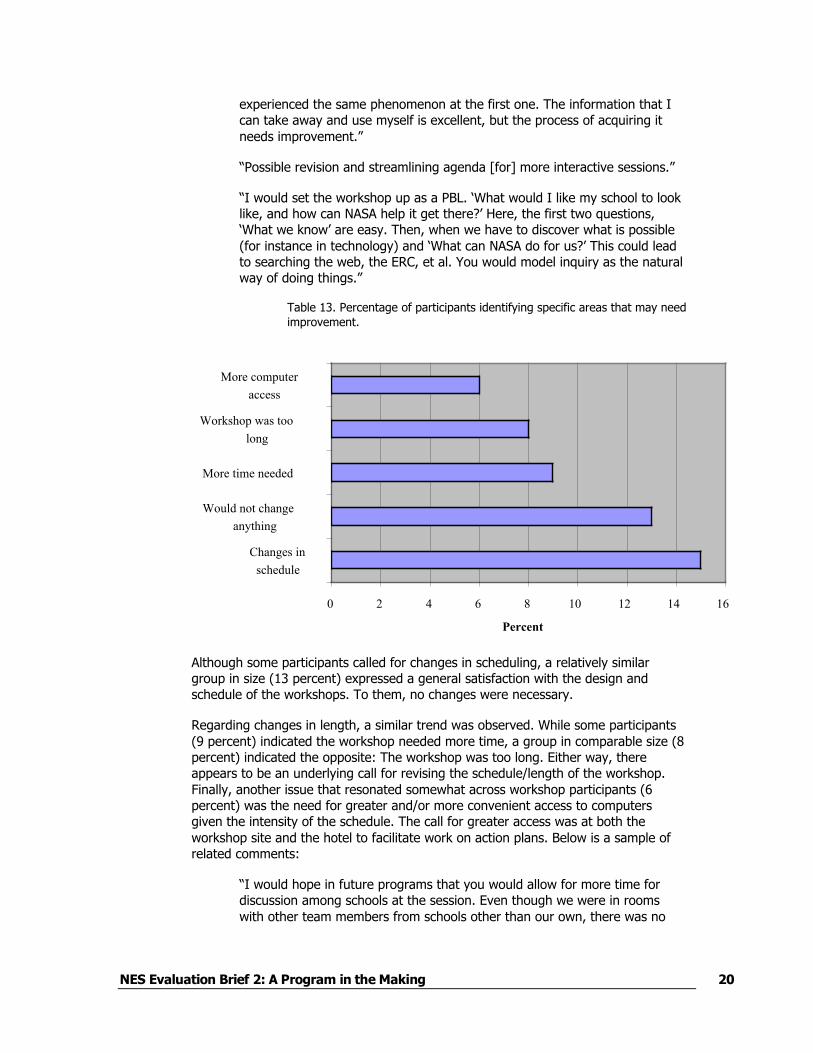
Perspectives on Potential Impact. Two NEEIS questions were used to gaugeparticipants’ perspectives on the impact of program participation. One related toimpact on knowledge and skills, the other related to anticipated changes comparedto prior teaching practices. The rating scale ranged from 1 (negative impact) to 5(great impact). Participantsresponded to six statements onknowledge and skills andaverage ratings ranged fromsome to great impact (4.5 to4.9). The same pattern ofaverage ratings was observedfor responses on eightstatements on anticipatedchanges (4.1 to 4.8). Table 11shows statements rated 4.7 andhigher, which signal “greatimpact” level. It is important tonote that responses appear totake into consideration overallpotential impact of the NES program beyond participation in individual summerworkshops.
Table 11. Average ratings on statements aboutprogram impact.
Program Impact on Use of Knowledge and Skills
Will inspire my students 4.9
The application of science, technology,engineering, mathematics, and/or geography
4.8
Integration of career education about science,technology, engineering, mathematics, and/orgeography
4.7
Anticipated Changes as a Result of Participation
Using NASA resources to enhance myinstruction
4.7
0 5 10 15 20
NASA's mission
Curriculum resources
PBL/Inquiry strategies
NASA personnel and assistance
Use of technology
Curriculum integration
Percent

NES Evaluation Brief 2: A Program in the Making 19
Clearly, participants expect an impact on their students. Participation in the NESprogram is expected to be the source of ideas for improvements in teaching andlearning, andultimatelythe source of inspiration for students. The use of NASAresources to enhance instructional practice is seen as the primary vehicle forimprovements in curriculum integration and student motivation.
Overall Evaluative PerspectivesResponses to NEEIS questions requiring the evaluation of the workshop as a wholeand rating of specific components yielded very positive feedback from workshopparticipants. Overall satisfaction was determined through responses to six statementsbased on a rating scale ranging from 1 (strongly disagree) to 5 (strongly agree).
Average ratings ranged from 4.5 to 4.8. In general, participants strongly agreed thatthe program was a valuable experience, NASA-related materials provided in theworkshop can be integrated in the school’s curriculum, they expect to apply whatthey learned in the program, and they were satisfied with the job done by thepresenters.
Likewise, the average ratings of fourstatements related to program contentand leaders were very positive. Table 12presents average ratings based on a 5-point Likert scale (1 = very poor, 5 =excellent). Average ratings for allstatements leaned toward the excellentlevel and signaled a high level ofsatisfaction with specific components ofthe workshop and the NES program atthis point. In general, participants wouldhighly recommend other teachers to participate in the program.
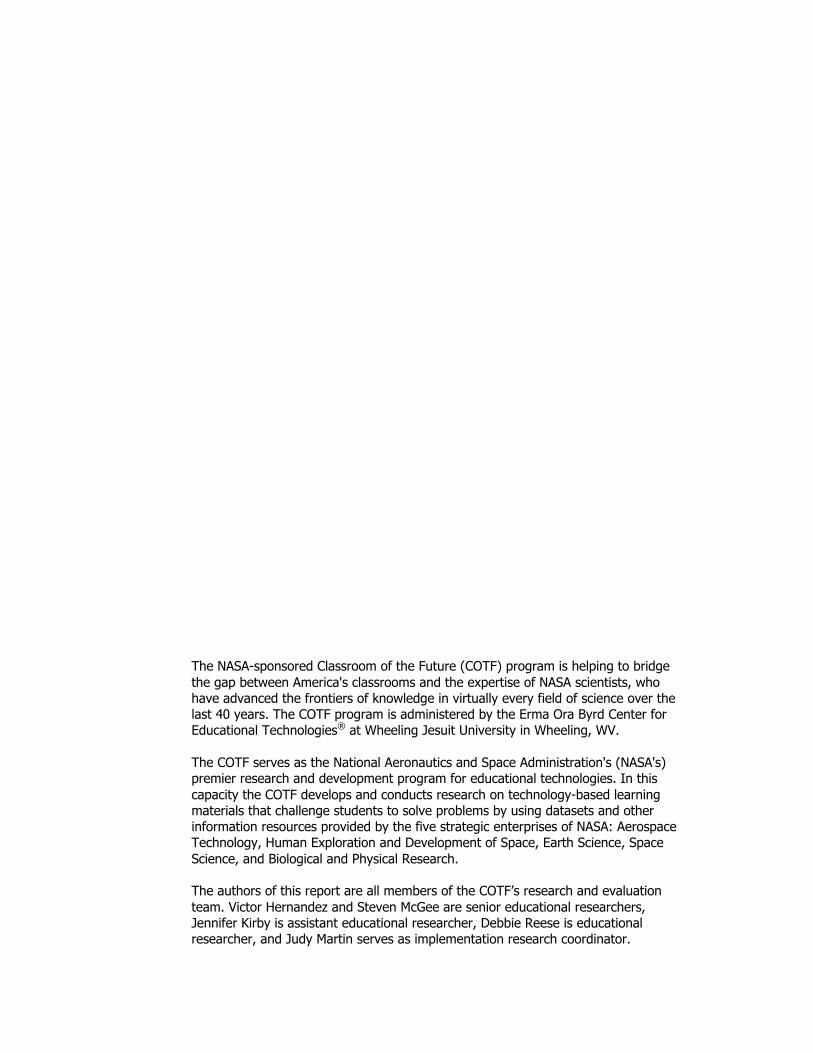
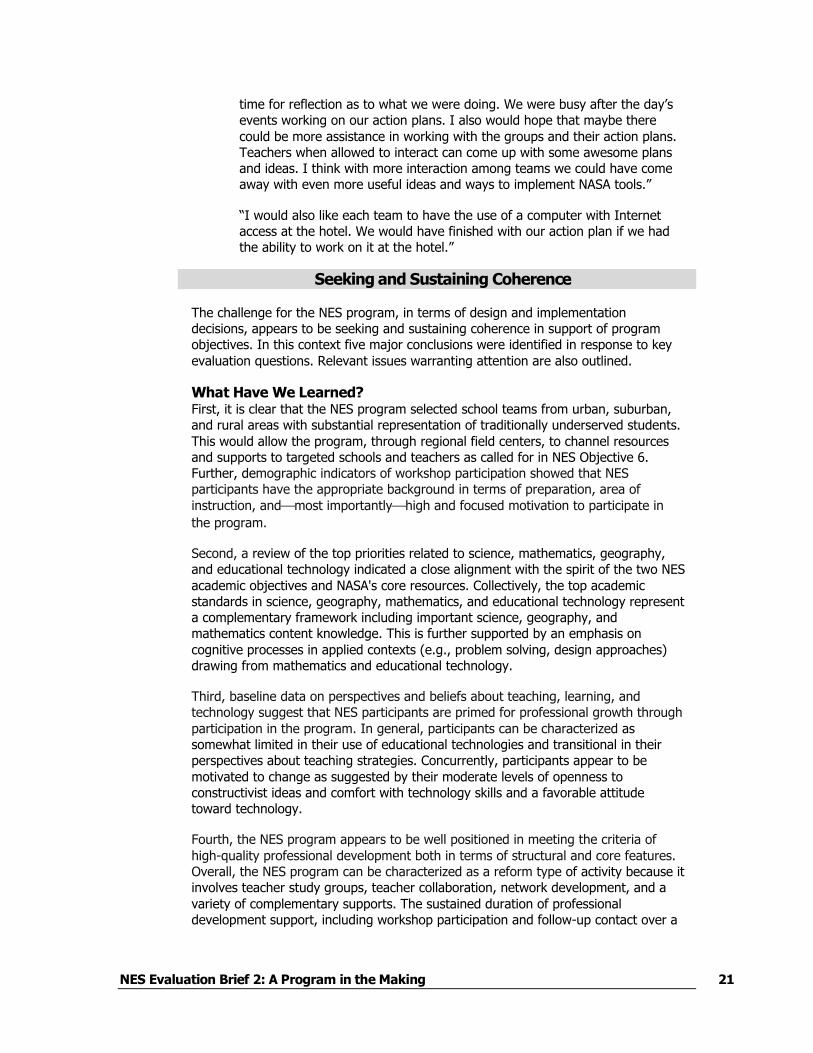
Suggestions for Improvement. Based on open commentary, it was possible toidentify specific areas that may require improvement. Comments from all workshopswere sorted in categories and summarized in aggregated form. In general, threeissues emerged from participants’ feedback. One issue related to schedule changes,the other was about length, and the thirdto a lesser extentwas concerned withcomputer access during the workshops (see Table 13).
About 15 percent of the participants called for changes in schedule. Suggestedchanges ranged from more time for group planning to reexamining the value and/ordelivery process of specific sessions. In some cases specific suggestions wereprovided. For example:
“I enjoyed all of the NASA activities. The only thing I would suggestchanging is having a little more work time set up each day for groupplanning of the action plans. For teachers it is very nerve-racking to have towait until the last day to complete activities (that's when we had the mosttime to finish up).
“The materials, web sites, posters, etc., are all extremely valuable, and Iappreciate gaining access to them. However, the time spent on site at NASAis not of the quality I expect. This is my second NASA workshop, and I
Table 12. Average rating of program, content,and leaders.
What kind of recommendation would yougive to someone who asked you aboutapplying to this program?
4.9
Rating of program content 4.8
Rating of the program 4.8
Rating of program leaders 4.7
NES Evaluation Brief 2: A Program in the Making 20
experienced the same phenomenon at the first one. The information that Ican take away and use myself is excellent, but the process of acquiring itneeds improvement.”
“Possible revision and streamlining agenda [for] more interactive sessions.”
“I would set the workshop up as a PBL. ‘What would I like my school to looklike, and how can NASA help it get there?’ Here, the first two questions,‘What we know’ are easy. Then, when we have to discover what is possible(for instance in technology) and ‘What can NASA do for us?’ This could leadto searching the web, the ERC, et al. You would model inquiry as the naturalway of doing things.”
Table 13. Percentage of participants identifying specific areas that may needimprovement.
Although some participants called for changes in scheduling, a relatively similargroup in size (13 percent) expressed a general satisfaction with the design andschedule of the workshops. To them, no changes were necessary.
Regarding changes in length, a similar trend was observed. While some participants(9 percent) indicated the workshop needed more time, a group in comparable size (8percent) indicated the opposite: The workshop was too long. Either way, thereappears to be an underlying call for revising the schedule/length of the workshop.Finally, another issue that resonated somewhat across workshop participants (6percent) was the need for greater and/or more convenient access to computersgiven the intensity of the schedule. The call for greater access was at both theworkshop site and the hotel to facilitate work on action plans. Below is a sample ofrelated comments:
“I would hope in future programs that you would allow for more time fordiscussion among schools at the session. Even though we were in roomswith other team members from schools other than our own, there was no
0 2 4 6 8 10 12 14 16
Changes in
schedule
Would not change
anything
More time needed
Workshop was too
long
More computer
access
Percent
NES Evaluation Brief 2: A Program in the Making 21
time for reflection as to what we were doing. We were busy after the day’sevents working on our action plans. I also would hope that maybe therecould be more assistance in working with the groups and their action plans.Teachers when allowed to interact can come up with some awesome plansand ideas. I think with more interaction among teams we could have comeaway with even more useful ideas and ways to implement NASA tools.”
“I would also like each team to have the use of a computer with Internetaccess at the hotel. We would have finished with our action plan if we hadthe ability to work on it at the hotel.”
Seeking and Sustaining Coherence
The challenge for the NES program, in terms of design and implementationdecisions, appears to be seeking and sustaining coherence in support of programobjectives. In this context five major conclusions were identified in response to keyevaluation questions. Relevant issues warranting attention are also outlined.
What Have We Learned?First, it is clear that the NES program selected school teams from urban, suburban,and rural areas with substantial representation of traditionally underserved students.This would allow the program, through regional field centers, to channel resourcesand supports to targeted schools and teachers as called for in NES Objective 6.Further, demographic indicators of workshop participation showed that NESparticipants have the appropriate background in terms of preparation, area ofinstruction, andmost importantlyhigh and focused motivation to participate inthe program.
Second, a review of the top priorities related to science, mathematics, geography,and educational technology indicated a close alignment with the spirit of the two NESacademic objectives and NASA's core resources. Collectively, the top academicstandards in science, geography, mathematics, and educational technology representa complementary framework including important science, geography, andmathematics content knowledge. This is further supported by an emphasis oncognitive processes in applied contexts (e.g., problem solving, design approaches)drawing from mathematics and educational technology.
Third, baseline data on perspectives and beliefs about teaching, learning, andtechnology suggest that NES participants are primed for professional growth throughparticipation in the program. In general, participants can be characterized assomewhat limited in their use of educational technologies and transitional in theirperspectives about teaching strategies. Concurrently, participants appear to bemotivated to change as suggested by their moderate levels of openness toconstructivist ideas and comfort with technology skills and a favorable attitudetoward technology.
Fourth, the NES program appears to be well positioned in meeting the criteria ofhigh-quality professional development both in terms of structural and core features.Overall, the NES program can be characterized as a reform type of activity because itinvolves teacher study groups, teacher collaboration, network development, and avariety of complementary supports. The sustained duration of professionaldevelopment support, including workshop participation and follow-up contact over a
NES Evaluation Brief 2: A Program in the Making 22
three-year period, should allow for productive experiences. The focus on teacher-teams from the same school (primarily) and grade level should increase thelikelihood of productive participation. Further, the content focus of workshops wassomewhat high on STEM content, action planning, and general information activitiesas shown by the combined time spent on these activities (85 percent of the time).The emphasis on curriculum integration and instructional strategies played asecondary role, while career education and family/parental involvement strategieswere virtually absent. Under these conditions participants spent most of the time (72percent of the time) being exposed to a wide variety of noncurricular NASA resourcesand field center capabilities and facilities, while the rest of the time was spent onusing NASA curriculum products and/or on presentations/demonstrations conductedby scientists. Nonetheless, workshop participants spent more than half of the time(58 percent) in professional development activities requiring active learning andinvolving work on strategic plans.
Finally, the feedback provided by workshop participants on the overall NES programand workshop experiences was highly positive. The program, the content focus, andstaffing were all rated high. Open commentary suggested a high level of appreciationfor the NES program and a high degree of excitement for the connection to NASA.Specific comments for improvement were voiced regarding issues related toscheduling, duration, and access to computers. Although conflicting in some cases(e.g., scheduling, duration), suggestions for improvement should provide field centerstaff with valuable feedback for adjusting the design and implementation of summerworkshops. More time for team reflection, in particular, appears to be an importantissue to consider.
Implications for Seeking and Sustaining CoherenceThe implications of these results are clearly connected to seeking and sustainingcoherence as design and implementation decisions are made to shape the NESprogram. In general, the results are both promising and tentative—promisingbecause the program is well positioned in the target school teams and for itspotential alignment with high-quality features of professional development, yettentative because the evidence at this point is not sufficient to make definite claimsabout the current success of the program. All in all, the structural features of theNES program appear to be sound. The school team concept in the context of long-term commitment, in particular, signals serious NASA support. However, as oneparticipant put it:
“The school team concept of the Explorer School program is a vastimprovement over the one person from each site plan of NEW. However,NASA still expects that people will experience a bonding during theexperience that just does not occur. Therefore, we as a team were oftenmade to endure a forced regrouping that took up time when we would ratherhave been working together. Each school has unique demographics andneeds and needs to spend as much time together as possible.”
The comment above captures the core challenges for the NES program to seek andsustain coherence over the next couple of years. Although, the NES program may beembracing high-quality features of professional development, it is unclear how actualprofessional development activities will translate when implemented. Below are somekey implications and/or issues to be considered in making design and implementationdecisions.
NES Evaluation Brief 2: A Program in the Making 23
In seeking and sustaining coherence, it will be important for NES staff toestablish connections between content priorities identified by school teams anddesign/implementation decisions. Based on data available for this report, it wasunclear how information on top target standards was used to inform decisionsfor implementing summer 2003 workshops. Field center staff should examine thealignment between target standards identified by their affiliated teams andworkshop goals and determine whether teachers are getting what they need tofacilitate work on action plans.
Further evidence is also needed to clarify the nature and extent of results oncore features. As suggested by related results and open commentary, thereappears to be room for improvement in terms of balance in content focus, natureof active learning, and allowing for reflection on action plans. Key issues to beaddressed by field centers are deciding on the balance in terms of emphasis oncontent, pedagogy, and action planning; making decisions on the nature andbalance of opportunities for active learning; and factoring in sufficient time forteams to engage in meaningful reflection and processing of information duringworkshops. To this end, we recommend field center staff to review bothquantitative and qualitative NEEIS data from their corresponding workshops toidentify and gauge the extent of potential adjustments.
Another issue requiring further attention relates to the use of NASA approvedcurriculum resources. The use of these curricular resources is central to thedefinition of the program’s intervention. Ultimately, the impact of the programwill be tied to both the extent of structural supports (e.g., technical assistance,stipends) and use of NASA’s curricular resources. Given the low use of relatedresources in 2003, it will be important to either increase their coherent use in theworkshops and/or improve the identification of such resources in the agendas.
Attention is also warranted on decisions related to the level of emphasis onfamily involvement and career education strategies. These two areas are at thecore of the NES objectives. However, the emphasis on related strategies wasessentially overlooked in summer 2003 workshops. Although these two areasmay fall outside the expertise of field center staff, an effort should be made toprovide teachers with access to related information. This is perhaps the area inneed of most improvement and/or documentation of related design andimplementation decisions.
Concurrently, it will be important for field center staff to examine and documentthe alignment between strategic plans and follow-up supports. Although initialfeedback is positive, it will be important for field center staff to examine anddocument the alignment of action plans and the nature and extent of sustained(follow-up) support provided after summer workshops. This documentation willbe key to sustain the qualification of the NES program as a reform-type activityand to strengthen the program as an educational intervention.
Regarding the use of evaluation results, it is critical to generate and have accessto consistent and accurate data to provide reliable and valid formativeassessments of overall program progress. For the evaluation of subsequentworkshops, the evaluation team has requested field center staff to provide codedagendas to facilitate the analysis of workshops. In addition, we plan to observeworkshops and take notes as a means to verify and support related analyses.

NES Evaluation Brief 2: A Program in the Making 24
All things considered, designing and implementing activities with multiple high-qualityfeatures is a challenging endeavor. Initial results based on summer 2003 workshopdata reflect the complexity of related activities in the quest to seek and sustaincoherence in the short and long term. Subsequent reports will be instrumental inclarifying the quality and, eventually, the impact of the NES program.
References
Becker, H. J. (2000). Findings from the teaching, learning, and computing survey: IsLarry Cuban right? Paper presented at the School Technology Leadership Conferenceof the Council of Chief State School Officers, Washington, D.C.
Becker, H. J., & Anderson, R. E. (1998). Validating self-report measures of theconstructivism of teachers' beliefs and practices. Paper presented at the AmericanEducational Research Association, San Diego.
Brown, A. L. (1992). Design experiments: Theoretical and methodological challengesin creating complex interventions in classroom settings. The Journal of the LearningSciences, 2(2), 141-178.
Brown, C. G. (2003). Potential federal education resources for high povertycommunity schools: A guide for communities. Retrieved February 4, 2004, from<http://www.responsiveeducation.org/pdf/federalResources.pdf>http://www.responsiveeducation.org/pdf/federalResources.pdf
Caine, R. N., & Caine, G. (1991). Making connections: Teaching and the humanbrain. Alexandria, VA: Association for Supervision and Curriculum Development.
Cobb, P., Confrey, J., diSessa, A., Lehrer, R., & Shauble, L. (2003). Designexperiments in educational research. Educational Researcher, 32(1), 9-13.
Garet, M. S., Porter, A. C., Desimone, L., Birman, B. F., & Yoon, K. S. (2001). Whatmakes professional development effective? Results from a national sample ofteachers. American Educational Research Journal, 38(4), 915-945.
McGee, S., Hernandez, V., & Kirby, J. (2003). Evaluation brief 1: Evaluating thequality and impact of the NASA Explorer Schools program (NES/EB1/7-2003).Wheeling, WV: Classroom of the Future.
Newmann, F. M., & Associates. (1996). Authentic achievement: Restructuring schoolsfor intellectual quality. San Francisco: Jossey-Bass.
Schifter, D. (1996). A constructivist perspective on teaching and learningmathematics. Phi Delta Kappan, 77(7), 492-499.
Talbert, J. E., & McLaughlin, M. W. (1993). Understanding teaching in context. In D.K. Cohen, M. W. McLaughlin, & J. E. Talbert (eds.), Teaching for understanding:Challenges for policy and practice (pp. 167-206). San Francisco: Jossey-Bass.