Embed Size (px)
Citation preview

Investigation of the Responses
of the General Circulation at
700 mb To Solar-Geomagnetic Disturbance
Harold L. Stolov
The City College of the City University of New York
New York, New York
and
Ralph Shapiro
Air Force Cambridge Research Laboratories
Bedford, Massachusetts.
(NASA-C-13818) INVESiIGATION OF THE 7-22056
RESPONSES OF THE GENERAL CIRCULATION AT
700 11B TO SOLAR-GEOMAGNETIC DISTURBANCE Unclas(City Coll, of the City of New York.) 38302
35 BC5. -- CSCL 0L4A G3/13 38302 -
https://ntrs.nasa.gov/search.jsp?R=19740013943 2019-02-03T10:54:43+00:00Z
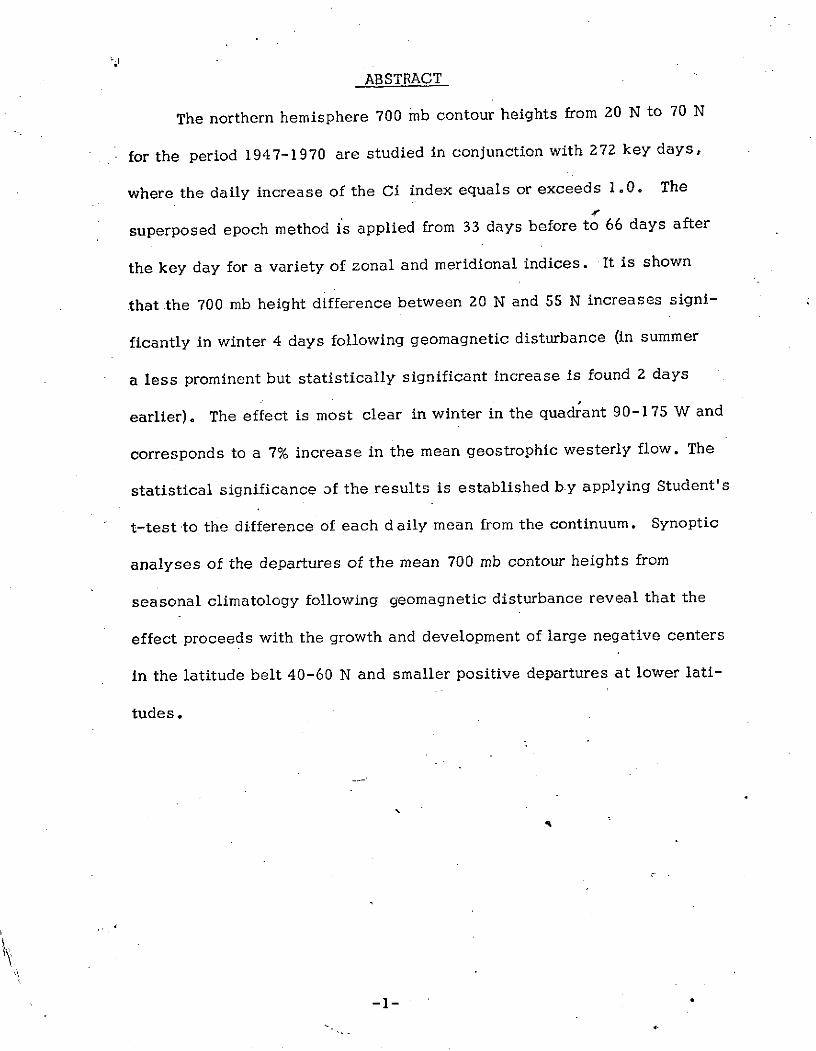
ABSTRACT
The northern hemisphere 700 mb contour heights from 20 N to 70 N
for the period 1947-1970 are studied in conjunction with 272 key days,
where the daily increase of the Ci index equals or exceeds 1.0. The
superposed epoch method is applied from 33 days before to 66 days after
the key day for a variety of zonal and meridional indices. It is shown
that the 700 mb height difference between 20 N and 55 N increases signi-
ficantly in winter 4 days following geomagnetic disturbance (in summer
a less prominent but statistically significant increase is found 2 days
earlier). The effect is most clear in winter in the quadrant 90-175 W and
corresponds to a 7% increase in the mean geostrophic westerly flow. The
statistical significance of the results is established by applying Student's
t-test to the difference of each daily mean from the continuum. Synoptic
analyses of the departures of the mean 700 mb contour heights from
seasonal climatology following geomagnetic disturbance reveal that the
effect proceeds with the growth and development of large negative centers
in the latitude belt 40-60 N and smaller positive departures at lower lati-
tudes.
-1-
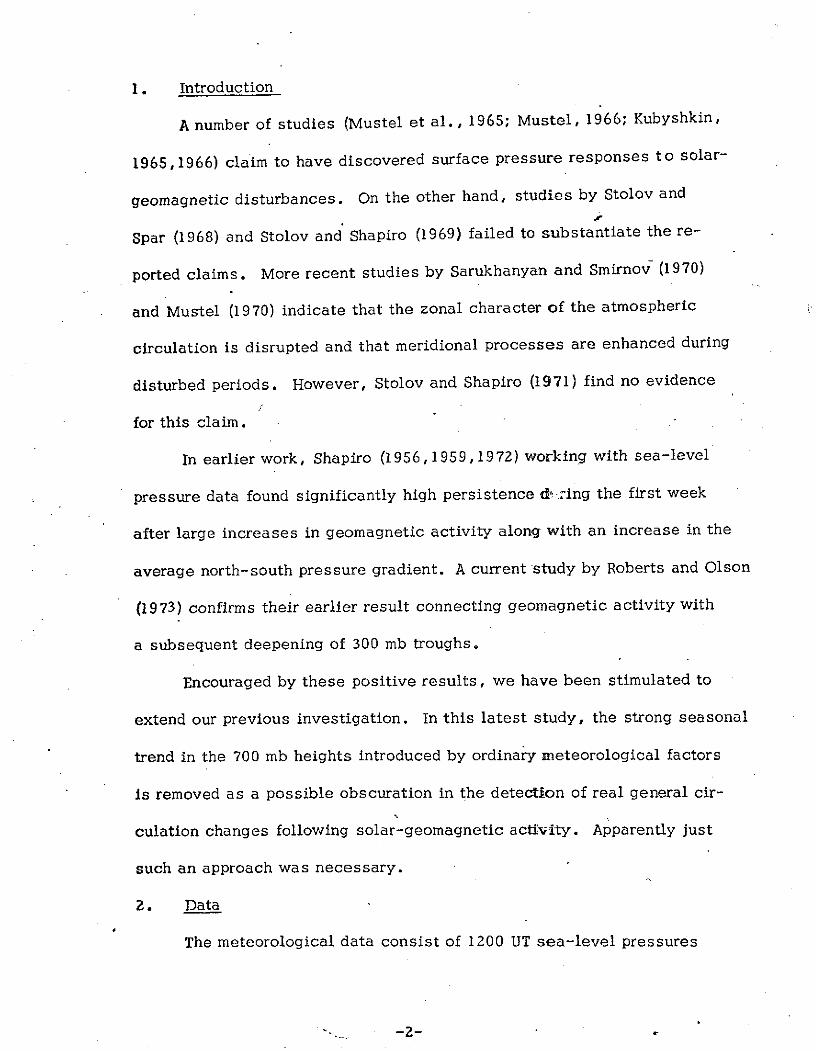
1. Introduction
A number of studies (Mustel et al., 1965; Mustel, 1966; Kubyshkin,
1965,1966) claim to have discovered surface pressure responses to solar-
geomagnetic disturbances. On the other hand, studies by Stolov and
Spar (1968) and Stolov and Shapiro (1969) failed to substantiate the re-
ported claims. More recent studies by Sarukhanyan and Smirnov (1970)
and Mustel (1970) indicate that the zonal character of the atmospheric
circulation is disrupted and that meridional processes are enhanced during
disturbed periods. However, Stolov and Shapiro (1971) find no evidence
for this claim.
In earlier work, Shapiro (1956,1959,1972) working with sea-level
pressure data found significantly high persistence d .oing the first week
after large increases in geomagnetic activity along with an increase in the
average north-south pressure gradient. A current study by Roberts and Olson
(1973) confirms their earlier result connecting geomagnetic activity with
a subsequent deepening of 300 mb troughs.
Encouraged by these positive results, we have been stimulated to
extend our previous investigation. In this latest study, the strong seasonal
trend in the 700 mb heights introduced by ordinary meteorological factors
is removed as a possible obscuration in the detection of real general cir-
culation changes following solar-geomagnetic activity. Apparently just
such an approach was necessary.
2. Data
The meteorological data consist of 1200 UT sea-level pressures
-- 2-
and 700 mb heights from 20 N to 70 N for the period 1 January 1947 to
31 December 1970. The data are available at 50 latitude intervals and
100 longitude intervals in a diamond-shaped grid. As measures of solar-
geomagnetic disturbance, we selected in the preliminary investigation
(Stolov and Shapiro, 1971):
1. The 41 chromospheric flares (1956-1960) producing geomagnetic
disturbance used by Mustel et al. (1965).
2. The 39 chromospheric flares (1961-1967) producing geomagnetic
disturbance used by Stolov and Shapiro (1969).
3. The 39 large isolated geomagnetic disturbances (1947-1961) selected
by Mustel (1968).
4. The 63 large, less-isolated geomagnetic disturbances (1947-1969)
selected by Mustel (1968,1970).
5. The 272 events (1947-1970) where the daily increase of the Inter-
national Magnetic Character Figure (Ci) equals or exceeds 1.0 used by
Shapiro (1972) and compared with Kp in Shapiro (1973).
It is altogether clear that all five lists are intimately related. The
solar key days in lists 1 and 2 tend to precede the geomagnetic key days
by one to two days. The geomagnetic key days in list 5 include most of
the key days in lists 3 and 4 as well as a number of moderate disturbances.
The objective selection criterion of list 5 is an obvious advantage.
3. Preliminary Investigation Yielding Negative Results
The method of analysis used to test for possible meteorological re-
sponses was the well-known superposed epoch analysis. A separate
-3-
analysis was performed with each of the five groups of key days both at
sea level and 700 mb for each of the parameters listed:
a. polar easterlies (P70 N - P55 N)
b. middle latitude westerlies'(P35 N - P55 N)
c. subtropical easterlies (P 3 5 N - P20 N)
A A A A A A A A
d. four meridional indices (Po-P90 P9 0-P180 P1 8 0 270; P70o
-e. standard -deviation of pressure around each latitude circle (20 N-70 N)
in intervals of 5 deg.
f. standard deviation of pressure within 12 sectors defined by latitudes
20 N, 35 N, 55 N and 70 N and longitudes 0,90,180, and 270,
where P is the average around a latitude circle and P is the average along
a meridian between 20 N and 70 N. With five groups of key days and 30
parameters at each of two levels, 300 separate superposed epoch analyses
were obtained. In each analysis, the parameter was examined from 33
days before to 66 days after the key day. Student's t-test was applied to
the difference of each daily mean from the population mean in order to
establish the 5% confidence limits. The results revealed approximately
the chance expectancy with no special preference after or before the key
day. Concentrating on the Ci key days, these were segregated into four
seasons and superposed epoch analyses were performed for each of the 30
parameters for both levels for each of the four new %ets of key days. Al-
though these superposed epoch results were also negative, the seasonal
trends in the parameters over-the 100 day periods were so overwhelming
as to suggest that any solar-terrestrial effects that might be present
-4-
would likely be obscured. With this in mind, the current investigation
was undertaken.
4. Current Investigation - Superposed Epoch Analysis
In the present study we have confined our attention to the Ci key
days and to the 700 mb heights. Our previous experienceindicates that
this approach is clearly the most objective and likely the most promising
provided that the problem of seasonal trend obscuration can be handled.
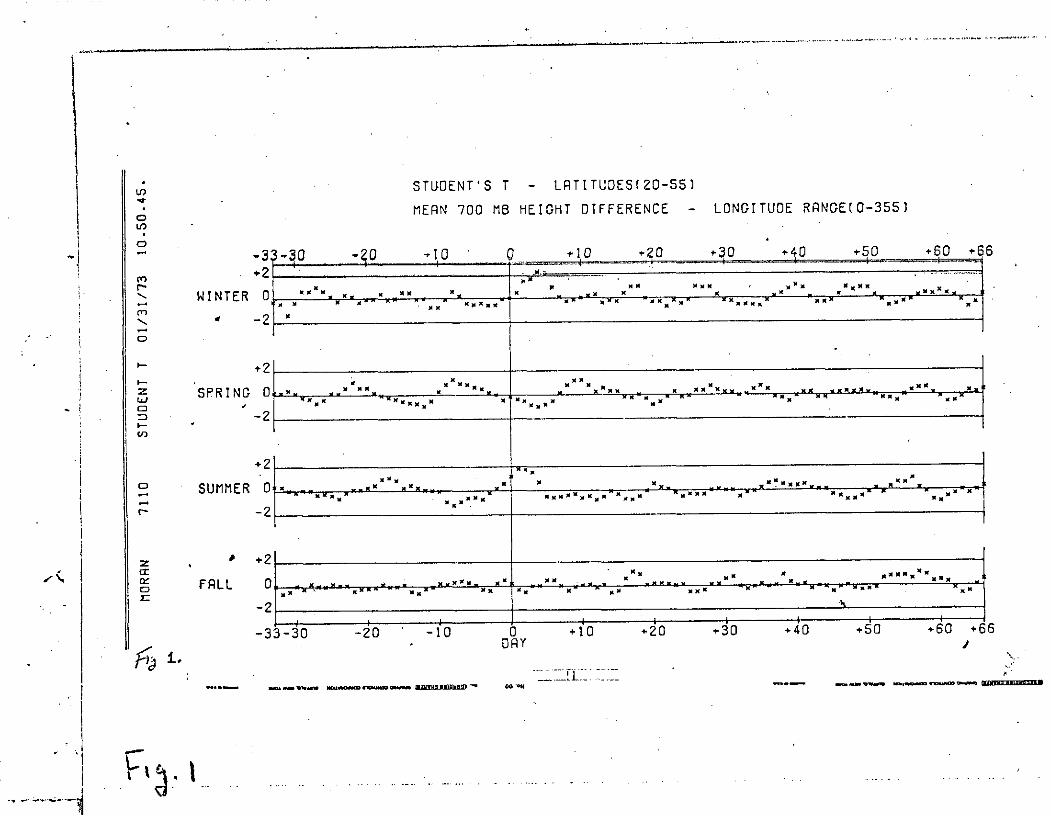
Figure 1 shows the results of a number of superposed epoch analyses per-
formed on the daily differences of the mean zonal 700 mb contour heights
around latitudes 20 and 55 N for the period 1947-1970., The results are
shown separately for the four seasons (winter: December-February; spring:March-
May; summer: June-August; fall: September-November). The abscissa of
Figure 1 extends from 33 days before the key days to 66 days after. Each
of these days bears a constant phase difference from the key day and,
where necessary for clarity, will be referred to as phase-days. The reason
for performing the analyses over a hundred day range was to permit compari-
son of the events immediately after the key day with a large sample of
events far removed from the key day and, therefore, presumably, not influenced (on
the average) by any possible solar-geomagnetic event. Another purpose,
which will become evident later, was to permit an additional test of sig-
nificance. The data of Figure 1 are presented in terms of the Student's
t-test corresponding to the departure of each phase-day mean from its con-
tinuun value. It is necessary to analyze the phase-day means as departures
from a continuum, rather than departures from the population mean of 100 n
values, because the seasonal differences between the extreme ends of
-5-
the curves would otherwise completely dominate the results. (n is the
number of key days used for each season). The continuum, for any par-
ticular phase-day, is defined as the mean of the 21 phase-day means
centered on the particular phase day.
Positive values of t indicate that the phase-day mean exceeds the
continuum value and implies a greater than "average"' contour height dif-
ference (20 N minus 55 N) and, therefore, to the extent that the mid-
latitude 700 mb winds are geostrophic, implies a greater than average wind
from west to east. Magnitudes of t of 2.0 or more indicate that the chance
expectancy of such a departure of the phase-day mean from the continuum
is 5% or less. It can be noticed that there are only two days where such
values of t are obtained - days 4 and 5 of the winter curve. This frequency
is much less than that expected by chance alone and is due in part to the
method of analysis. The phase-day means are highly persistent from one
day to the next. Thus, a large departure on some one phase-day implies
similarly large departures on at least the day before; and the day after.
Since these three phase-day values are included in the continuum value
for the phase day in questions, they would tend to exaggerate the continuum
value and thus depress the magnitude of Student's t. It is estimated that
if the phase-day in question and the day before and after were eliminated
from the computation of the continuum, it would increase the magnitude of
those values of t which are already large (say 2 1.0) by about 15 to 20%.
This would have the effect of elevating the magnitudes of these t-values
but nevertheless no more than three additional values would thus be
-6-
elevated to around 2.0.
The principal reason for the very small number of t-values with
large magnitude is due to the fact that the sample of calender days on
any phase-day ranges over the three months of the season. In addition
to containing the usual sampling fluctuations, the phase-day means con-
tain an appreciable variation from the pronounced seasonal differences in
the mean contour height gradient. Thus, the estimate of the standard de-
viation appropriate for the phase-day mean is appreciably greater than it
would be if the seasonal variation were first removed from the data. It is
estimated that the standard deviations being used in the computation of
Student's t are about twice as large as they should be. This state of af-
fairs introduces no real difficulty as long as we do not expect to find 20
phase days in Figure 1 where the magnitude of t equals or exceeds 2.0.
In fact, we could determine from the sample of 400 t-values, an approxi-
mate magnitude for the 5% significance level. We find that 5% of the 400
t-values have a magnitude equal to or greater than 1.0. A reasonable,
though unsophisticated, approach would be merely to use a magnitude of
1.0 as indicative of significance at the 5% level.
However, we shall use a somewhat different approach and avoid the
whole question of the relative magnitude of t. We shall treat each set of
100 t-values as a quasi-random "selection from a pQpulation whose mean
and standard deviation we shall assume to be the same as the mean and
standard deviation of the given 100 t-values. For example, for the winter
set, the mean t is nearly zero (0.05) and the standard deviation around
this mean is 0.62. Thus, the value of Student's t on day 4 (2.27) is
-7-
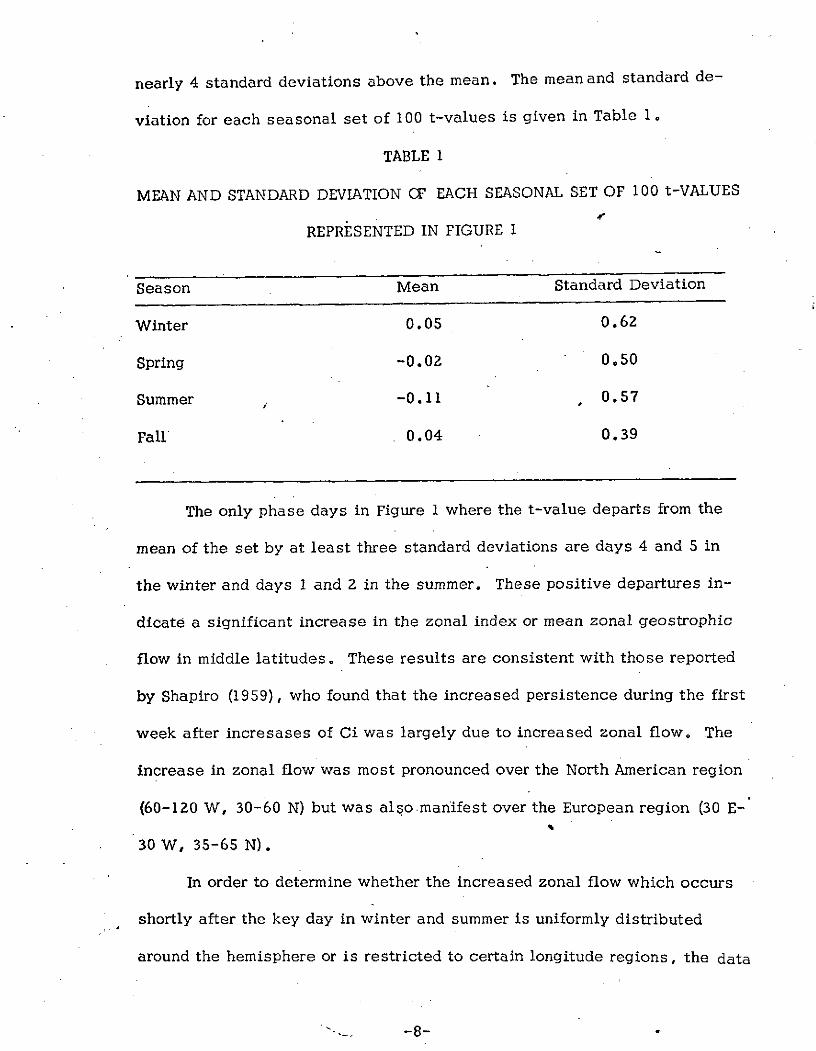
nearly 4 standard deviations above the mean. The mean and standard de-
viation for each seasonal set of 100 t-values is given in Table 1.
TABLE 1
MEAN AND STANDARD DEVIATION OF EACH SEASONAL SET OF 100 t-VALUES
REPRESENTED IN FIGURE 1
Season Mean Standard Deviation
Winter 0.05 0.62
Spring -0.02 0.50
Summer -0.11 0.57
Fall 0.04 0.39
The only phase days in Figure 1 where the t-value departs from the
mean of the set by at least three standard deviations are days 4 and 5 in
the winter and days 1 and 2 in the summer. These positive departures in-
dicate a significant increase in the zonal index or mean zonal geostrophic
flow in middle latitudes. These results are consistent with those reported
by Shapiro (1959), who found that the increased persistence during the first
week after incresases of Ci was largely due to increased zonal flow. The
increase in zonal flow was most pronounced over the North American region
(60-120 W, 30-60 N) but was also manifest over the European region (30 E-
30 W, 35-65 N).
In order to determine whether the increased zonal flow which occurs
shortly after the key day in winter and summer is uniformly distributed
around the hemisphere or is restricted to certain longitude regions, the data
-8-
for these two seasons were examined separately for the four quadrants
0-85 W, 90-175 W, 180-265 W, 270-355 W. The results are shown in
Figure 2. In winter, the increased zonal flow is largely limited to the
half hemisphere, 90-265 W, and is most pronounced in the quadrant 90-
175 W. In summer, however, the increased zonal flow is more modest
but more uniformly distributed around the hemisphere. This difference in
behavior cannot, of course, be explained on the basis of these results.
However, in terms of consistency, they are in agreement with the results
of Roberts and Olson (1973), who find trough intensification in winter over
North America following geomagnetic disturbance.
The difference in behavior between winter and summer may be char-
acterized in the following manner. In winter, the average of the t-values
for the four quadrants is a maximum on phase-day 4 and in summer on phase-
day 2. In both cases, these average values are the largest in the entire
range of one hundred phase days for the respective seasons. However, in
winter, for both quadrants where the increased zonal flow is most pro-
nounced (90-175 W and 180-265 W), the t-values on phase-day 4 are the
largest in the entire range of phase days for the respective quadrants -
whereas in summer, in three of the four quadrants, there are larger t-values
on days other than phase-day 2.
Since the results of Figure 1- and 2 are given -n terms of Student's t,
it is of interest, for.purposes of orientation, to note the magnitude of the
departures of the mean zonal gradients from the continuum values. For
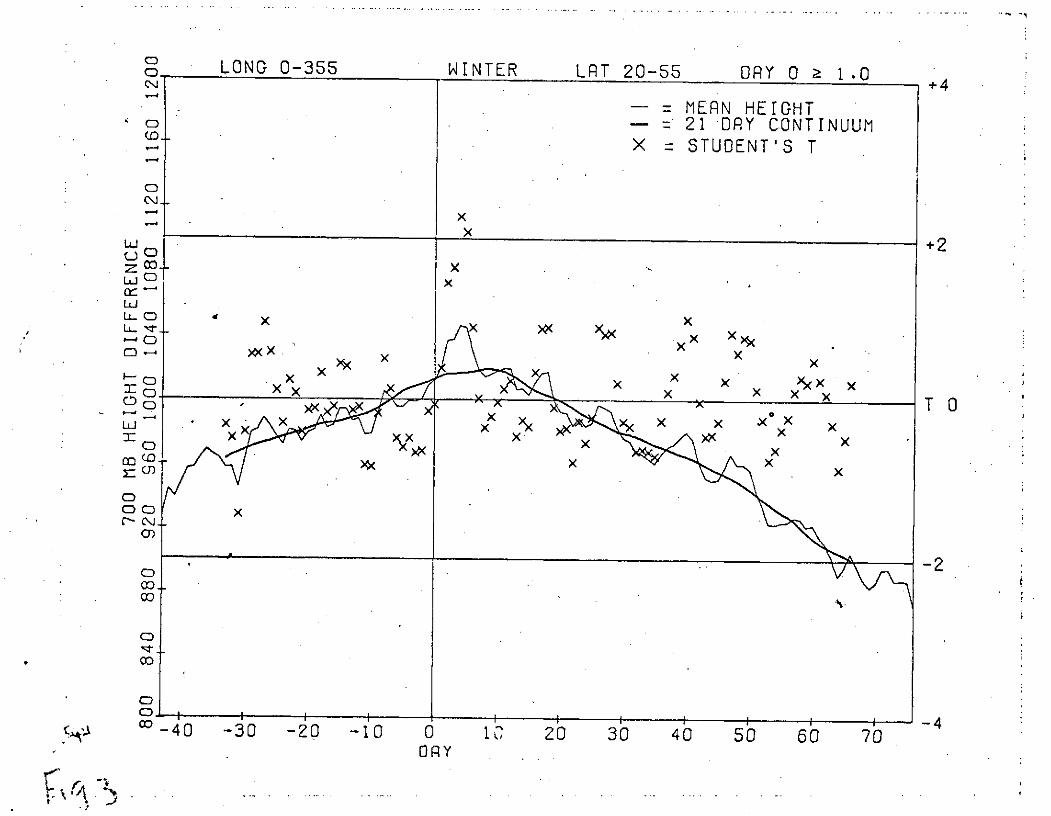
example, for the entire hemisphere, the winter continuum value of the mean
-9-
height difference of the 700 mb surface between 20 N and 55 N on and
around phase-day 4 is 1016 feet which corresponds, roughly, to a geo--l
strophic wind speed of about 7.9 m sec-1 for this entire belt. The ob-
served height difference on phase-day 4 is 1046 feet or about 3% greater
than the continuum (see Figure 3). This small percent difference is highly
significant from.a statistical point of view, but amounts to little-i
more than a 0.2 m sec increase in mean westerly geostrophic wind.
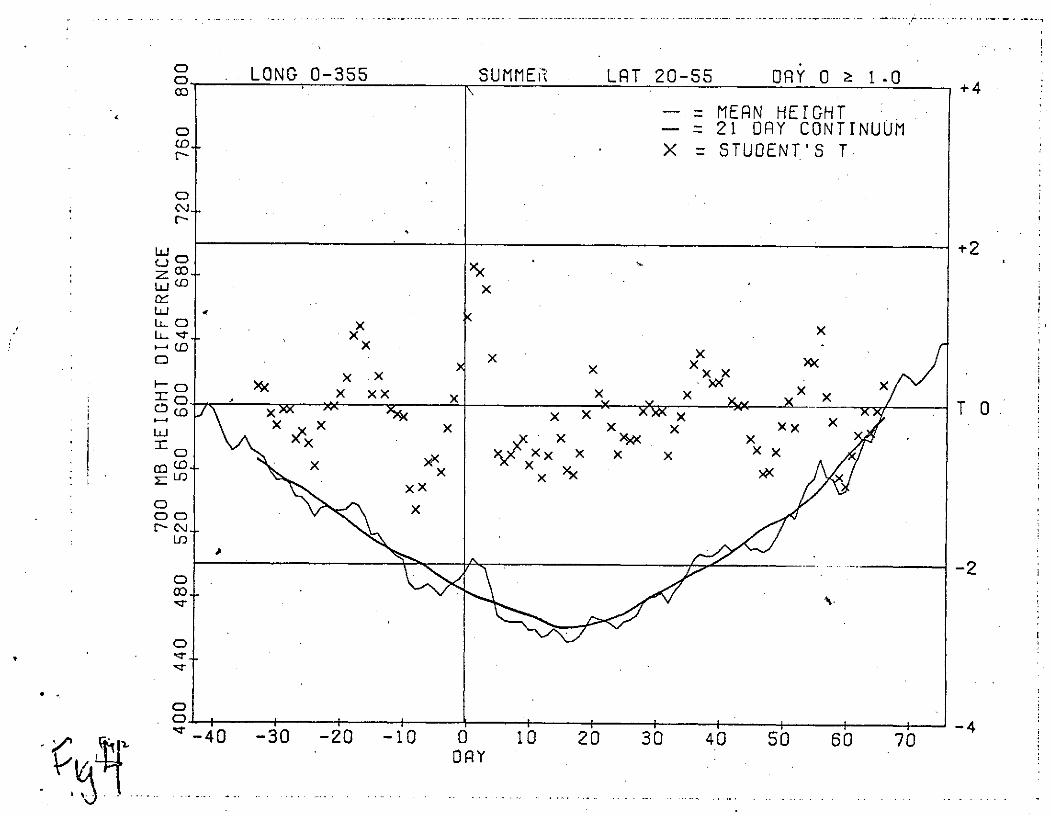
In summer, on phase-day 2, the continuum and observed height differences
are 479 feet and 490 feet respectively, corresponding to an increase of-1
mean geostrophic wind from about 3.6 to less than 3.8 m sec (see
Figure 4). The magnitude of the increase is somewhat greater for the
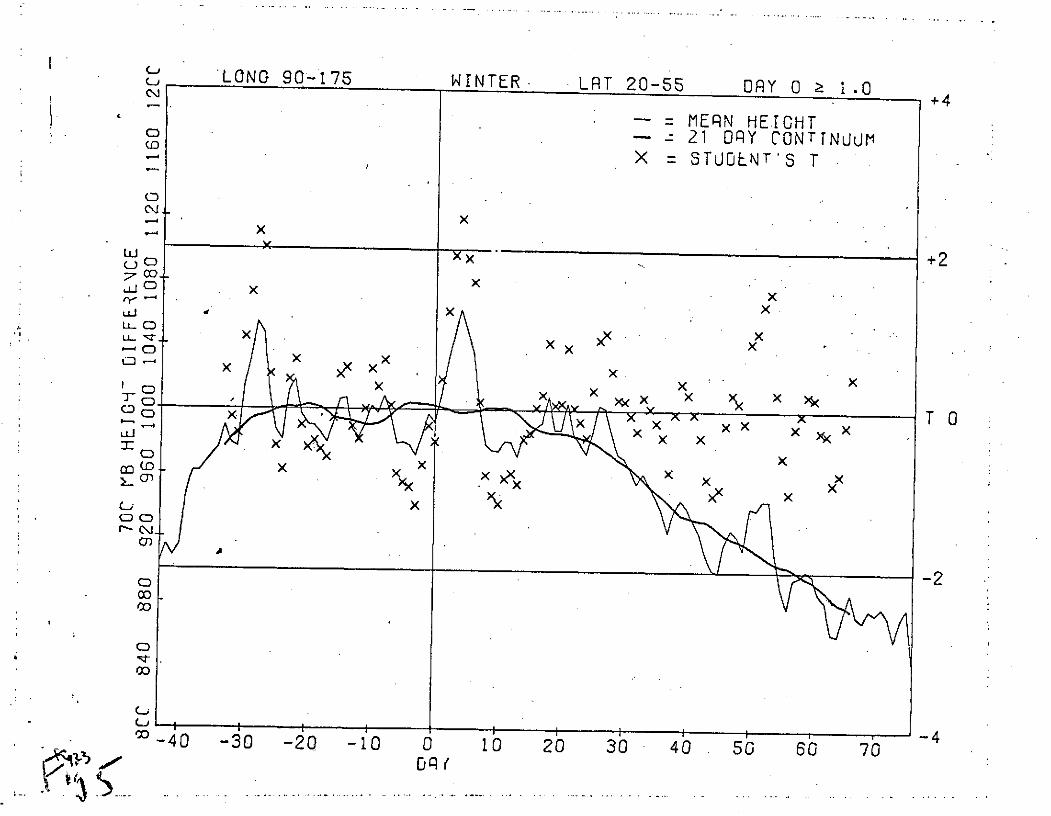
quadrant 90-175 W on phase-day 4 during winter. The appropriate
continuum height difference is 998 feet whereas the phase-day 4
difference is 1065 feet, corresponding to an increase of more than 7%0 or
-1to about 0.6 m sec increase in mean geostrophic wind (see Figure 5).
This is not a trivial increase in "wind" considering the width of.the
latitude belt 20-55 N.
5. Current Investigation - Synoptic Analysis
In order to elucidate more specifically the apparent increase of
the zonal wind in winter and summer, we undertake a northern hemisphere
synoptic analysis of the departures of the 700 mb contour heights from
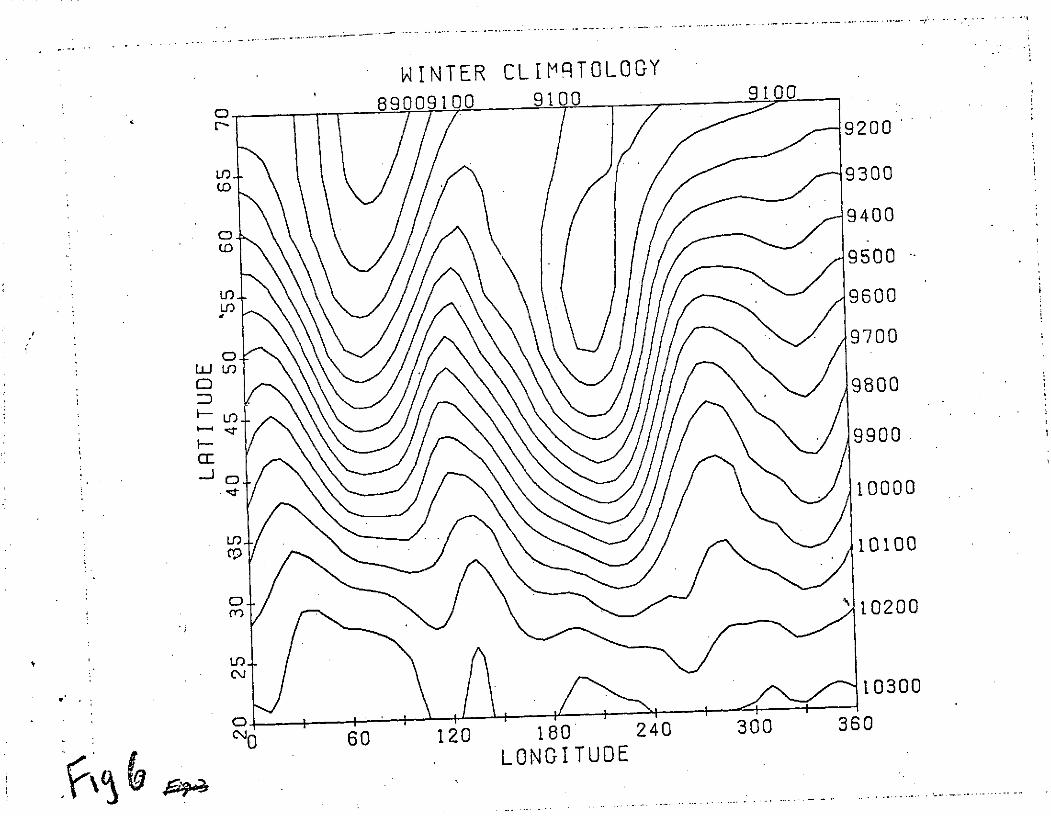
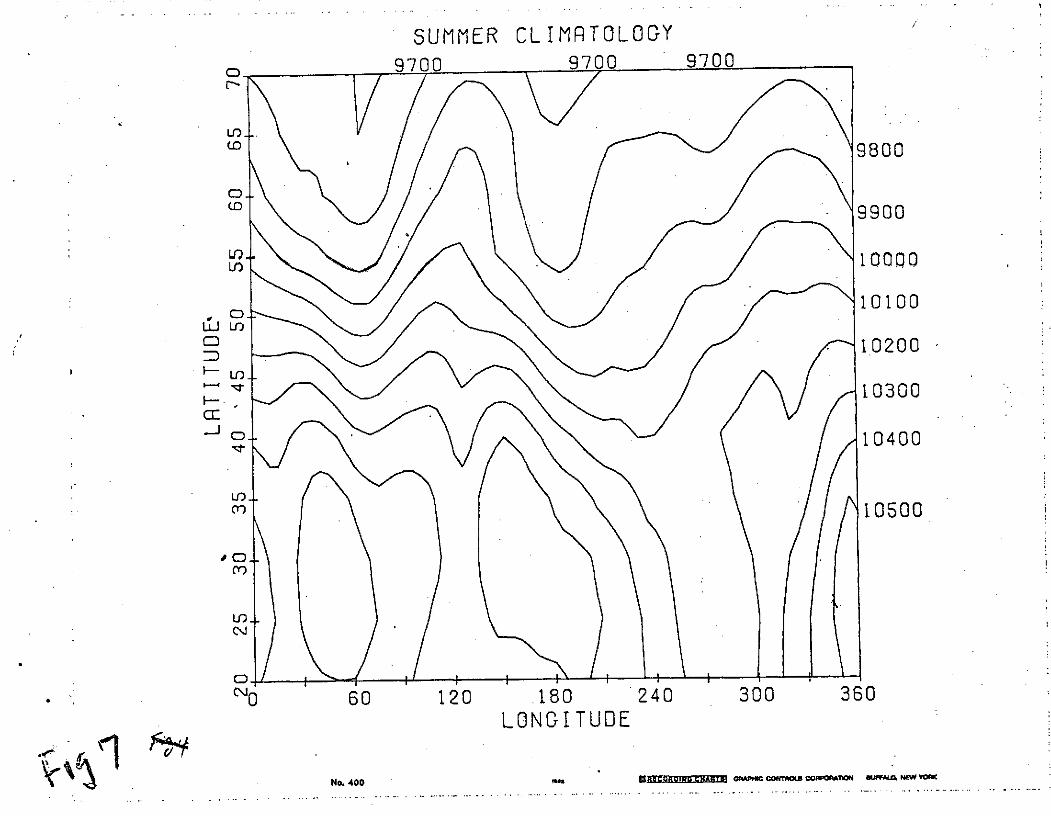
seasonal climatology before and after the disturbed key day. Figures 6 and 7
show the mean 700 mb contour heights (in feet) obtained from all winter
- 10-
and summer days respectively during the period 1947-1970, establishing
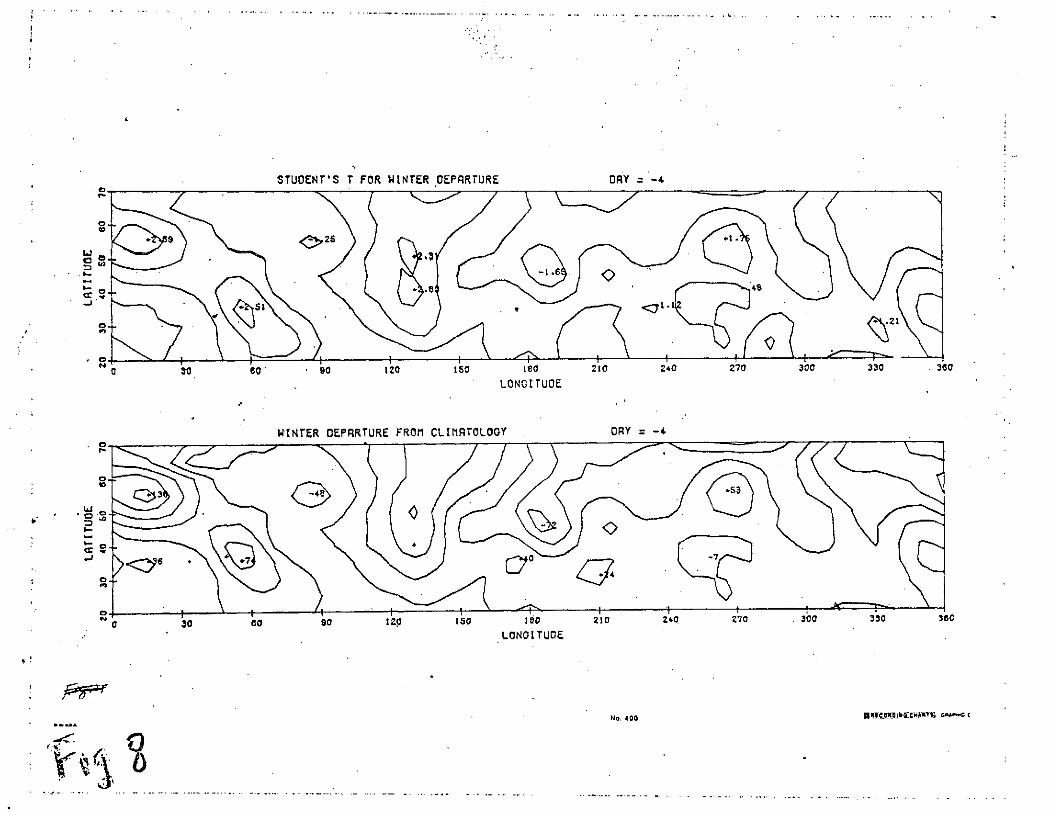
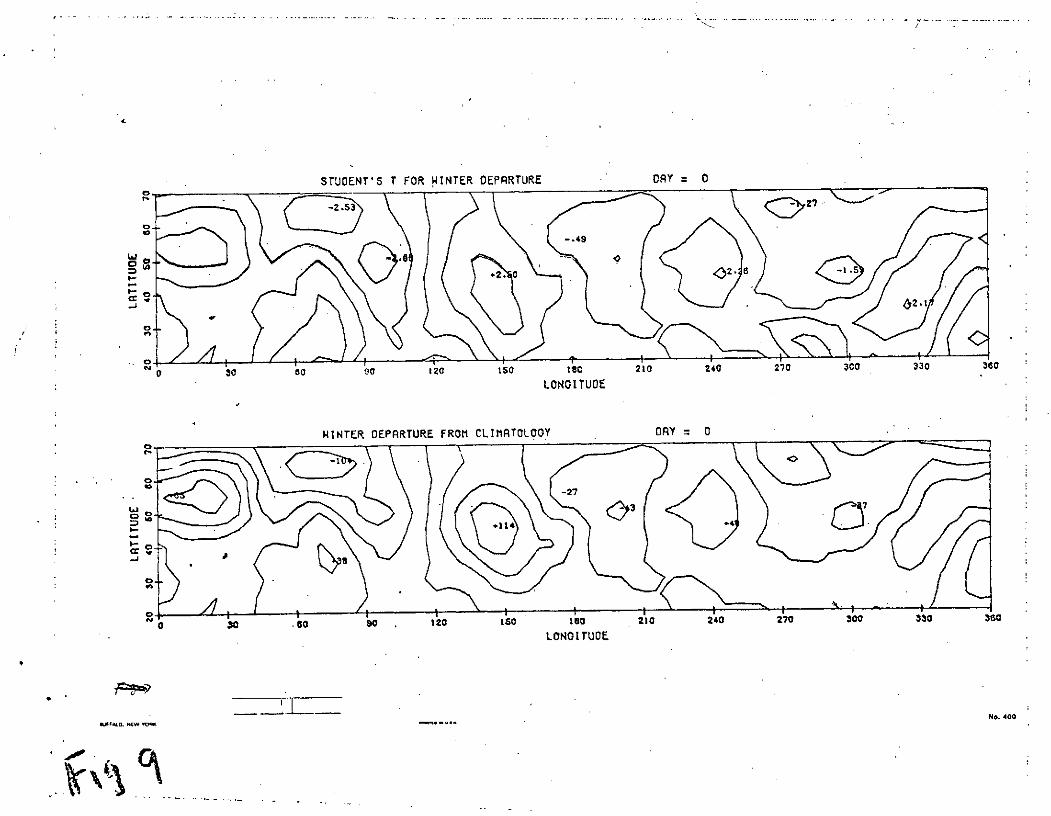
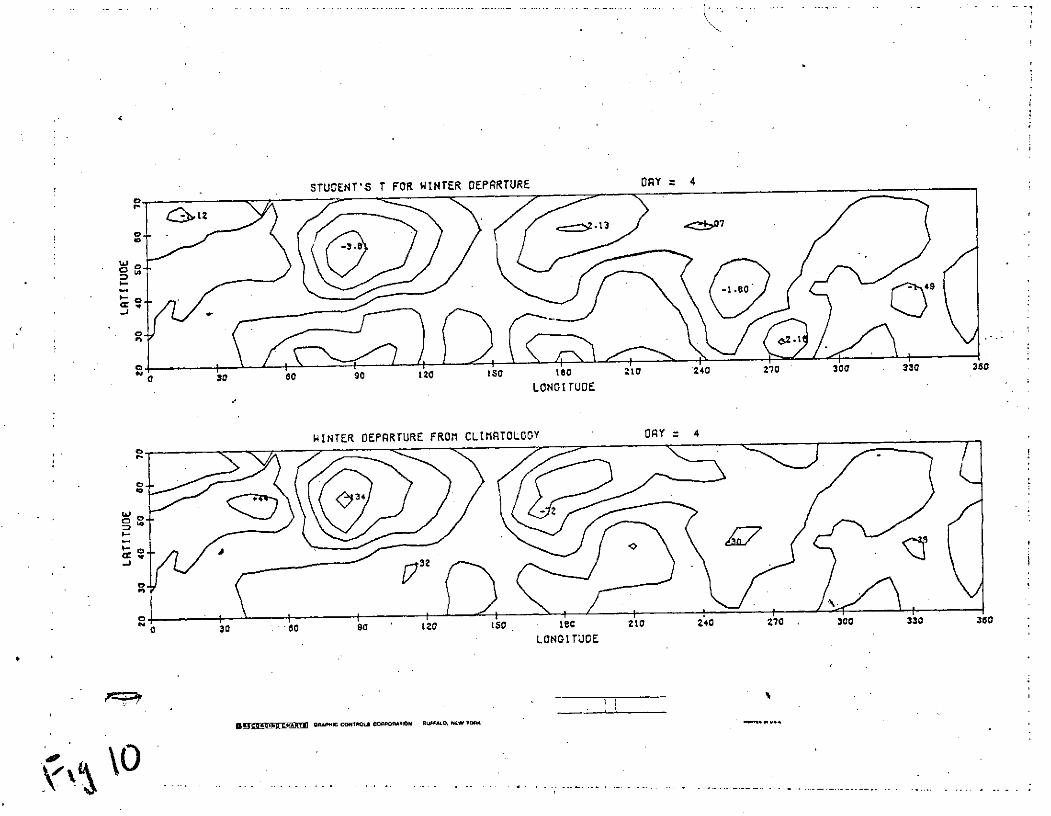
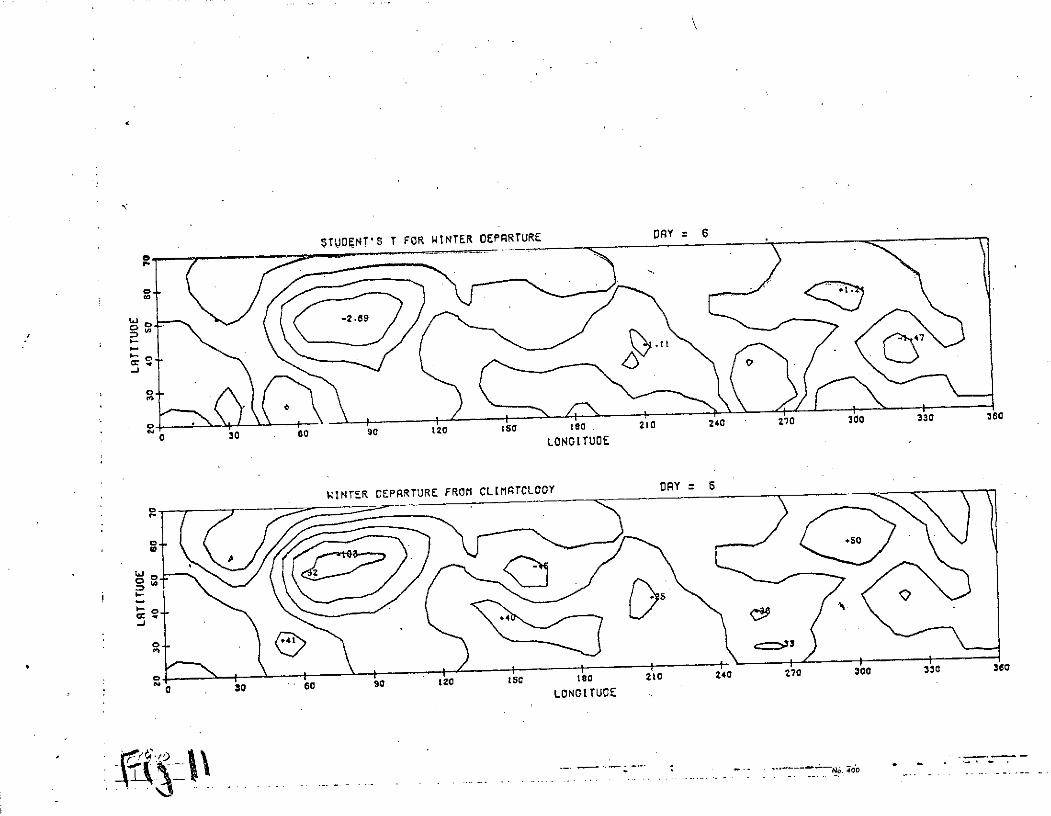
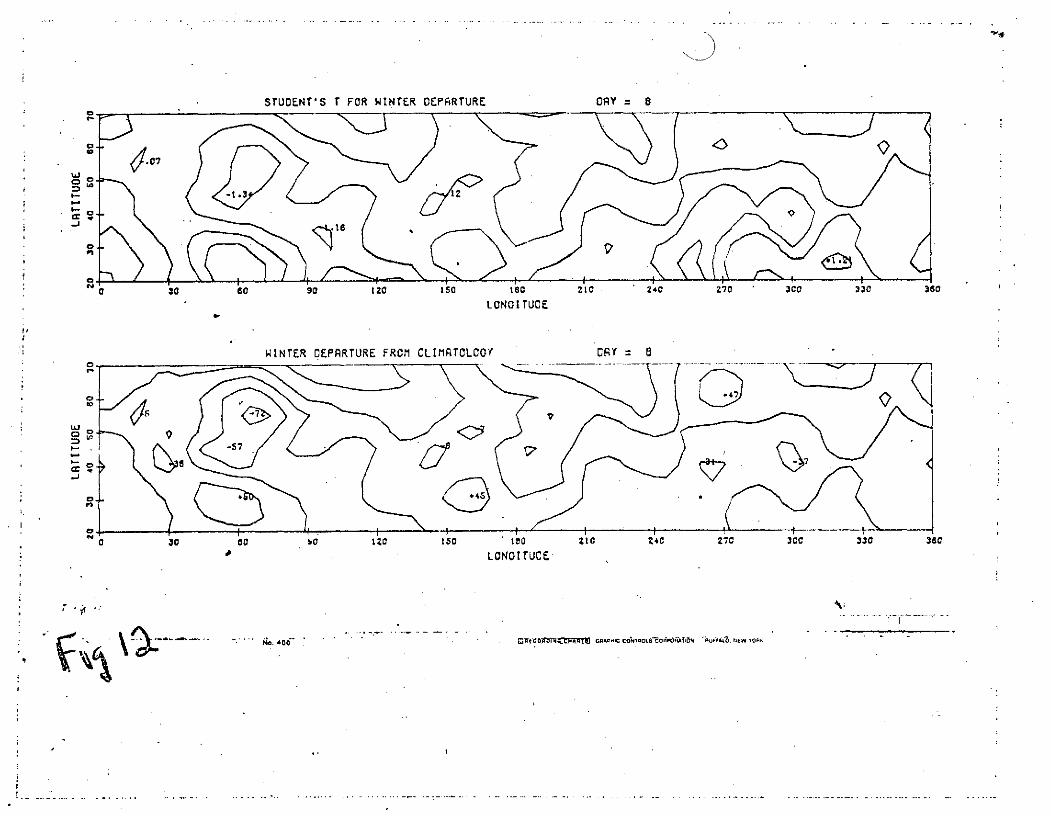
the seasonal climatology. Figures 8-12 show the winter synoptic development
of the departures of the 700 mb contour heights (in feet) from the winter
climatology (bottom curves) as well as in terms of the corresponding
Student's t (top curves) for the phase - days - 4, 0, 4,6, and-8, respectively.
For the winter sequence, we note that before and on phase-day 0, there
.are scattered and alternating centers of positive and negative departures
from climatology. Some of these departures, which represent averages
over 74 different days during the 24-year period, are relatively large,
both in terms of the magnitude of the departures and in terms of Student's
t. However, beginning almost immediately after day 0, the departures
begin to be organized so that the negative departures tend to be
concentrated between latitudes 40 - 60 N and the smaller positive
departures tend to move toward lower latitudes. This process reaches
its maximum development on phase-day 4 and then begins to decay. On
phase-day 4, there is a large depression of contour height centered
near 90 W and 55 N. This is situated just west of the trough line
located between 60 and 90 W on the winter climatology map (Figure 6).
It is perhaps only coincidental that 90 W is near the longitude of most
southerly extension of the geomagnetic latitudes and might therefore
be where corpuscular radiation penetrates farthest south in the earth's
.atmosphere. By the time phase-day 8 arrives, the character of the
• departures of 700 mb contour height from the winter climatology have
become rather small and disorganized, and similar in overall character
-11-
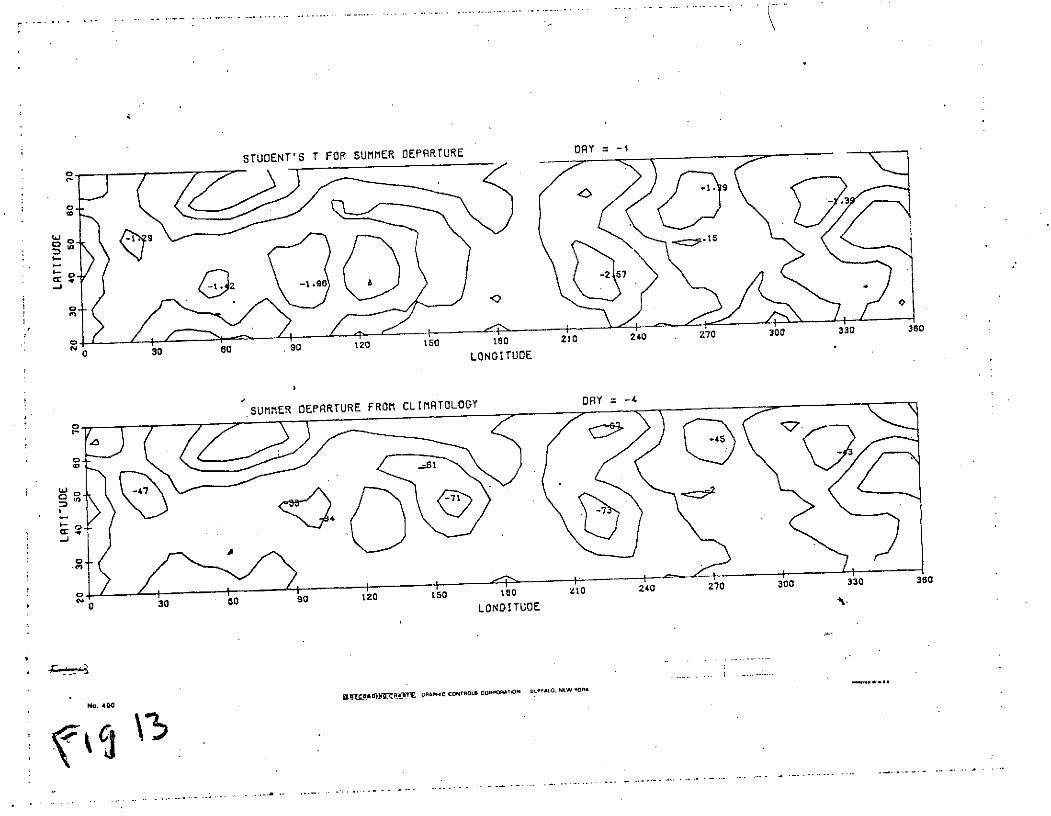
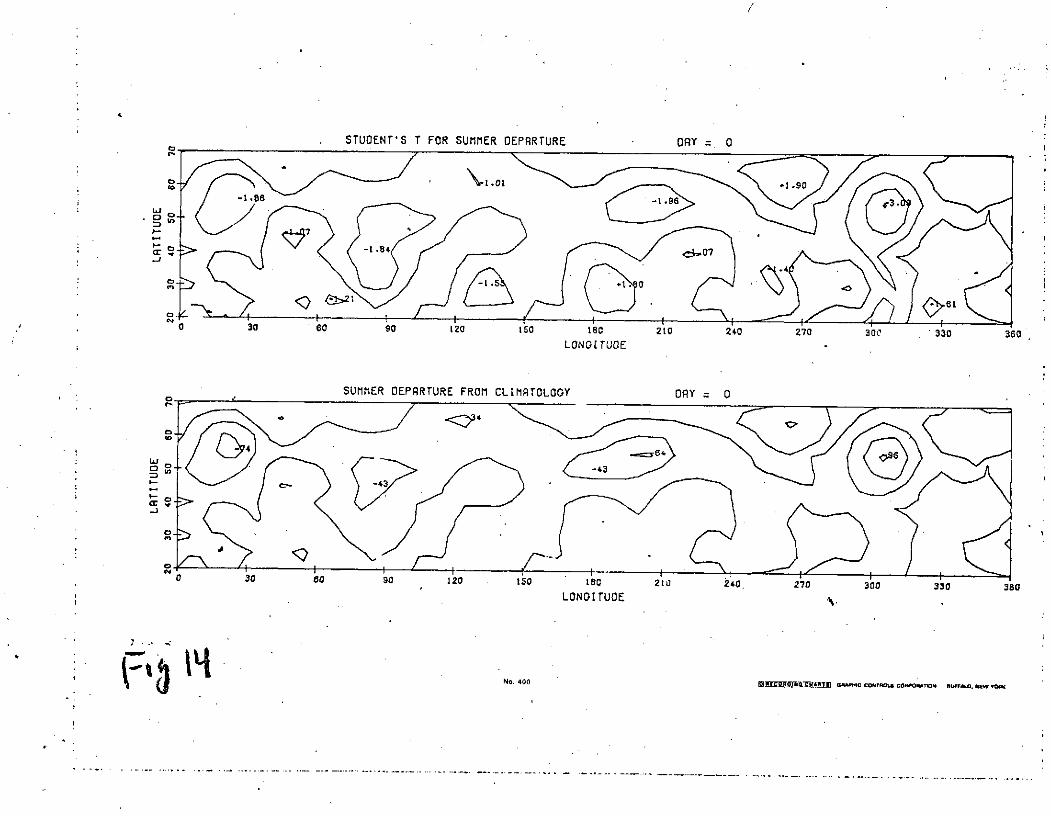
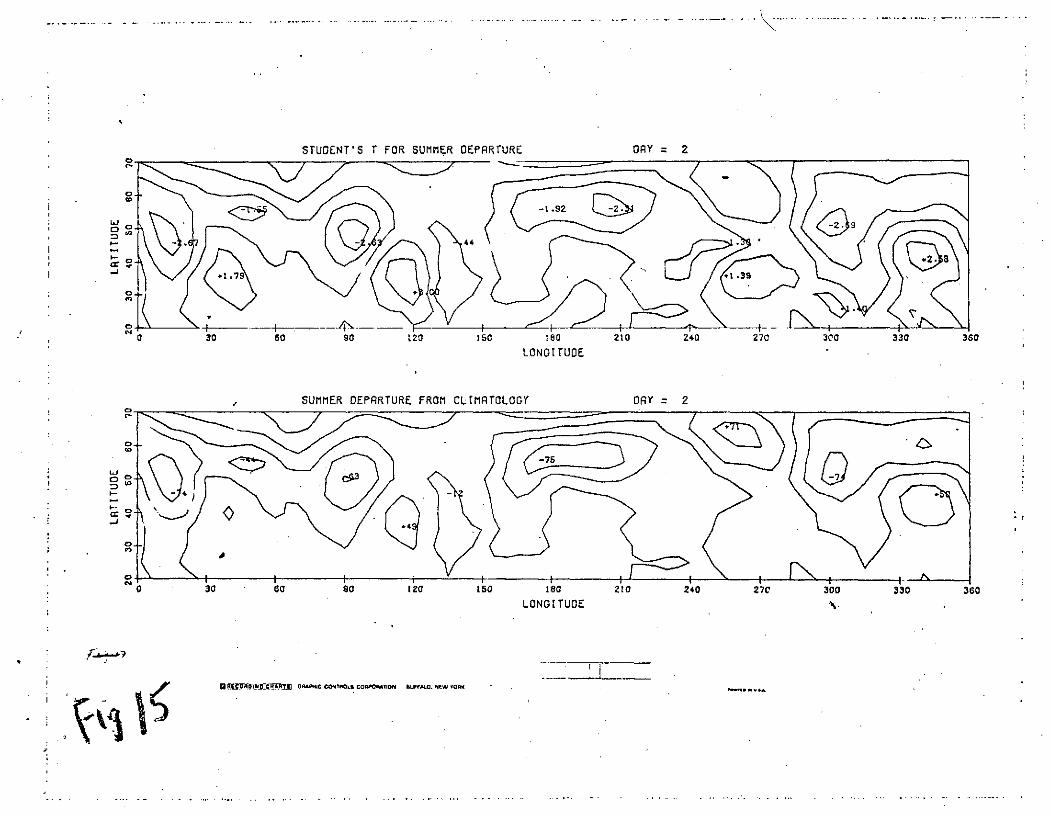
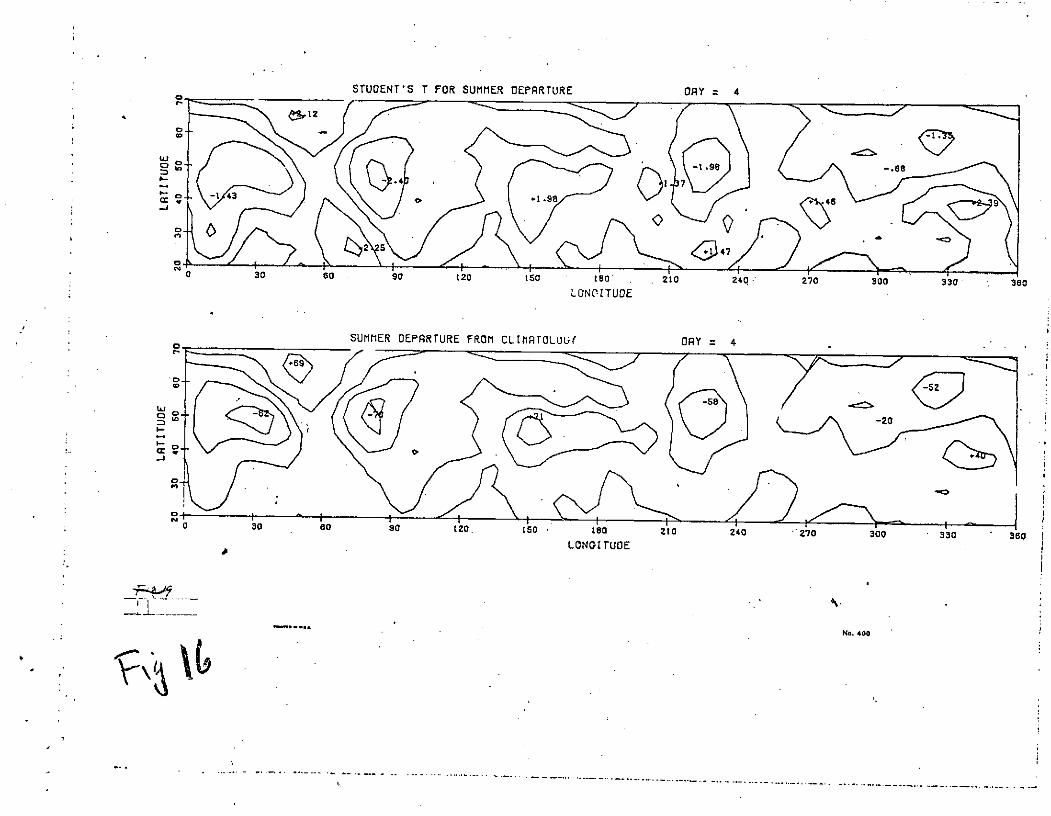
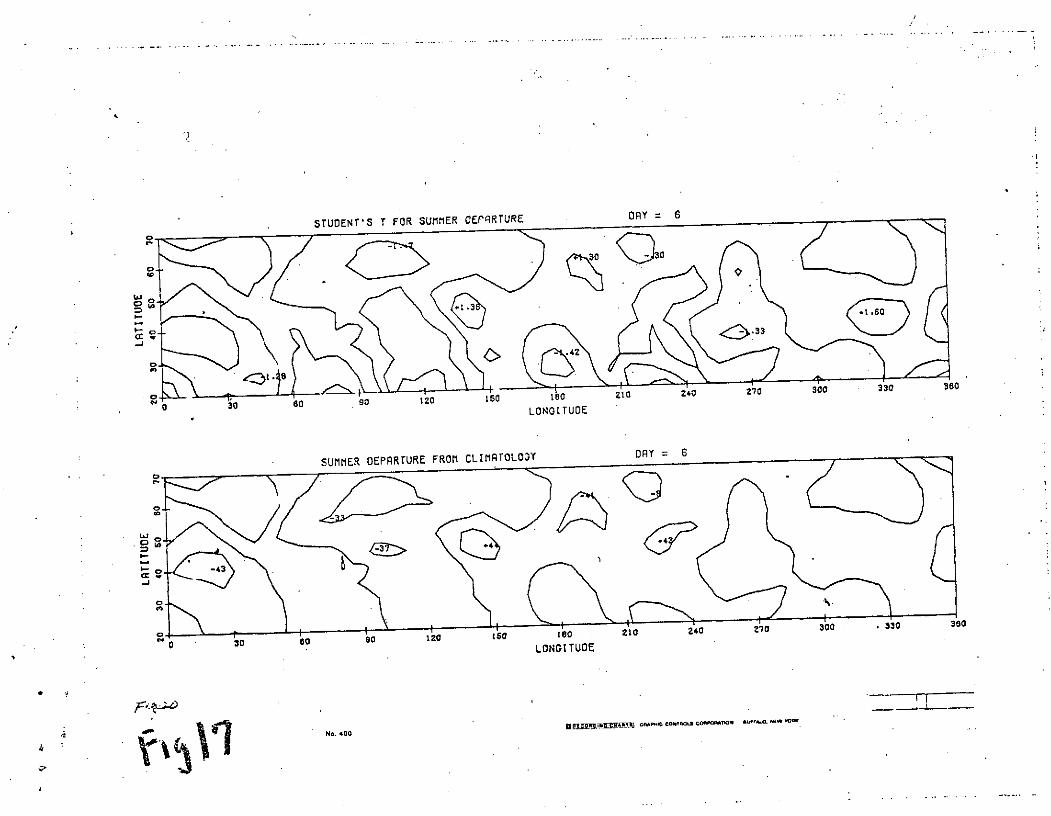
to the phase-days before day 0. Figures 13-17 show the summer synoptic
development of the departures of the 700 mb contour heights (in feet)
from summer climatology (bottom curves) as well as in terms of the
corresponding Student's t (top curves) for the phase - days - 4, 0, 2, 4, and 6,
respectively, so selected because of the more rapid development. On day - 4,
there are a number of small isolated centers. Although these centers
are mostly negative, there are some positive centers at the higher
latitudes. However, on day 0, there is an appreciable growth and organization
of these negative centers in the latitude belt 50 - 60 N. This growth
reaches its maximum development on phase-day 2 and then decays
rapidly. On phase-day 4, there are two sizeable positive centers,
interspersed among the ne-gative centers in the middle latitude belt
(40 - 60 N). Phase-day 6 with a scattering of small positive and negative
cells has a quasi-random appearance.
6. Summary and Conclusions
Firm statistical evidence is presented which strongly suggests
the existence of a real relationship between solar-geomagnetic disturbance
and the subsequent behavior of the 700 mb contour height difference
between 200 N and 550 N. In winter, four days following geomagnetic
disturbance, there is a significant increase in the zonal index, or mean
zonal geostrophic flow. In summer, a less prominent But statistically
.significant increase in the zonal index is found two days earlier. The
effect is most prominent in winter in the quadrant 90 - 175 W and
corresponds to a 7%0 increase in the mean westerly flow. Synoptic
- 12 -
analyses of the departures of the mean 700 mb contour heights from
seasonal climatology following geomagnetic disturbance reveal that the
effect proceeds with the growth and development of large negative centers
in the latitude belt 40 - 60 N and smaller positive departuresat lower
latitudes. Although no acceptable physical mechanisms are available to
explain the observations, further statistical studies may lead to a
better physical understanding and hopefully may contribute one day to
weather forecasting.
Acknowledgments. The authors would like to acknowledge with thanks
the considerable efforts of Donald Aiken in supervising the computations.
HLS wishes to thank Dr. Robert Jastrow for his hospitality at the Goddard
Institute for Space Studies. The research was supported in part by the
National Aeronautics and Space Administration under Contract NSG 197-62
and by the City University of New York Faculty Research Award Program.
- 13-
REFERENCES
Kubyshkin, V. V., Solar activity and pressure variations in the troposphere.
Astron. Zh., 42, 784-797 (Soviet Astron. -AJ, 9, 606-616), 1965.
Kubyshkin, V. V., The distribution of solar-tropospheric disturbances over
the earth's surface. Astron. Zh., 43, 374-384 (Soviet Astron.-AJ,
10, 295-303), 1966.
Mustel, E.R., The influence of solar activity on the troposphere in the polar
cap regions. Astron. Zh., 43, 365-373 (Soviet Astron.-AJ, 10,
288-294), 1966.
Mustel, E.R., Data on corpuscular streams used for the study of solar-
atmospheric relationships. Astronomicheskiy Sovet, Akademii
Nauk SSSR, Nauchnyye Informatsii Vyp. 10, 39-63, 1968.
Mustel, E.R., On the circulation changes in the lower layers of the
atmosphere after the penetration of a solar corpuscular stream
into the earth's magnetosphere. Astronomical Council, Akademii
Nauk SSSR, IUCSTP, Leningrad, 36-66, 1970.
Mustel, E.R., V.V. Kubyshkin, and I.V. Bonelis, Corpuscular streams
and cosmic rays of solar origin and their influence on the troposphere.
Astron. Zh., 42, 1232-1249 (Soviet Astron. -AJ, 4, 957-970), 1965.
Roberts, W.O., and R.H. Olson, Geomagnetic storms and wintertime
300 mb trough development in the North Pacific - North America
area. J. Atmos. Sci., 30, 135-140, 1973.
-14-
REFERENCES (cont...)
Saruldkanyan, E.I., and N.P. Smirnov, Solar Activity, earth's pressure
field, and atmospheric circulation. Geomag. and Aeronomy, i0,
390-392, 1970.
Shapiro, R., Further evidence of a solar-weather effect. J. Meteor.,
13, 335-340, 1956.
Shapiro, R., A comparison of the response of the North American and
European surface pressure distributions to large geomagnetic
disturbances. J. Meteor., 16, 569-572, 1959.
Shapiro, R., A test of an apparent response of the lower atmosphere to
solar corpuscular radiation. J. Atmos. Sci., 29, 1213-1216, 1972.
Shapiro, R., Reply. J. Atmos. Sci., 30, 741-744, 1973.
Stolov, H.L., and J. Spar, Search for tropospheric responses to chromospheric
flares. J. Atmos. Sci., 25, 126-132, 1968.
Stolov, H. L., and R. Shapiro, Further investigations of alleged tropospheric
responses to chromospheric flares. J. Atmos. Sci., 26,
1355-1359, 1969.
Stolov, H. L., and R. Shapiro, Report on an investigation of solar corpuscular
influences on the general circulation. IUGG Symposium on
Solar Corpuscular Effects in the Troposphere and Stratosphere,
Moscow, 1971.
-15-
Figure Legends
Fig. 1. Daily differences of the mean zonal 700 mb contour heights around
latitudes 20 and 55 N shown separately for the four seasons from
33 days before to 66 days after the Ci key days presented in terms
of the Student's t-value corresponding to the departure of each
phase-day mean from its continuum value.
Fig. 2. Daily differences of the mean 700 mb contour heights along 20 and
55 N for winter and summer, separated into quadrants and pre-
sented as in Fig. 1.
Fig. 3. The mean height differences (in feet) of the 700 imb surface between
20 N and 55 N for the entire hemisphere in winter from 33 days
before to 66 days after the Ci key days. The 21 day continuum is
shown by a dark line. Student's t-values, corresponding to the de-
partures of each phase-day mean from its continuum value, are also
shown.
Fig. 4. Same as Fig. 3 but for the entire hemisphere in summer.
Fig. 5. Same as Fig. 3 but for the quadrant 90-175 W in winter.
Fig. 6. Mean 700 mb contour heights (in feet) obtained from all winter days
during the period 1947-1970 running west from 0o to 3600.
Fig. 7. Mean 700 mb contour heights (in feet) obtained from all summer days
during the period 1947-1970 running west from 0o to 3600.
Fig. 8-12. Departures of the 700 mb contour heights (in feet) from winter clima-
tology as well as in terms of the corresponding Student's t for the
-16-
Figure Legends
phase days -4, 0, 4, 6 and 8 respectively.
Fig. 13-17. Departures of the 700 mb contour heights (in feet) from
summer climatology as well as in terms of the corresponding Student's t
for the phase-days -4, 0, 2, 4, and 6 respectively.
-17-
STUDENT'S T -LATITUDES(20-551
MIEAN 700 MIB HEIGHT DIFFERENCE - LONGITUDE RflNGE!1O-355)
Id,
C
Q1 +10 120 +20 +40 +0 +0+6
WINTER 0M MXXM x EMM m x N ~cr)
x
C
+2.
SPR ING 0,.xM,..- E ~ xx MM NMX MM M..Xm .xxxx~x~x~xxxx~xxmx.
Cr) x2 xXXw x x xx . X
SUMMIER 0M -X.M MU. Mxwx MMM MEx M ... MxM M M MM MM MMXXX
K X x
* ' +2MMM M
o: FALL 0 M' M.. M MXM mMM. MENU nM *~mm .X MMx~p- -x - .-
-33 -30 -20 -10 0 + 0 +20 +30 +40 +50 +60 +66DRY
~. fli~tIn 00 -Nl- l W

STUDENT'S T - LATITUOES(20-55]MERN 700 MB HEIGHT DIFFERENCE
WINTERLONGI TUDE-333-30 -20 -10 0 +10 +20 +30' +40 +50 +60 +66
0 I-- I-+2
-2
90-175 O x w0 ' X x x x X X
LI) -2
+2+2 x xx x x x
270-355 0 a. . x x X .x m X w. . . Xw -2
SUMMERI-
0-65 X -X XX x
x x" X x xxx X XX
-21x.-
• 980-175 , .. ..... "...... .. .n , "" _, .. .90-175 + X x Xx X xC x x . K xXX - x XX X X x x X X X
- 2 1 'X
S- - X X w XXX x X x XX Xm
2 xx x xW
xx xxh
2 0 5 xx X 5XX 5x - x x *r XX X .xX. xXXX
xI |X x x I x x X
-33-30 -20 -10 0 +10 +20 +30 +40 +50 +60 +66
LONGITUDE DRYf, .z
o. LONG 0-355 WINTER LRT 20-55 ORY 0 > 1.0e -+4
- MERN HEIGHTo - = 21 DRY CONTINUUM
X = STUDENT'S T
. xOX
0 +2oz - x..
LL x x
LX x x x X XX x
SXx x x xT 0
- x0 Xx x x xCD X x X x x
-- X x X)
-20 .
S-40 -30 -20 -10 0 1 20 30 40 50 60 701RY
* LONG 0-355 SUMMEIR LRT 20-55 DRY 0 1.0-+4
SMEAN HEIGHTC - = 21 DRY CONTINUUM
* X = STUDENT'S T
uW +2
0
o
-0 x xLcD x xXX
X X XXSx x x. xr0 x xx x x x x x x
XXX(c) J xW v x T 0
C xx x x x X X
xXX
OO
-2C.-
SI I I-4. -40 -30 -20 -10 0 10 20 30 40 50 60 70
LONG 90-175 WINTER LRT 20-55 DRY 0 1.0+4
- = MERN HEICHTS- - 21 DRY CONTTNUUM
X = STUDENT'S T
N
- - x
, - x X
0..4 X* X X
X X
' "x x xCD x x T x x
I .X X X
. X X X XX-X X
0 X X
O-2
= x x T O
C OS-2Co
S-4
-40 -30 -20 -0 0 i0 20 30 40 5b 60 70DR(
WINTER CLIMrTOLOGY
a 89009100 9100 9100
0 9200
9300
9400
9700
L.D 9800
S / 9900cc
Soooo000
10100
co 10200
C\l10300
c0 60 120 180 240 300 30
LONGITUOE
SUMMER CLIMRTOLOGY
o 9700 9700 9700
S9800
0.(o S9900
, 10000
10100
D 10200In
10300CD
0 10400
10500
)0.
. l
*0 60 120 180 240 300 360
LONGITUDE
No. 400 x UT r W C orapIc cotls coWo Taa m Ua NeW vOW
STUDENT'S T FOR WINTER OEPARTURE DRY =-4
25
-- 4
S30 60" 90 120 150 tIoa 210 240 270 300 0 360
LONGI TUOE
WINTER DEPARTURE FROM CL[MRTOLOGY ORY = -4
w
0 3 0 0 S 12 15o0 Io 210 240 270 . 300 330 3c
LONGI TUDE
No. 400 itb0l Y)lI G-C C(
I 2 .....
STUDENT'S T FOR WINTER DEPARTURE DAY = 0
."~* 2.0 -~
0
0 30 60 90 120 150 180 210 240 270 300 330 360
LONGITUDE
NINTER DEPARTURE FROM CLIMATOLOGY DAY =0
-27
cc11
Ss .0 120 0 100 210 240 270 300 330 3
LONG ITUDE
No. 400vkff. Ntw EWe
STUDENT'S T FOR WINTER OEPRRTURE DAY 4
1.
I-i
a 30 60 90 120 150ISO 1O 240 270 00 30 360
tw -.
LONGITUDE
WINTER DEPARTURE FROM CLIMATOLOGY ORY = 4
STUONT'S T FOR WINTER OEPARTURE DR 6
-J
30 60 90 120 150 180 210 240 270 300 330 360
LONGITUOE
WINTER OEPRRTURE FROM CLIMATCLOGY ORY = 6
Co 50
rJ
0 "60 so 120 ;So 180 2tO ?.0 ?0 3100 so3 3s
LONGITUE
4ley
STUDENT'S T FOR WINTER DEPARTURE RY =8
-- 1.3
S30 60 90 120 150 10 210 240 270 00 330 380
LONGITUOE
WINTER DEPARTURE FROM CLIMATOLOGY CRY = 8
o. .
a 30 0 $,O Iz; 150 tea 210 2z0 270 3c 330 380
+ LONGITUCE-
... ... o. ." T.. . . . .I---ir. .AA IC CdNToLS"o-6P6i N ".UFf..-.O. .E.N -
STUOENT'S T FOR SUMMER DEPARTURE OY = -
e.*
-o 257
03 .8 12 1z0 180 2240 270 300 330 3500 30 60 so90 120 50 T180 210 240 270 3 3
LONGITUDE
SUMMER DEPARTURE FROM CLIMATOLOGY DY -4
C2.t 240 270 300 330 360
S30 60 90 LONITUOE
gNOO r00A cmaC CONpOs CopanarON BUFALO . kw lo".
STUDENT'S T FOR SUMMER OEPARTURE DAY = 0C4
-1.86 -1.96
c C. t
30 60 90 120 1SO 180 210 240 270 30 . 330 360LONG0TUOE
SUMMER DEPARTURE FROM CLIMATOLOGY DRY = 0
..... ..-.
C -43
SIic- - 03-J
0 30 60 90 120 I SO0 ISO 210 240 270 300 330 360LONOiTUOE
No. 400 eAc. CONTROLS CORORTO N SUCFAL. kW TOM
STUDENT'S T FOR SUMMER DEPARTURE DAY = 2
0 30 60 90 t20 150 180 210 240 270 300 330 360
LONOI TUOE
SUMMER DEPARTURE FROM CLIMATOLOGY DAY 2
Li -76
o 30 60 90 120 150 180 210 240 270 300 330 360
LONGITUDE %.
Rf.l WjM O"PWCAMa CONTROLS CO PORATION BuFFALO. NEW YORK
.e -. . . .. . .
STUOENT'S T FOR SUMMER DEPARTURE DRY 4
" 6
-85 o *1.98
0 30 60 90 120 150 180. 210 240 270 300 330 360LONITUOE
SUMMER OEPARTURE FROM CLIMATOLJGY ORY 4
LONGITUDE
No. 400
l-
ci. . .. ... ,%
No.40
STUOENT'S T FOR SUMMER OEPrQRTURE DAY = 6
S33
0 30 60" 90 120 150 1 Zi 240 270 300 . 330 360
00 604 LONGITUDE
SUMMER DEPARTURE FROM CLIMATOLOGY DRY = 6
a V
C 1 2400 0 a 330 300
0 30 0 o o90 120 L50 ISO 20 20 70 300 3
LONGITUDE
No. 400o o coo oo * . O(W O