Embed Size (px)
Citation preview
1 FSA Meat Hygiene Controls
NAO Efficiency Review Food Standards Agency – The Delivery of Meat Hygiene Official Controls 30 May 2013

2 FSA Meat Hygiene Controls
The National Audit Office (NAO) scrutinises public spending for Parliament and is independent of government. This
document was prepared by the NAO for the Food Standards Agency under Terms of Reference agreed in January 2013. Our
findings are based on representations and data provided by the Food Standards Agency, and representations by
interviewees from other organisations, and we are grateful to each for their assistance. The data included within the
document, and analysis performed by the NAO on the basis of these, was provided by the Food Standards Agency solely for
the purpose of this document. We did not validate the data provided, beyond checking that it was internally consistent.
The document was produced by the NAO’s Regulation, Consumers and Competition team, which specialises in audits and
reviews of regulators and of government departments that implement regulations. The NAO study team consisted of: Simon
Banner, Elena Bechberger, Martin Malinowski, Ivan O’Brien, Anna Sydorak-Tomczyk and Peter Grummitt, under the direction
of Alex Scharaschkin. Find out more about the work of the Regulation, Consumers and Competition team at:
http://www.nao.org.uk/search/type/report/sector/regulation-consumers-and-competition
For further information about the National Audit Office please contact:
National Audit Office
Press Office
157-197 Buckingham Palace Road
Victoria,
London
SW1W 9SP
Tel: 020 7798 7400
Email: [email protected] Website: www.nao.org.uk Twitter: @NAOorguk

3 FSA Meat Hygiene Controls
Glossary of key acronyms used
Acronym Meaning
FSA Food Standards Agency
MHS Meat Hygiene Service
GB Great Britain
NI Northern Ireland
DEFRA Department for Environment Food and Rural Affairs
DARD Department of Agriculture and Rural Development
LV Lead Veterinarian
OV/VO Official Veterinarian (in GB; Veterinary Officer in NI)
MHI Meat Hygiene Inspector
PIA Poultry Inspection Assistant
CPLU Cost Per Livestock Unit
HPLU Hours Per Livestock Unit
IUWT Idle Unworked Time
FBO Food Business Operator

4 FSA Meat Hygiene Controls FSA Meat Hygiene Controls
4
Executive Summary
The Food Standards Agency has considerably reduced the costs of official controls over the last few years, mainly through reductions of both operational and back-office staff. The potential for achieving further savings through this approach is limited and there would be increasing risks to the quality of inspections provided, but there is some scope for
further incremental savings through operational improvements. The wide variation in inspection efficiency across Food Business Operators (FBOs) shows a large potential for further savings, but the FSA has limited influence on this due to the strong interdependency of inspection time and costs with FBO operations and technology, and a charging
system which does not incentivise efficiency. Therefore a step change in efficiency can only occur through more effective engagement between the FSA and other stakeholders, and a more integrated and strategic approach to pursuing, incentivising and measuring efficiency.
Key
Messages Summary of evidence & findings
1. How efficiency is defined is important
2. FSA has variable influence over
efficiency factors
The FSA has a strategic objective of efficiency through a risk-based and proportionate system of regulation, but links between this and its intermediate 2015 cost savings target are unclear
• Improving efficiency can either mean using fewer inputs for the same outputs/outcomes, or doing/achieving more with the same inputs • FSA’s efficiency objective is a cost savings target (to save £5m by 2014/15 against a 2010/11 baseline of £55.5m costs to industry) as part of its
wider ambition to deliver EU regulations at minimal cost • It uses Cost per Livestock Unit (CPLU) as its formal indicator of efficiency, which links costs and activity levels well, alongside a wider basket of
measures • ‘Efficiency’ is not an explicit strategic objective, but FSA told us that it is a key internal objective which it pursues through its ‘proportionate and
risk-based’ objectives and work to improve compliance
FSA’s influence over the factors impacting its efficiency varies widely, largely due to the strong interdependencies of its operations with those of FBOs and its lack of direct control over the legal framework and charging/discount system; it is developing its approach to influencing these factors more strategically
• Many factors affect FSA’s efficiency and it has variable influence over these • The FSA has little if any influence over some factors affecting efficiency such as industry structure and seasonal factors • The FSA has considerably more influence over matters such as its own internal organisational structure, staffing numbers and roles, and in its
choices about use of contractors, and has generated cost savings through actions in these areas. • There are other factors where the FSA has relatively less, but still some influence, and where there is potential to achieve further savings. Most
of these factors depend on FSA engagement with others to unlock this potential: for example, engaging with FBOs and industry on how the total charges borne by industry could be restructured to improve efficiency incentives; and engaging with staff and unions on flexible working. In some of these areas the FSA has done less, and could be more proactive and engage more effectively with others.
5 FSA Meat Hygiene Controls FSA Meat Hygiene Controls 5
Executive Summary
Key
Messages Summary of evidence & findings
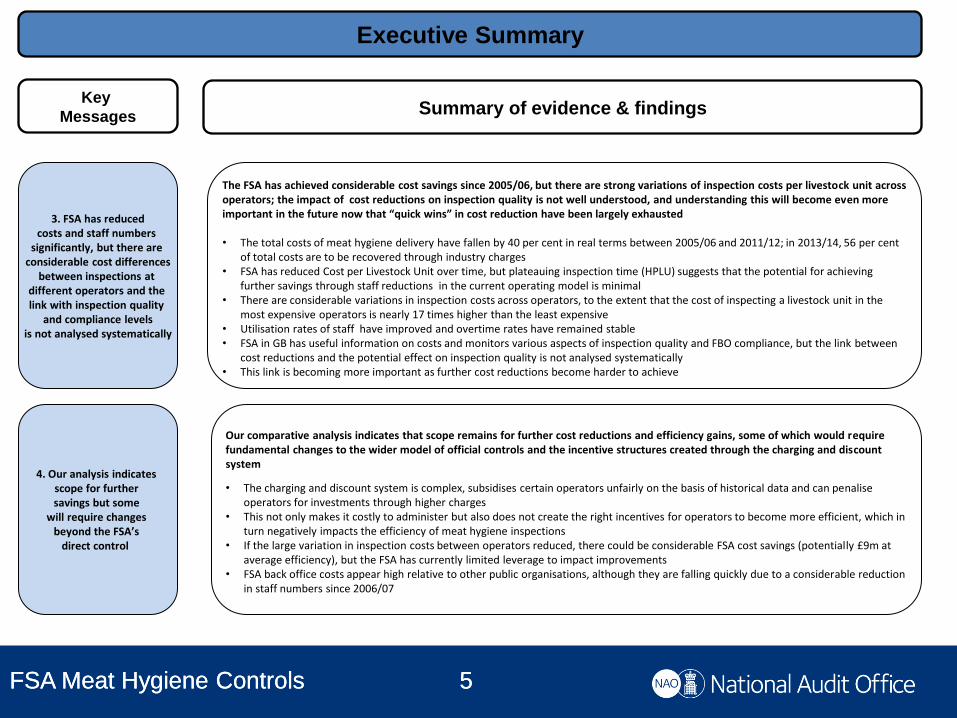
3. FSA has reduced costs and staff numbers
significantly, but there are considerable cost differences
between inspections at different operators and the link with inspection quality
and compliance levels is not analysed systematically
4. Our analysis indicates scope for further savings but some
will require changes beyond the FSA’s
direct control
The FSA has achieved considerable cost savings since 2005/06, but there are strong variations of inspection costs per livestock unit across operators; the impact of cost reductions on inspection quality is not well understood, and understanding this will become even more important in the future now that “quick wins” in cost reduction have been largely exhausted • The total costs of meat hygiene delivery have fallen by 40 per cent in real terms between 2005/06 and 2011/12; in 2013/14, 56 per cent
of total costs are to be recovered through industry charges • FSA has reduced Cost per Livestock Unit over time, but plateauing inspection time (HPLU) suggests that the potential for achieving
further savings through staff reductions in the current operating model is minimal • There are considerable variations in inspection costs across operators, to the extent that the cost of inspecting a livestock unit in the
most expensive operators is nearly 17 times higher than the least expensive • Utilisation rates of staff have improved and overtime rates have remained stable • FSA in GB has useful information on costs and monitors various aspects of inspection quality and FBO compliance, but the link between
cost reductions and the potential effect on inspection quality is not analysed systematically • This link is becoming more important as further cost reductions become harder to achieve
alternatives
Our comparative analysis indicates that scope remains for further cost reductions and efficiency gains, some of which would require fundamental changes to the wider model of official controls and the incentive structures created through the charging and discount system
• The charging and discount system is complex, subsidises certain operators unfairly on the basis of historical data and can penalise operators for investments through higher charges
• This not only makes it costly to administer but also does not create the right incentives for operators to become more efficient, which in turn negatively impacts the efficiency of meat hygiene inspections
• If the large variation in inspection costs between operators reduced, there could be considerable FSA cost savings (potentially £9m at average efficiency), but the FSA has currently limited leverage to impact improvements
• FSA back office costs appear high relative to other public organisations, although they are falling quickly due to a considerable reduction in staff numbers since 2006/07
• t variation driven by variation no cross-subsidy; costs of “inefficiency” borne by (i) taxpayer (mainly) and (ii) farmers – especially in NI Back office costs are high compared to “similar” public bodies; appears driven by staff numbers more than cost/head
6 FSA Meat Hygiene Controls FSA Meat Hygiene Controls 6
Executive Summary
Key
Messages Summary of evidence & findings
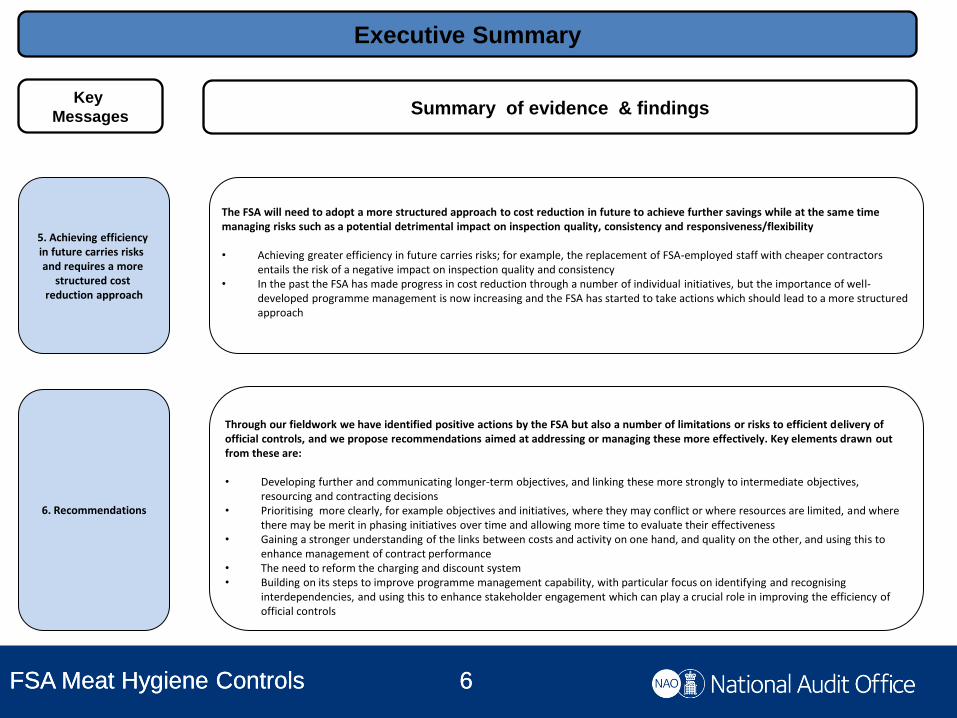
5. Achieving efficiency in future carries risks and requires a more
structured cost reduction approach
The FSA will need to adopt a more structured approach to cost reduction in future to achieve further savings while at the same time managing risks such as a potential detrimental impact on inspection quality, consistency and responsiveness/flexibility • Achieving greater efficiency in future carries risks; for example, the replacement of FSA-employed staff with cheaper contractors
entails the risk of a negative impact on inspection quality and consistency • In the past the FSA has made progress in cost reduction through a number of individual initiatives, but the importance of well-
developed programme management is now increasing and the FSA has started to take actions which should lead to a more structured approach
6. Recommendations
Through our fieldwork we have identified positive actions by the FSA but also a number of limitations or risks to efficient delivery of official controls, and we propose recommendations aimed at addressing or managing these more effectively. Key elements drawn out from these are:
• Developing further and communicating longer-term objectives, and linking these more strongly to intermediate objectives,
resourcing and contracting decisions • Prioritising more clearly, for example objectives and initiatives, where they may conflict or where resources are limited, and where
there may be merit in phasing initiatives over time and allowing more time to evaluate their effectiveness • Gaining a stronger understanding of the links between costs and activity on one hand, and quality on the other, and using this to
enhance management of contract performance • The need to reform the charging and discount system • Building on its steps to improve programme management capability, with particular focus on identifying and recognising
interdependencies, and using this to enhance stakeholder engagement which can play a crucial role in improving the efficiency of official controls

7 FSA Meat Hygiene Controls
Recommendations and supporting findings 1 (GB)
Findings Recommendations
1. Objectives
1.1 The FSA’s planning horizon currently extends to 2015, the end year of its internal target
to reduce costs by £5m. FSA management have not yet communicated a vision for efficiency
of delivery beyond 2015.
1.2 The FSA has a strategic objective of efficiency through a risk-based proportionate
system, but links between this and its intermediate objective (the 2015 target) are unclear.
a. The FSA should develop its horizon planning, so that it can always articulate a medium-term
vision for a minimum fixed period (say three years) ahead. As an example, some government
departments and sector regulators produce business plans for three years ahead. A clearer
articulation of its longer-term vision would help inform the steps it needs to take before then in
order to achieve that vision.
b. Since there is uncertainty about future developments such as European Union decisions, the
FSA could make use of scenario planning techniques to inform its longer-term vision.
c. The FSA should articulate more clearly what its strategic objective means in practical terms,
including a stronger link to its intermediate objectives.
2. Delivery model
2.1 The FSA has begun work on proposals for its future delivery model, but this is still in its
early stages.
d. The FSA should develop its proposals for its delivery model, linking these clearly to its
longer-term vision and its strategic and intermediate objectives.
3. Initiatives
3.1 Much of the legislative requirements administered by the FSA that FBOs must comply
with are established in EU law. Several interviewees considered that the FSA could be more
flexible in its interpretation of legislative requirements and compliance, which would reduce
both FBO costs and FBO demands for FSA resource.
e. The FSA should keep under review its existing interpretation of EU legislative requirements,
and take soundings across all stakeholders and across other member states, to identify
whether there are areas where an alternative interpretation could be made to improve efficiency
without adversely affecting quality.
4. Programme management
4.1 The progress in cost reduction that the FSA has made to date historically has been
through individual initiatives, rather than managing initiatives as a programme. As a result its
programme management capability is immature. It has however undertaken steps to start
addressing some of this immaturity, for example establishing a Change Portfolio Board, with
programme management specialist staff and an approved Strategy for programme
management.
4.2 The FSA has described to us a large range of initiatives it has started or proposes to
undertake in the next 12-18 months, across the spectrum of its meat hygiene official control
activities and beyond. This is a large number of initiatives to manage, and there are risks that
without careful management the benefits of these initiatives will not be fully realised, or that
business as usual activities may be adversely affected.
4.3 The importance of well-developed programme management is increasing now that “quick
wins” in cost reduction have been largely exhausted, and because of the wide range of
initiatives that the FSA is undertaking in the next 12-18 months.
f. The FSA needs to build on the initial steps taken in developing its programme management
capability. This development should be subject to regular review to ensure that capability is
improving towards the objectives set out in the terms of reference and strategy for the
programme management function.
g. The Change Portfolio Board should review the range of initiatives currently proposed for the
next 12-18 months, and assess whether some initiatives should be prioritised, with others
deferred to beyond the short-term horizon. This review will require careful consideration of the
costs, benefits, achievability and risks of proposed initiatives, and the interdependencies
between initiatives and their fit with the FSA’s vision and strategic objectives.

8 FSA Meat Hygiene Controls
Recommendations and supporting findings 2 (GB)
Findings Recommendations
5. Structures and roles, skills and resourcing
5.1 The FSA introduced a new field management structure from April 2012 and told us this
has reduced the number of roles and costs within the organisation. FSA interviewees pointed
to a degree of duplication in some roles and that decision-making can be slow. The FSA is
preparing to undertake reviews of structures and roles, partly to address these points.
5.2 The Capability Review identified that the FSA does not yet have a resourcing model.
5.3 The age profile of field staff is weighted towards older age groups. In part this is because
the FSA did not recruit any staff between 2006 and late 2012, when 8 new inspectors were
recruited. While this is not an immediate issue, there is a risk that the FSA will face a loss of
skills and experience as this section of the field staff reach retirement age.
5.4 Most industry interviewees considered that current terms and conditions for inspection
staff were overly generous and had a negative impact on the flexibility of inspection. We
have not independently analysed or verified those views.
5.5 A number of interviewees among industry considered that there is too much
inconsistency across decisions by different OVs.
h. The FSA needs to develop its formal resource model so that it can manage risks around the
age profile of field staff. This needs to be done in conjunction with its thinking about the delivery
model and choices about the expectations of quality and staff roles, so that there is a clear
understanding of skills needs, any skills gaps, and the actions necessary to address any gaps.
i. The FSA should engage with staff and unions to assess whether there is scope for more
flexible working and other changes in terms and conditions. The FSA should consider an
independent review, or its own review with external input, and be as transparent as possible to
stakeholders in communicating the process and outcomes of the review.
j. While responsibility for training OVs sits with contractors under the FSA’s contracting model,
ultimately the FSA is responsible to FBOs for decisions made by its contract staff. The FSA
should engage with both contractors and FBOs to understand the nature, scale and impact of
this inconsistency and, if necessary, to identify remedial action such as changes to training.
6. Charging and discounting
6.1 While FSA can be efficient or inefficient in its own use of resources, FSA inspections and
the use of FSA resources by FBOs are heavily interdependent. How FBOs use FSA
resources has a strong impact on FSA efficiency, while how FSA charges FBOs strongly
influences the efficiency of FBO use of FSA resources. It therefore makes sense to talk
about the efficiency of the system as a whole.
6.2 The current charging and discount system, combined with EU minima, does not provide
FBOs with incentives to use FSA resources efficiently. The system is also complex, which
adds to administration costs and the likelihood of error and disputes with industry and its
representatives, and the allocation of discounts to individual FBOs lacks any obvious
rationale.
6.3 The FSA is establishing a working group with industry to identify improvements to the
charging and discount system.
k. The FSA should set clear criteria for reform of the element of charging that is to be reviewed
by the Charging Reform Group, in the way that the Tierney Review established aims for the
current system. The criteria should be evaluated so that potential conflicts are identified and
prioritised. It will be essential to engage effectively with FBOs and industry representatives. The
proposals are likely to affect different FBOs in different ways and it will be important for the FSA
to consider distributional impacts of proposals.
l. As proposals are developed by the Group, the FSA should use modelling, sensitivity analysis
and scenario planning, and consider piloting, to review whether the proposals are likely to meet
the reform criteria. There is a limited amount of time available for introduction by the 2014/15
financial year as FSA intends, and the FSA should formally consider alternatives to ensure that
there is sufficient time to plan for a revised system, for example deferral or phased
implementation.

9 FSA Meat Hygiene Controls
Recommendations and supporting findings 3 (GB)
Findings Recommendations
7. Direct and indirect costs
7.1 The costs to the FSA of inspections at some plants are substantially greater than could
be expected given factors such as plant scale and species processed. The FSA has useful
data on costs at plant level, and FSA management reviews variances at plant and area level,
but has not historically made full use of analytical techniques to identify and review
variances.
7.2 Our analysis (with caveats) indicates that historically FSA and MHS back office costs
were relatively high compared to other public service organisations. The FSA has reduced
staff numbers and associated costs at a fast rate since merger with the MHS from these
historic high levels.
7.3 In our interviews, a number of FSA staff felt that support from the back office to field staff
was not well joined-up, for example in timeliness of requests for supplies. The work of OVs
and meat inspectors is challenging, and there is a risk that back office cost reductions could
affect the quality of support to field staff if it is not measured.
m. The FSA should consider building on its existing reviews of costs by using regression
analysis to identify more clearly what costs should look like and to investigate variances from
expectations.
n. The FSA should review the quality of support provided by the back office to field staff, to
clarify the level of service expected and monitor whether this is being delivered, particularly
where cost reductions are made.
8. Working with contractors
8.1 The new contracting model adopted from April 2012 provides benefits to the FSA, for
example through allowing contractors to allocate resources more flexibly over a wider area,
but there are also risks in this model that longer-term costs could increase if, for example,
competitive pressures are not sustained through the new model. The mechanism for
reimbursing contractors (fixed price for OVs) also reduces FSA costs, but introduces risks if
the quality of OV inspections is not carefully managed.
8.2 The managed service model also provides benefits to the FSA if contractors use their
greater degree of freedom, coupled with a wider coverage, to perform well under the
contract. There are some areas where the FSA’s management of the contract may not yet
work to deliver this full potential, for example achieving the right balance between the
intended managed service and FSA intervention in contractor activities; some duplication of
FSA and contractor roles; the quality and timeliness of information sharing; and the link
between contract KPIs and intended contract outcomes.
o. With regard to the existing contracts, the FSA should work with contractors to make sure that
the contract performance indicators and intended outcomes are more clearly aligned, and that
the information necessary to manage the contract is more effectively shared.
p. For the longer-term, it is important that the FSA first decides on and formalises its vision and
target operating model, which it can then use to establish its resourcing model, skills needs and
gaps. Decisions on these should then inform the FSA’s thinking on whether it has the right
contracting model, or whether changes need to be made due to skills needs, or due to the risks
associated with the current “two supplier” approach.
10 FSA Meat Hygiene Controls
Recommendations and supporting findings 4 (GB)
Findings Recommendations
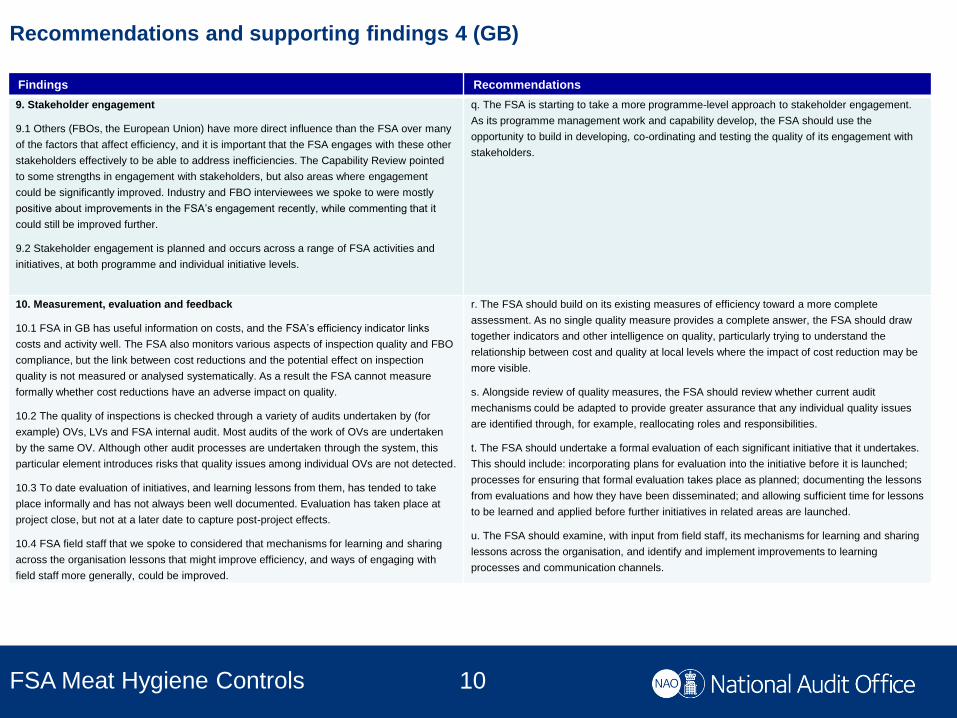
9. Stakeholder engagement
9.1 Others (FBOs, the European Union) have more direct influence than the FSA over many
of the factors that affect efficiency, and it is important that the FSA engages with these other
stakeholders effectively to be able to address inefficiencies. The Capability Review pointed
to some strengths in engagement with stakeholders, but also areas where engagement
could be significantly improved. Industry and FBO interviewees we spoke to were mostly
positive about improvements in the FSA’s engagement recently, while commenting that it
could still be improved further.
9.2 Stakeholder engagement is planned and occurs across a range of FSA activities and
initiatives, at both programme and individual initiative levels.
q. The FSA is starting to take a more programme-level approach to stakeholder engagement.
As its programme management work and capability develop, the FSA should use the
opportunity to build in developing, co-ordinating and testing the quality of its engagement with
stakeholders.
10. Measurement, evaluation and feedback
10.1 FSA in GB has useful information on costs, and the FSA’s efficiency indicator links
costs and activity well. The FSA also monitors various aspects of inspection quality and FBO
compliance, but the link between cost reductions and the potential effect on inspection
quality is not measured or analysed systematically. As a result the FSA cannot measure
formally whether cost reductions have an adverse impact on quality.
10.2 The quality of inspections is checked through a variety of audits undertaken by (for
example) OVs, LVs and FSA internal audit. Most audits of the work of OVs are undertaken
by the same OV. Although other audit processes are undertaken through the system, this
particular element introduces risks that quality issues among individual OVs are not detected.
10.3 To date evaluation of initiatives, and learning lessons from them, has tended to take
place informally and has not always been well documented. Evaluation has taken place at
project close, but not at a later date to capture post-project effects.
10.4 FSA field staff that we spoke to considered that mechanisms for learning and sharing
across the organisation lessons that might improve efficiency, and ways of engaging with
field staff more generally, could be improved.
r. The FSA should build on its existing measures of efficiency toward a more complete
assessment. As no single quality measure provides a complete answer, the FSA should draw
together indicators and other intelligence on quality, particularly trying to understand the
relationship between cost and quality at local levels where the impact of cost reduction may be
more visible.
s. Alongside review of quality measures, the FSA should review whether current audit
mechanisms could be adapted to provide greater assurance that any individual quality issues
are identified through, for example, reallocating roles and responsibilities.
t. The FSA should undertake a formal evaluation of each significant initiative that it undertakes.
This should include: incorporating plans for evaluation into the initiative before it is launched;
processes for ensuring that formal evaluation takes place as planned; documenting the lessons
from evaluations and how they have been disseminated; and allowing sufficient time for lessons
to be learned and applied before further initiatives in related areas are launched.
u. The FSA should examine, with input from field staff, its mechanisms for learning and sharing
lessons across the organisation, and identify and implement improvements to learning
processes and communication channels.

11 FSA Meat Hygiene Controls
Recommendations and supporting findings 5 (NI)
Findings Recommendations
1. Transparency of costs and charges
1.1 FSA in NI currently lacks detailed information about the calculation of DARD overhead
costs which are added to the cost of hygiene controls carried out by DARD and charged to
the FSA. A review of overheads was carried out which identified overheads that are no
longer relevant to the delivery of official controls. This prompted a request for further review
which has not yet been completed and no firm deadline has been set for this.
1.2 Some interviewees among FBOs and industry representatives considered the charges to
industry to be insufficiently transparent. Representatives of farmers that we interviewed said
that the lack of transparency in charging goes further, allowing some parts of industry to levy
charges on farmers which they said were disproportionate to the charges that industry itself
bears.
a. The second stage of the review of back office overheads by DARD should be expedited to
provide enhanced transparency on associated costs.
b. The FSA in NI should review its charging structure arrangements to assess whether it could
make charges more transparent to all stakeholders, while at the same time working through the
potential implications of different options to minimise the risk that any such action has an
adverse impact on competition in the market.
2. Systems and processes
2.1 There are compatibility issues between the time recording and IT charging systems used
by DARD, so that a manual transfer of time records into the charging system is required. This
increases administrative effort and costs.
c. The FSA in NI should encourage DARD to appraise the costs and benefits associated with
streamlining its IT systems in order to facilitate more efficient data collection, in considering how
to address these compatibility issues.
3. Structure & roles
3.1 Some interviewees questioned the need for Senior Meat Inspectors to be present in each
plant and the need for 3 FSA Regional Managers given the limited structure and size of the
industry.
d. The FSA in NI should encourage DARD to review its organisational structure and roles to
ensure they provide efficient coverage of the size and structure of the industry it regulates. It
should engage with FSA in GB to learn lessons from the experience of restructuring there.
4. Terms and Conditions of staff
4.1 While industry views of the service provided by FSA in NI and DARD have been strongly
positive, there were also strong views that the current terms and conditions for inspection
staff were overly generous and had a negative impact on the flexibility of inspections. We
have not independently analysed or verified those views.
e. The FSA in NI should encourage DARD to engage with staff and unions to assess whether
there is scope for more flexible working and other changes in terms and conditions. The FSA
should consider an independent review, or its own review with external input, and be as
transparent as possible to stakeholders in communicating the process and outcomes of the
review.

12 FSA Meat Hygiene Controls
Recommendations and supporting findings 6 (GB and NI)
Findings Recommendations
1. Impact of devolution
1.1 Devolution affects the structuring and co-ordination of FSA activities in GB and NI, which
in turn can affect the FSA’s efficiency. There is currently little systematic and comparative
analysis of management information between NI and GB which means that opportunities for
benchmarking and sharing good practice may be missed. This risk is likely to increase, as
there are currently plans for further devolution of responsibilities (i.e. in Scotland).
a. The FSA in GB and in NI should engage to identify opportunities for greater use of
comparative analysis across countries, and for learning and sharing lessons about efficiency
and efficiency initiatives.
13 FSA Meat Hygiene Controls FSA Meat Hygiene Controls
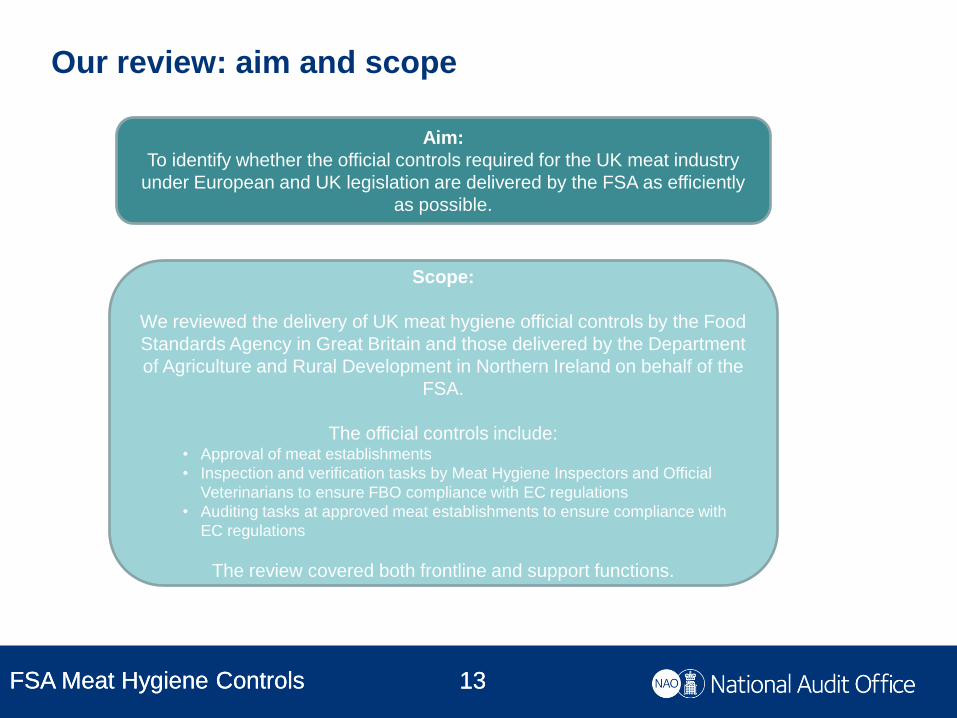
Our review: aim and scope
13
Aim:
To identify whether the official controls required for the UK meat industry
under European and UK legislation are delivered by the FSA as efficiently
as possible.
Scope:
We reviewed the delivery of UK meat hygiene official controls by the Food
Standards Agency in Great Britain and those delivered by the Department
of Agriculture and Rural Development in Northern Ireland on behalf of the
FSA.
The official controls include: • Approval of meat establishments
• Inspection and verification tasks by Meat Hygiene Inspectors and Official
Veterinarians to ensure FBO compliance with EC regulations
• Auditing tasks at approved meat establishments to ensure compliance with
EC regulations
The review covered both frontline and support functions.
14 FSA Meat Hygiene Controls
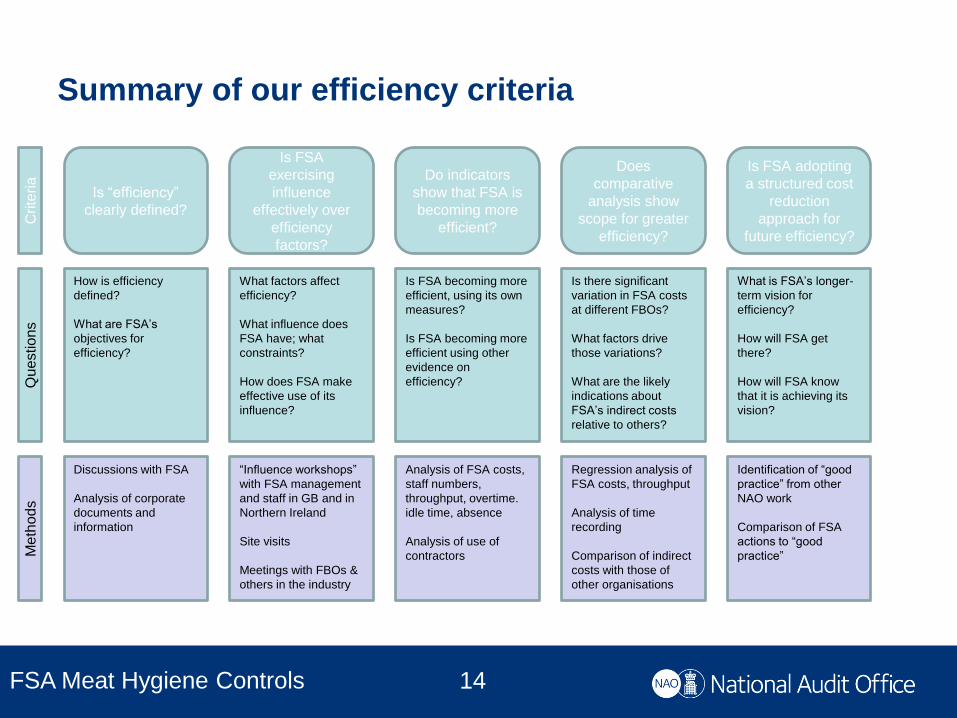
Summary of our efficiency criteria
Is “efficiency”
clearly defined?
Is FSA
exercising
influence
effectively over
efficiency
factors?
Do indicators
show that FSA is
becoming more
efficient?
Does
comparative
analysis show
scope for greater
efficiency?
Is FSA adopting
a structured cost
reduction
approach for
future efficiency?
Discussions with FSA
Analysis of corporate
documents and
information
“Influence workshops”
with FSA management
and staff in GB and in
Northern Ireland
Site visits
Meetings with FBOs &
others in the industry
Analysis of FSA costs,
staff numbers,
throughput, overtime.
idle time, absence
Analysis of use of
contractors
Regression analysis of
FSA costs, throughput
Analysis of time
recording
Comparison of indirect
costs with those of
other organisations
Identification of “good
practice” from other
NAO work
Comparison of FSA
actions to “good
practice”
Crite
ria
Qu
estio
ns
Me
tho
ds
What is FSA’s longer-
term vision for
efficiency?
How will FSA get
there?
How will FSA know
that it is achieving its
vision?
What factors affect
efficiency?
What influence does
FSA have; what
constraints?
How does FSA make
effective use of its
influence?
How is efficiency
defined?
What are FSA’s
objectives for
efficiency?
Is FSA becoming more
efficient, using its own
measures?
Is FSA becoming more
efficient using other
evidence on
efficiency?
Is there significant
variation in FSA costs
at different FBOs?
What factors drive
those variations?
What are the likely
indications about
FSA’s indirect costs
relative to others?
15 FSA Meat Hygiene Controls
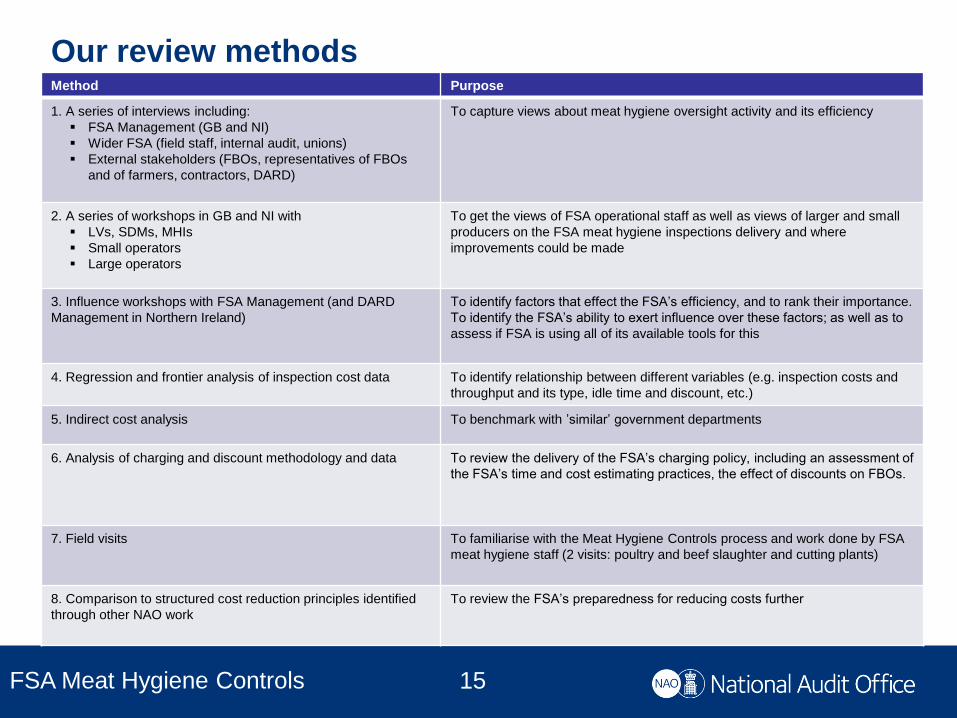
Our review methods Method Purpose
1. A series of interviews including:
FSA Management (GB and NI)
Wider FSA (field staff, internal audit, unions)
External stakeholders (FBOs, representatives of FBOs
and of farmers, contractors, DARD)
To capture views about meat hygiene oversight activity and its efficiency
2. A series of workshops in GB and NI with
LVs, SDMs, MHIs
Small operators
Large operators
To get the views of FSA operational staff as well as views of larger and small
producers on the FSA meat hygiene inspections delivery and where
improvements could be made
3. Influence workshops with FSA Management (and DARD
Management in Northern Ireland)
To identify factors that effect the FSA’s efficiency, and to rank their importance.
To identify the FSA’s ability to exert influence over these factors; as well as to
assess if FSA is using all of its available tools for this
4. Regression and frontier analysis of inspection cost data To identify relationship between different variables (e.g. inspection costs and
throughput and its type, idle time and discount, etc.)
5. Indirect cost analysis To benchmark with ’similar’ government departments
6. Analysis of charging and discount methodology and data To review the delivery of the FSA’s charging policy, including an assessment of
the FSA’s time and cost estimating practices, the effect of discounts on FBOs.
7. Field visits
To familiarise with the Meat Hygiene Controls process and work done by FSA
meat hygiene staff (2 visits: poultry and beef slaughter and cutting plants)
8. Comparison to structured cost reduction principles identified
through other NAO work
To review the FSA’s preparedness for reducing costs further

16 FSA Meat Hygiene Controls
The history of meat hygiene regulation and charging policy
1995 1996 1999 2000 2001 2006 2007 2008 2009 2010 2011 2012 2013
Meat Hygiene
Service
created as an
executive
agency of FSA
with the aim of
recovering the
costs of
hygiene
inspections
from the meat
industry
Po
licy c
han
ge
s
Regula
tor
FSA and DEFRA
state aim to
achieve full cost
recovery from
industry
FSA Future Meat Controls
review launched including
several strands of research
and evidence gathering
Meat Hygiene Service merged with FSA
- forms major part of FSA's new Operations
Group
Reducing Regulation Committee did not agree to full
cost recovery plan on the grounds that FSA could not
demonstrate that it is operating efficiently.
FSA Board committed to full cost
recovery to be implemented over 3
years
New charging system
implemented based on the
Maclean Report - charges set at the
lower of time cost and standard
charge per animal
Higher
charges
proposed in
FSA and MHS
consultation
Higher charges based
on time-cost only
proposed in FSA
consultation.
Red Tape Challenge - FSA Board
agrees to reduce the number of food
safety statutory instruments from 43
to 11
Cost recovery required by EU
Directive 96/43/EEC; regulation
EC 882/2004 now applies
Staged move to full cost recovery with a
maximum discount of 70% proposed in
FSA consultation. Industry wanted FSA to
become more efficient before putting more
costs onto them.
Pooley Report
concluded that
MHS costs were
punitive and made
recommendations
to reduce costs
and burden
Maclean Report addressed
problems of small businesses
failing because they had to
meet the cost of bringing UK
and EU regulation in line.
Recommended new charging
formula
FSA Efficiency Scrutiny report
commissioned from Deloitte and Touche to
advise on ways to improve MHS's efficiency
and reduce inspection costs to reduce the
burden on businesses.
Tierney Report looked at value
for money of controls.
Recommended a more
proportionate, risk-based
approach, cost reductions in
MHS and a staged move to full-
cost recovery
NAO Efficiency Review of UK
Delivery of Meat Hygiene
Controls Eff
icie
ncy
stu
die
s
Discounted time based
charging policy
implemented following
stakeholder consultation and
ministerial agreement.
17 FSA Meat Hygiene Controls
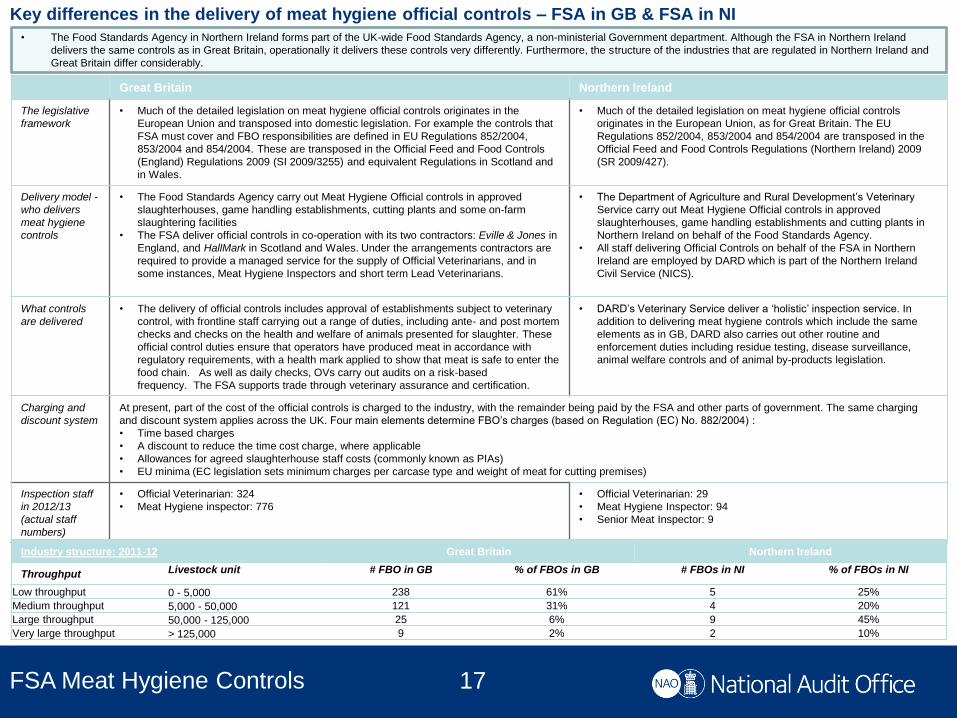
Key differences in the delivery of meat hygiene official controls – FSA in GB & FSA in NI
Great Britain Northern Ireland
The legislative
framework
• Much of the detailed legislation on meat hygiene official controls originates in the
European Union and transposed into domestic legislation. For example the controls that
FSA must cover and FBO responsibilities are defined in EU Regulations 852/2004,
853/2004 and 854/2004. These are transposed in the Official Feed and Food Controls
(England) Regulations 2009 (SI 2009/3255) and equivalent Regulations in Scotland and
in Wales.
• Much of the detailed legislation on meat hygiene official controls
originates in the European Union, as for Great Britain. The EU
Regulations 852/2004, 853/2004 and 854/2004 are transposed in the
Official Feed and Food Controls Regulations (Northern Ireland) 2009
(SR 2009/427).
Delivery model -
who delivers
meat hygiene
controls
• The Food Standards Agency carry out Meat Hygiene Official controls in approved
slaughterhouses, game handling establishments, cutting plants and some on-farm
slaughtering facilities
• The FSA deliver official controls in co-operation with its two contractors: Eville & Jones in
England, and HallMark in Scotland and Wales. Under the arrangements contractors are
required to provide a managed service for the supply of Official Veterinarians, and in
some instances, Meat Hygiene Inspectors and short term Lead Veterinarians.
• The Department of Agriculture and Rural Development’s Veterinary
Service carry out Meat Hygiene Official controls in approved
slaughterhouses, game handling establishments and cutting plants in
Northern Ireland on behalf of the Food Standards Agency.
• All staff delivering Official Controls on behalf of the FSA in Northern
Ireland are employed by DARD which is part of the Northern Ireland
Civil Service (NICS).
What controls
are delivered
• The delivery of official controls includes approval of establishments subject to veterinary
control, with frontline staff carrying out a range of duties, including ante- and post mortem
checks and checks on the health and welfare of animals presented for slaughter. These
official control duties ensure that operators have produced meat in accordance with
regulatory requirements, with a health mark applied to show that meat is safe to enter the
food chain. As well as daily checks, OVs carry out audits on a risk-based
frequency. The FSA supports trade through veterinary assurance and certification.
• DARD’s Veterinary Service deliver a ‘holistic’ inspection service. In
addition to delivering meat hygiene controls which include the same
elements as in GB, DARD also carries out other routine and
enforcement duties including residue testing, disease surveillance,
animal welfare controls and of animal by-products legislation.
Charging and
discount system
At present, part of the cost of the official controls is charged to the industry, with the remainder being paid by the FSA and other parts of government. The same charging
and discount system applies across the UK. Four main elements determine FBO’s charges (based on Regulation (EC) No. 882/2004) :
• Time based charges
• A discount to reduce the time cost charge, where applicable
• Allowances for agreed slaughterhouse staff costs (commonly known as PIAs)
• EU minima (EC legislation sets minimum charges per carcase type and weight of meat for cutting premises)
Inspection staff
in 2012/13
(actual staff
numbers)
• Official Veterinarian: 324
• Meat Hygiene inspector: 776
• Official Veterinarian: 29
• Meat Hygiene Inspector: 94
• Senior Meat Inspector: 9
• The Food Standards Agency in Northern Ireland forms part of the UK-wide Food Standards Agency, a non-ministerial Government department. Although the FSA in Northern Ireland
delivers the same controls as in Great Britain, operationally it delivers these controls very differently. Furthermore, the structure of the industries that are regulated in Northern Ireland and
Great Britain differ considerably.
Industry structure: 2011-12 Great Britain Northern Ireland
Throughput Livestock unit # FBO in GB % of FBOs in GB # FBOs in NI % of FBOs in NI
Low throughput 0 - 5,000 238 61% 5 25%
Medium throughput 5,000 - 50,000 121 31% 4 20%
Large throughput 50,000 - 125,000 25 6% 9 45%
Very large throughput > 125,000 9 2% 2 10%

18 FSA Meat Hygiene Controls
Summary: Defining Efficiency
1. The FSA’s goal for efficiency is driven by its 2015 cost savings target
What work we
have done
Our criteria
• Outline of different aspects of efficiency in the context of FSA’s work on meat hygiene
controls
• Review of FSA efficiency objectives, indicators and targets
• Clear definition of what is meant by efficiency
• Clear FSA objectives for efficiency, both strategic and operational
• Indicators established, linking clearly to objectives
Our findings
• FSA’s efficiency objective is a cost savings target (to save £5m by 2014/15 against a
2010/11 baseline of £55.5m costs to industry) as part of its wider ambition to deliver EU
regulations at minimal cost
• It uses Cost per Livestock Unit (CPLU) as its formal indicator of efficiency, alongside a
wider basket of measures
• ‘Efficiency’ is not an explicit strategic objective, but FSA told us that it is a key internal
objective which it pursues through its ‘proportionate and risk-based’ objectives and
work to improve compliance

19 FSA Meat Hygiene Controls
Efficiency can be viewed from many
perspectives …
Fewer inputs for
the same
outcomes
Doing more with
the same inputs
Lower unit
input costs
Reducing
quantity of
inputs
Redefining
activities for
same outcomes Streamlining
structures &
processes
More flexible
use of inputs
Increasing
productivity through
e.g. training
Joined-up
working with
others
Reducing
unproductive
time
20 FSA Meat Hygiene Controls
FSA efficiency measures
Cause for
concern
Forecast
Accuracy
CPLU
HPLU
IGN
Coding
Absence management
IUWT
PMI
Verification
Dairy
Hygiene
Visits
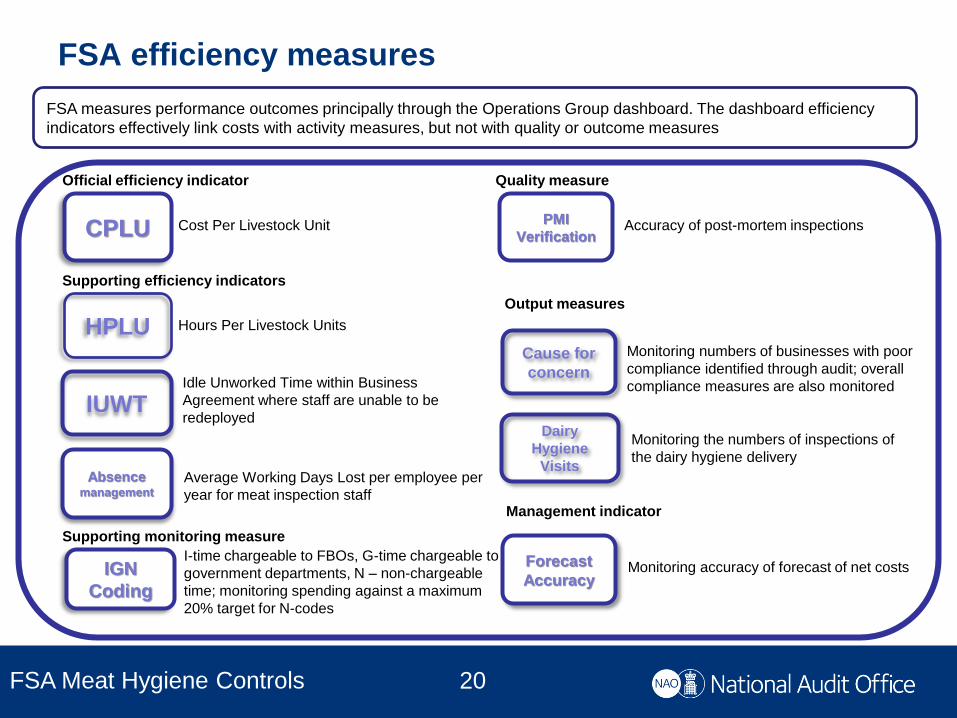
FSA measures performance outcomes principally through the Operations Group dashboard. The dashboard efficiency
indicators effectively link costs with activity measures, but not with quality or outcome measures
Official efficiency indicator
Cost Per Livestock Unit
Supporting efficiency indicators
Supporting monitoring measure
Hours Per Livestock Units
Idle Unworked Time within Business
Agreement where staff are unable to be
redeployed
Average Working Days Lost per employee per
year for meat inspection staff
I-time chargeable to FBOs, G-time chargeable to
government departments, N – non-chargeable
time; monitoring spending against a maximum
20% target for N-codes
Quality measure
Accuracy of post-mortem inspections
Monitoring numbers of businesses with poor
compliance identified through audit; overall
compliance measures are also monitored
Monitoring the numbers of inspections of
the dairy hygiene delivery
Management indicator
Monitoring accuracy of forecast of net costs
Output measures

21 FSA Meat Hygiene Controls
Strategic objectives and cost reduction target
Cost reduction targets:
• The FSA in GB has set itself a target to save £5m by
2014/15, against a baseline of £55.5m, which was the
FSA’s November 2010 estimate of the cost of delivering
meat official controls in 2010/11.
• The FSA in NI has been required to deliver savings of
£949k over the 2011-2015 budgetary period by the
Department of Finance and Personnel in NI. It aims to
deliver those savings through reducing the cost of meat
hygiene controls in NI to £5.8m by 2014/15.
The main priorities:
• secure effective enforcement and implementation of policies within the UK to protect
consumers from risks related to food and from fraudulent and misleading practices, targeting
the areas where there is highest risk
• strengthen the delivery of official controls
• develop our knowledge of what works in driving up business compliance with regulations
Enforcement is effective, consistent, risk-based, and proportionate, and is
focused on improving public health.
The FSA has the strategic objective to pursue ‘risk-based and proportionate’ approaches to regulation and enforcement,
with efficiency a key internal objective. FSA in GB and FSA in NI have separate cost reduction targets for 2014/15.
The main priorities:
• safeguard consumers by making it easier for business to comply with regulations, and minimise
burdens on businesses
• secure more proportionate, risk-based and effective regulation by strengthening our engagement in
the EU and in international forums
• work internationally to design a model for a new regulatory and enforcement regime for ensuring
meat controls are effective.
Regulation is effective, risk-based and proportionate, is clear about the
responsibilities of food business operators, and protects consumers and their interest
from fraud and other risks
Source: FSA Operations Groups Business Plan 2012/13, p. 2
Source: FSA Operations Annual Report 2011/12, p. 13, and FSA NI Management data 2005 to 2012
0
20
40
60
80
100
2005-06 2006-07 2007-08 2008-09 2009-10 2010-11 2011-12
88.2 91.3 87.1 77.9
68.1 66.9 61.0
7.2 7.0 7.1 6.8 6.6 6.6 5.9
Total Costs of Meat Hygiene Official Controls in GB and NI (current prices)
Total cost GB Total cost NINote: The £55.5m baseline excludes the cost of delivering official controls for
which charges are not applied, which amounted to around £11m in 2010/11.

22 FSA Meat Hygiene Controls
Summary: Influence over efficiency factors
2. FSA’s influence over the factors impacting its efficiency varies strongly, largely due to the
strong interdependencies of its operations with those of FBOs and its lack of direct control
over the legal framework and charging/discount system; it is developing its approach to
influencing these factors more strategically
What work we
have done
Our criteria
• Identification of factors affecting FSA’s own efficiency, through workshops with FSA
field staff and with small and large FBOs; site visits; interviews with industry
• Workshops with FSA management (GB and Northern Ireland) to rank relative
importance of factors affecting efficiency, and FSA’s relative influence over them
• FSA is clear on the factors and constraints that affect its own efficiency
• Where there is inefficiency, FSA understands the root causes
• Where FSA has direct influence, it uses this effectively
• Where FSA has less direct influence, it engages effectively with others
Our findings
• Many factors affect FSA’s efficiency; it has variable influence over these, and limited if
any influence on some factors with a very large impact on the efficiency of inspections
• Where it has most influence, FSA has acted and made savings
• There are other factors where the FSA has relatively less, but still some influence, and
where there is potential to achieve further savings. In some of these, FSA could
engage more effectively with others to unlock this potential

FSA influence over the factors that potentially affect its efficiency varies (GB)
Least Most
High Charges – element of total charges
currently met by taxpayer
Different interpretation of
compliance requirements: e.g.
OV attendance
Charges – element of total charges
currently met by industry
Industry structure and efficiency
Substituting from MHIs to PIAs FSA staff T&Cs - level FSA staff T&Cs - flexibility
Seasonal factors Earned recognition, reliance on others'
work
Impact of devolution FSA decisions, back office staff Reducing paperwork burden on staff FSA decisions on roles, including
minimising duplication
One-off FBO decisions e.g.
location, species
Efficiency through engaging with
FBOs
FSA decisions on contracting/in-house
balance
FSA decisions on organisation &
structure
Further savings through review of
fixed-price contract arrangements
Wider food chain impact e.g.
animal health, quality
Efficient staffing through work in
food premises
Joined OV - MHI working Efficient staffing through e.g. dairy,
shellfish work
Increased competition among
suppliers
Efficient IT support
Staff age/grade mix
FSA decisions, back office non-staff Savings through joined-up working
with contractors
Linking charges to compliance
Administration of simpler charges
Admin/paperwork burden on FBO
Efficient IT procurement
Low
Efficient resource allocation to
minimise costs e.g. T&S
Joining back office & field
Response to external events
POTENTIAL INFLUENCE
PO
TEN
TIA
L R
EMA
ININ
G S
AV
ING
S This slide outlines (for GB) a range of factors that potentially affect efficiency, and a joint NAO-FSA assessment of the FSA’s relative influence over each factor, and the
potential efficiency saving that remains to be made in relation to that factor. Relative influence reflects the degree to which FSA can directly influence a potential efficiency
factor, or influence indirectly through stakeholders. Various assumptions have been made regarding potential efficiency savings – for example savings that might be achievable
within the next 2-3 years – these assumptions are imprecise but are intended solely to derive an indication of the relative scale of potential efficiency for each factor, relative to
other factors shown here.
23 National Audit Office

24 FSA Meat Hygiene Controls
Where the FSA has direct influence: issues and FSA actions (GB)
Potential efficiency factor: Issues identified by interviewees FSA action in last 3 years FSA proposals for next 12-18 months
FSA structure: organisational structure (See slide 61) – Some interviewees
raised some concerns about the efficiency of the FSA’s organisational
structure and associated management chain. Some interviewees were unsure
if the recent reorganisation had secured efficiency benefits. Some
interviewees considered the FSA’s operations management structure to be
over-engineered, making decision making slow. Some industry representatives
feel that FSA has too many layers of management, given the proportion of
front line staff managed by external contractors.
• The FSA’s field management structure
was revised and re-launched in April
2012. The re-organisation saw the
delivery of meat hygiene official
controls move from a cluster basis to a
larger regional structure. FSA states
that over 40 management posts were
removed in the restructure.
• Review of the Operations Group structure.
• Review of the structure and roles of FSA Divisions (beyond
Operations Group).
• Strategic review of the process for approving new FBOs.
FSA structure: roles and responsibilities – Some interviewees identified a
degree of duplication in specific roles. Duplication between FSA Lead Vets
and contract Area Veterinary Managers is discussed in Slide 62. Some
interviewees questioned the need for Operations Managers in England when
the position is not used in Wales and Scotland. Some interviewees questioned
the effectiveness of certain aspects of the Service Delivery Manager role, in
particular the role’s Health and Safety function.
• The FSA’s field management structure
was revised in April 2012. This re-
launch saw the introduction of a
number of new roles, including:
Veterinary Field Managers, Operations
Managers (England only), Service
Delivery Managers.
• FSA plans to explore the opportunities and benefits
associated with Lead Vets taking on auditing functions.
• FSA plans to clarify the role and responsibility of Lead
Vets and contract Area Veterinary Managers to ensure no
duplication of effort.
FSA operational processes – Several interviewees commented on the
excessive paperwork requirements, both out in the field and internally. Some
considered that the FSA’s IT infrastructure, both out in the field and in the
back office, is not as good as it could be. FSA field staff that we spoke to
considered that mechanisms for learning and sharing lessons across the
organisation that might improve efficiency, and ways of engaging with field
staff more generally, could be improved
• Work to develop an IT strategy to improve data collection
methods, exploitation and reporting and IT infrastructure.
• “Digital By Default” programme with aim of 80% reduction
in paperwork.
• IT developments planned to improve back office efficiency
– see below.
Age profile of FSA inspection staff - With 87% of Meat Hygiene Inspectors
aged 40 or over, and 46% aged 50 or over, some stakeholders commented
that the aging profile of FSA inspectors is a concern for the future efficiency of
the business with the loss of skills when these inspectors retire.
• More regular consultation with unions.
• Recruit more MHIs.
• Develop in-house training.
FSA back office (See slide 57) – Several industry representatives highlighted
the scale of the FSA’s back office function, and the associated cost of this, as
inefficiency. Some interviewees felt that FSA front and back operations were
not well aligned and could provide more effective support to field staff.
• Reductions in back office staff numbers • Roll-out of lean and continuous improvement initiatives.
• Pushing ahead with current IT development plans,
including: streamlining the process of administration and
developing an 'operations business engine' - a workflow
and data validation tool.
Charging system and process (See slides 43-49) - A majority of
interviewees feel that the current charging system and process is a major
driver of inefficiency in FBO use of FSA resource. Many industry interviewees
commented that it was overly-complex and unclear how charges are
calculated. Some commented that the discount system is unfair.
• Discount review to be undertaken by the Charging
Working Group
• Initiatives to increase the flexibility of inspectors, for
example increasing their inspection remit.
This section looks at factors that can potentially impact FSA efficiency, identified in discussions with FSA staff and management and with industry, where FSA has relatively more
direct influence. The issues identified represent the views expressed by interviewees; we have not substantiated these views other than where covered in the rest of this presentation.

25 FSA Meat Hygiene Controls
Where the FSA has less direct influence: influence through stakeholder engagement (GB)
Potential efficiency factor: issues
identified by interviewees
Stakeholder group : evaluation of engagement FSA action in last 3 years FSA proposals for next 12-18 months
FBO operations – the influence
workshop with the FSA identified a
number of FBO specific factors (for
example, line speed and use of
PIAs) that can potentially impact FSA
efficiency.
Engagement with food business operators – Some
interviewees believed that the FSA listen better to the
concerns of small abattoirs since the rejection of the full cost
recovery proposal. FBOs praised the accommodating nature
of inspection staff around busy periods. Many felt, however,
that business agreements are too restrictive and it is not
practical for an FBO to forecast production 30 days in
advance, or they get punished through overtime rates when
this forecast is wrong.
• Existing system of business
agreements between the FSA
and individual FBOs.
• Business Agreements are being changed
to 'Statements of resources' which will be
examined by the FBO and FSA on a
quarterly, rather than annual, basis.
• Building smarter, more collaborative
relationships with FBOs.
• Speaking to industry about incentives to
increase substitution of PIAs for MHIs.
Collaborative working – concern
exists that the FSA does not work
collaboratively with industry to create
greater efficiencies, especially where
mutually beneficial outcomes can be
realised.
Engagement with industry representative groups – Most
industry interviewees said that FSA engagement with industry
has improved recently, although some still believe that
engagement is too formal and consultation is undertaken too
late in the decision making process. Some interviewees
considered the dropping of industry input to technical guidance
was a retrograde step.
• Established the ‘Current and
Future Meat Controls Group’
• Established the ‘Partnership
Working Group’
• FSA consultation on the Meat
Industry Guide (MIG) was
dropped.
• A renewed commitment to industry
engagement.
• Develop a mechanism to monitor and act
on industry feedback.
Collaborative workings – there is a
risk that the FSA does not take a
joined-up approach when working
with service contractors in order to
improve the efficiency and quality of
service.
Engagement with service contractors - Contractors
expressed concern that the FSA does not always take a joined
up approach on shared interests such as responding to
changes in business agreements, assessing performance,
sharing information, IT issues and the delivery of staff
training.
• Following a competitive re-
tendering process, new fixed
price veterinary contracts went
live in April 2012.
• Regular set-piece
engagements with contractors
to discuss performance.
• Consultation on future changes to the
contract, for example greater clarify the
role and responsibility of lead vets and
contract area veterinary managers to
ensure no duplication of effort.
Staffing and flexibility – Industry
interviewees consider the terms and
conditions of inspection staff to be
too generous, making the service
expensive and inflexible, as it is too
costly to pay overtime.
Engagement with unions – FSA staff said there has been
limited engagement between the FSA and unions. Union
representatives do not feel the FSA actively seek to engage
but rather interaction is imposed. FSA management have
pointed to previous threats of industrial action by the unions.
• The Terms and Conditions of
MHIs have remained relatively
unchanged. The key change
has been to the method of
overtime accrual that was
implemented with the
introduction of the ‘deficit hours’
calculation.
Implementing EU legislation – the
FSA are mandated to follow EU
legislation, which has a significant
impact on the way the FSA operates.
Engagement with the EU - The FSA have been described by
some stakeholder groups as a ‘proactive’ participant in
Europe. Some of the factors that can, potentially, have a major
impact on FSA efficiency, for example mandatory OV
attendance, are set by the EU; but some interviewees
considered the FSA could be more flexible in its interpretation.
• 100% OV attendance is an EU
requirement - monitor developments in
Europe.
• Oversight of PIAs is an EU requirement -
monitor developments in Europe.
This section looks at factors that can potentially impact FSA efficiency where FSA has relatively less influence, therefore requiring effective engagement with others who have
more direct influence. The issues identified represent the views expressed by interviewees; we have not substantiated these views other than where covered in the rest of this presentation.

FSA in NI have identified factors that affect its efficiency and how much influence it has over each one
Least
Most
High FSA operation of discount system
Incentives: impact of
discounts on idle time
Impact of devolution Civil service T&Cs - flexibility Correct charging, FBO or
Government
Efficiency of FBO TUS involvement
Market prices Business accords
Industry structure
Seasonality & unpredictability
Incentives: cost pass through
to farmers
Implementing EU legislation Staff cost levels Relationship with industry
Line speed control
EU minima Exports & trade reputation OV working expectations: part-
time, job-sharing
DARD/FSA, IT & EU minima Sharing back office costs with
DARD
Weather impact WTO issues Managing annual leave, peak
working
Flexible DARD/FSA staffing
Shifting age profile Internal DARD/FSA IT e.g.
timesheets
Low
REL
ATI
VE
IMP
OR
TAN
CE
TO F
SA E
FFIC
IEN
CY
POTENTIAL INFLUENCE
This slide outlines (for Northern Ireland) a range of factors that affect efficiency, a joint NAO-FSA assessment of the FSA’s relative influence over each factor, and the
importance of that factor to efficiency. Relative influence reflects the degree to which FSA can directly influence a potential efficiency factor, or influence indirectly through stakeholders.
Some of the factors identified are common to Great Britain, others are different. Unlike GB, the NAO did not take this output further to identify any potential remaining savings, partly
because as the scope for savings is much smaller in Northern Ireland.
26 National Audit Office

27 FSA Meat Hygiene Controls
Potential efficiency factor: Issues identified by interviewees FSA action in last 3 years FSA proposals/considerations for next 12-18 months
FSA structure & roles: Some interviewees questioned the need for
Senior Meat Inspectors to be present in each plant and the need for 3
Regional Managers given the limited structure and size of the
industry.
FSA in NI and DARD plan to initiate discussions on the
future deployment of SMIs
IT systems: Some interviewees commented on the front-line delivery
of hygiene controls in NI benefits from comprehensive and advanced
real-time information systems which allow the efficient collection of
inspection information. The IT systems in DARD also support the
efficient processing of charging information. However, both
management and staff at the FSA are concerned that the current time
recording system is not fit for purpose and not sufficiently aligned with
the IT charging system.
DARD have initiated a project to integrate their IT systems
to facilitate more efficient processing of the information
required for meat charging.
FSA staffing arrangements – FSA data indicates that only 3% of
meat inspectors are aged 30 or younger, which could pose an
operational risk in the near future if the current operating model is
maintained.
DARD have proposed to initiate a recruitment exercise as
a first step to address any short term concerns. They will
then consider any medium and long term options
dependant on the outcome of this recruitment exercise.
Where FSA has direct influence: issues and FSA actions (NI)
Source: DARD management information, May 2013
• The age profile of Meat Hygiene Inspectors in Northern Ireland is
unbalanced, with 58.6 per cent aged between 46 and 55.
• This age profile poses minimal operational risk to the business in the short
term. In the medium term, however, a lack of forward planning could see the
FSA in Northern Ireland risk losing significant resource through retirement
over a short period of time, without the benefit of managing this transition by
passing on knowledge, skill and experience to a younger cohort.
This section looks at factors that impact FSA efficiency, identified in discussions with FSA staff and management industry representatives, where FSA has relatively more direct
influence. The issues identified represent the views expressed by interviewees; we have not substantiated these views other than where covered in the rest of this presentation.
28 FSA Meat Hygiene Controls
Potential efficiency factor: issues identified by
interviewees
Stakeholder group : evaluation of FSA engagement FSA action in last 3
years
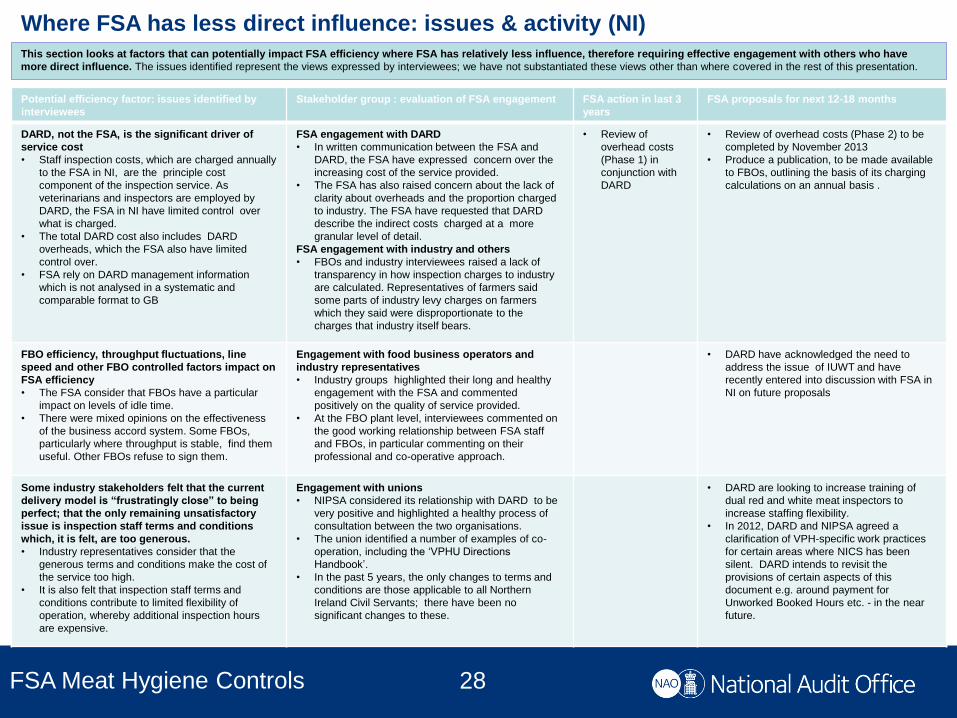
FSA proposals for next 12-18 months
DARD, not the FSA, is the significant driver of
service cost
• Staff inspection costs, which are charged annually
to the FSA in NI, are the principle cost
component of the inspection service. As
veterinarians and inspectors are employed by
DARD, the FSA in NI have limited control over
what is charged.
• The total DARD cost also includes DARD
overheads, which the FSA also have limited
control over.
• FSA rely on DARD management information
which is not analysed in a systematic and
comparable format to GB
FSA engagement with DARD
• In written communication between the FSA and
DARD, the FSA have expressed concern over the
increasing cost of the service provided.
• The FSA has also raised concern about the lack of
clarity about overheads and the proportion charged
to industry. The FSA have requested that DARD
describe the indirect costs charged at a more
granular level of detail.
FSA engagement with industry and others
• FBOs and industry interviewees raised a lack of
transparency in how inspection charges to industry
are calculated. Representatives of farmers said
some parts of industry levy charges on farmers
which they said were disproportionate to the
charges that industry itself bears.
• Review of
overhead costs
(Phase 1) in
conjunction with
DARD
• Review of overhead costs (Phase 2) to be
completed by November 2013
• Produce a publication, to be made available
to FBOs, outlining the basis of its charging
calculations on an annual basis .
FBO efficiency, throughput fluctuations, line
speed and other FBO controlled factors impact on
FSA efficiency
• The FSA consider that FBOs have a particular
impact on levels of idle time.
• There were mixed opinions on the effectiveness
of the business accord system. Some FBOs,
particularly where throughput is stable, find them
useful. Other FBOs refuse to sign them.
Engagement with food business operators and
industry representatives
• Industry groups highlighted their long and healthy
engagement with the FSA and commented
positively on the quality of service provided.
• At the FBO plant level, interviewees commented on
the good working relationship between FSA staff
and FBOs, in particular commenting on their
professional and co-operative approach.
• DARD have acknowledged the need to
address the issue of IUWT and have
recently entered into discussion with FSA in
NI on future proposals
Some industry stakeholders felt that the current
delivery model is “frustratingly close” to being
perfect; that the only remaining unsatisfactory
issue is inspection staff terms and conditions
which, it is felt, are too generous.
• Industry representatives consider that the
generous terms and conditions make the cost of
the service too high.
• It is also felt that inspection staff terms and
conditions contribute to limited flexibility of
operation, whereby additional inspection hours
are expensive.
Engagement with unions
• NIPSA considered its relationship with DARD to be
very positive and highlighted a healthy process of
consultation between the two organisations.
• The union identified a number of examples of co-
operation, including the ‘VPHU Directions
Handbook’.
• In the past 5 years, the only changes to terms and
conditions are those applicable to all Northern
Ireland Civil Servants; there have been no
significant changes to these.
• DARD are looking to increase training of
dual red and white meat inspectors to
increase staffing flexibility.
• In 2012, DARD and NIPSA agreed a
clarification of VPH-specific work practices
for certain areas where NICS has been
silent. DARD intends to revisit the
provisions of certain aspects of this
document e.g. around payment for
Unworked Booked Hours etc. - in the near
future.
Where FSA has less direct influence: issues & activity (NI)
This section looks at factors that can potentially impact FSA efficiency where FSA has relatively less influence, therefore requiring effective engagement with others who have
more direct influence. The issues identified represent the views expressed by interviewees; we have not substantiated these views other than where covered in the rest of this presentation.
29 FSA Meat Hygiene Controls
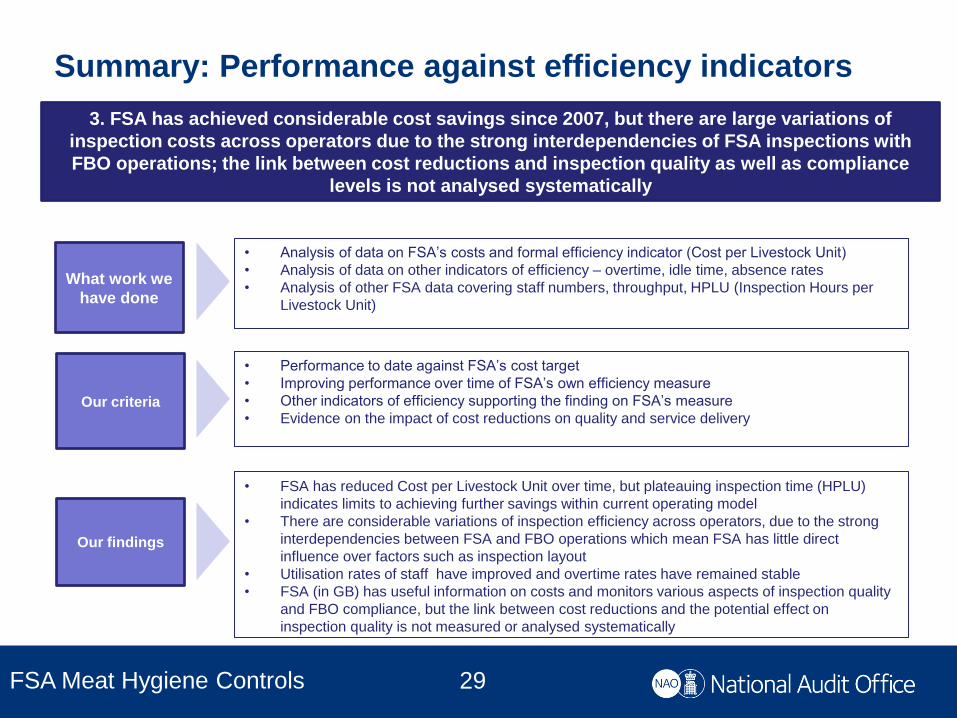
Summary: Performance against efficiency indicators
3. FSA has achieved considerable cost savings since 2007, but there are large variations of
inspection costs across operators due to the strong interdependencies of FSA inspections with
FBO operations; the link between cost reductions and inspection quality as well as compliance
levels is not analysed systematically
What work we
have done
Our criteria
• Analysis of data on FSA’s costs and formal efficiency indicator (Cost per Livestock Unit)
• Analysis of data on other indicators of efficiency – overtime, idle time, absence rates
• Analysis of other FSA data covering staff numbers, throughput, HPLU (Inspection Hours per
Livestock Unit)
• Performance to date against FSA’s cost target
• Improving performance over time of FSA’s own efficiency measure
• Other indicators of efficiency supporting the finding on FSA’s measure
• Evidence on the impact of cost reductions on quality and service delivery
Our findings
• FSA has reduced Cost per Livestock Unit over time, but plateauing inspection time (HPLU)
indicates limits to achieving further savings within current operating model
• There are considerable variations of inspection efficiency across operators, due to the strong
interdependencies between FSA and FBO operations which mean FSA has little direct
influence over factors such as inspection layout
• Utilisation rates of staff have improved and overtime rates have remained stable
• FSA (in GB) has useful information on costs and monitors various aspects of inspection quality
and FBO compliance, but the link between cost reductions and the potential effect on
inspection quality is not measured or analysed systematically

30 FSA Meat Hygiene Controls
Total costs of meat hygiene delivery in GB have fallen by 40% in real terms
between 2005/06 and 2011/12, mainly due to a reduction in staff numbers
Overall costs of meat hygiene delivery have fallen over
time, before and after the FSA/MHS merger
• Total meat hygiene delivery costs fell by 31%
(current prices) between 2005/06 and 2011/12
This equates to a 40% decrease (£40.5m –
see chart) in constant 2011/12 prices*
• Since the merger with MHS in 2010, FSA has
reduced costs by 10% in current prices
this equates to a 15% (£10.4m) decrease in
constant 2011/12 prices
There has been a steep reduction in staff numbers
between 2006-07 and 2012-13:
• Total (employed and contract) staff numbers
decreased by 651 (35 per cent) to 1,222
• MHI and related roles (the largest element)
decreased by 35%
• Official and Lead Veterinarian positions decreased
by 17%
• Managerial/admin staff decreased by 55%
The removal of BSE-related controls during this period
explains part of this change
• This removed the need for meat technicians,
numbering 150 in 2006/07
Source: FSA Operations Annual Report 2011-12; NAO analysis of FSA data
Source: National Audit Office analysis of FSA data
Note: * We have converted the FSA cost data (here and elsewhere) to
constant 2011/12 prices using the GDP deflator, to assess the change in
FSA costs by discounting inflation
31 FSA Meat Hygiene Controls
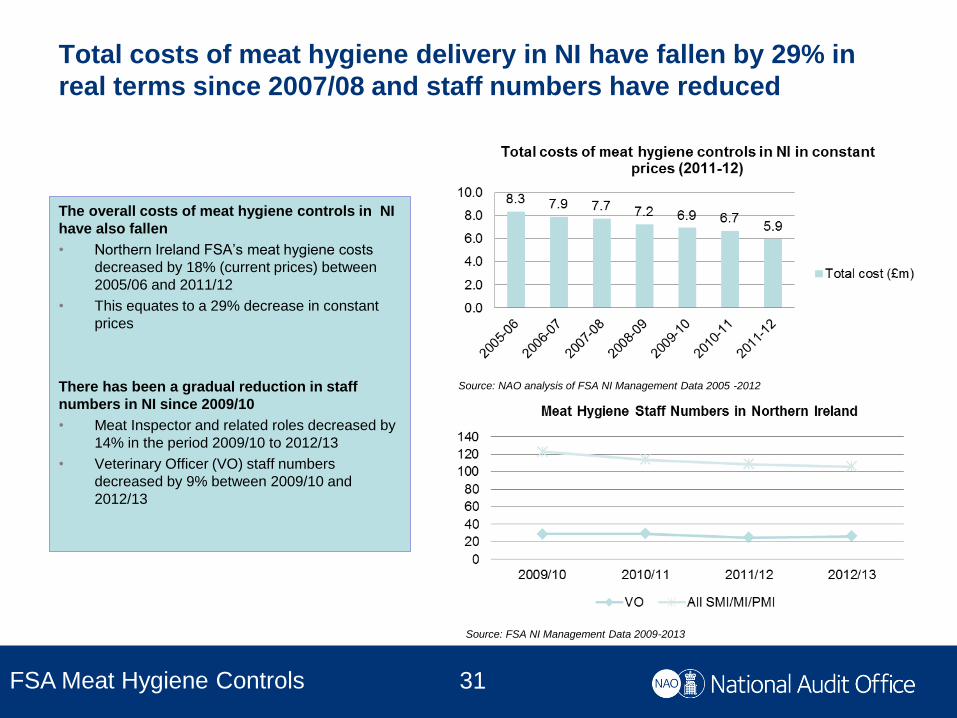
Total costs of meat hygiene delivery in NI have fallen by 29% in
real terms since 2007/08 and staff numbers have reduced
The overall costs of meat hygiene controls in NI
have also fallen
• Northern Ireland FSA’s meat hygiene costs
decreased by 18% (current prices) between
2005/06 and 2011/12
• This equates to a 29% decrease in constant
prices
There has been a gradual reduction in staff
numbers in NI since 2009/10
• Meat Inspector and related roles decreased by
14% in the period 2009/10 to 2012/13
• Veterinary Officer (VO) staff numbers
decreased by 9% between 2009/10 and
2012/13
Source: FSA NI Management Data 2009-2013
Source: NAO analysis of FSA NI Management Data 2005 -2012

32 FSA Meat Hygiene Controls
There has been a shift towards contracted field-based staff in GB,
which has reduced staff costs
Both OV and Meat Inspector numbers have fallen in
GB since 2006/07, but the latter fell at a faster rate
• The ratio of Meat Inspectors to OVs has fallen from
4.5:1 in 2006/07 to 3:1 in 2012/13
FSA is drawing proportionately more resource from
contract staff now than in 2006/07
• For OVs/LVs, the ratio of employed to contract fell
from 1:19 in 2006/07 to 1:54 in 2012/13
• For Meat Inspectors and related roles, the ratio of
employed to contract fell from 6:1 in 2006/07 to 4:1
in 2012/13
Costs are charged differently according to the role
and whether the staff member is employed or
contracted
• Resourcing a member of staff through contractors
costs FSA less than employing them directly
• Under contracts introduced from April 2012,
contract MHIs are charged on a time basis, but the
FSA does not incur additional overtime charges for
contract OVs
• Contract OVs form a larger proportion of staff now
compared to 2006/07
Source: National Audit Office analysis of FSA data
Source: National Audit Office analysis of FSA data
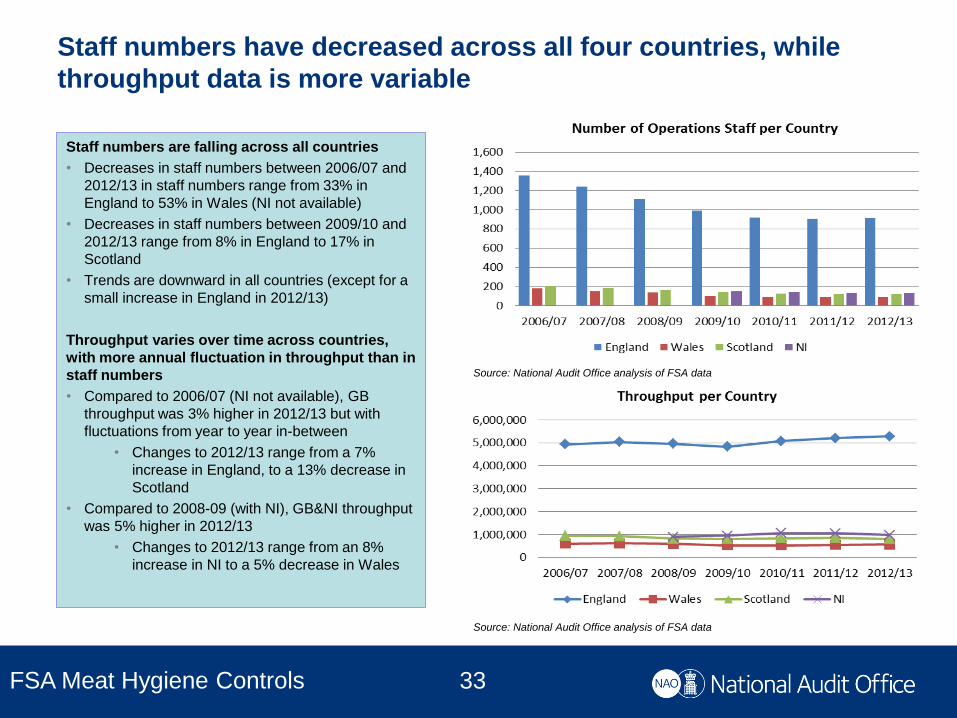
33 FSA Meat Hygiene Controls
Staff numbers have decreased across all four countries, while
throughput data is more variable
Staff numbers are falling across all countries
• Decreases in staff numbers between 2006/07 and
2012/13 in staff numbers range from 33% in
England to 53% in Wales (NI not available)
• Decreases in staff numbers between 2009/10 and
2012/13 range from 8% in England to 17% in
Scotland
• Trends are downward in all countries (except for a
small increase in England in 2012/13)
Throughput varies over time across countries,
with more annual fluctuation in throughput than in
staff numbers
• Compared to 2006/07 (NI not available), GB
throughput was 3% higher in 2012/13 but with
fluctuations from year to year in-between
• Changes to 2012/13 range from a 7%
increase in England, to a 13% decrease in
Scotland
• Compared to 2008-09 (with NI), GB&NI throughput
was 5% higher in 2012/13
• Changes to 2012/13 range from an 8%
increase in NI to a 5% decrease in Wales
Source: National Audit Office analysis of FSA data
Source: National Audit Office analysis of FSA data

34 FSA Meat Hygiene Controls
The number of livestock units inspected per member of
operational staff has increased substantially since 2006/07
Operational staff inspected more throughput each
year from 2006/07 until 2011/12
• Throughput per staff member increased by 60% in
GB between 2006/07 and 2012/13 (NI not available)
• Increases range from +49% (Scotland) to
+96% (Wales)
• Throughput per staff member in GB and NI increased
by 19% between 2009/10 and 2012/13
• Increases range from +19% (NI) to +23%
(Wales)
Throughput per staff number levels vary
considerably across countries
• NI is the most “productive” country within the UK (in
terms of the amount of throughput per operational
staff member) at 7,348 in 2012/13, followed by
Scotland.
• The industry structure, with concentration of meat
production in Scotland and NI among a relatively
smaller number of FBOs with larger plants compared
to England and Wales, is likely to be a key factor in
this variation.
Source: National Audit Office analysis of FSA data
Note: Throughput data is not available for Northern Ireland for the years 2006-07 to
2008-09.

35 FSA Meat Hygiene Controls
As inspection hours (per livestock unit) have been stable since late 2010,
the potential for further cost savings through staff reductions in the
current system is limited
Since mid-2010 CPLU has continued to fall with
HPLU.
• Cost Per Livestock Unit (CPLU) has continued to
fall and decreased by 7.2% in 2010/11 and 4.3% in
2011-12
• Hours Per Livestock Unit (HPLU) fell by 17%
between Apr 2010 and March 2013
Recent reductions in CPLU have mainly been due to
lower input costs
• Average HPLU* has remained relatively constant
(at around 0.33 hours) since the end of 2010
• Input-costs have reduced due to the on-going
switch to contracted staff, and the move to a fixed
price contract model
• There has also been an improvement in utilisation
rates of directly employed staff (reduction of
sickness absence rates, see Slide 40)
Source: National Audit Office analysis of FSA data
Source: National Audit Office analysis of FSA data
CPLU
£
HPLU
Average CPLU in each quarter, 2009/10 to 2012/13
Monthly average HPLU, 2010-11 to 2012-13
* Note: HPLU units are measured in hours per livestock unit and are
interpreted by converting the decimal based times into minutes. For
example; 0.33 would represent 20 minutes.
0.00
1.00
2.00
3.00
4.00
5.00
6.00
7.00
8.00
9.00
10.00
0.30
0.32
0.34
0.36
0.38
0.40

36 FSA Meat Hygiene Controls
Inspection costs per livestock unit are considerably lower in
Northern Ireland than in Great Britain
On average, inspection costs seem to be lower in NI
than in GB, on a per-livestock unit basis*
• Average CPLU in NI between April 2012 and March
2013 was £5.56 per livestock unit
• Equivalent CPLU in the rest of GB over the same
period was £7.56
• Average HPLU in NI between April 2012 and March
2013 was 0.24 hours per livestock unit
• Equivalent HPLU in GB over the same period was 0.31
hours per livestock unit
• We believe this is mainly due to throughput being
concentrated in the hands of companies with a larger
average size, which are cheaper to inspect per
livestock unit. For instance, in 2011/12, only 25% of
FBOs in NI had an annual throughput of 0-5,000
standardised livestock units per year, compared to 61%
of FBOs in GB
• Cost per livestock unit in N.I. between April 2012 and
March 2013 appeared to be rising, suggesting that
efficiency is decreasing (by this measure), though it is
not clear whether this will persist.
Cost per livestock unit, 2012-13*
Hours per livestock unit, 2012-13*
* Note: Our comparison is qualified because there are differences between
GB and NI in the way that time is charged, in part because FSA undertakes
considerably more work for Defra in GB than in NI. To derive a comparison, we
calculated HPLU for GB by excluding “Defra” time codes: GOBS, GBSE, GIMP,
GBSM, GSOM, GPAS, GVMD. The costs of time charged to Defra is not
detailed enough to allow exclusion of Defra-booked time costs from the CPLU
data for GB.
Source: National Audit Office analysis of FSA data
Source: National Audit Office analysis of FSA data
£4.00
£4.50
£5.00
£5.50
£6.00
£6.50
£7.00
£7.50
£8.00
G.B.
N.I. CPLU

37 FSA Meat Hygiene Controls
There are considerable differences in costs and efficiency
of inspections* across operators in both GB and NI
Average CPLU and HPLU (slide 36) mask
considerable variation in costs of inspection across
operators in GB
• Average CPLU is £5.20 for the most “efficient to inspect”
20% of operators; £86.49 for the least efficient 20%
• On average, the CPLU in the least “efficient to inspect”
FBOs is nearly 17 times higher than the cost in the most
efficient
• The HPLU of the most “efficient to inspect” 20% of
operators is 0.22, around 8 times smaller than that for
the least efficient 20%
Variation across operators is smaller in Northern
Ireland
• CPLU in the least “efficient to inspect” FBOs is nearly 8
times higher than the cost in the most efficient
businesses
• CPLU in NI lies in the range of £3.98 - £36.65,
compared with a range of £5.20 - £86.49 in GB
• HPLU in NI lies in the range of 0.15 - 1.25, compared
with a range of 0.22 – 1.87 in GB
All
Least
efficient
20%
Next
least
efficient
20%
Middle
20%
Next
most
efficient
20%
Most
efficient
20%
CPLU £7.55 £86.49 £31.52 £17.60 £10.31 £5.20
HPLU 0.32 1.87 1.47 0.85 0.36 0.22
Source: NAO analysis of FSA CPLU and HPLU data, 2012/13
Note: Hours and cost relate to slaughter-associated hours and costs only. CPLU and
HPLU are given as averages for the stratum of FBOs represented, by efficiency rank.
CPLU and HPLU, 2012/13, GB
Source: NAO analysis of FSA NI CPLU and HPLU data, 2011/12
All
Least
efficient
20%
Next
least
efficient
20%
Middle
20%
Next
most
efficient
20%
Most
efficient
20%
CPLU £5.8 £36.65 £10.66 £7.51 £5.84 £3.98
HPLU 0.24 1.25 0.41 0.32 0.26 0.15
CPLU and HPLU, April 2011-Dec 2012, Northern Ireland
* Note: “Efficiency” on this slide refers to the efficiency of inspections, as measured by
the CPLU (FSA cost of inspection per livestock unit) and HPLU, at different operators
during 2012/13.
* Note: HPLU units are measured in hours per livestock unit and are
interpreted by converting the decimal based times into minutes. For
example; 0.33 would represent 20 minutes.
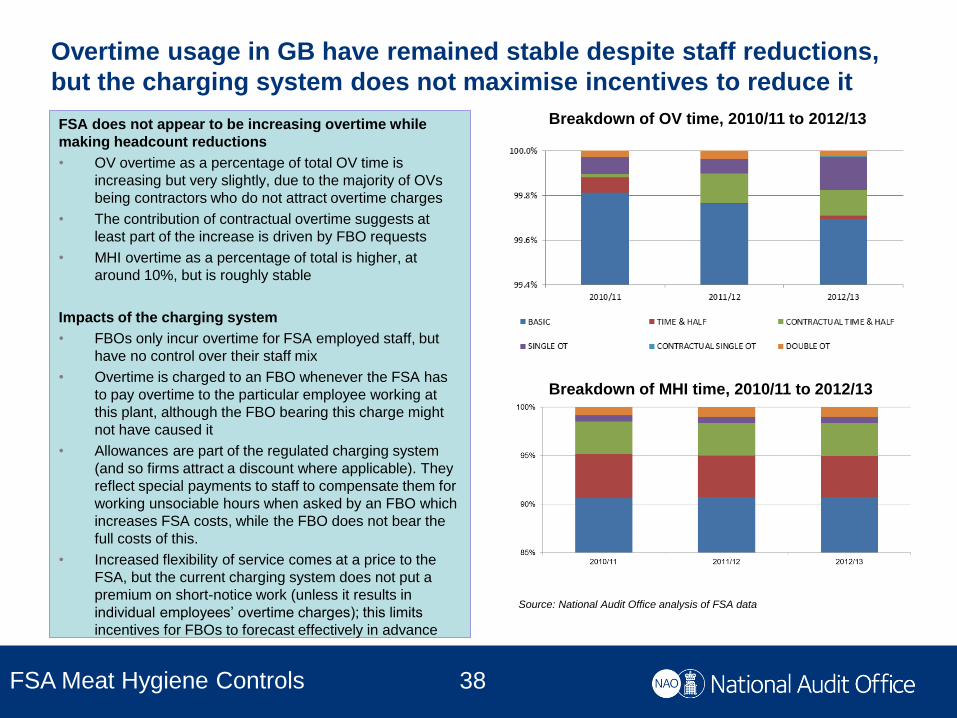
38 FSA Meat Hygiene Controls
Overtime usage in GB have remained stable despite staff reductions,
but the charging system does not maximise incentives to reduce it
Breakdown of OV time, 2010/11 to 2012/13 FSA does not appear to be increasing overtime while
making headcount reductions
• OV overtime as a percentage of total OV time is
increasing but very slightly, due to the majority of OVs
being contractors who do not attract overtime charges
• The contribution of contractual overtime suggests at
least part of the increase is driven by FBO requests
• MHI overtime as a percentage of total is higher, at
around 10%, but is roughly stable
Impacts of the charging system
• FBOs only incur overtime for FSA employed staff, but
have no control over their staff mix
• Overtime is charged to an FBO whenever the FSA has
to pay overtime to the particular employee working at
this plant, although the FBO bearing this charge might
not have caused it
• Allowances are part of the regulated charging system
(and so firms attract a discount where applicable). They
reflect special payments to staff to compensate them for
working unsociable hours when asked by an FBO which
increases FSA costs, while the FBO does not bear the
full costs of this.
• Increased flexibility of service comes at a price to the
FSA, but the current charging system does not put a
premium on short-notice work (unless it results in
individual employees’ overtime charges); this limits
incentives for FBOs to forecast effectively in advance
Source: National Audit Office analysis of FSA data
Breakdown of MHI time, 2010/11 to 2012/13

39 FSA Meat Hygiene Controls
Overtime as a percentage of staff time in Northern Ireland
has reduced between 2007 and 2013
Share of overtime hours of all NI inspection staff,
2007/08 – 2012/13*
* Includes FSA in NI, DARD and DEFRA hours booked
Source: National Audit Office analysis of FSA data
As in GB, the FSA in NI and its delivery
partner DARD do not appear to have
responded to headcount reductions by
increasing overtime
• Overtime as a percentage of all staff time
has reduced from 13% in 2007/08 to 11%
in 2012/13
• Direct comparisons of overtime and
utilisation rates of staff between GB and
NI are difficult due to different
employment models and approaches to
calculating overtime, but the available
evidence indicates that the share of
overtime for MHIs in both GB and NI is
broadly similar (around 10%)
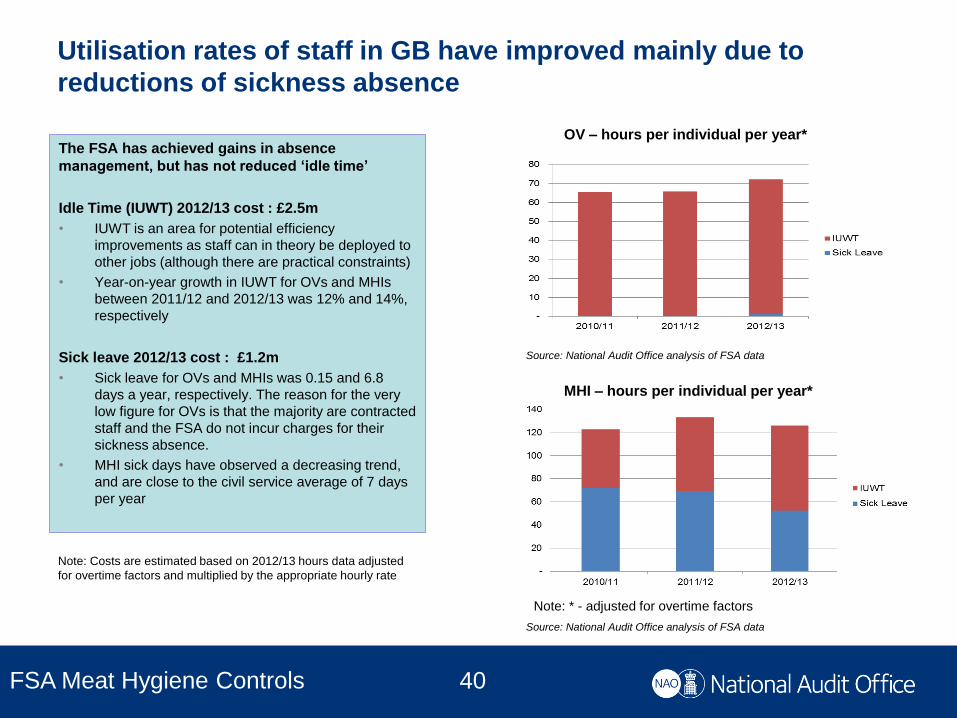
40 FSA Meat Hygiene Controls
Utilisation rates of staff in GB have improved mainly due to
reductions of sickness absence
The FSA has achieved gains in absence
management, but has not reduced ‘idle time’
Idle Time (IUWT) 2012/13 cost : £2.5m
• IUWT is an area for potential efficiency
improvements as staff can in theory be deployed to
other jobs (although there are practical constraints)
• Year-on-year growth in IUWT for OVs and MHIs
between 2011/12 and 2012/13 was 12% and 14%,
respectively
Sick leave 2012/13 cost : £1.2m
• Sick leave for OVs and MHIs was 0.15 and 6.8
days a year, respectively. The reason for the very
low figure for OVs is that the majority are contracted
staff and the FSA do not incur charges for their
sickness absence.
• MHI sick days have observed a decreasing trend,
and are close to the civil service average of 7 days
per year
MHI – hours per individual per year*
OV – hours per individual per year*
Note: * - adjusted for overtime factors
Note: Costs are estimated based on 2012/13 hours data adjusted
for overtime factors and multiplied by the appropriate hourly rate
Source: National Audit Office analysis of FSA data
Source: National Audit Office analysis of FSA data
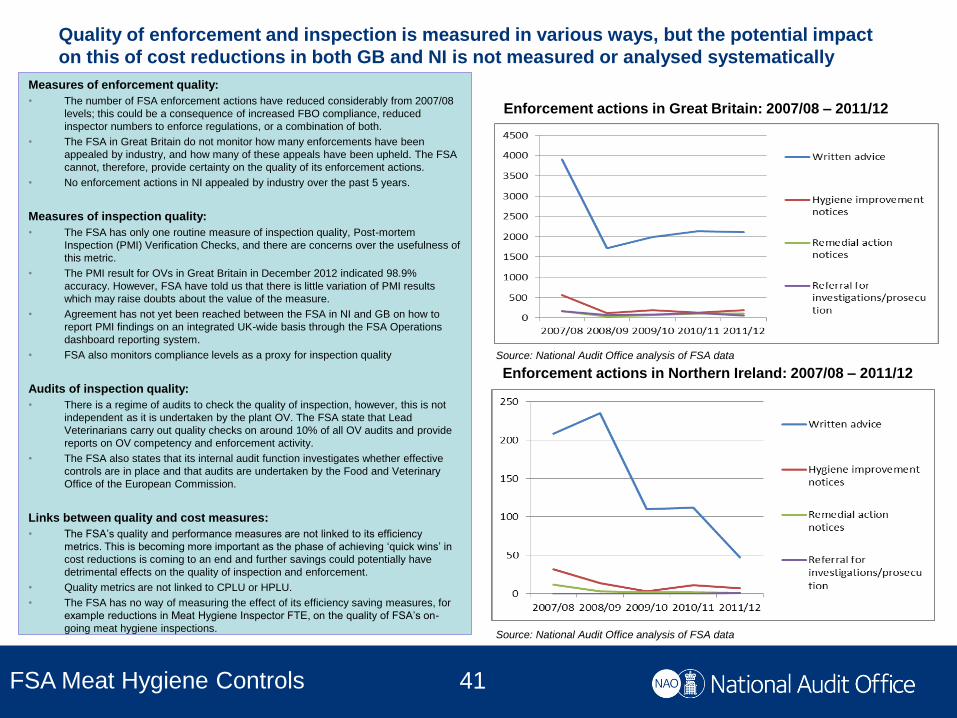
41 FSA Meat Hygiene Controls
Quality of enforcement and inspection is measured in various ways, but the potential impact
on this of cost reductions in both GB and NI is not measured or analysed systematically
Measures of enforcement quality:
• The number of FSA enforcement actions have reduced considerably from 2007/08
levels; this could be a consequence of increased FBO compliance, reduced
inspector numbers to enforce regulations, or a combination of both.
• The FSA in Great Britain do not monitor how many enforcements have been
appealed by industry, and how many of these appeals have been upheld. The FSA
cannot, therefore, provide certainty on the quality of its enforcement actions.
• No enforcement actions in NI appealed by industry over the past 5 years.
Measures of inspection quality:
• The FSA has only one routine measure of inspection quality, Post-mortem
Inspection (PMI) Verification Checks, and there are concerns over the usefulness of
this metric.
• The PMI result for OVs in Great Britain in December 2012 indicated 98.9%
accuracy. However, FSA have told us that there is little variation of PMI results
which may raise doubts about the value of the measure.
• Agreement has not yet been reached between the FSA in NI and GB on how to
report PMI findings on an integrated UK-wide basis through the FSA Operations
dashboard reporting system.
• FSA also monitors compliance levels as a proxy for inspection quality
Audits of inspection quality:
• There is a regime of audits to check the quality of inspection, however, this is not
independent as it is undertaken by the plant OV. The FSA state that Lead
Veterinarians carry out quality checks on around 10% of all OV audits and provide
reports on OV competency and enforcement activity.
• The FSA also states that its internal audit function investigates whether effective
controls are in place and that audits are undertaken by the Food and Veterinary
Office of the European Commission.
Links between quality and cost measures:
• The FSA’s quality and performance measures are not linked to its efficiency
metrics. This is becoming more important as the phase of achieving ‘quick wins’ in
cost reductions is coming to an end and further savings could potentially have
detrimental effects on the quality of inspection and enforcement.
• Quality metrics are not linked to CPLU or HPLU.
• The FSA has no way of measuring the effect of its efficiency saving measures, for
example reductions in Meat Hygiene Inspector FTE, on the quality of FSA’s on-
going meat hygiene inspections.
Enforcement actions in Great Britain: 2007/08 – 2011/12
Enforcement actions in Northern Ireland: 2007/08 – 2011/12
Source: National Audit Office analysis of FSA data
Source: National Audit Office analysis of FSA data
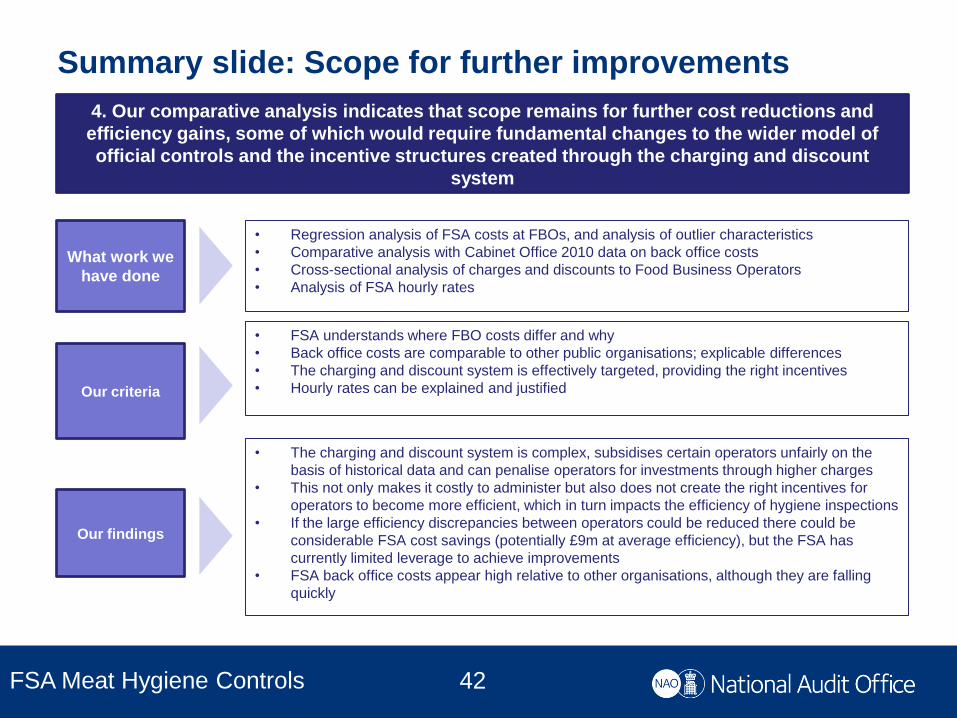
42 FSA Meat Hygiene Controls
Summary slide: Scope for further improvements
4. Our comparative analysis indicates that scope remains for further cost reductions and
efficiency gains, some of which would require fundamental changes to the wider model of
official controls and the incentive structures created through the charging and discount
system
What work we
have done
Our criteria
• Regression analysis of FSA costs at FBOs, and analysis of outlier characteristics
• Comparative analysis with Cabinet Office 2010 data on back office costs
• Cross-sectional analysis of charges and discounts to Food Business Operators
• Analysis of FSA hourly rates
• FSA understands where FBO costs differ and why
• Back office costs are comparable to other public organisations; explicable differences
• The charging and discount system is effectively targeted, providing the right incentives
• Hourly rates can be explained and justified
Our findings
• The charging and discount system is complex, subsidises certain operators unfairly on the
basis of historical data and can penalise operators for investments through higher charges
• This not only makes it costly to administer but also does not create the right incentives for
operators to become more efficient, which in turn impacts the efficiency of hygiene inspections
• If the large efficiency discrepancies between operators could be reduced there could be
considerable FSA cost savings (potentially £9m at average efficiency), but the FSA has
currently limited leverage to achieve improvements
• FSA back office costs appear high relative to other organisations, although they are falling
quickly

43 FSA Meat Hygiene Controls
The FSA’s charging and discount system has an important
impact on the overall efficiency of meat inspections
Four main elements determine FBO’s charges (based on Regulation (EC) No. 882/2004) : • Time based charges
• A discount to reduce the time cost charge (where applicable)
• Allowances for agreed slaughterhouse staff costs (commonly known as PIAs)
• EU minima: EC legislation sets minimum charges per carcase type and weight of meat for cutting premises. Although
the FSA charges on a time cost basis, it is still required to ensure compliance with the minimum charges. If time based
charges, invoiced in full with no discount, fall below the EU minimum the FBO will not be required to pay any more.
Tierney Review Recommendations (2007): to develop
a new charging system for 2009/10 which would
The current charging system
1. Allow a progressive move towards full cost
recovery
• FSA’s most recent plan to move to full cost charging over a 3 year period
(except for low-throughput establishments) was approved by the FSA board
and the Regulatory Policy Committee, but rejected by the Reducing
Regulation Committee in March 2012 on the grounds that the FSA had yet to
demonstrate that it was delivering the official controls efficiently.
2. Permit the more effective targeting of any subsidy
• The current discount system is not effectively targeted and mainly subsidies
the least efficient operators; it is highest for very small, but also for some
very large operators, and based on per-head inspection cost data from 2008
which has little relevance today.
3. Provide financial incentives to FBOs to comply
and to make efficient use of TMHS [now: FSA]
services.
• The current system neither rewards FBOs for good compliance, nor does it
put a premium on flexibility/short-term requests; for those FBOs with high
discounts, it does not incentivise the efficient use of FSA resources.
• The application of EU minima can disincentivise FBO’s investments (e.g. in
platforms) which would improve their efficiency and reduce inspection time,
as this might result in them having to pay a large share of costs.

Illustrating the complexity of the current charging and discount system 20
12-1
3 in
puts 2011-12 final charging calculation Business agreements (only for approvals of
new FBOs at new establishments)
FSA's charging rates and allowances
FSA 2011-12 activity recording
EU minimum rates
2011-12 throughput data return
from FBO
Exchange rates
Full cost (B.i) EU minimum for throughput (B.ii)
(predicted 2012-13 hours (=2011-12 actual
hours) x 2012-13 rates) + predicted allowance
2011-12 throughput x € minimum
rate x 2012-13 £:€ exchange rate
EU requirement (B.iii)
lower of full cost and EU minimum
2012-13 expected charges (B.iv)
Lower of:
~ full cost
~ higher of equivalent 2011-12
charge and EU requirement
Discount value (B.vi)
Full cost minus 2012-13 expected charges
Discount % (B.v)
Discount value divided by full cost
2012
-13
Inpu
ts 2012-13 preliminary calculation Business agreements
FSA's charging rates and allowances
FSA 2012-13 activity recording
EU minimum rates
2012-13 throughput data return
from FBO
Exchange rates
2012-13 discount % Full cost (A.i) EU minimum for throughput (A.ii)
determined on previous
(preliminary) calculation
(actual 2012-13 hours x 2012-13 rates) + allowances 2012-13 throughput x € minimum
rate x 2012-13 £:€ exchange rate
Equivalent charge (A.iv) EU requirement (A.iii)
Full cost x 2012-13 discount % lower of full cost and EU minimum
Revised 2012-13 discount %
Adjust if necessary to ensure
that Equivalent charge is not
less than EU requirement
Equivalent 2012-13 charge (A.v)
Full cost x revised 2012-13 discount %
To 2013-14 preliminary calculation
2012
-13
prel
imin
ary
calc
ulat
ion
2012
-13
final
cal
cula
tion
National Audit Office 44

45 FSA Meat Hygiene Controls
Comparison of charge out rates
Great Britain Northern Ireland
Core hourly rate Overtime hourly rate Core hourly rate Overtime hourly rate
OV £36.80 £55.20 £43.46 £54.63
MHI £28.80 £43.20 £26.86 £29.73
SMI £30.28 £34.87
Notes
• Overtime rates in GB are charged when hours for the day/week are exceeded Monday - Friday and on Saturdays, Sundays & Bank holidays.
• NI & GB calculate overtime charges in different ways. GB "plus up" the hours to single time and then spread the overhead across all the hours. NI
apply overheads only to basic hours, and then add a time premium to derive overtime rates
• The SMI (Senior Meat inspector) role does not exist in GB.
Source: Food Standards Agency; National Audit Office analysis of FSA data

46 FSA Meat Hygiene Controls
The discount subsidises smaller, more expensive to inspect FBOs
as well as some very large operators
Hours per
standardised
livestock
unit (HPLU)
Throughput of decile:
(thousands)
Companies in decile:
Average firm throughput:
(thousands)
660 664 671 653 634 696 654 700 671 622
245 31 21 15 11 89 7 6 4 3
3 21 32 44 57 78 93 117 168 208
Decile of FBO according to increasing throughput
Analysis of FSA hours incurred at different sizes of FBO
Source: National Audit Office analysis of FSA data
All components of HPLU tend to decrease with the scale of FBOs, as larger operators tend to have faster line
speed, a more efficient inspection layout and regular operating hours and throughput (which reduces idle time).

47 FSA Meat Hygiene Controls
The current charging system provides no incentives for
FBOs with high discounts to use FSA resources efficiently
Discount rates are based on historical cost data
of individual FBOs, rather than being effectively
targeted
• The discount is set so that the monthly charges
for official controls will, assuming all factors are
unchanged, be the same as in 2008/09 (when
inspection costs were calculated on a per-head
basis), subject to compliance with EU minima
• FBOs with very similar characteristics can
receive extremely different discount rates, and
discount rates are on average highest for the
smallest as well as largest operators (see slide
46)
2012/13 data indicates an inverse relationship
between efficiency and discounts
• The least costly to inspect operators (measured
by the CPLU to the FSA) received on average
the smallest discounts
Source: National Audit Office analysis of FSA data
Comparison of discount rates to inspection costs (GB),
2012/13
Note: In preparing this table we ordered FBOs according to the average inspection
cost per livestock unit (to the FSA) for each FBO during 2012/13. In this context, for
example, “most efficient” means the 20% of FBOs with the lowest CPLU.
All
Least
efficient
20%
Next
least
efficient
20%
Middle
20%
Next
most
efficient
20%
Most
efficient
20%
CPLU £7.52 £81.80 £30.36 £17.80 £10.00 £5.14
% discount 46% 92% 83% 71% 57% 25%

48 FSA Meat Hygiene Controls
Operators with the highest share of ‘idle time’ tend to
receive large discounts
Percentage discount on slaughter inspection costs
Pe
rce
nta
ge
sh
are
of IU
WT
in s
lau
gh
terh
ou
se h
ou
rs
FBO-level Scatterplot: % discount vs. % idle time, 2012/13 (GB)
N = 395 High discounts reduce incentives for
FBOs to minimise bookings of unused
inspection hours
• There is no strong overall statistical
correlation between discounts and
the percentage share of IUWT
bookings
• But all but one of the FBOs with
more than 20% of their inspection
hours booked as ‘idle time’ receive
a discount of more than 50%
Source: National Audit Office analysis of FSA data
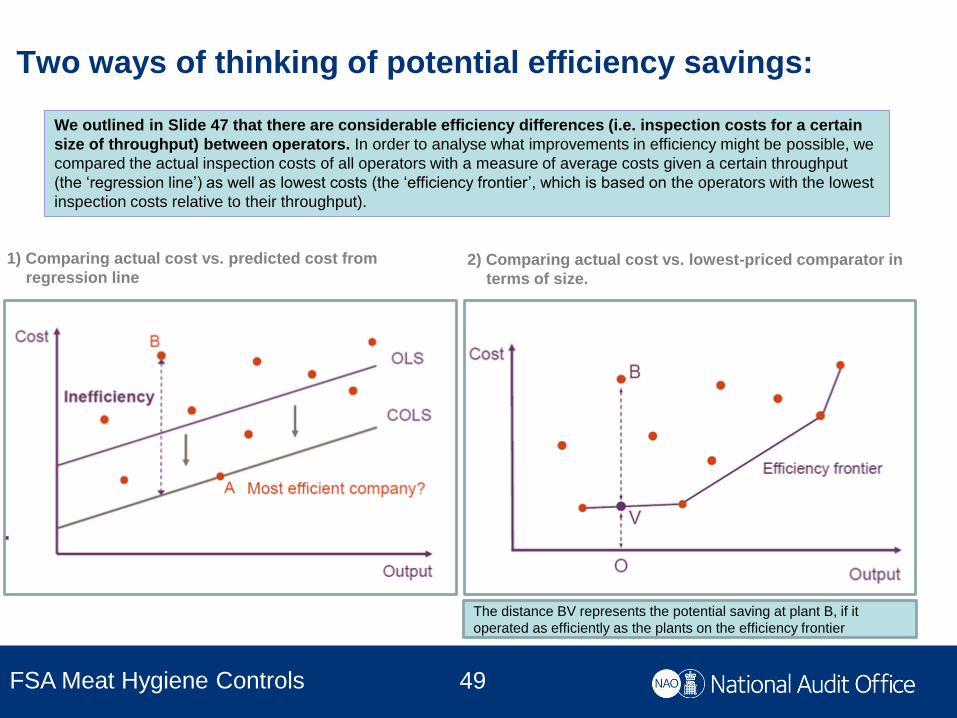
49 FSA Meat Hygiene Controls
Two ways of thinking of potential efficiency savings:
1) Comparing actual cost vs. predicted cost from
regression line 2) Comparing actual cost vs. lowest-priced comparator in
terms of size.
We outlined in Slide 47 that there are considerable efficiency differences (i.e. inspection costs for a certain
size of throughput) between operators. In order to analyse what improvements in efficiency might be possible, we
compared the actual inspection costs of all operators with a measure of average costs given a certain throughput
(the ‘regression line’) as well as lowest costs (the ‘efficiency frontier’, which is based on the operators with the lowest
inspection costs relative to their throughput).
The distance BV represents the potential saving at plant B, if it
operated as efficiently as the plants on the efficiency frontier

50 FSA Meat Hygiene Controls
2012/13 regression line
Inspection cost versus throughput (firm level), 2012-13
The analysis shows that there are a number of FBOs with much higher inspection costs than the average predicted
costs for their throughput size (the ‘regression’ line). The efficiency ‘frontier’ depicts a line of predicted maximum
efficiency, on the basis of the FBOs with the lowest inspection costs relative to throughput.
Source: National Audit Office analysis of GB FSA data
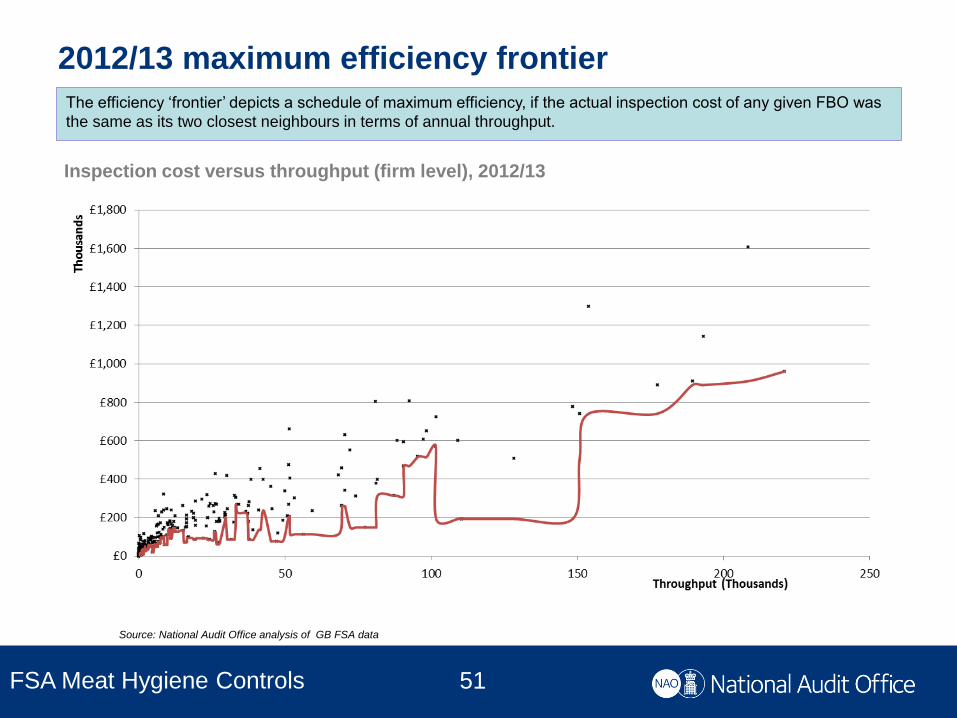
51 FSA Meat Hygiene Controls
2012/13 maximum efficiency frontier
Inspection cost versus throughput (firm level), 2012/13
The efficiency ‘frontier’ depicts a schedule of maximum efficiency, if the actual inspection cost of any given FBO was
the same as its two closest neighbours in terms of annual throughput.
Source: National Audit Office analysis of GB FSA data
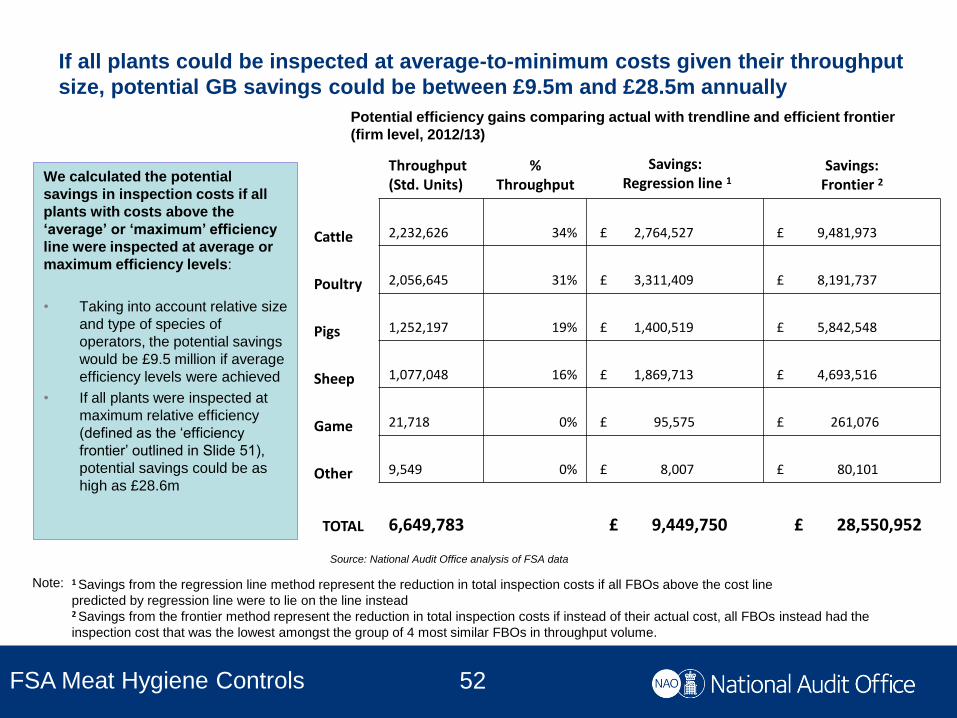
52 FSA Meat Hygiene Controls
If all plants could be inspected at average-to-minimum costs given their throughput
size, potential GB savings could be between £9.5m and £28.5m annually
Potential efficiency gains comparing actual with trendline and efficient frontier
(firm level, 2012/13)
1 Savings from the regression line method represent the reduction in total inspection costs if all FBOs above the cost line
predicted by regression line were to lie on the line instead 2 Savings from the frontier method represent the reduction in total inspection costs if instead of their actual cost, all FBOs instead had the
inspection cost that was the lowest amongst the group of 4 most similar FBOs in throughput volume.
Note:
We calculated the potential
savings in inspection costs if all
plants with costs above the
‘average’ or ‘maximum’ efficiency
line were inspected at average or
maximum efficiency levels:
• Taking into account relative size
and type of species of
operators, the potential savings
would be £9.5 million if average
efficiency levels were achieved
• If all plants were inspected at
maximum relative efficiency
(defined as the ‘efficiency
frontier’ outlined in Slide 51),
potential savings could be as
high as £28.6m
Source: National Audit Office analysis of FSA data
Throughput (Std. Units)
% Throughput
Savings: Regression line 1
Savings: Frontier 2
Cattle
2,232,626 34% £ 2,764,527 £ 9,481,973
Poultry
2,056,645 31% £ 3,311,409 £ 8,191,737
Pigs
1,252,197 19% £ 1,400,519 £ 5,842,548
Sheep
1,077,048 16% £ 1,869,713 £ 4,693,516
Game
21,718 0% £ 95,575 £ 261,076
Other
9,549 0% £ 8,007 £ 80,101
TOTAL
6,649,783 £ 9,449,750 £ 28,550,952

53 FSA Meat Hygiene Controls
The factors that drive the efficiency differences: analysis of
‘outliers’
Analysis of the factors that drive above-average inspection costs per livestock unit:
• FBO and FSA efficiency are closely interlinked: if an FBO does not use FSA resources efficiently (e.g. through its
choice of plant layout or working hours) this has a direct impact on inspection processes and hours, and therefore
costs. FSA decisions and practices also affect how FBOs make use of FSA resources (e.g. charging; terms and
conditions of FSA inspectors).
• To identify the factors which drive higher than expected costs and to assess the extent to which the FSA has
control over these, we identified from our regression analysis the 20 FBOs with the highest inspection costs
relative to expected costs given their size and species mix, and compared key cost drivers (slide 54, four “quant
analysis” columns) to those of other FBOs
• We also gathered the views of inspection teams and FSA management on the factors which drive above-average
inspection costs.
From this analysis, the main drivers of high relative inspection costs appeared to be:
• Slow line speed (due to old equipment, or variety of slaughtered species), requiring longer inspection time per
livestock unit
• Above average idle time and overtime
• Long operating hours /shift working (requiring change-over of staff)
The FSA has only indirect influence on these factors, but a further in-depth analysis of the specific factors
driving high inspection costs on an individual FBO basis could help the development of their approach on
how to address those (e.g. through better engagement with FBOs and stronger incentives for an efficient use
of FSA resources).
Source: National Audit Office analysis of FSA data

54 FSA Meat Hygiene Controls
Qualitative and quantitative analysis of the factors driving above-
average inspection costs in outliers
The main factors driving high costs are long
inspection time per livestock unit, caused by
slow line speed, as well as above average
overtime and idle time hours. FSA has only
indirect influence on these factors.
Qualitative findings:
• Old equipment, slow throughput, long working
hours/shift working and overtime arrangements
commonly cited as driving higher than expected
costs
Quantitative findings:
• The main factor driving excessive costs is above-
average inspection time, with idle time (IUWT)
also relevant in several cases
• Average HPLU in the 20 greatest outlier1 FBOs is
around 0.39 – approximately 0.12 higher than the
average HPLU which might be expected of this
sample of 20, based on the size of FBOs within
• There is no indication that unchargeable codes
(such as travel or admin) are important HPLU
drivers
• There are more casual and contracted overtime
hours per livestock unit in outliers than in non-
outliers
• However, basic hours are driving most of the
change in average HPLU between outliers and
non-outliers
We compared the timecode components of the HPLU for the 20 greatest outliers with the components for HPLU in
the remainder of FBOs. Where the difference between actual and expected timecode HPLU was greater than 5%
of expected HPLU for a FBO of that size, we flagged this as significant. Note: 1 Defined as greatest excess cost above the
regression line of cost on throughput

55 FSA Meat Hygiene Controls
Regression analysis of potential efficiency for Northern Ireland
Inspection cost versus throughput (firm level), 2012/13
Plant A
Plant B
Plant C
Insp
ecti
on
co
st
Slaughter Throughput (standardised livestock units)
The regression uses the actual NI
inspection cost and throughput data from
FBOs to predict what the best estimate of
cost should be, given any combination of
throughput from different species.
Given the much smaller number of operators
we had to apply a different approach to the
regression analysis compared to the GB data,
to reflect the higher degree of statistical
uncertainty (1). The line is not straight
because there are 5 inputs to the regression
(poultry, cattle, pigs, sheep, and other), which
can’t be depicted in a two-dimensional space.
Cost outliers are the crosses which lie above
the line (2). There are three operators with
higher than expected inspection cost given
their amount and composition of throughput.
1 Because the number of observations is low, there is a
degree of statistical uncertainty over where the ‘true’ line
should be drawn, but we are 95% sure that the true line
lies between the upper and lower bound.
2 Where they are above the upper-bound line, there is
only a 2.5% chance that they lie on the true regression
line. This is a high level of confidence that the difference
between the actual and predicted inspection cost
represents an anomaly.
Source: National Audit Office analysis of FSA data

56 FSA Meat Hygiene Controls
The estimated potential savings in NI are between
£0.2m and £0.5m
Potential efficiency gains comparing FBO outliers with regression line, 2012/13
Throughput
(Std. Units) %
Savings:
Upper Bound1 %
Savings:
Regression line 2
%
Poultry 248,835 26% £101,713 56% £185,480 40%
Cattle 449,441 46% £56,691 31% £189,394 41%
Pigs 230,967 24% £21,570 12% £84,644 18%
Sheep 42,324 4% £208 0% £7,424 2%
Other 891 0% 0 0% 0 0%
TOTAL 972,458 £180,182 £466,943
1 Savings to the Upper bound represent the reduction in total inspection costs if all FBOs above the 95% CI for the regression line were to lie on the
85% CI upper bound line instead
2 Savings from the regression line method represent the reduction in total inspection costs if all FBOs above the cost line
predicted by regression line were to lie on the line instead
Note:
We calculated the potential savings in inspection costs if all of the least “efficient to inspect” plants were inspected at improved
efficiency levels:
Taking into account relative size and type of species of operators, the potential savings would be £0.46m if average efficiency levels would be achieved. If the
three ‘outlier’ plants were to operate at the Upper Bound efficiency level, savings of £0.18m could be achieved. A more in-depth analysis of the reasons why
the ‘outlier’ plants have higher than expected inspection costs would be necessary to outline the reasons for their relative inefficiency and best approach to
address this.
Source: National Audit Office analysis of FSA data
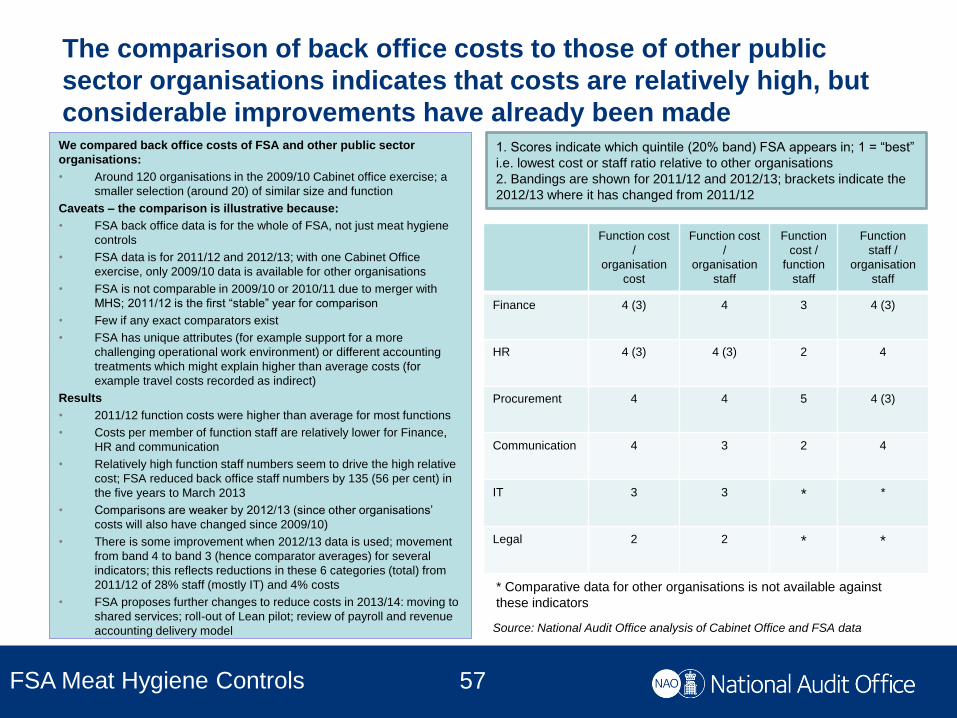
57 FSA Meat Hygiene Controls
The comparison of back office costs to those of other public
sector organisations indicates that costs are relatively high, but
considerable improvements have already been made We compared back office costs of FSA and other public sector
organisations:
• Around 120 organisations in the 2009/10 Cabinet office exercise; a
smaller selection (around 20) of similar size and function
Caveats – the comparison is illustrative because:
• FSA back office data is for the whole of FSA, not just meat hygiene
controls
• FSA data is for 2011/12 and 2012/13; with one Cabinet Office
exercise, only 2009/10 data is available for other organisations
• FSA is not comparable in 2009/10 or 2010/11 due to merger with
MHS; 2011/12 is the first “stable” year for comparison
• Few if any exact comparators exist
• FSA has unique attributes (for example support for a more
challenging operational work environment) or different accounting
treatments which might explain higher than average costs (for
example travel costs recorded as indirect)
Results
• 2011/12 function costs were higher than average for most functions
• Costs per member of function staff are relatively lower for Finance,
HR and communication
• Relatively high function staff numbers seem to drive the high relative
cost; FSA reduced back office staff numbers by 135 (56 per cent) in
the five years to March 2013
• Comparisons are weaker by 2012/13 (since other organisations’
costs will also have changed since 2009/10)
• There is some improvement when 2012/13 data is used; movement
from band 4 to band 3 (hence comparator averages) for several
indicators; this reflects reductions in these 6 categories (total) from
2011/12 of 28% staff (mostly IT) and 4% costs
• FSA proposes further changes to reduce costs in 2013/14: moving to
shared services; roll-out of Lean pilot; review of payroll and revenue
accounting delivery model
1. Scores indicate which quintile (20% band) FSA appears in; 1 = “best”
i.e. lowest cost or staff ratio relative to other organisations
2. Bandings are shown for 2011/12 and 2012/13; brackets indicate the
2012/13 where it has changed from 2011/12
Function cost
/
organisation
cost
Function cost
/
organisation
staff
Function
cost /
function
staff
Function
staff /
organisation
staff
Finance 4 (3) 4 3 4 (3)
HR 4 (3) 4 (3) 2 4
Procurement 4 4 5 4 (3)
Communication 4 3 2 4
IT 3 3 * *
Legal 2 2 * *
* Comparative data for other organisations is not available against
these indicators
Source: National Audit Office analysis of Cabinet Office and FSA data

58 FSA Meat Hygiene Controls
Working with contractors: Context and methodology
What we
did
We analysed the effect of the FSA’s current contractual arrangements on its ability to deliver meat hygiene controls as efficiently as
possible. To examine this we:
• held discussions with the FSA on contract management issues;
• held discussions with representatives of both contractors – HallMark and Eville & Jones;
• undertook a review of the management structures of the FSA and its contractors, and of FSA data on its use of contractors.
Context
• In 2012 the FSA moved to a new operations field structure. To accompany this change the FSA restructured its arrangements
with its contractors for the delivery of official meat controls by re-tendering contracts on a larger regional basis, rather than the
“cluster” basis that existed previously. FSA said it also wanted to address problems with the previous model associated with poor
supplier performance. There are six regions and contractors were invited to tender to supply to each region. The 6 main regions
are Scotland, Wales and 4 regions in England.
• The FSA issued contracts to two contractors: Eville & Jones in England, and HallMark in Scotland and Wales. Under the
arrangements contractors are required to provide a managed service (meaning, the contractor is responsible for elements such
as staff management and training) for the supply of Official Veterinarians, Meat Hygiene Inspectors, and short term Lead
Veterinarians. Suppliers must meet detailed conditions, as specified in the relevant contracts. In conjunction with the FSA,
suppliers are required to develop, maintain and improve performance and service with a view to enhancing the overall delivery of
service. Contractors have their own management structures in place to facilitate this and the FSA manages contractor
performance using a performance management framework.
• The number of contract staff as a proportion of total staff is increasing. Almost all OVs who work at FBO plants are contracted
staff. MHIs are primarily employed directly by the FSA, although contractors provide some, primarily to fill the gaps and provide a
resource “pool”. Under the new contract arrangements, the FSA pay a fixed price for the provision of Official Veterinarian staff,
contract Meat Hygiene Inspectors are supplied on a time basis. In 2011/12 , FSA delivery partners provided 320 (98.8%) Official
Veterinarians and 188 (24.2%) Meat Hygiene Inspectors.
• The value of the current fixed price contract for the provision of OVs is £14.8 million per year. Total contractor costs charged to
the FSA increased from £22 million in 2010/11 to just over £23 million in 2011/12. This is largely explained by an increase in
contractor hours worked by 32,000 over this period. FSA forecasts that contractor costs charged to the FSA will decrease by an
estimated £2 million in 2012/13, and a further £200K in 2013/14, savings partly attributed to the move to the fixed price charging
structure.

59 FSA Meat Hygiene Controls
Working with contractors: Risks associated with the FSA’s contracting
model
Risk area What we found Potential impact on FSA efficiency
Sustainability
• Sustainability of competition: the latest contract could reduce competition and
increased the FSA’s reliance on a small number of contractors.
• Sustainability of the contract model: FSA is aware of the fact that having
contractors on a call-off basis in increasing numbers may be a difficult model to
sustain
• Failure or withdrawal of one or more suppliers could,
potentially, have severe consequences on the ability of
the FSA to deliver its service in the short term. In the
longer-term it could lead to a monopoly situation which
would have a negative impact on FSA efficiency.
Alignment of
contractor and
FSA incentives
• The current contract provides limited opportunity for contractors to grow and
expand their business. As revenues are fixed there is no potential for increased
margins. As there is no way to win more business the only way to improve profit
position is to reduce costs. There is a risk that the contractor is therefore
incentivised to let go experienced (and better paid) staff and replace them with
cheaper, less qualified people.
• As contractors can no longer win any new contracts, and the FSA has limited
choice between different suppliers, there is little incentive for contractors to
develop and improve the quality of service delivered.
• Due to a lack of contractor competitions within regions it is impossible for
contractors to demonstrate, through comparison between competitors, improved
performance.
• The fixed price contract could have an unintended
negative impact on the quality of the delivery of
controls. In the long term, without an appropriate
performance monitoring framework in place, this could
lead to increased inefficiency. For example, good,
experienced staff should make less mistakes, ask fewer
questions, and deliver things right-first-time more often.
(e.g. audits) therefore requiring less time and effort
managing them.
Quality control
mechanisms
• Some industry representatives expressed concern that the FSA in Great Britain
has not been effective in maintaining consistent OV interpretation of meat
hygiene controls and enforcement actions in response to non compliance. By
comparison, the FSA in Northern Ireland have received much praise from its
stakeholder community for the quality and technical expertise of the OVs who
work on site.
• Under the current delivery model, where the technical team leader at the plant
level is not directly employed by the FSA, there is a risk that the competent
authority lacks direct influence to instruct OVs on their enforcement approach to
ensure FBO compliance.
• There is no provision in the current contract to incentivise the contractor to
control where resources are focused i.e. match skill/experience with difficulty.
• Inconsistent interpretation of legislation could cause
delays to the enforcement processes, FBO grievances
and damage the FSA’s credibility.
The fixed price contract provides the FSA with a number of benefits, including; reduced contractor costs in the short term, increased staff flexibility (as
overtime is included in the total cost) and greater budgeting stability. There are, however, risks attached to the revised contracting model which could impact on the
longer-term efficiency of the FSA both directly and indirectly. There are risks associated with the choice and structure of the FSA’s contractor model, identified in
discussions with FSA management and staff and with the contractors, detailed below.
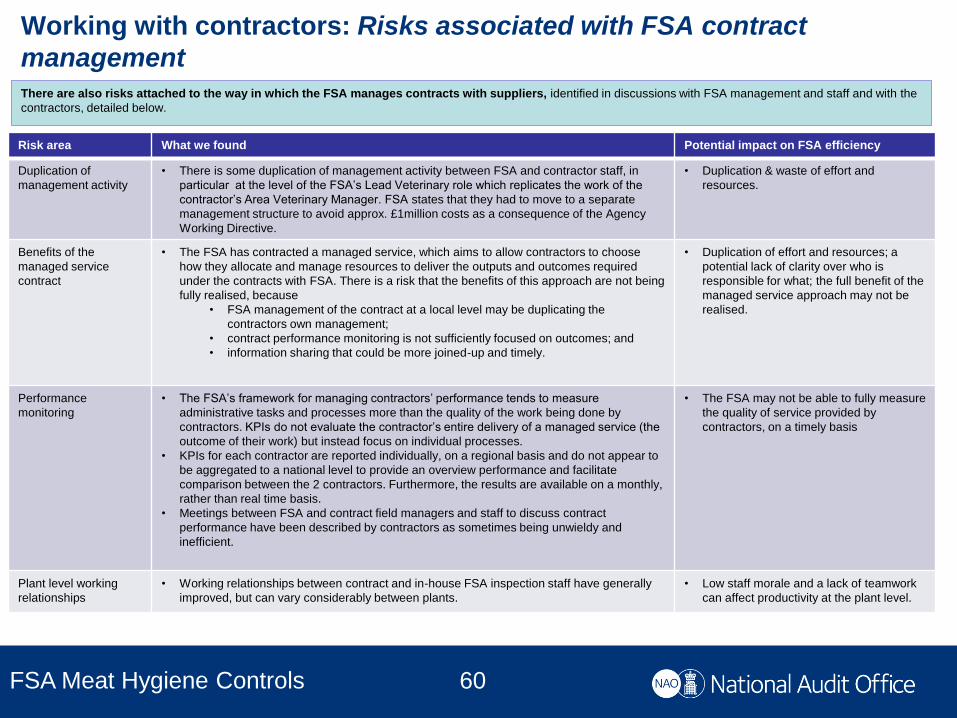
60 FSA Meat Hygiene Controls
Working with contractors: Risks associated with FSA contract
management
Risk area What we found Potential impact on FSA efficiency
Duplication of
management activity
• There is some duplication of management activity between FSA and contractor staff, in
particular at the level of the FSA’s Lead Veterinary role which replicates the work of the
contractor’s Area Veterinary Manager. FSA states that they had to move to a separate
management structure to avoid approx. £1million costs as a consequence of the Agency
Working Directive.
• Duplication & waste of effort and
resources.
Benefits of the
managed service
contract
• The FSA has contracted a managed service, which aims to allow contractors to choose
how they allocate and manage resources to deliver the outputs and outcomes required
under the contracts with FSA. There is a risk that the benefits of this approach are not being
fully realised, because
• FSA management of the contract at a local level may be duplicating the
contractors own management;
• contract performance monitoring is not sufficiently focused on outcomes; and
• information sharing that could be more joined-up and timely.
• Duplication of effort and resources; a
potential lack of clarity over who is
responsible for what; the full benefit of the
managed service approach may not be
realised.
Performance
monitoring
• The FSA’s framework for managing contractors’ performance tends to measure
administrative tasks and processes more than the quality of the work being done by
contractors. KPIs do not evaluate the contractor’s entire delivery of a managed service (the
outcome of their work) but instead focus on individual processes.
• KPIs for each contractor are reported individually, on a regional basis and do not appear to
be aggregated to a national level to provide an overview performance and facilitate
comparison between the 2 contractors. Furthermore, the results are available on a monthly,
rather than real time basis.
• Meetings between FSA and contract field managers and staff to discuss contract
performance have been described by contractors as sometimes being unwieldy and
inefficient.
• The FSA may not be able to fully measure
the quality of service provided by
contractors, on a timely basis
Plant level working
relationships
• Working relationships between contract and in-house FSA inspection staff have generally
improved, but can vary considerably between plants.
• Low staff morale and a lack of teamwork
can affect productivity at the plant level.
There are also risks attached to the way in which the FSA manages contracts with suppliers, identified in discussions with FSA management and staff and with the
contractors, detailed below.

61 FSA Meat Hygiene Controls
FSA Operations field structure: Great Britain, May 2013
The diagram illustrates the FSA’s
current field management
structure and how it aligns with
the management structures of its
contractors.
• Our discussions with industry
representatives, FSA
management, Eville & Jones
and HallMark identified
potential role duplication
between contractor Area
Veterinary Managers and FSA
Lead Veterinarians.
• Lead Vets support Official
Veterinarians, providing
technical support and
ensuring compliance. Part of
their role is to work closely
with contractors. There is a
risk that this relationship is not
working effectively and that
Lead Vets are getting involved
in the day-to-day
management of contracted
OVs, a role undertaken by
Area Veterinary Managers.
3
2
1
Notes:
• FSA staff are denoted in blue, contract staff are denoted in red.
• 1 = senior management, 2 = middle management (performance monitoring), 3 = front line delivery.
• The FSA Operations Manager position relates exclusively to England.
• FSA Supervisory MHIs are not fulltime management posts.
• The figures, in brackets, represent the number of staff employed to each grade, May 2013 (source: FSA,
HallMark and Eville & Jones).
Head of Operations delivery (6)
1 Vet director (4) Veterinary Field Manager (4) Operations Manager (4)
2 Area Veterinary Manager (19) Lead Veterinary (17) Service Delivery Manager (34)
Supervisory MHI (45)
3 Contracted OV (320) Employed OV (4)
Contracted MHI (188) Employed MHI (588)

62 FSA Meat Hygiene Controls
Summary slide: Mitigating future risks and structured
cost reduction
5. Achieving efficiency in future carries risks, and requires a more
structured cost reduction approach
What work we
have done
Our criteria
• Identification of risks to the FSA arising from cost reduction measures (through
interviews, document review, quantitative analyses)
• Comparison to structured cost reduction good practice developed by the NAO in its
cross-government work
• Application by the FSA of structured cost reduction principles and practices
• Evidence of the FSA acting on any areas where weaknesses in its approach have
been identified
Our findings
• Achieving greater efficiency in future carries risks requiring careful management
• The FSA will need to adopt a more structured approach to cost reduction in future to
achieve these savings while at the same time managing these risks
• The FSA has started to take actions which should lead to a more structured approach

63 FSA Meat Hygiene Controls
A more structured cost reduction approach by FSA will be much
more important in future
Stages of cost reduction
Sustainability
Implementation time/cost
Tactical efficiency
savings
Strategic operational
realignment
Sustainable cost
reduction
Quick wins
Prioritisation,
localised cost
savings/process
improvement/
performance
improvement
Cost:value
ratio – better
utilisation/
optimisation
of people,
processes,
technology,
procurement,
capital assets
Change
customer
expectations/
consider
alternative
delivery
models/shift
customer
channels
Structured
cost reduction
programme/
transformational
change
programme
Ongoing
embedded
cost
management
and
continuous
improvement
FSA has achieved cost reductions through a combination of:
• The availability of “quick wins” meant FSA has been able to reduce costs though for example
– removal of SRM controls, and the associated requirement to employ meat technicians
– reducing relatively large back office staff costs and numbers before and following merger with MHS
• Better utilisation of field staff
• Some changes to the delivery model, for example contracting, with increased use of contract staff and adopting a managed service
A move towards a more strategic and sustainable cost reduction approach is much more important in the future because (for example):
• There are fewer (if any) quick wins available • FSA (GB) has useful information on costs and monitors various aspects
of inspection quality and FBO compliance, but the link between cost reductions and the potential effect on inspection quality is not measured or analysed systematically and holistically
• This link is becoming more important as further cost reductions become harder to achieve
• The FSA has an expanding range of initiatives (slide 65)
• Risks in some areas have increased, for example regarding the sustainability of the contracting model
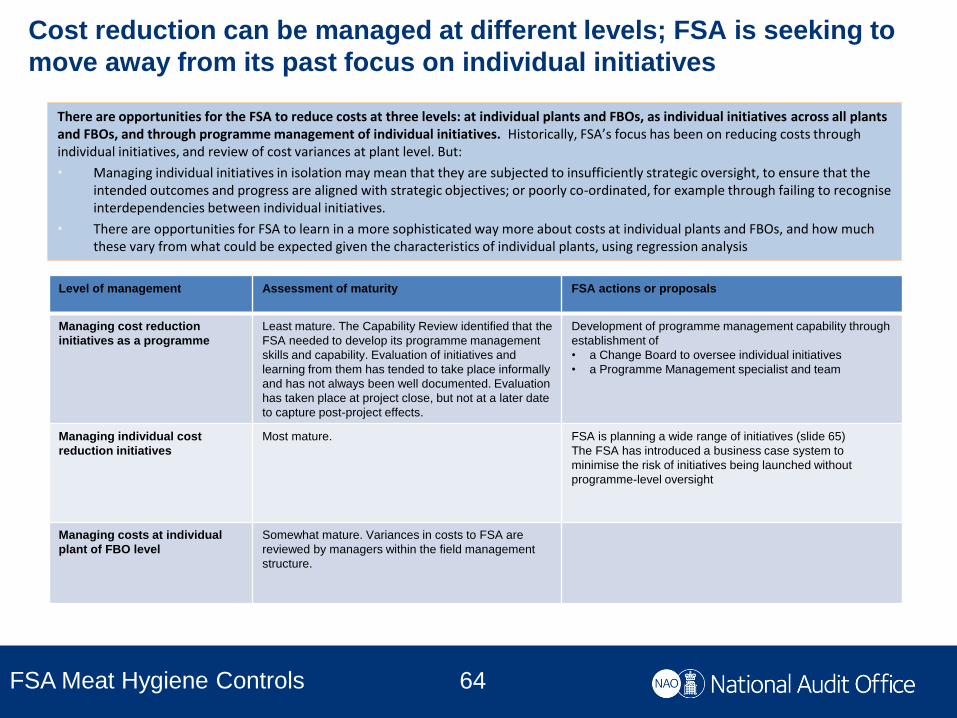
64 FSA Meat Hygiene Controls
Cost reduction can be managed at different levels; FSA is seeking to
move away from its past focus on individual initiatives
There are opportunities for the FSA to reduce costs at three levels: at individual plants and FBOs, as individual initiatives across all plants and FBOs, and through programme management of individual initiatives. Historically, FSA’s focus has been on reducing costs through individual initiatives, and review of cost variances at plant level. But:
• Managing individual initiatives in isolation may mean that they are subjected to insufficiently strategic oversight, to ensure that the intended outcomes and progress are aligned with strategic objectives; or poorly co-ordinated, for example through failing to recognise interdependencies between individual initiatives.
• There are opportunities for FSA to learn in a more sophisticated way more about costs at individual plants and FBOs, and how much these vary from what could be expected given the characteristics of individual plants, using regression analysis
Level of management Assessment of maturity FSA actions or proposals
Managing cost reduction
initiatives as a programme
Least mature. The Capability Review identified that the
FSA needed to develop its programme management
skills and capability. Evaluation of initiatives and
learning from them has tended to take place informally
and has not always been well documented. Evaluation
has taken place at project close, but not at a later date
to capture post-project effects.
Development of programme management capability through
establishment of
• a Change Board to oversee individual initiatives
• a Programme Management specialist and team
Managing individual cost
reduction initiatives
Most mature. FSA is planning a wide range of initiatives (slide 65)
The FSA has introduced a business case system to
minimise the risk of initiatives being launched without
programme-level oversight
Managing costs at individual
plant of FBO level
Somewhat mature. Variances in costs to FSA are
reviewed by managers within the field management
structure.
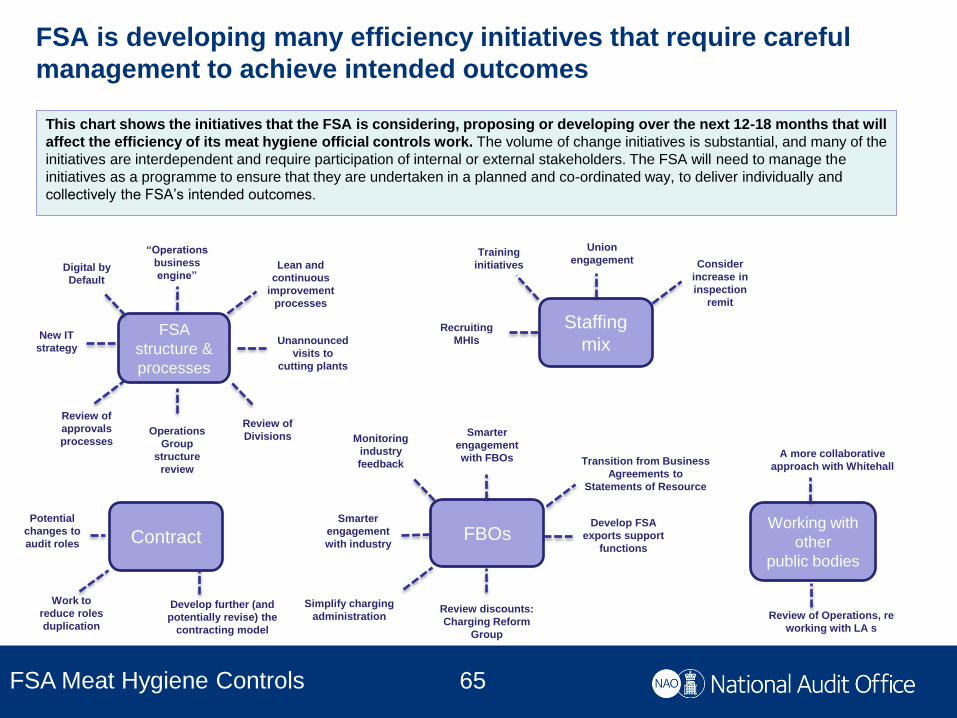
65 FSA Meat Hygiene Controls
FSA is developing many efficiency initiatives that require careful
management to achieve intended outcomes
Contract Working with
other
public bodies
FBOs
FSA
structure &
processes
Staffing
mix
Develop further (and
potentially revise) the
contracting model
Potential
changes to
audit roles
Work to
reduce roles
duplication Review of Operations, re
working with LA s
A more collaborative
approach with Whitehall
Union
engagement
Operations
Group
structure
review
“Operations
business
engine”
Unannounced
visits to
cutting plants
Consider
increase in
inspection
remit
Training
initiatives
Develop FSA
exports support
functions
Smarter
engagement
with FBOs
Simplify charging
administration Review discounts:
Charging Reform
Group
Transition from Business
Agreements to
Statements of Resource
Smarter
engagement
with industry
Monitoring
industry
feedback
Review of
Divisions
Review of
approvals
processes
New IT
strategy
Digital by
Default
Lean and
continuous
improvement
processes
Recruiting
MHIs
This chart shows the initiatives that the FSA is considering, proposing or developing over the next 12-18 months that will
affect the efficiency of its meat hygiene official controls work. The volume of change initiatives is substantial, and many of the
initiatives are interdependent and require participation of internal or external stakeholders. The FSA will need to manage the
initiatives as a programme to ensure that they are undertaken in a planned and co-ordinated way, to deliver individually and
collectively the FSA’s intended outcomes.
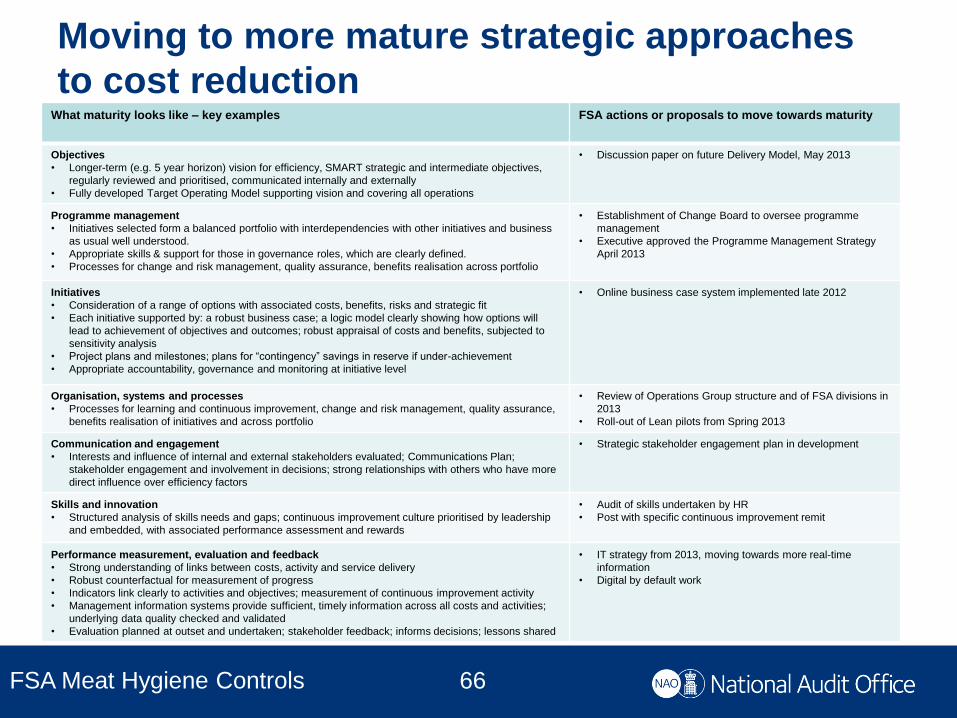
66 FSA Meat Hygiene Controls
Moving to more mature strategic approaches
to cost reduction What maturity looks like – key examples FSA actions or proposals to move towards maturity
Objectives
• Longer-term (e.g. 5 year horizon) vision for efficiency, SMART strategic and intermediate objectives,
regularly reviewed and prioritised, communicated internally and externally
• Fully developed Target Operating Model supporting vision and covering all operations
• Discussion paper on future Delivery Model, May 2013
Programme management
• Initiatives selected form a balanced portfolio with interdependencies with other initiatives and business
as usual well understood.
• Appropriate skills & support for those in governance roles, which are clearly defined.
• Processes for change and risk management, quality assurance, benefits realisation across portfolio
• Establishment of Change Board to oversee programme
management
• Executive approved the Programme Management Strategy
April 2013
Initiatives
• Consideration of a range of options with associated costs, benefits, risks and strategic fit
• Each initiative supported by: a robust business case; a logic model clearly showing how options will
lead to achievement of objectives and outcomes; robust appraisal of costs and benefits, subjected to
sensitivity analysis
• Project plans and milestones; plans for “contingency” savings in reserve if under-achievement
• Appropriate accountability, governance and monitoring at initiative level
• Online business case system implemented late 2012
Organisation, systems and processes
• Processes for learning and continuous improvement, change and risk management, quality assurance,
benefits realisation of initiatives and across portfolio
• Review of Operations Group structure and of FSA divisions in
2013
• Roll-out of Lean pilots from Spring 2013
Communication and engagement
• Interests and influence of internal and external stakeholders evaluated; Communications Plan;
stakeholder engagement and involvement in decisions; strong relationships with others who have more
direct influence over efficiency factors
• Strategic stakeholder engagement plan in development
Skills and innovation
• Structured analysis of skills needs and gaps; continuous improvement culture prioritised by leadership
and embedded, with associated performance assessment and rewards
• Audit of skills undertaken by HR
• Post with specific continuous improvement remit
Performance measurement, evaluation and feedback
• Strong understanding of links between costs, activity and service delivery
• Robust counterfactual for measurement of progress
• Indicators link clearly to activities and objectives; measurement of continuous improvement activity
• Management information systems provide sufficient, timely information across all costs and activities;
underlying data quality checked and validated
• Evaluation planned at outset and undertaken; stakeholder feedback; informs decisions; lessons shared
• IT strategy from 2013, moving towards more real-time
information
• Digital by default work