Embed Size (px)
Citation preview
Nanotechnology Research and Innovation in India: Drawing Insights from Bibliometric and Innovation
Dr. Sujit Bhattacharya (Principal Author)
Project Supported by Department of Science and Technology and Technology Management Information System
(Ministry of Science and Technology, Government of
CSIR- National Institute of Science Technology and Development Studies, New Delhi, India
CSIR-NISTADS Strategy Paper I
Nanotechnology Research and Innovation in India: Drawing Insights from Bibliometric and Innovation
Indicators
Dr. Sujit Bhattacharya (Principal Author)
Shilpa
Jayanthi A. Pushkaran
Project Supported by Department of Science and Technology - National Science and Technology Management Information System
Ministry of Science and Technology, Government of India)
National Institute of Science Technology and Development Studies, New Delhi, India
1
NISTADS Strategy Paper II: July 2012
Nanotechnology Research and Innovation in India: Drawing Insights from Bibliometric and Innovation
National Science and Technology Management Information System
India)
i
Nanotechnology Research and Innovation in India: Drawing
Insights from Bibliometric and Innovation Indicators
* This Strategy Paper is from the Project ‘Knowledge Creation and Innovation in an Emerging Technology: Contemporary and Future Scenario in Nanotechnology’ supported by DST-NSTMIS (Ministry of Science and Technology, Government of India).
This Strategy Paper is to be cited as: Bhattacharya, S., Shilpa and Jayanthi, A. P. (2012). Nanotechnology Research and Innovation in India: Drawing Insights from Bibliometric Indicators. CSIR-NISTADS Strategy Paper on Nanotechnology, No. II - July 2012, NISTADS, India.
for comments/suggestions and correspondence: [email protected]
This strategy paper draws from the ongoing project “Knowledge
Creation and Innovation in an Emerging Technology: Contemporary
and Future Scenario in Nanotechnology”. The paper applies
bibliometric and innovation indicators to underscore to what extent
India is making an assertion in nanoscience and nanotechnology. To
have a more informed assessment, it makes a broad examination of the
global scenario.
The study demonstrates that India has made significant progress
particularly in scientific publications. Also India’s application
development looks promising as it shows it is addressing areas of
pressing concerns like water, energy, medicine. However, it is too early
to say whether India’s research outputs can translate to niche global
products or can make a major impact in Indian industry and society.

ii
Contents
Introduction 1
Methodology 2
Publication Analysis 3
Patent Analysis 24
Standard Development 27
Products and Processes Developed 28
Final Remarks 33
References 34
Annexure 36

1
Introduction
Nanotechnology has generated a great deal of excitement worldwide and is being cited as the key
technology of the 21st century. Nanotechnology is already addressing key economic sectors
namely materials and manufacturing (coatings and composites for products like automobiles and
buildings), ICT and electronics (displays, chips, photonics, batteries), health and fitness, food &
beverages, and life sciences (pharmaceutical applications). Nanotechnology can provide
solutions in areas that are of pressing concerns in developing and improvised economies i.e.
environment, water purification, agriculture, energy and in a host of other products and services.
Nanotechnology if properly addressed can provide a ‘window of opportunity’ for developing
economies like India that intends to address developmental problems and forge economic growth
through technological interventions. Unlike established technologies, nanotechnology provides a
more level playing field as even advanced technology leaders are developing competency in this
field.
From 2001 onwards, Government of India has given special attention to this area.
Nanotechnology was launched as a mission mode programme in the Xth plan (2002-2007);
programme termed as NSTI (Nanoscience and Technology Initiative) with an allocation of Rs 60
crores (15 million USD). In 2007, this programme was upgraded with another major initiative
known as ‘Nano Mission’ with a budgetary allocation of Rs. 1000 crore (250 million USD) for
five years. Both these programs were initiated and implemented by the Department of Science
and Technology (DST). The Indian nanotechnology initiative has now become a multi-agency
effort. Along with DST, other government departments and scientific agencies have undertaken
major initiatives ― programmes with liberal funding support. This has helped to strengthen
nanotechnology interventions in key sectors. The key players are Department of Information
Technology (DIT), Department of Biotechnology (DBT), Council of Scientific and Industrial
Research (CSIR), Ministry of New and Renewable Energy (MNRE), Ministry of Health and
Family Welfare (MoHWF), Indian Council of Agricultural Research (ICAR), Indian Space
Research Organisation (ISRO), Department of Atomic Energy (DAE), Indian Council of
Medical Research (ICMR), and Defense Research and Development Organization (DRDO).
Various programmes undertaken by different departments/scientific agencies intend to
create necessary research and innovation climate for nanotechnology in India. At this juncture

2
when the government driven initiatives have completed a decade, it is important to a make an
assessment that would allow policy/decision makers to assess the outcome of their efforts. An
informed assessment would help in drawing attention to areas that can be strengthened and can
create new opportunities.
The Policy Briefs and Strategy Papers have been developed with this intention. Policy
Brief I and Strategy Paper I examines the capacity creation for nanotechnology research and
innovation in the country1. This strategy paper focuses on output i.e. performance of Indian
research community in nanotechnology. This evaluation is based on bibliometrics (publications
and patents) and other innovation indicators (standards, products/processes developed). The two-
strategy papers compliments each other and provides an informed view of our strengths and
gaps, which can to our understanding, play an important role in creation of the roadmap for the
next phase of development.
Methodology
Data for this study is primarily based on varied secondary sources. Science Citation Index-
Expanded (SCI-E) and Thomson Innovation Patent database is used for capturing bibliometric
data. Bibliometric indicators are primarily constructed from research papers and patents. These
indicators provide good indication of innovative capability in knowledge intensive areas, more
so in emerging technology fields. Nanotechnology evolution is contingent on strong interaction
with scientific research. Not all products are patented and not all patents yield products.
However, patenting activity demonstrates the inventive ability of a firm or a country and a
possible indication of creating future novel products particularly applicable to knowledge intense
areas such as nanotechnology. In addition, involvement of various actors and linkages among
them and other insights of research and innovation can be revealed through bibliometric
indicators.
The paper by Huang, Notten and Rasters (2011) reviewed the various search strategies for
extraction of nanotechnology papers. Search strategy by Kostoff et al. (2006), or Porter and
Youtie (2008) have been applied by most of the authors for harvesting nanotechnology research
1 Bhattacharya, S, Jayanthi A.P and Shilpa (2012). ‘Nanotechnology Development in India: Investigating ten years of India’s efforts in capacity building’. CSIR-NISTADS Strategy Paper on Nanotechnology, Number I, July 2012. Refer also to the Policy Brief I and Policy Brief II for key observations. Both are available at http://nistads.res.in under Reports.

3
publications. Our study shows more or less the two search strategies extract the same number of
records. We applied Kostoff et al. (2006) search strategy in this study. Mogoutov and Kahane
(2007) have defined a search strategy, which extracts nanotechnology records in different fields.
Huang et al. (2011) review has shown this is a very relevant strategy. This search strategy i.e.
defined by Mogoutov and Kahane (2007) identifies (a) overall records in nanotechnology (small
variations were found) with what Kostoff et al. (2006) search string gives, (b) identifies
nanotechnology research activities in eight areas. This search string was applied to identify
nanotechnology research activity in the eight identified areas.
Standards being developed were delineated from metrology activity of BIS (Bureau of Indian
Standards), CSIR-NPL (National Physical Laboratory), etc. Products/processes developed
provide final indication of a country (ies)/firm(s) ability to assert in a particular technology.
Indian Business Insight Database (newspaper clipping service), annual reports, websites, trade-
journals etc were used to capture application development.
Publication Analysis
Figure 1: Publication Activity of Key Advanced OECD and Emerging Economies
Source: Constructed from SCI-E; Search strategy based on Kostoff et al. (2006).
2.00
2.50
3.00
3.50
4.00
4.50
2000 2001 2002 2003 2004 2005 2006 2007 2008 2009 2010 2011
Pu
bli
cati
on(l
og s
cale
)
Year
China
USA
Japan
Germany
France
EnglandS. Korea India Taiwan
Brazil

4
It is surprising to observe China emerging as most prolific in research publications from 2009!2
Nanotechnology is a highly science intensive field wherein technology development critically
depends on scientific research. It makes a strong statement that China is now in a leading
position ahead of USA and other OECD economies.
India’s relative growth rate has been much higher than that of China from 2007 onwards (2000
taken as the base year). The maximum growth from year 2000 to year 2011 is shown by India
(1394%) followed by China (1163%), Taiwan (1140%), and S. Korea (1064%) while the country
with least growth is Japan (165%) followed by England (240%) and France (289%). Publication
aggregate for the complete period 2000-2011 shows China accounting for 10,9828 papers (20%
of the total world papers) and India 21,981 papers (4% of the total world papers) in this field.
Figure 2: Emerging Asian Countries Making Progress in Nanotechnology
Source: SCI-E; Note: India taken as a benchmark for comparison
2 The actual number of papers show variations on account of different search criteria’s as well as date of searching the database. Refer Methodology for further clarifications.
0
1000
2000
3000
4000
5000
6000
2000 2001 2002 2003 2004 2005 2006 2007 2008 2009 2010 2011
No.
of P
ublic
atio
ns
Year
India
Iran
Singapor
MalaysiaThailand
Sri Lanka
China is leading in terms of research publications in this field.
India has increased its research publications significantly and is now in 6th rank.
5
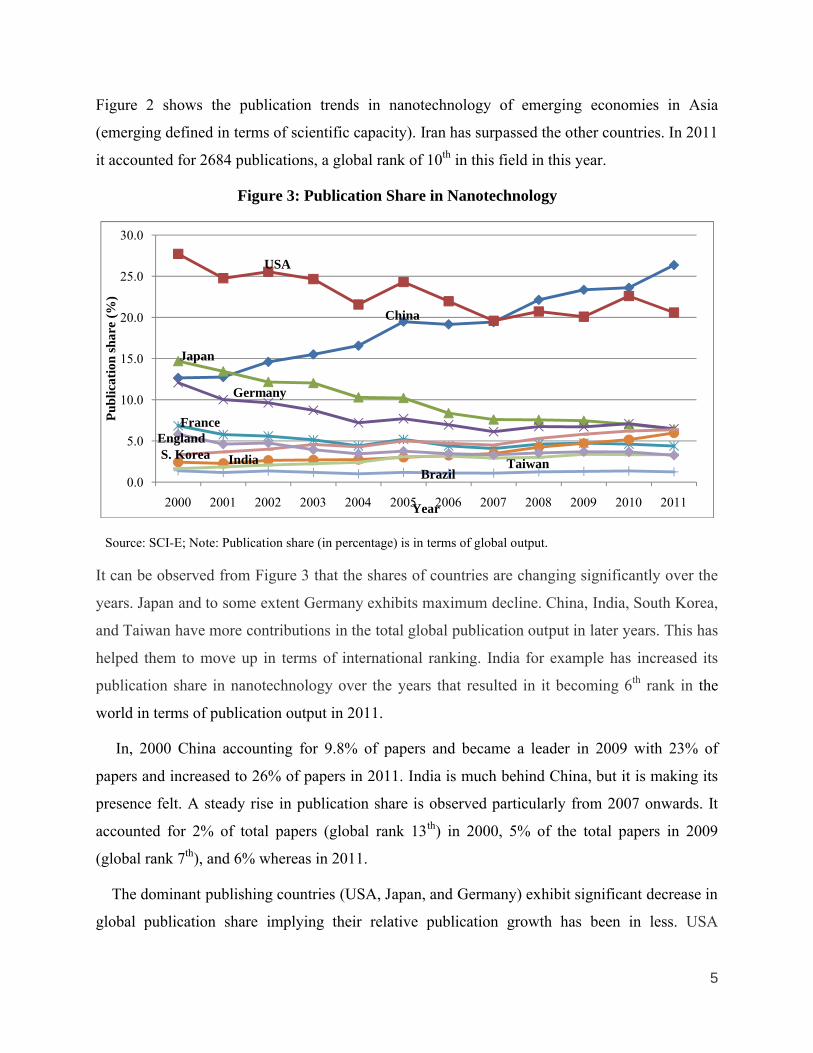
Figure 2 shows the publication trends in nanotechnology of emerging economies in Asia
(emerging defined in terms of scientific capacity). Iran has surpassed the other countries. In 2011
it accounted for 2684 publications, a global rank of 10th in this field in this year.
Figure 3: Publication Share in Nanotechnology
Source: SCI-E; Note: Publication share (in percentage) is in terms of global output.
It can be observed from Figure 3 that the shares of countries are changing significantly over the
years. Japan and to some extent Germany exhibits maximum decline. China, India, South Korea,
and Taiwan have more contributions in the total global publication output in later years. This has
helped them to move up in terms of international ranking. India for example has increased its
publication share in nanotechnology over the years that resulted in it becoming 6th rank in the
world in terms of publication output in 2011.
In, 2000 China accounting for 9.8% of papers and became a leader in 2009 with 23% of
papers and increased to 26% of papers in 2011. India is much behind China, but it is making its
presence felt. A steady rise in publication share is observed particularly from 2007 onwards. It
accounted for 2% of total papers (global rank 13th) in 2000, 5% of the total papers in 2009
(global rank 7th), and 6% whereas in 2011.
The dominant publishing countries (USA, Japan, and Germany) exhibit significant decrease in
global publication share implying their relative publication growth has been in less. USA
0.0
5.0
10.0
15.0
20.0
25.0
30.0
2000 2001 2002 2003 2004 2005 2006 2007 2008 2009 2010 2011
Pu
bli
cati
on s
har
e (%
)
Year
China
USA
Japan
Germany
FranceEnglandS. Korea India Taiwan
Brazil

6
accounted for 27% of nontechnology papers in 2000, 21% of papers in 2009 and 21% of papers
in 2011. Sharp fall in publication share can be seen for Japan and Germany. In 2000, Japan
accounted for 15% of papers and Germany 12% of papers while their shares in 2011 were 6%
and 7% respectively.
The trend of the global share i.e. contribution of each country to the total publications shows how the scenario is changing.
Except for Asian countries, namely China, South Korea, Taiwan, and India,the global share of other advanced OECD countries are decreasing.
Table 1: Publication and Citation Trend (India)
Year Publications Citations
Citation per
paper
(in the year of
publication)
Citations received in the year of
publication
(Uncited papers in the year of
publication; %Uncited)
Uncited papers
(%uncited)*
2000 247 8525 34.5 (0.2) 55 [213; 86%] 25 (10%)
2005 1072 15985 14.9 (0.3) 295 [777; 72%] 127 (12%)
2009 3086 14559 4.5 (0.4) 1364 [1869;58%] 762 (24%)
2011 5020 5260 1.04 (0.4) 2241 [3806;76% ] 2674 (53%)
Source: SCI-E; Note: * (Uncited papers/ papers) � total 100
India increased its publication activity significantly during this twelve year period (2000-2011);
219% growth in 2005, 818% in 2009 and 1394% growth in 2011 (calculated from publication
output in 2000). Citation measures provide view of reception of papers by the international
community. Citations received and citations per paper are however strongly affected by the
citation window, which the results also signify. One important indication is how fast the papers
from India are received by the international community? We find in 2009, although the citation
per paper was less but 42% of the papers received at least one citation. Thus, this is one
indication that Indian research (particularly in 2009) is addressing important problems,
advancing knowledge and making researchers take note of that.
7
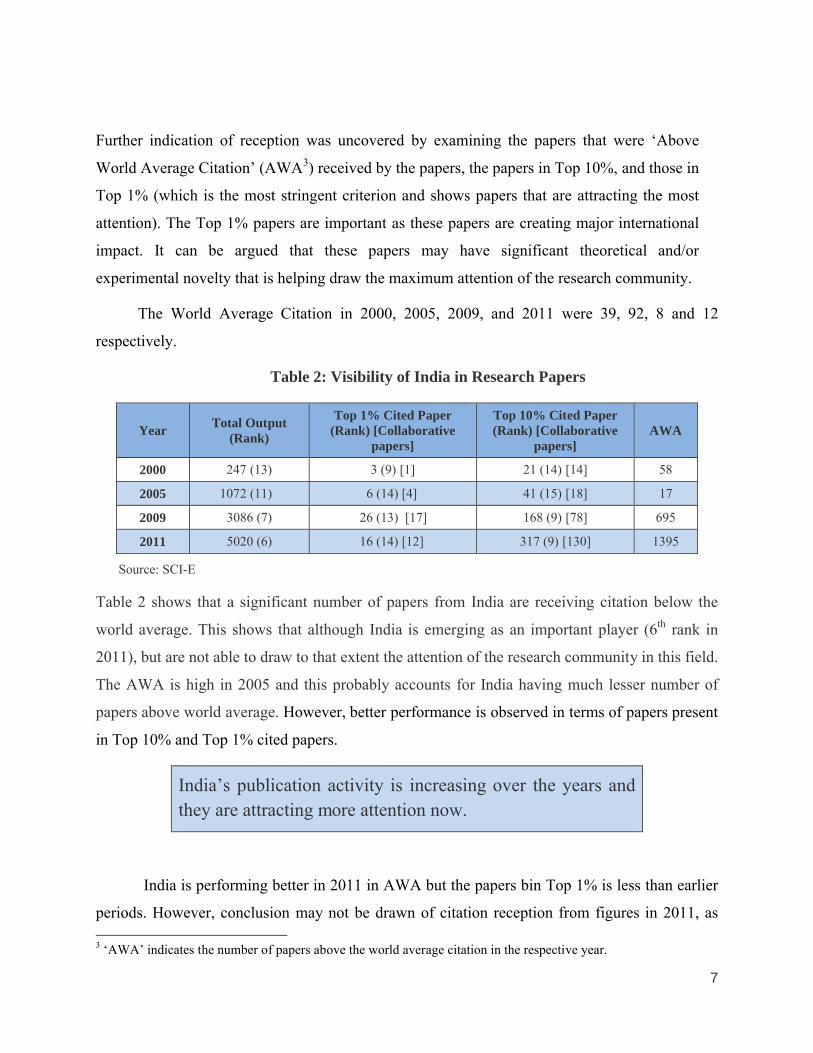
Further indication of reception was uncovered by examining the papers that were ‘Above
World Average Citation’ (AWA3) received by the papers, the papers in Top 10%, and those in
Top 1% (which is the most stringent criterion and shows papers that are attracting the most
attention). The Top 1% papers are important as these papers are creating major international
impact. It can be argued that these papers may have significant theoretical and/or
experimental novelty that is helping draw the maximum attention of the research community.
The World Average Citation in 2000, 2005, 2009, and 2011 were 39, 92, 8 and 12
respectively.
Table 2: Visibility of India in Research Papers
YearTotal Output
(Rank)
Top 1% Cited Paper (Rank) [Collaborative
papers]
Top 10% Cited Paper (Rank) [Collaborative
papers]AWA
2000 247 (13) 3 (9) [1] 21 (14) [14] 58
2005 1072 (11) 6 (14) [4] 41 (15) [18] 17
2009 3086 (7) 26 (13) [17] 168 (9) [78] 695
2011 5020 (6) 16 (14) [12] 317 (9) [130] 1395
Source: SCI-E
Table 2 shows that a significant number of papers from India are receiving citation below the
world average. This shows that although India is emerging as an important player (6th rank in
2011), but are not able to draw to that extent the attention of the research community in this field.
The AWA is high in 2005 and this probably accounts for India having much lesser number of
papers above world average. However, better performance is observed in terms of papers present
in Top 10% and Top 1% cited papers.
India’s publication activity is increasing over the years and they are attracting more attention now.
India is performing better in 2011 in AWA but the papers bin Top 1% is less than earlier
periods. However, conclusion may not be drawn of citation reception from figures in 2011, as 3 ‘AWA’ indicates the number of papers above the world average citation in the respective year.

they will change, as the citation window
in the top ten most active players in terms of research papers as reflected in the SCI
papers are not attracting attention to that extent.
Characteristic feature in the
are result of authors from different institutions collaborating with each other.
Figure 4 below highlights the linkages
Figure 4: Linkages among Institutions in
Note: Analysis
Two key clusters are observed
CSIR-COE4, DST, JNCASR (Jawaharlal Nehru Centre for Advanced Scientific Research
(Indian Institute of Science) and National Institute of Material Science (Japan)
cluster is between Indian Institute of Technology
institutions are scattered and display individual linkages with one or more Indian or foreign
institutions.
4 In January 1991, the CSIR established the various aspects of solid state and materials chemistry.
as the citation window will increase. Still there is a cause of concern as India is
in the top ten most active players in terms of research papers as reflected in the SCI
papers are not attracting attention to that extent.
Characteristic feature in the highly cited papers of India is that majority of the
are result of authors from different institutions collaborating with each other.
Figure 4 below highlights the linkages among the TOP 1% cited papers in 2009
Linkages among Institutions in the Top 1% Cited Papers (2009)
Note: Analysis using Bibexcel and Graph using UCINET
are observed; one formed by the public sector institutions such as
Jawaharlal Nehru Centre for Advanced Scientific Research
and National Institute of Material Science (Japan)
Indian Institute of Technology (IIT’s) and foreign institutions. Other
institutions are scattered and display individual linkages with one or more Indian or foreign
R established the Centre of Excellence in Chemistry in JNCASR. The Centre works on various aspects of solid state and materials chemistry.
8
Still there is a cause of concern as India is
in the top ten most active players in terms of research papers as reflected in the SCI-E; their
s that majority of these papers
among the TOP 1% cited papers in 2009.
(2009)
one formed by the public sector institutions such as
Jawaharlal Nehru Centre for Advanced Scientific Research), IISc
and National Institute of Material Science (Japan), and another
and foreign institutions. Other
institutions are scattered and display individual linkages with one or more Indian or foreign
Centre of Excellence in Chemistry in JNCASR. The Centre works on

9
Collaboration is playing an important role in papers getting high degree of visibility.
For example, among the 26 papers from India in the Top 1% cited papers in 2009, 65% of papers (17 papers) are collaborative papers.
Citation Reception: Global Scenario
Table 3: Visibility of Top Five Countries in Research Papers
Country
2000 2005 2009
Total Output (Rank)
Top 1% Cited Paper (Rank)
Top 10% Cited Paper (Rank)
AWATotal
Output (Rank)
Top 1% Cited Paper (Rank)
Top 10% Cited Paper (Rank)
AWATotal
Output (Rank)
Top 1% Cited Paper (Rank)
Top 10% Cited Paper (Rank)
AWA
China1314 (4)
3 (6) 81 (3) 2246512 (2)
30 (3) 362 (2) 18914329
(1)132 (2)
1072 (2)
2592
USA3344 (1)
68 (1) 475 (1) 128410453
(1)155 (1)
1150 (1)
72913553
(2)257 (1)
1904 (1)
4940
Japan1661 (2)
7 (3) 77 (4) 3463740 (3)
19 (4) 193 (4) 1054743 (3)
44 (7) 295 (4) 1084
Germany1388 (3)
9 (2) 132 (2) 4362845 (4)
35 (2) 237 (3) 1474298 (4)
103 (3) 462 (3) 1443
S. Korea 320 (14)
2 (10) 25 (12) 861894 (6)
8 (9) 118 (7) 633787 (5)
48 (6) 286 (5) 910
Source: SCI-E
Table 4: Visibility of Top Five Countries in Research Papers (2010-2011)
Country
2010 2011
Total Output (Rank)
Top 1%
Cited Paper (Rank)
Top 10% Cited Paper (Rank)
AWATotal
Output (Rank)
Top 1%
Cited Paper (Rank)
Top 10% Cited Paper (Rank)
AWA
China17532
(1) 177 (2) 1802 (2) 509122132
(1)230 (2)
2251 (2)
7195
USA16783
(2) 358 (1) 2679 (1) 637117288
(2)340 (1)
2598 (1)
7264
Japan5206 (4) 45 (4) 449 (4) 1338
5382
(4)58 (4) 484 (5) 1663
Germany5270 (3) 75 (3) 704 (3) 1925
5430
(3)71 (3) 734 (3) 2276
S. Korea4608 (5) 35 (6) 408 (5) 1237
5344
(5)51 (6) 489 (4) 1631
Source: SCI-E
10
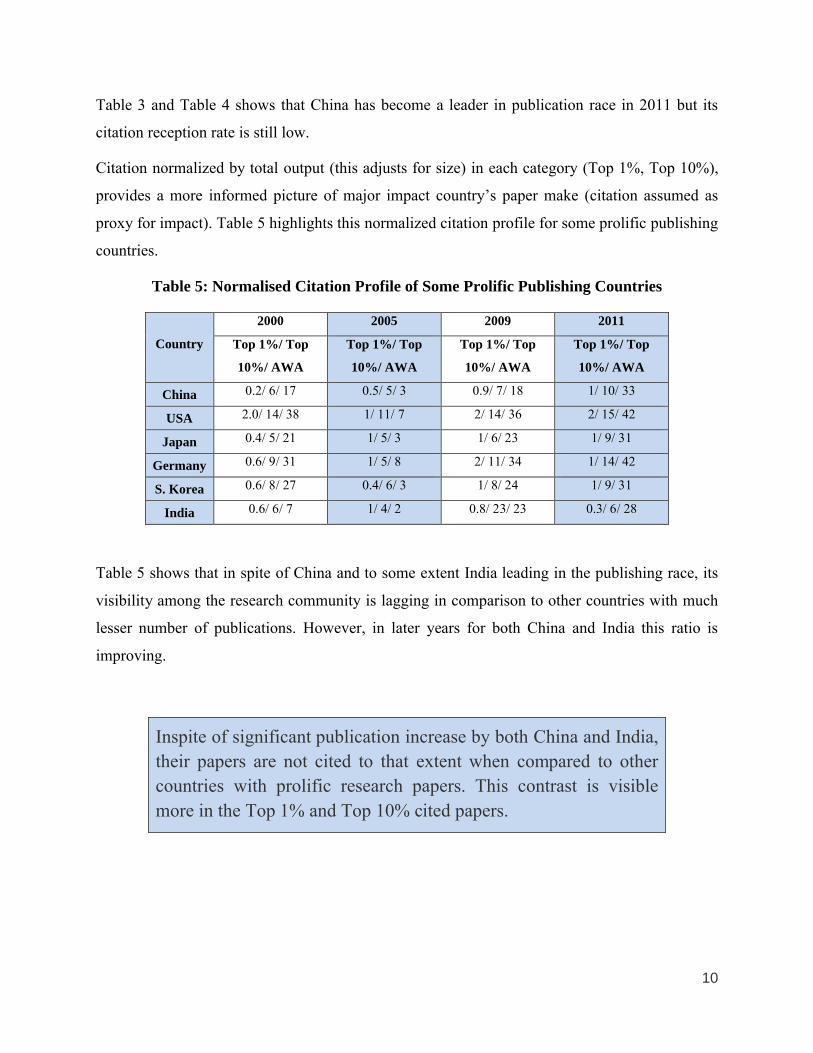
Table 3 and Table 4 shows that China has become a leader in publication race in 2011 but its
citation reception rate is still low.
Citation normalized by total output (this adjusts for size) in each category (Top 1%, Top 10%),
provides a more informed picture of major impact country’s paper make (citation assumed as
proxy for impact). Table 5 highlights this normalized citation profile for some prolific publishing
countries.
Table 5: Normalised Citation Profile of Some Prolific Publishing Countries
Country
2000 2005 2009 2011
Top 1%/ Top
10%/ AWA
Top 1%/ Top
10%/ AWA
Top 1%/ Top
10%/ AWA
Top 1%/ Top
10%/ AWA
China 0.2/ 6/ 17 0.5/ 5/ 3 0.9/ 7/ 18 1/ 10/ 33
USA 2.0/ 14/ 38 1/ 11/ 7 2/ 14/ 36 2/ 15/ 42
Japan 0.4/ 5/ 21 1/ 5/ 3 1/ 6/ 23 1/ 9/ 31
Germany 0.6/ 9/ 31 1/ 5/ 8 2/ 11/ 34 1/ 14/ 42
S. Korea 0.6/ 8/ 27 0.4/ 6/ 3 1/ 8/ 24 1/ 9/ 31
India 0.6/ 6/ 7 1/ 4/ 2 0.8/ 23/ 23 0.3/ 6/ 28
Table 5 shows that in spite of China and to some extent India leading in the publishing race, its
visibility among the research community is lagging in comparison to other countries with much
lesser number of publications. However, in later years for both China and India this ratio is
improving.
Inspite of significant publication increase by both China and India, their papers are not cited to that extent when compared to other countries with prolific research papers. This contrast is visible more in the Top 1% and Top 10% cited papers.
11
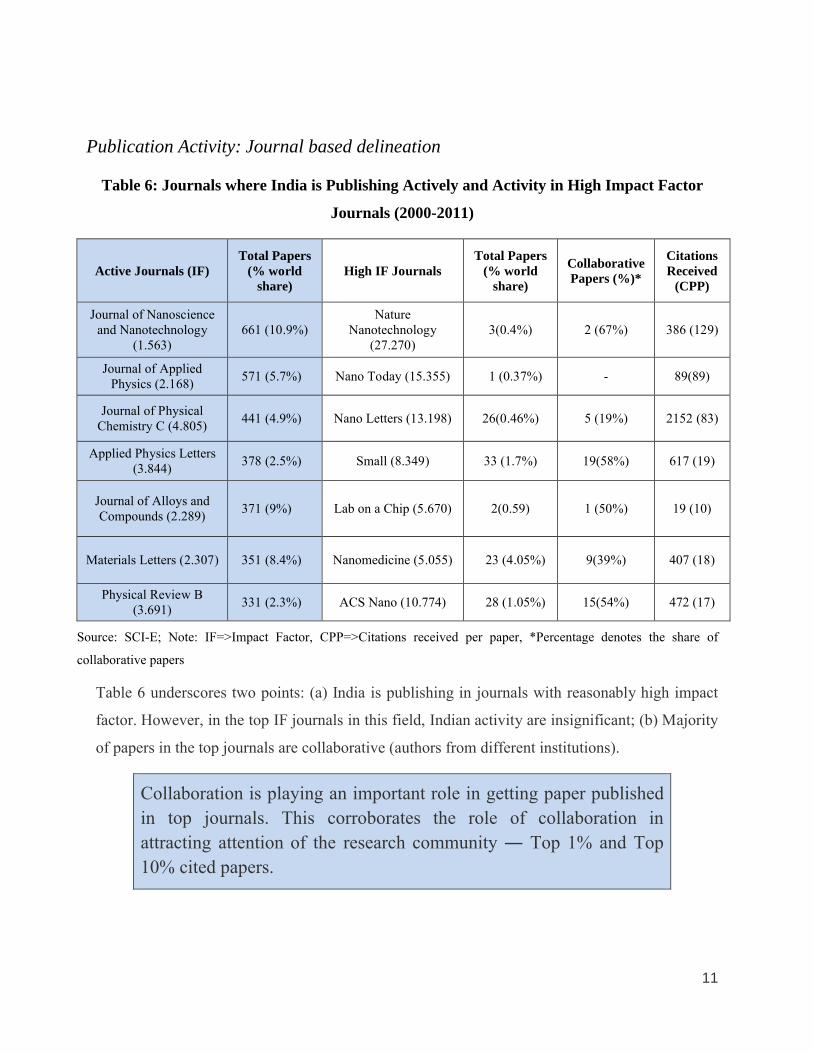
Publication Activity: Journal based delineation
Table 6: Journals where India is Publishing Actively and Activity in High Impact Factor
Journals (2000-2011)
Active Journals (IF)Total Papers
(% world share)
High IF JournalsTotal Papers
(% world share)
Collaborative Papers (%)*
Citations Received
(CPP)
Journal of Nanoscience and Nanotechnology
(1.563)661 (10.9%)
Nature Nanotechnology
(27.270)3(0.4%) 2 (67%) 386 (129)
Journal of Applied Physics (2.168)
571 (5.7%) Nano Today (15.355) 1 (0.37%) - 89(89)
Journal of Physical Chemistry C (4.805)
441 (4.9%) Nano Letters (13.198) 26(0.46%) 5 (19%) 2152 (83)
Applied Physics Letters (3.844)
378 (2.5%) Small (8.349) 33 (1.7%) 19(58%) 617 (19)
Journal of Alloys and Compounds (2.289)
371 (9%) Lab on a Chip (5.670) 2(0.59) 1 (50%) 19 (10)
Materials Letters (2.307) 351 (8.4%) Nanomedicine (5.055) 23 (4.05%) 9(39%) 407 (18)
Physical Review B (3.691)
331 (2.3%) ACS Nano (10.774) 28 (1.05%) 15(54%) 472 (17)
Source: SCI-E; Note: IF=>Impact Factor, CPP=>Citations received per paper, *Percentage denotes the share of
collaborative papers
Table 6 underscores two points: (a) India is publishing in journals with reasonably high impact
factor. However, in the top IF journals in this field, Indian activity are insignificant; (b) Majority
of papers in the top journals are collaborative (authors from different institutions).
Collaboration is playing an important role in getting paper published in top journals. This corroborates the role of collaboration in attracting attention of the research community ― Top 1% and Top 10% cited papers.
12
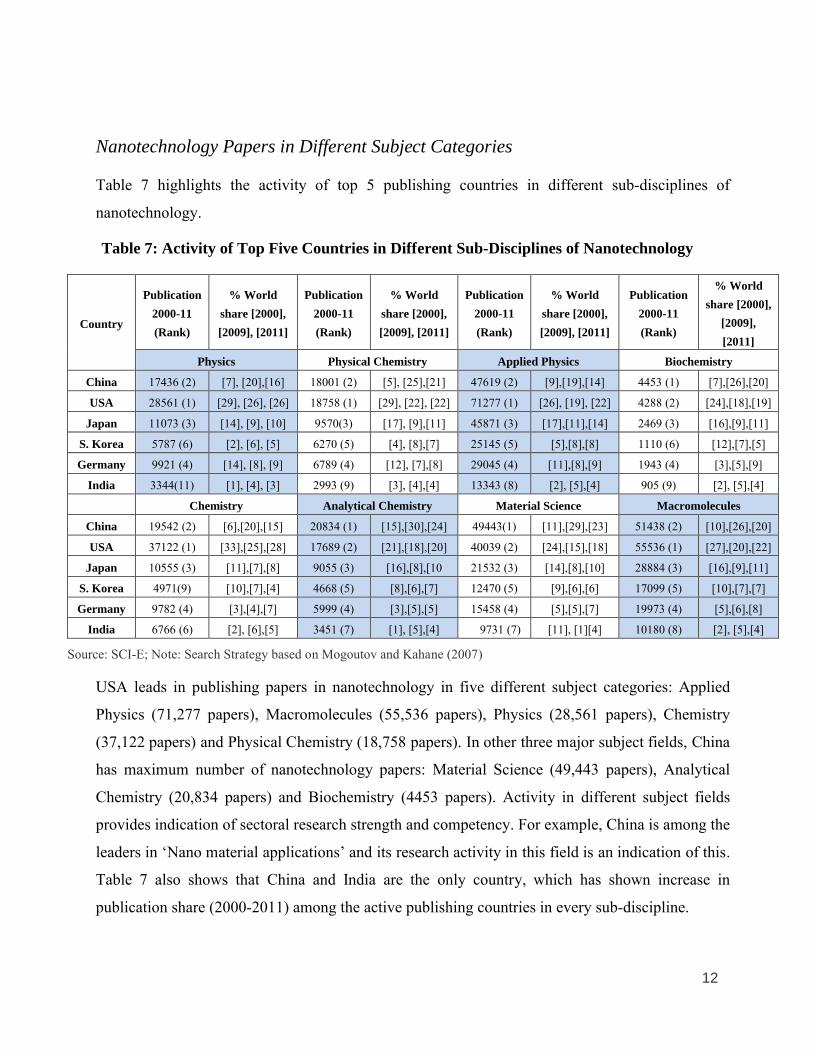
Nanotechnology Papers in Different Subject Categories
Table 7 highlights the activity of top 5 publishing countries in different sub-disciplines of
nanotechnology.
Table 7: Activity of Top Five Countries in Different Sub-Disciplines of Nanotechnology
Country
Publication
2000-11
(Rank)
% World
share [2000],
[2009], [2011]
Publication
2000-11
(Rank)
% World
share [2000],
[2009], [2011]
Publication
2000-11
(Rank)
% World
share [2000],
[2009], [2011]
Publication
2000-11
(Rank)
% World
share [2000],
[2009],
[2011]
Physics Physical Chemistry Applied Physics Biochemistry
China 17436 (2) [7], [20],[16] 18001 (2) [5], [25],[21] 47619 (2) [9],[19],[14] 4453 (1) [7],[26],[20]
USA 28561 (1) [29], [26], [26] 18758 (1) [29], [22], [22] 71277 (1) [26], [19], [22] 4288 (2) [24],[18],[19]
Japan 11073 (3) [14], [9], [10] 9570(3) [17], [9],[11] 45871 (3) [17],[11],[14] 2469 (3) [16],[9],[11]
S. Korea 5787 (6) [2], [6], [5] 6270 (5) [4], [8],[7] 25145 (5) [5],[8],[8] 1110 (6) [12],[7],[5]
Germany 9921 (4) [14], [8], [9] 6789 (4) [12], [7],[8] 29045 (4) [11],[8],[9] 1943 (4) [3],[5],[9]
India 3344(11) [1], [4], [3] 2993 (9) [3], [4],[4] 13343 (8) [2], [5],[4] 905 (9) [2], [5],[4]
Chemistry Analytical Chemistry Material Science Macromolecules
China 19542 (2) [6],[20],[15] 20834 (1) [15],[30],[24] 49443(1) [11],[29],[23] 51438 (2) [10],[26],[20]
USA 37122 (1) [33],[25],[28] 17689 (2) [21],[18],[20] 40039 (2) [24],[15],[18] 55536 (1) [27],[20],[22]
Japan 10555 (3) [11],[7],[8] 9055 (3) [16],[8],[10 21532 (3) [14],[8],[10] 28884 (3) [16],[9],[11]
S. Korea 4971(9) [10],[7],[4] 4668 (5) [8],[6],[7] 12470 (5) [9],[6],[6] 17099 (5) [10],[7],[7]
Germany 9782 (4) [3],[4],[7] 5999 (4) [3],[5],[5] 15458 (4) [5],[5],[7] 19973 (4) [5],[6],[8]
India 6766 (6) [2], [6],[5] 3451 (7) [1], [5],[4] 9731 (7) [11], [1][4] 10180 (8) [2], [5],[4]
Source: SCI-E; Note: Search Strategy based on Mogoutov and Kahane (2007)
USA leads in publishing papers in nanotechnology in five different subject categories: Applied
Physics (71,277 papers), Macromolecules (55,536 papers), Physics (28,561 papers), Chemistry
(37,122 papers) and Physical Chemistry (18,758 papers). In other three major subject fields, China
has maximum number of nanotechnology papers: Material Science (49,443 papers), Analytical
Chemistry (20,834 papers) and Biochemistry (4453 papers). Activity in different subject fields
provides indication of sectoral research strength and competency. For example, China is among the
leaders in ‘Nano material applications’ and its research activity in this field is an indication of this.
Table 7 also shows that China and India are the only country, which has shown increase in
publication share (2000-2011) among the active publishing countries in every sub-discipline.

13
Institutional Activity
Institutions involved in publishing activity in 2009 increased more than three-fold from that of
2000 (from 423 to 1349 institutions). The most prolific institutes are highlighted in Table 8.
Table 8: Activity of Prolific Indian Institutes (2000-11)
InstitutionsNumber of
Publications (2000-11)
Collaborative Papers (% of Collaborative
Papers)
Growth Rate*
IISc 1390 751 (54) -5
IIT-Kharagpur 1253 702 (56) 4
IACS 1028 607 (59) 10
BARC 993 715 (72) 20
CSIR-NCL 899 602 (67) -4
IIT-Madras 816 555 (68) 5
IIT-Delhi 790 593 (75) 6
CSIR-NPL 764 649 (85) -8
Note: *%age rate of growth => (Y-X)/X � 100 (2009 to 2011); IACS => Indian Association for the Cultivation of Science; BARC => Bhabha Atomic Research Center
Institutions of prolific activity are reputed academic institutions and research laboratories. Out of
the eight institutes listed, six namely IISc, IIT-Kharagpur, CSIR-NCL, IACS, IIT-Madras, IIT-
Delhi are Centres of Excellence5 (COE). Thus, COE’s are playing an important role in
strengthening the research activity in this field.
5 As part of its efforts to promote R&D in Nano Science and Technology, the NSTI and Nano-Mission established Centers of Excellence, Thematic Unit and Institute of Nanoscience and Technology. DIT also established two COE’s in nanoelectronics. Refer for further details: Bhattacharya, S, Jayanthi A.P, Shilpa (2012). ‘Nanotechnology Development in India: Investigating ten years of India’s efforts in capacity building’. CSIR-NISTADS Strategy Paper on Nanotechnology, Number I, July 2012.
14
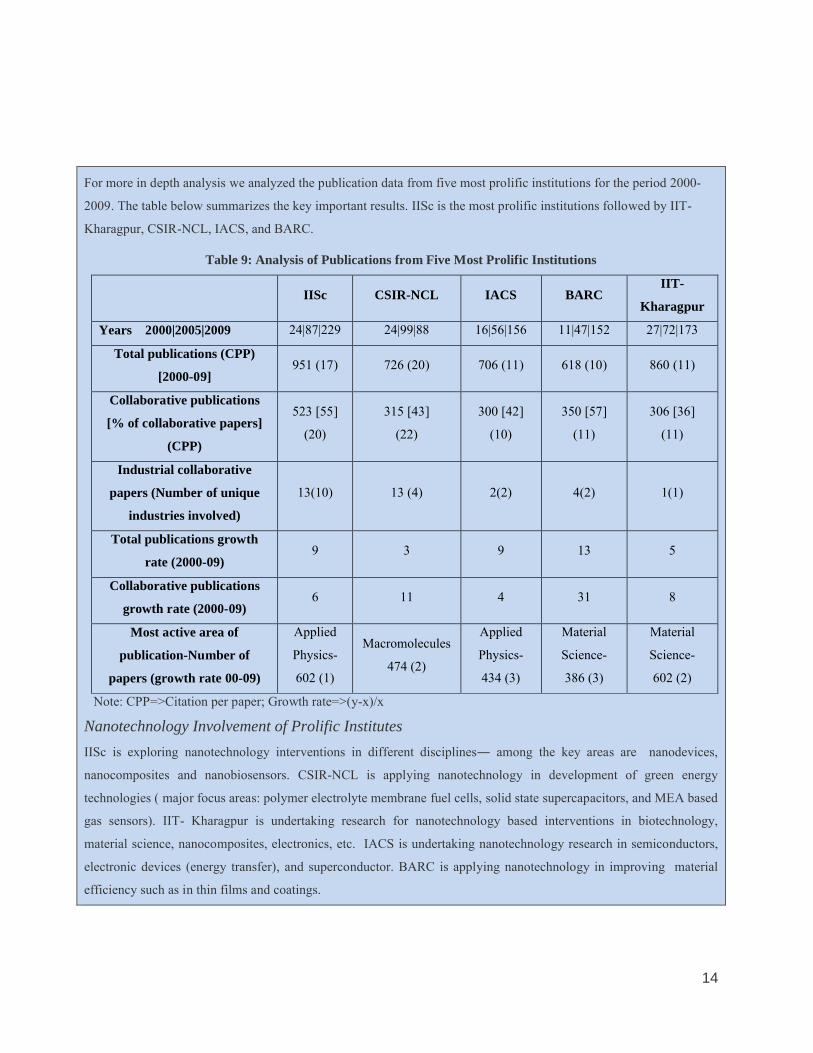
For more in depth analysis we analyzed the publication data from five most prolific institutions for the period 2000-
2009. The table below summarizes the key important results. IISc is the most prolific institutions followed by IIT-
Kharagpur, CSIR-NCL, IACS, and BARC.
Table 9: Analysis of Publications from Five Most Prolific Institutions
IISc CSIR-NCL IACS BARCIIT-
Kharagpur
Years 2000|2005|2009 24|87|229 24|99|88 16|56|156 11|47|152 27|72|173
Total publications (CPP)
[2000-09]951 (17) 726 (20) 706 (11) 618 (10) 860 (11)
Collaborative publications
[% of collaborative papers]
(CPP)
523 [55]
(20)
315 [43]
(22)
300 [42]
(10)
350 [57]
(11)
306 [36]
(11)
Industrial collaborative
papers (Number of unique
industries involved)
13(10) 13 (4) 2(2) 4(2) 1(1)
Total publications growth
rate (2000-09)9 3 9 13 5
Collaborative publications
growth rate (2000-09)6 11 4 31 8
Most active area of
publication-Number of
papers (growth rate 00-09)
Applied
Physics-
602 (1)
Macromolecules
474 (2)
Applied
Physics-
434 (3)
Material
Science-
386 (3)
Material
Science-
602 (2)
Note: CPP=>Citation per paper; Growth rate=>(y-x)/x
Nanotechnology Involvement of Prolific Institutes
IISc is exploring nanotechnology interventions in different disciplines― among the key areas are nanodevices,
nanocomposites and nanobiosensors. CSIR-NCL is applying nanotechnology in development of green energy
technologies ( major focus areas: polymer electrolyte membrane fuel cells, solid state supercapacitors, and MEA based
gas sensors). IIT- Kharagpur is undertaking research for nanotechnology based interventions in biotechnology,
material science, nanocomposites, electronics, etc. IACS is undertaking nanotechnology research in semiconductors,
electronic devices (energy transfer), and superconductor. BARC is applying nanotechnology in improving material
efficiency such as in thin films and coatings.

15
Collaborative Linkages among Institutions
The collaborative papers involving different institutes are increasing in later periods. In 2000, 37
percent of the total papers involved at least two authors from different institutes (92 out of 247
papers published), whereas in 2009, 47 percent of total papers were collaborative papers
involving different institutes (1450 out of 3086 papers). Figure 5 shows the most active
collaboration among institutions in 2009.
Figure 5: Collaborative Linkages among Most Active Institutions (2009)
Note: Analysis using Bibexcel and visualization using Pajek. CSIR includes aggregated research publications of
its 37 laboratories. IIT includes aggregated publication activity of all the seven IIT’s.
Institutional linkages are developing from sparse network (2000) towards a more connected
network in 2009. Cluster formation has strong bearing on geographical proximity. This
formation may be due to sharing of sophisticated capital intensive instrument required for
nanotechnology research.

16
As a group/entity, CSIR and IIT’s are publishing maximum number of papers― 2193 and 2784
papers respectively (research period 2000-2009). The contemporary two years i.e. 2010 and
2011, exhibit a significant rise of research output by both these entities. The aggregated
publication in this period (2010 and 2011) of CSIR increased by 47% to 3213 papers, and IIT by
55% to 4309 papers from the earlier period (2000-2009). This increasing research output in these
two entities has played a major role in the publication increase from India in this field. Table 10
highlights the aggregated publication by different CSIR Laboratories for the period 2000-11.
Table 10: Aggregated Publications of Different CSIR Laboratories (2000-11)
CSIR Laboratories No. of Publications CSIR Laboratories No. of Publications
NCL 899 NAL 68
NPL 764 IGIB 36
IICT 326 IICB 31
CGCRI 212 IMT 26
CECRI 204 CDRI 22
NIIST 122 CEERI 19
NML 108 CMERI 13
RRL 104 IIP 9
CLRI 83 NEERI 7
CSMCRI 80 CFTRI 5
IMMT 74 CFRI 1
Note: For full forms of the names of the CSIR laboratories refer Annexure I
The research collaboration (as visible through research papers) of CSIR laboratories in 2009 is
shown in Figure 6.

17
Figure 6: Research Collaboration in CSIR Laboratories (2009)
Note: Analysis using bibexcel and visualization using pajek
Geographical proximity is playing a role in collaboration. For example, out of 106 papers of
CSIR-NPL in 2009, 71 papers are collaborative papers. Among these collaborative papers, 53%
were from the institutes in close proximity- University of Delhi (accounting for 35% of CSIR-
NPL collaboration), IIT-Delhi (28%), and Jamia Milia Islamia University (13%).
18
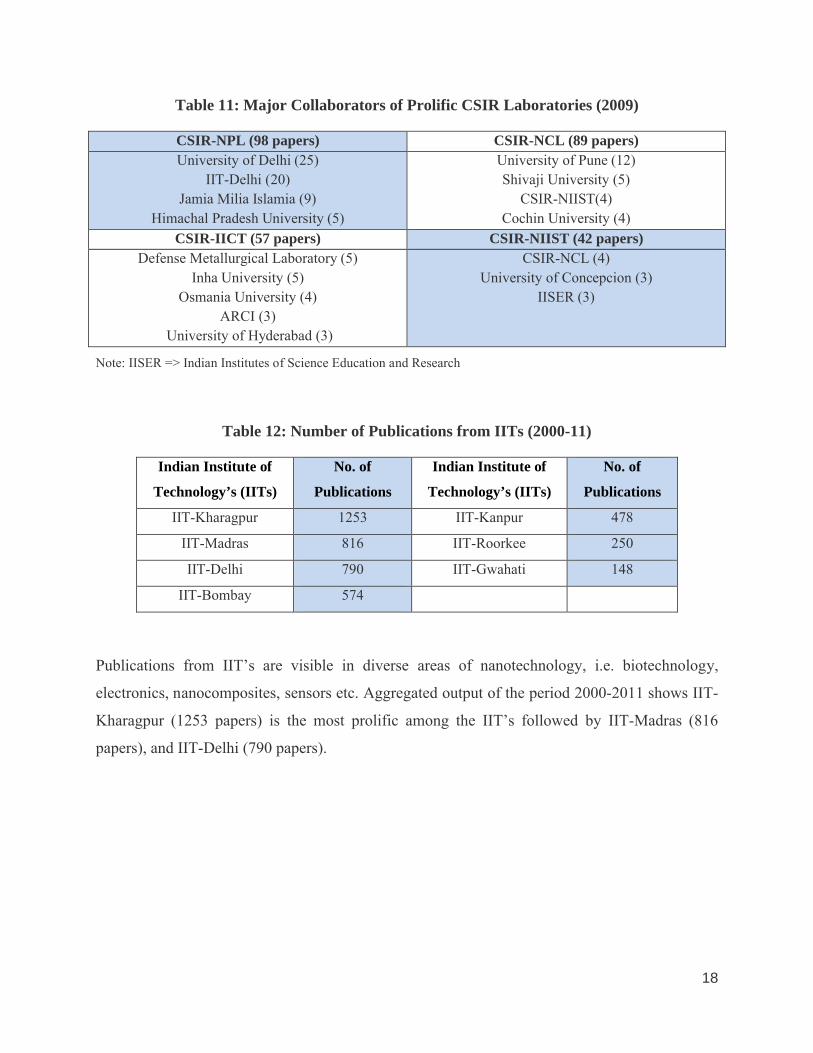
Table 11: Major Collaborators of Prolific CSIR Laboratories (2009)
CSIR-NPL (98 papers) CSIR-NCL (89 papers)University of Delhi (25)
IIT-Delhi (20)Jamia Milia Islamia (9)
Himachal Pradesh University (5)
University of Pune (12)Shivaji University (5)
CSIR-NIIST(4)Cochin University (4)
CSIR-IICT (57 papers) CSIR-NIIST (42 papers)Defense Metallurgical Laboratory (5)
Inha University (5)Osmania University (4)
ARCI (3)University of Hyderabad (3)
CSIR-NCL (4)University of Concepcion (3)
IISER (3)
Note: IISER => Indian Institutes of Science Education and Research
Table 12: Number of Publications from IITs (2000-11)
Indian Institute of
Technology’s (IITs)
No. of
Publications
Indian Institute of
Technology’s (IITs)
No. of
Publications
IIT-Kharagpur 1253 IIT-Kanpur 478
IIT-Madras 816 IIT-Roorkee 250
IIT-Delhi 790 IIT-Gwahati 148
IIT-Bombay 574
Publications from IIT’s are visible in diverse areas of nanotechnology, i.e. biotechnology,
electronics, nanocomposites, sensors etc. Aggregated output of the period 2000-2011 shows IIT-
Kharagpur (1253 papers) is the most prolific among the IIT’s followed by IIT-Madras (816
papers), and IIT-Delhi (790 papers).
19
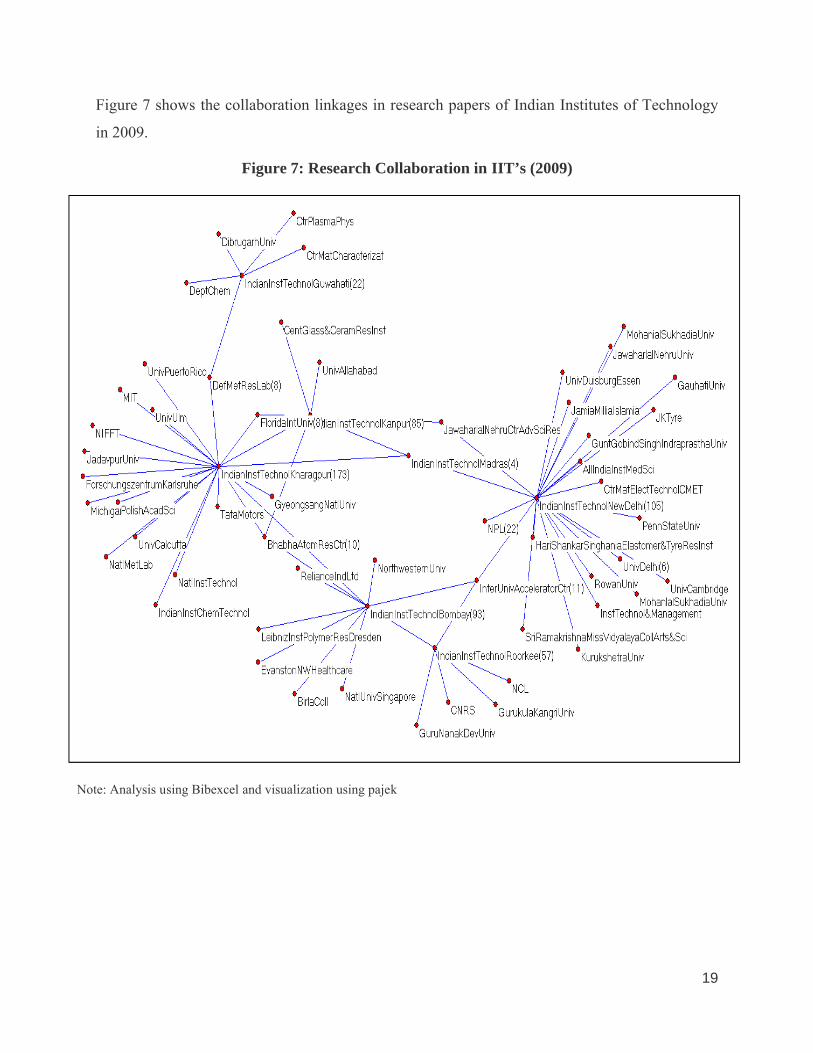
Figure 7 shows the collaboration linkages in research papers of Indian Institutes of Technology
in 2009.
Figure 7: Research Collaboration in IIT’s (2009)
Note: Analysis using Bibexcel and visualization using pajek
20
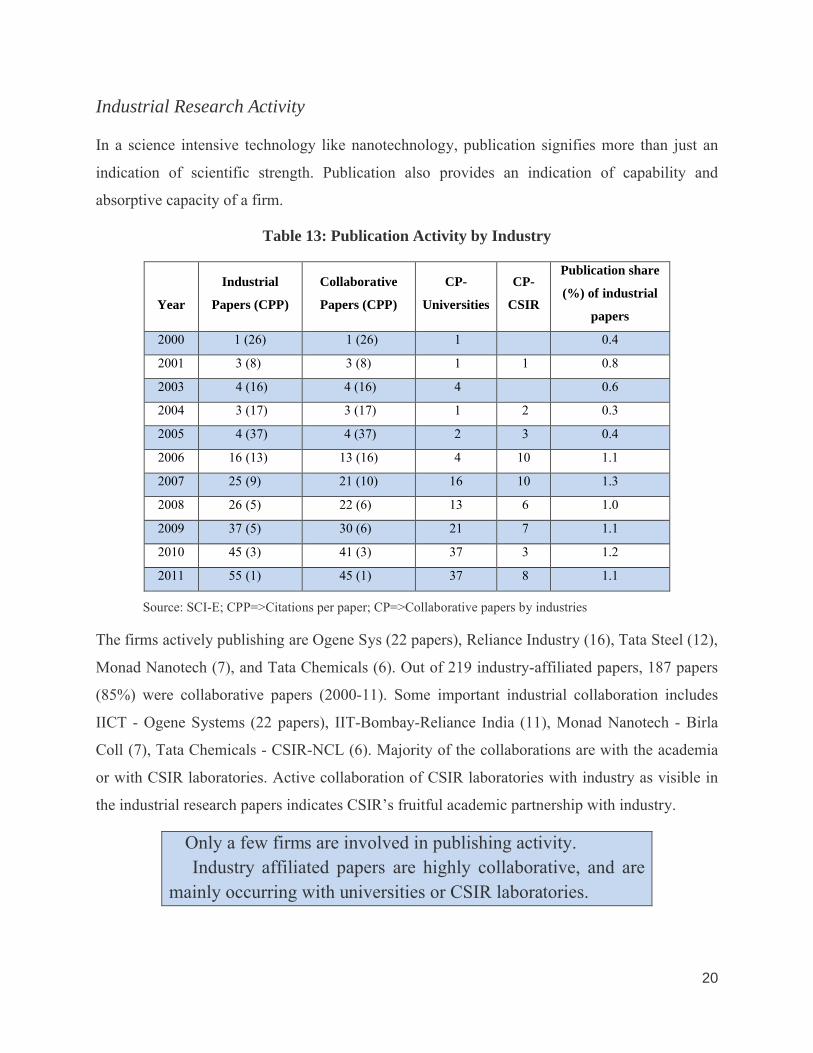
Industrial Research Activity
In a science intensive technology like nanotechnology, publication signifies more than just an
indication of scientific strength. Publication also provides an indication of capability and
absorptive capacity of a firm.
Table 13: Publication Activity by Industry
Year
Industrial
Papers (CPP)
Collaborative
Papers (CPP)
CP-
Universities
CP-
CSIR
Publication share
(%) of industrial
papers
2000 1 (26) 1 (26) 1 0.4
2001 3 (8) 3 (8) 1 1 0.8
2003 4 (16) 4 (16) 4 0.6
2004 3 (17) 3 (17) 1 2 0.3
2005 4 (37) 4 (37) 2 3 0.4
2006 16 (13) 13 (16) 4 10 1.1
2007 25 (9) 21 (10) 16 10 1.3
2008 26 (5) 22 (6) 13 6 1.0
2009 37 (5) 30 (6) 21 7 1.1
2010 45 (3) 41 (3) 37 3 1.2
2011 55 (1) 45 (1) 37 8 1.1
Source: SCI-E; CPP=>Citations per paper; CP=>Collaborative papers by industries
The firms actively publishing are Ogene Sys (22 papers), Reliance Industry (16), Tata Steel (12),
Monad Nanotech (7), and Tata Chemicals (6). Out of 219 industry-affiliated papers, 187 papers
(85%) were collaborative papers (2000-11). Some important industrial collaboration includes
IICT - Ogene Systems (22 papers), IIT-Bombay-Reliance India (11), Monad Nanotech - Birla
Coll (7), Tata Chemicals - CSIR-NCL (6). Majority of the collaborations are with the academia
or with CSIR laboratories. Active collaboration of CSIR laboratories with industry as visible in
the industrial research papers indicates CSIR’s fruitful academic partnership with industry.
Only a few firms are involved in publishing activity. Industry affiliated papers are highly collaborative, and are mainly occurring with universities or CSIR laboratories.

21
Table 14 lists the Industries collaborating with the prolific institutions for publishing research
papers.
Table 14: Firms Collaborating with the Most Prolific Institutions
IISc CSIR-NCL BARC
Datar Switchgear
NED Energy
Rigaku Americas Corporation
Exxon Mobil Research & Engineering Company
Materials and Electrochemical Company
Nanoco Technologies
Orbifold Solutions
Tata Steel
Reliance India
IBM Co.
Tata Chemicals
United Phosphorus
Monad Nanotech
SHM
IACS IIT-Kharagpur
Nanoco Technologies
Jubilant Chemsys
Tata Steel
Majority of the firms involved in research activity and showing active collaboration with
universities/CSIR-laboratories have invested in this technology at an early stage; estimated to
have invested over 1.2 billion rupees (30 million USD) in nanotechnology research and
development. Reliance and TATA Chemicals have set up their own R&D centres in Pune
(Maharashtra).
A rough estimate of researchers involved in nanotechnology research in India can be calculated
from authors publishing papers in this field. Based on unique author identification6, 15,562
authors were identified (research period 2000-2011).
6 There are various types of errors such as wrong author spelling, common names, etc. Another problem is that only first alphabet of the author name is given. For corrections/validations, matching of authors with institution was undertaken. But still this method only provides a very rough estimate.
22
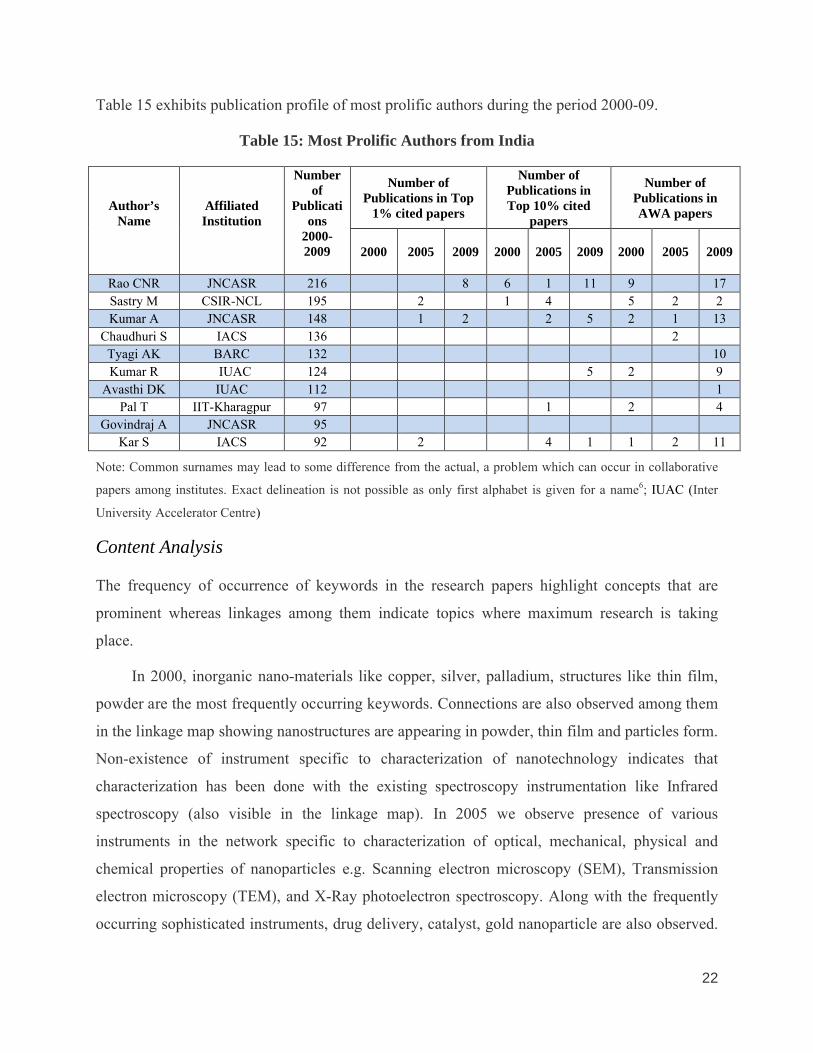
Table 15 exhibits publication profile of most prolific authors during the period 2000-09.
Table 15: Most Prolific Authors from India
Author’s Name
Affiliated Institution
Number of
Publications
2000-2009
Number of Publications in Top
1% cited papers
Number of Publications in Top 10% cited
papers
Number of Publications in AWA papers
2000 2005 2009 2000 2005 2009 2000 2005 2009
Rao CNR JNCASR 216 8 6 1 11 9 17Sastry M CSIR-NCL 195 2 1 4 5 2 2Kumar A JNCASR 148 1 2 2 5 2 1 13
Chaudhuri S IACS 136 2Tyagi AK BARC 132 10Kumar R IUAC 124 5 2 9
Avasthi DK IUAC 112 1Pal T IIT-Kharagpur 97 1 2 4
Govindraj A JNCASR 95Kar S IACS 92 2 4 1 1 2 11
Note: Common surnames may lead to some difference from the actual, a problem which can occur in collaborative
papers among institutes. Exact delineation is not possible as only first alphabet is given for a name6; IUAC (Inter
University Accelerator Centre)
Content Analysis
The frequency of occurrence of keywords in the research papers highlight concepts that are
prominent whereas linkages among them indicate topics where maximum research is taking
place.
In 2000, inorganic nano-materials like copper, silver, palladium, structures like thin film,
powder are the most frequently occurring keywords. Connections are also observed among them
in the linkage map showing nanostructures are appearing in powder, thin film and particles form.
Non-existence of instrument specific to characterization of nanotechnology indicates that
characterization has been done with the existing spectroscopy instrumentation like Infrared
spectroscopy (also visible in the linkage map). In 2005 we observe presence of various
instruments in the network specific to characterization of optical, mechanical, physical and
chemical properties of nanoparticles e.g. Scanning electron microscopy (SEM), Transmission
electron microscopy (TEM), and X-Ray photoelectron spectroscopy. Along with the frequently
occurring sophisticated instruments, drug delivery, catalyst, gold nanoparticle are also observed.
23
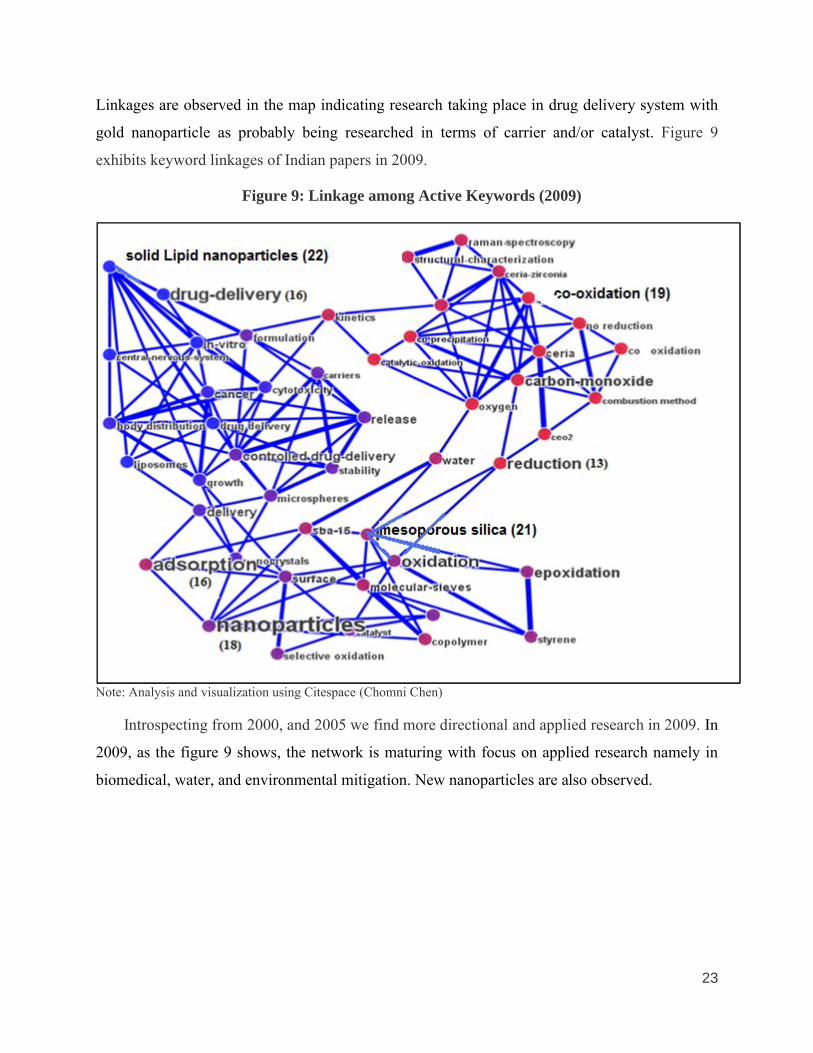
Linkages are observed in the map indicating research taking place in drug delivery system with
gold nanoparticle as probably being researched in terms of carrier and/or catalyst. Figure 9
exhibits keyword linkages of Indian papers in 2009.
Figure 9: Linkage among Active Keywords (2009)
Note: Analysis and visualization using Citespace (Chomni Chen)
Introspecting from 2000, and 2005 we find more directional and applied research in 2009. In
2009, as the figure 9 shows, the network is maturing with focus on applied research namely in
biomedical, water, and environmental mitigation. New nanoparticles are also observed.
24
Patenting Activity
Total 11,289 patents were filed (2001-2011) under ‘Class 977: Nanotechnology’ in the US Patent
Office (USPTO). USA filed 4393 patents (39% of overall filing), followed by Japan 1014 patents
(9% of patents filed) and South Korea 829 patents (7% of overall filing), and Taiwan 623 patents
(5% of total contribution).
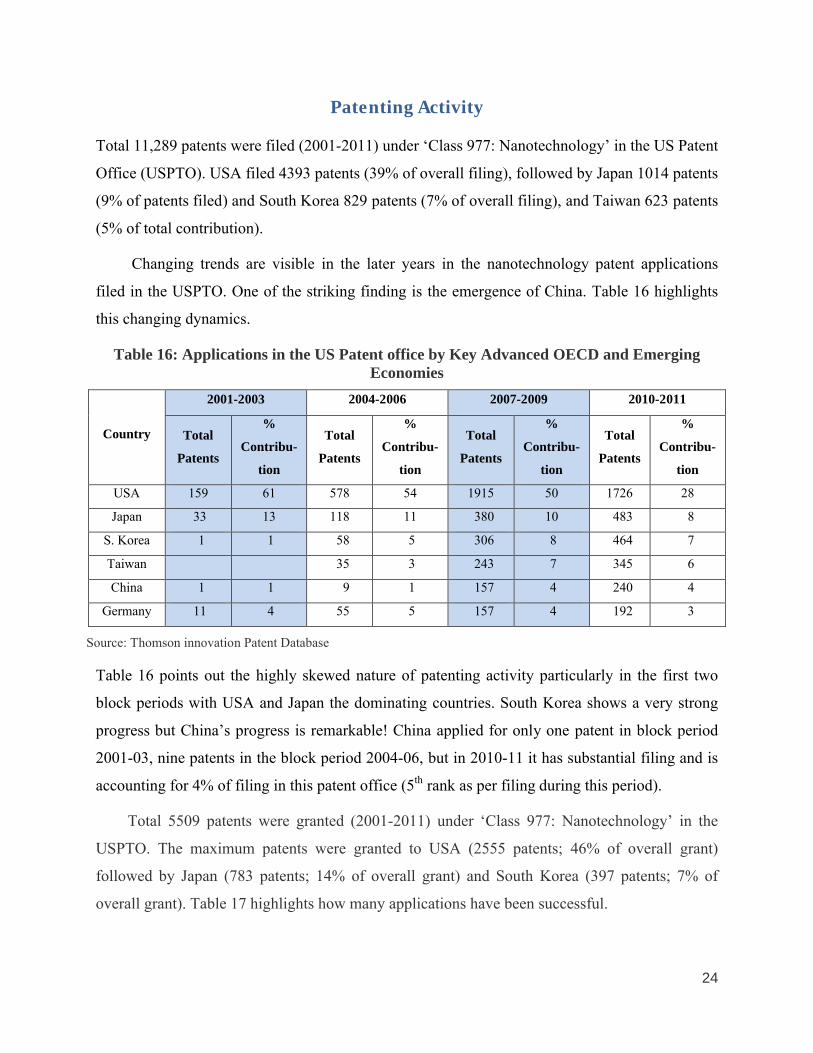
Changing trends are visible in the later years in the nanotechnology patent applications
filed in the USPTO. One of the striking finding is the emergence of China. Table 16 highlights
this changing dynamics.
Table 16: Applications in the US Patent office by Key Advanced OECD and Emerging Economies
Country
2001-2003 2004-2006 2007-2009 2010-2011
Total
Patents
%
Contribu-
tion
Total
Patents
%
Contribu-
tion
Total
Patents
%
Contribu-
tion
Total
Patents
%
Contribu-
tion
USA 159 61 578 54 1915 50 1726 28
Japan 33 13 118 11 380 10 483 8
S. Korea 1 1 58 5 306 8 464 7
Taiwan 35 3 243 7 345 6
China 1 1 9 1 157 4 240 4
Germany 11 4 55 5 157 4 192 3
Source: Thomson innovation Patent Database
Table 16 points out the highly skewed nature of patenting activity particularly in the first two
block periods with USA and Japan the dominating countries. South Korea shows a very strong
progress but China’s progress is remarkable! China applied for only one patent in block period
2001-03, nine patents in the block period 2004-06, but in 2010-11 it has substantial filing and is
accounting for 4% of filing in this patent office (5th rank as per filing during this period).
Total 5509 patents were granted (2001-2011) under ‘Class 977: Nanotechnology’ in the
USPTO. The maximum patents were granted to USA (2555 patents; 46% of overall grant)
followed by Japan (783 patents; 14% of overall grant) and South Korea (397 patents; 7% of
overall grant). Table 17 highlights how many applications have been successful.
25
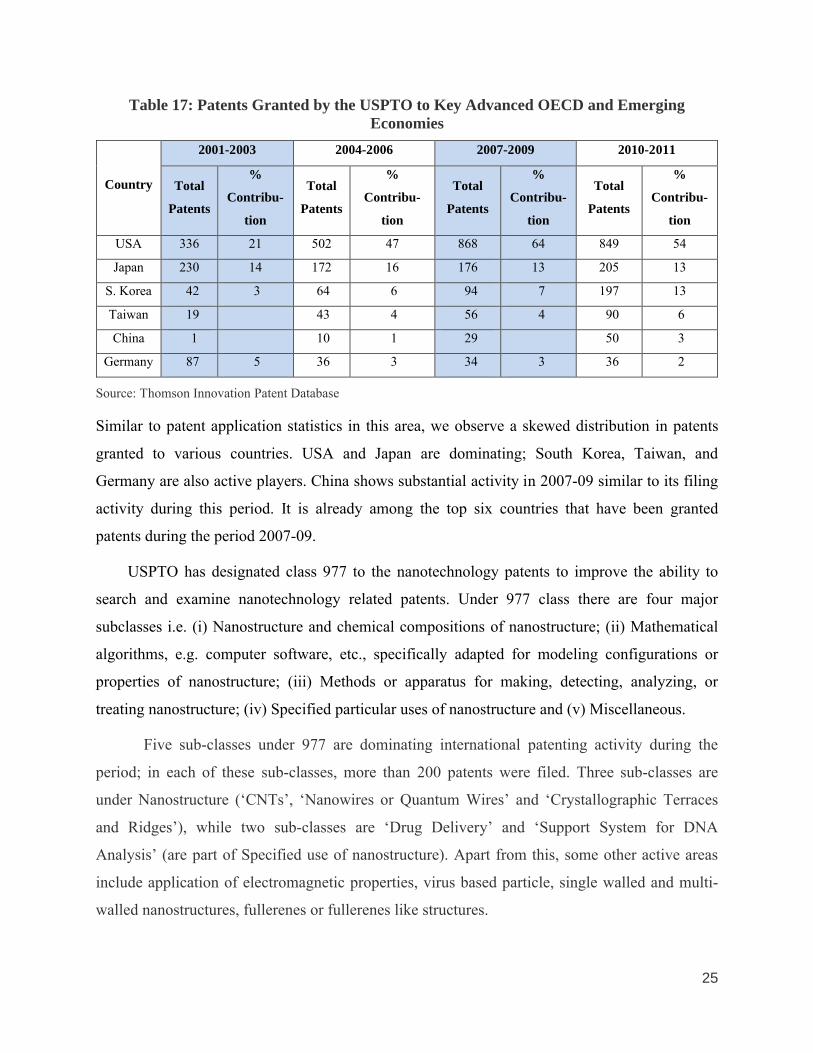
Table 17: Patents Granted by the USPTO to Key Advanced OECD and Emerging Economies
Country
2001-2003 2004-2006 2007-2009 2010-2011
Total
Patents
%
Contribu-
tion
Total
Patents
%
Contribu-
tion
Total
Patents
%
Contribu-
tion
Total
Patents
%
Contribu-
tion
USA 336 21 502 47 868 64 849 54
Japan 230 14 172 16 176 13 205 13
S. Korea 42 3 64 6 94 7 197 13
Taiwan 19 43 4 56 4 90 6
China 1 10 1 29 50 3
Germany 87 5 36 3 34 3 36 2
Source: Thomson Innovation Patent Database
Similar to patent application statistics in this area, we observe a skewed distribution in patents
granted to various countries. USA and Japan are dominating; South Korea, Taiwan, and
Germany are also active players. China shows substantial activity in 2007-09 similar to its filing
activity during this period. It is already among the top six countries that have been granted
patents during the period 2007-09.
USPTO has designated class 977 to the nanotechnology patents to improve the ability to
search and examine nanotechnology related patents. Under 977 class there are four major
subclasses i.e. (i) Nanostructure and chemical compositions of nanostructure; (ii) Mathematical
algorithms, e.g. computer software, etc., specifically adapted for modeling configurations or
properties of nanostructure; (iii) Methods or apparatus for making, detecting, analyzing, or
treating nanostructure; (iv) Specified particular uses of nanostructure and (v) Miscellaneous.
Five sub-classes under 977 are dominating international patenting activity during the
period; in each of these sub-classes, more than 200 patents were filed. Three sub-classes are
under Nanostructure (‘CNTs’, ‘Nanowires or Quantum Wires’ and ‘Crystallographic Terraces
and Ridges’), while two sub-classes are ‘Drug Delivery’ and ‘Support System for DNA
Analysis’ (are part of Specified use of nanostructure). Apart from this, some other active areas
include application of electromagnetic properties, virus based particle, single walled and multi-
walled nanostructures, fullerenes or fullerenes like structures.

26
Table 18: Activity of different countries in Sub-classes of 977 USPTO (2001-11)
Description
Application
[Grant]
Nanostructure
(977700)
Mathematical
algorithms for
modeling
configurations
(977839)
Manufacture,
treatment or
detection of
nanostructure
(977840)
Specified use of
nanostructure
(977902)
Miscellaneous
(977963)
USA 2811 [1938] 10 [6] 750 [1109] 1767 [873] 5 [13]
S. Korea 614 [234] - 154 [147] 232 [969] 1 [1]
China 294 [64] - 79 [38] 139 [19] -
India 26 [14] - 10 [9] 17 [9] -
World 8048 [3649] 18 [11] 2070 [2563] 4207 [2369] 7 [24]
Indian Patenting Activity in US Patent Office
Indian patenting in nanotechnology is just beginning in the USPTO. Only 35 patents were filed
during the period 2001-11; three filing in 2004-06, thirteen filing in 2007-09 and nineteen filings
in 2010-11 respectively. Only a few entities are involved in patenting activity but the number is
increasing in later period. From 2001-2009 in patent filing only three entities are visible. They
are Purdune Research Foundation, Transgene Biotek, and DRDO, rest all are individual patents.
But during the two year period (2010-2011) fourteen entities are involved in patent filing
activity. These include IISc, CSIR, IIT-Madras, Tata Chemicals with two patent respectively and
JNCASR, Sunev Pharmaceuticals Solutions, Laila Pharmaceuticals, IIT-Bombay, IACS, DRDO,
University of Calcutta, Lifecare Innovations, Sun Pharmaceuticals with one filing each.
A total of 15 patents were granted during this period (2001-2011); eight patents granted
during 2001-03 and four patents in 2004-06, only one patent in 2007-09 and two patents in year
2010-11. Patents have been granted to only six entities during the period 2001-2011. They are
Dabur Research Foundation (2 patents [1 collaborative]), Delhi University (1 collaborative
patent), CSIR (10 patents), Torrent Pharmaceuticals (1 patent), CTS Corporation (1 patent), IISc
(1 patent).
The areas where India is dominating in patent filing and grant activity are ‘Nanostructure
based therapeutic compounds’, ‘Chemical process based manufacture of nanostructure’ and
‘Chemical compound to treat disease’. Some patents seem to provide new pathways to advance

27
technology with novel solutions. Sensor patents by Ajay Sood’s group in IISc are one example of
this. This group made international news in 2002 when they generated electricity by making a
fluid flow through single-walled nanotubes. The discovery led to an entirely new class of
nanosensors. Concept Medical Research Private Limited has applied for patents in the US and
India for introducing nano particles to release drugs to block cell proliferation in the narrowed
diseased coronary arteries. This is the first patent filed of this kind anywhere in the world to
release drugs into the diseased coronary arteries. The present solution is through stents, which
although are bio-absorbable but being made of polymers can create complications of
inflammation, clotting and toxicity.
Standard Development
Standard creation, recognition internationally, and its adoption plays an important role in making
a country’s dominant presence in a technology. This is more so for an emerging technology and
for a country with a large domestic market, as technical standards created by it in a particular
product class can become a key strategy for dominating internal market and influence future
adoption of that standard internationally.
China a non-OECD country is actively challenging advanced OECD economies in standard
creation in nanotechnology. China has developed a range of standards; initiating this process
from 2003 onwards with different agencies involved in this process. Standard setting has been
undertaken in parallel with other activities undertaken by her to gain early mover advantage in
this technology. China’s core area of focus within nanotechnology is in nanomaterial. In this
area one finds her active involvement in standard setting. It has created 27 nano-dimensional
material and characterization standards, two standards on terminology & nomenclature and 12
nano materials/products standards. Twenty-one standards have been implemented so far. In fact
it is the first country to issue national standards for nanotechnology in April, 2005. Among them
is the standard created in textile. This is the only standard of its kind and provides a competitive
edge for China in demonstrating that its nano-enabled textile is adhering to a standard. China
active involvement in TC-229 and creation of range of standards in non-materials has led to the
creation of TC-229 Material Specification Group WG4, which it is heading.
India inspite of significant progress has not paid due attention to nanotechnology standard
creation. Standard activity is not explicitly articulated in India’s nanotechnology plan and

28
implementation documents. Bureau of Indian Standards (BIS), CSIR-NPL and DST (Nano
Mission) are the key stakeholders in the standard creation activity. CSIR-NPL is the national
metrology institute of the country and thus the development of technical standards in
nanotechnology falls within its mandate. BIS coordinates the overall standardization activity in
the country. Only in 2010, BIS Nanotechnologies Sectional Committee has formed four national
mirror Working Groups adopting from ISO TC229. So far two standards are at the test stage:
National standard on use of Atomic Force Microscope for Characterization and Evaluation of
Nanomaterials
Electron Microscopic Characterization of Multi-wall Carbon Nanotubes.
The remaining two proposed standards are:
Luminescent Nanomaterials and Magnetic Nanoparticles and
Standard on Toxicity of Zinc Oxide Nanomaterials
Products and Processes Developed
Woodrow Wilson database explores various aspects of nanotechnology world. This database
contains 1317 items (covered upto the year 2011). Thirty countries show their presence in this
database. USA, Germany, South Korea, China, and Japan have major presence with 587, 168,
126, 55, and 51 products respectively. Majority of the products (60% of the total products)
globally are in health and fitness segments. Home and garden segment is another area that
dominates global activity. Products are not visible in two key medical segments where
nanotechnology based applications can play a key role namely ‘drug delivery and therapeutics’,
and ‘biosensors and medical devices’. This may be due to the limitations of this database as they
focus on product and not process inventory. India just entered in the list with two personal care
products (St. Botanica Nano Breast Cream, St. Botanica Pueraria Nano Breast Serum).
Indian firms and research organizations shows a more active profile in application
development in the domestic market. A few applications are visible which are addressing
developmental problems and can make global impact. Pharmaceuticals/Nano-biotechnology is
one of the important areas where India is now devoting attention. Other areas that are
attracting attention are energy, and water sector. Table 19 constructed from various websites,
29
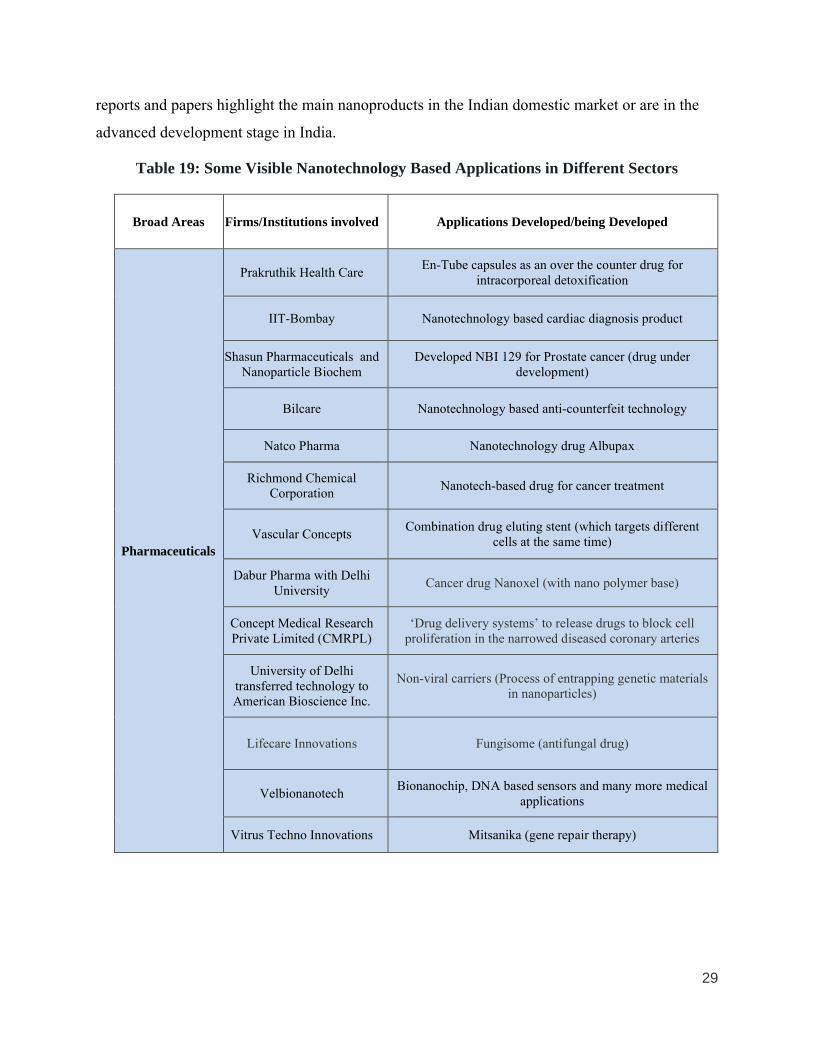
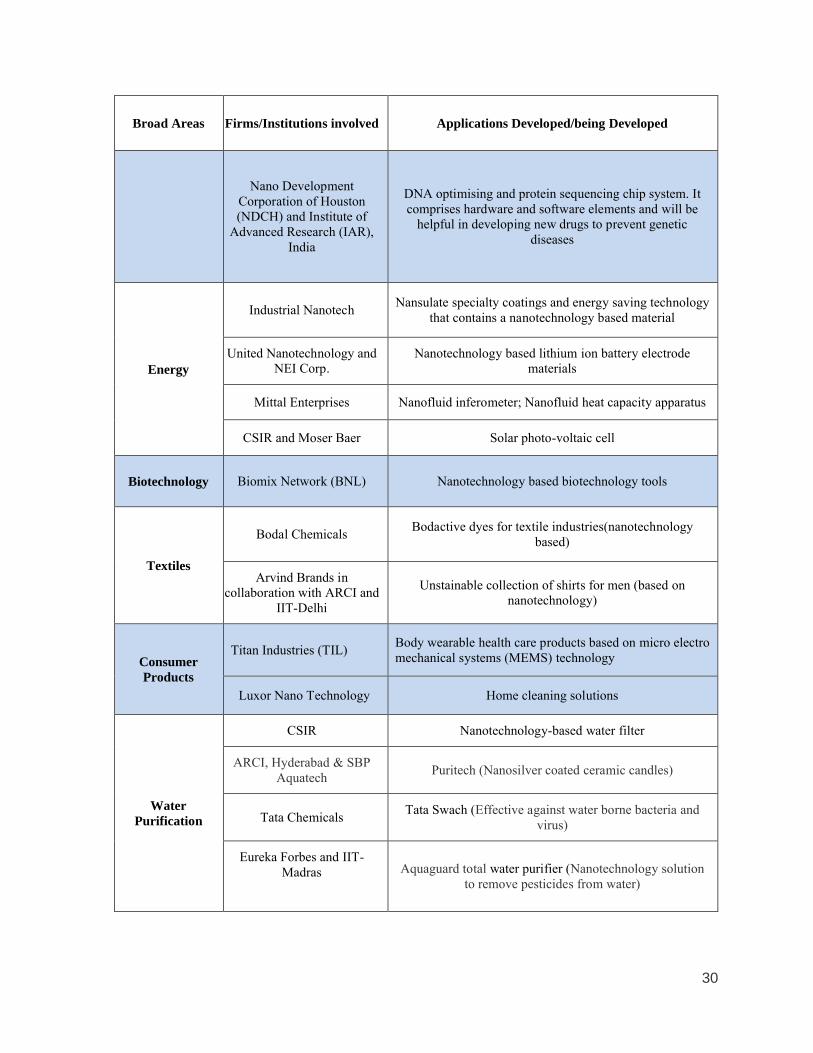
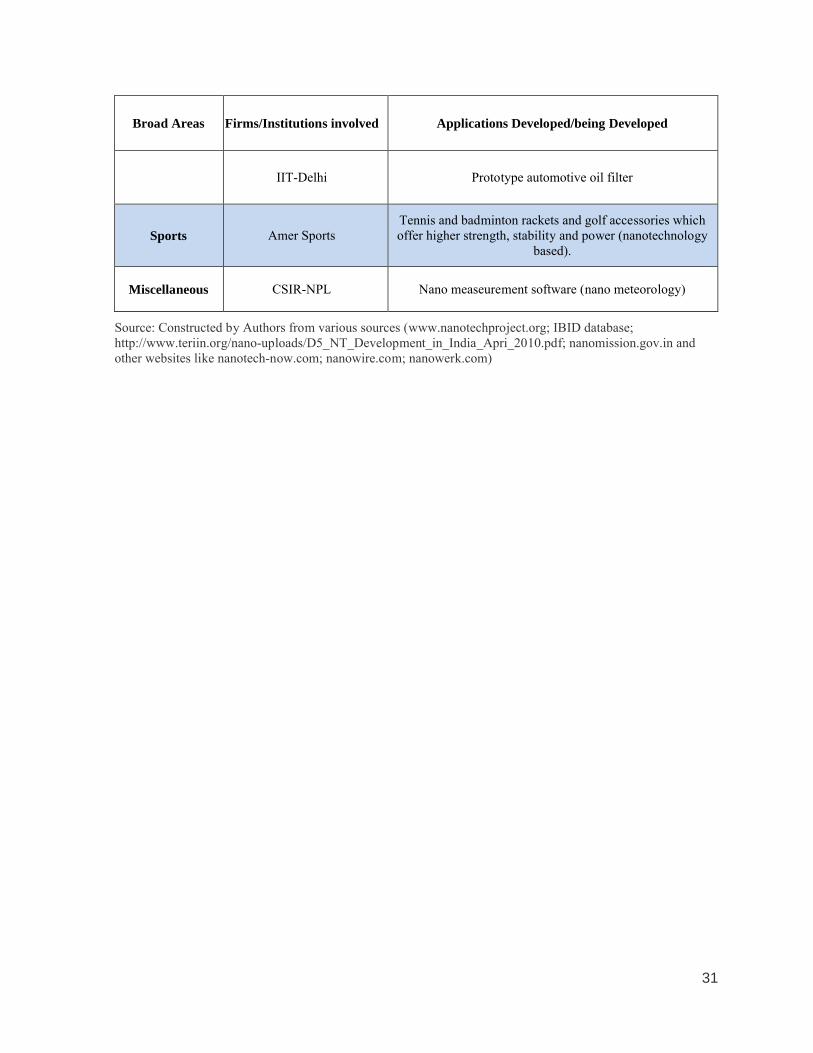
reports and papers highlight the main nanoproducts in the Indian domestic market or are in the
advanced development stage in India.
Table 19: Some Visible Nanotechnology Based Applications in Different Sectors
Broad Areas Firms/Institutions involved Applications Developed/being Developed
Pharmaceuticals
Prakruthik Health CareEn-Tube capsules as an over the counter drug for
intracorporeal detoxification
IIT-Bombay Nanotechnology based cardiac diagnosis product
Shasun Pharmaceuticals and Nanoparticle Biochem
Developed NBI 129 for Prostate cancer (drug under development)
Bilcare Nanotechnology based anti-counterfeit technology
Natco Pharma Nanotechnology drug Albupax
Richmond Chemical Corporation
Nanotech-based drug for cancer treatment
Vascular ConceptsCombination drug eluting stent (which targets different
cells at the same time)
Dabur Pharma with Delhi University
Cancer drug Nanoxel (with nano polymer base)
Concept Medical Research Private Limited (CMRPL)
‘Drug delivery systems’ to release drugs to block cell proliferation in the narrowed diseased coronary arteries
University of Delhi transferred technology to American Bioscience Inc.
Non-viral carriers (Process of entrapping genetic materials in nanoparticles)
Lifecare Innovations Fungisome (antifungal drug)
VelbionanotechBionanochip, DNA based sensors and many more medical
applications
Vitrus Techno Innovations Mitsanika (gene repair therapy)
30
Broad Areas Firms/Institutions involved Applications Developed/being Developed
Nano Development Corporation of Houston (NDCH) and Institute of
Advanced Research (IAR), India
DNA optimising and protein sequencing chip system. It comprises hardware and software elements and will be
helpful in developing new drugs to prevent genetic diseases
Energy
Industrial NanotechNansulate specialty coatings and energy saving technology
that contains a nanotechnology based material
United Nanotechnology and NEI Corp.
Nanotechnology based lithium ion battery electrode materials
Mittal Enterprises Nanofluid inferometer; Nanofluid heat capacity apparatus
CSIR and Moser Baer Solar photo-voltaic cell
Biotechnology Biomix Network (BNL) Nanotechnology based biotechnology tools
Textiles
Bodal ChemicalsBodactive dyes for textile industries(nanotechnology
based)
Arvind Brands in collaboration with ARCI and
IIT-Delhi
Unstainable collection of shirts for men (based on nanotechnology)
Consumer Products
Titan Industries (TIL)Body wearable health care products based on micro electro mechanical systems (MEMS) technology
Luxor Nano Technology Home cleaning solutions
Water Purification
CSIR Nanotechnology-based water filter
ARCI, Hyderabad & SBP Aquatech
Puritech (Nanosilver coated ceramic candles)
Tata ChemicalsTata Swach (Effective against water borne bacteria and
virus)
Eureka Forbes and IIT-Madras Aquaguard total water purifier (Nanotechnology solution
to remove pesticides from water)
31
Broad Areas Firms/Institutions involved Applications Developed/being Developed
IIT-Delhi Prototype automotive oil filter
Sports Amer SportsTennis and badminton rackets and golf accessories which offer higher strength, stability and power (nanotechnology
based).
Miscellaneous CSIR-NPL Nano measeurement software (nano meteorology)
Source: Constructed by Authors from various sources (www.nanotechproject.org; IBID database; http://www.teriin.org/nano-uploads/D5_NT_Development_in_India_Apri_2010.pdf; nanomission.gov.in and other websites like nanotech-now.com; nanowire.com; nanowerk.com)

32
Based on product development and innovation activity of firms and research organizations, it is
possible to highlight key institutions involved. Figure 11 highlights the institutions involved in
developing applications in key sub-domains of nanotechnology.
Figure 11: Key Players Involved in Sub Domains of Nanotechnology
Key players involved in developing
nanotechnology based
applications in sub-domains
Drug delivery/
Diagnostics/ Medicines
IACS, IIT-Bombay, IISc, IIT-Delhi, IIT-Kanpur, CSIR,
University of Delhi, Bilcare, Nacto Pharma, Shasun,
Prakruthik Health Care, Dabur Pharma, Lifecare
InnovationsPaneacea Biotech, Piramal, Dr. Reddy's
LaboratoriesEnvironmental
remediation
IIT-Bombay, IIT-Kanpur, CSIR
Semiconductors
IIT-Madras, IACS, SINP, CSIR-NCL, IIT-Bombay, Univ. of Pune, IISc, IIT-
Delhi
Energy
IACS, IIT-Bombay, IISc, IIT-Delhi, IIT-Kanpur, CSIR, SINP, Amrita University,
Moser Baer, Mittal Enterprises, Bharat
Electronics,Insta Power
Textiles
IIT –Delhi, IISc, ARCI,Resil Chemicals,
Pluss Polymer, Purolater India Ltd
Water
IIT-Madras, ARCI, IIT-Delhi, IIT-Kanpur, CSIR,
Tata Chemicals, SBP Aquatech, Eureka
Forbes

33
Final Remarks
India has made significant progress in nanotechnology research. It is now the seventh most
active country publishing in this field. Significant upward trends are on account of increasing
activity of institutions, increase in number of institutions involved in publishing, wider set of
journals used for publication and increasing collaborations. Research is exhibiting more
interdisciplinary characteristics (reflection through journals) and activity within different
subfields of nanotechnology. India’s global share and contribution among highly cited papers
are increasing. Publication analysis underscores the role of collaboration. Collaboration is
instrumental in increasing output, helping in publishing in high impact factor journals and in
papers attracting citations.
India’s patenting activity is still in a nascent stage. However, some patents are promising
as they address niche areas of global relevance and in addressing pressing concerns such as
sensors, medicine, and water. Standardization is very important as it defines and regulates
product/process quality. India, has only taken initial first steps in addressing standardization
issue. India is focusing on a few key areas for nanotechnology based intervention. Nano-
biotechnology is one of the important areas now getting attention. India has developed
nanotechnology based products mainly in water, medicines, computers, energy, sports,
pharmaceutical/biotechnology and various consumer products.
There are some major gaps that need to be addressed. Patenting is important in this
critical technology. Only a few firms and organizations from India are involved in patenting
activity. This picture may change to some extent in the domestic patent office. Patenting in US
provides higher value appropriation to firms particularly in a high technology area. Indications
available of patenting activity in the US thus have to be seen in this context. India’s papers are
attracting attention but still large numbers of papers remains uncited or attract one/two citations.
The ratio of citation per paper is still very low, an indication of weak reception.
Inspite of impressive research activity the translation towards product/process
development needs more attention. Nanotechnology is a science intensive technology and
scientific understanding is pre-requisite for developing applications in this field. This translation
is possibly not happening because only a few firms are involved in research activity.
34
Standardization is a major area of concern. It has not taken up to the extent it is needed to be
addressed.
Acknowledgement
We thank DST-NSTMIS for supporting this study and Dr Parveen Arora in particular for his
coordination. Thank CSIR-NISTADS for providing necessary support for conducting this study.
The project received valuable support from ARCI and in particular Dr G Sundararajan Director
ARCI and Chairman of the Project Advisory Committee. We are grateful to the LPAC members
and in particular Prof Santanu Roy (IMT) and Dr Anil Rai (IASRI) for their comments on this
Policy Brief and the related Strategy Paper.
Papers Primarily Cited for this Strategy Paper
Research Publications (Published/Ongoing) of the study group
Bhattacharya, S., Shilpa, Bhati, M (in Press). China and India: The two new players in the nanotechnology race. Scientometrics. DOI: 10.1007/s11192-012-0651-7. Available at online first; http://www.springerlink.com/content/l60518387804681v/.
Bhattacharya, S., Shilpa (2012). China Moving Ahead in the Global Nanotechnology Race: Evidences from Scientometric Study. COLLNET Journal of Scientometrics and Information Management. Abstract available at online first; http://www.tarupublications.com/journals/cjsim/Abstract/CJSIM61_09_Abstract.pdf
Bhattacharya, S., Bhati, M., Jayanthi, A.P. and Malhotra, S.K. (in Press). Knowledge Creation and Transformation Process in a Frontier Technology: Case Study of Nanotechnology Research in India In Advances in Nanotechnology Westville Publishing India, Volume 7, Chapter 26.
Bhattacharya, S., Bhati,M and Kshitij, AP. (2011). Investigating the Role of Policies, Strategies, and Governance in China’s Emergence as a Global Nanotech Player. IEEE conference proceeding of the 2011 Atlanta Conference on Science and Innovation Policy. Available at: http://ieeexplore.ieee.org/xpls/abs_all.jsp?arnumber=6064462.
Bhattacharya, S and Bhati, M. (2011). China’s Emergence as a Global Nanotech Player: Lessons for Countries in Transition. China Report, 47 (4).
Bhattacharya, S., Shilpa (2011). Mapping Nanotechnology Research and Innovation in India. DESIDOC Journal of Library & Information Technology, 31 (5), 349-358.
TERI. (2009). Nanotechnology developments in India – a status report. The Energy and Resources Institute.(http://www.teriin.org/nano-uploads/D5_NT_Development_in_India_Apri_2010.pdf)
35
NRM Project Report. (2006). FP6 Program. European Commission. (http://www.nanowerk.com/nanotechnology/reports/reportpdf/report74.pdf)
NSD Bio Group, LLC. (2009). Research report on Chinese High-tech Industries. U.S. China Economic and Security Review Commission.
Porter, A. and Youtie, J. (2008). How interdisciplinary is nanotechnology? Journal of Nanoparticle Research, 11(5), 1023-1041.
Woodrow Wilson International Center for Scholars’ Project on Emerging Nanotechnologies database, www.nanotechproject.org.
Dang, Y. et al. (2009). Trends in worldwide nanotechnology patent applications: 1991-2008, Journal of Nanoparticle Research, 12(3), 687–706.
Huang, C., Notten, A., Rasters, N. (2011). Nanoscience and technology publications and patents: A review of social science studies and search strategies. Journal of Technology Transfer, 36(2), 145-172.
Kostoff, R. N., Stump, J. A., Johnson, D., Murday, J. S., Lau, C. G. Y., Tolles, W. M. (2006). The structure and infrastructure of global nanotechnology literature. Journal of Nanoparticle Research, 8(3-4), 301-321.
Kostoff, et al. (2007). ‘DTIC Technical Report Number ADA 461930’, Defense Technical Information Center, Fort Belvoir VA, http://www.dtic.mil/
Mogoutov, A., Kahane, B. (2007). Data search strategy for science and technology emergence: A scalable and evolutionary query for nanotechnology tracking. Research Policy, 36, 893-903.
Mantovani, E, A Porcari, M J Morrison and R E Geertsma (2010). Developments in Nanotechnologies Regulation and Standards - Report of the Observatory Nano. (http//. www.observatorynano.eu/)
Bai, C (2005). Global voices of science: Ascent of Nanoscience in China. Science, Vol. 309 (5731), pp. 61-63.
Gu H. and Schulte J. (2005). Scientific Development and Industrial Application of Nanotechnology in China in Nanotechnology: Global Strategies, Industry Trends and Applications, ed. Jurgen Schulte, chapter 1. West Sussex: John Wiley & Sons Ltd, pp-25.
Zhou, P. and Leydesdorff, L. (2006). The emergence of China as a leading nation in science. Research Policy, 35(1), 83-104.

36
Annexure 1
Biological Sciences• Institute of Genomics and Integrative Biology (IGIB) • Centre for Cellular and Molecular Biology (CCMB) • Central Drug Research Institute (CDRI) • Central Food Technological Research Institute (CFTRI) • Central Institute of Medicinal & Aromatic Plants (CIMAP)• Indian Institute of Chemical Biology (IICB) • Institute of Microbial Technology (IMT) • Indian Institute of Toxicology Research (IITR) • National Botanical Research Institute (NBRI) • Indian Institute of Integrative Medicine (IIIM) • Institute of Himalayan Bioresource Technolonogy (IHBT)
Engineering Sciences• Central Road Research Institute (CRRI) • National Aerospace Laboratories (NAL) • National Environmental Engineering Research Institute (NEERI) • National Metallurgical Laboratory (NML) • Advanced Material and Process Research Institute (AMPRI)• Institute of Minerals and Materials Technology (IMMT)• National Institute of Interdisciplinary Science and technology (NIIST) • Structural Engineering Research Centre (SERC)• Central Building Research Institute (CBRI)• Central Glass and Ceramic Research Institute (CGCRI) • Central Mechanical Engineering Research Institute (CMERI)
Chemical Sciences• Central Electrochemical Research (CECRI) • Central Leather Research Institute (CLRI)• Central Salt & Marine Chemicals Research Institute (CSMCRI) • Indian Institute of Chemical Technology (IICT) • Indian Institute of Petroleum (IIP) • National Chemical Laboratory (NCL) • North-East Institute of Science and Technology (NEIST)• Central Institute of Mining and Fuel Research (CIMFR)
Information Sciences• National Institute of Science Communication & Information Resources (NISCAIR) • National Institute of Science Technology and Development Studies (NISTADS) • Unit for Research and Development of Information Products (URDIP)
Physical Sciences• Central Electronics Engineering Research Institute (CEERI) • Central Scientific Instruments Organisation (CSIO) • National Geophysical Research Institute (NGRI) • National Institute of Oceanography (NIO) • National Physical Laboratory (NPL)
Source: Council of Scientific and Industrial Research, Annual Report 2010-2011.
CSIR LABORATORIES/ INSTITUTES
37
Annexure 2
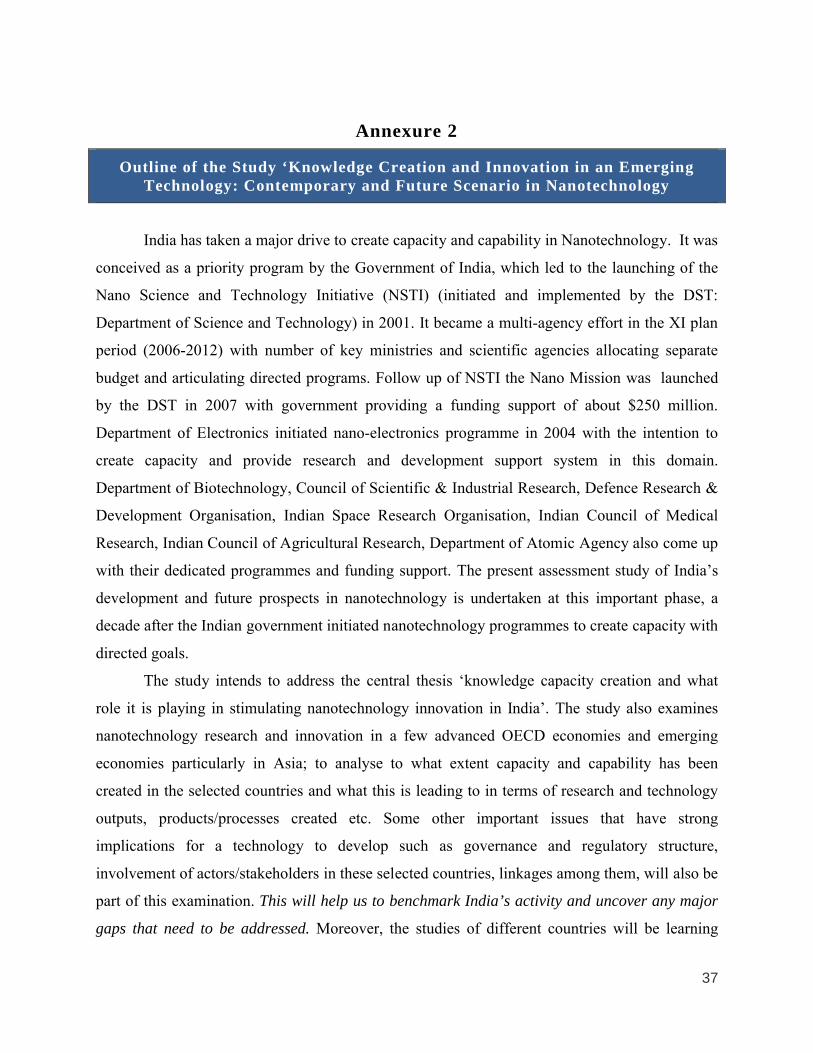
Outline of the Study ‘Knowledge Creation and Innovation in an Emerging Technology: Contemporary and Future Scenario in Nanotechnology
India has taken a major drive to create capacity and capability in Nanotechnology. It was
conceived as a priority program by the Government of India, which led to the launching of the
Nano Science and Technology Initiative (NSTI) (initiated and implemented by the DST:
Department of Science and Technology) in 2001. It became a multi-agency effort in the XI plan
period (2006-2012) with number of key ministries and scientific agencies allocating separate
budget and articulating directed programs. Follow up of NSTI the Nano Mission was launched
by the DST in 2007 with government providing a funding support of about $250 million.
Department of Electronics initiated nano-electronics programme in 2004 with the intention to
create capacity and provide research and development support system in this domain.
Department of Biotechnology, Council of Scientific & Industrial Research, Defence Research &
Development Organisation, Indian Space Research Organisation, Indian Council of Medical
Research, Indian Council of Agricultural Research, Department of Atomic Agency also come up
with their dedicated programmes and funding support. The present assessment study of India’s
development and future prospects in nanotechnology is undertaken at this important phase, a
decade after the Indian government initiated nanotechnology programmes to create capacity with
directed goals.
The study intends to address the central thesis ‘knowledge capacity creation and what
role it is playing in stimulating nanotechnology innovation in India’. The study also examines
nanotechnology research and innovation in a few advanced OECD economies and emerging
economies particularly in Asia; to analyse to what extent capacity and capability has been
created in the selected countries and what this is leading to in terms of research and technology
outputs, products/processes created etc. Some other important issues that have strong
implications for a technology to develop such as governance and regulatory structure,
involvement of actors/stakeholders in these selected countries, linkages among them, will also be
part of this examination. This will help us to benchmark India’s activity and uncover any major
gaps that need to be addressed. Moreover, the studies of different countries will be learning

38
experience and provide insights to different approaches that can be adopted for stimulating
nanotechnology research and innovation in India.
The key research questions that inform this research study are: What are the enabling
factors/incentives for nanotechnology R&D in India?; What are the structural characteristic of
the scientific and applied knowledge?; Is scientific and technological capacity being created
driving innovation in different settings i.e. university/domestic firms/foreign Institutions?; What
is the nature and quality of linkages existing among different actors? Do the various linkages
play an important role in the invention and innovation process?; What are the major constraints
that are inhibiting innovation activity of different actors?; What would be the approach to
enhance R&D capability and move up the value chain?; What has been the strategy followed by
different countries to enhance research and innovation in nanotechnology?; What can be the
learning experiences for India in terms of policy formulation, strategy and governance that can
stimulate research and innovation in nanotechnology?
The status of ‘nanotechnology’ research and innovation in nanotechnology and
particularly in India is discerned based on: (a) Analysing research material on S&T and
Innovation policy and strategy with specific reference to nanotechnology of select countries
including India. (b) Applying bibliometric and innovation indicators to map the research and
innovation activity in India. (c) Analyzing initiatives undertaken by various countries including
India to commercialize nanotechnology. Status and extent of nanotechnology enabled products in
the market, new applications developed that have potential markets, etc.

Brief Profile of the Contributors
Dr. Sujit Bhattacharya
New Delhi and Editor
Research
Innovation Policy Studies, Scientometrics, Intellectual Property Rights
in the context of research, innovation and development
published widely in the afforesaid areas
project ‘Knowledge
Contemporary and Future Scenario in nanotechnology’
Shilpa is a Project Assistant at NISTADS, presently working in the
project ‘Knowledge creation and innovation in emerging technologies’.
She is an M.Sc in Bioinformatics and is developing competency in data
mining and visualization which is reflected in her rese
Jayanthi A. Pushkaran
presently working on project title “Knowledge
in emerging technologies
Science Policy, Jawaharlal Nehru University. She is especially interested
in risk and governance issues in emerging technologies and is
contributing actively in this theme.
Brief Profile of the Contributors
Dr. Sujit Bhattacharya is a Senior Principal Scientist in NISTADS,
New Delhi and Editor-In-Chief of the ‘Journal of Scientometric
Research’. His areas of work include Science, Technology and
Innovation Policy Studies, Scientometrics, Intellectual Property Rights
in the context of research, innovation and development
published widely in the afforesaid areas. He is leading th
‘Knowledge creation and innovation in emerging technologies
Contemporary and Future Scenario in nanotechnology’.
is a Project Assistant at NISTADS, presently working in the
project ‘Knowledge creation and innovation in emerging technologies’.
She is an M.Sc in Bioinformatics and is developing competency in data
mining and visualization which is reflected in her research contributions.
Jayanthi A. Pushkaran is a Senior Project Assistant at NISTADS
presently working on project title “Knowledge creation and innovation
in emerging technologies” and a PhD Scholar at the Centre for Studies in
Science Policy, Jawaharlal Nehru University. She is especially interested
in risk and governance issues in emerging technologies and is
contributing actively in this theme.
39
is a Senior Principal Scientist in NISTADS,
Journal of Scientometric
. His areas of work include Science, Technology and
Innovation Policy Studies, Scientometrics, Intellectual Property Rights
in the context of research, innovation and development. He has
. He is leading the DST-NSTMIS
creation and innovation in emerging technologies:
is a Project Assistant at NISTADS, presently working in the
project ‘Knowledge creation and innovation in emerging technologies’.
She is an M.Sc in Bioinformatics and is developing competency in data
arch contributions.
is a Senior Project Assistant at NISTADS
creation and innovation
” and a PhD Scholar at the Centre for Studies in
Science Policy, Jawaharlal Nehru University. She is especially interested
in risk and governance issues in emerging technologies and is