Embed Size (px)
Citation preview

HAL Id: hal-01451186https://hal.archives-ouvertes.fr/hal-01451186
Submitted on 31 Jan 2017
HAL is a multi-disciplinary open accessarchive for the deposit and dissemination of sci-entific research documents, whether they are pub-lished or not. The documents may come fromteaching and research institutions in France orabroad, or from public or private research centers.
L’archive ouverte pluridisciplinaire HAL, estdestinée au dépôt et à la diffusion de documentsscientifiques de niveau recherche, publiés ou non,émanant des établissements d’enseignement et derecherche français ou étrangers, des laboratoirespublics ou privés.
Nanoparticle formation and dusty plasma effects in DCsputtering discharge with graphite cathode
Armelle Michau, Cécile Arnas, Guillaume Lombardi, Xavier Bonnin, KhaledHassouni
To cite this version:Armelle Michau, Cécile Arnas, Guillaume Lombardi, Xavier Bonnin, Khaled Hassouni. Nanoparti-cle formation and dusty plasma effects in DC sputtering discharge with graphite cathode. PlasmaSources Science and Technology, IOP Publishing, 2016, 25, pp.15019 - 15019. �10.1088/0963-0252/25/1/015019�. �hal-01451186�

1
Nanoparticle formation and dusty plasma effects in DC sputtering
discharge with graphite cathode.
A. Michaua,1
, C. Arnasb, G. Lombardi
a, X. Bonnin
a*, K . Hassouni
a,1
aLSPM, CNRS, 99 Avenue J. B. Clément, 93430 Villetaneuse, France
bLaboratoire PIIM, CNRS, Aix-Marseille université, Centre Saint-Jérôme, 13397 Marseille, France
Abstract
We developed a model for the nucleation, growth and transport of carbon dust particles in a
DC discharge. The carbon source comes from the sputtering of a graphite cathode resulting in
the production of primary clusters and then of nanoparticles. We consider the ionic cluster
growth as well as the particle growth and charging and the influence of both on the discharge
equilibrium. We found that the discharge becomes electronegative for long duration when
particle density reaches 109
cm-3
and particle size 45 nm. The corresponding transition
modifies the electric field profile in the vicinity of the field reversal region in the negative
glow. We then analyze the space and time evolution of the different discharge characteristics
and the mechanisms involved in the discharge. We showed that particle density is governed
by nucleation, coagulation and transport, while particle size is mainly governed by the
deposition of the small neural clusters emitted at the cathode on the particle surface
Key-words : DC discharges, dusty plasma, cluster, model
*Present address : ITER Organization, Building 72/4005, POP, Science Division Route de Vinon-sur-Verdon -
13067 St Paul Lez Durance Cedex – France
1 corresponding author : [email protected], [email protected]
2
Introduction
Although, dust formation was experimentally observed in DC discharges in the early 90’s
[1],[2], there are very few studies, especially through modeling, of this phenomenon [3] which
was mainly considered for capacitively coupled parallel plate RF (CCPP-RF) discharges in
silane and, to a lesser extent, in acetylene [4]. In these discharges the molecular species
present in all the plasma volume give rise to a molecular growth and a subsequent solid
particle nucleation. These conditions are very different from those encountered when particle
formation results from cathode sputtering as experimentally observed in rare gas DC or DC-
magnetron discharges [1]. In these last cases, the growth precursors are generated at the
cathode and therefore sputtering kinetics is one of the key phenomena that govern particle
formation and growth. Further, the discharge structure and dynamic are different from the
CCPP-RF configuration. As a result, one may expect that the driving mechanisms for particle
formation and growth and the subsequent dusty plasma effect would be different from those
encountered in CCPP-RF dusty plasmas.
In this work, we are interested in the study of the mechanisms involved in particle formation
through sputtering of a graphite electrode in DC discharges. Our purpose is to understand how
carbon particles observed in this kind of discharges [5], [6]are produced, and to investigate
the changes in the discharge characteristics, density, electric field, etc., when particle
formation is significant enough to induce a dusty plasma effect.
A scenario of particle formation and growth was previously proposed [7], in which primary
carbon species C, and to a lesser extent, C2 and C3, are produced as a result of the sputtering
of the graphite cathode by argon ion and fast neutral species. These primary species undergo
molecular growth that result in the formation of larger clusters, which may end up with
nucleation of solid particles, if the discharge conditions are appropriate. The particle
population and charge evolve under the effect of aerosol dynamic phenomena, transport,
surface-growth and particle-coagulation.
Based on this scenario, we have previously developed a numerical model that enables us
investigating molecular growth and particle nucleation in DC sputtering discharges for
conditions where the density of clusters and carbonaceous particle is small enough so as the
discharge equilibrium is not affected by clustering [8, 9]. In these conditions we showed in
particular, the key-role of the field reversal that occurs in the negative glow of the discharge
[7]. This effect induces a trapping of the negative clusters, the residence time of which
becomes long enough to allow for efficient molecular growth.
A question that naturally arises is whether this very weak field reversal still plays a key-role
when dusty plasma effect, i.e., coupling between discharge, particles and clusters dynamics,
becomes significant and should be taken into account.
As a matter of a fact, experimental measurements showed that carbon particles are obtained at
a density value as high as 108 cm
-3 [10]. Taking into account the typical electron density in
this discharge, i.e., between 108 and 10
10 cm
-3depending on the discharge region, and the large
charge number that could be carried-out by submicron particles, the contribution of solid
particles to the discharge equilibrium and therefore the dusty plasma effect should be
significant.
In this paper, we specifically address this question and examine clustering, nucleation and
particle growth while taking into account a dusty plasma effect that would result from the
coupling between molecular growth kinetics and solid particle dynamics on one hand, and the
discharge equilibrium on the other hand. We propose to investigate how this coupling affects
the growth kinetics and the discharge characteristics. Especially, one may expect that the
presence of heavy negative particles at a significant density would affect the space charge
field and the trapping efficiency.

3
For this purpose, we substantially improved the model that was previously developed to
investigate the molecular growth of carbon clusters and the onset of particle formation [8, 9]
in order to achieve a self-consistent description of clustering, aerosol dynamic and discharge
equilibrium.
The paper includes five sections. In section 2, we briefly describe the experimental system
considered in this work. The details of the model used to describe the dusty plasma are
discussed in section 3. The results are presented and discussed in section 4. The main
conclusions that arise from this work are summarized in section 5.
I. Investigated Discharges
We consider argon DC glow discharges, generated between two parallel electrodes of 10cm
diameter [6]. The cathode is in polycrystalline graphite and the grounded anode, in stainless
steel. The distance between the electrodes is 14 cm. The argon pressure is set to 60 Pa and the
discharge current is set to a constant value of 80 mA. In such conditions, the discharge voltage
is a free parameter and the cathode takes spontaneously a bias value of ~ -550 V. As a
consequence, the cathode is sputtered by ions and by fast argon atoms that are produced
through charge exchange in the cathode sheath.
A detailed experimental study was performed on the discharge described above [5], which
clearly indicates that the sputtering of the graphite cathode results indeed in the injection of
carbon species, probably carbon atoms and, to a lesser extent, small C2 and C3 molecules, in
the discharge. Langmuir probe measurements at 300 s showed that the electron density is
approximately 1010
cm-3
in the negative glow (NG). The dust particles collected on the anode
showed an average diameter of ~ 40 nm, while the average dust density was estimated to be
around 2.108 cm
-3 [10]. A simple estimation from the Orbital Motion Limited (OML) theory
shows that these dust particles are negatively charged and can carry up to 10 elementary
charges. The total density of the charge carried out by the solid particles and the negatively
charged clusters may exceed, at least in some discharge regions, the charge density
corresponding to electrons. As a result, a transition to an electronegative discharge is
expected, which would result in a significant change in the electric structure of the discharge.
The confinement and charging process of dust particles would be modified due to the strong
coupling between aerosol dynamic and discharge equilibrium. In the next section, we present
the dusty plasma effects in the discharge of interest by taking into account the coupling
between the discharge equilibrium, the growth of negative clusters and the aerosol dynamics
in a self-consistent way. The model develop in this aim is discussed in the next section.
II. A dusty DC discharge model
II.1. Phenomenological description
The model used in this work is based with a large number of improvements on the one
described in [7]. In particular, the present model takes into account the coupling between
molecular growth and dust particle aerosol dynamic on one hand, and the discharge
equilibrium on the other hand. As a result, this model enables us describing properly the dusty
plasma effect, while our previous model [7] only describes molecular growth and particle
formation assuming pristine argon discharge conditions.
In this model, although it is not mandatory, we assume a short discharge, i.e., no positive
column. We distinguish three regions in the discharge vessel: the cathode sheath (CS), the

4
negative glow (NG) and the Faraday dark space (FDS). The cathode sheath region is mainly
considered because it provides the fast secondary electrons that maintain the discharge in the
negative glow. The molecular growth of carbon clusters is assumed to take place in the NG
and FDS through a collisional model that involves both neutral and negative clusters.
Nucleation and growth of solid carbonaceous particles are also assumed to take place in the
NG and the FDS. The model takes into account the field reversal effect in the NG which
induces the trapping of the negatively charged species and solid particles.
As a result, two main modules have been developed. The first one combines a semi-analytical
model and a Monte Carlo simulation to determine the sheath characteristics and the non local
ionization source terms in the NG and the FDS. The second module describes the coupled
phenomena of (i) transport of the discharge species, i.e. argon-ion, charged and neutral carbon
clusters, (ii) molecular growth of carbon clusters, and (iii) nucleation, growth and transport of
solid carbon particles (dust) in the FDS and the NG. This module combines several sub-
modules that allow determining: the electric field structure in the NG and the FDS, the cluster
densities, the nucleation rate and the solid particle population density, charge and size.
In the next section we describe the models used in these different sub-modules.
II.2. Sheath, non local ionization and electron population models.
The sheath characteristics are determined from the well known classical sheath model
described for example in [11]. For a given background gas pressure and plasma density in the
NG, the sheath thickness and the secondary emission coefficient are determined from the
current balance equation and Poisson’s equation assuming a matrix-sheath. Then, once the
sheath characteristics, i.e., essentially the thickness and secondary emission coefficient, are
known, a Monte Carlo simulation of electron kinetics in the gap region, i.e., sheath, NG and
FDS in the case of short discharges, is performed. These simulations yield the rate of non
local ionization needed to express charged species balance in the NG region.
Electron kinetics in this quite well known DC discharge is surprisingly complex [12].
Basically, three electron groups may be distinguished in the discharge: (i) the fast electrons,
with energy above the ionisation threshold, that are produced in the sheath and induce the non
local ionization in the NG and are no more present in the FDS, (ii)the intermediate energy
electrons that results from fast electrons that loose their energy and end up with energy below
the first excitation threshold, (iii) the cold electron that are produced through the ionization
processes that take place in the NG and that show very low energy, much below the first
ionization threshold.
The fast and intermediate electrons show very weak populations and insure ionization
processes and current continuity, respectively. The population of cold electron that are present
in much larger number insure the space charge and one may therefore neglect the population
of fast and intermediate electrons in determining the E-field in the NG and FDS.
II.3. Collisional processes and transport phenomena in the dusty NG and FDS
II.3.a. Molecular growth and transport of Carbon clusters
As mentioned above, some aspects of this model was discussed in [7]. Therefore, we restrict
ourselves here to the description of the key assumptions and the main peculiarities of the
model, and especially the characteristics that are related to the dusty plasma effect.
The model assumes that cluster formation is due to the sputtering of the graphite cathode by
energetic argon ions, which produces carbon as C, C2 and C3 [13]. These clusters are created
at the carbon cathode and are subsequently transported inside the sheath, the NG and the FDS

5
where they experience collisions with electrons, positive argon ions (charge transfer) and
other clusters (molecular growth). These collisions result in ionization,
attachment/detachment processes, charge transfer and molecular growth. As a result, a
complex plasma containing a cluster population with a large size distribution is formed.
Positively charged carbon species created by neutral clusters ionisation or charge transfer with
positive argon ion have extremely short a residence time of approximately 10-6
s, in the region
located between the cathode and the field reversal position. This time is much shorter than the
characteristic time of molecular growth and sticking on the surface of negatively charged
particles. These were estimated to be of the order of 1 s and 10-2
s, respectively. The positive
species created in this region are therefore lost at the graphite cathode before contributing to
molecular growth and particle growth through surface deposition. In the region located
beyond the field reversal location, the carbon cluster ionization is fairly slow with a
characteristic time of approximatively 10 s. Therefore the contribution of positively charged
clusters to molecular growth and sticking to particles is limited by the ionization kinetics. This
has to be compared to the characteristic time of particle growth through neutral cluster
deposition which is approximately 10-4
s, indicating that particle growth through sticking is
dominated by neutral clusters in this region.
The above analysis shows that the contribution of positive ions to the molecular growth and
aerosol dynamic is negligible in the whole investigated discharge system. These species were
therefore not considered in our model.
On the opposite, collisions with electron produce negative clusters that can be trapped in the
positive potential of the discharge. Although both singly and doubly charged negative carbon
clusters can be formed, doubly charged negative clusters usually show population much
smaller than singly charged negative clusters and are not taken into account [7].
Consequently, we only consider neutral and single charge negative clusters. Further, the
model takes into account the existence of different conformation, i.e., linear, cyclic, bicyclic,
etc., for each cluster size [14]. We describe the formation of large clusters from the C, C2 and
C3 species emitted from the cathode through a collisional scheme that involves:
Molecular aggregation for neutral and charged clusters
Cx+CnCn+x (R1)
Cx+Cn-Cn+x
- (R2)
Charge transfer
Cn-+Cm Cn + Cm
- (R3)
Electron Attachment/Detachment
Cn+ e- Cn
- (R4)
e-+CnCn +2e
- (R5)
where x=1-3, n>1, m>1
As may be noticed, we did not use a reversible molecular growth model. We indeed assume
that large clusters cannot undergo fragmentation to produce more stable smaller clusters.
Nevertheless, the molecular model we are using does take into account the existence of magic
numbers in the cluster size distribution and therefore predict much higher abundance for
clusters corresponding to these magic numbers (such as fullerenes).
The estimation of the rate constants for the processes (R1-R5) is thoroughly discussed in [7].
To take into account the existence of magic numbers in the size distribution, the rate constants
include a correction that depends on the formation enthalpy and the subsequent relative
thermodynamic stability of the different clusters. Of course more accurate description of

6
cluster size distribution would require taking into account fragmentation (reversibility).
However this would make the molecular growth model far more complex.
The molecular growth mechanism described by processes (R1-R5) is assumed to take place
up to a maximum size that defines the largest molecular edifice (LME). Aggregation
processes involving this LME are assumed to lead to the nucleation of a solid particle.
In the present study, we choose a LME of 30-atom carbon clusters which leads, taking into
account the existence of a negative and a neutral clusters and several isomers for each size, to
a cluster system of 126 species.
Once solid particles are formed, carbon cluster may also undergo heterogeneous chemistry on
the surface of the particles. We assume in the present model that this heterogeneous chemistry
essentially consists of sticking reactions that results in a depletion of cluster population and is
therefore described using a phenomenological sticking coefficient.
As far as transport effects in the NG and FDS regions are concerned, the neutral species are
transported by diffusion while the charged species are transported by drift and diffusion in the
very weak electric field.
We are mainly interested in the trapping mechanism that confine negative clusters and dust
particle in the axial direction between the sheath and the FDS. Consequently, only axial
distribution of species densities and electric field between the sheath edge and the anode
surface are of interest in the present study. Therefore, we make use of a radially averaged 1D
model where the species losses at the reactor wall are described through a macroscopic source
term. As a result, the time evolution for the density of a cluster of size ‘i’ with a charge ‘z’ is
governed by the continuity equation:
with i=1,30 z= -1,0
(1)
Equation (1) expresses the balance between the time evolution of the cluster density and the
rates of change due to the drift-diffusion transport (first term in the right hand side) and to the
source terms related to molecular growth processes (second term in the RHS), heterogeneous
sticking on solid particles (third term in the RH) and on the reactor wall (last term).
niz, Di, µi, Wi
z represent the density, diffusion coefficient, mobility and net production rate
through gas phase processes of cluster ‘i’ of charge z respectively.
Drift and diffusion are assumed to take place in argon that remains the major species.
Diffusion coefficients are determined using a Lenard-Jones potential, while mobility
coefficients are obtained from Einstein relation.
The net production rate Wiz
takes into account the processes R1-R5, the rate constants of
which are thoroughly discussed in [9] and references therein.
and represent the loss rate of cluster i through heterogeneous processes at the surface
of carbon particles and at the reactor wall. Note that since we do not consider positively
charged clusters and multiply charged negative clusters, the value of z may be either 0 or -1 in
the present model. E is the electric field.
The solution of the continuity equations (1) requires specifying boundary conditions at the
cathode and anode surface. The boundary conditions for the small C, C2 and C3 are derived
from the sputtering rate of the graphite cathode assuming that C, C2 and C3 represents 70%,
20% and 10% of the sputtered carbon. We assumed that all the other neutral cluster sticks to
the cathode surface with a sticking coefficient of 1. As for the negative clusters, we assume a
zero density at the cathode surface since they experience the repulsion of the potential.
At the anode surface, the boundary conditions express the balance between drift-diffusion
fluxes and surface reactions, i.e., sticking at the surface.
-1,0z 1,30i avec)..(
r
i
p
i
z
ii
z
ii
z
i PPWEznDt
n
p
iP r
iP

7
II.3.b. Nucleation, growth, charging and transport of solid
particles
As mentioned previously, aggregation processes involving this LME are assumed to lead to
the nucleation of a solid particle that may undergo an aerosol dynamic with transport
phenomena and growth processes through surface sticking of clusters or particle coagulation
processes. Fragmentation processes are not taken into account.
In principle, describing the growth and charging of solid particles requires considering
detailed size and charge distributions of the solid particle population [15]. Coupling such a
detailed aerosol dynamic to the detailed model of molecular growth and to the discharge
equilibrium model would however result in too much complexity and can make the problem
intractable. Therefore, we made the choice in this work to simplify the description of the
aerosol dynamic, while keeping a detailed description of the molecular growth, i.e., the
nucleation step, and the coupling between cluster kinetics, solid particle growth and discharge
equilibrium.
As a result the particle population is described through three physical parameters: the particle
density, the particle volume mean diameter and the particle averaged charge.
The particle density is governed by the following transport equation that expresses the balance
between the rates of change in particle number density due to transport fluxes, particle
nucleation and coagulation process :
(2)
where is the particle flux density determined through a drift-diffusion expression as in the
case of carbon clusters. Wnuc accounts for particle production through nucleation processes
and represents therefore the nucleation rate, i.e., the total rate of cluster aggregation processes
that lead to more than 30 carbons (30 carbons is the size assumed for the LME). Wcoag
accounts for the reduction of the particle number density due to aggregation processes that
merge two particles in a single one. The source terms are thoroughly discussed in [7]. Note
that the image potential enhancement of coagulation rate suggested in reference by Ravi and
Girshick is not taken into account in this study [16].
The particle volume mean diameter is estimated from the average mass of particles assuming
a material density of 1 g.cm-3
[17]. The average particle mass is determined using the
following particle mass conservation equation that expresses the balance between the rates of
change in particle mass density due to transport fluxes, nucleation and deposition of gas phase
species on the surface of solid particulates :
(3)
mnuc is the mass of the nucleus and mi the mass of the cluster i. The source terms, i.e. last two
terms of the right hand side, that appear in this equation account for particle mass gain
through nucleation and sticking of carbon clusters on the existing particles.
coagnucp
pWWF
t
n
pF
ncluster
i
i
cluster
i
stnucnucpp
ppmWmWFm
t
mn
1
....

8
The discharge conditions encountered in the NG and the FDS are such that the particle charge
may significantly deviate from the steady state charge obtained when assuming that charging
process is only due to electron and positively charged ion fluxes. This deviation is due to the
contribution of nucleation of singly charged particles and sticking of charged clusters to the
particles in the average charge governing equation (3). Note also, that the electron
temperature for the dominant cold electrons is very low, i.e., 0.1 eV [18]. Consequently, the
charging of particles, especially those with diameter below 10 nm, is characterized by a fairly
long characteristic time. A 4 nm particle needs 0.3 s in order to reach its equilibrium charge of
-0.8 elementary charge whereas a 10 nm particle will reach -2 elementary charge in a few ms
(cf. figure 1).
As a result, we have to consider the dynamic evolution of the average charge of solid particles
through the following charge conservation equation that expresses the balance between the
rates of change of particle charge due to transport effects, absorption of electron (slow and
fast), positive ion and negative clusters, as well as nucleation through charged cluster.
(4)
Where qnuc is the charge of the nucleus, qicluster the charge of the cluster i, S the particle
averaged surface and Ikj the courant density expressed using OML theory. In this equation we
distinguish charging due to fast [19], intermediate [19], and cold electrons
[20]. Of course charging due to ions is also taken into account .
Equation (4) allows estimating the average charge of the particles. This is not sufficient since
describing particle growth through coagulation and surface sticking of clusters requires in
principle the knowledge of the detailed charge and size distributions of the particles. As a
matter of fact, the major driver for particle coagulation in dusty plasma is charge fluctuation
effect that results in the presence of neutral or positively charged particles, especially for
small size particles [21]. Assuming the same average negative charge for all particles would
prevent any coagulation. Similarly, particle charge fluctuation enhances surface sticking of
negatively charged clusters. It is therefore necessary to take into account the charge
fluctuation effect. For this purpose we make use of the approach proposed by Matsoukas et al.
[22] who derive an analytic expression for charge distribution as a function of the average size
and charge of the particles and of the plasmas parameters, Te and ne. Note however, that the
validity of the analytic expression given in [22] is questionable for small size particles.
Nevertheless, we estimate the fraction of particle that may be neutral or positively charged as
a result of charge fluctuation over all the considered size domain. The charge distribution of 5
nm particles with averaged charge of -1 and -5 obtained for Te=0.1 eV are given in figure 2.
In practice, beside the very dominant negatively charged particles only neutral and singly
charged positive particles contribute significantly to coagulation and surface growth processes
[23].
The boundary conditions for the particle density continuity equation are similar to those used
for the cluster density continuity equation. The boundary conditions for mass and charge
density conservation equations are derived on the basis of consistent density, mass and charge
fluxes at the anode and cathode surface. This is discussed in detail in Reference [7].
i
cluster
ncluster
i
i
stnucnucp
h
eiepp
ppqWqWnSIIIFq
t
qn...).(.
.
1
fast
eI int
eI cold
eI
iI

9
II.4. Cold electron transport, and dusty plasma effect in the NG and FSD,
The dusty plasma effect is basically described through the transport of the cold electron
population. As mentioned previously the model developed here considers that the discharge
current is carried out by the intermediate energy electrons. This results in approximately zero
current carried out by the other charged species. In other words, the present model assumes
that the net electrical current carried out by the positive ions, the negative clusters, the
negative particles and the dominant cold electron is zero. This is equivalent to assuming that
the transport of cold electrons, positive argon-ions and negative clusters and particles is
ambipolar.
Consequently, the plasma can be assumed to be locally neutral in the NG and the FDS and the
constraint of zero electrical current for the cold electrons and ions enables determining the
electric field in these regions. We recall that the discharge current is carried by the
intermediate electrons.
Therefore to describe the discharge equilibrium one has to consider a transport equation for
slow electrons (or argon-ion), the density of argon-ion (or slow electron) being determined
form a local electrical neutrality constraint.
Here we use the following transport equation for cold electrons that expresses the balance
between drift-diffusion flux, non local ionisation rate (in the NG), attachment processes,
absorption on dust particles and losses at the reactor wall:
(5)
where De, µe are the electron diffusion and mobility coefficients, Si the ionization source term
obtained from a Monte-carlo simulation of the fast electron population combined with an
analytical sheath model [18] (this term is disregarded in the FDS), Pedust and P
eattach are the
electron losses on the particles and clusters and Perad is the electron loss on the wall which is
controlled by ambipolar diffusion. The ambipolar diffusion coefficient is a function of the
neutral carbon species density, n- [24].
The structure of the electric field in the NG and FDS regions, and therefore the field reversal
effect if it takes place, are determined by expressing that the electrical current carried out by
the cold electron, the positive ion and the negative clusters and particles is zero:
(6)
where Z- represent charge number and D+, µ+and n+ represent the positive Argon ion diffusion
coefficient, mobility coefficient and density.
It is worthy to mention hear that the approach used here is similar, at least in its spirit, to that
proposed by Boeuf and Pitchford [25]. The main difference comes from the fact that we take
into account the radial losses of charged species on the lateral wall of the reactor. This
approach is quite different from the one that is proposed by Kolobov and Tsendin [18] and
that we used in our previous work on the early discharge phase where the plasma is still
electropositive and the clusters and particles do not contribute to the discharge equilibrium. In
this approach, the E-field is derived assuming that the cold electrons satisfy the Boltzmann
equilibrium. Note that for both these approaches cold electron temperature is one of the key-
parameter of the model that is very difficult to estimate. As discussed by Kolobov and
e
e
rad
e
attach
e
dustieeeee
n
nPPPxSEnnD
t
n)(
nZnn
nDZnDnDE
ee
ee
2

10
Tsendin, measurement tends to indicate that the temperature of these electrons would be of
few tenths of eV [26]. The authors investigated the effect of these parameters on particle
formation and showed that the particle formation can only take place in a narrow window of
cold electron temperature that is consistent with the value reported in [18]and that would be
approximately 0.1 eV [7].
Basically, equation (5) and (6),along with the conservation equations for cluster densities (1),
and solid particle, number (2), mass (3) and charge (4) lead to a self consistent description of
the E-field and charged species densities distributions in the NG and the FDS, which makes it
possible to describe the dusty plasma effect in these regions.
II.5. Solution method
The model discussed in the previous sections end up with a description of the time-space
variations of cluster density, dust particle density, dust particle average mass, dust particle
average charge, and electron density through a set of 130 non linear partial differential
equations that are strongly coupled and subject to a non linear differential constraint that yield
the electric field.
The simulation domain is located between the sheath edge and the anode considering only a
short discharge. This means that the sheath region is disregarded when investigating the dusty
plasma effect. This should not affect the results since negative cluster and particles are
produced outside the sheath, in the NG and the FDS. As for the boundary conditions, we
assume zero density for cold electron and negative clusters and particles at the sheath edge.
The boundary conditions at the anode for negative clusters and solid particles express the
balance between the rates of transport flux and sticking processes. For cold electrons, we
assume a zero density at the end of cathode sheath and zero gradient condition at the anode,
this means that the cold electron flux are absorbed at the anode, their flux being essentially a
drift flux.
As for the numerical approach, we used a central difference approximation for diffusion-
dominated fluxes and an upwind approximation for (drift) convection-dominated flux. This
formulation transforms the partial differential equation system into a large system of coupled
non-linear ordinary differential equations that are solved by time integration using the
Backward Difference Formula (BDF) method.
However a full implicit treatment of such a coupled system of equations is quite difficult due
to an ill-conditioned jacobian matrix that results at least partly from the strong coupling
between the transport fluxes of carbonaceous species and the density of cold electrons which
determine the ambipolar electric field dynamics. Therefore, since the characteristic time for
the density variation of clusters, of the order of few seconds (c15 ~ 10 s), is much greater than
the cold electron plasma frequency e~10-5
s, we used an explicit treatment for the estimation
of the carbonaceous transport fluxes as function of the electric field. The flux at a time t+dt is
estimated as a function of the field at t using:
(7)
The change in cold electron density shows a much shorter characteristic time and an implicit
formulation was used. An under-relaxation is introduced to enable a system of differential
equation with a diagonally dominant Jacobian matrix.
(8)
where = 0,1.
tdtt
ii
dtt
i
dtt
iiidtt EnznDF
kkk
e
k
eeek EEnznDF
1111 )1(

11
III. Results
III.1. Simulation conditions
In the simulations described in paper, the cold electron temperature is set to 0.1 eV.
The carbon cluster populations are followed until they reach 30 carbons with different
isomer configuration. We consider that these carbon clusters are in thermal equilibrium
at 300 K. We assume that the sticking coefficient of the neutral clusters on particle
surface is 1. Finally 126 continuity equations are considered.
III.2. Dynamic of the discharge at the field reversal position
Figure 3 shows the axial profiles of the electron density and the axial electric field between
the cathode, x=0 cm, and the anode, x=14 cm. The electron density, Figure 3.a, reaches a
maximum of 1011
cm-3
in the negative glow, at a distance of 2.25 cm from the cathode. The E-
field profile, Figure 3.b, shows a reversal at a 2.3 cm in the negative glow. Since the discharge
is short, i.e., no positive column, the field remains positive in the whole region between the
reversal position and the anode. The field remains almost constant, at a value around 5x10⁻²
V.cm-1
, in a large fraction of this region. Then, it decreases in the vicinity of the anode. Note
that the field reversal is weaker by more than 8 orders of magnitudes than the field in the
cathode fall, i.e., 5x10³ V.cm
-3.
Figure 4a shows the time evolution of the negatively charged C4-, C15
- et C30
- clusters at the
position of the field reversal, i.e., E=0. The density of the clusters increases very sharply
during the first 150-200 s of the discharge. The maximum density of the C4- is around 10
9 cm
-
3, while the density of C30
- that is responsible for solid particle nucleation remains below
107 cm
-3. The time-variations of the neutral cluster densities are shown Figure 4b. The
densities of neutral clusters with more than four carbon-atoms, are much smaller than the
corresponding negative cluster densities. The neutral clusters are indeed rapidly lost by
diffusion to the wall, while the negative clusters are trapped in the field reversal. The only
neutral species that show large densities are C, C2 and C3 that are sputtered from the cathode
(cf. figure 5). Actually, aggregation processes between the high density small neutral clusters
that are emitted at the cathode result in the formation of C4-C6 neutral clusters, a fraction of
which undergoes attachment processes that result in the production of C4-, C5
- and C6
-
negative clusters. These small negative clusters are trapped in the field reversal region where
they undergo a molecular growth process that end up with the nucleation of solid particles.
This molecular growth route is schematized in figure 6.
Figure 7 shows the time-variation of the solid particle density (figure 7a), diameter (figure 7b)
and charge (figure 7c) at the field reversal position, i.e., E=0 position. The particle density
increases during the 150-200 s, reaches a value of 2x109 cm
-3, slightly decreases for time-
periods between 300 and 500 sec and then remains almost constant for longer durations. The
particle diameter shows a different behaviour since it increases steadily, reaching 30 nm at
200 s and 60 nm at 600 s. The particle charge number increases steadily up to 6 negative
charges for a particle diameter of 60 nm (The net charge, which is the opposite of the charge
number decreases).
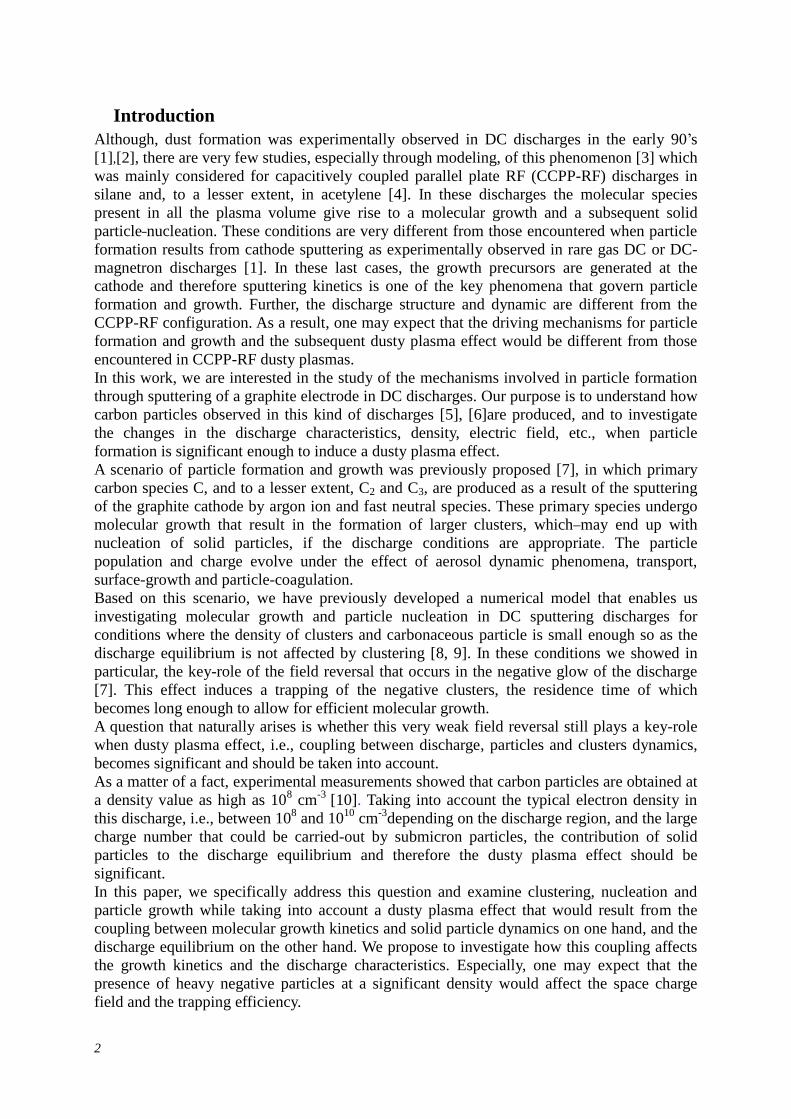
To understand the time-variation of particle density and average diameter, we report in figure
8 the contributions of the different phenomena involved in the particle formation and growth.
Figure 8a shows that the nucleation rate, the number of solid particles produced per unit time
and volume, remains greater than the number of solid particles consumed by coagulation. The
ratio of the nucleation to the coagulation rates is around 100 for short time-period, i.e., when
the particles start to form, and decreases significantly at longer time period to less than a
factor 10 when the particle density becomes significant, i.e. around 109 cm
-3. It appears

12
therefore that the nucleation rate always exceeds the coagulation rate during the whole
discharge duration. This means that there is a continuous net production of particles at the
field reversal position. Nevertheless, particle density at this position reaches a maximum of
3x109 cm
-3 at a time-value of 300 s and slightly changes above this value. The limitation in
the particle density despite a positive net production of particles is due to transport effects and
changes in the topology of the electric field in the vicinity of the field reversal position.
Indeed and as will be discussed in the next section, the particles that are produced at the field
reversal position are transported by drift-diffusion in the surrounding region. The change in
the field topology and the resulting transport processes even results in a slight decrease of the
particle density at the field reversal position for time-periods between 300 s and 500 s despite
the positive net production rate. Figure 8b shows a comparison between the contributions to
particle growth, i.e., the increase of the mean diameter, due to the sticking of carbon clusters
on one hand, and to the particle coagulation on the other hand. These contributions are
expressed in terms of the number of carbon atoms gained by each solid carbon-particle per
unit time. Basically, the particle growth is mainly insured by the sticking of carbon cluster.
The number of carbon atoms gained by each particle through this process remains at least
two-orders of magnitude higher than the one corresponding to the coagulation process. Figure
8c shows the contribution of the different clusters to the particle growth through molecular
deposition at the surface. It appears clearly that the small clusters emitted at the cathode bring
the major contribution to particle growth and therefore to the observed increase of the particle
diameter. This result may be well understood when considering that the major part of the large
clusters, i.e., Cn>3, are negatively charged. Their sticking to the negatively charged particle is
therefore strongly inhibited by the electrostatic repulsive forces. Note that the 2 orders of
magnitude decrease in the nucleation rate over the time-periods ranging between 200 and 600
s is consistent with the one order of magnitude decreases of the C, C2 and C3 densities on one
hand and of the C4- density on the other hand. The rate of molecular growth that determine the
nucleation kinetics is indeed at least partly determined by the second order aggregation
processes between the negative clusters, like C4-, and the dominant small neutral clusters
emitted at the cathode.
Figure 9a represents the time variation of the electron density at the field reversal position.
This density remains almost constant during the first 150 s, it decreases exponentially by more
than one order of magnitude for time-periods ranging between 150 and 300 s, and at a much
slower rate for longer time-periods. The values obtained for the electron density at the field
reversal position and for time period of 500-600 s are in quite good agreement with those
measured by Dominique et al. [27] who found a value of approximately 1010
cm-3
at 2.5 cm
from the cathode.
The decrease of the electron density is accompanied by a strong increase of the negative
clusters and charged particle densities. The total electrical charge carried by negative clusters
and charged particles exceeds the electrical charge carried by electrons as shown in figure 9b
that depicts the discharge electronegativity factor . The discharge becomes therefore
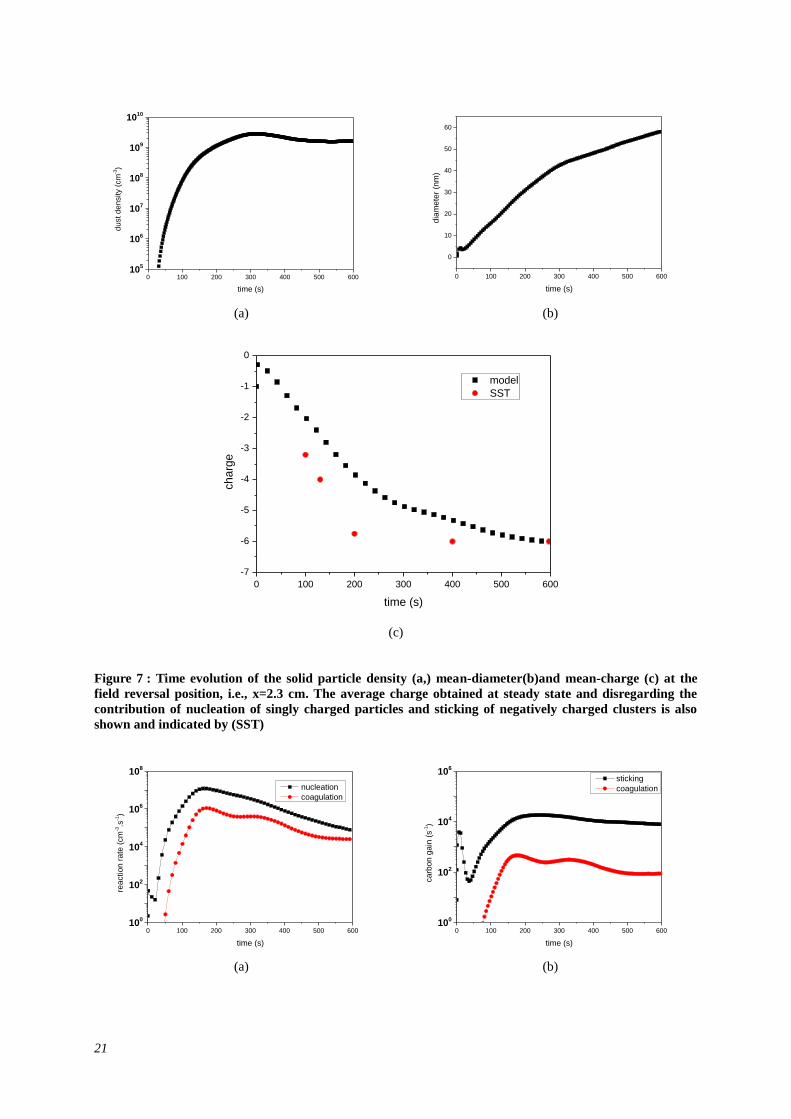
electronegative at the field reversal position. The analysis of the loss terms, depicted in figure
10, shows that the electron depletion is mainly due to the losses at the reactor wall during the
first 100 seconds of the discharge and to the dust particle charging for longer discharge
duration. It is also interesting to notice that the charging of the dust particles becomes rapidly
the major electron loss process despite the very small value of the cold electron temperature,
i.e., Te = 0.1 eV, that results in very limited electron attachment charging rates as compared to
what is usually obtained in capacitively coupled RF discharges, for Te~2 eV.

13
III.3. Space distributions of the charged species densities, self consistent E-field and dust cloud densities, average charge and mean diameter.
So far, we mainly discussed the time-evolution of the discharge parameters at the field
reversal position. Cluster and particle formation and the resulting time-evolution of the
discharge parameters significantly depend on the considered discharge region. We therefore
discuss in the second part of this section the evolution of the axial distribution of the different
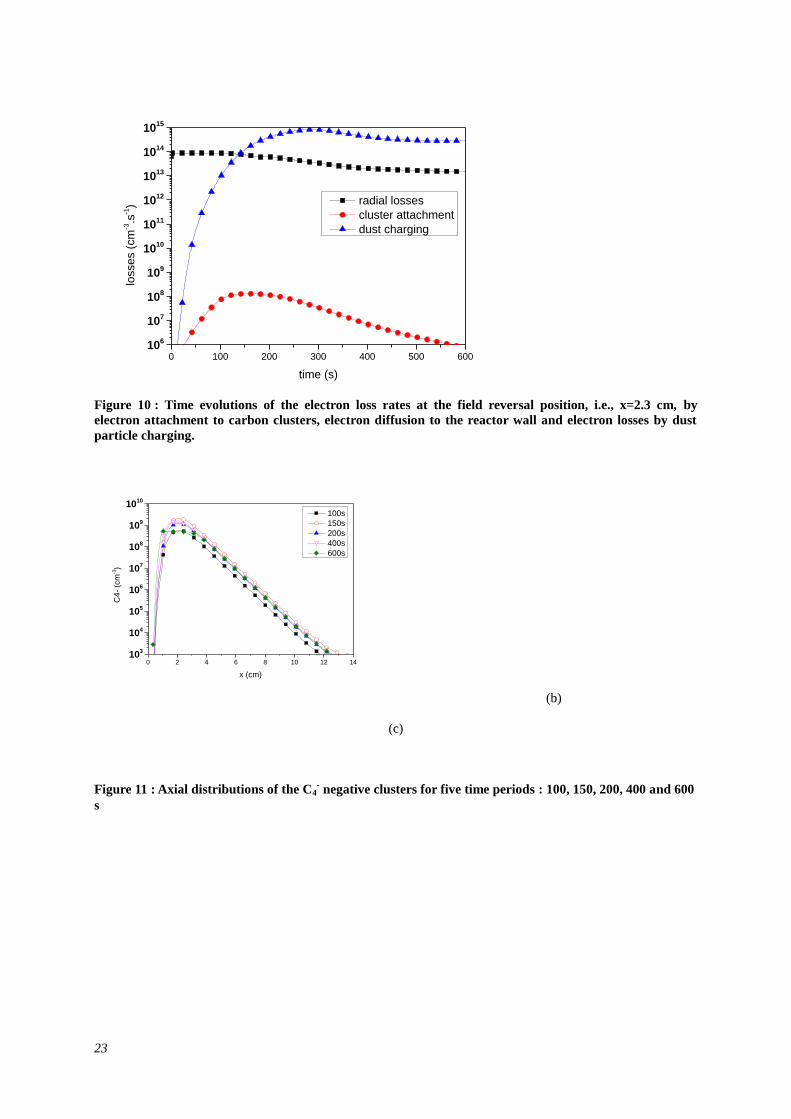
discharge parameters. Figure 11 shows the axial profile of C4- density for time periods of 100,
150, 200, 400 and 600 s. The cluster density is significant, i.e., density-values greater than 1%
of the maximum value, in a region located between 1 and 6 cm distance from the cathode.
Although the maximum value decreases significantly for time period above 150-200 s, the
region with large density value tends to extend significantly, and the maximum density-value
is reached over a 2-3 cm plateau with a constant density. The axial profiles of larger cluster
densities show similar relative variations, although the absolute values are one and two orders
of magnitude smaller for C15- and C30
-, respectively. Also, axial profiles with a plateau region
are obtained earlier for larger clusters. They are observed at a time period of 400 s for C30- and
600 s for C4-.. Similar behaviour are obtained for the electron density, since, as shown in Fig.
12, the large decrease of the maximum electron density, i.e., more than one order of
magnitude, is accompanied with the formation of a large plateau region where the electron
density reaches its maximum value. The transition from an electropositive to an
electronegative discharge is accompanied with a strong decrease of the ionization degree. This
decrease in the total ionization degree may be well understood when considering that electron
and positive ion production through the non local ionization is very weakly affected by the
formation of carbon clusters and particles and remains therefore almost constant meanwhile
electron and positive ion losses strongly increase with the appearance of solid particles (cf.
figure 10).
The dust density profiles calculated for 100, 150, 200, 400 and 600 s are shown in figure 13.
Basically, during the early time period, the dust cloud shows a density profile with a
pronounced maximum. This maximum is reached at the field reversal position at the early
stage of the discharge (200 s) and tends to move toward the sheath for larger time periods
(400 s). The maximum particle density shows only a slight decrease for time-periods between
400 and 600 s, where the major change observed is the spreading of the dust cloud and the
formation of a plateau region where the maximum density is reached (see the dust density
distribution at 600 s). Basically, the evolution of the dust cloud formed in the investigated
discharge is characterized by a first phase where the cloud shows a significant non-uniformity
in terms of density, and a second phase where the dust cloud tends to spread out with a large
region of maximum concentration (a plateau shape) that remains almost constant and around
1-2x109 cm
-3.This is somewhat larger than the estimate derived experimentally by laser
extinction [10] who suggested a value of 2x108 cm
-3 for a time-period of 600s. This difference
may be due to the absence of any detailed representation of the particle size distribution and
the subsequent approximate treatment of the coagulation kinetics. The model describes the
particle clouds only in terms of averaged quantities, i.e., number density, diameter and charge,
and is therefore quite simple as far as aerosol dynamics is concerned. Nevertheless, the model
prediction and the experimental estimation of the particle number density remain of the same
order of magnitude which can be considered as satisfactory.
Dust particles are therefore trapped in a region located between the sheath edge and the bulk
of the discharge, namely the negative glow of the DC discharge. This is similar to what was

14
already observed in several experiments on similar or different discharge systems [28].
However, the position and width of the dust cloud highly depend on the space-distribution of
the E-field shown in figure 14. As a matter of fact, a constant electric field region, consistent
with the plateau observed in the charged species density profiles, is also observed for large
time periods, i.e., above 400 s (figure 14). The formation of this constant E-field region is
accompanied with a decrease of the electric field magnitude (in absolute value) around the
initial field reversal position. This evolution ends up with an almost zero E-field magnitude
over a wide region between the initial field reversal position and the sheath. Compared with
an electropositive discharge, the field structure in the dusty electronegative discharge does not
show a precise field reversal position, we rather obtain a negative E-field in the region of the
negative glow that is close to the sheath, a wide almost zero E-field region in the bulk of the
negative glow and a positive E-field in the negative glow and the Faraday dark space. This
zero-field quasi-equipotential region corresponds to space occupied by the dust cloud. Outside
the dust cloud in the NG and FDS regions the electric field is almost not affected by the
presence of the particles and its magnitude remains nearly equal to the one obtained in the
pristine argon discharge.
Figure 15 shows the space distribution of the particle mean-diameter (15. a) and average
charge (15.b). Of course, the particle mean diameter increases with time and the maximum
mean-diameter values varies from 30 nm at 200 s to 50 nm at 400s and 75 nm at 600 s. This
increase is in good agreement with experimental measurements of Dominique et al [5],
showing that mean sizes of ~ 35 nm and ~ 45 nm are reached at 180 s and 420 s, respectively.
Note however that mean sizes determined experimentally are number mean diameter and may
therefore differ from the calculated volume mean diameter. Basically, a volume mean
diameter is larger than the corresponding number-mean diameter. This would indicate that the
calculated sizes are slightly smaller than the measured one.
Nevertheless, this result can be considered as a very satisfactory since the model used does
not describe the details of the particle size distributions an only considers average quantities
to characterize the particle cloud. The present model can be therefore used to investigate, at
least qualitatively and more probably semi-quantitatively in terms of variations and trends, the
major effects that govern the dusty plasmas obtained in DC sputtering discharges.
The space distribution of the dust mean-diameter becomes strongly non uniform for larger
time-periods. As a matter of fact, while the space distribution for short discharge periods, i.e.,
t=200 s, shows a maximum value at the field reversal position, in the bulk of the dust cloud,
and almost symmetric behaviour with smaller diameter around the field reversal position, the
distribution at large time periods tends to becomes much less symmetric with a maximum
diameter reached at the edge of the dust cloud facing the cathode sheath and a strong decrease
of the mean diameter with the distance from the cathode. In other words, the largest dust
particles tend to accumulate at the edge of the cloud facing the cathode sheath while the
particles inside the cloud are smaller. This result may be well understood by comparing the
different source terms involved in the particle growth kinetics. As a matter of fact, particle
growth takes place through surface sticking of the small clusters sputtered from the cathode.
These clusters interact first with the particles located in the cloud region facing the cathode.
Their density significantly decreases inside the dust cloud as shown in figure 16 in the case of
C-atom. Therefore, dust particle growth through carbon cluster sticking is much less effective
for larger distance from the cathode. As a result, while the axial distributions of the C, C2 and
C3 cluster densities exhibit a simple exponential behaviour at short time periods, i.e., t<200 s,
they evolve to bimodal distributions for larger time periods, i.e., t=400 and 600 s (cf. figure 16
for the case of C-atom density). This bimodal distributions show a first exponential part with
a strong variation, i.e., more than one order of magnitude over 2 cm distance. This happens in
a region located between the cathode and the left side of the dust cloud where the particles

15
have the largest mean-diameter and induce an enhanced loss of the small neutral carbon
clusters through heterogeneous surface reaction (0<x<2.5 cm). In this first region, the
variation rate of the carbon cluster density with the distance from the cathode strongly
increases with the time period. It is therefore consistent with the trends of the variation of the
maximum value of the particle mean diameter obtained at the cathode faced side of the
particle cloud with the time-period. The second part of the distributions corresponds to
distances above 3 cm from the cathode, and shows much slower and similar values for the
variation rates of the carbon cluster density as function of the distance over the whole time-
domain explored in this work (cf. Figure 16 for the case of C-atom density).
Further understanding of the interplay between the different phenomena that govern the
particle production and growth kinetics may be gained by comparing the source terms
involved in the particle number and mass density equations. For this purpose, we reported the
axial profiles of the coagulation and nucleation rates for different time-periods in figure 17.
This shows that the maximum nucleation rate decreases by one order of magnitude between
200 and 600 s (figure 17.a). The position of the maximum is however shifted toward the
sheath at the edge of the dust cloud. The decrease of the nucleation rate with time inside the
cloud is much more pronounced since the rate varies by two orders of magnitude between 200
and 600 s. This means that although the nucleation still takes place at the edge of the dust
cloud facing the sheath, it is clearly quenched in the bulk of the cloud and in the whole region
located between the cloud and the anode. Figure 17.b shows the axial profiles of the
coagulation rate for the same time periods. The coagulation rate strongly decreases in the
region where largest mean-diameters are obtained, i.e., the cathode-faced side of the dust
cloud facing the sheath. The decrease of the coagulation in the bulk and in the right side of the
dust cloud remains however quite moderate, i.e., less than one order of magnitude, and the
coagulation rate almost compensates the nucleation rate in the bulk of the cloud, i.e., x=2-2.5
cm, and exceeds it in the right side of the cloud, i.e., x=2.5-4 cm for long time periods.
In figure 18 we reported the axial profiles of the carbon gain per particle and per second
corresponding to the coagulation processes (Figure 18. a) and to the surface deposition
processes (figure 18 b). We can see that the rate of a particle growth due to the deposition of
carbon clusters on its surface exceeds by 1-4 orders of magnitude depending on the
considered position. The evolution of the particle mean diameter is then clearly largely
dominated by surface sticking of carbon clusters.
The analysis above enables to draw a simple picture for the aerosol dynamics that characterize
the dusty plasma obtained in sputtering DC discharge. The particle number density is mainly
governed by the balance between (i) nucleation processes, the only particle production
process, at the edge of the dust cloud facing the sheath potential barrier, where the small
carbon clusters emitted at the cathode still shows high density-values to initiate molecular
growth, (ii) coagulation processes, the only particle number reduction process, in the bulk and
in the anode-faced side of the cloud where particle mean diameter and average charge are
small enough to make the formation of neutral or positively charged particles through charge
fluctuation significant enough thus enhancing coagulation and (iii) transport phenomena that
insure the transfer of a fraction of the particles that are produced in the nucleation region to
the coagulation region (without affecting the global number of particles), thus leading to
almost constant solid particle density in the major fraction of the dust cloud. The particle size
is mainly governed by the deposition of small neutral carbon clusters on particle surface. The
coagulation processes, as modelled in this work, do not affect particle size significantly, while
they play a key-role in affecting the particle number density in the bulk of the cloud and in the
cloud region facing the anode.
The axial distributions of the average charge of the dust particles obtained for different time
periods (cf. Figure 15.b) show behaviours that are similar to those of the mean diameter

16
distributions. Basically, for long time-periods, particles with the largest charge (in absolute
value), i.e., around 7-8 charge units, corresponds to those with the largest diameter and are
therefore located at the edge of the dust cloud facing the cathode sheath. Consistently, the
smaller particles located inside the dust cloud and farther from the cathode sheath shows
smaller charges (in absolute value), i.e., 2-4 charge unit. Also interesting is the comparison of
the calculated average-charge and the charge value that would be obtained using OML theory.
These are also reported figure 15b (open symbols). There is a significant deviation of the
calculated non-equilibrium average charge from the equilibrium OML charge. For the short
time periods, i.e., t=200 s, the deviation from the OML theory is around 1 charge unit at the
edge of the dust cloud and 2 charge units in the bulk of the charge cloud, which corresponds
to around 50% deviation for both cases. For very long time periods, i.e., t=400-600 s, the
deviation from OML is mainly significant at the cloud edge facing the cathode sheath where
the difference with respect to OML theory is of almost 2 charge units, which represents 25%-
30% relative deviation. It appears therefore very important to take into account the deviation
of the average charge from the OML theory.
IV Conclusion
We developed a self-consistent model of particle formation and growth in DC discharge.
Discharge equilibrium, molecular transport and growth, and particle nucleation transport and
growth are described self-consistently. The model makes use of a detailed description of the
nucleation kinetics that results from the molecular growth of carbon clusters, while the
aerosol dynamics was described in a simpler and approximate fashion by expressing balance
equations on averaged quantities, i. e., number density, average mass and average charge.
The model results in a mathematical description in terms of a large partial differential
continuity equations system subject to an algebraic constraint that yields the ambipolar
electric field. This system was solved using a high order implicit approach, which makes it
possible to simulate the non-stationary evolution of the dusty plasma over large discharge
durations despite the very high stiffness of the system.
The simulations showed that the particle formation takes place and a dusty plasma effect is
obtained due to the reversal of the axial electric field that enables trapping negatively charged
carbon clusters which makes it possible to induce a molecular growth and a nucleation
process. Negative particle formation takes place due to attachment processes on the C4, C5
and C6 clusters obtained through coagulation of the small neutral clusters emitted at the
cathode. They also showed that the field topology is strongly affected by the presence of the
dust cloud. Instead of a single field reversal position that characterizes electropositive
discharges, the dusty plasmas showed a large zero-field region corresponding to the dust
cloud. The trapping effect remains however effective and particle formation is still possible.
The formation of a dusty plasma is accompanied with the transition from an electropositive to
an electronegative discharge with an electronegativity factor of 2. The cold electron density is
mainly depleted due to the charging of solid particles, attachment processes on carbon clusters
being quite negligible in the electron balance. We showed that the dust cloud obtained at a
long time-period is characterized by an almost constant particle density. The space
distribution of the particle size is however much more non uniform, the largest particle being
located at the edge of the dust cloud facing the cathode sheath. We explain this result by
analyzing the different effect involved in the aerosol dynamics. We showed that the particle
density is governed by nucleation at the edge of the dust cloud facing the sheath, coagulation
in the bulk and in the anode-faced side of the cloud, and transport inside the cloud, while

17
particle size is mainly governed by the deposition of the small neural clusters emitted at the
cathode on the particle surface. Comparison of the results predicted by the model discussed
here and estimates determined experimentally show that the present model gives a very good
prediction of the electron density in the NG and the particle mean diameter. However, the
model predictions overestimate the particle number density estimated experimentally although
the calculated and experimental values of this parameter remain in a fairly good qualitative
agreement. In any case the fairly good qualitative agreement obtained between the model
results discussed in this paper and the experimental estimates of reference [27] tends to
support the whole picture inferred from the analysis of the model results as far as the interplay
between the different phenomena governing the investigated dusty plasmas, i.e., molecular
growth, aerosol dynamics, transport, discharge equilibrium, is concerned.
Of course, this model that deals with the description of quite complex plasmas can be
substantially improved. In particular, an improved description of the aerosol dynamics by
taking into account a detailed description of the particle size distribution is needed. This
would enable a more accurate description of the coagulation kinetics and its impact on the
behaviour of the whole dusty plasma. Such improvement would hopefully yield a better
agreement with experiments as far as particle number density is concerned, which would
make the model much more predictive. Also, the approach used here in the case of graphite
cathode and carbon (nano)-particles formation can be used for many other dusty plasmas
generated in sputtering discharges provided basic data for sputtering yields and molecular
growth kinetics are known.
Acknowledgements
This work is supported in part by contract ANR-09-BLAN-0070-01 of the French National
Research Agency, and undertaken under the auspices of the French Research Federation on
Controlled Magnetic Fusion (FRFCM).
Figures and figure caption
1 10
0
2
4
6
8
10
12
14
16
18
abso
lute
ele
men
tary
cha
rge
elementary charge
charging time
diameter (nm)
10-5
10-3
10-1
101
103
ch
arg
ing
tim
e (
s)

18
Figure 1 : Absolute elementary charge and charging time derived from the OML theory as functions of the
particle diameter for Te=0.1 eV, ni=ne=1010
cm-3
,Tg=300 K,
Figure 2 : charge distribution for a 5 nm particle and an average charge of -5 and -1 for Te=0.1 eV,
ne=ni=1010
cm-3
, Ti=Tg= 300 K
s
(a)
(b)
Figure 3: Axial distribution of the cold electron density (a) and the electric field (b) in the gap region for
the pristine argon discharge. The cathode is located at 0 cm while the anode is at 14 cm. These profiles
represent the initial distribution, the distribution at t= 0 sec, for the dusty plasma model. Since the
discharge is a short discharge, there is no positive column and the field remains positive beyond the field
reversal position, i.e., x=2.3 cm.
-10 -9 -8 -7 -6 -5 -4 -3 -2 -1 0 1 2
0.0
0.1
0.2
0.3
0.4
norm
aliz
ed d
istr
ibution
charge
qp = -5
qp = -1
0 2 4 6 8 10 12 1410
9
1010
1011
ne (
cm
-3)
x (cm)
2 4 6 8 10 12 14-0.10
-0.08
-0.06
-0.04
-0.02
0.00
0.02
0.04
0.06
0.08
0.10
E (
V/c
m)
x (cm)
electrostatic Forces

19
(a)
(b)
Figure 4 : Time evolutions of the C4
-, C15
- and C30
- negative cluster densities (a) and C4, C15 and C30
neutral cluster densities (b) at the field reversal position, i.e., x=2.3 cm.
0 100 200 300 400 500 60010
5
106
107
108
109
density (
cm
-3)
time (s)
C4-
C15-
C30-
0 100 200 300 400 500 60010
0
101
102
103
104
density (
cm
-3)
time (s)
C4
C15
C30

20
Figure 5 : Time evolutions of the C, C2 and C3 neutral cluster densities at the field reversal position, i.e.,
x=2.3 cm.
Figure 6 : Schematic of the cluster growth route that take place in graphite cathode argon DC discharge
and result in the formation of solid particles.
0 100 200 300 400 500 60010
8
109
1010
1011
density (
cm
-3)
time (s)
C1
C2
C3
C C2
C3
Ar+ + Ar
NucleationMolecular growth
1 30
Carbon
4-5-6
e-
- -
attachment
3
Sputtering
Charge exchange
-
-
--
-
--
-
-
--
-
-
--
-
C4- C5
- C6-
21
(a) (b)
(c)
Figure 7 : Time evolution of the solid particle density (a,) mean-diameter(b)and mean-charge (c) at the
field reversal position, i.e., x=2.3 cm. The average charge obtained at steady state and disregarding the
contribution of nucleation of singly charged particles and sticking of negatively charged clusters is also
shown and indicated by (SST)
(a) (b)
0 100 200 300 400 500 60010
5
106
107
108
109
1010
dust
de
nsity (
cm
-3)
time (s)
0 100 200 300 400 500 600
0
10
20
30
40
50
60
dia
mete
r (n
m)
time (s)
0 100 200 300 400 500 600
-7
-6
-5
-4
-3
-2
-1
0
model
SST
charg
e
time (s)
0 100 200 300 400 500 60010
0
102
104
106
108
rea
ction r
ate
(cm
-3.s
-1)
time (s)
nucleation
coagulation
0 100 200 300 400 500 60010
0
102
104
106
carb
on g
ain
(s
-1)
time (s)
sticking
coagulation

22
(c)
Figure 8 : Contribution of the different mechanisms involved in the particle aerosol dynamics (a) time
variations of the solid particle nucleation and coagulation rate at the field reversal position, i.e., x=2.3 cm,
(b) the number of carbon gained per solid particle and unit time through sticking of carbon cluster at the
particle surface and coagulation between solid particle and (c) contributions of the different clusters to the
growth of solid particle.
(a) (b)
Figure 9 : Time evolutions of the electron density (a) and electronegativity factor (b) at the field reversal
position, i.e., x=2.3 cm
0 5 10 15 20 25 3010
0
102
104
106
108
1010
1012
1014
stickin
g r
ate
(cm
-3.s
-1)
cluster
neutral
negative
0 100 200 300 400 500 600
1010
1011
ne (
cm
-3)
time (s)
0 100 200 300 400 500 600
0.0
0.2
0.4
0.6
0.8
1.0
1.2
1.4
1.6
time (s)
23
Figure 10 : Time evolutions of the electron loss rates at the field reversal position, i.e., x=2.3 cm, by
electron attachment to carbon clusters, electron diffusion to the reactor wall and electron losses by dust
particle charging.
(b)
(c)
Figure 11 : Axial distributions of the C4- negative clusters for five time periods : 100, 150, 200, 400 and 600
s
0 100 200 300 400 500 60010
6
107
108
109
1010
1011
1012
1013
1014
1015
losse
s (
cm
-3.s
-1)
time (s)
radial losses
cluster attachment
dust charging
0 2 4 6 8 10 12 1410
3
104
105
106
107
108
109
1010
C4
- (c
m-3)
x (cm)
100s
150s
200s
400s
600s

24
(b)
Figure 12 : Axial distributions of the electron density for five time periods : 100, 150, 200, 400 and 600 s
along the discharge
Figure 13 : Axial distributions of the dust particle density for five time periods : 100, 150, 200, 400 and
600 s along the discharge.
0 2 4 6 8 10 12 1410
8
109
1010
1011
ne (
cm
-3)
x (cm)
0s
200s
400s
600s
0 2 4 6 8 10 12 1410
2
104
106
108
1010
density (
cm
-3)
x (cm)
100 s
200s
400s
600s

25
Figure 14: electric field at 0, 200, 400 and 600 s along the discharge.
(a) (b)
Figure 15 : Axial distributions of the mean diameter (a) and average charge (b) of the dust particle for five
time periods : 100, 150, 200, 400 and 600 s. The charge value obtained from OML theory are also shown
(open symbols)
0 2 4 6 8 10 12 14
-0.10
-0.08
-0.06
-0.04
-0.02
0.00
0.02
0.04
0.06
0.08
0.10
E
(V
/cm
)
x (cm)
0s
200s
400s
600s
zero field region
0 2 4 6 8 10 12 14
10
20
30
40
50
60
70
80
dia
mete
r (n
m)
x (cm)
200s
400s
600s
0 1 2 3 4 5 10
-10
-8
-6
-4
-2
0
ch
arg
e
x (cm)
200s
400s
600s
equilibrium 200s
equilibrium 400s
equilibrium 600s

26
Figure 16: Density axial distributions for the neutral carbon clusters emitted at the cathode: C
(a)
0 2 4 6 8 10 12 1410
6
108
1010
C (
cm
-3)
x (cm)
200s
400s
600s
0 2 4 6 8 10 12 1410
0
102
104
106
108
nucle
ation r
ate
(cm
-3.s
-1)
x (cm)
200s
400s
600s

27
(b)
Figure 17: Axial distributions of the rate of change in dust density through nucleation (a) and coagulation
(b)
(a)
0 2 4 6 8 10 12 1410
0
102
104
106
108
coagula
tion r
ate
(cm
-3.s
-1)
x (cm)
200s
400s
600s
0 2 4 6 8 10 12 1410
0
102
104
106
Carb
on g
ain
bycoagula
tion (
s-1)
x (cm)
200 s
400s
600s

28
(b) Figure 18: Axial distributions of the number of carbon gained per dust particle by coagulation (a) and
through surface deposition of carbon clusters (b) .
0 2 4 6 8 10 12 1410
0
102
104
106
Carb
on g
ain
by s
tickin
g (
s-1)
x (cm)
200 s
400 s
600s

29
References
[1] G. M. Jellum and D. B. Graves, "Particulates in aluminum sputtering discharges," Journal of Applied
Physics, vol. 67, pp. 6490-6496, 1990.
[2] S. J. Choi, M. J. McCaughey, T. J. Sommerer, and M. J. Kushner, "Perturbation of the cathode fall in
direct-current glow discharges by particulate contamination," Applied Physics Letters, vol. 59, pp.
3102-3104, 1991.
[3] J. P. Boeuf, "Characteristics of a dusty nonthermal plasma from a particle-in-cell Monte Carlo
simulation," Physical Review A, vol. 46, p. 7910, 1992.
[4] K. De Bleecker, A. Bogaerts, and W. Goedheer, "Detailed modeling of hydrocarbon nanoparticle
nucleation in acetylene discharges," Physical Review E, vol. 73, p. 026405, 2006.
[5] C. Dominique and C. Arnas, "Cathode sputtering and the resulting formation of carbon nanometer-size
dust," Journal of Applied Physics, vol. 101, pp. 123304-8, 2007.
[6] C. Arnas, A. Michau, G. Lombardi, L. Couedel, and K. K. Kumar, "Effects of the growth and the charge
of carbon nanoparticles on direct current discharges," Physics of Plasmas, vol. 20, Jan 2013.
[7] A. Michau, G. Lombardi, L. Colina Delacqua, M. Redolfi, C. Arnas, P. Jestin, X. Bonnin, and K.
Hassouni, "Field Reversal and Particle Growth in DC Discharge," Plasma Chemistry and Plasma
Processing, pp. 1-20, 2012.
[8] A. Michau, G. Lombardi, C. Arnas, L. Colina Delacqua, M. Redolfi, X. Bonnin, and K. Hassouni,
"Modelling of dust grain formation in a low-temperature plasma reactor used for simulating parasitic
discharges expected under tokamak divertor domes," Plasma Sources Science and Technology, vol. 19,
p. 034023, 2010.
[9] A. Michau, G. Lombardi, L. Colina Delacqua, R. M., A. C., B. X., and H. K., "Modeling carbonaceous
particle formation in an argon graphite cathode dc discharge," Plasma Physics and Controlled Fusion,
vol. 52, p. 124014, 2010.
[10] A. Zeinert, C. Arnas, C. Dominique, and A. Mouberi, "Optical properties of carbonaceous nanoparticles
produced in sputtering discharges," Journal of Vacuum Science & Technology A, vol. 26, pp. 1450-
1454, 2008.
[11] Y. P. Raizer, Gas Discharge Physics: Springer, 1991.
[12] L. D. Tsendin, "Electron kinetics in non-uniform glow discharge plasmas," Plasma Sources Science and
Technology, vol. 4, pp. 200-211, 1995.
[13] E. Oyarzabal, R. P. Doerner, M. Shimada, and G. R. Tynan, "Carbon atom and cluster sputtering under
low-energy noble gas plasma bombardment," Journal of Applied Physics, vol. 104, pp. 043305-12,
2008.
[14] V. A. Schweigert, A. L. Alexandrov, Y. N. Morokov, and V. M. Bedanov, "MINDO/3 study of the
interaction of small carbon clusters," Chemical Physics Letters, vol. 238, pp. 110-115, 1995.
[15] P. Agarwal and S. L. Girshick, "Sectional modeling of nanoparticle size and charge distributions in
dusty plasmas," Plasma Sources Science and Technology, vol. 21, p. 055023, 2012.
[16] L. Ravi and S. L. Girshick, "Coagulation of nanoparticles in a plasma," Physical Review E, vol. 79, p.
026408, 2009.
[17] K. Hassouni, F. Mohasseb, F. Bénédic, G. Lombardi, and A. Gicquel, "Formation of soot particles in
Ar/H2/CH4 microwave discharges during nanocrystalline diamond deposition: A modeling approach,"
Pure and applied chemistry, vol. 78, pp. 1127-1146, 2006.
[18] V. I. Kolobov and L. D. Tsendin, "Analytic model of the cathode region of a short glow discharge in
light gases," Physical Review A, vol. 46, p. 7837, 1992.
[19] B. Walch, M. Horányi, and S. Robertson, "Charging of Dust Grains in Plasma with Energetic
Electrons," Physical Review Letters, vol. 75, p. 838, 1995.
[20] J. E. Allen, "Probe theory - the orbital motion approach," Physica Scripta, vol. 45, p. 497, 1992.
[21] B. M. Annaratone and et al., "Agglomeration of mesoscopic particles in plasma," New Journal of
Physics, vol. 11, p. 103013, 2009.
[22] T. Matsoukas and M. Russell, "Particle charging in low-pressure plasmas," Journal of Applied Physics,
vol. 77, pp. 4285-4292, 1995.
[23] M. Olevanov, Y. Mankelevich, and T. Rakhimova, "Coagulation rate of dust grains in a low-temperature
plasma," Technical Physics, vol. 48, pp. 1270-1279, 2003.
[24] M. A. Lieberman and A. J. Lichtenberg, Principles of plasma discharges and materials processing. New
York: John Wiley & Sons, 1994.

30
[25] J. P. Boeuf and L. C. Pitchford, "Field reversal in the negative glow of a DC glow discharge," Journal
of Physics D: Applied Physics, vol. 28, pp. 2083-2088, 1995.
[26] E. A. DenHartog, T. R. O Brian, and J. E. Lawler, "Electron temperature and density diagnostics in a
helium glow discharge," Physical review letters, vol. 62, pp. 1500-1503, 1989.
[27] C. Dominique, "Etude d'une décharge à pulvérisation cathodique pour la production de poussières
carbonées et étude de la croissance des nanoparticules produites," Université de Provence, 2006.
[28] Bouchoule, Dusty plasmas: physics, chemistry & technological impacts in plasma processing John
Wiley and Sons Ltd, 1999.