Embed Size (px)
Citation preview
PHYSICAL REVIEW E SEPTEMBER 2000VOLUME 62, NUMBER 3
Laser-excited Mach cones in a dusty plasma crystal
A. Melzer,* S. Nunomura,† D. Samsonov,‡ Z. W. Ma, and J. Goree§
Department of Physics and Astronomy, The University of Iowa, Iowa City, Iowa 52242~Received 31 March 2000!
Experimental studies of the formation and structure of Mach cones in a plasma crystal are presented. Plasmacrystals are ordered structures of charged microspheres trapped in the sheath of an rf discharge plasma. Usinga monolayer crystal with a hexagonal lattice, Mach cones were excited by the radiation pressure of a focusedlaser beam. The beam was swept at a supersonic speed through the crystal, in a controlled and repeatablemanner. A multiple Mach cone structure was observed, with at least three distinct Mach cones. The Machangle relation was verified over a wide range of Mach numbers, for both the first and second cones. The soundspeed, measured from the first Mach angle, was found to increase with the particle number density. Twomethods of determining the particle charge and screening distance are developed, making use of the soundspeed and an assumption of a Yukawa interparticle potential. Molecular-dynamics simulations of the experi-ment were carried out, using a monolayer of particles interacting through a Yukawa potential, and these showclose agreement with the experiment.
PACS number~s!: 52.25.Zb, 47.40.2x
sioeneyonfo
ina
areisc
cleusesttieptyry
at
ntat
r as
n,y alion
owisentoe
icle
hel-
s.it iss. In.
es,
are
herennnddustre-to
beorces ofhedthem.it,ma
e
I. INTRODUCTION
A dusty plasma is an ionized gas containing a suspenof small particles of solid matter. These particles are in geral micron-sized, and they are often called ‘‘dust.’’ Thacquire a large electric charge by collecting free electrand ions from the plasma. Dusty plasmas occur naturally,example in interstellar space and Saturn’s rings@1#. In thelaboratory, dusty plasmas are made either by introducmanufactured particles into a plasma, or by growing the pticles in the gas phase by nucleation and aggregation.
In the laboratory it is possible to trap micron-sized pticles in a stable equilibrium provided by electrostatic forcand gravity. An additional force acting on the particlesdamping on the ambient neutral gas. This damping reduthe particles’ random kinetic energy below the interpartipotential energy. Under these circumstances, the dplasma is said to be ‘‘strongly coupled,’’ and the particlarrange themselves in an ordered pattern, or Coulomb la@2–6#. This lattice can be in a gas, liquid, or solid phasdepending on the particle size and discharge operatingrameters@7,8#. To describe these strongly coupled dusplasmas, various authors have used the terms ‘‘plasma ctals,’’ ‘‘colloidal plasmas,’’ and ‘‘complex plasmas,’’ wherethe latter two terms are analogies to the condensed mfields of colloidal suspensions and complex fluids.
When the plasma is generated by a high voltage ohorizontal electrode, the lattice generally forms in horizonlayers in the sheath above the electrode. Depending on
*Permanent address: Institut fu¨r Experimentelle und AngewandtPhysik, Christian-Albrechts-Universita¨t Kiel, 24098 Kiel, Germany.Email address:
†Email address:‡Present address: Max-Planck-Institut fu¨r Extraterrestrische
Physik, Giessenbachstrasse, 85740 Garching, Germany.§Email address:
PRE 621063-651X/2000/62~3!/4162~15!/$15.00
n-
sr
gr-
-s
es
ty
ce,a-
s-
ter
alhe
apparatus and particle size, there can be a single layer omany as several tens of layers.
Experiments have shown that in the horizontal directiothe force between two particles is modeled accurately bYukawa potential@9#. The interparticle force in the verticadirection is more complicated due to the presence of anfocus downstream of particles exposed to an ion fl@10,11#. This complication is avoided when the experimentoperated with a single horizontal layer. Such an experimis two-dimensional~2D! and is well suited for comparison tmolecular-dynamics~MD! simulations parametrized by thchargeQ, Debye lengthlD , and interparticle spacinga. It iscommon to describe the shielding length and the partspacing by the dimensionless quantityk[a/lD . The par-ticle spacing is determined partly by the geometry of texternal confining potential, which is provided by the bowshaped curvature of the sheath that levitates the particle
The lattice sustains compressional waves, and whenin a solid phase it also sustains transverse shear waveseismology these are termed theP andSwaves, respectivelyIn dusty plasmas, the compressional wave is sometimcalled the dust lattice wave~DLW!. For long wavelengthsi.e., small values of the wave numberq, the dispersion rela-tions of both the compressional and transverse waveacoustic,v}q, if the interparticle potential is Yukawa.
There are several ways these waves can be excited;we will make use of the laser-excitation method of Homaet al. @12,13#. They launched compressional waves in 1D a2D plasma crystals using a laser beam focused on theparticles. In this method of wave excitation, photons areflected or absorbed by the particle, imparting a momentumthe particle in the direction of the laser beam. There mayadditional forces on the particles, such as a gas-phase fdue to heating the particle surface. In any case, regardlesthe mechanisms involved in the force, it has been establisempirically that a laser beam can apply a strong force toparticles and move them in the direction of the beaHomannet al. modulated the laser intensity by choppingcausing a compressional DLW to be excited in a plas
4162 ©2000 The American Physical Society
t
fntFiac
cedr.igi-trn’sag-
t thet it-entaredthat, itsthee
ics
uet is
es-
i.e.,ous-hhan
2Dl ef-
,
ees
onalen
tantial.
-
irrp
to
in
tatoa
ar
PRE 62 4163LASER-EXCITED MACH CONES IN A DUSTY PLASMA . . .
crystal. Here, we will adapt this laser excitation techniqueproduce Mach cones.
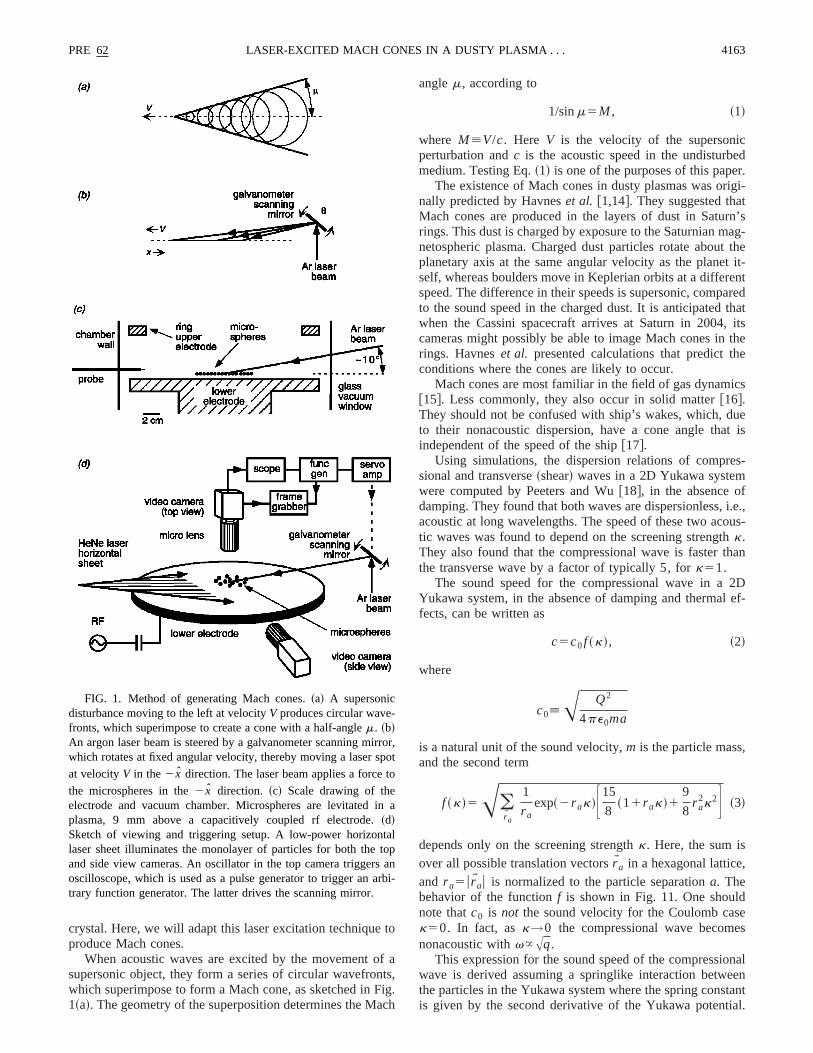
When acoustic waves are excited by the movement osupersonic object, they form a series of circular wavefrowhich superimpose to form a Mach cone, as sketched in1~a!. The geometry of the superposition determines the M
FIG. 1. Method of generating Mach cones.~a! A supersonicdisturbance moving to the left at velocityV produces circular wavefronts, which superimpose to create a cone with a half-anglem. ~b!An argon laser beam is steered by a galvanometer scanning mwhich rotates at fixed angular velocity, thereby moving a laser s
at velocityV in the2 x direction. The laser beam applies a force
the microspheres in the2 x direction. ~c! Scale drawing of theelectrode and vacuum chamber. Microspheres are levitatedplasma, 9 mm above a capacitively coupled rf electrode.~d!Sketch of viewing and triggering setup. A low-power horizonlaser sheet illuminates the monolayer of particles for both theand side view cameras. An oscillator in the top camera triggersoscilloscope, which is used as a pulse generator to trigger antrary function generator. The latter drives the scanning mirror.
o
as,g.h
anglem, according to
1/sinm5M , ~1!
where M[V/c. Here V is the velocity of the supersoniperturbation andc is the acoustic speed in the undisturbmedium. Testing Eq.~1! is one of the purposes of this pape
The existence of Mach cones in dusty plasmas was ornally predicted by Havneset al. @1,14#. They suggested thaMach cones are produced in the layers of dust in Saturings. This dust is charged by exposure to the Saturnian mnetospheric plasma. Charged dust particles rotate abouplanetary axis at the same angular velocity as the planeself, whereas boulders move in Keplerian orbits at a differspeed. The difference in their speeds is supersonic, compto the sound speed in the charged dust. It is anticipatedwhen the Cassini spacecraft arrives at Saturn in 2004cameras might possibly be able to image Mach cones inrings. Havneset al. presented calculations that predict thconditions where the cones are likely to occur.
Mach cones are most familiar in the field of gas dynam@15#. Less commonly, they also occur in solid matter@16#.They should not be confused with ship’s wakes, which, dto their nonacoustic dispersion, have a cone angle thaindependent of the speed of the ship@17#.
Using simulations, the dispersion relations of comprsional and transverse~shear! waves in a 2D Yukawa systemwere computed by Peeters and Wu@18#, in the absence ofdamping. They found that both waves are dispersionless,acoustic at long wavelengths. The speed of these two actic waves was found to depend on the screening strengtk.They also found that the compressional wave is faster tthe transverse wave by a factor of typically 5, fork51.
The sound speed for the compressional wave in aYukawa system, in the absence of damping and thermafects, can be written as
c5c0f ~k!, ~2!
where
c0[A Q2
4pe0ma
is a natural unit of the sound velocity,m is the particle massand the second term
f ~k!5A(rWa
1
r aexp~2r ak!F15
8~11r ak!1
9
8r a
2k2G ~3!
depends only on the screening strengthk. Here, the sum isover all possible translation vectorsrWa in a hexagonal lattice,and r a5urWau is normalized to the particle separationa. Thebehavior of the functionf is shown in Fig. 11. One shouldnote thatc0 is not the sound velocity for the Coulomb cask50. In fact, ask→0 the compressional wave becomnonacoustic withv}Aq.
This expression for the sound speed of the compressiwave is derived assuming a springlike interaction betwethe particles in the Yukawa system where the spring consis given by the second derivative of the Yukawa potent
or,ot
a
lpn
bi-
thl
a-yemfee
rg
erthc
n
nwonacn
iclao
pal-
eronsie
antelesinc
on
tic
llieba
honngicyo
apdto
elyo
an
cusidth
ser,ideo berors
theas
erByat
ross,idee
t rfri-
net-as
ed ahe
in-
re
-I.
er-
me
.0
4164 PRE 62MELZER, NUNOMURA, SAMSONOV, MA, AND GOREE
The coefficients 15/8 and 9/8, rather than 2 and 1 as inusual 1D treatment@19#, follow from the hexagonal crystastructure.
Samsonovet al. @20,21# detected Mach cones in a labortory dusty plasma using a crystalline hexagonal monolaof microspheres suspended in the sheath of an rf plasBeneath the monolayer, which was stable, there were aunstable particles that moved horizontally at a speed of seral cm/s. Because these unstable particles were chathey disturbed the main layer above them. Samsonovet al.imaged the particles in the monolayer using a video camand from the digitized images they produced maps ofparticle velocity. These maps showed V-shaped disturbanthat were identified as Mach cones. Samsonovet al. carriedout a test of Eq.~1!, and verified that it was obeyed, withithe error bars, for the range of supersonic velocitiesV thatwere observed. In the experiment they found not just oV-shaped cone, as in a gas, but two cones. The firstcompressive, with particles pushed in the forward directiand the second was rarefactive, with particles moving btoward their original positions. The existence of the secocone was attributed to the restoring force of the interpartbonds in a solid state. Molecular-dynamics simulations cried out with a Yukawa interparticle potential revealed nonly the second cone, but additional cones as well, asticles oscillated around their equilibrium lattice positions folowing the passage of the initial disturbance. The expmenters were unable to detect the presence of a third cpresumably because it was too weak to be detected utheir method. An analysis of the interparticle bonds showthat the particle motion was primarily elastic, rather thplastic, meaning that lattice defects were not generaSmoothing their particle image data, they produced profiof continuum parameters, such as particle number denwhich allowed them to analyze the Mach cone disturbausing methods familiar in shock physics.
In this paper, we report experiments similar to thoseSamsonovet al. @20,21#. Here, however, we used an argolaser beam, which we focused onto a spot on the latplane, in the manner of Homannet al. @12,13#. To excite aMach cone, we moved the laser spot across the crystalattice at a velocityV of several cm/s, which is faster than thacoustic speed of the compressional wave. We did thisbouncing the beam from a rotatable scanning mirror,shown in Fig. 1~b!. This method has the advantage that ttiming and velocity of the supersonic disturbance are ctrolled, allowing us to make measurements over a wide raof V and to repeat them many times. Each scan was identexcept for the initial particle positions within the lattice. Baveraging over 100 scans, we were able to reduce the nin our images.
We also carried out molecular dynamics~MD! simula-tions of the experiment. Using a Yukawa potential andplying a force like that of the moving laser spot, and incluing the effects of damping, we found results very similarthe experiment.
II. APPARATUS
The experiments were performed in a capacitivcoupled radio-frequency plasma. A cross-sectional view
e
ra.wv-ed,
a,ees
eas,kder-tr-
i-e,
ngd
d.s
ty,e
f
e
ne
ys
e-e
al,
ise
--
f
our experimental apparatus is shown in Fig. 1~c!. We usedthe same electrodes and vacuum chamber as Samsonovet al.@20,21#. The main difference, however, is that we usedargon-ion laser to excite the Mach cones.
The argon laser was focused with a telescope. At its foin the vacuum chamber, the beam had a Gaussian fullwat halfmaximum~FWHM! of 0.5 mm. In this paper we willreport the laser power measured at the output of the lawhich had a maximum of 1.6 W. In the sample region insthe vacuum chamber, the laser power was measured treduced by approximately 50% due to losses at the mirand windows.
The beam was incident on the plasma crystal abovelower electrode at a grazing angle of approximately 10°,shown Fig. 1~c!. This angle was varied by a galvanometlaser scanner, i.e., a mirror that is turned by a servo.ramping the servo voltage linearly, the mirror was rotateda constant angular velocity, so that the beam moved acthe electrode at a speedV that was constant, to within 5%over the camera’s field of view. The apparatus allows a wrange of V. We operated with an angular velocity in thrange from 0.3 to 1.5 s21, corresponding to 14<V<94 mm/s.
An argon plasma was generated by applying differenvoltages between 50 and 180 V at 13.56 MHz to the hozontal lower electrode through an impedance matchingwork. The input power ranged from 5 to 30 W. The gpressure was regulated at 10 mtorr~13 Pa! using a gas flowrate of 0.5 sccm. Operating at such a low pressure providlow level of damping of particles by the neutral gas. Tplasma parameters, measured with a Langmuir probeserted 16 mm above the lower electrode, wereTe'2 eVand ne5(125)3109 cm23. The dc self-bias on the loweelectrode was233 to2136 V. This bias helped provide thvertical dc electric field that levitated the particles. A summary of the different discharge conditions is given in Table
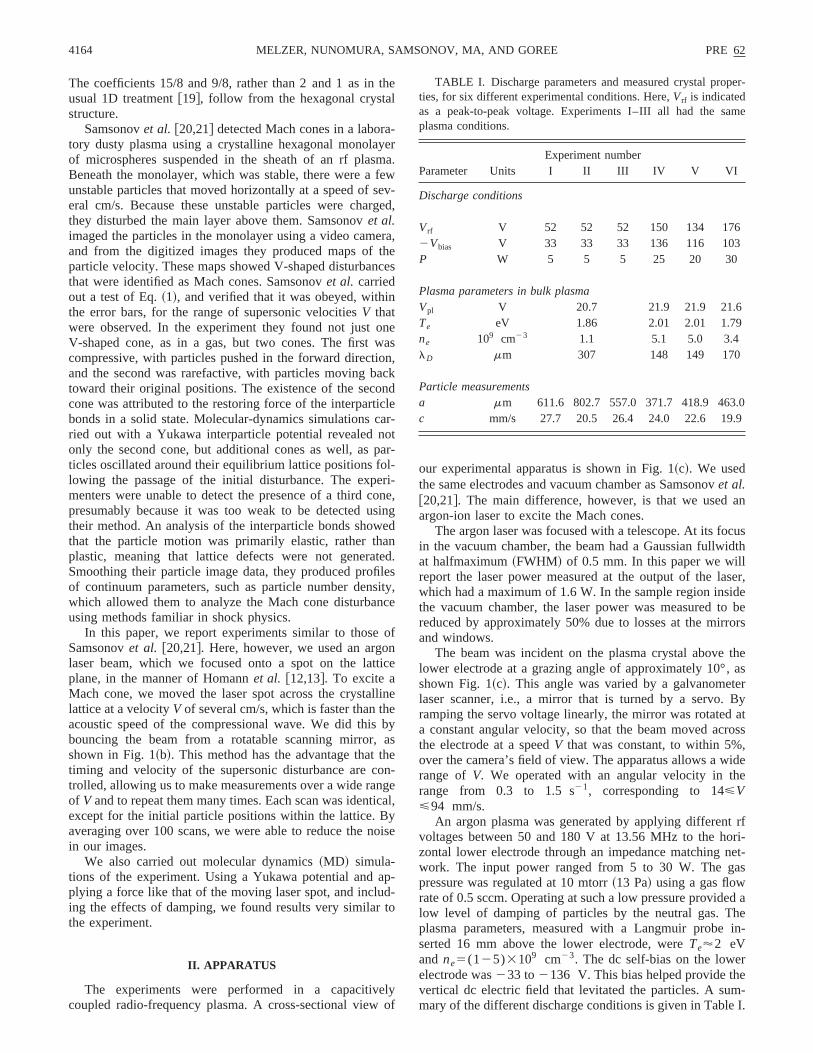
TABLE I. Discharge parameters and measured crystal propties, for six different experimental conditions. Here,Vrf is indicatedas a peak-to-peak voltage. Experiments I–III all had the saplasma conditions.
Experiment numberParameter Units I II III IV V VI
Discharge conditions
Vrf V 52 52 52 150 134 1762Vbias V 33 33 33 136 116 103P W 5 5 5 25 20 30
Plasma parameters in bulk plasmaVpl V 20.7 21.9 21.9 21.6Te eV 1.86 2.01 2.01 1.79ne 109 cm23 1.1 5.1 5.0 3.4lD mm 307 148 149 170
Particle measurementsa mm 611.6 802.7 557.0 371.7 418.9 463c mm/s 27.7 20.5 26.4 24.0 22.6 19.9

ismf
heinmhtenm
eke
n-toc
a
dhratim
nou
reHhur
inindngngr 1gito
s
veltts
noinels
te.u
ar
outhth
ofamef.
ra-thehelowrstnghedpar-ar-
le-air
onVeer.ofe-ble
o-
,a
thebyee ofs in
in
ical
thetos ofand
re to
PRE 62 4165LASER-EXCITED MACH CONES IN A DUSTY PLASMA . . .
A dusty plasma crystal was formed by shaking monodperse particles into the plasma. The particles were polyspheres of 6.560.3 mm in diameter, with a mass density o1514 kg/m3 corresponding to a particle mass ofm52.18310213 kg. After they were dispersed into the plasma, tparticles became negatively charged. They were trappedmonolayer crystal with a diameter of approximately 5 cParticles were levitated in the electrode sheath at a heigmm above the electrode. The particles arranged into a hagonal lattice, with an interparticle spacing that was nonuform over the whole dust cloud. Under the same plasconditions of experiment I, II, and III~see Table I!, the par-ticle spacing ranged from 557 to 802mm. The particleswere spaced more closely near the center of the cloud, duthe weight of the particles uphill on the sides of the bowl-liradial confining potential@22,23#.
The particles were imaged by illumination with a horizotal He-Ne laser sheet. They were viewed through thewindow by a video camera using a 632.8 nm interferenfilter. The field of view was 24318 mm, and it included700–3500 particles. The images were digitized witheight-bit gray scale and a 6403480 pixel resolution.
For each laser scan, two consecutive frames, separate33 ms, were recorded on a PC. The frames were syncnized to the motion of the laser beam so that the videoways captured the passage of the Mach cone at the sameand position. This was done using the triggering scheshown in the upper part of Fig. 1~d!. The video cameraserved as the master oscillator. The first vertical-line sigin the camera’s output waveform was used to trigger ancilloscope, which was not used to view the waveform, bmerely as a convenient generator of a single pulse. Theetition rate of the trigger pulse was reduced from the 30video rate to a much slower rate in the range 0.3–1 Hz. Tallowed the crystal sufficient time to anneal after the distbance created by the previous laser scan.
The oscilloscope pulse triggered two events: the begning of the waveform that moved the galvanometer scannmirror, and, after a delay adjusted to the scanning speethe mirror, the grabbing of the two video frames. Takiadvantage of the repeatability of the timing in this triggerischeme, we averaged our images of the Mach cones ovelaser scans, all under the same conditions. This averaprovided an improved signal-to-noise ratio, allowing usimage features that were previously undetectable, such athird Mach cone.
As a test of linearity, we repeated experiments at selaser power levels ranging from 0.2 to 1.6 W. The resuappear to rule out the possibility of strong nonlinear effecbut are inconclusive in assessing the presence of weaklinearity. The angle of the first Mach cone may havecreased from 46° at 0.2 W to 51° at 1.6 W. However, bcause of the error-bar size in this measurement, it is apossible that the angle did not change at all. Thus, oursuggests a slight nonlinearity, but they are not conclusivemore powerful laser or a more sensitive measurement wobe required to make a definitive identification of nonlineity.
Besides the improvement of the Mach cone imaging,choice of a laser instead of a moving charged particle assupersonic object resulted in a fundamental difference in
-er
a.9
x-i-a
to
pe
n
byo-l-mee
als-tp-zis-
-gof
00ng
the
ns,n-
--ostAld-
ree
forces acting on a particle. Figure 2 shows a comparisonthe forces acting on a particle from the focused laser beand the moving charged particle of the experiments of R@20#. Due to the small inclination of the laser beam, thediation pressure provides a force which always pushesparticles forward, i.e., in the direction of the laser beam. Tcharged particle and its Debye cloud, however, move bethe crystal layer. Therefore, a crystal-layer particle is fipushed in the forward direction, and when the movicharged particle has passed the crystal particle, it is pusbackwards. That means that the mean force on a crystalticle is zero in the case of the supersonic lower-layer pticles. The laser, however, provides a net momentum*FLdtin the forward direction.
III. IMAGES OF MACH CONES
A. Mach cone maps
The Mach cone experiments were performed in a singlayer lattice that was highly ordered. Figure 3 shows the pcorrelation function and the orientational correlation functifor a typical crystal under the conditions of experiment~see Table I!. The pair correlation function exhibits a largnumber of peaks, indicating a long-range translational ordThe orientational correlation has a correlation lengthabout 5500mm, which is 13 times the interparticle distancof a5419 mm; this large multiple reflects a high orientational ordering. Crystals with such a high order are possi
FIG. 2. Comparison of forces acting on particles in the mon
layer. Shown here is the component of force in the forward (2 x)direction, as a function ofx, where the latter is equivalent to timex5Vt. For excitation by a moving charged particle located inplane 0.2 mm below the monolayer, the force on a particle inlattice reverses direction as the moving particle goes by. The Delength, which was assumed here to be 0.35 mm, limits the rangthe electric force. The optical force, on the other hand, is alwaythe forward direction, and it is spread over several millimeters
the2 x direction due to the 10° angle of the laser beam. The opt
force is applied to a more compact region in they direction, notshown here. This figure is intended to illustrate the direction offorce; the spatial distribution on the horizontal axis is drawnscale, but the vertical axis has an arbitrary scale. The magnitudethe electric and optical forces depend on the particle chargelaser power, respectively, and therefore they are not drawn hethe same scale.

ngam
eebi
e
ashgn
tia
agetbuaroee
od
n foris-Atersas-
eare
ne
chho-rstas-iketo ahe
ar-ion.
nOurtivealles100kesans,ofly toe inthe
es.an-aps,
d
aslack
g a
4166 PRE 62MELZER, NUNOMURA, SAMSONOV, MA, AND GOREE
at these low gas pressures only when arranged in a silayer. With more layers, they are unstable due to ion streing @24,25#. Note that the video images of particles that wused in computing the correlation functions were disturbby the presence of a Mach cone structure; the undisturmedium probably had a slightly higher order than shownFig. 3.
The analysis of the Mach cones starts from the digitizgray-scale video images. As usual, the particle (x,y) coordi-nates are found by computing the center of a particle. Pticles are identified by pixels that are brighter than a threold level. Contiguous bright pixels are treated as a sinparticle, and their center is found, weighting it by the intesity of each pixel. This method provides subpixel sparesolution. The particle velocityvW ~not to be confused withthe speed of the laser spotV) is determined by tracking aparticle from one video frame to the next.
Figure 4 shows an example of a video image. The imshown has been thresholded and inverted, so that it appin black and white. Here the laser spot moved from rightleft, producing a Mach cone that in this example caneasily identified. More often, however, the cones are difficto identify in the raw video image because the particlesdisplaced by only small distances from their equilibrium psitions. For this reason, we rely on images that have bprocessed in other ways.
Maps of the particle speeduvW u in Fig. 5 reveal the Machcone structure in the crystal. These images are less nthan in previous experiments@20,21#, because we average
FIG. 3. ~a! Pair correlation functiong(r ) and ~b! orientationalcorrelation functiong6(r ) for a typical monolayer crystal, in whichthe Mach cones are studied. These correlations indicate a highgree of order.
le-
dedn
d
r--
le-l
earsoelte-n
isy
100 repeatable events. In Fig. 5, speed maps are showlaser velocities ranging from 17.6 to 93.6 mm/s. The dcharge conditions are those of experiment V in Table I.the lowest laser speed, no Mach cone is visible, but all othshow a clear Mach cone structure. As expected, with increing ~supersonic! laser velocityV, the Mach cones becomnarrower and narrower. In most cases, at least two conesobservable, and forV523.4 mm/s andV529.3 mm/s evena third cone can be identified. We will discuss the third cofurther in Sec. III B.
We devised an additional method to visualize the Macone structure that is similar to the method of Schlieren ptography in gas dynamics. To explain our method, we fireview how Schlieren photography works. A transparent geous medium is homogeneously illuminated by a pointllight source. Density changes in the medium, e.g., dueshock, modulate the corresponding refractive index. Tlight is diffracted in these regions, giving rise to the appeance of streaks in the otherwise homogeneous illuminatThe term ‘‘Schlieren’’ means ‘‘streaks’’ in German.
Our method yields what we call ‘‘numerical Schlieremaps,’’ which are analogous to Schlieren photographs.maps correspond roughly to a snapshot of the time derivaof the particle number density. We begin with the origingray-scale inverted video images, which have dark particon a light background. To reduce graininess, we averageimages for each video frame. This averaging process taadvantage of the random particle movement between scso that particles are in slightly different positions in eachthe 100 images. The averaged images correspond roughnumber density maps. To emphasize the small differencnumber density produced by the Mach cone, we computedifference in the pixel intensities of two consecutive framThis yields our numerical Schlieren map. It has the advtage that it requires less effort to prepare than speed m
e-
FIG. 4. Single video frame with a Mach cone. The image hbeen thresholded and inverted, so that particles appear as bspots. When measuring the particle (x,y) coordinates, we computedthe center of these spots, weighted by the pixel intensity, yieldinsubpixel resolution.

leer-left
PRE 62 4167LASER-EXCITED MACH CONES IN A DUSTY PLASMA . . .
FIG. 5. Gray-scale maps of the particle speedv5uvW u for different speeds of the laser spotV. Dark gray values correspond to high particvelocities~black corresponds tov>4 mm/s). The numbers in the boxes indicate the laser speed in mm/s. The dark spot in the lowcorner is an artifact, and it is unrelated to the Mach cones. The experimental conditions were those of experiment V in Table I.
thsathones
esstioi-ut
nt
u-utghtnal
The
ec-rwill
beserrys-
e oformtwo
although they are noisier since they are obtained fromsmall difference in pixel gray values.
Our numerical Schlieren maps in Fig. 6 clearly revealcone structure. These maps were prepared under theconditions as the speed maps in Fig. 5. ComparingSchlieren and speed maps, we note that the Mach cangles do not exactly match. We will rely on the Mach coangles measured from the speed maps, since they repran actual physical parameter.
Hereafter, we will focus our attention on maps corrsponding to a laser spot velocity of 29.3 mm/s. In this cathe Mach number isM51.3, based on the angle of the firMach cone in the speed map of Fig. 5. A wiremesh versof the speed map, Fig. 7~a!, offers perhaps the clearest evdence that there is not only a first and second cone, bthird cone as well.
While only two cones were seen in previous experime
a
emeeneeent
-e,
n
a
s
@20,21#, we observed three, verifying the prediction of simlations @20#. Our observation of a third cone also rules othe possibility that the two previously observed cones micorrespond to the two different wave modes, compressioand shear, that can propagate in a crystalline lattice.cone angles measured from Fig 5 arem1553°, m2541.5°,andm3528.9° for the first, second and third cones, resptively. The ‘‘amplitude’’ of the third cone is much weakethan that of the first and second, for reasons that wediscuss in Sec. V.
In conclusion, we have shown that Mach cones canexcited by using the radiation pressure of a focused labeam that is moved with supersonic speed through the ctal. As in the experiments of Homannet al. @12,13#, the laserexcited compressional waves in the lattice, and becausthe supersonic excitation, these waves superimpose to fthe expected Mach cone. The existence of more thancones was verified.
FIG. 6. Numerical Schlieren maps with different speeds of the laser spotV for the same data as Fig. 5.

p,hite
4168 PRE 62MELZER, NUNOMURA, SAMSONOV, MA, AND GOREE
FIG. 7. Analysis of the Mach cone structure for the case ofV529.3 mm/s~see Fig. 5!. ~a! Wire mesh representation of the speed ma~b! gray-scale coded particle velocity along thex direction,vx ~darker areas correspond to higher backward motion in the lab frame, w
correponds to forward motion!, ~c! map of the particle velocity vectorsvW , and~d! density map. The arrows indicate the line of thevx andnd profiles shown in Fig. 8.
ilheath
teth
to
m
tyei
e
in
hein
ed,h
nceer-a
umleshenghetion
the
B. Analysis of the Mach cone structure
Next we will discuss the structure of Mach cones. We wfocus on a specific example, the Mach cone made witlaser spot velocity of 29.3 mm/s. In addition to the spemap shown in Fig. 5, we will present maps of additionphysical quantities. All of these maps are based on datawere averaged over 100 scans.
First, we calculated maps for the velocity vectorvW asshown in Fig. 7~c!. For clarity, we suppressed vectors shorthan 0.5 mm/s when drawing the map. Accompanyingvector plot ofvW is a gray-scale plot of thex component ofvW ,vx , see Fig. 7~b!. In this map, dark regions correspondhigh velocity in the1 x direction, which is opposite to themotion of the laser spot, whereas white corresponds totion in the direction of the beam.
The map of number densitynd in Fig. 7~d! was preparedusing the method of Ref.@21#, which begins with a Wigner-Seitz~Voronoi! map of the lattice. The local number densiis computed as the inverse of the area of the Wigner-Scell for each particle, mapped onto a rectangular grid.
ladlat
re
o-
tz
Additionally, we present cross-sectional slices along thxdirection of thevx map and the density map at they positionindicated by the arrows in Fig. 7. These slices are shownFig. 8.
One interesting feature is a long tail that is formed in ttrack of the laser spot. Within this track, particles movethe direction of the laser beam, as seen in Figs. 7~b! and 7~c!.The number density of dust particles in this track is reducas shown in Fig. 7~d!. This track is not observed in Maccones generated by a moving charged particle@20,21#. Weassume that this difference can be attributed to the differein the forces acting on the particles in the track of the supsonic object. As illustrated in Fig. 2, the laser spot, unlikemoving charged particle, imparts a net forward momentto the particles. The resulting forward motion of the particleaves a low-density track behind the spot. The track is tfilled by particles moving in from outside the track, yieldina general backward drift motion behind the first cone. Ttrack feature in the speed maps is rather long, an observathat in Sec. V we will attribute to the elongated shape of

fcththssmngher
rafo
noth
theum,cle
u-
omurth
sesin
forerralln in
, ise
sib
spot
und
PRE 62 4169LASER-EXCITED MACH CONES IN A DUSTY PLASMA . . .
spot created by the tilted laser beam.The speed map in Fig. 7~a! clearly shows the presence o
a third peak, which we identified above as the third Macone. There is a reason, however, to question whetherfeature might actually be the fourth cone, rather thanthird. To consider this issue, we first examine the crosectional slice in Fig. 8. As expected, the first peak in nuber density coincides with the first cone of forward-moviparticles, and the first minimum in density coincides with tsecond cone, with its backward-moving particles. Therefothe first cone is compressional, while the second is rareftional. These findings are consistent with the resultscones excited by a moving charged particle@20#.
The third extremum in number density, however, doescoincide with the third peak in particle speed. Instead,
FIG. 8. Profiles ofvx ~a! andnd ~b! along thex direction. Thescale ofvx is expanded, clipping off the first and second conesorder to bring out the third cone. The dashed vertical lines reprethe location of maximum speeduvW u of the first, second, and thirdcones, respectively. The inclined dash-dot line indicates a posoverall backward drift.
hise--
e,c-r
te
extremum in number density atx515.5 mm precedes thepeak in particle speed at 17.5 mm. At the latter position,number density does not have a profound peak or minimas would be expected. Moreover, the direction of partimotion at the third peak in the speed is backward in Fig. 7~b!and Fig. 8, rather than forward as predicted by earlier simlations for cones excited by a moving charged particle@20#.Thus, it is possible that the feature we have identified frthe speed maps as the third cone might actually be the focone.
It is possible that this discrepancy in counting cones arifrom our using an absolute particle velocity, as measuredthe lab frame. We have not adjusted the particle velocityoverall drifts in the particle motion produced by the lasbeam. Outside the track behind the laser spot, the ovemotion behind the first cone is backward, as can be see
nnt
le
FIG. 9. ~a! Mach cone anglem of the first and second Machcone measured from the speed maps as a function of the laservelocity V. ~b! Plot of the Mach cone relation 1/sinm5V/c for thefirst and second cone, respectively. From a linear fit, the sospeedc is found to bec1519.9 mm/s for the first cone andc2
517.4 mm/s for the second. The sound speedc1 is indicated as thevertical dashed line. In~a! the solid line form of the first cone iscalculated using the sound speedc1 derived from the linear fit in~b!.

ser
bt
ahe
ckhe-
nb
thn
osn
icW,
eat
thha
n
thtey
oav’’
cob
cedne.irethe
ondn betwos too
the
theargehethege,nd
hethet isas ares.thecon-This
s ining
op-
solidec-
hegher
4170 PRE 62MELZER, NUNOMURA, SAMSONOV, MA, AND GOREE
Fig. 7~b! and Fig. 8. If this overall backward motion imerely a secular drift due to backfilling the track, then phaps it should be subtracted out. To illustrate how this candone, we have drawn an inclined dash-dot line in Fig. 8indicate the secular trend ofvx . Subtracting this trend fromthe measured velocity, the minimum invx at x515.5 mmbecomes amaximum in the forward direction. This forwardmaximum velocity coincides, as one would expect, withdensity maximum. If this explanation is correct, then tfeature identified in Fig. 7~a! and 7~b! as the third cone isactually the fourth cone.
Finally, we evaluate the Mach cone as if it were a shoDoing this, we quantify the strength of the shock from tjump in the density and pressure~normal stress, i.e., the diagonal elements of the stress tensor! from the undisturbedmedium~with densityn1) to the peak in the first cone~withdensity n2). The ratio of the densities isn2 /n156.7 mm2/5.5 mm251.2, as determined from Fig. 8~b!.Computing the ratio of the Coulombic pressurep2 /p1 corre-sponding to these number densities, using the methodSamsonovet al. @21# and assuming a particle velocityv54 mm/s in the shock, we find thatp2 /p1<1.5, where theexact value depends on the particle charge and screestrength. With this pressure ratio the Mach shock canclassified as weak. For such a weak shock, it is possiblethe particle motion might be nearly linear, rather than nolinear.
C. Test of the Mach angle relation
Here we test the Mach angle relation Eq.~1! over a widerrange ofM and with less scatter than in the earlier testRef. @20#. This improvement was made possible by our uof the laser spot, which moved with a controlled speed atiming, where the latter allowed us to average many identexperimental runs to reduce the noise in our images.covered the range 10°,m<80°, which is a wider rangeespecially close toM51, than in a previous experiment@21#.We measured the cone angles manually, using the spmaps in Fig. 5. The cone angles of the first and second Mcone are shown in Fig. 9~a! for the conditions of experimenVI.
The Mach angle relation Eq.~1! is tested in Fig. 9~b!. Thisis a plot of 1/sinm versusV. The points for the first and thesecond cone fall on separate straight lines, indicatingvalidity of the Mach angle relation. From a linear fit of Macnumber, the sound speed for the first and second conefound, as listed in Table I. For the experimental conditioVI that were used for Fig. 9, we findc1519.9 mm/s andc2517.4 mm/s.
There are three physics conclusions we can draw fromdata shown in Fig. 9~b!. First, the quality of the fit to straighlines in Fig. 9~b! is evident, verifying that the Mach anglrelation is applicable when a dusty plasma is disturbed bsupersonic disturbance. Second, the'20 mm/s speed of thewave is quite slow, due to the low charge-to-mass ratiothe particles in a dusty plasma. Third, the two cones hdifferent angles, indicating that the second cone ‘‘seesslower sound speed than the first.
The reason for the slower sound speed in the secondis not clear. One possibility is that nonlinear effects might
-e
o
.
of
ingeat-
fedale
edch
e
res
e
a
fea
nee
involved, if the sound speed of the second cone is redudue to a diminished number density behind the first coDetermining whether nonlinearity is the cause will requfurther study in simulations and experiments, wherestrength of the laser excitation can be varied.
The possibility that the first and second cone correspto the compressional and shear waves, respectively, caruled out two ways. First, we have observed more thancones. Second, the sound speed for the second cone iclose to that of the first cone. In the experiment,c1 /c251.14, whereas the theory of Peeters and Wu@18# predictsthat the compressional wave is five times faster thanshear wave, fork51.
A useful test of the dependence of the sound speedc onthe particle number density is shown in Fig. 10. Here,Mach cones have been excited under the same dischconditions, but in different parts of the crystal cloud, in tcenter and at the edge. As mentioned in the Introduction,number density is highest in the center and lower at the edcorresponding, for example, to experimental conditions I aII, respectively. While the number density varies from tcenter to the edge of the particle cloud, we believeplasma conditions and therefore the charge do not. Thabecause the plasma is produced by the electrode, which hmuch larger diameter than the suspension of microspheFrom Fig. 10 it is seen that at a higher number density,sound speed is faster. This is expected, since the springstant increases when the crystal is more compressed.tendency is quantified in Eq.~3!. We will exploit our abilityto measure sound speeds at two different number densitiethe next section, yielding a measurement of the screenstrength and, consequently, the particle charge.
IV. METHODS OF MEASURING Q AND kFROM THE SOUND SPEED
The particle chargeQ and the screening strengthk arecrucial parameters in the determination of the crystal pr
FIG. 10. Sound speed dependence on number density. Theand broken curves are for experimental conditions I and II, resptively, which are for two different regions of the same lattice in tsame discharge. A higher number density corresponds to a hisound speed.

surap
tricadehiemrfi
b
atin
aed
oa
s
our
het-.
thcatsono
mna
rtidm
r-cuamd
e ofsure-undas-
xt.
2D
al-sany
h to
the
e,
fferheyanboththe
thentma
Fig.
nd
bors
PRE 62 4171LASER-EXCITED MACH CONES IN A DUSTY PLASMA . . .
erties. Various methods have been developed to meathem, which we review next. Then, we will present sevenew methods that we have devised, based on the sound smeasured from Mach cones.
A. Review of previous methods
The first method was the resonance technique@6,26#,which is based on the force equilibrium between elecfield force and gravity. Particles are shaken in the vertidirection by modulating the voltage on the lower electroThe vertical resonance frequency can be measured withprecision. The method also requires a value for the ion dsity in the sheath, which must be extrapolated froLangmuir-probe measurements made in the bulk plasmagion. The method assumes that the electric potential proin the sheath is parabolic.
As a second method, binary collisions were usedKonopkaet al. to measure bothQ andk @27,9#. This methodis limited to use with a suspension of two particles that cbe made to collide. The parameters are determined by fitthe particle orbits in a center-of-mass frame.
A third method involves comparing experimentally mesured and theoretical DLW dispersion relations to providmeasurement ofk. The first authors to use this metho@12,13# employed the resonance method to measureQ. Inrecent experiments with a linear chain@28# both Q and kwere measured simultaneously by fitting the dispersionthe DLW. These methods use a dispersion relation thatsumes a Yukawa interparticle potential.
Fourth, the dust chargeQ was determined in previouexperiments with Mach cones@20,21# by measuring thesound speed from the cone angle and comparing to the sspeed predicted by the theoretical dispersion relation fo2D DLW assuming a Yukawa potential. In the theory, tauthors included nearest-neighbor@20# and second-nearesneighbor @21# interactions, which we will discuss belowTheir method required an independent measurement ofk. Asusual, direct measurements of the particle spacinga are veryprecise while those of the Debye length are not, due toinaccuracies of Langmuir probes and the fact that theyonly be used in the bulk plasma rather than at the heighthe particle layer. The same limitation applies to the renance method. These authors measured the ion Debye lelD with a Langmuir probe in the bulk plasma, and extraplated the measurement to the sheath using an arbitrarytiple to reduce the density. This extrapolation scales owith the square root of the ion density, which is weaker ththe scaling in the resonance technique, giving rise tosmaller error.
Except for the collision method, all of thesein situ tech-niques for measuringQ and/or k rely on extrapolatingLangmuir-probe measurements of the bulk plasma propeinto the sheath. Therefore, they are subject to a certaingree of error. Here we develop methods intended to circuvent these problems.
Below, we will present two different methods to detemine Q and k using the sound speed measured from Macones. The first method is based on the difference in sospeed for different dust number densities under the splasma conditions~see Fig. 10!. The second uses the soun
releed
cl.ghn-
e-le
y
ng
-a
fs-
nda
en
of-gth-ul-lyna
ese--
hnd
e
speed and the vertical resonance frequency. An advantagthese methods is that neither relies on an absolute meament of the ion density in the sheath. They both use a sospeed predicted by a theoretical dispersion relation thatsumes a Yukawa potential. We will review this theory ne
B. Sound speed theory
The sound speed of a compressional wave in aYukawa system depends on the screening strengthk, as inEq. ~2!. This dependence is plotted in Fig. 11, where in cculating the sum inf (k)5c/c0 we included various numberof neighbors. The most accurate expression includes mneighbors, which we define to be a number large enougassure thatr a,maxk@1. For largek, it is adequate to retainonly one or two nearest neighbors in the sum. However,error becomes significant if one includes only one ring (r a51) or two rings of neighbors, fork<1.5 andk<1, respec-tively. In previous Mach cone experiments@21# where k>1.5, it was justified to include only one or two rings. Herhowever, we will include many neighbors,r a,maxk@1.
The two methods of measurement described below diin the input parameters that are used. Most importantly, tdiffer in the way thatk is measured. Both methods use asinput parameter the measured sound speed, and theyassume that the sound speed is accurately predicted bydispersion relation for a 2D Yukawa lattice.
C. Sound-speed ratio method of measuringk and Q
Here, we present a method where the screening strengkis determined by measuring the sound speed for differparticle number densities, under otherwise identical plasconditions. The experimental data we use are shown in
FIG. 11. Theoretical determination of the normalized souspeedc/c05 f (k) as a function of the screening strengthk. Thesound speed is shown for the exact solution~solid line! and bytaking into account nearest neighbors and two nearest neigh~dashed lines!.
as
twbesaterithd
romsmo
.
n
usd
,
ofhe
rror,ri-
sedthe
bygenal
d:eadcleomure-herethisnalter-
fea-
nnce,
arge
theedea-
ncy
la-
hey
ua-
4172 PRE 62MELZER, NUNOMURA, SAMSONOV, MA, AND GOREE
10. There, the sound speedc1 andc2 were measured in twodifferent regions of the same plasma crystal, with interpticle distancesa1 anda2, respectively. These two conditionare identified in Table I as experiments I and II.
We assume that the particle charge is the same in theparts of the plasma crystal. This assumption is justifiedcause the measurements were performed under theplasma conditions. The relevant plasma conditions for demining the charge are the electron temperature, ion dspeed, and the electron/ion density ratio at the height oflattice. These plasma conditions likely do have radial graents, but we expect them to be on the scale of the electradius, which was much larger than the particle cloud diaeter. Therefore, it is reasonable to assume that the placonditions and therefore the charge were uniform throughthe cloud.
When the charge is the same, we can computek from theratio of the sound speedsc1 /c2 and the interparticle distanceThis can be expressed as
f ~k1!
f ~k2!5
c1
c2
Aa1
Aa2
,
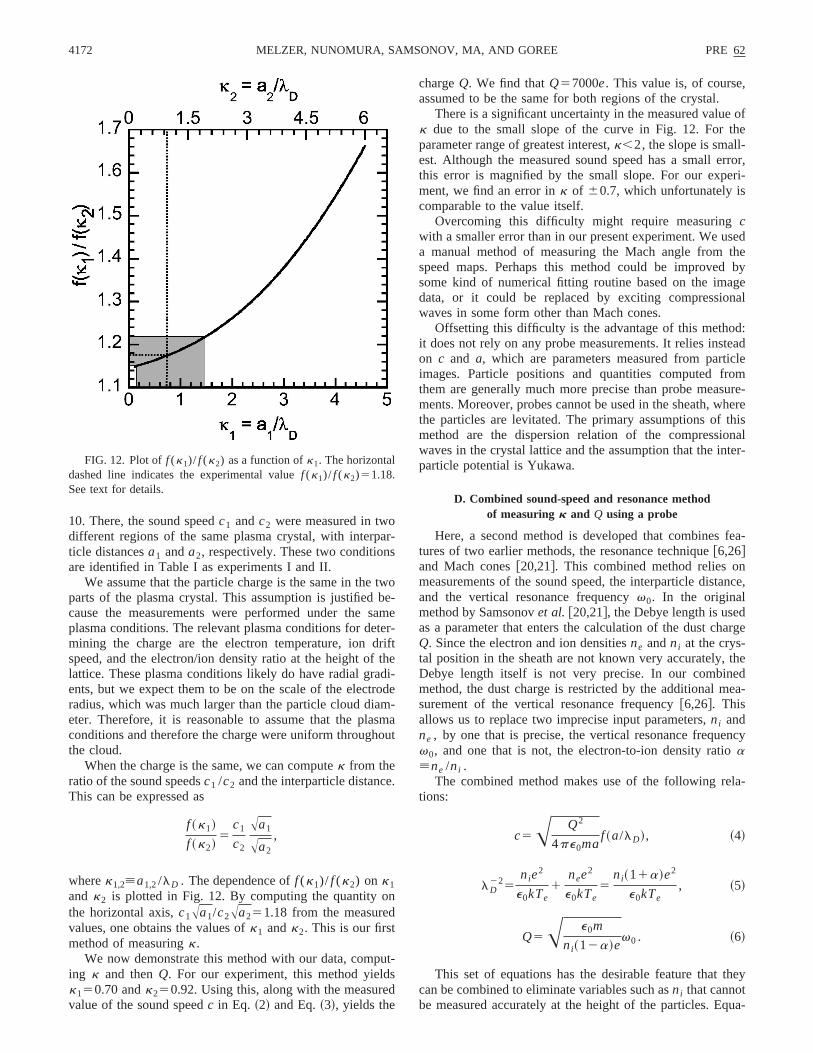
wherek1,2[a1,2/lD . The dependence off (k1)/ f (k2) on k1and k2 is plotted in Fig. 12. By computing the quantity othe horizontal axis,c1Aa1/c2Aa251.18 from the measuredvalues, one obtains the values ofk1 andk2. This is our firstmethod of measuringk.
We now demonstrate this method with our data, comping k and thenQ. For our experiment, this method yieldk150.70 andk250.92. Using this, along with the measurevalue of the sound speedc in Eq. ~2! and Eq.~3!, yields the
FIG. 12. Plot off (k1)/ f (k2) as a function ofk1. The horizontaldashed line indicates the experimental valuef (k1)/ f (k2)51.18.See text for details.
r-
o-mer-fte
i-de-a
ut
t-
chargeQ. We find thatQ57000e. This value is, of courseassumed to be the same for both regions of the crystal.
There is a significant uncertainty in the measured valuek due to the small slope of the curve in Fig. 12. For tparameter range of greatest interest,k,2, the slope is small-est. Although the measured sound speed has a small ethis error is magnified by the small slope. For our expement, we find an error ink of 60.7, which unfortunately iscomparable to the value itself.
Overcoming this difficulty might require measuringcwith a smaller error than in our present experiment. We ua manual method of measuring the Mach angle fromspeed maps. Perhaps this method could be improvedsome kind of numerical fitting routine based on the imadata, or it could be replaced by exciting compressiowaves in some form other than Mach cones.
Offsetting this difficulty is the advantage of this methoit does not rely on any probe measurements. It relies inston c and a, which are parameters measured from partiimages. Particle positions and quantities computed frthem are generally much more precise than probe measments. Moreover, probes cannot be used in the sheath, wthe particles are levitated. The primary assumptions ofmethod are the dispersion relation of the compressiowaves in the crystal lattice and the assumption that the inparticle potential is Yukawa.
D. Combined sound-speed and resonance methodof measuring k and Q using a probe
Here, a second method is developed that combinestures of two earlier methods, the resonance technique@6,26#and Mach cones@20,21#. This combined method relies omeasurements of the sound speed, the interparticle distaand the vertical resonance frequencyv0. In the originalmethod by Samsonovet al. @20,21#, the Debye length is usedas a parameter that enters the calculation of the dust chQ. Since the electron and ion densitiesne andni at the crys-tal position in the sheath are not known very accurately,Debye length itself is not very precise. In our combinmethod, the dust charge is restricted by the additional msurement of the vertical resonance frequency@6,26#. Thisallows us to replace two imprecise input parameters,ni andne , by one that is precise, the vertical resonance frequev0, and one that is not, the electron-to-ion density ratioa[ne /ni .
The combined method makes use of the following retions:
c5A Q2
4pe0maf ~a/lD!, ~4!
lD225
nie2
e0kTe1
nee2
e0kTe5
ni~11a!e2
e0kTe, ~5!
Q5A e0m
ni~12a!ev0 . ~6!
This set of equations has the desirable feature that tcan be combined to eliminate variables such asni that cannotbe measured accurately at the height of the particles. Eq

di
mhttoe-
yat
astio
he
-
th
, a
ofnt
cyndsrichitiesm-theye-
as athe
atiom-edesse
thatithis
o atoust
y agthorn 2
for
ofter-le
d ofd
-atlyere
icler
vth
he
e-
PRE 62 4173LASER-EXCITED MACH CONES IN A DUSTY PLASMA . . .
tion ~4! is the sound-speed relation, which assumes thepersion relation for a 2D Yukawa lattice. Equation~5! de-fines the Debye length, and this relation requires soexplanation. Because the particles are levitated sligwithin the sheath, where the ions have been acceleratedenergy on the order ofkTe , we have assumed, in the dnominator of the second term of Eq.~5!, that the appropriateenergy for the screening by ions iskTe . This assumption issupported by previous experimental findings@9,12,13,27#.The electron temperatureTe is determined experimentallfrom Langmuir probe measurements in the bulk plasma,height above the particle layer. Unlikeni , this parameter isbelieved to have nearly the same value in the bulk plasmin the sheath. Equation~6! imposes a restriction on the ducharge or equivalently the ion density at the crystal positby the measured vertical resonance frequencyv0 accordingto the resonance technique@6,26#. In addition to Te , thismethod uses as inputs the values ofc, a, andv0, which areall measured precisely from particle images.
In Fig. 13, the lines inQ,k phase space represent tsound-speed relation according to Eq.~2! or ~4! using themeasured values ofc and a for experimental conditionsI–VI, thus each pair ofQ,k on the line results in the measured sound speedc. Both methods presented here~thesound-speed ratio and the combined method! make use of thesound speed, and either the determination ofQ or k fixes apoint on this line.
From the combined method one can parametrizesound-speed relation by the single parametera using Eqs.~5! and ~6! to eliminate the ion densityni . The thin tick
FIG. 13. Summary of the experimental results in theQ,k plane.The solid lines indicate the values ofQ andk compatible with theexperimental values of the sound speed, interparticle distance,tical resonance frequency, and electron temperature withelectron-to-ion density ratioa as free parameter, based on tmethod of Sec. IV D using Eqs.~4!–~6!. The tick marks indicate thevalues corresponding toa50,0.1,0.33,0.66 from bottom to top. Thsolid squares indicatek ~and thusQ) obtained using the soundspeed ratio method of Sec. IV C. The circles arek andQ obtainedin a method similar to Ref.@21#. The roman numerals I–VI indicatethe experiment number as listed in Table I.
s-
elyan
a
as
n
e
marks on the solid curves indicate the valuesa50,0.1,0.33,0.66, beginning from the bottom. In doing sominimum value forQ andk is identified. Thus, the bottomend of these curves corresponds to the minimum valuea50, which would apply if there were no electrons preseat the height of the crystal. Fortunately, we find thatQ andkare not extremely sensitive toa. As seen in Fig. 13,k andQvary typically over a range of630% and620%, respec-tively, for 0<a<0.66.
Our experiment was performed with a radio-frequensheath. During the rf cycle, the sheath repeatedly expaand then collapses, and during its collapse the electron-plasma extends all the way to the electrode. The densand electric potential have both dc and time-varying rf coponents. The particles, like the ions, are so massive thatrespond only to the dc potential. Therefore, it is the timaveraged densitiesni andne that enter intoa[ne /ni . Thisratio is nonzero since the rf sheath, unlike a dc sheath, hfinite electron density penetrating to the electrode duringsheath collapse.
E. Comparison of methods of measuringk and Qfrom Mach cones
Here we compare the two methods of measuringQ,kdescribed above. Data points from the sound-speed rmethod of Sec. IV C are shown as squares in Fig. 13. Coparing the two, we find that the data for the sound-speratio method fall very nearly at the bottom end of the curvfor the combined method of Sec. IV D. The bottom of thocurves corresponds toa50.
We also compare to the method of Ref.@21#, which alsoused the sound speed measured from the Mach angle. Inmethod,k is determined by measuring the Debye length wLangmuir probes in the bulk plasma. The Debye lengthadjusted upward by an arbitrary factor, corresponding treduction in the ion density, in the sheath as comparedwhere the probe measurement was made. Here we mchoose the ion density reduction arbitarily, in our case bfactor of 5. The corresponding increase in the Debye lenis a factor ofA5. This adjustment is accurate within 50%, fion density reductions in the sheath by a factor betweeand 20.
Typical error bars for determiningk andQ are indicatedin the figure. For the sound-speed ratio method, the errork is 60.7 due to the small slope off (k1)/ f (k2) in Fig. 12,as explained in Sec. IV C. The error bar fork also reflectsthe above-mentioned 50% uncertainty in the extrapolationthe shielding length into the sheath. These errors in deminingk give rise to the indicated error range for the particchargeQ.
For both the sound-speed ratio method and the methoRef. @21#, the data fall on the curves for the combinemethod in a range 0.1<a<0.33. If all the methods are correct, this result suggests that the electron density is grereduced as compared to the ion density, at the height whthe particles are levitated. In this case, the interpartshielding would likely be provided mainly by ions rathethan electrons.
er-e

h
l
iaic
s
. 5
it
mg
rc
am
-he
enione
pa, b
t
gl
iorele°foin
aytheof
sityet
icalok
ig.thetionond
heres-ouroneustic
n-heted
he
omomwn.s. 5
4174 PRE 62MELZER, NUNOMURA, SAMSONOV, MA, AND GOREE
V. MOLECULAR-DYNAMICS SIMULATIONS
We carried out molecular-dynamics~MD! simulations, re-producing the experiment as faithfully as was practical. Tparticle equation of motion,
md2rW
dt252Q¹f2n
drW
dt1FL , ~7!
was integrated forN55000 particles. The electric potentiawas
f52k
2r 22(
i , j
NQ
4pe0r i jexpS 2
r i j
lDD , ~8!
where the first term is a harmonic potential for the radconfinement and the second term is a binary interpartrepulsion, assuming a Yukawa model. Herer is the distancefrom the axis,r i j is the distance between any two particleand the sum is over all particles.
We used the parametersQ56860e, lD5330 mm, m52.18310213 kg, andn52.3 s21 for Epstein drag. Theseparameters are like those for experiment V in Table I, Figand Fig. 6. We chosek55.46310213 kg /s2 to achieve aparticle separationa5420 mm, corresponding tok51.27,when averaged over the region shown in the figures.
The simulation ran as follows. Particles were seeded wrandom initial positions. Then, while integrating Eq.~7!, par-ticles moved about. Eventually they settled into equilibriupositions, with their kinetic energy lost entirely to dampinWe then introduced a moving localized forceFL to modelthe force due to the moving laser spot. As in Fig. 2, the fowas modeled with an elliptical Gaussian profile,FL5
2 f 0exp@2(x2Vt)2/bx2#exp(2y2/by
2)x. To make it similar tothe experiment, the elongated laser footprint had the pareters by50.33 mm and bx5by /sinu51.9 mm with u510°. The laser spot velocity wasV529.3 mm/s, as in oneof the experiments in Fig. 5.
The force at the center of the beam wasf 052.2310214 N. We chose this value empirically to yield approximately the same particle velocity as in Fig. 7 for texperiment. This force is equivalent to 0.01mg, in terms ofthe gravitational accelerationg.
The speed map from the simulation, Fig. 14, shows geral agreement with the experiment. In both the simulatand the experiment, the first and second cones are promiand a third cone is faintly visible.
The experiment and simulation yielded generally comrable values for the angles of the first and second conesthere is a discrepancy. Our measurements, made fromspeed maps with an accuracy of typically61.5°, were asfollows. In the simulation, the first two cones have an anm1549.5° andm2544.5°. In the experiment,m1553° andm2541.5°. The angles in the experiment and the simulatare generally comparable. Nevertheless, there is a discancy in the difference of the first and second cone angThe differencem12m255° is much smaller than the 11.5difference for the experiment. We do not know the reasonthis discrepancy, or whether it could be resolved by choosdifferent simulation parameters.
e
lle
,
,
h
.
e
-
-nnt,
-uthe
e
np-s.
rg
The numerical Schlieren map was computed in a wanalogous to the experimental map. The difference is thatexperimental map was prepared from the video imageparticles, while in the simulation we used the number dendirectly. The quantity we plot here is the differencnd(x,y,t)2nd(x,y,t21/30 sec). Because of the differenmethods of preparation, one might not expect the numerSchlieren maps for the experiment and simulation to loexactly alike.
The numerical Schlieren map from the simulation, F14, also shows the Mach cones. The first two cones, as inspeed maps, are more nearly equal in angle in the simulathan in the experiment. Indeed, in the simulation, the seccone is nested directly against the first cone.
We also note in the numerical Schlieren map from tsimulation that there appear to be some random compsional disturbances in the track behind the laser spot. Ifmedium were a continuum, rather than discrete particles,might be tempted to describe these disturbances as ‘‘acoturbulence.’’
Now we will use the simulation to explain the experimetal observation of an elongated low-density region in ttrack behind the moving laser spot. To do this, we repea
FIG. 14. From the MD simulation, a gray-scale map of t
particle speeduvW u and a Schlieren map, both forV529.3 mm/s.Unlike the experiment where the Schlieren map is produced fran uncalibrated video image of particles, here it is computed frthe number density, and therefore a calibration scale is shoThese plots should be compared to the experimental data in Figand 6.

ith
ththice
in
amstthtlathtia
atth
on
gle-nesh aof age ofcon-anen-red
oneuc-
es,
chverforomeases
nsdi-
deters
dustun-thean-
th isgd-
hns.ed
ent.b-ichbyent
ach
rkda-y
ialce.
asthre
PRE 62 4175LASER-EXCITED MACH CONES IN A DUSTY PLASMA . . .
the simulation with a laser footprint that was round, wbx5by50.33 mm, rather than elliptical. Diffraction limitingwould prevent one from shaping a narrow laser beamway in the experiment, so this test can only be done insimulation. To achieve approximately the same peak partspeed as before, we increasedf 0 by 50%. Nevertheless, thmomentum applied to the crystal as a whole was reduceda factor 0.26, because the shorter laser footprint resultedsmaller value of*FLdx.
The resulting simulation results for a circular laser befootprint, shown in Fig. 15, lead us to two conclusions. Firwe note that the high-speed region in the track behindlaser footprint becomes shorter when the laser footprinshortened into a round spot. This verifies our earlier expnation that the elongated track in the experiment is due toelongated laser beam. Second, we observe in the simulathat the third cone becomes clearer and additional conespear when the footprint becomes round. This suggests thour experiment, the elongated laser footprint causesthird- and higher-order cones to overlap and obscureanother.
FIG. 15. From the MD simulation, with a laser spot that hbeen artificially reshaped so that it makes a round footprint onlattice. Otherwise, this is like Fig. 14. Comparing these two figureveals the effects of an elongated laser footprint.
isele
bya
,e
is-e
onp-inee
VI. SUMMARY
We have performed experiments on Mach cones in sinlayer plasma crystals. We have shown that the Mach cocan be excited by sweeping a focused laser beam witsupersonic velocity through the plasma crystal. The uselaser generates repeatable Mach cones over a large ransubsonic and supersonic speeds. This was done in atrolled manner, allowing a large number of repetitions ofexperiment. Averaging these repetitions allowed us to idtify a number of features that would otherwise be obscuby noise.
We have demonstrated the existence of a third Mach cand possibly a fourth cone as well. This multiple cone strture was anticipated in earlier simulations@20#, and it rulesout the possibility that the cone structure with two conobserved in earlier experiments@20#, was generated by thetwo possible wave modes in a plasma crystal. The Macone relation has been verified with quite high accuracy oa large range of supersonic velocities. It is found thatincreasing order of the Mach cones, the cone angles becsmaller and thus the corresponding sound velocity decreslightly.
In an experiment performed in different crystal regiowith different dust density, but at the same plasma contions, it was demonstrated that the sound speedc increaseswith dust density. This finding was used to devise anin situmethod for measuring the screening strengthk ~and, there-fore, the dust chargeQ) in the plasma crystal. This methodoes not depend on any knowledge of the plasma paramat the crystal position.
A second technique was developed for measuring thecharge and screening strength that replaces some of theknown parameters, such as electron and ion density atcrystal position, by other more accurately measurable qutities. From these measurements the screening strengfound to be in the rangek50.5–1.3 and the correspondindust charge isQ56000–8000 elementary charges, depening on the discharge conditions.
Finally, we have performed MD simulations of the Maccones in a plasma crystal using the experimental conditioThe simulation, which assumed a Yukawa potential, yieldresults that were generally comparable to the experimThe simulation helped us explain the experimentally oserved long track behind the laser spot. This track, whresults from the net momentum imparted on the particlesthe laser beam, had a considerable length in the experimdue to the shape of the laser spot that excited the Mcones.
ACKNOWLEDGMENTS
We thank R.A. Quinn for technical assistance. This wowas supported by NASA and the National Science Fountion. A.M. acknowledges for the friendly support for his staat The University of Iowa. S.N. acknowledges the financsupport from the Japan Society of the Promotion of Scien
es

. E
A
ll,
ci.
s.
4176 PRE 62MELZER, NUNOMURA, SAMSONOV, MA, AND GOREE
@1# O. Havneset al., J. Geophys. Res.@Space Phys.# 100, 1731~1995!.
@2# H. Thomaset al., Phys. Rev. Lett.73, 652 ~1994!.@3# Y. Hayashi and K. Tachibana, Jpn. J. Appl. Phys., Part 233,
L804 ~1994!.@4# J. Chu and Lin I, Physica A205, 183 ~1994!.@5# J. Chu and Lin I, Phys. Rev. Lett.72, 4009~1994!.@6# A. Melzer, T. Trottenberg, and A. Piel, Phys. Lett. A191, 301
~1994!.@7# A. Melzer, A. Homann, and A. Piel, Phys. Rev. E53, 2757
~1996!.@8# H. Thomas and G. E. Morfill, Nature~London! 379, 806
~1996!.@9# U. Konopka, G. Morfill, and L. Ratke, Phys. Rev. Lett.84, 891
~2000!.@10# F. Melandso” and J. Goree, Phys. Rev. E52, 5312~1995!.@11# A. Melzer, V. Schweigert, and A. Piel, Phys. Rev. Lett.83,
3194 ~1999!.@12# A. Homann, A. Melzer, S. Peters, and A. Piel, Phys. Rev
56, 7138~1997!.@13# A. Homann, A. Melzer, R. Madani, and A. Piel, Phys. Lett.
173, 242 ~1998!.@14# O. Havneset al., J. Vac. Sci. Technol. A14, 525 ~1996!.
@15# J. Bond, K. Watson, and J. Welch,Atomic Theory of Gas Dy-namics~Addison-Wesley, Reading, MA, 1965!.
@16# N. Cheng, Z. Zhu, C. Cheng, and M. Tokso¨z, Geophys. Pros-pect.42, 303 ~1994!.
@17# G. Crapper,Introduction to Water Waves~E. Harwood, Chich-ester, England, 1984!.
@18# F. Peeters and X. Wu, Phys. Rev. A35, 3109~1987!.@19# F. Melandso”, Phys. Plasmas3, 3890~1996!.@20# D. Samsonovet al., Phys. Rev. Lett.83, 3649~1999!.@21# D. Samsonov, J. Goree, H. M. Thomas, and G. E. Morfi
Phys. Rev. E~to be published!.@22# V. A. Schweigert and F. Peeters, Phys. Rev. B51, 7700
~1995!.@23# Y. Lai and Lin I, Phys. Rev. E60, 4743~1999!.@24# A. Melzer et al., Phys. Rev. E54, 46 ~1996!.@25# V. A. Schweigertet al., Phys. Rev. E54, 4155~1996!.@26# T. Trottenberg, A. Melzer, and A. Piel, Plasma Sources S
Technol.4, 450 ~1995!.@27# U. Konopka, L. Ratke, and H. M. Thomas, Phys. Rev. Lett.79,
1269 ~1997!.@28# H. Schollmeyer, A. Melzer, A. Homann, and A. Piel, Phy
Plasmas6, 2693~1999!.


![Sonic Mach Cones Induced by Fast Partons in a Perturbative Quark-Gluon Plasma [1]](https://img.pdfslide.us/doc/110x75/568145f9550346895db30285/sonic-mach-cones-induced-by-fast-partons-in-a-perturbative-quark-gluon-plasma-5695cf080939f.jpg)