Embed Size (px)
Citation preview

Nanoghosts as a Novel Natural Nonviral Gene
Delivery Platform Safely Targeting Multiple Cancers
SUPPORTING INFORMATION
Limor Kaneti, Tomer Bronshtein, Natali Malkah Dayan, Inna Kovregina,
Nitzan Letko Khait, Yael Lupu-Haber, Miguel Fliman, Beth W. Schoen, Galoz Kaneti,
and Marcelle Machluf*
Faculty of Biotechnology and Food Engineering, Technion – Israel Institute of Technology, Haifa
3200003, Israel
*Corresponding author
Professor Marcelle Machluf, PhD
The Laboratory of Cancer Drug Delivery & Mammalian Cell Technology
Faculty of Biotechnology & Food Engineering
Technion-Israel Institute of Technology
Haifa, Israel, 3200003
Tel: 972-4-829-4916, 972-4-829-3079
Fax: 972-77-887-1951
Email: [email protected]
SUPPLEMENTAL DATA
Figure S1. Surface associated mechanisms that govern MSC targeting and immune
evasiveness. Ample studies have shown that allogeneically transplanted MSCs can selectively
target a wide range of pathological tissues and have produced positive outcomes in numerous
clinical trials with different diseases including solid and hematological tumors, degenerative
diseases, and immune disorders.1, 2
Figure legend continues on the next page
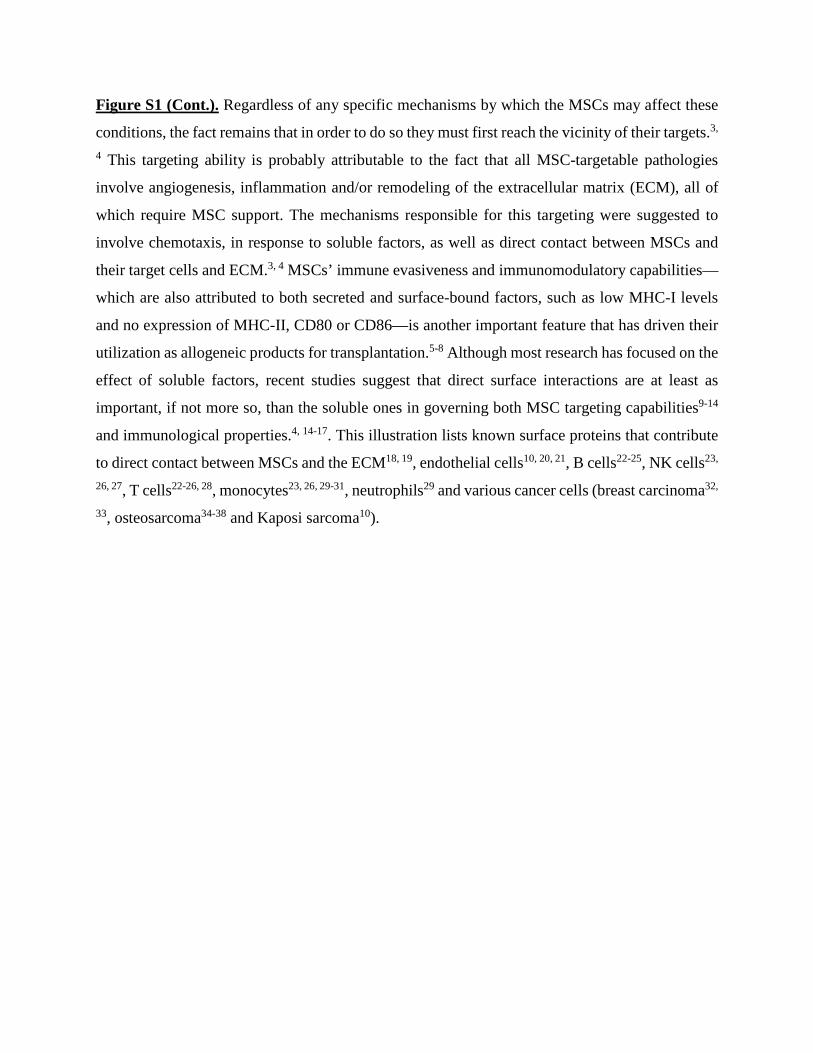
Figure S1 (Cont.). Regardless of any specific mechanisms by which the MSCs may affect these
conditions, the fact remains that in order to do so they must first reach the vicinity of their targets.3,
4 This targeting ability is probably attributable to the fact that all MSC-targetable pathologies
involve angiogenesis, inflammation and/or remodeling of the extracellular matrix (ECM), all of
which require MSC support. The mechanisms responsible for this targeting were suggested to
involve chemotaxis, in response to soluble factors, as well as direct contact between MSCs and
their target cells and ECM.3, 4 MSCs’ immune evasiveness and immunomodulatory capabilities—
which are also attributed to both secreted and surface-bound factors, such as low MHC-I levels
and no expression of MHC-II, CD80 or CD86—is another important feature that has driven their
utilization as allogeneic products for transplantation.5-8 Although most research has focused on the
effect of soluble factors, recent studies suggest that direct surface interactions are at least as
important, if not more so, than the soluble ones in governing both MSC targeting capabilities9-14
and immunological properties.4, 14-17. This illustration lists known surface proteins that contribute
to direct contact between MSCs and the ECM18, 19, endothelial cells10, 20, 21, B cells22-25, NK cells23,
26, 27, T cells22-26, 28, monocytes23, 26, 29-31, neutrophils29 and various cancer cells (breast carcinoma32,
33, osteosarcoma34-38 and Kaposi sarcoma10).

Figure S2. MSC-NG production yield and purity following sonication or extrusion. MSC-
NGs were produced by using either sonication or extrusion to downsize the MSC-ghosts into NGs.
Extrusion was carried out as we have published before.39 Briefly, the re-suspended ghost’ pellet
was extruded 11 times through 0.4 µm polycarbonate membranes (Osmonics Inc., Minnetonka,
MN) using LIPEX® (Northern Lipids, Burnaby, Canada) and ultra-centrifuged to collect the NGs
at 150,000g for 45 min at 4°C. Sonication was carried out as detailed hereafter in the Supplemental
Experimental Procedures section. Briefly, the resuspended MSC-ghosts were sonicated for 2 min
at 27% amplitude using a VibraCell VCX750 (Sonics & Materials Inc., Newtown, CT), and
centrifuged at 800g for 15 min at 4°C. The pellet was discarded and the supernatant containing the
NGs was filtered through 0.45 μm syringe filters and ultra-centrifuged using the same conditions
as mentioned above. The amounts of proteins and phospholipids in the NG samples (and the ratio
thereof) were determined using the Bradford assay and the LabAssay™ phospholipid kit (Wako,
Osaka, Japan), respectively. As can be seen, changing from extrusion to sonication increased the
NGs’ phospholipids (A) yield and (B) purity (as lipids-to-proteins ratio) by almost 10- and 2-fold,
respectively. Sonication was, therefore, selected as the preferred ghosts downsizing method for the
continuation of our studies.

Figure S3. NG-pPEX paracrine effect on the migration and proliferation of endothelial cells.
Conditioned media (CM) derived from PC3 cells incubated for 6 h with naked pPEX, empty NGs,
and NG-pPEX was collected and transferred to confluent HUVEC cultures shortly after they were
scratched and washed. Pictures of the scratch gap were taken at different time points up to 24 h,
the gap widths were measured, and the HUVECs’ migration rate was calculated. As seen in these
representative images, taken after 24 h of incubation with CM, the migration of HUVECs treated
with CM derived from PC3 cells that were transfected with NG-pPEX was drastically impeded
compared to all other controls, indicating the secretion of active PEX.
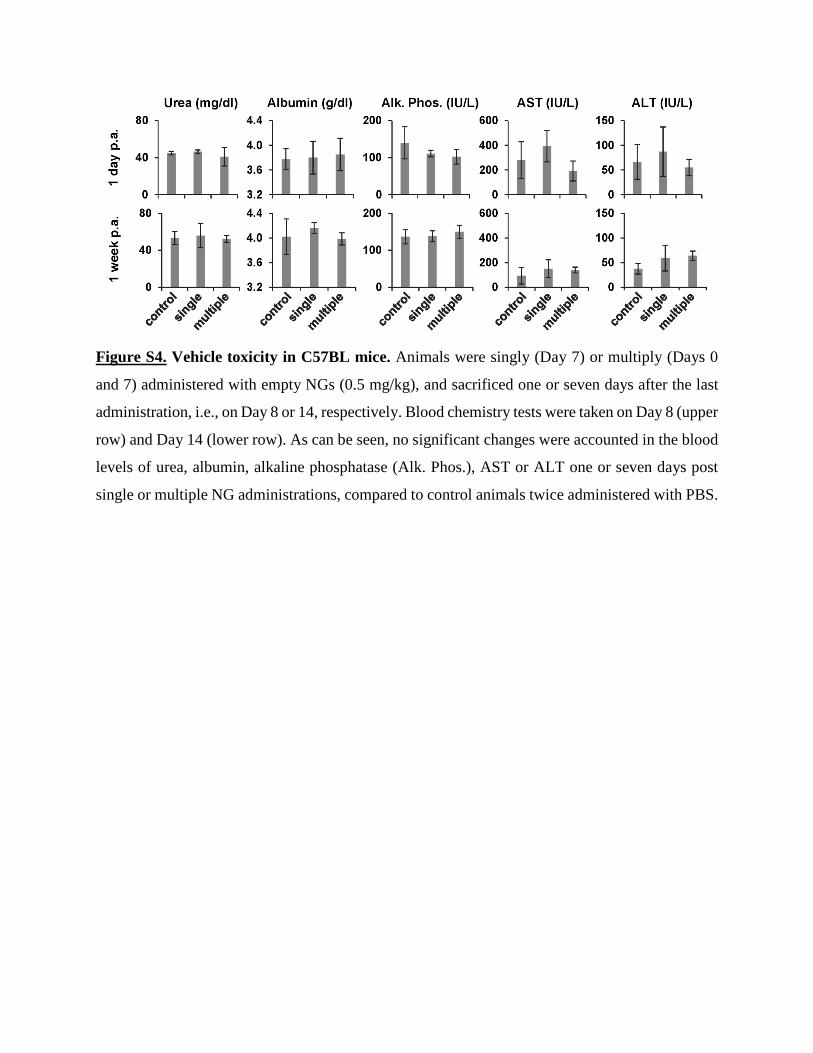
Figure S4. Vehicle toxicity in C57BL mice. Animals were singly (Day 7) or multiply (Days 0
and 7) administered with empty NGs (0.5 mg/kg), and sacrificed one or seven days after the last
administration, i.e., on Day 8 or 14, respectively. Blood chemistry tests were taken on Day 8 (upper
row) and Day 14 (lower row). As can be seen, no significant changes were accounted in the blood
levels of urea, albumin, alkaline phosphatase (Alk. Phos.), AST or ALT one or seven days post
single or multiple NG administrations, compared to control animals twice administered with PBS.
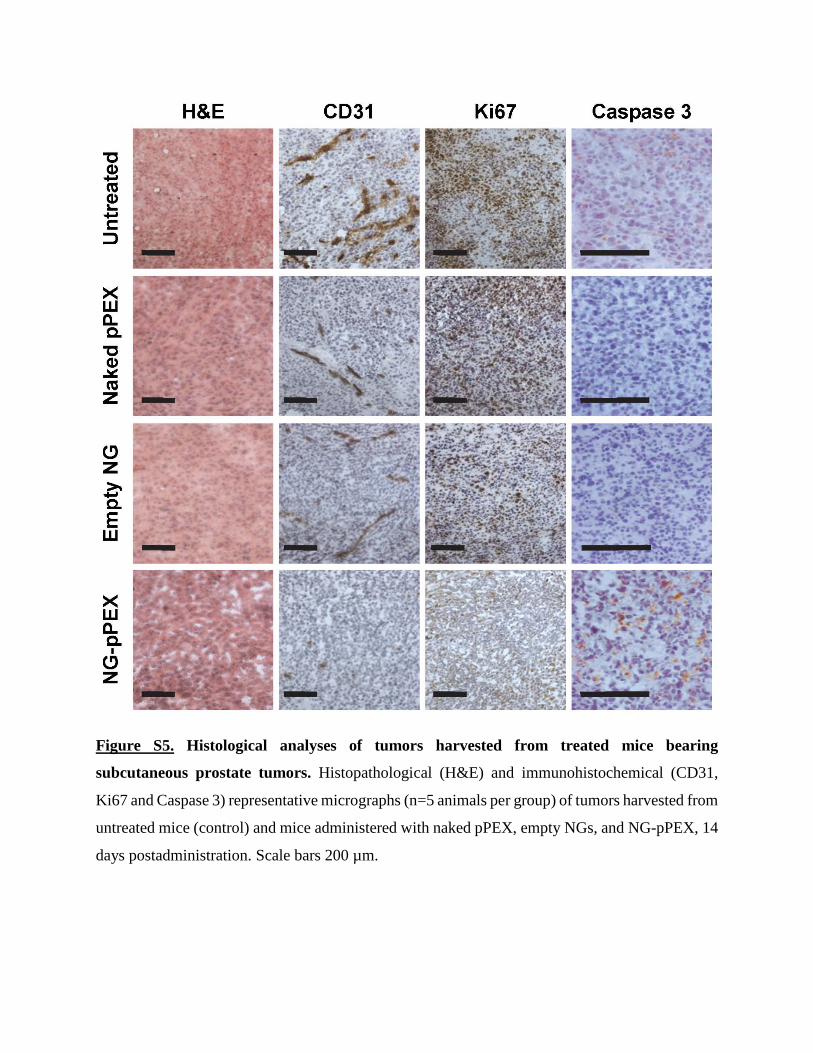
Figure S5. Histological analyses of tumors harvested from treated mice bearing
subcutaneous prostate tumors. Histopathological (H&E) and immunohistochemical (CD31,
Ki67 and Caspase 3) representative micrographs (n=5 animals per group) of tumors harvested from
untreated mice (control) and mice administered with naked pPEX, empty NGs, and NG-pPEX, 14
days postadministration. Scale bars 200 µm.
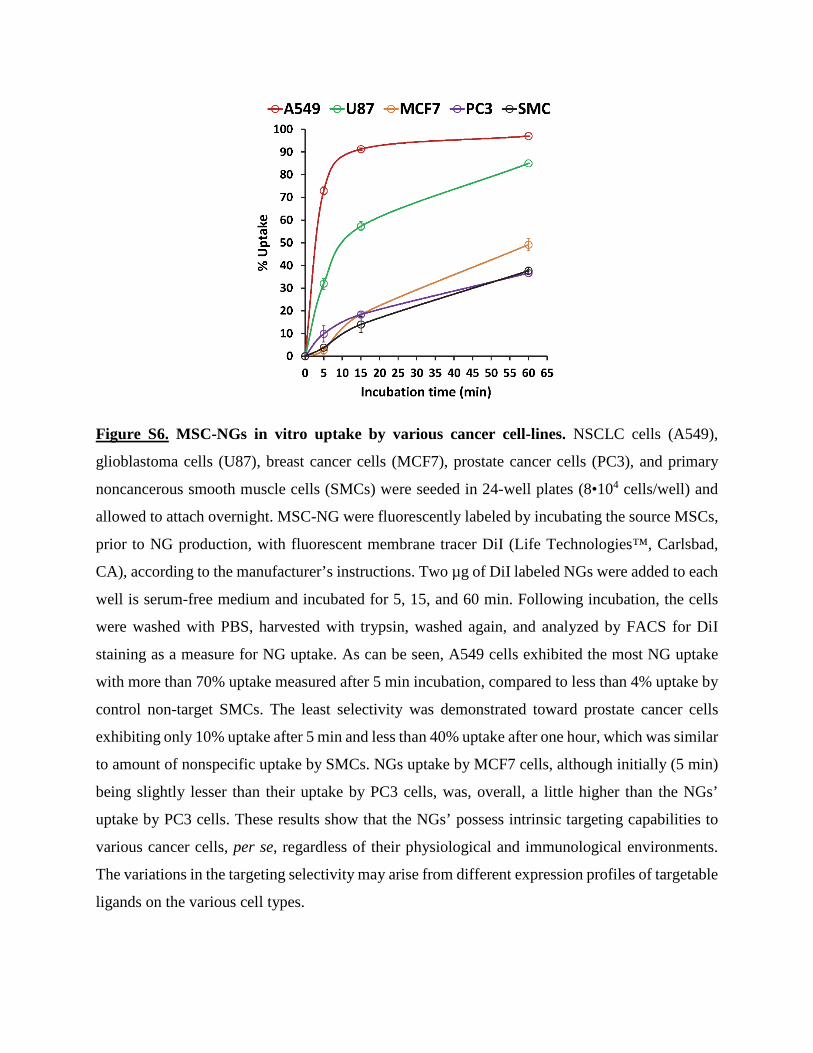
Figure S6. MSC-NGs in vitro uptake by various cancer cell-lines. NSCLC cells (A549),
glioblastoma cells (U87), breast cancer cells (MCF7), prostate cancer cells (PC3), and primary
noncancerous smooth muscle cells (SMCs) were seeded in 24-well plates (8•104 cells/well) and
allowed to attach overnight. MSC-NG were fluorescently labeled by incubating the source MSCs,
prior to NG production, with fluorescent membrane tracer DiI (Life Technologies™, Carlsbad,
CA), according to the manufacturer’s instructions. Two µg of DiI labeled NGs were added to each
well is serum-free medium and incubated for 5, 15, and 60 min. Following incubation, the cells
were washed with PBS, harvested with trypsin, washed again, and analyzed by FACS for DiI
staining as a measure for NG uptake. As can be seen, A549 cells exhibited the most NG uptake
with more than 70% uptake measured after 5 min incubation, compared to less than 4% uptake by
control non-target SMCs. The least selectivity was demonstrated toward prostate cancer cells
exhibiting only 10% uptake after 5 min and less than 40% uptake after one hour, which was similar
to amount of nonspecific uptake by SMCs. NGs uptake by MCF7 cells, although initially (5 min)
being slightly lesser than their uptake by PC3 cells, was, overall, a little higher than the NGs’
uptake by PC3 cells. These results show that the NGs’ possess intrinsic targeting capabilities to
various cancer cells, per se, regardless of their physiological and immunological environments.
The variations in the targeting selectivity may arise from different expression profiles of targetable
ligands on the various cell types.

Figure S7. Comparison between the therapeutic effect of NG-pPEX and previously reported
cell-based therapies employing genetically engineered MSCs. The %TGI achieved by NG-
pPEX, singly or multiply administered to PC3 tumor bearing nude mice, was compared to that
obtained by Song et al.40 and Lee et al.41 using the same animal model multiply transplanted (at
least twice) with whole MSCs expressing thymidine kinase that were administered in addition to
ganciclovir. TGI at time t was calculated according to Supplementary equation (1) using time zero
(t0) as the day the first effective treatment (or treatment round) was completed—i.e., Day 18 for
the cell based systems (post-tumor inoculation) or Day 0 in our studies, which is between 14 and
18 days post-tumor inoculation. The metadata required for this analysis was retrieved from figure
6A in the report by Song et al.40, and figure 5B (upper plot) in the report by Lee et al.41 As can be
seen, under all circumstances NG-pPEX led to similar or greater tumor inhibition, both in extent
and duration, than the cell-based systems.
Supplementary equation (1):
𝑇𝑇𝑇𝑇𝑇𝑇𝑡𝑡 = 1 −𝑉𝑉𝑇𝑇𝑡𝑡 − 𝑉𝑉𝑇𝑇𝑡𝑡0
𝑉𝑉𝐶𝐶𝑡𝑡 − 𝑉𝑉𝐶𝐶𝑡𝑡0
VTt and VTt0≡ Average volume of tumors in the treated group at time t and time zero, respectively.
VCt and VCt0≡ Average volume of tumors in the control group at time t and time zero, respectively.

Figure S8. MSC-NGs’ targeting of tumor allografts. Fluorescently labeled MSC-NGs were
administered into C57BL mice bearing PC2 murine prostate cancer allografts. Tumors were
harvested one day postadministration, dissociated into single cells, counterstained with specific
antibodies against macrophages, T lymphocytes, endothelial and cancer cells, and analyzed by
flow-cytometry. The %uptake of the MSC-NGs was calculated for each cell population relative to
untreated tumor-bearing mice, as background. As can be seen, MSC-NGs targeted all major
components of the tumor niche and not only the cancer cells, suggesting their ability to target the
entire tumor microenvironment.

Figure S9. MSC-NGs’ shelf life stability. MSC-NGs in PBS were stored at 4oC, -20oC or freeze-
dried and kept at -20oC until rehydration with double deionized water (DDW). Dynamic light
scattering measurements (DLS) of the (A) size and (B) charge of MSC-NGs stored at 4oC revealed
that the NGs’ were stable under refrigeration for up to two weeks. DLS measurements of the (C)
size and (D) charge of MSC-NGs stored at -20oC did not reveal any significant changes after
almost two months. (E) DLS size analysis of freeze-dried MSC-NGs, kept at -20oC until
rehydration, did not reveal any changes in their sizes.
Figure legend continues on the next page

Figure S9 (Cont.). Cryo-TEM images of (F) MSC-NGs in PBS stored in -20oC for seven days
and thawed, or (G) rehydrated freeze-dried MSC-NGs that were kept, until rehydration, for seven
days at -20oC demonstrated small unilamellar morphology similar to that of fresh MSC-NGs (Main
text Fig. 1D). Flow cytometry analyses comparing the expression of typical MSC markers between
fresh MSC-NGs’ and (H) MSC-NGs in PBS stored in -20oC for seven days or (I) rehydrated freeze-
dried MSC-NGs that were kept, until rehydration, for one day at -20oC revealed no changes in the
membrane composition and orientation.

SUPPLEMENTAL EXPERIMENTAL PROCEDURES
Cells
Human bone marrow mesenchymal stem cells (MSCs) and human umbilical vein cord endothelial
cells (HUVECs) were purchased from Lonza™ (Basel, Switzerland). MSCs were cultured in
alpha-MEM (Sigma-Aldrich™, St. Louis, MO) supplemented with 5 ng/ml basic fibroblast growth
factor (bFGF, Peprotech, Rehovot, Israel). HUVECs were cultured in M199 (Biological Industries,
Beit Ha’Emek, Israel) supplemented with 10 ng/ml bFGF on plates pre-coated with 0.1% (w/v)
gelatin (Sigma-Aldrich™) for 3 h at 37oC. Human cancer cell-lines were purchased from the
ATCC (Manassas, VA): prostate cancer cells (PC3, #CRL-1435™) were grown in HAM/F-12
nutrient-mixture (Sigma-Aldrich™), breast cancer cells (MCF7, #HBT-22™), were grown in
high-glucose DMEM (Biological Industries), and non-small cell lung cancer cells (A549, #CCL-
185™) were grown in RPMI-1640 (Sigma-Aldrich™). All culture media were also supplemented
with 10% FBS (Gibco®), 1% Pen-Strep® solution and 0.4% Fungizone®, all purchased from Life
Technologies™ (Carlsbad, CA). PC3, MCF7 and A549 cells were authenticated by inoculation
into nude mice and assessment of their ability to establish subcutaneous tumors in the flank
validated by tumor size progression and histopathological analyses. HUVECs were authenticated,
prior to these experiments, by flow cytometry analyses for endothelial markers: CD44, CD105,
CD31 and vWf. Cultures were maintained at 37°C in a humidified incubator with 5% CO2.
Plasmids
pCMV-EGFP-C1 (pGFP, 4.7 kb), encoding for enhanced GFP protein (EGFP) under CMV
promoter, and kanamycin resistance, was purchased from Clontech, BD (Mountain View, CA) as
we published before.42 An expression plasmid for human PEX (pPEX) was cloned under CMV

promotor, as we have previously published, on a pTracer CMV/Bsd backbone (6 kb, Life
Technologies™) with ampicillin resistance.42
NG production
NGs were produced as we have previously published, with slight modifications.39 Briefly, human
bone marrow MSCs were harvested, washed with PBS and re-suspended in a hypotonic Tris-
Magnesium buffer (TM-buffer, pH 7.4, 4oC) containing 10 mM Tris and 1 mM MgCl2 (Sigma-
Aldrich™). Cells were homogenized at 22,000 rpm for 40 sec (IKA®, Taquara, RJ, Brazil) and
immediately after the homogenization, a sucrose (Sigma-Aldrich™) solution in TM-buffer (60%
w/v) was added, to a final concentration of 0.25M. The homogenized cells were then centrifuged
at 2400g for 15 min at 4°C. The supernatant was discarded and the resulting pellet, containing the
cell ghosts, was centrifuged and washed twice more with 0.25M sucrose in TM-buffer (pH 7.4).
The re-suspended pellet was sonicated for 5 sec at 27% amplitude using a VibraCell VCX750
(Sonics & Materials Inc., Newtown, CT) and centrifuged at 2400g for 15 min at 4°C. The pellet
was washed twice with 0.25M sucrose in TM-buffer pH 8.6 as before. To downsize the ghosts into
NGs, the re-suspended pellet, containing the ghosts, was sonicated for 2 min at 27% amplitude
and centrifuged at 800g for 15 min at 4°C. The pellet was discarded and the supernatant containing
the NGs was filtered through 0.45 μm syringe filters and ultra-centrifuged at 150,000g for 45 min
at 4°C. The resulting NG pellet was re-suspended in PBS. The NGs were then PEGylated, as we
published before 39, making the last re-suspension buffer an electroporation buffer containing:
25 mM KCl, 0.3mM KH2PO4, and 0.85 mM K2HPO4. The amount of phospholipids in the NG
samples was determined using a LabAssay™ phospholipid kit (Wako, Osaka, Japan).
NG loading
cDNA complexation with polyethylenimine was done by mixing the cDNA with linear
polyethylenimine (PEI 25 kDa, Polysciences Inc. Warrington, PA) in ultrapure water at different
molar N/P ratios (between the amine and the phosphate groups on the PEI and DNA, respectively),
and incubating them for 15 min at room temperature (RT) under gentle agitation. PEI:cDNA
complexes or naked cDNA were loaded into the NGs passively—by adding them to a final cDNA
concentration of 5 µg/ml into the buffer in which the ghosts are downsized to NGs—or actively,
by electroporation. For electroporation, naked or complexed cDNA was added to the NGs in an
electroporation buffer (25mM KCl, 0.3mM KH2PO4, 0.85mM K2HPO4) at different ratios ranging
from 0.25 to 2 cDNA-to-lipids (w/w). The NGs were then electroporated twice with a 10 sec delay
between pulses (2500V, 5ms) using an Eppendorf™ Multiporator® (Hamburg, Germany). cDNA
loading was measured using a StepOnePlus Real Time PCR system (Applied Biosystems, Foster
City, CA), according to the manufacturer’s protocol, with primers for the ORI uncoding region:
Forward: 5'-AGCAGAGCGCAGATACCAAA-3'; Reverse: 5'-
GCAGAGCGAGGTATGTAGGC-3'. pPEX copy number was determined against a calibration
curve.
NGs characterization
The size and zeta-potential of loaded and empty NGs were analyzed by number and intensity
correlation of dynamic light scattering (DLS), and zeta-potential analysis using a Zetasizer®
Nano-Series® (Malvern Instruments, Malvern-Worcestershire, UK). To assess cDNA
localization, empty NGs and NGs loaded with gold labeled pPEX were imaged by Cryo-TEM
(Philips CM120, 120 kV) using an Oxford CT-3500 Cryo-holder as we published before.39 Briefly,

pPEX was first labeled with biotin using the Mirus™ Label IT® kit (Madison, WI), according to
the manufacturer’s instructions. Then, biotin-pPEX was incubated over night at 4ºC in ultrapure
water with streptavidin-conjugated gold nanoparticles (5 nm, Cytodiagnostics Inc., Burlington,
ON) at a 1:1.5 (w/w) nano-gold to pPEX ratio. The gold labeled pPEX was purified by ethanol
precipitation, resuspended in ultrapure water and loaded into the NGs by electroporation as
mentioned above. To validate the NGs’ retention of MSC membrane proteins and asymmetry,
empty NGs and NG-pPEX were covalently adsorbed to the surface of Tosyl-activated M-280
Dynabeads™ (Life Technologies™) according to the Dynabeads™ manufacturer’s protocol,
replacing the conjugated proteins with NGs. NG-conjugated beads were analyzed by flow-
cytometry (FACS Calibur, BD™, San Diego, CA) for typical MSC markers against isotype
controls and un-conjugated beads using 1:100 APC labeled mouse anti-human CD29, CD44 or
CD90 (Abcam®, Cambridge, UK).
NG-pPEX cytotoxicity
The efficiency of NGs loading, by sonication or electroporation, with PEI-complexed or naked
pPEX was assessed using a functional bioactivity assay measuring the effect of loaded NGs on the
viability of PC3 cells, compared to the effect of naked pPEX, pPEX transfected using
Lipofectamine2000™, and NGs loaded with a non-therapeutic gene (pGFP). PC3 cells were
seeded in 24-well plates (1.5•105 cells/well) and allowed to recover overnight, after which different
treatments were administered for 6 h. All cultures treated with NGs were added with 8 µg of NGs
(as lipids) per well. The initial (nominal) amounts of pPEX or pGFP (as a non-therapeutic gene
control) used for the loading of the NGs, with or without complexations, were identical under all
loading methods (1 µg cDNA/µg lipids). The amount of pPEX added to the negative control wells

containing pPEX only (naked pPEX) was identical to the amount of pPEX that was carried by NGs
loaded with pPEX via electroporation (2.7 µg/well), which achieved the highest reduction in PC3
viability. The amounts of pPEX added to the positive control wells, which were transfected with
Lipofectamine 2000™ (life technologies™), were determined according to the manufacturer’s
protocol. Cell viability, relative to the untreated cells, was measured three days posttransfection
using the AlamarBlue™ assay and reagent (Life Technologies™), according to the manufacturer’s
protocol, and as we previously published.39 NGs loaded by electroporation with naked pPEX (i.e.,
without complexation) led to the highest cytotoxic effect toward PC3, which was comparable to
that achieved using Lipofectamine™, and were, therefore, selected for the continuation of our
studies.
NGs cellular uptake
The uptake of fluorescently labeled NGs by counterstained PC3 cells was evaluated using confocal
microscopy. PC3 cells were seeded on cover slips in 6-well plates (3•105 cells/well) and allowed
to recover overnight. Fluorescently labeled NGs were made from MSCs stained, prior to their
harvesting, with fluorescent lipophilic tracer DiI (2.5 mg/ml in DMSO, Life Technologies™)
mixed 1:2000 with the cells’ culture medium, incubated for 2 h, and washed twice with PBS. DiI
labeled NGs were added to the PC3 cell cultures in serum-free medium (40 µg lipids/well) and
incubated for up to 3 h. After different incubation times, the cover slips were removed, washed
with PBS and fixed with 4% PFA for 30 min at RT. The coverslips were then washed with PBS
twice more, incubated with 0.01 mg/ml Phalloidin-FITC (Sigma Aldrich™) in PBS (30 min, RT),
and counterstained with 2 µg/ml Hoechst (Life Technologies™) for 15 min at RT. The coverslips
were mounted with Fluoromount-G™ (SouthernBiotech, Birmingham, AL) and observed under
an LSM700 laser scanning inverted confocal microscope (Zeiss®, Oberkochen, Germany).
NG-pPEX transfection efficiency
NG-pPEX transfection efficiency of PC3 cells—in terms of pPEX uptake and PEX mRNA and
protein expression levels—were evaluated using Real-Time PCR, Real-Time RT-PCR, and ELISA
assay, respectively. PC3 cells were seeded in 24-well plates (1.5•105 cells/well) and allowed to
recover overnight. Naked pPEX (2.7 µg/well), NG-pPEX (8 µg lipids/well) delivering the same
amount of DNA, and empty NGs (same amount of lipids/well) were added to the cultured cells in
a serum-free medium and incubated for 6 h. To determine pPEX uptake, the cells were harvested
and DNA was extracted using the common phenol chloroform method.43 pPEX copy number was
determined using Real Time PCR against a calibration curve as mentioned above. To determine
PEX mRNA levels, cells were harvested 72 h posttransfection, homogenized, and treated with tri-
reagent (Sigma-Aldrich™) to extract the mRNA, according to the manufacturer’s instructions. The
mRNA was treated with DNAse (Roche, Mannheim, Germany) and reverse-transcribed in a PTC-
200 PCR cycler (MJ Research, Waltham, MA) using a qScript cDNA synthesis kit (Quanta
Biosciences, Gaithersburg, MD). PEX mRNA levels (normalized to GAPDH) were quantified by
PerfeCTa® SYBR® Green FastMix®, ROXTM (Quanta Biosciences) using a Real Time PCR, and
the results were analyzed using the StepOne software v2.2.2 (Applied Biosystems, Foster City,
CA). The following primers were used for pPEX detection: Forward: 5'-
AGATTGATGCGGTATACGAGGC-3'; Reverse: 5'-AGGGTGCTGGCTGAGTAGAT-3'. To
assess the amount of PEX secreted by transfected cells, the growth media of transfected cells was
collected 72 h posttransfection, and passed into a 96-well maxisorp plate for overnight incubation

at 4oC. The plate was then washed three times with 0.05% (v/v) Tween 20 (Sigma Aldrich™) in
PBS, and incubated with 5% (w/v) skimmed milk (Bio-Rad, Hercules, CA) in PBS for 1 hr at RT.
The plate was then washed three times with PBS and incubated with 1 µg/ml Rabbit anti-MMP2
(ab79781, Abcam®) in PBS for 1.5 h at RT. The plate was washed again, three times, and incubated
for 1.5 h at RT with the secondary antibody: anti-rabbit-HRP diluted 1:100,000 (Abcam®). Finally,
100 μl/well of the substrate (Tetramethylbenzidine, Life Technologies™) solution was added. The
reaction was stopped with 25 μl/well of 1N H2SO4, after color had developed. The absorbance was
measured at 450 nm. The results were plotted against a standard curve using MMP2 (Abcam®).
The amount of PEX was calculated and normalized to the cells’ viability and presented relative to
cells treated with naked pPEX.
NG-pPEX effect on the viability, proliferation and apoptosis of cancer cell
The effect of NG-pPEX on the viability, proliferation and apoptosis of various cancer cell lines
(PC3, MCF7 and/or A549), compared to naked pPEX and empty NGs, was followed for up to
seven days posttransfection and presented relative to the untreated cells. Cancer cell lines (PC3,
MCF7 and/or A549) were seeded in 96-well plates (1.5•104 cells/well) and allowed to recover
overnight. Naked pPEX (0.4 µg/well), NG-pPEX (1.3 µg lipids/well) carrying the same amount
of DNA, and empty NGs (same amount of lipids/well) were added to the cultured cells in serum-
free medium and incubated for 6 h. The medium was then replaced with complete serum containing
medium and the cells were cultured for up to seven days. Cell viability was followed up using the
AlamarBlue™ assay. Cell proliferation was evaluated using the Roche Cell Proliferation ELISA
BrdU kit (Mannheim, Germany), according to the manufacturer’s protocol. For the apoptosis
assays, PC3 cells were seeded in 24-well plates (1.5•105 cells/well) and allowed to recover

overnight. Naked pPEX (2.7µg/well), NG-pPEX (8 µg lipids/well) carrying the same amount of
DNA, and empty NGs (same amount of lipids/well) were added to the cultured cells in serum-free
medium and incubated for 6 h. The medium was then replaced with complete serum containing
medium and the cells were cultured for up to seven days. To determine the amount of apoptosis,
the cells were harvested and analyzed by flow-cytometry for Annexin-V labeling using a
MEBCYTO apoptosis kit (Medical & Biological Ltd., Nagoya, Japan).
The paracrine effect of transfected PC3 cells
The paracrine effect of PC3 cells, transfected with NG-pPEX, on the migration and proliferation
of endothelial cells was measured following incubation with conditioned-media derived from
transfected or control PC3 cells (untreated or treated with empty NGs or naked pPEX). PC3 cells
were seeded in 24-well plates (1.5•105 cells/well) and allowed to recover overnight. Naked pPEX
(2.7 µg/well), NG-pPEX (8 µg lipids/well) carrying the same amount of DNA, and empty NGs
(same amount of lipids/well) were added to the cultured cells in serum-free medium and incubated
for 6 h. The medium was then replaced with complete serum containing medium. HUVECs were
seeded in 24-well plates (1.8•105 cells/well) and allowed to recover overnight. One linear scratch
(per well) was drawn in the cells’ monolayer the next day. The wells were washed to remove the
scarped cells and the stripped area was marked and imaged using an Eclipse TE 2000S inverted
microscope (Nikon, Tokyo, Japan) at x20 magnification and captured using NIS-elements software
(Nikon). Fresh conditioned media was collected from the above mentioned PC3 cells transfected
with NG-pPEX, 72 h posttransfection, or PC3 cells incubated with empty NGs or naked pPEX,
and mixed 1:1 (v/v) with the HUVECs medium. The effect of the different conditioned media on
HUVECs migration—i.e., the rate in which they close the stripped gap—was microscopically

estimated for up to 24 h with sampling points at 0, 4, 8, 12 and 24 h. HUVECs proliferation was
measured after three days using the BrdU assay as mentioned above.
In vivo studies
All animal experiments were performed in compliance with the Council on Animal Experiments,
and the Israel Ministry of Health guidelines for the care and use of laboratory animals. Approval
was received from the Animal Ethics Committee (No.: IL-064-05-13). Animals were purchased
from Harlan Laboratories (Jerusalem, Israel).
In vivo safety: Off-target transfection
The risk of off-target transfection was assessed; 8-week-old male C57BL mice were intravenously
(I.V.) administered (into the tail vein) with PBS (control), naked pGFP (10 µg/mouse) or 15 µg
NGs (lipids) per mouse loaded by electroporation with pGFP (NG-pGFP) and carrying the same
amount of cDNA per mouse. Mice were sacrificed one or seven days postadministration and their
blood filtering organs were harvested, dissociated into single cells, and analyzed by FACS for GFP
expression, as we have previously published.39

In vivo safety: Toxicity
To evaluate the Maximal Tolerated Dose, 8-week-old C57BL mice were weighed and
administered (I.V.) with empty NGs in doses ranging from 0.5 to 6.0 mg (lipids) per kg body
weight—roughly 15 to 180 µg NGs per mouse. Preliminary studies have shown that dose
concentrations above 0.3 mg/ml are too viscous, and therefore, the dose concentration was kept at
0.15 mg/ml in PBS. Mice were administered up to six times with a maximal volume of 200 µl per
bolus, with a one-hour delay between injections. Signs of acute toxicities were followed for up to
24 h postadministration. The animals’ well-being and weights were followed for up to one week
postadministration. Animals were sacrificed one and seven days postadministration and their blood
and blood filtering organs were harvested. Complete blood counts were tested by American
Medical Laboratories (A.M.L., Herzliya, Israel) using the Sysmex KX-21N™ Automated
Hematology Analyzer (Kobe, Japan) according to the manufacturer’s instruction. Blind
pathological analyses of harvested organs were carried out by the Weizmann Institute Pathology
Center (Rehovot, Israel).
In vivo safety: Immunogenicity
To assess primary and secondary immune responses, 8-week-old C57BL mice were weighed and
divided into three groups: a control group, twice administered with 100 µl PBS on Days 0 and 7;
single dose group, administered with PBS on Day 0 and with empty NGs (0.5 mg/kg ≈ 15
µg/mouse) on Day 7; and multiple dose group, twice administered with empty NGs (0.5 mg/kg)
on both Days 0 and 7. Signs of acute toxicities, animal well-being, and weights were followed for
up to one week postadministration revealing no adverse effects. Animals were sacrificed one and
seven days after the last administration (i.e., on Days 8 and 14) and their blood and inguinal lymph

nodes were harvested. Complete blood counts and blood levels of urea, albumin, alkaline
phosphatase, AST and ALT were tested by A.M.L. The lymph nodes’ mRNA levels of the pro-
inflammatory cytokines TNF-α and IL-1β were analyzed by Real Time PCR as we published
before.39
In vivo efficacy: Subcutaneous prostate cancer model
Six-week-old male athymic nude mice were inoculated subcutaneously in the flank with 106 PC3
cells. Tumors volumes were measured and calculated according to the following correlation:
𝑉𝑉𝑉𝑉𝑉𝑉𝑉𝑉𝑉𝑉𝑉𝑉 = 𝐿𝐿𝑉𝑉𝐿𝐿𝐿𝐿ℎ𝑡𝑡 ∙ 𝑊𝑊𝑊𝑊𝑊𝑊𝑡𝑡ℎ2 ∙ 0.5, as previously published.41 When tumors reached an average
volume of 75 mm3, animals were randomly divided into four groups: Untreated control, mice
injected (I.V) with naked pPEX (10 µg cDNA/mice), mice injected with empty NGs (15 µg
lipids/mice) and mice injected with NG-pPEX (15 µg lipids carrying 10 µg DNA per mice). To
assess NG-pPEX targeting selectivity, the tumors and blood filtering organs (spleen, kidneys, liver
and lungs) of mice treated with NG-pPEX were harvested 2 weeks postadministration, dissociated
into single cells and analyzed by FACS for human CD90 (compared to untreated animals), which
indicates NG binding, as we have previously published.39 To determine NG-pPEX effect on tumor
pathology and PEX expression, tumors were subjected to pathological (H&E),
immunohistochemical (IHC), and immunofluorescent analyses for blood vessel density, apoptosis,
proliferation, and PEX expression as we previously published.39, 42 Briefly, tumors were harvested,
sectioned into 10 µm slices and subjected to pathological (H&E) and immunohistochemical (IHC)
analyses for blood vessel density, apoptosis and proliferation using anti-CD31, anti-caspase-3, and
anti-Ki67, respectively. IHC indices were calculated from the micrographs (n>10 samples/group)
using the DAB algorithm on ImageJ based Fiji software. To validate PEX expression, tumor slices
were perforated with 1% (v/v) TritonX100 (Bio-Lab, Jerusalem, Israel) in PBS for 10 min at RT,
and then incubated with 1.5 µg/mL primary polyclonal rabbit anti-human MMP2 C-terminal
(Abcam®) overnight at 4ºC. The slides were then washed with PBS and incubated with Alexa Fluor
568-conjugated secondary polyclonal donkey anti-rabbit IgG (Life Technologies™) for 1 hr at RT.
The slides were counterstained with 2 µg/ml Hoechst for 10 min at RT and imaged using an Eclipse
TE-2000S inverted epi-fluorescent microscope (Nikon). To assess the effect of multiple
administrations, NG-pPEX was administered as before—singly, when tumors reached an average
volume of 75 mm3 (Day 0), or three times on Days 0, 7, and 14. Mice were sacrificed when
reaching a tumor volume of 1000 mm3. Tumor sizes and animals’ survival were followed and
compared to untreated tumor bearing mice.
In vivo efficacy: Metastatic NSCLC model
Six-week-old male athymic nude mice were tail vain injected with 2.5•106 A549 cells. Metastatic
progression was followed weekly by Aspect M2 – 1 Tesla MRI machine (Aspect Imaging Ltd.,
Shoham, Israel) using the following operation parameters: Slices=17; Slice Thickness=0.9;
Gap=0.1; FOV=50; Matrix=160*160; TR=2750; TE=60; Excitations=4; and Averages=4. Fifty
days post inoculation, the animals were administered (I.V) with fluorescent DiI labeled NGs (0.5
mg/kg), produced as mentioned above. One week post administration, the animals’ lungs and other
blood filtering organs were harvested, dissociated into single cells, and analyzed by FACS for NG
uptake. Specific NG uptake was calculated as the percent of DiI-positive cells in the different
organs harvested from treated tumor bearing mice relative to the background of untreated tumor
bearing mice. Nonspecific uptake was calculated as the percent of DiI-positive cells in the different
organs harvested from treated non-tumor-bearing animals relative to the background of untreated

non-tumor-bearing mice. To assess their therapeutic efficacy in this model, NG-pPEX were
administered 50 days post tumor inoculation with three doses (once per week, 0.5 mg/kg carrying
about 10 µg pPEX/mouse/dose). Mice were sacrificed one week after the last administration and
their lungs were weighed and compared to lungs harvested from untreated tumor-bearing animals
and non-tumor-bearing mice.
Statistics
Results are presented as the mean±SD (standard deviation) or mean±SE (standard error of the
mean), for the in vivo trials of at least triplicates. Statistical significance in the differences of the
means was evaluated by two-tailed t-test. Analysis of variance (ANOVA) was used to test the
significance of differences among groups using JMP 6 software (SAS™, Cary, NC). Statistical
significance indicators: * p<0.05; ** p<0.01; *** p<0.001; **** p<0.0001.

REFERENCES
1. Wang, S.; Qu, X.; Zhao, R. C. Journal of hematology & oncology 2012, 5, 19.
2. Kim, N.; Cho, S. G. The Korean journal of internal medicine 2013, 28, 387-402.
3. Zhang, T.; Lee, Y. W.; Rui, Y. F.; Cheng, T. Y.; Jiang, X. H.; Li, G. Stem cell research &
therapy 2013, 4, 70.
4. Hass, R.; Otte, A. Cell communication and signaling : CCS 2012, 10, 26.
5. Caplan, A. I. J. Cell. Physiol. 2007, 213, 341-7.
6. Griffin, M. D.; Ryan, A. E.; Alagesan, S.; Lohan, P.; Treacy, O.; Ritter, T. Immunology
and cell biology 2013, 91, 40-51.
7. Ankrum, J.; Karp, J. M. Trends in molecular medicine 2010, 16, 203-9.
8. Beggs, K. J.; Lyubimov, A.; Borneman, J. N.; Bartholomew, A.; Moseley, A.; Dodds, R.;
Archambault, M. P.; Smith, A. K.; McIntosh, K. R. Cell transplantation 2006, 15, 711-21.
9. Roorda, B. D.; Elst, A.; Boer, T. G.; Kamps, W. A.; de Bont, E. S. Cancer investigation
2010, 28, 526-34.
10. Khakoo, A. Y.; Pati, S.; Anderson, S. A.; Reid, W.; Elshal, M. F.; Rovira, II; Nguyen, A.
T.; Malide, D.; Combs, C. A.; Hall, G.; Zhang, J.; Raffeld, M.; Rogers, T. B.; Stetler-Stevenson,
W.; Frank, J. A.; Reitz, M.; Finkel, T. The Journal of experimental medicine 2006, 203, 1235-47.
11. Roorda, B. D.; ter Elst, A.; Kamps, W. A.; de Bont, E. S. Critical reviews in
oncology/hematology 2009, 69, 187-98.
12. Bergfeld, S. A.; DeClerck, Y. A. Cancer metastasis reviews 2010, 29, 249-61.
13. Martin, F. T.; Dwyer, R. M.; Kelly, J.; Khan, S.; Murphy, J. M.; Curran, C.; Miller, N.;
Hennessy, E.; Dockery, P.; Barry, F. P.; O'Brien, T.; Kerin, M. J. Breast cancer research and
treatment 2010, 124, 317-26.

14. Kauser, K.; Zeiher, A.-M., Bone marrow-derived progenitors. Springer: 2007; Vol. 180.
15. Traggiai, E.; Volpi, S.; Schena, F.; Gattorno, M.; Ferlito, F.; Moretta, L.; Martini, A. Stem
cells 2008, 26, 562-9.
16. Ren, G.; Zhang, L.; Zhao, X.; Xu, G.; Zhang, Y.; Roberts, A. I.; Zhao, R. C.; Shi, Y. Cell
stem cell 2008, 2, 141-50.
17. Zhang, B.; Liu, R.; Shi, D.; Liu, X.; Chen, Y.; Dou, X.; Zhu, X.; Lu, C.; Liang, W.; Liao,
L.; Zenke, M.; Zhao, R. C. Blood 2009, 113, 46-57.
18. Son, B. R.; Marquez-Curtis, L. A.; Kucia, M.; Wysoczynski, M.; Turner, A. R.; Ratajczak,
J.; Ratajczak, M. Z.; Janowska-Wieczorek, A. Stem cells 2006, 24, 1254-64.
19. Steingen, C.; Brenig, F.; Baumgartner, L.; Schmidt, J.; Schmidt, A.; Bloch, W. Journal of
molecular and cellular cardiology 2008, 44, 1072-84.
20. Ruster, B.; Gottig, S.; Ludwig, R. J.; Bistrian, R.; Muller, S.; Seifried, E.; Gille, J.;
Henschler, R. Blood 2006, 108, 3938-44.
21. Yilmaz, G.; Vital, S.; Yilmaz, C. E.; Stokes, K. Y.; Alexander, J. S.; Granger, D. N. Stroke;
a journal of cerebral circulation 2011, 42, 806-11.
22. Elola, M. T.; Chiesa, M. E.; Alberti, A. F.; Mordoh, J.; Fink, N. E. Journal of biomedical
science 2005, 12, 13-29.
23. Gieseke, F.; Bohringer, J.; Bussolari, R.; Dominici, M.; Handgretinger, R.; Muller, I. Blood
2010, 116, 3770-9.
24. Luz-Crawford, P.; Noel, D.; Fernandez, X.; Khoury, M.; Figueroa, F.; Carrion, F.;
Jorgensen, C.; Djouad, F. PloS one 2012, 7, e45272.
25. Gu, Y. Z.; Xue, Q.; Chen, Y. J.; Yu, G. H.; Qing, M. D.; Shen, Y.; Wang, M. Y.; Shi, Q.;
Zhang, X. G. Human immunology 2013, 74, 267-76.
26. Nasef, A.; Mathieu, N.; Chapel, A.; Frick, J.; Francois, S.; Mazurier, C.; Boutarfa, A.;
Bouchet, S.; Gorin, N. C.; Thierry, D.; Fouillard, L. Transplantation 2007, 84, 231-7.
27. Shiroishi, M.; Tsumoto, K.; Amano, K.; Shirakihara, Y.; Colonna, M.; Braud, V. M.; Allan,
D. S.; Makadzange, A.; Rowland-Jones, S.; Willcox, B.; Jones, E. Y.; van der Merwe, P. A.;
Kumagai, I.; Maenaka, K. Proceedings of the National Academy of Sciences of the United States
of America 2003, 100, 8856-61.
28. Simon, I.; Zhuo, S.; Corral, L.; Diamandis, E. P.; Sarno, M. J.; Wolfert, R. L.; Kim, N. W.
Cancer research 2006, 66, 1570-5.
29. Ma, S.; Xie, N.; Li, W.; Yuan, B.; Shi, Y.; Wang, Y. Cell Death Differ 2014, 21, 216-225.
30. Ren, G.; Zhao, X.; Zhang, L.; Zhang, J.; L'Huillier, A.; Ling, W.; Roberts, A. I.; Le, A. D.;
Shi, S.; Shao, C.; Shi, Y. Journal of immunology 2010, 184, 2321-8.
31. Pietila, M.; Lehtonen, S.; Tuovinen, E.; Lahteenmaki, K.; Laitinen, S.; Leskela, H. V.;
Natynki, A.; Pesala, J.; Nordstrom, K.; Lehenkari, P. PloS one 2012, 7, e31671.
32. Shen, Q.; Rahn, J. J.; Zhang, J.; Gunasekera, N.; Sun, X.; Shaw, A. R.; Hendzel, M. J.;
Hoffman, P.; Bernier, A.; Hugh, J. C. Molecular cancer research : MCR 2008, 6, 555-67.
33. Gregory, L. A.; Ricart, R. A.; Patel, S. A.; Lim, P. K.; Rameshwar, P. Current cancer
therapy reviews 2011, 7, 176-183.
34. Zhao, D.-H.; Zhu, J.; Wang, W.-B.; Dong, F.; Zhang, Q.; Fan, H.-W.; Zhang, J.-Z.; Wang,
Y.-M. The Scientific World Journal 2014, 2014, 10.
35. Tsukamoto, S.; Honoki, K.; Fujii, H.; Tohma, Y.; Kido, A.; Mori, T.; Tsujiuchi, T.; Tanaka,
Y. Int. J. Oncol. 2012, 40, 163-9.
36. Mattila, P.; Majuri, M. L.; Renkonen, R. International journal of cancer. Journal
international du cancer 1992, 52, 918-23.

37. Kim, Y. J.; Yu, J. M.; Joo, H. J.; Kim, H. K.; Cho, H. H.; Bae, Y. C.; Jung, J. S. Pflugers
Archiv : European journal of physiology 2007, 455, 283-96.
38. Lee, H. J.; Choi, B. H.; Min, B. H.; Park, S. R. Arthritis and rheumatism 2009, 60, 2325-
32.
39. Toledano Furman, N. E.; Lupu-Haber, Y.; Bronshtein, T.; Kaneti, L.; Letko, N.; Weinstein,
E.; Baruch, L.; Machluf, M. Nano Lett. 2013, 13, 3248-55.
40. Song, C.; Xiang, J.; Tang, J.; Hirst, D. G.; Zhou, J.; Chan, K. M.; Li, G. Human gene
therapy 2011, 22, 439-49.
41. Lee, W. Y.; Zhang, T.; Lau, C. P.; Wang, C. C.; Chan, K. M.; Li, G. Cytotherapy 2013, 15,
1484-97.
42. Duvshani-Eshet, M.; Benny, O.; Morgenstern, A.; Machluf, M. Mol Cancer Ther 2007, 6,
2371-82.
43. Ausubel, F. M., Short protocols in molecular biology : a compendium of methods from
Current protocols in molecular biology. 5th ed.; Wiley: New York, 2002.