Embed Size (px)
Citation preview

Nanofluidics for Single Molecule DNA Sequencing
by
Padmini Krishnakumar
A Dissertation Presented in Partial Fulfillment
of the Requirements for the Degree
Doctor of Philosophy
Approved June 2013 by the
Graduate Supervisory Committee:
Stuart Lindsay, Chair
Sara Vaiana
Jin He
Kevin Schmidt
ARIZONA STATE UNIVERSITY
August 2013

i
ABSTRACT
After a decade of efforts, accurate and affordable DNA sequencing continues to
remain an important goal in current research landscape. This thesis starts with a brief
overview of the recent updates in the field of DNA sequencing technologies followed by
description of the nanofluidics route to single molecule DNA detection. Chapter 2
presents discusses carbon nanotube(CNT) based nanofluidics. The fabrication and DNA
sensing measurements of CNT forest membrane devices are presented. Chapter 3 gives
the background for functionalization and recognition aspects of reader molecules.
Chapter 4 marks the transition to solid state nanopore nanofluidics. The fabrication of
Imidazole functionalized nanopores is discussed. The Single Molecule detection results
of DNA from Palladium nanopore devices are presented next. Combining chemical
recognition to nanopore technology, it has been possible to prolong the duration of single
molecule events from the order of a few micro seconds to upto a few milliseconds.
Overall, the work presented in this thesis promises longer single molecule detection time
in a nanofludic set up and paves way for novel nanopore- tunnel junction devices that
combine recognition chemistry, tunneling device and nanopore approach.

ii
For my family and friends

iii
ACKNOWLEDGMENTS
First and foremost, I would like to take this opportunity to thank my advisor Dr. Stuart
Lindsay for his constant guidance and support. His passion for science and drive for
excellence have been truly inspirational. I would also like to thank my committee
members Dr. Sara Vaiana, Dr. Jin He and Dr. Kevin Schmidt for their encouragement
and insightful comments. Special thanks to Dr. Peiming Zhang , Dr.Jin He and Dr. Brett
Gyarfas for mentoring me through several projects. Thanks to Dr.Pei Pang and Dr.Di Cao
for all the inputs related to cleanroom fabrication. I’d like to also thank collaborators Dr.
Sergei Smirnov and Dr. Predrag Krjstic for all the valuable discussions. Dr.Ashley Kibel,
Dr. Shreya Bhattacharya, Dr.Shuo Huang, Dr.Shuai Chang, Weisi Tsong, Dr.Qiang Fu,
Dr.Parminder Kaur, Suman Sen, Jong-One Im and Dr.Brian Ashcroft – Thank you for
making the whole process an enriching experience. I also really appreciate Maggie, Mike
and Steve for all your help – from ordering chemicals and upgrading computers to your
constant efforts to keep the fume-hoods safe.
It has been a long journey, and I owe it to my family for making through. I would like to
take this moment to express my gratitude to my parents for their unconditional love, to
my sister for cheering me along the way and to my husband Vineeth for all the loving
support, encouragement and most of all, the cooperation to endure my irregular working
hours during my experiments. Special thanks to my dear daughter Saishree, for being my
sunshine even on the darkest of days. Finally, I’d like to conclude by offering this effort
to the Divine Light that has been my constant companion through life.

iv
TABLE OF CONTENTS
Page
LIST OF TABLES ............................................................................................................... viii
LIST OF FIGURES ................................................................................................................ ix
CHAPTER
1 INTRODUCTION ............................................................................................... 1
1.1 Introduction to DNA Sequencing ............................................................. 1
1.1.1 DNA Structure .......................................................................... 1
1.1.2 Significance of DNA Sequencing ............................................. 4
1.2 Progress in Sequencing Techniques ......................................................... 5
1.2.1 Sanger Method .......................................................................... 6
1.2.2 Next(Second) Generation Sequencing ...................................... 9
1.2.3 Third Generation Sequencing .................................................. 11
1.3 Nanofluidics as a route to DNA Sequencing .......................................... 13
1.3.1 Introduction to Nanopores ....................................................... 13
1.3.2 Biological and Synthetic Nanopores ....................................... 14
1.3.3 Carbon Nanotubes .................................................................... 18
1.4 Thesis Summary .................................................................................. 21
1.5 References ............................................................................................ 22
2 CARBON NANOTUBE BASED NANOFLUIDICS
FOR DNA SENSING ........................................................................................ 28
2.1 Carbon Nanotubes – Structure and Properties .................................... 28
v
CHAPTER Page
2.1.1 Physical Structure of Carbon Nanotubes ............................... 28
2.1.2 Electronic Structure of Carbon Nanotubes ............................. 31
2.2 Why CNT membrane nanofluidics ...................................................... 32
2.3 Synthesis of CNT Membranes ............................................................. 34
2.3.1 Vertically Aligned CNT Forest Growth ................................. 34
2.3.2 SEM, TEM Characterization ................................................. 35
2.3.3 Parylene Deposition and Membrane Fabrictaion ................... 37
2.4 CNT Membrane measurements ........................................................... 39
2.4.1 DNA and Nanoparticle Transport .......................................... 40
2.4.2 Chemical Modification Effects on Transport ........................ 48
2.5 Conclusions ......................................................................................... 50
2.6 References ........................................................................................... 52
3 DNA BASE RECOGNITION .......................................................................... 55
3.1 Self – Assembled Monolayer Technique ............................................. 55
3.2 Base Differentiation Mechanism .......................................................... 58
3.2.1 Recognition Tunnelling ........................................................... 58
3.2.2 Imidazole-Universal Reader ................................................... 61
3.3 Imidazole Functionalization on Pd ....................................................... 64
3.4 References ........................................................................................... 67
4 FUNCTIONALIZED NANOPORES FOR DNA ANALYSIS ...................... 70

vi
CHAPTER Page
4.1 Palladium Electrode Fabrication ............................................................ 70
4.1.1 Electron Beam Lithography .................................................... 70
4.1.2 Fabrication Protocol ................................................................ 72
4.2 Nanopore Fabrication ............................................................................. 73
4.2.1 Methods of Nanopore Synthesis ............................................. 74
4.2.2 TEM Drilling Protocol ............................................................ 77
4.3 Experimental Set up ................................................................................ 80
4.3.1 Flow Cell Assembly ................................................................ 80
4.3.2 Wetting of Nanopore ............................................................... 84
4.4 Nanopore Theory .................................................................................... 86
4.4.1 Resistive Sensing Technique .................................................. 86
4.4.2 Ionic and Biomolecular transport............................................ 89
4.5 DNA Translocation Experiments ........................................................... 91
4.5.1 Effect of Functionalization ...................................................... 91
4.5.2 Positive control with 1-Octanethiol ........................................ 94
4.5.3 Models for slowing translocation ........................................... 97
4.5.4 Comparison of predicted models with experimental
data ................................................................................................... 101
4.6 Theoretic Calculations ........................................................................... 104
4.7 Conclusions & Discussions ................................................................... 108
4.8 References .............................................................................................. 101

vii
CHAPTER Page
5 SUMMARY ...................................................................................................... 113
5.1 Conclusions ............................................................................................ 113
5.2 Future work ............................................................................................ 114
5.3 References .............................................................................................. 117
APPENDDIX .............................................................................................................................
A. Co-author Approval .................................................................................................. 118
B. supplemental information for chapter 2 ................................................................... 120
C. supplemental information for chapter 4 ................................................................... 122

viii
LIST OF TABLES
Table Page
3.1 Ellipsometry result for Imidazole functionalized palladium surface . 65
3.2 XPS data for Imidazole functionalized palladium surface ................. 66
3.3 Wettability data for Imidazole functionalized palladium surface .... 67
4.1 Estimated hydrodynamic radii and Stokes diffusion coefficients in
Coulter counters and nanopores .......................................................... 88
4.2 Dissociation parameters from DFS data in literature ....................... 100
4.3 Comprison of exponents .................................................................... 102

ix
LIST OF FIGURES
Figure Page
1.1 Block Schematic of DNA Structure ................................................... 2
1.2 Chemical Bonding in DNA ................................................................. 3
1.3 Sanger Method of Sequencing ............................................................ 7
1.4 Graph of trend in estimated costfor sequencing a complete human
genome ............................................................................................... 10
1.5 Protein and solid state nanopores for DNA analysis ........................ 17
1.6 Ion current signals for DNA translocation......................................... 20
2.1 Schematic illustration of SWCNT chirality ...................................... 30
2.2 Schematic of integrating array of CNTs within STM set up for
sequencing .......................................................................................... 33
2.3 SEM and TEM Imagesfor characterization ....................................... 36
2.4 MWCNT forest characterization ...................................................... 38
2.5 Diagram of ionic current set up ........................................................ 39
2.6 Ionic conductance measurements ..................................................... 41
2.7 Transport of small molecules ............................................................ 44
2.8 Ionic conductance comparison ........................................................... 46
2.9 U.V. Spectra for DNA and Au nanoparticles ................................... 48
2.10 Effect of chemical modification on transport ................................. 50
3.1 A SAM molecule ................................................................................ 56
3.2 Schematic of Self-assembled monolayer growth mechanism ......... 57
3.3 Recognition Tunneling ...................................................................... 60

x
Figure Page
3.4 Nucleotide differentiation in STM .................................................... 61
3.5 Chemical structures of reader molecules .......................................... 63
3.6 Comparison of Palladium and Gold ................................................. 64
4.1 Schematic of Lithography principle .................................................. 71
4.2 The optical image of SiN membrane chip with gride of markers .... 73
4.3 The schematic of fabrication steps leading to deposition of
palladium layer .................................................................................. 74
4.4 TEM Image of a sub-5nm nanopore .................................................. 79
4.5 Cross-linking in PDMS ..................................................................... 81
4.6 The PDMS flow cell assembly ......................................................... 82
4.7 Conductance vs Concentration .......................................................... 85
4.8 Conductance change on DNA addition ............................................ 86
4.9 Some examples of biological and synthetic nanopores .................... 87
4.10 Effect of functionalization on translocation .................................... 93
4.11 Molecular structure of Octanethiol and Imidazole ........................... 94
4.12 Octanethiol vs Imidazole functionalization results ......................... 96
4.13 The energy landscape for a transition from bound to unbound state 98
4.14 Fits of translocation time as a function of voltage ......................... 101
4.15 Translocation time as a function of chain length for different voltages
........................................................................................................... 102
4.16 Capture rate change with surface change and molecular length .... 103
4.17 The volume forces in a combined pore .......................................... 107

xi
Figure Page
4.18 Fluid velocity in Silicon Nitride and Palladium coated Silicon Nitride
pores ................................................................................................ 107
5.1 Planar Junction ................................................................................ 115
5.2 Stacked Junction .............................................................................. 116
S-1 Protocol for graphene growth using Nickel catalyst ...................... 121
S-2 Raman spectra indicating presence of multilayered graphene ...... 121
S-3 Methods to control DNA access to the pore .................................. 123
S-4 I-V curves for plain Pd nanopore ................................................... 124

1
1. INTRODUCTION
1.1 INTODUCTION TO DNA SEQUENCING
Deoxyribonucleic acid (DNA) is a molecule that forms the basis for life on Earth. It
contains the genetic blue print that is vital for the development and function of almost
every living organism on earth, with the exception of some viruses that use
RNA(ribonucleic acid) for their genome. In 1869, DNA was discovered, when Swiss
medical researcher Friedrich Miescher isolated nuclein1 (or what we know as nucleic
acids today) for the first time in history.2 Ever since then, numerous studies have
revolved around this molecule and over the course of time, it has been experimentally
established that genetic coding is universal – i.e. it is common to all living organisms.
DNA sequencing thus, could be defined as the process that extracts the corresponding
genetic information from DNA of the respective organism.
1.1.1 DNA Structure
The structure of DNA consists of phosphate backbone that forms the connecting link
between chains of 2'-deoxy-D-ribose (5 member sugar rings) (see Figure 1.1). To each
sugar ring is attached one of four heterocyclic nitrogen compounds (known as bases)-
Adenine, guanine, thymine and cytosine. The first two bases belong to the family of
substituted purines, while the other two are substituted pyrimidines. Adenine binds with
thymine forming two hydrogen bonds while guanine binds to cytosine forming three
hydrogen bonds. Due to this reliable Hydrogen bonding, two complimentary strands of
single stranded DNA (ssDNA) when brought together attach well to form stable double
stranded DNA helix.

2
Figure 1.1 Simple block schematic explaining the DNA structure. (a) The phosphate
group linking sugars to form the sugar-phosphate backbone. (b) three nucleotides, with
their sugar(S), phosphate(P) and base (B) components. (c) DNA double helix with each
vertical line representing each base pair. The diameter of the double helix is 20Å.
(d)Complementary strands when separated – showing a nucleotide. The width of each
nucleotide is 6 Å.3
The detailed chemical structures and bonding are shown in Figure 1.2. The Hydrogen
bonding pairs are referred to as Watson Crick pairs, named after Watson and Crick who
first suggested the double helix model for DNA in 1953.4,5
Figure 1.2a shows the carbons on the sugar ring labeled with a prime symbol, to
distinguish them from the carbons in the bases. From the structure, it is evident that

3
single stranded DNA has two different ends, the 5' end and the 3' end. In double stranded
DNA, the complementary DNA strands are bound together with opposing ends. The
orientation of the strand plays an important factor in the processes that lead to protein
assembly, as DNA is only read from the 5' end to the 3' end.
A base when attached to 2'-deoxy-D-ribose (the sugar ring in DNA) is referred to as a
nucleoside. The nucleosides are adenosine, guanosine, cytidine and thymidine
respectively. When a nucleoside is bound to a phosphoric acid, either at the 5' or 3'
position, it is called a nucleotide.
Figure 1.2 Chemical bonding in DNA. (a) Molecular orientation of ssDNA strand. (b)
Individual Bases of DNA (c) Hydrogen bonding between base pairs.6

4
Depending on the position of the phosphate group (5' or 3'), the form of phosphate
(mono, di or tri-phosphate) and type of nucleoside, the nucleotide is named accordingly.
For instance, adenosine bonded at the 5' position to a triphosphate is referred to as
adenosine 5'-triphosphate (ATP). ATP plays key role as energy carrier for cellular
processes.
1.1.2 Significance of DNA Sequencing
In the cell, DNA codes the information for proteins. Just as the four bases form the
alphabets for language of nucleic acids, 20 amino acids form the alphabets for the
language of proteins. DNA is translated into another biopolymer called ribonucleic acid
(RNA). For translation to occur, the double strand of DNA has to be unwound. Once the
DNA has been unwound, one of the strands, referred to as the template or antisense-
strand, is read from the 3' end and complementary bases of RNA bind to the DNA and
are linked together. The resulting strand of RNA contains the exact same information as
is contained in the DNA since the strand is complementary. This RNA strand is then able
to move outside of the cell nucleus and play one of several vital roles in protein synthesis.
Proteins serve many vital functions in living systems, and thus, the DNA that codes for
them is an important part of the cell. They are involved in virtually all cell functions.
Each protein within the body has a specific function. Some proteins are involved in
structural support, while others are involved in bodily movement, or in defense against
germs. Furthermore, protein generation and regulation is necessary for maintaining

5
optimal health. For this reason, sequencing of DNA has, and continues, to play an
important role in biological sciences.
Clinically, there are thousands of rare genetic diseases, ranging from the widely-known
(such as Huntington’s disease, an adult-onset brain disorder) to the obscure (such as
fibrodysplacia ossificans progressiva , where the patient’s muscles slowly get replaced
by bones). While each of these diseases may be rare, collectively they cause a lot of
suffering. Single-gene disorders affect four out of every thousand live births and account
for more than 10% of paediatric hospital admissions.7 Genome sequencing, especially
when coupled with the need to unravel mutations for rare genetic diseases, assumes a
goal far more significant than just academic interest. Thus the ability to sequence the
human genome at a fraction of the current cost and time could potentially lead to
detection and prevention of future diseases as well as improve the implementation of
individualized medical treatment.
1.2 PROGRESS IN SEQUENCING TECHNOLOGIES
The first leap of advance in sequencing occurred in 1975 when Sanger and Coulson
discovered the chain termination method.8 This marked the beginning of First –
generation sequencing. Other technologies included in this time period are chemical
method proposed by Maxam and Gilbert in 1976-77. 9
The Sanger technique achieved sequencing of the first genome, bacteriophage ΦΧ 174,
which is 5375 bases in length. Decades later, four-color fluorescent10
Sanger sequencing
(each color corresponds to each base) was still a part of the first human genome sequence
effort– a project that involved great cost and decade long human effort. Sanger method

6
was, and continues to be in use in some form. Hence, sequencing history without a brief
description of this method would be incomplete.
1.2.1 Sanger Method
First, a reaction mix is prepared by putting together template DNA, free nucleotides, an
enzyme and a DNA ‘primer’ – a small piece of single stranded DNA which is about 20-
30 nucleotides long and can hybridize to one strand of the template DNA. The enzyme is
usually a variant of Taq polymerse. The free nucleotides are labeled either radioactively
or by attaching fluorescent tags.
First, the double stranded DNA is heated so as to break the Hydrogen bonds that bind the
strands together, and this causes them to separate into single strands. The primer attaches
to the strand at some spot after which the polymerase begins to elongate the primer. This
process, if allowed to go complete will result in a DNA strand that’s identical to the
template DNA we began with. So, if we begin with hundred strands of template DNA, on
completion, we would have hundred new copies of one of the strands of the template.
In the reaction mixture are also present a small amount of chain terminators or
Dideoxynucleotides. These nucleotides are very similar to regular DNA nucleotides
except that on their sugar ring, the third Carbon from base has just Hydrogen instead of
the usual Hydroxyl (-OH) group. So, if instead of a regular nucleotide, a
Dideoxynucleotide happens to attach to the growing primer strand, then, nucleotides
cannot be added after it as there is no -OH group for bonding. Thus adding a
Dideoxynucleotide leads to chain termination.

7
Figure 1.3 (a) The first step shows the separation of double stranded DNA into
single strands. The second step shows the attaching of primer to the template and
the elongation of template in the presence of DNA polymerase. (b) The
Dideoxynucleotide has a Hydrogen instead of a Hydroxyl group on the third
Carbon atom in the sugar ring. This causes it to be a chain terminator. (c)
Replication performed in the presence of Dideoxy-T (d) Electrophoresis on gel –
showing an illustration of the colored bands representing the positions of the four
bases.

8
For the case of replication in the presence of chain terminator, the amount of
Dideoxynucleotide is controlled to 5% of the total amount of the regular nucleotides.
Thus, every time a nucleotide is required to build the primer, the polymerase will ensure
to procure a ‘good’ regular nucleotide, where as there is a meager 5% chance that this
might happen to be a Dideoxynucleotide. Thus, sooner or later, all the strands get
terminated, although, they would have got terminated at different lengths. If there were a
large number of template strands to begin with, it would result in primers terminated at
all possible lengths.
So, if we used dideoxy -T as the chain terminator, it would mean that every strand would
have ended with a T base. So, now, although, the products of our reaction happen to be
strands of different lengths, they all end in T. In other words, if we only know the length
of each of these strands, we have the knowledge of all the positions where T occurs on
the Template strand. Further, if four sets of the same template strands undergo the same
reaction-except with 4 different chain terminators, i.e. dideoxy-A, dideoxy-T, dideoxy-C
and dideoxy-G, and analyse the lengths of the resulting strands in each case, we will,
ineffect, know the all the positions of occuence of A, T, C and G respectively. Thus, the
DNA sequence can be known.
In order to find the lengths of the resulting strands, the Dideoxynucleotides are
chemically modified to fluoresce under exposure to ultraviolet radiation. And each of
them fluoresce at different wavelengths unique to their chemical structure. Thus, the
reaction products are separated lengthwise under a resolution of one base, by gel
electrophoresis on a denaturing polyacrylamide-urea gel. Each of the four chain

9
termination reactions is run on 4 different lanes of the gel, and the gel is then visualized
in UV light. The result is seen as bands of four colors occurring at different distances.
In an industrial, high-throughput configuration, Sanger technology was used in the
sequencing of the first human genome, which was completed in 2003 through the Human
Genome Project, a 13-year effort with an estimated cost of $2.7 billion.11
There are
however, limitations to Sanger-sequencing have stimulated the development of new
techniques. Most importantly, the expense involved in Sanger sequence prohibits its use
in view of future goals that include sequencing thousands of human genomes.12
1.2.2 Next (Second) Generation Sequencing
The successful completion of first generation sequencing demonstrated the feasibility of
the technical sequencing part of the Human Genome project, and triggered the
development of a series of techniques that could allow higher sequencing throughput.
Five years later, in 2008, a human genome was sequenced over a 5 month period for
approximately $1.5 million.11

10
Figure 1.4 Graph from Review by Niedringhaus et al shows the estimated cost required
to sequence a complete human genome based on expense data from NHGRI-funded-
large-scale DNA sequencing centers. 13
This accomplishment was directly the result of the rapidly evolving Next Generation
Sequencing (NGS) technologies such as pyrosequencing and sequencing by litigation
chemistry.13
Commercially available NGS platforms include Roche’s 454 Genome
Sequencer FLX, 14
Illumina’s Genome Analyzer,15–17
helicos Heliscope18
and Life
Technologies SOLiD system. A detailed review including the comparison, advantages
and shortcomings of the various NGS platforms is provided in review by Voelkerding et
al.
Although, with the advent of NGS, the sequencing cost per base has gone down several
orders of magnitude when compared to the cost involved in Sanger sequencing, yet the

11
main limiting factor for these emerging technologies remains the over-all high cost of
generating sequence with high throughput. Also, when compared to Sanger sequencing, it
must be admitted that the several of the newer technologies are challenged by higher
error factors, non-uniform confidence in base calling, short read lengths etc. 19
The second generation sequencing technologies are progressing to achieve even better
throughput at reduced cost via constant innovation in their chemical, engineering and
informatics aspects. The momentum of progress is such that by the time some of the
techniques are translated to instruments for general access, there are further innovations
that outdate the very technique to begin with.
Also, some of the advances are made on such rapid time scales that they do not easily fit
into a generational time bracket – The effect of this being a difficulty in categorizing
certain techniques in second or third generation sequencing.
Despite this technological gusto, there is still an underlying need for the revolutionary
advances that will ultimately land the sequencing tool into the physician’s office as a
cost-effective component of standard medical care.
1.2.3 Third Generation Sequencing
Thus with the vision of bringing the cost of a human genome to under $1000, National
Institutes of Health/ National Human Genome Research Institute (NIH/NHGRI) funded
various groups to improve the existing techniques as well as develop alternative
approaches to sequencing. In most of the major SGS sequencing, the process flow
depends on Polymerase Chain Rection (PCR) to amplify a DNA template so that
resulting DNA cluster can be tethered to a solid substrate and imaged as the clusters get
12
sequenced. The new generation of Sequencing by synthesis (SBS) technologies
interrogate single molecules of DNA, such that no synchronization is required (a
limitation of SGS), thereby overcoming issues related to the biases introduced by PCR
amplification and dephasing. More importantly, this new generation of sequencing
technologies has the potential to exploit more fully the high catalytic rates and high
processivity of DNA polymerase. There is scope to avoid any biology or chemistry
altogether. There is also a possibility of increasing the read length radically (from tens of
bases to tens of thousands of bases per read) and shorter time to acquire results (from
days to hours or minutes). The promises then of this new, third generation of sequencing
technologies in offering advantages over current sequencing technologies are (i) higher
throughput; (ii) faster turnaround time (e.g. sequencing metazoan genomes at high fold
coverage in minutes); (iii) longer read lengths to enhance de novo assembly and enable
direct detection of haplotypes and even whole chromosome phasing; (iv) higher
consensus accuracy to enable rare variant detection; (v) small amounts of starting
material (theoretically only a single molecule may be required for sequencing); and (vi)
low cost, where sequencing the human genome at high fold coverage for less than $100.20
SBS technologies can roughly be binned into three different categories: (i) SBS
technologies in which single molecules of DNA polymerase are observed as they
synthesize a single molecule of DNA; (ii) Nanofluidic based nanopore-sequencing
technologies in which single molecules of DNA are threaded through a nanopore or
positioned in the vicinity of a nanopore, and individual bases are detected as they pass
through the nanopore; and (iii) direct imaging of individual DNA molecules using
advanced microscopy techniques. Each of these technologies provides novel approaches

13
to sequencing DNA and has advantages and disadvantages with respect to specific
applications.
These technologies are at varying stages of development, making the writing of a review
on Third generation Sequencing (TGS) difficult given there is still much to prove
regarding the utility of many of the TGS technologies. However, if the full potential of
these technologies is realized, in a span of several years, whole genome sequencing will
likely be fast enough and inexpensive enough to re-sequence genomes as needed for any
application. Thus the emerging TGS technologies have the potential to make such
stunning advances possible. 20
Here we discuss nanofluidics subset of this technology,
which is relevant to the work presented in the later chapters of this dissertation.
1.3 NANOFLUIDICS AS A ROUTE TO DNA SEQUENCING
Most nanopore sequencing technologies rely on transit of a DNA molecule or its
component bases through a hole and detecting the bases by their effect on an electric
current or optical signal. Because this type of technology uses single molecules of
unmodified DNA, they have the potential to work quickly on extremely small amounts of
input material. Both biological nanopores constructed from engineered proteins and
entirely synthetic nanopores are under development. In particular, there is potential to use
atomically thin sheets of grapheme as a matrix supporting nanopores and also carbon
nanotubes for these applications.
1.3.1 Introduction to Nanopores
A nanopore is a nanometer sized aperture present in a membrane that separates two
chambers filled with conductive electrolyte. When an electric potential is applied across

14
the nanopore, by means of electrodes immersed in the chambers, ionic flow through the
nanopore results in the creation of ionic current. When an analyte molecule of interest is
introduced into the input chamber; driven by the applied potential, the molecule flows
towards the output chamber via the nanopore. While passing through the aperture, the
temporary partial blockade of the aperture results in a transient decrease in the ionic
current. The electric signal in turn reveals useful information about the analyte particle.
This is the essence of the nanopore–scheme of single molecule detection. The underlying
principle of such orifice-based resistive-sensing of particles in solutions was pioneered by
Wallace H. Coulter in 1953.21
The Coulter counter applies the principle at the micrometer
scale to count and size blood cells. Invented 6 decades ago, it has evolved into an
accurate, effective and ubiquitous hematological tool in clinical labs today. Nanopores
are sort of miniaturized coulter-counters in that they analyze biomolecules (of cross-
sectional diameter of a few nm) using the same principle at the nanometer scale. The use
of nanopores as tools for molecular analysis constitutes a much younger branch of
biophysics that began in the early 90s. Prior to the emergence of the first nanopore
studies, ion channels found in lipid bilayers and membranes were already being
investigated as part of electrophysiological studies.22,23
1.3.2 Biological and Synthetic Nanopores
The first nanopores were biological – they were based on trans-membrane protein α-
hemolysin.24,25
By demonstrating the electrical detection of individual ssDNA and
ssRNA molecules using α-hemolysin these studies marked the milestone that initiated a
plethora of efforts in biological pore based single molecule work. DNA translocation

15
dynamics26
in these pores have been examined in context of molecular orientation27
,
polymer length, applied electric potential28,29
, temperature30
and direction of approach
with respect to the nanopore.
Homopolymer and Hairpin DNA translocation studies show that it is possible to tap
single base resolution and sequence-specific information using α-hemolysin pores.31
In
perspective of nucleic acid analysis, a majority of the nanopore based experimental
findings come from α-hemolysin based studies. However, biological pores also have
limitations in terms of size, stability, resolution and variability.32
In response to these
limitations, biological pores are increasingly being combined with enzyme motors and
this route has recently demonstrated proof-of-principle DNA sequencing.33,34
Based on
single-molecule mass spectroscopy,35,36
proof-of-principle DNA sequencing-by-synthesis
in biological nanopores has also been demonstrated.37
With the advances in modern microfabrication facilities, a different class of nanopores
known as synthetic nanopores have become increasingly popular.38
Made of solid-state
materials, these pores exhibit superior stability over their biological counterparts. The
conventional semiconductor processes involved in fabrication of solid-state nanopores
provide scope for tunability in size, mass fabrication and seamless device integration. In
2003, Li et al demonstrated dsDNA translocation in solid state nanopore for the first
time.39
Controlling the DNA translocation speed was soon identified as the key step toward
single molecule identification. By changing bias and electrolyte properties Li et al

16
achieved 30 base/µs translocation speed for 3 kilo base pair (kbp) dsDNA in silicon
nitride pores.40
Chen et al achieved similar translocation speeds(~ 27 base/µs) by fine-
tuning surface properties of the solid-state nanopores via atomic layer deposition of
alumina.41,42
Despite these advances, the translocations in solid state nanopores occur too
fast compared to the speeds desirable for sequencing, and the need for improving
temporal resolution in solid state nanopore continues to exist.43–46
Attempts to control biomolecular transport in solid state nanopores include altering the
electrolyte viscosity,40
temperature, electro-osmotic screening, 47,48
alternating electric
field,49
optical50
and magnetic tweezers51
. Theoretical investigations suggest that
reducing the fluid temperature from ambient conditions to 0℃ could cut translocation
speed by 49.7%.52
The effect of counter ion binding has been applied to reduce the
charge on DNA and thus prolong its translocation time.53
In this study Kowalczyk et al
report a 10 fold increase in ssDNA translocation by changing the electrolyte from KCl to
LiCl. Biological modification of pores include targeted scaffolding of solid state
nanopores with DNA origami54
and enzymes such as phi29 DNA polymerase.34,55
Keyser and others have shown that the entire surface of a nanopore can be
functionalized to slow DNA.56
Other pore modifications involve manipulating the
charge distribution on the walls of nanopore, via gate modulation57
and electrostatic
screening.58

17
Figure 1.5 Protein nanopores and solid state nanopores for DNA analysis.59
(a) Left:
structural cross-section of α-haemolysin. Right: typical plot of residual ionic current
through an aminocyclodextrin-modified α-haemolysin nanopore versus t for individual
mononucleotides (dAMP, dCMP, dGMP, dTMP).60
(b) Top: TEM images of nanopores in
Al2O3 membranes. Bottom: scatter plot of event blockage (the percentage of open pore
ionic current that is blocked as a molecule passes through the pore) vs. event duration for
the translocation 5kbp dsDNA through a 5-nm Al2O3 pore showing a single blockage
level corresponding to linear, unfolded dsDNA transport. (c) Top: schematic (left) and
TEM image (right) of a nanopore in a suspended graphene film. Bottom: scatter plot of
event blockage versus event duration showing that folded DNA (left of inset, deep
blockade level) and unfolded DNA (right of inset, shallow blockade level) can be
distinguished. The solid line represents a constant electronic charge deficit.

18
1.3.3. Carbon Nanotubes
Carbon nanotubes (CNTs) have recently emerged as a new type of synthetic nanopore.
CNTs are grown or formed from bottom- up rather than top- down approach. Hence the
absence of the need to manipulate or control at the nanoscale fabrication is advantageous.
Also, with hydrophobic walls and nanochannel structure, CNTs can be treated as
synthetic analogs of biological ion channels, and explored in order to understand flow at
nanometer scale. The interior surface of good quality CNTs is pristine with well-defined
structure providing for an atomically smooth, frictionless pathway of transport. The
excellent electrical properties of CNTs provide new routes to electrical detection,
trapping and manipulation of charged biomolecules and nanoparticles. Well-defined
sites are available for chemical functionalization at the ends of the tubes. Such
modifications will be extremely useful for ion and molecule selection, gating or
separation. Smooth surface and perfect uniformity over large distances also.
Molecular dynamics (MD) simulations by Hummer et al led to observations of
spontaneous wetting and filling of water molecules.61
Despite the hydrophobicity of the
walls, the nanoscale confinement and the interactions between water and the CNT
surface caused alignment of water molecules inside the CNT. This increased the stability
of the CNT confined molecules .The lower free energy of confined water predicted ready
wetting of CNTs and the frictionless walls meant very fast water transport through CNTs.
Following the pioneering work on water molecule transport, the translocations of
more complicated molecules, such as long chain polymer molecules,62
DNA63
and
RNA,64
were simulated as well. Van der Waals and hydrophobic interaction forces

19
assisted in translocation of these molecules when driven by an electric field. In support
of these facts, in-situ experimental studies of wetted CNTs using nuclear magnetic
resonance (NMR), 65
IR spectroscopy,66
transmission electron microscope (TEM)67
and scanning electron microscope (SEM)68
confirmed the presence of water molecules
aided by ordered structuring within CNT .
In 2010, Liu et al reported experimental verification of translocations of DNA in
nanotube system for the first time.69
ssDNA (60-nt and 120-nt) with sequences that were
predicted to be relatively free of secondary structure were translocated through a single
walled carbon nanotube (SWCNT) based device. When DNA molecules were introduced
to the input reservoir of the device, large transient increases in current were observed.
These “spikes” were accompanied by large fluctuations in the background current
(Figure 4.6). The spikes disappeared when the polarity of the bias across the tube was
reversed and reappeared when the original bias (positive on the output side) was restored.

20
Figure 1.6 Ion current signals of DNA translocation.65
(A) Current (2 M KCl, 1 mM PBS,
pH 7) before DNA addition. (B) After DNA addition, current slowly increases. (C) 5 min
after addition of 0.1nM 60-nt DNA, large positive current spikes appear. These spikes are
followed by a drop in baseline over a periodof a second or so and then by a gradual rise
leading to the next spike. (D) Representative data from another tube (also 60-nt DNA),
with the distribution of currents shown in (E). The DNA causes large changes in baseline
in addition to the spikes. (F) Data from a tube that showed both a current increase on
DNA addition and baseline fluctuations but no spikes. No translocation was detected by
PCR. The insets in (C) and (F) show the fluorescence signal from double-stranded DNA
dye labels as a function of the PCR cycle number for samples collected from these
particular runs.
21
Quantitative polymerase chain reaction (QPCR), for detecting and counting small
numbers of molecules, showed that DNA was translocated in devices manifesting these
large spikes. Thus, the spikes signal translocation of DNA through the SWCNTs.
1.4 THESIS SUMMARY
Having introduced the field of DNA sequencing, examined the background of
nanofluidics in third generation sequencing (single molecule DNA sequencing) , we now
move onto examine the nanofluidic systems of this study. Chapter 2 presents the work
related to CNT membrane devices. Fabrication, characterization and experimental results
from these devices are discussed. A section of this chapter also covers the synthesis of
graphene which has been subsequently used for graphene based translocation devices.
Chapter 3 discusses the background of functionalization of metal electrodes within the
context of recognition tunneling. A good understanding of role of reader molecules in
STM experiments is necessary and the evolution of these molecules in pace with
demands of DNA sequencing goals, sets the stage for Chapter4.
Chapter 4 is sort of a confluence of chapters 2 and 3.On one hand, there are the inherent
disadvantages common to any CNT based device (such as the lack of control of chirality
and uniformity). On the other hand, even a setup (like the functionalized STM
experiment ) that has repeatedly and successfully demonstrated great molecular
sensitivity and base differentiating capabilities ultimately requires a more dedicated
method of orienting DNA molecules to the tunnel junction, if long DNA molecules are to
be sequenced. These disadvantages motivate the switch over to solid state technology.
Silicon Nitride nanopores are the object of interest in Chapter 4. When coated with Pd

22
and functionalized, these nanopores form a nanochannel with reader molecule sensitivity.
Voltage driven ionic flow and biomolecular transport of DNA through these pores give
some interesting results that promise a way to control translocations in nanopore systems.
Finally, chapter 5 summarizes all the experimental results in perspective of the grand
goals of DNA sequencing. The significance of the progress thus far as well as the plan for
future work is described briefly
1.5 REFERENCES
1. Dahm, R. Friedrich Miescher and the discovery of DNA. Developmental Biology
278, 274–288 (2005).
2. Maderspacher, F. Rags before the riches: Friedrich Miescher and the discovery of
DNA. Curr. Biol. 14, R608 (2004).
3. Mulhardt, C. Molecular Biology and Genomics. (Academic Press, 2006).
4. Watson, J. D. & Crick, F. H. C. Molecular Structure of Nucleic Acids: A
Structure for Deoxyribose Nucleic Acid. Nature 171, 737–738 (1953).
5. Watson, J. D. & Crick, F. H. C. Genetical Implications of the Structure of
Deoxyribonucleic Acid. Nature 171, 964–967 (1953).
6. Base pair. Wikipedia, the free encyclopedia (2013). at
<http://en.wikipedia.org/w/index.php?title=Base_pair&oldid=555542584>
7. How new DNA sequencing technologies are unravelling rare genetic diseases.
Wellcome Trust Blog at <http://blog.wellcome.ac.uk/2011/04/13/how-new-dna-
sequencing-technologies-are-unravelling-rare-genetic-diseases/>
8. Sanger, F., Nicklen, S. & Coulson, A. R. DNA sequencing with chain-terminating
inhibitors. PNAS 74, 5463–5467 (1977).
9. Maxam, A. M. & Gilbert, W. A new method for sequencing DNA. PNAS 74,
560–564 (1977).
10. Ju, J. et al. Four-color DNA sequencing by synthesis using cleavable fluorescent
nucleotide reversible terminators. PNAS 103, 19635–19640 (2006).

23
11. Voelkerding, K. V., Dames, S. A. & Durtschi, J. D. Next-Generation Sequencing:
From Basic Research to Diagnostics. Clinical Chemistry 55, 641–658 (2009).
12. Strausberg, R. L., Levy, S. & Rogers, Y.-H. Emerging DNA sequencing
technologies for human genomic medicine. Drug Discovery Today 13, 569–577 (2008).
13. Niedringhaus, T. P., Milanova, D., Kerby, M. B., Snyder, M. P. & Barron, A. E.
Landscape of Next-Generation Sequencing Technologies. Anal Chem 83, 4327–4341
(2011).
14. Wheeler, D. A. et al. The complete genome of an individual by massively parallel
DNA sequencing. Nature 452, 872–876 (2008).
15. Bentley, D. R. et al. Accurate whole human genome sequencing using reversible
terminator chemistry. Nature 456, 53–59 (2008).
16. Ley, T. J. et al. DNA sequencing of a cytogenetically normal acute myeloid
leukaemia genome. Nature 456, 66–72 (2008).
17. Wang, J. et al. The diploid genome sequence of an Asian individual. Nature 456,
60–65 (2008).
18. Pushkarev, D., Neff, N. F. & Quake, S. R. Single-molecule sequencing of an
individual human genome. Nat Biotech 27, 847–850 (2009).
19. Ansorge, W. J. Next-generation DNA sequencing techniques. New Biotechnology
25, 195–203 (2009).
20. Schadt, E. E., Turner, S. & Kasarskis, A. A window into third-generation
sequencing. Hum. Mol. Genet. 19, R227–R240 (2010).
21. Coulter, W.H. Means for Counting Particles suspended in a fluid. US 2656508A
22. Hille, B. Ionic channels in excitable membranes. Current problems and
biophysical approaches. Biophys J 22, 283–294 (1978).
23. Sakmann, B. & Neher, E. Patch Clamp Techniques for Studying Ionic Channels
in Excitable Membranes. Annual Review of Physiology 46, 455–472 (1984).
24. Kasianowicz, J. J., Brandin, E., Branton, D. & Deamer, D. W. Characterization of
individual polynucleotide molecules using a membrane channel. PNAS 93, 13770–
13773 (1996).
25. Akeson, M., Branton, D., Kasianowicz, J. J., Brandin, E. & Deamer, D. W.
Microsecond Time-Scale Discrimination Among Polycytidylic Acid, Polyadenylic

24
Acid, and Polyuridylic Acid as Homopolymers or as Segments Within Single RNA
Molecules. Biophysical Journal 77, 3227–3233 (1999).
26. Meller, A. Dynamics of polynucleotide transport through nanometre-scale pores.
J. Phys.: Condens. Matter 15, R581 (2003).
27. Wanunu, M., Chakrabarti, B., Mathé, J., Nelson, D. R. & Meller, A. Orientation-
dependent interactions of DNA with an α-hemolysin channel. Phys. Rev. E 77, 031904
(2008).
28. Meller, A. & Branton, D. Single molecule measurements of DNA transport
through a nanopore. Electrophoresis 23, 2583–2591 (2002).
29. Meller, A., Nivon, L. & Branton, D. Voltage-Driven DNA Translocations through
a Nanopore. Phys. Rev. Lett. 86, 3435–3438 (2001).
30. Meller, A., Nivon, L., Brandin, E., Golovchenko, J. & Branton, D. Rapid
nanopore discrimination between single polynucleotide molecules. PNAS 97, 1079–
1084 (2000).
31. Vercoutere, W. et al. Rapid discrimination among individual DNA hairpin
molecules at single-nucleotide resolution using an ion channel. Nat Biotech 19, 248–
252 (2001)
.
32. Deamer, D. W. & Branton, D. Characterization of Nucleic Acids by Nanopore
Analysis. Acc. Chem. Res. 35, 817-825 (2002)
33. Manrao, E. A. et al. Reading DNA at single-nucleotide resolution with a mutant
MspA nanopore and phi29 DNA polymerase. Nat Biotech 30, 349–353 (2012).
34. Cherf, G. M. et al. Automated forward and reverse ratcheting of DNA in a
nanopore at 5-A precision. Nat Biotech 30, 344–348 (2012).
35. Robertson, J. W. F. et al. Single-molecule mass spectrometry in solution using a
solitary nanopore. PNAS 104, 8207–8211 (2007).
36. Reiner, J. E., Kasianowicz, J. J., Nablo, B. J. & Robertson, J. W. F. Theory for
polymer analysis using nanopore-based single-molecule mass spectrometry. PNAS
107, 12080–12085 (2010).
37. Kumar, S. et al. PEG-Labeled Nucleotides and Nanopore Detection for Single
Molecule DNA Sequencing by Synthesis. Sci. Rep. 2, (2012).
38. Iqbal, S. M. & Bashir, R. Nanopores: Sensing and Fundamental Biological
Interactions. (Springer, 2011).

25
39. Li, J., Greshow, M., Stein, D., Brandin, E & Golovchenko, J.A. DNA molecules and
configurations in a solid-state nanopore microscope. Nat. Mater. 2, 611-615 (2003)
40. Fologea, D., Uplinger, J., Thomas, B., McNabb, D. S. & Li, J. Slowing DNA
Translocation in a Solid State Nanopore. Nano Lett 5, 1734–1737 (2005).
41. Chen, P. et al. Probing Single DNA Molecule Transport Using Fabricated
Nanopores. Nano Lett. 4, 2293–2298 (2004).
42. Chen, P. et al. Atomic Layer Deposition to Fine-Tune the Surface Properties and
Diameters of Fabricated Nanopores. Nano Lett. 4, 1333–1337 (2004).
43. Dekker, C. Solid-state nanopores. Nat Nano 2, 209–215 (2007).
44. Branton, D. et al. The potential and challenges of nanopore sequencing. Nat
Biotech 26, 1146–1153 (2008).
45. Venkatesan, B. M. & Bashir, R. Nanopore sensors for nucleic acid analysis. Nat
Nanotechnol 6, 615–624 (2011).
46. Venta, K., Shlmer, G., Puster, M., Rodriguez-Manzo, J. A., Balan, A.,Rosenstein,
J. K., Shepard, K. & Drndic, M. ACS Nano (2013)
47. Ghosal, S. Electrokinetic-flow-induced viscous drag on a tethered DNA inside a
nanopore. Phys. Rev. E 76, 061916 (2007).
48. Van Dorp, S., Keyser, U. F., Dekker, N. H., Dekker, C. & Lemay, S. G. Origin of
the electrophoretic force on DNA in solid-state nanopores. Nat Phys 5, 347–351
(2009).
49. Sigalov, G., Comer, J., Timp, G. & Aksimentiev, A. Detection of DNA Sequences
Using an Alternating Electric Field in a Nanopore Capacitor. Nano Lett. 8, 56–63
(2008).
50. Keyser, U. F. et al. Direct force measurements on DNA in a solid-state nanopore.
Nat Phys 2, 473–477 (2006).
51. Peng, H. & Ling, X. S. Reverse DNA translocation through a solid-state nanopore
by magnetic tweezers. Nanotechnology 20, 185101 (2009).
52. Yeh, L.-H., Zhang, M., Joo, S. W. & Qian, S. Slowing down DNA translocation
through a nanopore by lowering fluid temperature. ELECTROPHORESIS 33, 3458–
3465 (2012).

26
53. Kowalczyk, S. W., Wells, D. B., Aksimentiev, A. & Dekker, C. Slowing down
DNA Translocation through a Nanopore in Lithium Chloride. Nano Letters 12, 1038–
1044 (2012).
54. Wei, R., Martin, T.G., Rant, U. &Dietz, H.DNA_origami_gatekeepers for solid state
nanopores. Angew. Chem. 51, 4864-4867 (2012)
55. Lieberman, K. R. et al. Processive replication of single DNA molecules in a
nanopore catalyzed by phi29 DNA polymerase. J. Am. Chem. Soc. 132, 17961–17972
(2010).
56. Keyser, U. F. Controlling molecular transport through nanopores. J. R. Soc.
Interface 8, 1369–1378 (2011).
57. He, Y., Tsutsui, M., Fan, C., Taniguchi, M. & Kawai, T. Controlling DNA
Translocation through Gate Modulation of Nanopore Wall Surface Charges. ACS
Nano 5, 5509–5518 (2011).
58. Luan, B. et al. Base-by-base Ratcheting of Single Stranded DNA through a Solid-
State Nanopore. Phys Rev Lett 104, 238103 (2010).
59. Venkatesan, B. M. et al. Stacked Graphene-Al2O3 Nanopore Sensors for
Sensitive Detection of DNA and DNA–Protein Complexes. ACS Nano 6, 441–450
(2012).
60. Deamer, D. Nanopore Analysis of Nucleic Acids Bound to Exonucleases and
Polymerases. Annual Review of Biophysics 39, 79–90 (2010).
61. Hummer, G., Rasaiah, J. C. & Noworyta, J. P. Water conduction through the
hydrophobic channel of a carbon nanotube. Nature 414, 188–190 (2001).
62. Wei, C. & Srivastava, D. Theory of Transport of Long Polymer Molecules
through Carbon Nanotube Channels. Phys. Rev. Lett. 91, 235901 (2003).
63. Xie, Y., Kong, Y., Soh, A. K. & Gao, H. Electric field-induced translocation of
single-stranded DNA through a polarized carbon nanotube membrane. The Journal of
Chemical Physics 127, 225101–225101–7 (2007).
64. Yeh, I.-C. & Hummer, G. Nucleic acid transport through carbon nanotube
membranes. PNAS 101, 12177–12182 (2004).
65. Chen, M., Khalid, S., Sansom, M. S. P. & Bayley, H. Outer membrane protein G:
Engineering a quiet pore for biosensing. Proc Natl Acad Sci U S A 105, 6272–6277
(2008).

27
66. Byl, O. et al. Unusual Hydrogen Bonding in Water-Filled Carbon Nanotubes. J.
Am. Chem. Soc. 128, 12090–12097 (2006).
67. Naguib, N. et al. Observation of Water Confined in Nanometer Channels of
Closed Carbon Nanotubes. Nano Lett. 4, 2237–2243 (2004).
68. Rossi, M. P. et al. Environmental Scanning Electron Microscopy Study of Water
in Carbon Nanopipes. Nano Lett. 4, 989–993 (2004).
69. Liu, H. et al. Translocation of Single-Stranded DNA Through Single-Walled
Carbon Nanotubes. Science 327, 64–67 (2010).

28
CHAPTER 2 CARBON NANOTUBE BASED NANOFLUIDICS FOR DNA
ANALYSIS
In this chapter, successful integration of vertically aligned carbon nanotube
(CNT) and microfluidic systems for CNT mass transportation experiments is shown. .
The demonstration of DNA sensing using a single CNT based nanofluidic device
motivates the study of DNA transport in CNT membrane devices. My work focuses on
CNT forest synthesis, PDMS microfluidic device fabrication, ionic current measurement
and absorbance measurements of translocated DNA molecules.
This chapter begins with discussion of structure and properties of a single CNT.
This is followed by description of the CVD growth of vertically aligned CNT forest.
Characterization and further fabrication techniques of the CNT forest to synthesize CNT
membrane device chips are described. Results of DNA and nanoparticle transport from
CNT membrane device measurements are presented. The chapter concludes with
implications of the results and the need to move onto solid state nanopores.
2.1 CARBON NANOTUBES – STRUCTURE AND PROPERTIES
2.1.1 Physical Structure of Carbon Nanotubes
Elemental carbon can form a variety of structures based on its ability to exist in different
hybridization states. Two popular allotropes of Carbon are diamond and graphite, where
in carbon resumes sp2 and sp
3 hybridization states respectively. Apart from graphite, sp
2
hybridized carbon can form open and closed cages of honey comb atomic arrangement.
The first structure of this type was discovered in 1985, when researchers from Rice

29
University reported the discovery of C60 spheres also referred to as Buckminster
fullerenes1. Following the flood of research activity directed towards understanding the
nature and properties of fullerenes and their applications, the first tubular carbon
structures were reported by Iijima in 19912. Popularly referred to as carbon nanotubes
(CNTs), these hollow cylindrical tubes typically have diameter of the order of a few
nanometers, and very high aspect ratio. Based on the number of concentric shells, CNTs
can be categorized as single-walled carbon nanotubes (SWCNTs) and multi-walled
carbon nanotubes (MWCNTs). A SWCNT forms the fundamental unit of a CNT. The
SWCNT can be thought of as a grapheme sheet rolled up to form a hollow seamless
cylinder. The diameter and helicity of the resulting CNT depend on the direction of
rolling, which is represented by the chiral vector hC = n 1a + m 2a . The integers n and m
represent the number of unit vectors ( ⃑ and ⃑ ) along the 2 dimensional graphene
lattice. Thus, hC can be defined as the vector that connects two crystallographically
equivalent sites on the 2D grapheme plane (Figure 2.1). Depending on their chirality,
CNTs can be classified as “zig-zag” (for m = 0), “arm-chair” (for n = m) or simply chiral.
From the magnitude of the chiral vector, the diameter of the resulting CNT can be
calculated using the formula:
| ̅|
√
√ (1.1)
Where is the C-C bond length (~ 1.42 Å)

30
Figure 2.1 (a)–(c) Schematic illustration of the SWCNT chirality: armchair (10,10),
zigzag (18,0) and chiral (17,-7). The left column shows the rolling of graphene sheets to a
carbon nanotube, illustrating the chiral vector hC with respect to the unit vectors 1a and
2a in the honeycomb crystal lattice of the graphene. The right column displays the
corresponding SWCNT models. (d) Chiral structures for possible SWCNT structures.3

31
2.1.2 Electronic Structure of Carbon Nanotubes
The electronic structure of carbon nanotubes is very sensitive to their geometric
structure.4,5
While grapheme is a zero-gap semiconductor, CNTs can be metallic or
semiconducting with different energy gaps based on the diameter and helicity of the
CNTs.3 SWCNT will be semiconducting if (m.n) values are such that
6
( )
integer (1.2)
And metallic if m, n are such that
( )
integer (1.3)
As of current production technological standards, the helicity of grown SWCNTs is
random during the growth process. Thus statistically, 2/3of the randomly produced
SWCNTs are semiconducting and 1/3 are metallic. The bandgap of a semiconducting
SWCNT is given by
γ/ D (1.4)
where dcc = 0.142 nm is the C- C bond length of the graphene,; γ = 2.5-3.2 eV is the
nearest-neighbor hopping parameter, and D is the diameter of the SWCNT.

32
2.2 WHY CNT MEMBRANE MICROFLUIDICS?
In recent years, there has been enormous interest in utilizing carbon nanotube as a
nanochannels or nanopores.7–14
CNTs emerge as a natural choice for nanofluidic
applications primarily due to their structure – hollow inner volume accompanied by
diameter that is uniform across the entire length and very high aspect ratio. Secondly,
due to growing interest in understanding the motion of highly confined fluids, CNT
nanofluidics has gained considerable attention from theoretical standpoint.
Synthesis of sub 10nm channels is easy without the need for expensive fabrication set up
as in the case of solid state nanopores. They have an atomically smooth surface and
perfect uniformity over large distances, resulting in frictionless motion of fluid and
particles. Recent studies show significantly faster transport in CNT comparing with
nanochannels made from conventional materials.15–17
For high quality CNTs, the
chemistry and structures of the interior surface are well-defined, which simplifies
theoretical simulations. Well-defined sites are available for chemical functionalization
at the ends obtained from oxidation of the nanotube caps. Chemical modifications at
these sites could affect and modulate ion and molecule flow through the tubes, giving
scope for a wide variety of applications. To develop a fundamental understanding of
mass transport inside CNT, transport measurement based on single SWCNT (diameter
<2nm) has been developed in recent years.
Apart from the general advantages mentioned above, one of the important advances
in CNT field that is of direct relevance to the sequencing community is the work done
by my lab colleagues with respect to DNA translocation in single CNT devices.15
As

33
already mentioned in the chapter 1, this study shows that the SWCNTs could be a clever
choice of nanopores that involve inexpensive fabrication of highly sensitive and robust
nanochannels, capable of single molecule DNA detection. While there are so many
advantages to the above mentioned devices, there is however one problem - the
individual CNT based nanofluidic device is difficult to fabricate and the diameter of the
CNT cannot be exactly controlled.
In order to overcome this problem, it was proposed that we fabricate large scale growth
of aligned CNTs, such that when a membrane device is created out of this array, DNA
threading through the CNTs could be sensed in-tandem using a functionalized STM tip.
(see Figure 2.2 )
Figure 2.2 Schematic of integrating array of CNTs within the STM set up for sequencing
purpose.

34
Currently, measurements of mass and charge transport in the CNT are made mainly with
membranes containing a large quantity (~109-11
tubes/cm2) of CNTs, the orientation of
which is either aligned or not aligned.14,18–20
The membranes with aligned CNTs
generally show better performance. However, it is difficult to grow high quality aligned
CNT with diameters below 2nm. Various polymers have been cast onto the CNT film to
fill the gaps between CNTs and form an impenetrable membrane. Subsequently, both
ends of the CNT were opened by oxygen plasma. Recent research on CNT based
nanofluidic devices has yield exciting applications in efficient gas filtration, chemical and
biological separation, water desalination and programmable transdermal drug delivery.21–
23
2.3 SYNTHESIS OF CNT MEMBRANES
2.3.1 Vertically Aligned CNT Forest Growth
A 1nm thick Fe layer and a 30 nm thick Al layer were deposited sequentially on a silicon
chip containing a silicon nitride membrane using ion-beam sputtering or electron-beam
deposition. The vertically aligned MWCNT forest was grown from this catalyst by
chemical vapor deposition (CVD) using Ethylene as the carbon source at 850oC for 70
seconds.14
More supporting information related to the synthesis of vertically aligned
forest growth protocol is given in Appendix B.

35
2.3.2 SEM, TEM Characterization
A scanning electron microscope (SEM) image of the as-grown vertically aligned
MWCNT forest is shown in Figure 2.3a. The height of the CNT forest is about 42±5 μm
under our growth condition. The inset in Figure 2b shows a transmission electron
microscope (TEM) image of individual CNTs, confirming that these CNTs are multi-
walled (~5-10 layers) and the inner and outer diameters are about 7 nm and 11 nm
respectively. Bamboo structure is not observed in these MWCNTs. By analyzing more
than 100 CNTs in TEM images, we obtained a histogram (Figure 2.3 b) of the CNT
inner diameter distribution, with the peak around 7 nm. These carbon nanotubes were
also characterized by Raman spectroscopy, confirming MWCNT structures due to the
absence of radial breathing mode (Figure 2.4).

36
Figure 2.3. SEM and TEM characterization(a) SEM image of the cross-section of the as-
grown vertically aligned MWCNT forest. The average height of the CNT forest is about
42µm. (b) Low resolution TEM image of a large number of MWCNTs. The inset at the
top left corner is a high resolution TEM image of one MWCNT. The inset at the top right
corner shows the histogram of inner diameters of these MWCNTs. (c) A SEM image
shows the cross-section of the parylene coated MWCNT membrane. (d) A SEM image
shows the membrane surface after oxygen plasma treatment. (e) The schematic of the
parylene encapsulated MWCNT forest membrane on a silicon support with a square
window with size 35-100μm.

37
2.3.3 Parylene Depostion and Membrane Fabrication
The fabrication of vertically aligned MWCNT forest membrane is based on the procedure
developed by Holt et al. 14
In brief, a 5mm square silicon chip with a square shaped free
standing silicon nitride membrane (35-100μm in width, 300nm in thickness) in the center
is first fabricated by KOH anisotropic wet etching. After the MWCNT forest is grown
uniformly on the whole surface, parylene is vapor deposited onto the MWCNT forest at
room temperature using a PDS 2010 LABCOTER (Specialty coating systems,
Indianapolis, IN). Immediately after deposition, the parylene film is planarized by
thermal annealing at 350oC for two hour in argon atmosphere. SEM images in Figure 1c
suggest that the CNT forests are fully embedded in parylene. A two-step reactive ion
etching (RIE) process is used to sequentially remove the excess parylene film and the
300nm SiN layer from the backside of the chip. Then the chip is sequentially immersed in
45oC PAN etch solution (H3PO4:H2O: HNO3:CH3COOH (16:2:1:1, volume ratio) for 5
minutes and in HCl (50% of concentrated HCl) for 30 minutes, to remove the exposed Al
and Fe layers from the backside. Then oxygen plasma (5-10 minutes, 7.2W, 550-600
mTorr) is used to remove the excess parylene, and to expose and open the CNT ends. The
surface of the membrane after oxygen plasma is shown in Figure 1d. The as-grown
parylene surface is hydrophobic. However, the parylene surface becomes hydrophilic
after oxygen plasma treatment. The hydrophilic parylene surface is stable and facilitates
the transport of particles. The schematic of the final device is shown in Figure 2.5

38
Figure 2.4 CNT Forest characterization(a) SEM image of the top view of the as-grown
vertically aligned MWCNT forest. (b) Optical image of an aqueous droplet (100mM KCl)
on the as-grown MWCNT forest. The measured contact angle is 128o. (c) Raman
spectroscopy of the MWCNT forest.

39
2.4 CNT Membrane measurements
To start with, control experiments have been carried out to prove that within the applied
bias and pressure range, the transport is through the inside of the CNT and not through
any cracks or voids in the parylene film. The ionic current through the membrane is
measured using the setup as shown in Figure 2.5
Figure 2.5 Diagram of the ionic current measurement set up.
When the control device with pure parylene thin film is fabricated and treated by the
same process, no ionic current is observed . Similarly, when the CNT membrane is not
treated by oxygen plasma, there is no measurable ionic current. With the increase of the
oxygen plasma time, the measured ionic current initially increases and then flattens out
(see supplementary information). The dependence of ionic current on oxygen plasma

40
time implies the ionic current is proportional to the number of opened CNTs in the
membrane.
2.4.1 DNA AND NANOPARTICLE TRANSPORT
We also studied the translocation of gold nanoparticles with well-defined size under
pressure and electric field. The 5nm Au NP is smaller than the average CNT inner
diameter and the 10 nm Au NP is bigger than the average CNT inner diameter. We have
measured more than 10 membranes and about 80% of the membranes only allow 5nm
AuNPs to pass with only electric field applied (see one example in Figure 2.6a).
However, the ratio reduced to about 40% when a pressure (294 Pa, about 3cm height
difference) is applied. We discard the 60% membranes that also allow the passage of
10nm NPs. This fact also suggests that these parylene encapsulated CNT membranes are
not suitable for high pressure applications. Therefore, we mainly study the transport
driven by electrical field. If a pressure gradient is needed, the pressure was always below
294 Pa, a level at which no leaks were detected in the parylene membranes.
To understand the ion transport mechanisms in these large diameter MWCNTs, we
measured the ionic conductance in KCl solution as a function of KCl concentration and
solution pH. We first measured the ionic current through CNT forest membrane at
different bias. The current-voltage (IV) curves are symmetric in the applied bias range
(<2V) and a typical curve taken in 100mM KCl solution is shown in the inset of Figure
2b. The ionic conductance can be derived from the slope of the IV curve. We then plot
the ionic conductance data as a function of KCl concentration in logarithmic scale. As
shown in Figure 2.6 (a), the ionic conductance is proportional to the KCl concentration
when the concentration is above 0.1mM.

41
Figure 2.6 Ionic conductance measurements(a) The ionic conductance vs. KCl
concentration on a log-log scale. The solid line is a linear fit to the experimental data.
The inset shows the I-V curve of the membrane in 100mM KCl solution. (b) The ionic
conductance through the membrane as a function of pH in 1M KCl (red circle) and
10mM KCl (blue triangle) solutions. The solid lines are guides for the eye.
The deviation at low salt concentration is previously explained by surface charge on the
nanochannel/nanopore.26
The proportionality at high salt concentration suggests the
transport mechanism under electric field is electrophoresis. This is very different from the
transport mechanism in individual SWCNTs with inner diameter below 2nm.12,24
A
unique power law relationship with exponent smaller than 1 is always observed in those
single SWCNT fluidic devices. The origin of such behavior is attributed to the strong
electroosmotic flow inside smaller diameter SWCNT. We further studied the ionic
conductance as a function of pH and the result is shown in Figure 2.6(b). We didn’t

42
observe obvious change in ionic conductance when changing the pH of the KCl solution
from 3 to 9. This is also different from the results of small diameter SWCNT, confirming
that the electroosmosis is not an important transport mechanism in these MWCNTs of
average 7nm diameter. This conclusion is also consistent with previous experiments and
theoretical calculations.10,25
We then studied the transport of small molecules through these membranes. Anions
Fe(CN)63-
(hydrated diameter ~0.95 nm)26
and cations Ru(bipy)32+
(hydrated diameter
~1.18 nm)16
were used in this study. The molecular structures of both ions are shown in
Figure 2.7(a). We first measured the IV curves and the results are shown in Figure 2.7
(b). The solutions in the cis/trans reservoirs are K3Fe(CN)6 / KCl, Ru(bipy)3Cl2 / KCl
and Ru(bipy)3Cl2 /K3Fe(CN)6. The KCl solution concentration is always100mM and the
K3Fe(CN)6 and Ru(bipy)3Cl2 solutions are always 25mM. At the same bias, the current of
K3Fe(CN)6 / KCl (green curve) is slightly smaller than the current of KCl / KCl (black
curve). However, the current of Ru(bipy)3Cl2 / KCl (red curve) is almost half the value of
KCl / KCl. This suggests that cation Ru(bipy)32+
passes the MWCNT membrane less
easily. Meanwhile, there is a slight asymmetry in the IV curve and the current is smaller
at negative bias, which also reflecting the smaller mobility of cation Ru(bipy)32+
. We also
measured the IV curve of Ru(bipy)3Cl2 /K3Fe(CN)6. The current is further reduced
compared with Ru(bipy)3Cl2 / KCl. The decrease in current also confirms that the ions
are transport through the inside of the MWCNT.7 Because the ionic current is contributed
by all the ion species in the solution, we then directly measure the concentration of
translocated ions at trans reservoir after applying a bias between two reservoirs for 90
43
minutes. In this experiment, the cis reservoir is filled with 25mM K3Fe(CN)6 or
Ru(bipy)3Cl2 in 100mM KCl (pH 7) solution. The trans reservoir is filled with 100mM
KCl solution. The concentration of Fe(CN)63-
ions is determined by the pronounced redox
peak at 0.18 V versus Ag/AgCl in square wave voltammetry. The concentration of
Ru(bipy)32+
ion is determined by the two adsorption peaks at 285nm and 450nm in UV-
vis spectra. As shown in Figure 2.7( c ), the anion Fe(CN)63-
can only be driven across
the membrane by positive bias and the cation Ru(bipy)32+
can only be driven across the
membrane by negative bias. In addition, the concentration of transported ion increases
with the applied bias. At zero bias, the concentration of transported ion is not detectable,
confirming diffusive transport is inefficient for these membranes. These results are
consistent with the electric field induced electrophoretic transport. Between the two ions,
the anion Fe(CN)63-
is apparently much easier to transport through the MWCNTs and the
concentration is about 25 times higher at the trans reservoir when the bias magnitude of
1.5V is applied for 90 minutes between the two reservoirs. This observation is consistent
with the IV curves in Figure 2.7b.

44
Figure 2.7. Transport of small molecules (a) Schemes of the molecular structure of anion
Fe(CN)63-
and cation Ru(bipy)32+
and their hydrated diameters. (b) The measured I-V
curves when the cis and trans reservoirs are filled with K3Fe(CN)6/KCl(green line),
Ru(bipy)3Cl2/KCl and Ru(bipy)3Cl2/ K3Fe(CN)6, respectively. The black curve is a control
experiment in which both reservoirs are filled with KCl. The concentration of KCl
solution is 100mM and the concentration of anion Fe(CN)63-
or cation Ru(bipy)32+
is
25mM. (c) The concentration of anion Fe(CN)63-
(red square) and cation Ru(bipy)32+
(blue triangle) at the trans reservoir as a function of the applied bias. The time is always
90 minutes. The solid lines are guides for the eye.

45
What is the reason for the big difference in transport between anion Fe(CN)63-
and cation
Ru(bipy)32+
? Interestingly, the much higher rejection of cation Ru(bipy)32+
than anion
Fe(CN)63-
is opposite to the observation in small diameter DWCNTs,26
in which the anion
is rejected by the negative charged carboxyl groups at the CNT ends. Because of the
much bigger diameter of MWCNT in these membranes, the charges carried by the ions
and at the CNT ends are likely fully screened by the electric double layer (EDL) at
100mM KCl concentration. Therefore, the electrostatic interactions between ions and
CNT ends are not important. In addition, the hydrated diameter of anion Fe(CN)63-
is
only slightly smaller than cation Ru(bipy)32+
. So size induced steric hindrance will not
contribute significantly to such obvious ion selectivity. The reason may be attributed to
the stronger molecular interaction between the cation Ru(bipy)32+
and the curved CNT
inner surface. We also compared the transport between anion Fe(CN)63-
and cation
Ru(bipy)32+
through nominal 20 nm pore diameter AAO membrane and the difference is
still obvious but much smaller (see Figure 2.8). This experimental result supports that the
ion selectivity in CNT membrane is mainly due to surface interactions.

46
Figure 2.8 (a) The log-log plot of ionic conductance as a function of KCl concentration
for both CNT membrane (red curve) and AAO membrane (blue curve). The experimental
data (dot) are fitted by linear functions. (b) The concentration of anion Fe(CN)63-
(red
square) and cation Ru(bipy)32+
(blue triangle) at the trans reservoir as a function of the
applied bias. The time is always 90 minutes. The solid lines are guides for the eye.
We also studied the transport of DNA through this membrane. Theoretical simulations
have made predictions that single-stranded DNA can pass through a CNT under external
electric field.27,28
The translocation of short single-stranded DNAs through SWCNT has
also been reported.27,29
TEM revealed clear images of ssDNAs inside SWCNT, which
were injected by electrical field.30
Interestingly, the ionic current signatures during DNA
translocation in individual SWCNT are quite different from those in silicon based
nanopore/nanochannel.20,31
There are still no studies on the transport of DNA though big
diameter MWCNT membranes. Here, we investigated the translocation of a 12mer
ssDNA (GTCGTCGTCGTC) through the MWCNT membrane. As shown in Figure 4a,
47
no DNA is detected in UV-vis spectrometer at the trans reservoir when a bias of 3V is
applied across the membrane for 60 minutes. The same magnitude of bias is also applied
for a longer time (> 120 minutes) and still no DNA is detected by UV-vis spectrometer.
The difficulty of transporting ssDNA through these MWCNT membranes is probably due
to (1) the strong interactions between CNT inner surface and ssDNA, and (2) the lack of
electroosmosis in these big diameter MWCNTs. It has been well-studied that ssDNA will
adsorb strongly to CNT outer surface due to pi-pi stacking.34
Therefore, without the
efficient electroosmotic pumping, the applied electric field is likely not enough to
overcome the interaction force between ssDNA and CNT inner surface and cannot drive
ssDNA through the large diameter MWCNT. To test this hypothesis, we increase the
driving force by adding a small pressure difference (98 Pa) between two reservoirs. As
the green curve shown in Figure 2.9a, ssDNA is detected at the trans reservoir. We also
studied the electrophoretic transport of negatively charged 5nm gold nanoparticles. As
shown in Figure 2.7b, 5nm gold nanoparticles can be detected at the trans reservoir by
UV-vis spectrometer after applying a 2V bias across the membrane for 6 hours. Although
the 5nm gold nanoparticle has bigger size than 12mer ssDNA, the interaction between
gold NPs and CNT surface is presumably weaker than ssDNA due to the citrate coating
on the surface of gold NPs. Therefore, 5nm gold NPs are easier to transport through the
MWCNT membrane. These results suggest the interactions between particles and the
hydrophobic CNT inner surface strongly affect their electrophoretic transport through
these large diameter MWCNT membranes.

48
Figure 2.9. (a) UV-vis spectra of 12mer ssDNA at the trans reservoir after applying 3V
bias (red) and after applying 3V bias and 98 Pa pressure simultaneously for 60 minutes
(green). The solution in the cis reservoir is 5μM ssDNA in 100mM KCl solution. (b) UV-
vis spectra of 5nm (red) and 10nm (blue) Au nanoparticles at the trans reservoir after
applying a 2V bias for 6 hours. No pressure is applied.The concentration of Au NPs at
the cis reservoir is 60 μM in 1mM KCl solution.
2.4.2 Chemical Modification Effects on Transport
Finally, we studied how chemical modification of CNT membrane affects particle
transport. The chemical modification at the CNT ends may affect the particle transport by
steric hindrance, electrostatic interactions and chemical bonding. During the fabrication,
the CNT ends acquire carboxylate groups due to the oxygen plasma process. A variety of

49
chemical modifications on the CNT ends can be easily accomplished by using well-
established carbodiimide chemistry to couple carboxylic acid group with amine group.
Similar to previous reports,8,32
a very simple molecule, ethanolamine is used to modify
the membrane, which will neutralize the negatively charged carboxyl groups (when
pH>4) and may hinder the particle transport at the pore entrance. The schematics of the
unmodified and modified CNT ends are shown in the inset of Figure 5a. We first
measured ionic current through these MWCNT membranes before and after the chemical
modification in KCl solution. No difference in the ionic current was observed (see Figure
S4). This suggests that the modification does not affect the transport of small ions, such
as K+ and Cl
-. We then measured the transport of bigger particles, including 12mer
ssDNA (GTCGTCGTCGTC) and 5nm gold NPs under a small pressure (~147 Pa). The
results are shown in Figure 5. The transport of ssDNA and 5nm diameter gold NPs across
the membrane is obviously suppressed by the modification (blue curves in Figure 5 a
and b). The observed effect is most likely due to steric hindrance because there is no
charge on the CNT ends after modification. To further confirm the chemical modification
effect, we use oxygen plasma to remove the modified molecules and then redo the
modification. As shown in Figure 5a, the CNT membranes can be repeatedly modified
and hinder the transport of ssDNA. Here we just use a simple molecule to demonstrate
the capability of reversible chemical modification on these parylene embedded MWCNT
membranes. By using rational designed molecules, we expect to enhance selectivity and
electroosmotic flow in these MWCNT membranes.15

50
Figure 2.10 Effect of modification on transport (a) UV-vis spectra of 12mer ssDNA at
the trans reservoir after applying 147 Pa (1.5cm water height difference) for 120 minutes
for membrane after ethanolamine modification(red), after removing the modification by
oxygen plasma (green) and after ethanolamine modification again(blue). The initial
concentration of ssDNA at the cis reservoir is 5μM. (b) The UV-vis spectra of 5nm Au
NPs in 1mM KCl at the trans reservoir before (green) and after (blue) ethanolamine
modification. The concentration of Au NPs at the cis reservoir is 10 μM in 1mM KCl
solution. A pressure of 147 Pa is applied for 36 minutes.
2.5 CONCLUSIONS
In summary, we have successfully fabricated parylene encapsulated vertically aligned
large diameter MWCNT membranes. In contrast to small diameter DWCNTs and
SWCNTs, electroosmosis in these large diameter MWCNTs is weak. Therefore an
electric field can only provide a weak force to drive ions and small molecules. The
transport is also significantly affected by the interactions with the hydrophobic CNT
51
inner surface, leading to enhanced selectivity for small molecules. Chemical
modification on these MWCNT membranes also shows obvious effect on the
translocation of particles.
From the measurements of the forest membranes, it is however obvious that
single molecule information is hard to obtain via this route. Thus, while single CNT
based devices pose the disadvantage of lack of fabrication control and array model CNT
forest membrane based devices lack single molecule precision, we focus on the next
possible route to nanofluidic DNA sensing – solid state nanopores. Chapter 4 discusses
functionalized nanopore fabricaton and results. Before we move on to chapter 4, we
discuss the concept of functionalization in chapter 3. This is useful to understand the
implications of functionalization in other kinds of sequencing approach (such as
recognition by tunneling). Before moving to chapter 3, it is important to mention that the
possibilities of incorporating CNT properties in nanopore platform have also been
explored through the synthesis and use of graphene nanopores in a collaborative effort
with Dr. Smirnov ( New Mexico State University) and Dr. He (Florida International
University). The details of this work are presented in Appendix B.

52
2.6 REFERNCES
1. Kroto, H. W., Heath, J. R., O’Brien, S. C., Curl, R. F. & Smalley, R. E. C60:
Buckminsterfullerene. Nature 318, 162–163 (1985).
2. Helical microtubules of graphitic carbon. at
<http://www.nature.com/nature/journal/v354/n6348/pdf/354056a0.pdf>
3. Dresselhaus, M. S., Dresselhaus, G. & Avouris, P. Carbon Nanotubes: Synthesis,
Structure, Properties and Applications. (Springer, 2001).
4. Odom, T. W., Huang, J.-L., Kim, P. & Lieber, C. M. Structure and Electronic
Properties of Carbon Nanotubes. J. Phys. Chem. B 104, 2794–2809 (2000).
5. Meyyappan, M. Carbon Nanotubes: Science and Applications. (CRC Press,
2004).
6. Micro- and Opto-Electronic Materials and Structures: Physics, Mechanics,
Design, Reliability, Packaging: Volume 1 Materials Physics / Materials ... Physical
Design / Reliability and Packaging. (Springer, 2007).
7. Hummer, G., Rasaiah, J. C. & Noworyta, J. P. Water conduction through the
hydrophobic channel of a carbon nanotube. Nature 414, 188–190 (2001).
8. Whitby, M. & Quirke, N. Fluid flow in carbon nanotubes and nanopipes. Nat
Nano 2, 87–94 (2007).
9. Noy, A. et al. Nanofluidics in carbon nanotubes. Nano Today 2, 22–29 (2007).
10. Schoch, R. B., Han, J. & Renaud, P. Transport phenomena in nanofluidics. Rev.
Mod. Phys. 80, 839–883 (2008).
11. Mattia, D. & Gogotsi, Y. Review: static and dynamic behavior of liquids inside
carbon nanotubes. Microfluid Nanofluid 5, 289–305 (2008).
12. Lee, C. Y., Choi, W., Han, J.-H. & Strano, M. S. Coherence Resonance in a
Single-Walled Carbon Nanotube Ion Channel. Science 329, 1320–1324 (2010).
13. Hinds, B. J. et al. Aligned Multiwalled Carbon Nanotube Membranes. Science
303, 62–65 (2004).
14. Holt, J. K. et al. Fast Mass Transport Through Sub-2-Nanometer Carbon
Nanotubes. Science 312, 1034–1037 (2006).

53
15. Liu, H. et al. Translocation of Single-Stranded DNA Through Single-Walled
Carbon Nanotubes. Science 327, 64–67 (2010).
16. Strano, M. S. et al. Electronic Structure Control of Single-Walled Carbon
Nanotube Functionalization. Science 301, 1519–1522 (2003).
17. Qin, X., Yuan, Q., Zhao, Y., Xie, S. & Liu, Z. Measurement of the Rate of Water
Translocation through Carbon Nanotubes. Nano Lett. 11, 2173–2177 (2011).
18. Wu, J., Gerstandt, K., Zhang, H., Liu, J. & Hinds, B. J. Electrophoretically
induced aqueous flow through single-walled carbon nanotube membranes. Nat Nano 7,
133–139 (2012).
19. Majumder, M., Chopra, N. & Hinds, B. J. Mass Transport through Carbon
Nanotube Membranes in Three Different Regimes: Ionic Diffusion and Gas and Liquid
Flow. ACS Nano 5, 3867–3877 (2011).
20. Sun, X., Su, X., Wu, J. & Hinds, B. J. Electrophoretic Transport of Biomolecules
through Carbon Nanotube Membranes. Langmuir 27, 3150–3156 (2011).
21. Fornasiero, F. et al. Ion exclusion by sub-2-nm carbon nanotube pores. PNAS
105, 17250–17255 (2008).
22. Corry, B. Designing Carbon Nanotube Membranes for Efficient Water
Desalination. J. Phys. Chem. B 112, 1427–1434 (2008).
23. Wu, J. et al. Programmable transdermal drug delivery of nicotine using carbon
nanotube membranes. PNAS 107, 11698–11702 (2010).
24. Okada, T., Kaneko, T., Hatakeyama, R. & Tohji, K. Electrically triggered
insertion of single-stranded DNA into single-walled carbon nanotubes. Chemical Physics
Letters 417, 288–292 (2006).
25. Liang, X. & Chou, S. Y. Nanogap Detector Inside Nanofluidic Channel for Fast
Real-Time Label-Free DNA Analysis. Nano Lett. 8, 1472–1476 (2008).
26. Lulevich, V., Kim, S., Grigoropoulos, C. P. & Noy, A. Frictionless Sliding of
Single-Stranded DNA in a Carbon Nanotube Pore Observed by Single Molecule Force
Spectroscopy. Nano Lett. 11, 1171–1176 (2011).
27. Miserendino, S., Yoo, J., Cassell, A. & Tai, Y.-C. Electrochemical
characterization of parylene-embedded carbon nanotube nanoelectrode arrays.
Nanotechnology 17, S23 (2006).

54
28. Shoda, M., Bandow, S., Maruyama, Y. & Iijima, S. Probing Interaction between
ssDNA and Carbon Nanotubes by Raman Scattering and Electron Microscopy. J. Phys.
Chem. C 113, 6033–6036 (2009).
29. Karnik, R. et al. Electrostatic Control of Ions and Molecules in Nanofluidic
Transistors. Nano Lett. 5, 943–948 (2005).
30. Stein, D., Kruithof, M. & Dekker, C. Surface-Charge-Governed Ion Transport in
Nanofluidic Channels. Phys. Rev. Lett. 93, 035901 (2004).
31. Strano, M. S. et al. Electronic Structure Control of Single-Walled Carbon
Nanotube Functionalization. Science 301, 1519–1522 (2003).
32. Lee, C. Y., Choi, W., Han, J.-H. & Strano, M. S. Coherence Resonance in a
Single-Walled Carbon Nanotube Ion Channel. Science 329, 1320–1324 (2010).

55
3. DNA BASE RECOGNITION
3.1 SELF-ASSEMBLED MONOLAYER TECHNIQUE
Self-assembly (SA) involves spontaneous organization of interacting components to form
ordered supramolecular architectures without external manipulation. Self-assembly
occurs in many naturally occurring biological processes- such as spontaneous formation
of double stranded DNA helix, formation of lipid bi-layers etc.1–4
Molecular self-
assembly can generate ordered structures in 2D (monolayer) as well as 3D(crystal). The
simplicity of SAM formation process makes it inherently manufacturable and thus
technologically attractive for surface modification. Hence, this technique has gained
significance in many areas of technology such as macromolecular science,5,6
crystal
engineering,7,8
molecular devices7,9,10
etc.
Self-assembled monolayers (SAMs) can be formed as a result of spontaneous
chemisorption or physisorption. Alkanes adsorbed on highly oriented pyrolytic graphite
(HOPG) are physisorbed SAMs11–17
, while alkanethiolate SAMs on metals constitute a
case of chemisorbed SAMs.18–21
Three components constitute a SAM – a head group, a chain structure and a tail group.
(see Figure 3.1) When the metal or metal oxide substrate is left in a solution of the SAM
molecules, the head group gets chemisorped onto the metal surface.
In this dissertation, we use Alkanethiol SAM, where the thiol group is the head group
(point of attachment to the surface). Ethanol is a common solvent for Alkane thiol
SAMS, as it is not easily incorporated into the SAM.

56
Figure 3.1 A SAM Molecule.
SAM Formation in Ethanolic solutions have been extensively studies and time-resolved
characterizations establish the mechanism of SAM formation.18,19
The formation of
SAMs occurs through two distinct steps (see Figure 3.2): first, a rapid adsorption process
occurs followed by a slower consolidation process that can take hours during which the
chains stack together to form ordered arrays. It is during this later phase that lateral
diffusion occurs causing a reduction of defects and an enhanced packing of the chains. It
has been established that contaminants present on metal surface get displaced by the thiol
linkers during SAM formation, and this is one of the advantages of functionalizing
nanoscale surfaces with SAMs.

57
Figure 3.2 Schematic of Self-assembled Monolayer Growth Mechanism (adapted from.
Vericat et al20
) The final self assembly of SAM molecules bonded to the substrate
uniformly without any defects, is usually possible after a timeframe of 24 hours.

58
3.2 BASE DIFFERENTIATION MECHANISM
3.2.1 Recognition tunneling
Sequencing by recognition is a scheme of sequencing DNA where a binding
molecule recognizes each base of the DNA and produces a measurable and distinct
electrical signal. Theoretical calculations have demonstrated that electron tunneling could
be used to differentiate between bases of the DNA when the molecule is trapped between
two closely held electrodes. 21
An ideal system to experimentally verify this hypothesis is
the scanning tunneling microscope(STM). In the STM, a very sharp metallic probe is
approached to a conductive surface until a predetermined tunneling current is achieved.
From quantum mechanics, the wavefunction for a particle to tunnel through a one
dimensional potential barrier is given by ( ) ( √
( )
)
where E is the energy
of the particle and V is the potential barrier. By squaring this, we get the probability
density of finding a particle at any given location in the one dimensional space as
( ) ( √
( )
)
. The expression indicates that the probability of finding
the particle distance x away through a potential barrier falls off exponentially with x.
Thus, as the tip is moved farther away from the surface, the current will drop off
exponentially.22
This extreme electronic sensitivity could therefore be tapped to
distinguish the the bases of DNA molecule trapped in the STM junction. However, it is
almost impossible to use bare STM tips to align individual DNA base with subangstrom
precision and the gap distance in the calculation is too small to pass single-strand DNA
through easily. It is here that, the use of self-assembled monolayers becomes invaluable.

59
My colleagues attempted a series of STM experiments in pursuit of differentiating
DNA bases. At the very outset it was found that functionalizing the STM tip and
substrate with a SAM capable of specific hydrogen bon structures (with DNA
nucleosides) sharpened the current signal distribution by an order of magnitude. 4-
mercaptobenzoic acid was selected as the recognition or reader molecule. In nonpolar
environment, the OH group of the benzoic acid molecule behaves as hydrogen bond
donor and the carbonyl bond, as hydrogen bond acceptor. Density functional calculation
predicted that functionalizing the tip and substrate with recognition molecule SAM could
reduce the contact resistance to the nucleosides thus allowing electronic signatures of all
four DNA nucleosides to be resolved in a tunneling gap.23
The calculations indicated that
when individually trapped in a 2.5nm gap with the recognition molecule, each of the four
nucleosides formed four distinct hydrogen bonding complexes (see Figure 3.3).24
The
experiments agreed with the predicted results and established that functionalized
electrodes could lower contact resistance as well as enable selective orientations at the
tunnel junction.

60
Figure 3.3 (a) Schematic of recognition via tunneling in STM with SAM functionalized
tip and substrate. (b) The different Hydrogen bonding structures that are predicted to
form by 4-Mercaptobenzoic acid with different nucleosides when the tip and substrate are
separated by 2.5nm tunnel gap. 24

61
3.2.2 Imidazole – Universal Reader Molecule
4-Mercapto Benzoic acid formed the first generation of a series of reader
molecules that were synthesized subsequently. While 4-Mercapto benzoic acid
functionalization demonstrated nucleotiode differentiation, its use is restricted to
nonpolar solvents. Since aqueous medium is the preferred medium when it comes to
ambient dna sequencing, a water-friendly variant of the original reader; 4-
mercaptobenzamide was synthesized and tested. While this reader molecule could
distinguish between bases from short oligomers25
, one problem with 4-
mercaptobenzamide functionalization was the lack of tunneling signals from Thymine
nucleoside.
Figure 3.4 Schematic of Tunneling .Nucleotide differentiation in short oligomers with
Benzamide functionalized tip and substrate.25
62
Hence, the need for a reader molecule that could give tunneling signals with all
the bases in aqueous medium persisted and organic chemists from our lab proposed a
new reader molecule, 4(5)-(2-mercaptoethyl)-1H-imidazole-2-carboxamide (see figure
3.4). Also referred to as Imidazole reader, this chemical reagent can recognize all
naturally occurring DNA bases due to its ability to form non-covalent
complexes(through Hydrogen bonding) with individual DNA bases and thus generate
recognizable electronic signatures under an electrical bias. Hence it is referred to as
‘universal reader’.
The complete description and details of synthesis and characterization of this
molecule are provided by Liang et al.26
. The data presented therein show that the 1-H-
imidazole-2-carboxamide exists in a neutral form between pH 6–10. NMR studies
indicate that naturally occurring nucleosides interacted with 1-H-imidazole-2-
carboxamide through hydrogen bonding in a tendency of dG>dC≫dT>dA..

63
Figure 3.5 Chemical Structures of a series of ‘reader’ molecules synthesized for
recognition by tunneling. (a) The first generation reader molecule 4-mercaptobenzoic
acid. (b) A water-friendly variant of the original structure, 4-mercaptobenzamide (c) The
universal reader or Imidazole reader : 4(5)-(2-mercaptoethyl)-1H-imidazole-2-
carboxamide. This molecule is identified capable of forming distinct Hydrogen bonding
complexes with all the 4 nucleosides in aqueous medium.
The STM experiments that followed later, using Imidazole reader functionalization
demonstrated the ability to differentiate nucleosides.27
Thus far, all the STM
measurements mentioned in this work were done on gold surface, whereas for this
particular study, data from STM experiments with functionalized gold and palladium
metal surfaces (tip and substrate) were compared. Figure 3.6 explains the difference in
base differentiation for both the cases. Functionalized Palladium tips and substrate form a
more sensitive tunnel junction, leading to more distinguishable signals from individual
nucleosides.

64
Figure 3.6 When compared to gold electrodes, data from palladium
electrodes appear to be better separated with larger peak currents.27
3.3 IMIDAZOLE FUNCTINONALIZATION ON Pd
It is clear from the previous sections that Palladium substrates functionalized with
Imidazole have ultimately proved to be ideal choice for recognition by tunneling. This
section provides the experimental protocol for functionalization and characterization.
Palladium surface is cleaned either via Hydrogen flame annealing or piranha (Highly
oxidizing 3:1 mixture of Sulfuric Acid and Hydrogen Peroxide ) cleaning for 30-40s.
The solvent for Imidazole dissolution and SAM formation is Ehanol, as is the case of
most thilated SAMs. HPLC grade ethanol is used for superior quality of SAM. The
Ethanol solution is degassed with Argon in order to eliminate any dissolved oxygen from
the solution. Imidazole is then dissolved into this to form 0.1 mM ethanolic solution of
Imidazole. The clean Palladium substrate is then left to soak in Imidazole solution for 24

65
hours. The substrate is then rinsed gently with ethanol and and dried under nitrogen prior
to its use in experiments.
Ellipsometry, XPS and Wetting Data
Ellipsometric measurements of SAM thicknesses were performed on a Rudolph
Research AutoEL ellipsometer with a He-Ne laser light source, λ= 63 .8 nm and an
incidence angle of 70°. To calculate SAM thickness, a three phase model (ambient –
organic film – Palladium) was used. The ellipsometric parameters of the bare Palladium
substrate (obtained previously) were entered as set values and the refractive index of the
organic film was assumed to be 1.5. This is a common assumption, pre-programmed
in the instrument’s automatic measurement file. Each sample surface was measured at
five detection spots and the average SAM thickness was calculated by the instrument,
using in-built algorithm.
Measured length of trapping molecule
(Å)
Experimental thickness of
monolayer (Å)
9.2 7.5 ± 1.6
Table 3.1 Ellipsometry result for Imidazole functionalized Palladium surface
XPS measurements were performed to examine the chemical state of thiol group sulfur.
Measurements were performed on a VG ESCALAB 200i-XL photoelectron
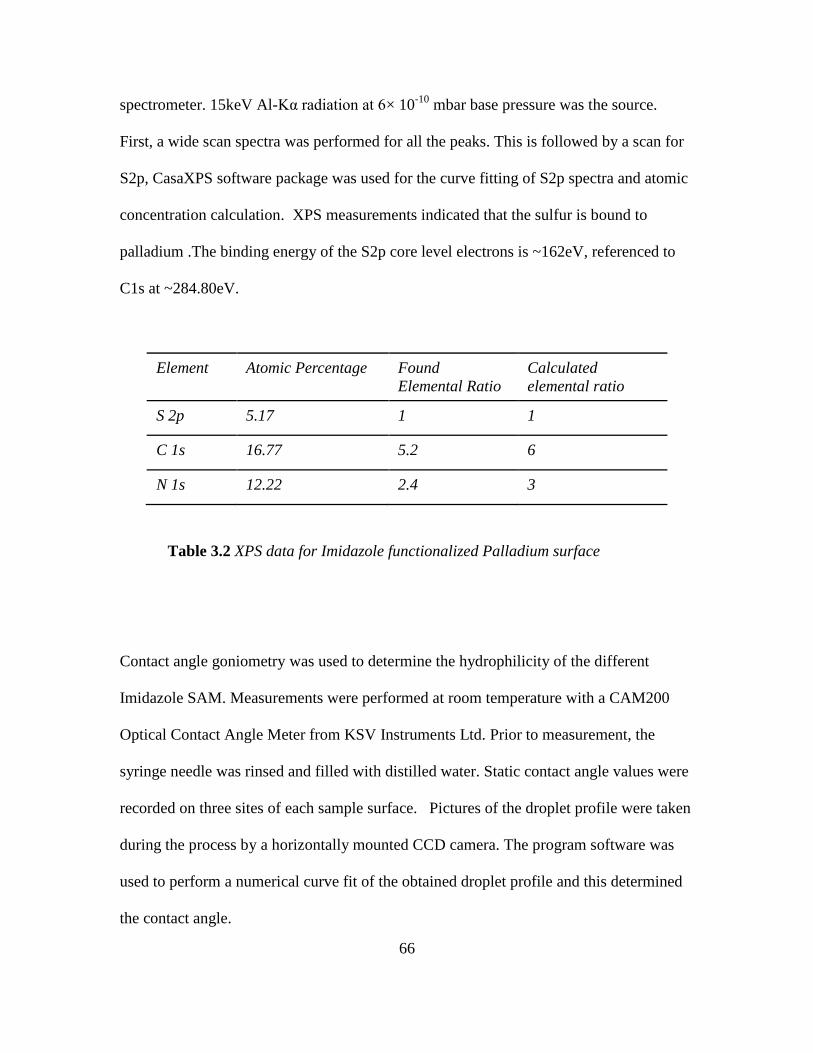
66
spectrometer. 15keV Al-Kα radiation at 6× 10⁻¹⁰
mbar base pressure was the source.
First, a wide scan spectra was performed for all the peaks. This is followed by a scan for
S2p, CasaXPS software package was used for the curve fitting of S2p spectra and atomic
concentration calculation. XPS measurements indicated that the sulfur is bound to
palladium .The binding energy of the S2p core level electrons is ~162eV, referenced to
C1s at ~284.80eV.
Element Atomic Percentage Found
Elemental Ratio Calculated
elemental ratio
S 2p 5.17 1 1
C 1s 16.77 5.2 6
N 1s 12.22 2.4 3
Table 3.2 XPS data for Imidazole functionalized Palladium surface
Contact angle goniometry was used to determine the hydrophilicity of the different
Imidazole SAM. Measurements were performed at room temperature with a CAM200
Optical Contact Angle Meter from KSV Instruments Ltd. Prior to measurement, the
syringe needle was rinsed and filled with distilled water. Static contact angle values were
recorded on three sites of each sample surface. Pictures of the droplet profile were taken
during the process by a horizontally mounted CCD camera. The program software was
used to perform a numerical curve fit of the obtained droplet profile and this determined
the contact angle.
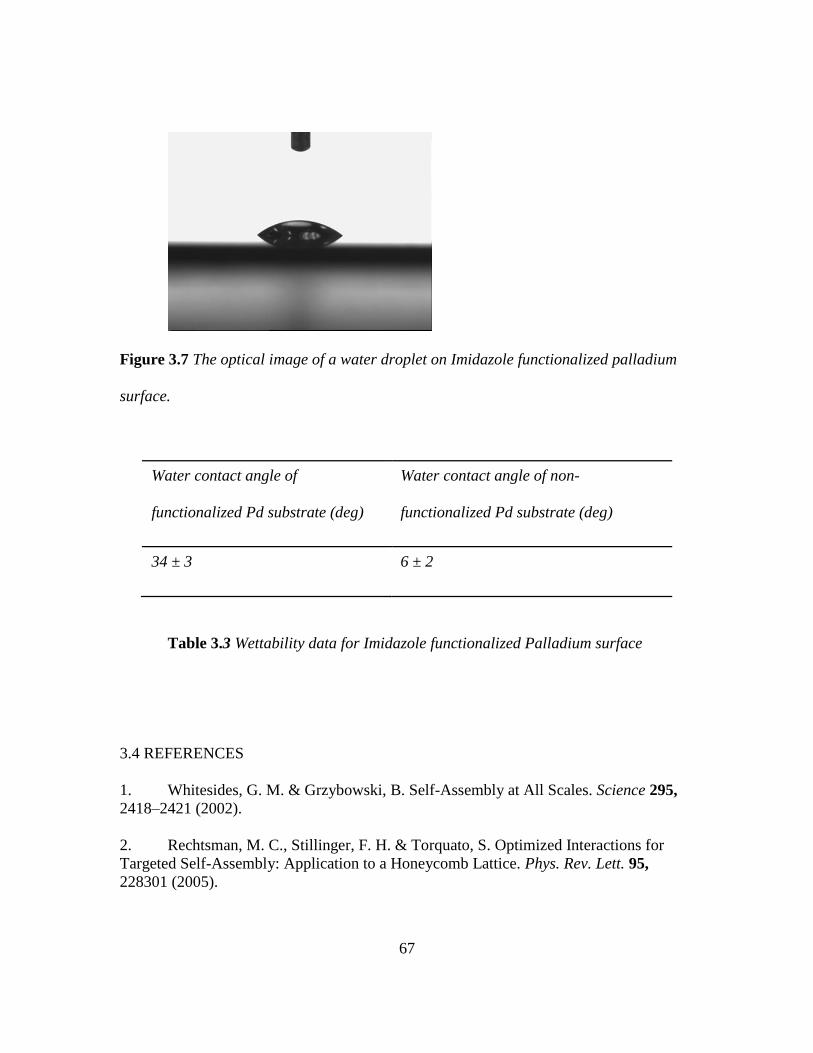
67
Figure 3.7 The optical image of a water droplet on Imidazole functionalized palladium
surface.
Water contact angle of
functionalized Pd substrate (deg)
Water contact angle of non-
functionalized Pd substrate (deg)
34 ± 3 6 ± 2
Table 3.3 Wettability data for Imidazole functionalized Palladium surface
3.4 REFERENCES
1. Whitesides, G. M. & Grzybowski, B. Self-Assembly at All Scales. Science 295,
2418–2421 (2002).
2. Rechtsman, M. C., Stillinger, F. H. & Torquato, S. Optimized Interactions for
Targeted Self-Assembly: Application to a Honeycomb Lattice. Phys. Rev. Lett. 95,
228301 (2005).

68
3. De Feyter, S. & De Schryver, F. C. Self-Assembly at the Liquid/Solid Interface:
STM Reveals. J. Phys. Chem. B 109, 4290–4302 (2005).
4. Hemsley, A. R., Collinson, M. E., Kovach, W. L., Vincent, B. & Williams, T. The
Role of Self-Assembly in Biological Systems: Evidence from Iridescent Colloidal
Sporopollenin in Selaginella Megaspore Walls. Phil. Trans. R. Soc. Lond. B 345, 163–
173 (1994).
5. MacGillivray, L. R., Subramanian, S. & Zaworotko, M. J. Interwoven two-and
three-dimensional coordination polymers through self-assembly of CuI cations with
linear bidentate ligands. J. Chem. Soc., Chem. Commun. 1325–1326 (1994).
6. Jenekhe, S. A. & Chen, X. L. Self-Assembly of Ordered Microporous Materials
from Rod-Coil Block Copolymers. Science 283, 372–375 (1999).
7. Aoyama, Y. et al. Crystal Engineering of Stacked Aromatic Columns. Three-
Dimensional Control of the Alignment of Orthogonal Aromatic Triads and Guest
Quinones via Self-Assembly of Hydrogen-Bonded Networks. J. Am. Chem. Soc. 118,
5562–5571 (1996).
8. Kato, T. Self-Assembly of Phase-Segregated Liquid Crystal Structures. Science
295, 2414–2418 (2002).
9. Fendler, J. H. Chemical Self-assembly for Electronic Applications. Chem. Mater.
13, 3196–3210 (2001).
10. Chen, J., Reed, M. A., Rawlett, A. M. & Tour, J. M. Large On-Off Ratios and
Negative Differential Resistance in a Molecular Electronic Device. Science 286, 1550–
1552 (1999).
11. Kim, K. & Matzger, A. J. Inequivalent Molecules in a Two-Dimensional Crystal.
J. Am. Chem. Soc. 124, 8772–8773 (2002).
12. Plass, K. E., Kim, K. & Matzger, A. J. Two-Dimensional Crystallization: Self-
Assembly, Pseudopolymorphism, and Symmetry-Independent Molecules. J. Am. Chem.
Soc. 126, 9042–9053 (2004).
13. Venkataraman, B., Flynn, G. W., Wilbur, J. L., Folkers, J. P. & Whitesides, G. M.
Differentiating Functional Groups with the Scanning Tunneling Microscope. J. Phys.
Chem. 99, 8684–8689 (1995).
14. Wintgens, D., Yablon, D. G. & Flynn, G. W. Packing of HO(CH2)14COOH and
HO(CH )15COOH on Graphite at the Liquid−Solid Interface Observed by Scanning
Tunneling Microscopy: Methylene Unit Direction of Self-Assembly Structures. J. Phys.
Chem. B 107, 173–179 (2003).

69
15. Wei, Y., Kannappan, K., Flynn, G. W. & Zimmt, M. B. Scanning Tunneling
Microscopy of Prochiral Anthracene Derivatives on Graphite: Chain Length Effects on
Monolayer Morphology. J. Am. Chem. Soc. 126, 5318–5322 (2004).
16. Kim, K., Plass, K. E. & Matzger, A. J. Conformational Pseudopolymorphism and
Orientational Disorder in Two-Dimensional Alkyl Carbamate Crystals. Langmuir 21,
647–655 (2005).
17. Rabe, J. P. & Buchholz, S. Direct observation of molecular structure and
dynamics at the interface between a solid wall and an organic solution by scanning
tunneling microscopy. Phys. Rev. Lett. 66, 2096–2099 (1991).
18. Nuzzo, R. G., Zegarski, B. R. & Dubois, L. H. Fundamental studies of the
chemisorption of organosulfur compounds on gold(111). Implications for molecular self-
assembly on gold surfaces. J. Am. Chem. Soc. 109, 733–740 (1987).
19. Bain, C. D. et al. Formation of monolayer films by the spontaneous assembly of
organic thiols from solution onto gold. J. Am. Chem. Soc. 111, 321–335 (1989).
20. Vericat, C., Vela, M. E., Benitez, G., Carro, P. & Salvarezza, R. C. Self-
assembled monolayers of thiols and dithiols on gold: new challenges for a well-known
system. Chemical Society Reviews 39, 1805 (2010).
21. Zwolak, M. & Di Ventra, M. Colloquium: Physical approaches to DNA
sequencing and detection. Rev. Mod. Phys. 80, 141–165 (2008).
22. Lindsay, S. Introduction to Nanoscience. (Oxford University Press, USA, 2009).
23. Lindsay, S. et al. Recognition tunneling. Nanotechnology 21, 262001 (2010).
24. Chang, S. et al. Electronic Signatures of all Four DNA Nucleosides in a
Tunneling Gap. Nano Lett. 10, 1070–1075 (2010).
25. Huang, S. et al. Identifying single bases in a DNA oligomer with electron
tunnelling. Nat Nano 5, 868–873 (2010).
26. Liang, F., Li, S., Lindsay, S. & Zhang, P. Synthesis, Physicochemical Properties,
and Hydrogen Bonding of 4(5)-Substituted 1-H-Imidazole-2-carboxamide, a Potential
Universal Reader for DNA Sequencing by Recognition Tunneling. Chemistry – A
European Journal 18, 5998–6007 (2012).
27. Chang, S. et al. Palladium electrodes for molecular tunnel junctions.
Nanotechnology 23, 425202 (2012).

70
4. FUNCTIONALIZED NANOPORES FOR DNA ANALYSIS
Nanopores are unique not only because they facilitate the exploration of new physics at
the nanometer scale, but also due to the expanding progress in fabrication techniques that
make it possible to dictate precision in geometry, dimensions and chemistry on that scale.
This chapter first elucidates the major techniques involved in fabricating functionalized
pores. This is followed by a description of the single molecule translocation experiments
and their implications.
4.1 PALLADIUM ELECTRODE FABRICATION
4.1.1 Electron Beam Lithography
Any sort of semiconductor device fabrication usually mandates patterning of selective
areas of samples to accommodate for standard processing steps such as etching,
deposition etc. The technique of creating patterns that distinguish or “mask off” selected
regions for further processing is known as “lithography”. Electron Beam Lithography is
a process that uses a finely focused electron beam to write patterns in thin films of
electron sensitive material. When a finely focused beam of electrons is accelerated at a
resist surface, very high resolution patterns can be produced due to the fact that the
wavelength of electrons are smaller than that of Ultra violet photons (by 3 orders of
magnitude).1 The basic steps involved in any lithographic process are illustrated in
Figure 4.1. First the semiconductor surface is cleaned to remove any contaminants that
may result in poor adhesion of the e-beam resist film. The e-beam resist is mostly an
organic polymer that is

71
Figure 4.1 Schematic of Lithography. A schematic illustrating sequence of
steps required to pattern a substrate by e-beam exposure of positive and negative
resist.
‘sensitive’ to the incident e-beam and can ‘resist’ chemical attack of the underlying
substrate. The resist is deposited via by spin-coating a solution of the polymer dissolved
in an appropriate solvent. (This step is sometimes preceded by spin-coating an adhesion
promoter to enhance the adhesion of the resist.) The substrate is then baked at a
temperature above the boiling point of the solvent so as to evaporate excess solvent from
the film and thermally anneal the stress built up in the film during spin coating.

72
During exposure, a computer generated pattern file directs a tightly focused electron
beam to desired locations on the resist surface. The pattern is discretized into a series of
pixels and the beam is deflected, scanned, turned off and on as per the pixilated pattern.
Irradiated area of resist undergoes chain scission. Chain scission can cause fragmentation
of high weight polymers into smaller chains or induce crosslinking by generating radicals
within the resist. This causes lowering of molecular weight distribution in the former case
and increasing in the latter. The substrate is then immersed in a developer solution.
Depending on whether the exposed regions are rinsed away (former) or remain (the
latter), the lithographic process is called ‘positive’ or ‘negative’ respectively.
Typically this step is followed by metal deposition after which the substrate is immersed
in a solvent. Metal deposited on the substrate remains while the metal on the damaged
resist is rinsed away along with the resist. The result is high resolution metal pattern on
the substrate.
4.1.2 Fabrication Protocol
The starting substrates used for fabrication of nanopores are standard TEM nitride
membrane windows purchased from Norcada inc. These are 3 x 3 mm2
silicon chips
comprising of 200 µm thickness Silicon frame with a central window where a thin
Silicon Nitride membrane is suspended (see Figure 4.2 ).

73
Figure 4.2 The optical image of the SiN membrane chip with grid of markers
The Silicon Nitride membranes are low stress and robust. On the central free standing
region of SiliconNitride membranes, a restricted area pattern of Palladium needs to be
deposited. In order to locate and lay down Palladium electrode, the electron beam
lithography technique is used. First an alphanumerical grid of location reference Au/Cr
(35nm/5nm) markers are laid onto the chip. This grid is used to locate the position of the
central membrane area accurately. AUTOCAD is used to generate pattern of 10µm
x10µm square on the membrane. The chip is then subjected to the fabrication steps
illustrated in Figure 4.3.
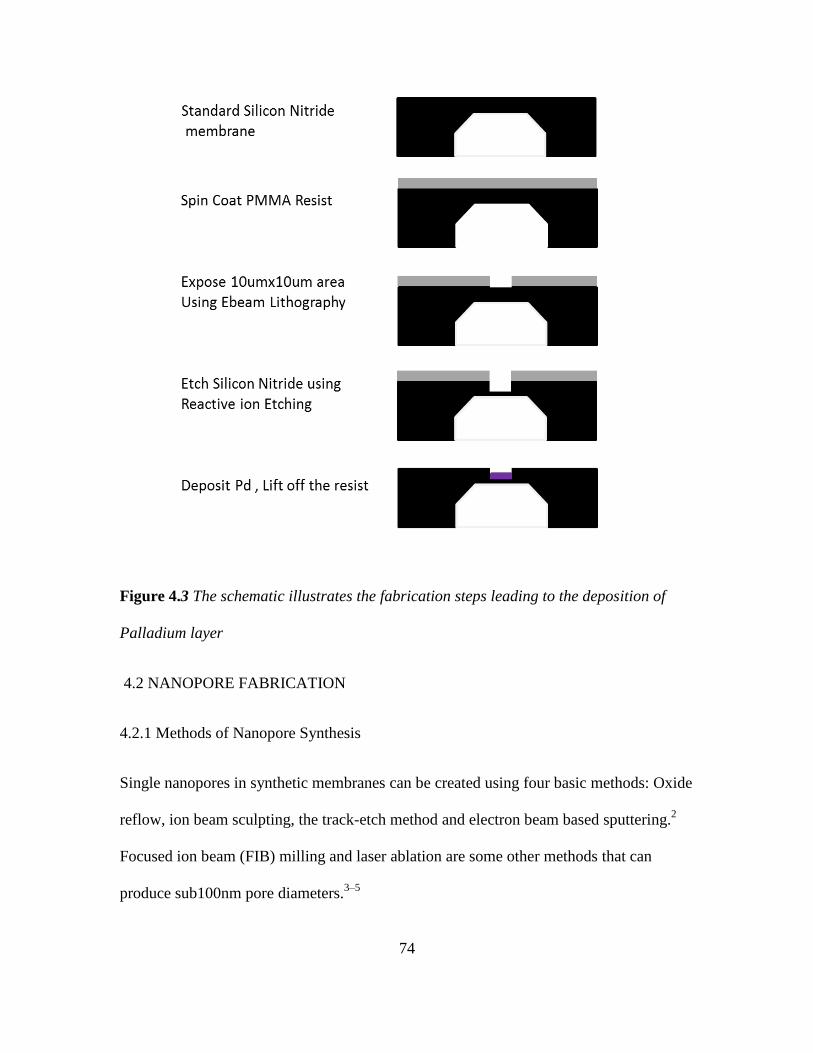
74
Figure 4.3 The schematic illustrates the fabrication steps leading to the deposition of
Palladium layer
4.2 NANOPORE FABRICATION
4.2.1 Methods of Nanopore Synthesis
Single nanopores in synthetic membranes can be created using four basic methods: Oxide
reflow, ion beam sculpting, the track-etch method and electron beam based sputtering.2
Focused ion beam (FIB) milling and laser ablation are some other methods that can
produce sub100nm pore diameters.3–5

75
Electron Beam Induced Oxide Reflow
The oxide reflow technique is a two- step process of drilling nanopore. First, electron
beam lithography is used to pattern 40-100nm holes in silicon membranes. Then, using
TEM6 high energy electron beam, the oxide surface surrounding the original pore is
fluidized. In substrates where the diameter of the pore is lesser than thickness of the
membrane, the fluidized oxide reflows causing the pore to shrink to less than 10nm
range. The shrinking phenomenon could be due to the build-up of hydrocarbon layer in
the nanopore during the electron beam irradiation.7 The main limitation of silicon oxide
pores formed by thermal oxidation is the high level of compressive stress and membrane
–buckling observed in these membranes, causing them to rupture frequently during DNA
translocation experiments.8 This implies the need for mechanically stable, low stress
membranes for nanopore formation.
Ion Beam Sculpting
The ion-beam sculpting process first developed by Li et al uses an energetic beam of Ar+
ions to form nanopores with dimensions as low as 1.5 nm in thin Si3N4 membranes.9
When a 3 keV Ar+ ion beam is rastered continuously over a Si3N4 sample at room
temperature, atoms get diffused into the pore region causing the nanopore to shrink. The
flow of matter to the developing nanopore cite showed temperature dependence with a
transition between pore opening and closing being consistently observed at ~5°C, under
76
the ion-beam conditions used. Pore expansion was attributed to ion 18 sputter erosion at
the pore edge, the dominant mechanism at low temperature and high ion flux Pore
closure was accredited to the formation of a stressed viscous surface layer at the lip of the
nanopore. The reduced viscosity and/or enhanced stress owing to implantation or surface
tension effects cause this layer to relax, thereby filling the nanopore. Feedback control
was used to precisely sculpt nanopores of various sizes using this process.
Track-Etch Method
In this method, a high energy beam of ions or nuclear fission fragments from a MeV
accelerator is made to bombard a thin sheet of polymer material.10–12
The irradiated
polymer sheet is then placed between two electrolyte chambers. One chamber is filled
with a chemical etchant (such as NaOCl) while the other is filled with a stopping agent
(KI). At high pH (pH=13) and elevated temperatures (~50℃), etching of the irradiated
track begins from one side, and continues until the etching is through and a pore is
formed. At this point the OCl- oxidize to Cl- ions thereby terminating the etch process
automatically. The pores created by this process have diameter less than 10nm.
Electron Beam Induced Sputtering
In this method, a focused convergent electron beam with sufficiently high current density
is used to sputter nanometer-sized pores in thin oxide or nitride membranes of thickness
less than 60nm. Electron Beam induced sputtering is increasingly being adopted as the

77
drilling method of choice because it provides a reliable, fast and direct way to make
nanopores.
High-resolution TEM has been used to explain nanopore formation kinetics in Si3N4 as a
balance between two competing processes: (a) material sputtering and (b) surface-tension
induced shrinking. In the same study, 4 to 8 nm in diameter nanopores were directly
drilled using a JEOL 2010F field emission TEM with an accelerating voltage of 200 keV
and a beam current density of 108 – 10
9 e nm
−2.
13It was also demonstrated that by
slightly defocusing the e-beam, (corresponding to ~106 e nm
−2 intensity), the drilled pores
could be contracted. TEM tomography of these solid-state nanopores revealed that the
sidewalls of the pores were angled (65° to the horizontal), attributed to the intensity
distribution of the e-beam around its focal point. After drilling, these pores formed an
‘hourglass’ structure with pore width being represented by the width of the narrowest
constriction.13,14
Reports from other structural studies of nanopores drilled using this indicate that the
shape of TEM drilled nanopores is typically double-coned with cone angles varying from
10°15
in ultrathin silicon nitride membranes up 45° in composite SiO2/SiN/SiO2
membranes.16
4.2.2 TEM drilling Protocol
In this work, all nanopores have been fabricated by electron beam sputtering in the JEOL
2010F Transmission electron microscope. The drilling procedure is described briefly. The

78
field emitting source is set at to 200kV accelerating voltage. A test sample is first loaded
and the objective lens is stigmated and focused onto the surface. The condenser aperture
is introduced and the eucentric height is established by adjusting the height of the sample
until the diffraction spot is eliminated. The surface is imaged at this point to check for
stability. If the sample is found to be drifting,, it is left to stabilize until there is minimal
drift. At this point, the beam is focused to a tight spot under the highest magnification
settings and a nanopore is drilled through the sample surface. The beam current and
energy settings can be adjusted so as to drill pore gradually for a time of 30-45 s. The
formation of the nanopore is indicated by the accompanying increase in electron flux
crossing the sample. As soon as the pore is formed, the condenser is spread and an image
of the fresh pore is captured via CCD camera. The beam is blanked immediately and the
sample is taken out of the TEM. The actual Pd membrane is loaded on to the TEM and a
nanopore is then drilled under the same

79
. Figure 4.4 TEM Image of sub 5nm nanopore.
conditions. It has been observed that for membranes thinner than 20 nm successive
imaging can introduce defects of the order of less than 1nm.While these defects do not
interfere with DNA translocation through the device, they do contribute to a higher
background current that may be undesirable. In order to circumvent this problem,
imaging is mostly performed on the test sample to get an idea of the pore dimensions
upto a point when the alignment, drill time settings repeatedly yield same pores of
consistent diameter. The actual membranes are then loaded onto the TEM and drilled
without changing any settings.

80
The size estimation is confirmed by conductance measurements done before performing
DNA translocation experiments.
The nanopores are stored in 50% IPA 50% water solution in order to avoid shrinkage and
clogging.It has been our observation that piranha cleaning of the nanopores within 5-6
hours of drilling prolongs the shelf life of the pore.
4.3 EXPERIMENTAL SET-UP
4.3.1 Flow Cell Assembly
In order to perform the single molecule studies described here, the experimental set up
necessitates that the nanopore be the bridge between two otherwise isolated reservoirs of
electrolytes. Barring the access via nanopore, electrolytes need to be completely isolated
from each other in order to mitigate all scope for leakage current. At the same time,
minimal macroscopic pressure on the chip, intended originally to prevent leakage path,
could by itself damage the suspended membrane of the chip that is just a few nm thin. To
balance the pressure and maintain a leak-free channel, polydimethylsiloxane (PDMS) is
used.
PDMS is an organo-silicon polymer with chemical formula
(H3C)3SiO[Si(CH3)2O]nSi(CH3)3. When subjected to crosslinking (Figure 4.3), the liquid
PDMS can be modified into a solid with hydrophobic surface.17

81
Figure 4.5 Cross linking in polydimethylsiloxane (PDMS)
Further, the amount of cross-linking reagent added can be varied to change the hardness
and rigidity of the resulting solid. Fluid compatibility studies in PDMS microchannels
show that water flow through the channels is non-destructive and causes no swelling.18
Due to these attractive properties, PDMS has been widely used for making microfluidic
devices.
PDMS is popular in microfluidic devices for its inertness, tunable rigidity, transparency
and easy wettability. Thus, the nanopore chip encapsulated by PDMS on either sides is
sandwiched between reservoirs of 1M KCl+PB salt buffer solutions. Microfluidic
channels are drilled through the PDMS to provide access for the solutions to the nanopore
area. Ag/AgCl electrodes, dipped in the solutions are connected to Axon Axopatch 200B
patch clamp amplifier (Figure 4.5).

82
Figure 4.6 The PDMS flow-cell assembly
The PDMS based flow cell has advantages of optical visibility during assembly and
experiment, convenient access to change analytes without applying pressure on the chip
and low access resistance due to elimination of long flow conduits.

83
However, the lowest analyte volume that can be analyzed in this set up is limited to
500 uL. Reducing this volume further would accommodate for minimizing the volume of
expensive analytes. In view of this need an alternative flow cell made of PEEK has been
designed and is ready for use in future experiments. The design and extended purpose of
this flowcell will be elucidated in the next chapter in the context of future work.
4.3.2 Wetting of Nanopore
One of the most common and perhaps tricky issues that experimentalists across the
nanofluidics research community face is the problem of nanopore wetting or rather
incomplete wetting. There are two basic reasons for this. Firstly, a nanopore chip
undergoes multiple fabrication steps spanning days of sample preparation before it is
mounted for the experiment. Hence it is natural to expect that the surface of the chip
maybe contaminated with hydrocarbons. Secondly, the set up in these experiments
involves interfacing nanometer scale channels with comparatively macroscopic channels,
such that practical access and manipulation is possible only up to macroscopic limit. This
could lead to trapped air bubbles and possibility of partial wetting.
In order circumvent these issues, cleaning by means of plasma or piranha
is usually recommended. For the devices used in this work, piranha cleaning step has
worked well in favor of establishing good pore wettability. In the case of functionalized

84
chips, the piranha cleaning is done before bringing the chip in contact with Imidazole
reader molecules. In addition to improving wettability, piranha treatment removed
surface contamination effecting in formation of more uniform SAM along the walls of
the nanopore.
Apart from the nanopore surface, the PDMS and the solution reservoirs are ultra-
sonicated for 20 minutes in Isopropanol Water mixture (1:1) in order to expel other
surface contamination. Degassing the salt buffers also eliminates the chance of air
bubbles in the fluidic channels.
4.4 NANOPORE I-V MEASUREMENTS
The successful drilling of a nanopore can be checked by perfomring an ionic flow
measurement using the nanopore. When 1M KCl + PB buffer is introduced to the
nanopore flow cell, standard IV curve is obtained by measuring current at different bias.
The I-V curves for different salt concentrations is plotted in the figure and it is observed
that linear behavior is maintained in high as well as low salt regime. The conductance vs
concentration is plotted in Figure 4.7. Upon addition of DNA, a jump in conductance is
typically observed. This is shown in Figure 4.8, for the case of a functionalized as well
as unfunctionalized nanopore
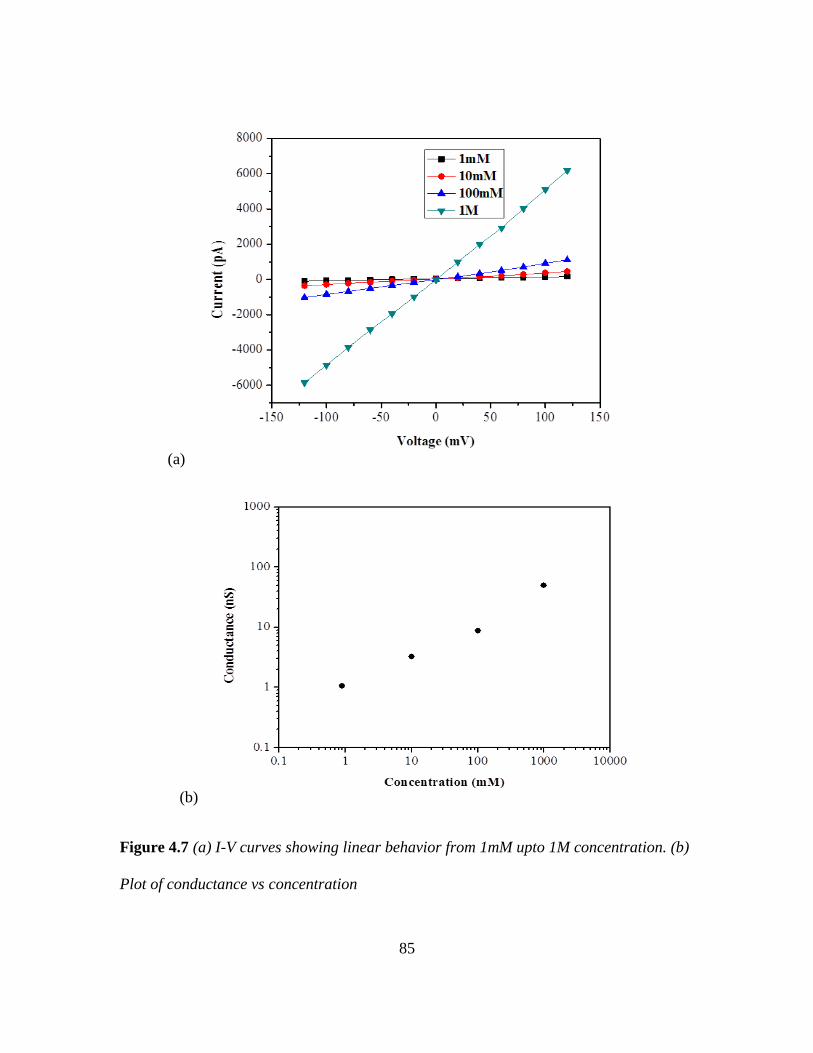
85
(a)
(b)
Figure 4.7 (a) I-V curves showing linear behavior from 1mM upto 1M concentration. (b)
Plot of conductance vs concentration

86
Figure 4.8 (a) Current vs. Voltage characteristics for an Imidazole functionalized
nanopore before adding ssDNA and (b) after adding ssDNA. On adding DNA, the
conductance for this pore increases from 21.1 nS to 55.5 nS (c) Current vs. Voltage
characteristics for an plain palladium nanopore before adding ssDNA and (b) after
adding ssDNA. The increase in conductance for this case is from 49.9nS to 66.76 nS.
4.4.1 Resistive Sensing Technique
Resistive Sensing technique is the fundamental principle behind nanopore detection,
irrespective of whether the pores are naturally occurring, biological ion channels or
synthetic nanopores. Figure 4.9 obtained with permission from a recent review on
nanopores19
shows the variety of nanopores being explored to date. The principle can
applied to sense a rage of particle size – from a few nm long DNA fragments upto micron
size cells (as used in Coulter Counters).20

87
Figure 4.9 Some examples of biological and synthetic nanopores. (a) The toxin α -
hemolysin secreted by Staphylococcus aureus 21
(b) MspA from Mycobacterium
smegmatis.22
(c) Engineered phi29 viral packaging motor23
. (d) Ion-sculpted pores in
silicon nitride membrane 9 (e) Sub-10 nm thick solid-state pores generated by dry etching
a selected area of a silicon nitride membrane and electron-beam pore drilling 24
.(f)
Pores in a suspended single-layer graphene membrane 25
. Images were obtained with
permission.

88
To understand the phenomenon, the physical properties of the analytes need to be
compared ( See Table 4.1).19
Species RH (nm) D (µm2s-1) Typical Concentration(M)
Red Blood Cell 3500 0.06 ~10-14
20-bp DNA fragment 3 140 10-9 – 10-6
K+, Cl- 0.14 1600 0.1-1
Table 4.1 Estimated hydrodynamic radii and Stokes diffusion coefficients of
aqueous species used in Coulter counters and nanopore sensors. Typical
experimental concentrations are also listed.19
From the list of hydrodynamic radii and diffusion constants in Table 4.1, it is clear that
the ions involved in pore-based sensing are smaller, faster and more concentrated than
the analytes they are used for detecting. This observation leads to three important
implications. Firstly, for every analyte passing the pore, greater number of ions should be
able to pass through the pore. Secondly, In order to sense the analyte, the pore needs to
have a diameter greater than the hydrodynamic radius of the analyte. Thirdly, due to the
fact that the ion happens to be the smallest hydrodynamic particle (radius 0.1nm), ionic
flow should be sufficient to differentiate two analytes that differ in cross section by the
ion’s hydrodynamic radius. Most importantly this implies that the detection of every
single analyte involves the passage of many ions through the nanopore.

89
4.4.2 Ionic and Biomolecular transport
When Voltage V is applied across a cylindrical nanopore, the ionic current through the
pore is approximated in high ionic strength solutions (>100mM) by
([ ] ) (
)
Solution Geometric Access Electroosmotic
Conductivity term resistance term
Where is the ionic current, is the number density of the species, is the
electrophoretic mobility of the species and is the elementary charge. The last term is
required to explain ion transport through highly charged pore surfaces, where is the
solution mobility of the counterion adsorbed on the charged pore and is the surface
charge density of the pore(opposite to the charge of the counterion )16
This equation
combines the effect of access resistance to the earlier transport studies.14,16,25
Contribution
of access resistance becomes more significant as the membrane thickness approaches
zero limit ( ).
When biomolecules such as DNA are introduced in a nanopore experiment, it is
interesting to understand the mechanism behind how long polymers find their way
through a very narrow pore. When the DNA concentration is very low, the interactions
between the DNA molecules are very low. In this regime, the process of capture is
governed by classic arrival time Poisson process. Thus the normalized probability of
arrival time-delay is given by:

90
( )
Where δt is the measured time-delay between successive events and Rc is the mean
capture rate. This is mostly true, except for situations where the mean wait time 1/Rc is
comparable to the transport time, the concentration of the analyte is high enough that
analyte molecules interact with each other or that the analyte solution is not mixed
uniformly.
In solid state nanopores, capture rate of the molecule is another important parameter. The
dependence of capture rate on applied bias for the case of ssDNA in solid state nanopores
has been studied The voltage profile outside the pore mouth is known to decay with
radial distance r from the pore as follows.26,27
( )
Where d is the diameter of the pore, h the pore height, and is the applied voltage.
When the negatively charged DNA approaches the vicinity of the pore via diffusion, the
diffusion is biased by electric field. Thus, the biased diffusion is a function of the electric
field as well as the diffusion, causing the radial distance r to be dependent on the DNA
length, and will be dependent on the total charge as well as the diffusion coefficient of
the DNA. So, in case of a diffusion –limited process, the radius of capture is linearly
dependent on the voltage.
Biological pores are known to have an exponential dependence of capture rate on the
voltage. This clearly indicates that the capture is not diffusion limited – meaning, every

91
molecule that diffuses towards the pore may not be captured.19
Or, that a fraction of
molecules that approach the vicinity of the pore, are rejected. Such a behavior may be
attributed to the entropic barrier inherent in a polymer threading into the confines of the
pore. The entropic barrier can however be reduced by increasing the applied voltage.
Hence beyond some threshold voltage, the entropic barrier could be overcome, and the
capture may become diffusion-limited. At that critical voltage, the capture rate switches
from exponential dependence onto a linear dependence on V.
4.5 DNA TRANSLOCATION EXPERIMENTS
4.5.1 Effect of Functionalization
After the flow cell is assembled under optical microscope and wetted, the entire set up is
placed inside a faraday cage. Current Voltage measurements are made using an Axon
Axopatch 200B patch clamp amplifier. The amplifier applies a constant potential across
the pore and measures the current necessary to maintain the potential drop. The current
signal is captured in real time using LABVIEW software. At the outset of the experiment,
the baseline current values are noted for various voltages so as to establish the open pore
conductance. Once this is established, the analyte molecules are introduced in the cis side
of device. Since the analytes here are mainly negatively charged DNA, they translocate
through the nanopore towards the positively charged electrode on the trans side. Each
single molecule crossing is detected by an accompanying transient decrease in the ionic
current. The width of the pulse represents the duration of the translocation event.

92
We first study the effect of Imidazole functionalization on DNA translocation. First, 63 nt
ssDNA is introduced into Pd nanopore that does not have any Imidazole on its surface. In
the presence of electric field, the ssDNA molecules translocate through the nanopore
yielding current spike signals. The data is collected, and the same chip is cleaned and
functionalized with Imidazole. Now, upon introducing the 63nt ssDNA ( 5'- CCT CGC
ATG ACT CAA CTG CCT GGT GAT ACG AGG ATG GGC ATG CTC TTC CCG
ACG GTA TTG GAC-3' from IDT) it is observed that the current spikes are of relatively
longer duration. After collecting data, the chip is cleaned and Pd is etched away. The
resulting silicon nitride nanopore is once again set up to analyze the translocations of
63mer. Figure 4.10 represents sample spike from three sets of data gathered during the
experiment. From examining the spike duration, it is evident that the presence of
Imidazole reader causes the translocation to slow down. The same analyte molecule now
takes a longer time causing a longer blockade in the ionic current and thus a longer event.
A statistical analysis of the events shows that the median event-duration tM <0.6 ms for
the Pd pore, 12 ms for the functionalized pore and <0.2 ms for the stripped pore.

93
Figure 4.10 (a) Illustration of 4nm diameter Palladium coated silicon nitride nanopore
with functionalization. (b) Histogram comparing duration of events with and without
functionalization. (c), (d) and (e) show sample spikes for Palladium, Imidazole
functionalized Palladium and Bare Silicon nitride nanopores respectively.

94
4.5.2 Positive control with 1-Octanethiol
Imidazole functionalized substrates and tips have already established base resolution
capabilities, as indicated from previous chapter disucssions. Also, from 4.5.2
experimental results indicate that Imidazole functionalization slows the translocation of
DNA molecules through Palladium nanopores. Hence, the question that arises is –
whether the the slowing down of translocations is because of the Hydrogen bond
mediated interactions of the DNA with the Imidazole reader or whether it is due to the
steric hindrance due to the mere presence of the reader molecules.
In order to investigate this underlying mechanism of slowing down, the following
experiment was conducted. 1-Octanethiol is chosen as a positive control. From the
structure of the molecule ( Figure 4.11), it is known that 1Octanethiol is a thiol
terminated alkane chain which lacks any H bonding capacity, when tethered to metal.
Figure 4.11 Molecular structure of 1-Octanethiol (left) and Imidazole (right).

95
Hence, two identical Palladium nanopores were fabricated. One of them was
functionalized with 1-Octane thiol and the other, with Imidazole reader. After a 24 hour
gap, both nanopores were set up to translocate 120nt ss DNA (5'- CCT CGC ATG ACT
CAA CTG CCT GGT GAT ACG AGG ATG GGC ATG CTC TTC CCG ACG GTA
TTG GAC CCT CGC ATG ACT CAA CTG CCT GGT GAT ACG AGG ATG GGC
ATG CTC TTC CCG ACG GTA -3' from IBA Lifesciences). From the data collected, it
is seen that the translocation events are more prolonged (median translocation time 13.9
ms) in the case of Imidazole functionalized pore, whereas in the Octanethiol
functionalized pore, they translocate very quickly ( median translocation time 0.5 ms).
Figure 4.12 displays a sample trace from both the experiments and the spike shape is
indicative of the difference in translocation time. When plotted in amplitude vs distance
graph, the events from the two pores are very well separated. From this, it is evident that
H bonding moieties of Imidazole that cause the molecule to translocate significantly
than they would in a non H-bond forming functionalized pore.
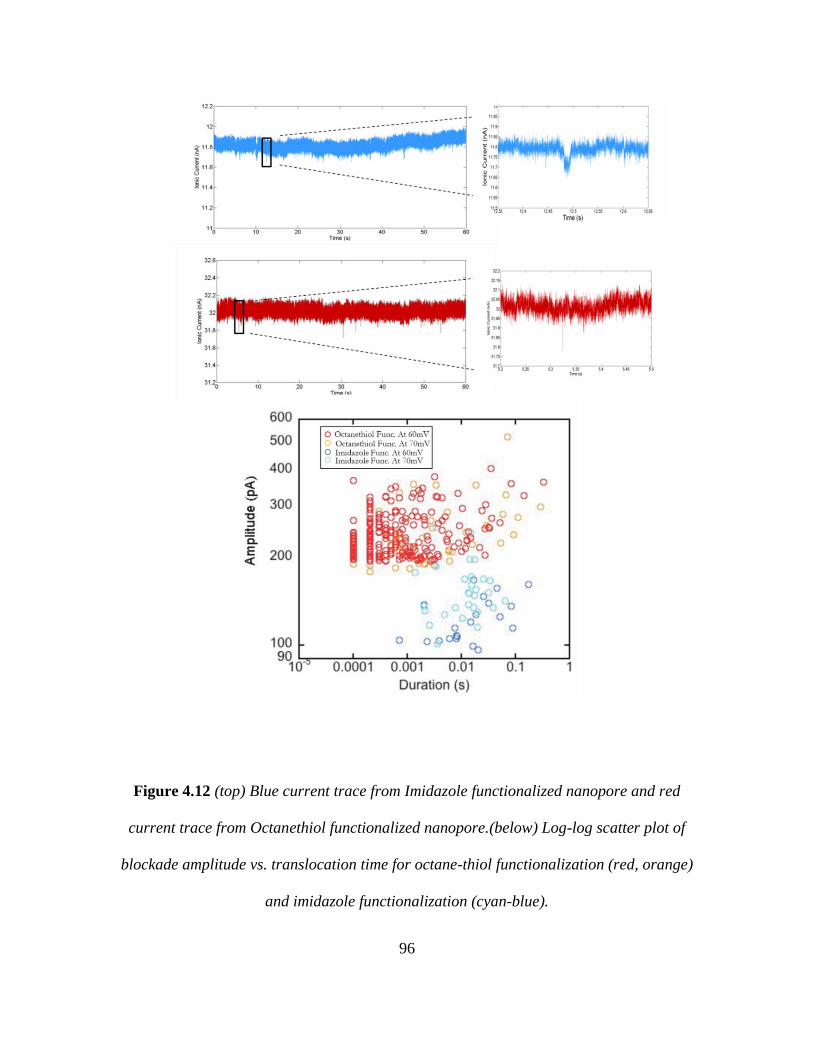
96
Figure 4.12 (top) Blue current trace from Imidazole functionalized nanopore and red
current trace from Octanethiol functionalized nanopore.(below) Log-log scatter plot of
blockade amplitude vs. translocation time for octane-thiol functionalization (red, orange)
and imidazole functionalization (cyan-blue).

97
4.5.3 Models for slowing Translocation
When DNA molecule translocates through a functionalized nanopore, the molecule
seems to be under the competing effects of electrophoretic force pushing towards the
positive electrode versus hydrodynamic drag generated by the electro osmotic ion current
(which is directed opposite to DNA motion). In addition to this the functionalization
causes hydrogen bond interactions that effect a frictional drag on the molecule. If such is
the case, then it becomes very interesting to compare the translocation behavior with
studies that describe the dissociation of hydrogen bonded complexes.
One of the routes to getting information about the lifetime of hydrogen bonded
complexes, is to study the dynamics of dissociation of these using dynamic force
spectroscopy (DFS) technique. DFS experiments involve pulling of bonded molecular
complexes apart with an atomic force microscope (AFM) and extrapolating data to zero
applied force to discover the intrinsic dissociation rate. The binding partners of interest
are attached to the AFM tip and a surface via well-characterized linkers (such as PEG
tethers) and the probe displacement can be controlled with nanometer precision. The
force acting on the tip is measured as a function of the distance while the tip is cycled up
and down relative to the surface. Retracting the probe with constant speed increases the
force acting on the chemical bond between the two binding partners until the molecules
dissociate. The distribution of the rupture forces is measured for various speeds of
retraction and quantitative information about the energy-landscape parameters and kinetic
constants of the interaction can be obtained from these experiments.

98
The theoretical modeling of single-bond rupture in DFS is well established In brief, the
rupture of a bond that is subjected to a time-dependent force, F(t) or F(s(t)), is a one-step
rate process with the force-dependent dissociation rate k(f). The exact functional
dependence of k(f) on force f is determined by the underlying reaction potential, U(x),
where x denotes the reaction coordinate. Many models describing this dependence have
been developed. The Kramer’s theory of transition states gives a basic description of the
response of molecular systems to the application of force [S. M. Lindsay, Introduction to
Nanoscience, Oxford University Press, 2009] The energy landscape for binding and
unbinding of a complex is shown in the figure below.
Figure 4.13 The energy landscape for a transition from bound to unbound state. Work
done on the system lowers the energy barrier increasing the dissociation rate.

99
The solid line curve represents the energy landscape for a transition from bound state A
to unbound state B separated by an energy barrier ETS. The reaction proceeds along the
reaction coordinate where the transition state is the maximum in potential at a distance
xTS from the minimum of the bound state. When a force F is applied to this system, the
system moves a distance d under this effect and the work done on the system equals F.d.
The sum of the work done and the original potential results in a new tilted potential
landscape, represented by the dashed line. In the process, the energy of the barrier at the
transition state is lowered and the rate of dissociation of bonded species increases. Evan’s
modification of the Kramer’s theory calculates the dissociation constant in terms of the
curvature parameters lC and lT given by the formula
or
.
EB represents the energy barrier, and kB T at room temperature is 4.1pN nm. D represents
the diffusion constant for the Brownian motion of the species in the potential well (can be
obtained from Einstein-Smoluchowski equation). The dissociation constant at zero force
is represented by k0.
To gain better insight into the barriers that control the dissociation kinetics of dna base
pairs, Fuhrmann et al [ Biophysical Journal (102)10, 2381-2390 (2012)] conducted a
study of the dissociation kinetics of A-T basepair and its triply hydrogen-bonded analog,
2AA-T using DFS. Similar experiments with 2benzamide-A pair was reported by Huang
et al [Nature Nanotechnology 5, 868-873 (2010)]. The values of k0 and xTS from above
mentioned literature are tabulated below.

100
Combination k0(s-1
) xts (nm)
2 benzamide+ dA 0.28 0.78
dAA+dT (3 HB) 0.23 0.6
dA+dT (2HB) 0.52 0.7
Table 4.2 Dissociation parameters from DFS data in literature. k0 and xTS for
2benzamide + dA (from Huang et al), dAA +dT and dA + dT (from Fuhrmann et al)
In the context of DNA translocating through functionalized nanopores, if the slowing is
activated, the lifetime of the bonded complex can be predicted from the values obtained
from DFS AFM experiments. The lifetime T of a complex in solution is inversely
proportional to the dissociation constant k. Hence from the equation for the
equation for T can be obtained as . Since EB = F xTS, equation for T becomes
. From Table 4.2, taking mean value of xTS to be 0.7 nm and T0 = 1/ k0 =
3s, kBT to be 4.2 pN nm and applying that F = KV where K = 0.24 pN/mV (as obtained
from force measurements done on DNA by Dekker group) , where V is
the applied voltage in mV. Thus, if the interaction between reader molecules and
translocating DNA lead to activated slowing down, T would depend exponentially on
applied voltage. (Also, substituting for voltage of 60 mV in the above expression, we
would get T = 0.27 s predicting a translocation time of 0.27 s per base.)

101
Instead of activated translocations, if the interactions are purely frictional, because drag
force is proportional to the applied voltage, the translocation time would be inversely
proportional to applied voltage V.
4.5.4 Comparison of predicted models with experimental data
In this section, the data from a functionalized nanopore (10nm SiN + 10nm Pd) that was
used to translocate ssDNA of varying lengths (23 nt, 63nt and 180 nt) is used to fit to the
predicted models from previous section. Figure 4.14 shows the graphs of data presenting
voltage dependence of translocation time.
Figure 4.14 Fits of translocation time as a function of voltage. The graphs include plot of
log T vs V on left and T vs 1/V on the right. The former is a fit to the model representing
activated translocations while the latter represents frictional slowing model.
From the plots in Figure 4.14, with the given amount of data, there is a possibility that the
data could agree to certain extent with both the models. This may indicate the
translocations are a combination of frictional as well as activated interactions. A

102
comparison of exponents as shown in the table below shows that the exponent matches
closely to the values from DFS data obtained from AFM experiments.
Length T0 (ms) T/base (ms) kxts/kBT (mV-1
)
23 5.5 0.24 -0.032
63 54 0.86 -0.035
180 120 0.67 -0.032
Table 4.3 Comparison of exponents. The values of exponents match with those predicted
by the DFS –AFM data.
The plot in Figure 4.15 shows the scaling of translocation time with chain length of
translocating DNA. The inset table also indicates the decrease in translocation time with
increase in applied bias.
Figure 4.15 Translocation time as a function of chain length for different voltages.

103
The scaling of the event duration with molecular length is evident. However the exact
dependence of translocation as a function of number of bases is not very clear. This may
be due to several reasons such as nonuniform interaction of different regions of ssDNA
with the Imidazole reader. While the above results definitely indicate that the current
blocakdes are indicative of actual translocation of DNA molecules, further understanding
of the mechanism can obtained by perhaps increasing the range of molecular lengths.
Figure 4.16 shows the plot of number of events vs applied bias for 2 different cases. On
the left is the case of experiment where the same nanopore was studied under three
different surface conditions (functionalized Pd, bare Pd and bare SiN). It is interesting to
note that the presence of metal lowers the capture rate of DNA molecules. The plot on
right shows the capture rate data for the chip that was used to study molecules of various
lengths. The capture rate is found to be independent of the chain length for this range of
molecular lengths.
Figure 4.16 Capture rate change with surface change (left) and molecular length
(right).Capture rate is lowered in the presence of metal. For the molecular length range
in this study, capture rate is independent of chain length.

104
4.6 Theoretical Calculations
The motion of DNA or any other charged polymer in the nanopore is complex since the
actual force on the DNA has contributions besides the electrophoretic attraction of the
DNA to the positively polarized electrode. Specifically, the forces on the DNA can
include the drag force, which depends on the size and speed of the molecule; the
electrophoretic force, proportional to the DNA charge in the pore, which, to first
approximation, depends only on the voltage along the pore and random thermal forces.
All of these contributions have been considered in a finite element analysis of DNA
translocation in the floating Palladium electrode device. The calculations have been
performed by Dr. Predrag Krstic of Oak Ridge national Laboratory. The simulations are
based on the continuum approximation, assuming the micro-nano fluid system in a steady
flaw, with small Knudsen and Reynolds numbers, incompressible Newtonian fluid with
the usual conservation laws of mass, energy, momentum. This is described by the set of
the time-independent partial differential equations which are solved numerically, self
consistently, seeking fulfillment of all conservation laws with high accuracy (3-4
significant digits), and full convergence at a fine finite elements numerical mesh, using
the multiphysics and modeling software package COMSOL [COMSOL Multiphysics
Quick Start and Quick Reference, COMSOL AB. http://www.comsol.com.]. At each
iteration, a sparse matrix form is constructed from the finite element discretization of
equations (1-4). The algorithm employed (MUltifrontal Massively Parallel sparse direct
Solver, MUMPS [http://graal.ens- lyon.fr/MUMPS/]) repeats the damping-factor
reduction until the relative error is less than in the previous iteration or until the damping

105
factor underflows its predefined minimum. The relative tolerance in all present
calculations was set to be below 10-6
.
To find the steady state fluid flow we numerically solve a set of time-independent
coupled, nonlinear partial differential equations, the Poisson-Nernst-Planck-Stokes
(PNPS) equations [B.J. Kirby, Micro- and Nanoscale Fluid Mechanics. Cambridge
University Press: New York: 2010]. The Poisson equation defines electrostatic scalar
potential as response to the local excess electric charge, e=(c+-c-) F in the
environment of relative dielectric constant r, where c are the instantaneous volume
densities of the positive (+) and negative (-) ions, and F is the Faraday constant.
0
,er e c c F
(1)
This equation in its integral version describes the total electric field flux through a surface
enclosing an excess charge. The Nernst-Planck equation, in its integral form, defines the
conservation of the flux, , of charged particles (of charge z(e), where e is an
elementary charge) through an arbitrary closed surface, i.e. the conservation of the total
electric current, and contains electrophoretic (proportional to the ion mobility m,),
diffusive (diffusion constant D) and electroosmotic terms (proportional to the velocity of
the fluid element u ), and its local form is
, 0mD c z Fc c u (2)
Finally, the Stokes equation is the approximation of Navier-Stokes equations for a
laminar flow with a negligible inertial term,
2
ep u (3)

106
and yields the fluid velocities, which depend on the electric potentials, charges, external
pressure gradients p and the fluid viscosity η through the assumption of the full
hydration of charged particles. Thus, the fluid moves with the charged particles. The
conservation of the mass flux, i.e. zero total flux of the fluid exiting any closed surface,
compatible with the assumption of the fluid non-compressibility, adds the equation
0u . (4)
When solved with appropriate boundary conditions, the numerical simulations yield the
following results. In Silicon Nitride (SiN) as well as Pd coated SiN case, most of the
potential drop is seen to occur at the pore. Within the SiN pore, the radial and normal (z)
components are comparable in magnitude. The z component of the field is also observed
to linearly increase with applied bias. In the case of Pd coated SiN pore however, the
presence of floating Pd electrode has a drastic influence due to its surface charging, in
particular in the pore part of its surface (the total charge of the Pd layer stays zero!). The
floating Pd electrode acquires positive potential, and its upper surface and the pore
surface becomes positively charged, inducing negatively volume charge in the Pd part of
the electrode. The SiN part of the electrode carries a positive volume charge which due to
the negative surface charge of the SiN part of the pore. It is found that the positive
volume charge in the Pd part is smaller than the negative one in the SiN pore, unless the
bias is bigger than 0.2 V. Also, it is obvious that a longer Pd pore would cause reaching
the balance at smaller bias.
As a consequence of the volume charges, opposite in sign in the Pd and SiN parts of the
pore, the volume forces acting to the charge distributions in each part of the pore, causing
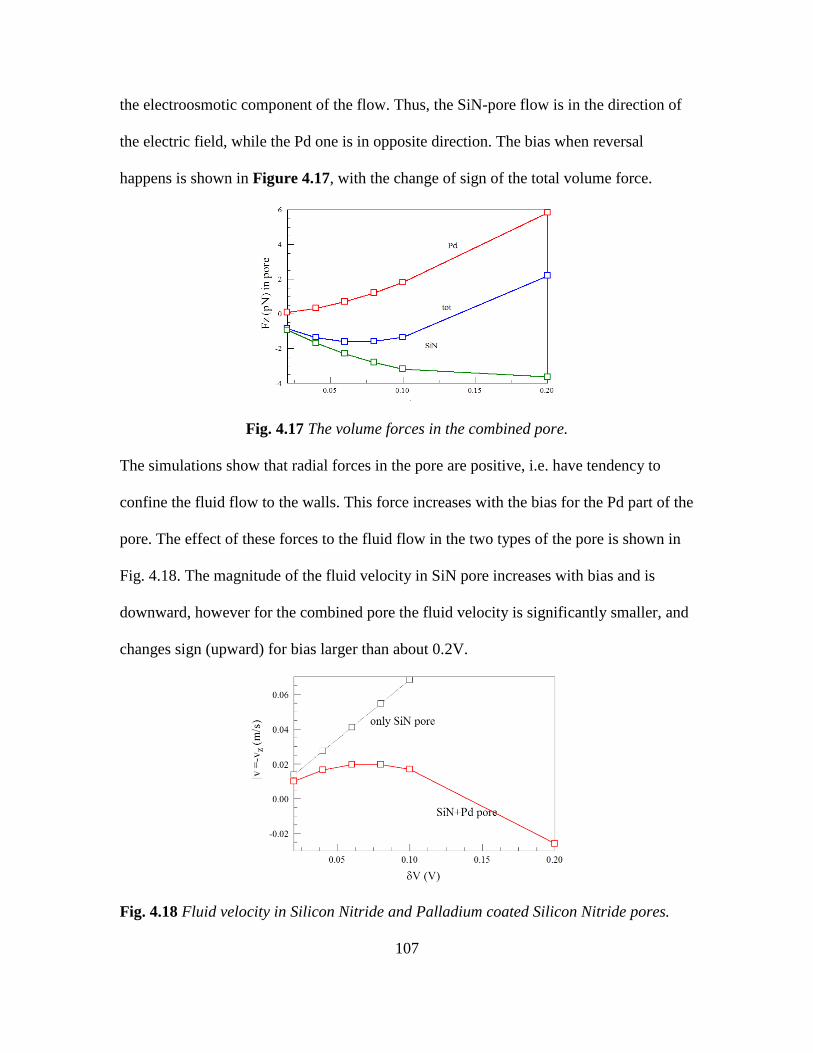
107
the electroosmotic component of the flow. Thus, the SiN-pore flow is in the direction of
the electric field, while the Pd one is in opposite direction. The bias when reversal
happens is shown in Figure 4.17, with the change of sign of the total volume force.
Fig. 4.17 The volume forces in the combined pore.
The simulations show that radial forces in the pore are positive, i.e. have tendency to
confine the fluid flow to the walls. This force increases with the bias for the Pd part of the
pore. The effect of these forces to the fluid flow in the two types of the pore is shown in
Fig. 4.18. The magnitude of the fluid velocity in SiN pore increases with bias and is
downward, however for the combined pore the fluid velocity is significantly smaller, and
changes sign (upward) for bias larger than about 0.2V.
Fig. 4.18 Fluid velocity in Silicon Nitride and Palladium coated Silicon Nitride pores.

108
As per theoretical calculations, the total ion current for the cases of SiN electrode
(diameter 3 nm, length 30 nm) and SiN+Pd electrode (diameter 3 nm) length 30+10 nm
are 3.28 nS and 2.55 nS respectively. I-V measurements on 30 nm long SiN (3 nm
diameter) pore yield conductance of 3nS and the conductance measured for the 30 nm
SiN+ 10nm Pd (3nm diameter) is 2.92 nS. For both cases, the measured and calculated
values are in good agreement within the scope of error arising due to uncertainties in the
exact geometrical configuration of the pores that may not be possible to take into account
in theoretical models. It must be noted here that thinner pores in 10nm Pd+ 18nm SiN
and 10nm Pd + 10nm SiN configuration have been used in experiments. For these
configurations, due to the extreme thinness of the membranes, the experimental values of
conductance is found to be higher than predicted values of conductance. This could be
possibly due to leakage path and migration of charge occurring at such low values of
membrane thickness. However such nanopores continue to show linear I-V behavior and
are able to capture translocation spikes.
4.7 CONCLUSIONS & DISCUSSIONS
From experiments conducted with fuctionalized nanopores it is evident that, the
Hydrogen bonding moieties formed by Imidazole with the ssDNA cause an increase in
molecule-pore interactions bringing about slower and more controlled translocations. The
slowing down of DNA translocations is advantageous in the nanopore configuration.
From the point of view of sequencing and molecular analysis however, functionalization
of nanopore can be better utilized by combing electronic measurement of translocating
molecules. This can also allow for conducting measurements on thicker membranes with

109
longer strands of DNA. Longer reads offer better prospects in terms of sequencing device
efficiency. Also, as the sensing route for analysis will be primarily via electronic
tunneling rather than ionic current measurements, there is better scope of obtaining base
recognition and information at the individual nucleotide level.
Also, in order to better investigate the mechanism of slowing down, future experiments
may be planned with modified microfluidic set up that allows for collection of larger
amount of data per experiment for improving the scope of statistical analysis on the data.

110
4.8 REFERENCES
1. Livesay, W. R. & Fritz, R. B. Electron image projection systems for microcircuit
lithography. IEEE Transactions on Electron Devices 19, 647–651 (1972).
2. Nanopores: Sensing and Fundamental Biological Interactions. (Springer, 2011).
3. Lo, C. J., Aref, T. & Bezryadin, A. Fabrication of symmetric sub-5 nm nanopores
using focused ion and electron beams. Nanotechnology 17, 3264 (2006).
4. Wu, S., Park, S. R. & Ling, X. S. Lithography-Free Formation of Nanopores in
Plastic Membranes Using Laser Heating. Nano Lett. 6, 2571–2576 (2006).
5. Yu, M., Kim, H. & Blick, R. H. Laser drilling of nano-pores in sandwiched thin glass
membranes. Optics Express 12, 10044-10049 (2009)
6. Storm, A. J., Chen, J. H., Ling, X. S., Zandbergen, H. W. & Dekker, C. Fabrication
of solid-state nanopores with single-nanometre precision. Nat Mater 2, 537–540
(2003).
7. Schenkel, T., Radmilovic, V., Stach, E. A., Park, S. J. & Persaud, A. Formation of a
few nanometer wide holes in membranes with a dual beam focused ion beam system.
Journal of Vacuum Science Technology B: Microelectronics and Nanometer
Structures 21, 2720–2723 (2003).
8. Fitch, J. T., Bjorkman, C. H., Lucovsky, G., Pollak, F. H. & Yin, X. Intrinsic stress
and stress gradients at the SiO2/Si interface in structures prepared by thermal
oxidation of Si and subjected to rapid thermal annealing. Journal of Vacuum Science
Technology B: Microelectronics and Nanometer Structures 7, 775–781 (1989).
9. Li, J. et al. Ion-beam sculpting at nanometre length scales. Nature 412, 166–169
(2001).
10. Harrell, C. C., Siwy, Z. S. & Martin, C. R. Conical Nanopore Membranes:
Controlling the Nanopore Shape. Small 2, 194–198 (2006).

111
11. Siwy, Z., Dobrev, D., Neumann, R., Trautmann, C. & Voss, K. Electro-responsive
asymmetric nanopores in polyimide with stable ion-current signal. Appl Phys A 76,
781–785 (2003).
12. Siwy, Z., Heins, E., Harrell, C. C., Kohli, P. & Martin, C. R. Conical-Nanotube Ion-
Current Rectifiers: The Role of Surface Charge. J. Am. Chem. Soc. 126, 10850–
10851 (2004).
13. Kim, M. J., McNally, B., Murata, K. & Meller, A. Characteristics of solid-state
nanometre pores fabricated using a transmission electron microscope.
Nanotechnology 18, 205302 (2007).
14. Kim, M. J., Wanunu, M., Bell, D. C. & Meller, A. Rapid Fabrication of Uniformly
Sized Nanopores and Nanopore Arrays for Parallel DNA Analysis. Advanced
Materials 18, 3149–3153 (2006).
15. Heng, J. B. et al. Sizing DNA Using a Nanometer-Diameter Pore. Biophysical
Journal 87, 2905–2911 (2004).
16. Smeets, R. M. M. et al. Salt Dependence of Ion Transport and DNA Translocation
through Solid-State Nanopores. Nano Lett. 6, 89–95 (2006).
17. McDonald, C. et al. Fabrication of microfluidic systems in poly(dimethylsiloxane).
Electrophoresis 21, 27–40 (2000).
18. Lee, J. N., Park, C. & Whitesides, G. M. Solvent compatibility of
poly(dimethylsiloxane)-based microfluidic devices. Anal. Chem. 75, 6544–6554
(2003).
19. Wanunu, M. Nanopores: A journey towards DNA sequencing. Physics of Life
Reviews 9, 125–158 (2012).
20. Coulter, W.H. Means for Counting Particles suspended in a fluid. US Patent.
21. Song, L. et al. Structure of staphylococcal alpha-hemolysin, a heptameric
transmembrane pore. Science 274, 1859–1866 (1996).

112
22. Butler, T. Z., Pavlenok, M., Derrington, I. M., Niederweis, M. & Gundlach, J. H.
Single-molecule DNA detection with an engineered MspA protein nanopore. PNAS
105, 20647–20652 (2008).
23. Wendell, D. et al. Translocation of double stranded DNA through membrane adapted
phi29 motor protein nanopore. Nat Nanotechnol 4, 765–772 (2009).
24. Wanunu, M. et al. Rapid electronic detection of probe-specific microRNAs using thin
nanopore sensors. Nat Nano 5, 807–814 (2010).
25. Garaj, S. et al. Graphene as a subnanometre trans-electrode membrane. Nature 467,
190–193 (2010).
26. Wanunu, M., Morrison, W., Rabin, Y., Grosberg, A. Y. & Meller, A. Electrostatic
focusing of unlabelled DNA into nanoscale pores using a salt gradient. Nat Nano 5,
160–165 (2010).
27. Grosberg, A. Y. & Rabin, Y. DNA capture into a nanopore: Interplay of diffusion
and electrohydrodynamics. The Journal of Chemical Physics 133, 165102–165102–
15 (2010).

113
5. SUMMARY
5.1 CONCLUSIONS
An important goal that we face today, from technological and research point of view is
the realization of affordable, accurate DNA sequencing platform. Sequencing via
nanofluidics offers a label free, relatively in- expensive route to achieve this. Specifically,
in this body of work, two branches of nanofluidic devices were explored - Carbon
Nanotube based devices and the solid state nanopore based devices. Carbon nanotubes
possess novel properties such as large aspect ratio, uniform thickness, frictionless interior
and easy wettability that makes them suitable for nanofluidic DNA sequencing (as
already established by translocations in single CNT based devices). However, the
difficulty in synthesis of single CNT growth devices, lack of control over the helicity and
low yield prompted the development of CNT forest membrane project. The CNT forest
membranes have been used to study the transport of DNA and nanoparticles. The
chemical functionalization of the CNT is used to affect the transport of macromolecules.
These properties indicate that such membranes could be used in tunable filtering
applications. However, the goal of DNA sequencing is still far from possible within the
CNT paradigm. . Hence, in the second part of this thesis we explore solid state
nanopores. Nanopores offer a unique and powerful tool for a variety of single molecule
studies. Nanopores , both solid state and biological, are known for their single molecule
sensitivity and have already been used for DNA translocation studies over the last
decade. They hold the potential to sequence DNA faster and cheaper compared to current
industrial standard. It is understood that improvements in spatial and temporal resolution
can help improve base resolution. Recently, biological pores have pushed the resolution

114
limits by combining with ion channel proteins to demonstrate proof of principle DNA
sequencing. To advance similarly within solid state nanopores, we apply recognition
molecule chemistry within nanopore framework. Solid state nanopores, when metallized
with Palladium and functionalized by Imidazole molecules show that time resolution is
enhanced by several orders of magnitude. The implication of this result is two-fold.
Firstly, any solid state nanopore analysis can be improved with metallization and
functionalization. Secondly, and perhaps more importantly, the recognition chemistry that
could achieve base differentiation in the ST M set up, can also be contribute to the
entending the duration of translocation events coming from nanopore. A combination of a
functionalized nanopore for threading and straightening out DNA and a functionalized
tunnel junction for nucleoside differentiability, could ideally merge the best of both
worlds and sequence DNA.
5.2 FUTURE WORK
We have established that translocations in solid state nanopores can be slowed down by
means of metallization and functionalization with recognition molecule. The next logical
step towards DNA sequencing would be the improvement of base-recognition and
differentiation. Since it is changes in the ionic flow inside the nanopore channel that are
used to sense presence and translocation of biomolecules, reducing the dimensions of the
pore to increase base-resolution is one alternative. The configuration would have to be
such that when a ssDNA translocates through the nanopore, the ionic current will
continue to detect the movement of the analyte molecule through the pore, while the
electronic signals coming from tunneling of each base could be used to provide sequence
information.

115
Efforts to create such tunnel junctions are already in place.1 Currently my colleagues are
exploring two possible device configurations to this effect – planar and stacked junctions.
Planar junctions are created by cutting a tunnel gap in a palladium nanowire using the
scanning tunneling electron microscope (STEM) electron beam. When this gap is treated
with analyte solution, recognition signals are evident (figure 5.1)
Figure 5.1 (a) A schematic of a planar junction experiment – tunneling current
signals are measured while the junction is being exposed to the analyte buffer.
(b) TEM Image of a freshly created 2nm tunnel gap. (c) Current measurements
and controls for various conditions indicating that tunneling signals appear
when dGMP is added to an Imidazole functionalized junction

116
Stacked junctions are made by fabricating a Pd (10nm)/Al2O3 (3nm) / Pd (10nm) trilayer.
A trench is cut through the trilayer using focused ion beam (FIB) for providing access to
the analyte buffer. Recognition signals are observed when the functionalized junction is
exposed to analyte (Figure 5.2)
Figure 5.2 (a) A schematic of the top view of a stacked junction exposed to the analyte
buffer (b) Schematic of its side view. (c) Current measurements and controls for various
conditions indicating that tunneling signals appear when dGMP is added to an
Imidazole functionalized junction

117
The promising results from Palladium functionalized nanopores (chapter 4) and tunnel
junctions (above) indicate that an integration of the two techniques is definitely a
promising path to pursue. Thus tunnel junction incorporated nanopores could be the key
to achieving DNA sequencing within the solid state nanopore framework, thus making a
leap towards the $1000 genome goal.
5.3 REFERENCES
1. Pang, P., Gyarfas, B., Yang, J., Eller, B. S., Nemanich, R. and Lindsay, S. Solid
State Tunnel Junctions for Recognition Tunnelling. Poster presented at the
National Human Genome Research Institute conference (2013)

118
APPENDIX A
CO-AUTHOR APPROVAL
119
I verify that the following co-authors have approved of my use of our publication
“Mass transport through vertically aligned large diameter MWCNTs embedded in parylene”
Nanotechnology volume 23(2012)
in my dissertation
Stuart Lindsay (Arizona State University), Jin He (Florida International University)
Tao Luo (ASU.), Spence Staples (ASU), Purushottam B. Tiwari (FIU)
I also verify that the following co-acuthors have approved of my use of parts of our manuscripts
for publications(in near future)
Stuart Lindsay (ASU), Jin He (FIU), Peiming Zhang(ASU), Brett Gyarfas (ASU)
Predrag Krjstic (Oak Ridge National Laboratory), Sergei Smirnov(NMSU)
Ivan Vlassiouk (Oak ridge National Laboratory), Purushottam B. Tiwari (FIU)
Y. Darici (FIU), Y. P. Shan(FIU), W. Z. Li(FIU), X. W. Wang (FIU)
H. D. Wang (Chinese Academy of Sciences)

120
APPENDIX B
SUPPLEMENTAL INFORMATION FOR CHAPTER 2
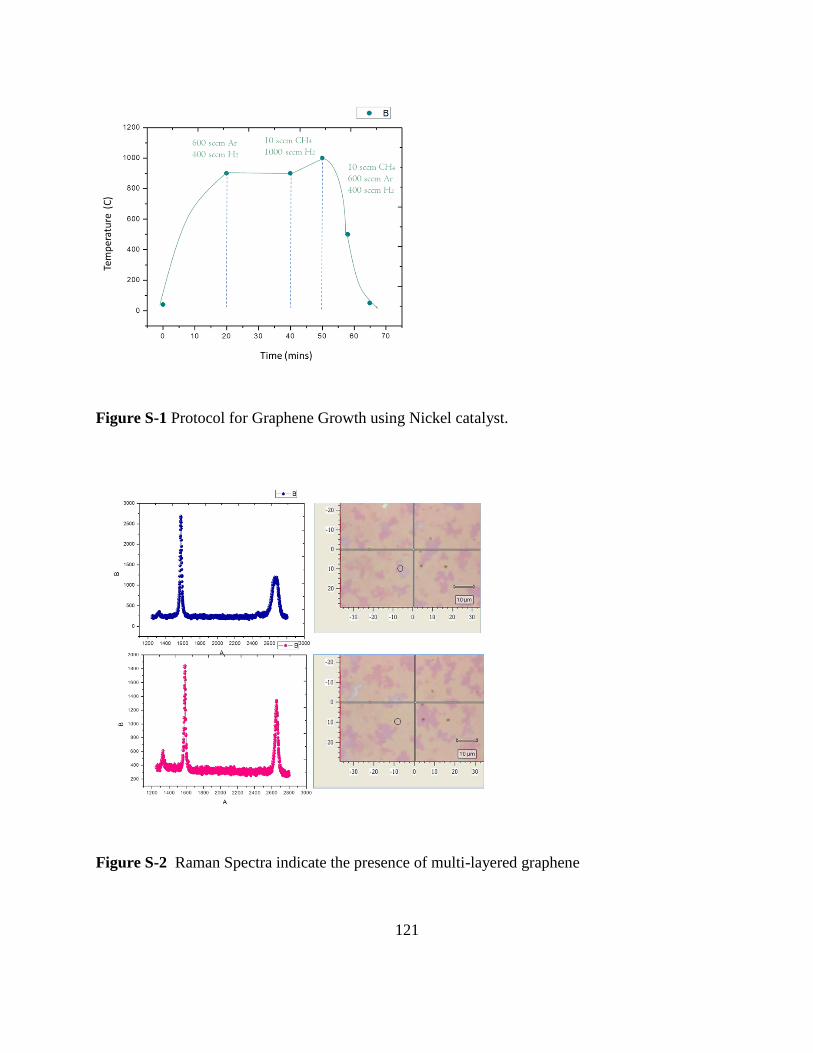
121
Figure S-1 Protocol for Graphene Growth using Nickel catalyst.
Figure S-2 Raman Spectra indicate the presence of multi-layered graphene

122
APPENDIX C
SUPPLEMENTAL INFORMATION FOR CHAPTER 4

123
(a)
(b)
Figure S-3 Methods to control DNA access to the nanopore. One of the issues in the early
developmental stage of the nanopore work was the problem of DNA molecules clogging the
nanopore. Two steps taken to tackle this issue are described in the figure. (a) The zoom-in on the
chip/reservoir area showing DNA being introduced at the vicinity of chip (right), and distance
(of 3mm) away from the chip(left). The latter causes the DNA to diffuse towards the region of
high electric field leading to more controlled series of events. (b) Time trace of events in a pore,
where the voltage is switched off intermittently to prevent accumulation of DNA near the pore
entrance

124
(a)
(b)
Figure S-4 The Current Voltage curves for a plain Palladium [ nanopore (length 20 nm, 10 nm
SiN, 10nm Pd/Ti) Diameter =4nm] are shown below. The conductance of the nanopore is
observed to increase upon the introduction of DNA in the input reservoir. (a) the conductance
before adding DNA is 49.9 nS. (b) After adding DNA it increases to 66.76nS

125
ANALYSIS CODE
The following MATLAB, developed by Dr. Brett Gyarfas was used for the analysis of data
presented in Chapter 4.
gui_Singleton = 1;
gui_State = struct('gui_Name', mfilename, ...
'gui_Singleton', gui_Singleton, ...
'gui_OpeningFcn', @eventDetector_v2_OpeningFcn, ...
'gui_OutputFcn', @eventDetector_v2_OutputFcn, ...
'gui_LayoutFcn', [] , ...
'gui_Callback', []);
if nargin && ischar(varargin{1})
gui_State.gui_Callback = str2func(varargin{1});
end
if nargout
[varargout{1:nargout}] = gui_mainfcn(gui_State, varargin{:});
else
gui_mainfcn(gui_State, varargin{:});
end
function eventDetector_v2_OpeningFcn(hObject, eventdata, handles, varargin)
handles.output = hObject;
guidata(hObject, handles);
initFunc(hObject,eventdata, handles);
function initFunc(hObject,~,handles)
switch computer
case 'PCWIN'
dlldir = fullfile(pwd,'dlls','bin','32-bit','nilibddc.dll');
headerdir = fullfile(pwd,'dlls','include','32-bit','nilibddc_m.h');
case 'PCWIN64'
dlldir = fullfile(pwd,'dlls','bin','64-bit','nilibddc.dll');
headerdir = fullfile(pwd,'dlls','include','64-bit','nilibddc_m.h');
end
try
temp = mex.getCompilerConfigurations('C++','Selected');
catch ME
findError = strcmp(ME.identifier, ...
'MATLAB:CompilerConfiguration:NoSelectedOptionsFile');
if ~isempty(findError)
f = warndlg({'You do not have a compiler selected!',...
'Please run ''mex -setup'' to select a complier'},...
'Need to run mex setup!', 'modal');
else
f = warndlg({'You do not have a C++ compiler selected!',...
'Please run ''mex -setup'' to select a complier'},...
'Need to run mex setup!', 'modal');
end
uiwait(f);
close(hObject)
return
end
if ~libisloaded('nilibddc')
try
loadlibrary(dlldir,headerdir);
catch %#ok<CTCH>
warndlg({'Cannot load libraries to read TDMS files!',...
'You can continue to use the program but it won''t read TDMS files,',...

126
'you probably need to install a compiler in MATLAB.',...
'Google "MATLAB Selecting a Compiler on Windows Platforms"',...
'Or Talk to Brett Gyarfas!'},'Error!','modal')
end
end
parentdirectory=fileparts(which('eventDetector_v2'));
UtilsDirectory=[parentdirectory filesep 'CORE'];
remain = path; temppath = {}; counter = 1;
while true
[str, remain] = strtok(remain, pathsep);
if isempty(str)
break
elseif ~isempty(strfind(str, 'eventDetector_v2'))
temppath{counter} = str;
counter = counter + 1;
end
end
if ~isempty(temppath), rmpath(temppath{:}); end
addpath(genpath(UtilsDirectory));
[X, ~] = imread(fullfile(UtilsDirectory, 'View', 'Icons', 'xAxisZoomOut.bmp'));
set(handles.btn_xaxis_zoom_out, 'CData', X);
[X, ~] = imread(fullfile(UtilsDirectory, 'View', 'Icons', 'xAxisZoomIn.bmp'));
set(handles.btn_xaxis_zoom_in, 'CData', X);
[X, ~] = imread(fullfile(UtilsDirectory, 'View', 'Icons', 'yAxisZoomOut.bmp'));
set(handles.btn_yaxis_zoom_out, 'CData', X);
[X, ~] = imread(fullfile(UtilsDirectory, 'View', 'Icons', 'yAxisZoomIn.bmp'));
set(handles.btn_yaxis_zoom_in, 'CData', X);
[X, ~] = imread(fullfile(UtilsDirectory, 'View', 'Icons', 'yAxisZoomOut.bmp'));
set(handles.btn_yaxis_overview_zoom_out, 'CData', X);
[X, ~] = imread(fullfile(UtilsDirectory, 'View', 'Icons', 'yAxisZoomIn.bmp'));
set(handles.btn_yaxis_overview_zoom_in, 'CData', X);
disableControls(hObject);
handles.dataHandles = containers.Map();
handles.activeData = [];
handles.prevDir = parentdirectory;
set(handles.axesCurrent,'UserData', containers.Map({'Line1','Line2','ClickPt','Cursor1',
'Cursor2'...
'Cursor1Text', 'Cursor2Text', 'CursorXDeltaText','CursorYDeltaText'},...
{[],[],[],[],[],[],[],[],[]}),'Units','pixels','DrawMode', 'Fast');
set(handles.axesOverview, 'UserData',
containers.Map({'Line1','Line2'},{[],[]}),'Units','pixels');
MouseMotionHandler(hObject, {@changePointer, 'arrow'});
MouseMotionHandler.put(hObject, handles.axesCurrent, @zHAxesCurrentMouseMotion);
MouseMotionHandler.put(hObject, handles.axesOverview, @zHAxesOverviewMouseMotion);
MouseMotionHandler.put(hObject, handles.sldr_yAxis_Cur, @HAxesCurrentMouseMotionDefault);
MouseMotionHandler.put(hObject, handles.sldr_xAxis_Cur, @HAxesCurrentMouseMotionDefault);
MouseMotionHandler.put(hObject, handles.sldr_yAxis_Overview, @HAxesOverviewMouseMotionDefault);
set(handles.axesCurrent, 'ButtonDownFcn', @zHAxesCurrentMouseButtonDown);
set(handles.axesOverview, 'ButtonDownFcn', @zHAxesOverviewMouseButtonDown);
set(hObject, 'renderer', 'opengl')
guidata(hObject,handles);
function varargout = eventDetector_v2_OutputFcn(hObject, eventdata, handles)

127
if ishandle(hObject)
varargout{1} = handles.output;
end
function disableControls(hObject)
children = get(hObject,'Children');
for i=1:length(children)
if ~strcmp(get(children(i),'Tag'),'btn_open_file') && ...
strcmp(get(children(i),'Type'),'uicontrol')
set(children(i),'Enable', 'off')
end
end
function enableControls(hObject)
children = get(hObject,'Children');
for i=1:length(children)
if ~strcmp(get(children(i),'Tag'),'btn_open_file') && ...
strcmp(get(children(i),'Type'),'uicontrol')
set(children(i),'Enable', 'on')
end
end
% --------------------------------------------------------------------
function uimenu_File_Callback(hObject, eventdata, handles)
function uimenu_exit_Callback(hObject, eventdata, handles)
% --- Executes on selection change in lstbox_open_files.
function lstbox_open_files_Callback(hObject, eventdata, handles)
tempLstBoxStr = cellstr(get(hObject,'String'));
if ne(handles.dataHandles(tempLstBoxStr{get(hObject,'Value')}), handles.activeData)
handles.activeData.Visible('off')
handles.activeData = handles.dataHandles(tempLstBoxStr{get(hObject,'Value')});
%Bring the current one forward
handles.activeData.Visible('on')
set(handles.godFigure, 'name', ['eventDetector_v2: ' ...
handles.activeData.pathname '\' handles.activeData.filename]);
end
guidata(hObject,handles)
function btn_open_file_Callback(hObject, eventdata, handles)
[filename,pathname] = uigetfile({'*.tdms;*.abf;*.txt;*.evntd','Valid File Types
(*.tdms,*.abf,*.txt,*.evntd)'},...
'Open File', handles.prevDir);
if ~isequal(filename,0)
tempLstBoxStr = get(handles.lstbox_open_files, 'String');
if ~nnz(strcmp(tempLstBoxStr,filename))
tempLstBoxStr{length(tempLstBoxStr)+1} = filename;
set(handles.lstbox_open_files,'String', tempLstBoxStr);
set(handles.lstbox_open_files,'Value', length(tempLstBoxStr));
if ~isempty(handles.activeData)
handles.activeData.Visible('off');
end
try
handles.dataHandles(filename) = traceData(filename,pathname,...
handles.axesCurrent,handles.axesOverview);
handles.activeData = handles.dataHandles(filename);
enableControls(ancestor(hObject,'figure'))
catch ME
disp(ME)
disp(ME.message)
disp(ME.identifier)
for i=1:numel(ME.stack)
128
disp(ME.stack(i).file)
disp(ME.stack(i))
end
% disp(struct2cell(ME.stack))
end
handles.prevDir = pathname;
else
%Its already loaded, go the value and load the file
set(handles.lstbox_open_files,'Value', find(strcmp(tempLstBoxStr,filename)))
guidata(hObject,handles);
lstbox_open_files_Callback(handles.lstbox_open_files,eventdata,handles);
end
end
guidata(hObject,handles)
figure(handles.godFigure)
set(hObject,'Enable', 'off')
drawnow;
set(hObject,'Enable', 'on')
% --- Executes on button press in btn_close_file.
function btn_close_file_Callback(hObject, eventdata, handles)
tempLstBoxStr = get(handles.lstbox_open_files, 'String');
tempLstBoxValue = get(handles.lstbox_open_files,'Value');
if ~isempty(handles.dataHandles)
handles.activeData.Visible('off')
delete(handles.dataHandles(tempLstBoxStr{tempLstBoxValue}))
remove(handles.dataHandles, tempLstBoxStr{tempLstBoxValue});
if tempLstBoxValue == length(tempLstBoxStr)
set(handles.lstbox_open_files,'Value', tempLstBoxValue-1)
end
tempLstBoxStr(tempLstBoxValue) = [];
set(handles.lstbox_open_files,'String',tempLstBoxStr)
if isempty(tempLstBoxStr)
handles.activeData = [];
disableControls(handles.godFigure);
else
tempLstBoxStr = get(handles.lstbox_open_files, 'String');
tempLstBoxValue = get(handles.lstbox_open_files,'Value');
disp(get(handles.lstbox_open_files, 'Value'))
disp(tempLstBoxStr{tempLstBoxValue})
handles.activeData = handles.dataHandles(tempLstBoxStr{tempLstBoxValue});
%Bring the current one forward
handles.activeData.Visible('on')
end
end
guidata(hObject,handles)
% --------------------------------------------------------------------
function uimenu_open_file_Callback(hObject, eventdata, handles)
.
function lstbox_open_files_CreateFcn(hObject, eventdata, handles)
.
if ispc && isequal(get(hObject,'BackgroundColor'), get(0,'defaultUicontrolBackgroundColor'))
set(hObject,'BackgroundColor','white');
end
function godFigure_CloseRequestFcn(hObject, eventdata, handles)
delete(hObject);
function godFigure_WindowButtonUpFcn(hObject, eventdata, handles)
% hObject handle to godFigure (see GCBO)

129
if ~isempty(handles.activeData)
notify(handles.activeData,'MouseUpEvent')
end
function godFigure_KeyPressFcn(hObject, eventdata, handles)
persistent test
if isempty(test)
test = 0;
end
handles.activeData.keyDown = eventdata.Key;
test = test + 1;
% --- Executes on key release with focus on godFigure and none of its controls.
function godFigure_KeyReleaseFcn(hObject, eventdata, handles)
handles.activeData.keyDown = 'None';
function sldr_xAxis_Cur_Callback(hObject, eventdata, handles)
handles.activeData.xSliderVal = get(hObject,'Value');
figure(handles.godFigure)
set(hObject,'Enable', 'off')
drawnow;
set(hObject,'Enable', 'on')
function sldr_xAxis_Cur_CreateFcn(hObject, eventdata, handles)
if isequal(get(hObject,'BackgroundColor'), get(0,'defaultUicontrolBackgroundColor'))
set(hObject,'BackgroundColor',[.9 .9 .9]);
end
function btn_xaxis_zoom_out_Callback(hObject, eventdata, handles)
tempLims = handles.activeData.limTime;
deltaLim = abs(tempLims(2)-tempLims(1))/2;
deltaLim = [-1*deltaLim deltaLim];
handles.activeData.limTime = tempLims+deltaLim;
figure(handles.godFigure)
set(hObject,'Enable', 'off')
drawnow;
set(hObject,'Enable', 'on')
% --- Executes on button press in btn_xaxis_zoom_in.
function btn_xaxis_zoom_in_Callback(hObject, eventdata, handles)
deltaLim = abs(tempLims(2)-tempLims(1))/4;
deltaLim = [deltaLim -1*deltaLim];
handles.activeData.limTime = tempLims+deltaLim;
figure(handles.godFigure)
set(hObject,'Enable', 'off')
drawnow;
set(hObject,'Enable', 'on')
% --- Executes on button press in btn_yaxis_zoom_out.
function btn_yaxis_zoom_out_Callback(hObject, eventdata, handles)
deltaLim = abs(tempLims(2)-tempLims(1))/2;
deltaLim = [-1*deltaLim deltaLim];
handles.activeData.limMag = tempLims+deltaLim;
figure(handles.godFigure)
set(hObject,'Enable', 'off')
drawnow;
set(hObject,'Enable', 'on')
% --- Executes on button press in btn_yaxis_zoom_in.
function btn_yaxis_zoom_in_Callback(hObject, eventdata, handles)
tempLims = handles.activeData.limMag;
deltaLim = abs(tempLims(2)-tempLims(1))/4;
deltaLim = [deltaLim -1*deltaLim];
handles.activeData.limMag = tempLims+deltaLim;
figure(handles.godFigure)
set(hObject,'Enable', 'off')
drawnow;
set(hObject,'Enable', 'on')

130
function sldr_yAxis_Cur_Callback(hObject, eventdata, handles)
handles.activeData.ySliderVal = get(hObject,'Value');
figure(handles.godFigure)
set(hObject,'Enable', 'off')
drawnow;
set(hObject,'Enable', 'on')
function sldr_yAxis_Cur_CreateFcn(hObject, eventdata, handles)
if isequal(get(hObject,'BackgroundColor'), get(0,'defaultUicontrolBackgroundColor'))
set(hObject,'BackgroundColor',[.9 .9 .9]);
end
function sldr_yAxis_Overview_Callback(hObject, eventdata, handles)
handles.activeData.HOverview.ySliderVal = get(hObject,'Value');
figure(handles.godFigure)
set(hObject,'Enable', 'off')
drawnow;
set(hObject,'Enable', 'on')
function sldr_yAxis_Overview_CreateFcn(hObject, eventdata, handles)
if isequal(get(hObject,'BackgroundColor'), get(0,'defaultUicontrolBackgroundColor'))
set(hObject,'BackgroundColor',[.9 .9 .9]);
end
function btn_yaxis_overview_zoom_out_Callback(hObject, eventdata, handles)
deltaLim = abs(tempLims(2)-tempLims(1))/2;
deltaLim = [-1*deltaLim deltaLim];
handles.activeData.HOverview.limMag = tempLims+deltaLim;
figure(handles.godFigure)
set(hObject,'Enable', 'off')
drawnow;
set(hObject,'Enable', 'on')
% --- Executes on button press in btn_yaxis_overview_zoom_in.
function btn_yaxis_overview_zoom_in_Callback(
deltaLim = abs(tempLims(2)-tempLims(1))/4;
deltaLim = [deltaLim -1*deltaLim];
handles.activeData.HOverview.limMag = tempLims+deltaLim;
figure(handles.godFigure)
set(hObject,'Enable', 'off')
drawnow;
set(hObject,'Enable', 'on')
% --------------------------------------------------------------------
function uimenu_help_Callback(hObject, eventdata, handles)%#ok<*INUSL,*DEFNU,*INUSD>
parentdirectory=fileparts(which('eventDetector_v2'));
UtilsDirectory=[parentdirectory filesep 'CORE'];
[X, map] = imread(fullfile(UtilsDirectory, 'View', 'Icons', 'brettFace.bmp'));
msgbox({'USAGE NOTES:','-To change the x and y axis on the main plot, you can click and drag just
above the scrollbars on the axis themselves.'...
'-To change the box representing the currently displayed data, you can click and drag its
borders. To move the box hold shift while clicking the box.',...
'-You can pan on the main plot by holding shift.',...
'-To delete an exclusion area, right-click on the area and select ''Delete Exclusion'''},...
'Tips and Hints','custom',X,map);
function btn_test_Callback(hObject, eventdata, handles)
figure
set(gca, 'FontSize', 26)
% %=================GET RAW DISPLAYED DATA=================%
startPt = round(handles.activeData.displayedTime(1)/handles.activeData.sampleInt)+1;
endPt = round(handles.activeData.displayedTime(end)/handles.activeData.sampleInt);
tY =
(double(handles.activeData.binaryPtr.data.current(startPt:endPt))*handles.activeData.alphaCurrent
)/1000;
plot(0:handles.activeData.sampleInt:(length(tY)-1)*handles.activeData.sampleInt, tY, '-k');
%========================================================%

131
xlabel('Seconds')
ylabel('Ionic Current, nA')
traceDataProps = handles.activeData.saveObjStruct();
save('traceDataProps', 'traceDataProps')
zip([handles.activeData.filename '.evntd'], {'traceDataProps.mat', ...
['~$' handles.activeData.filename]})
delete('traceDataProps.mat')
movefile([handles.activeData.filename '.evntd.zip'], [handles.activeData.filename '.evntd'])
tEventTiming = handles.activeData.eventTiming;
tInd = regexp(handles.activeData.filename, '.tdms','start');
tFilename = [handles.activeData.filename(1:tInd-1) '_spikeinfo.csv'];
fid = fopen(tFilename, 'w+');
fprintf(fid, '%s\n','Duration,Peak Amplitude,Time Index');
for i=1:size(tEventTiming, 1)
fprintf(fid,'%.4f,%d,%d\n', (tEventTiming(i,2)-
tEventTiming(i,1))*handles.activeData.sampleInt, ...
tEventTiming(i,4), tEventTiming(i,1));
end
fclose(fid);
[FileName,PathName,FilterIndex] = uigetfile('*.mat','MultiSelect','on');
eventTimings_all = [];
if iscell(FileName)
for i=1:numel(FileName)
load(FileName{i})
eventTimings_all = [eventTimings_all; [tTraceData.eventTiming(:,1:2).*tTraceData.sampleInt
...
tTraceData.eventTiming(:,3:4).*tTraceData.alpha]];
end
else
eventTimings_all = [tTraceData.eventTiming(:,1:2).*tTraceData.sampleInt ...
tTraceData.eventTiming(:,3:4).*tTraceData.alpha];
end


![[Joshua B. Edel, Andrew J. de Mello] Nanofluidics (BookZZ.org)](https://img.pdfslide.us/doc/110x75/577cb1041a28aba7118b6f7d/joshua-b-edel-andrew-j-de-mello-nanofluidics-bookzzorg.jpg)


