Embed Size (px)
Citation preview
Sensors 2014, 14, 24231-24243; doi:10.3390/s141224231
sensors ISSN 1424-8220
www.mdpi.com/journal/sensors
Article
Nanocrystalline Tin Oxide Nanofibers Deposited by a Novel Focused Electrospinning Method. Application to the Detection of TATP Precursors
José Pedro Santos 1,*, Maria Jesús Fernández 1, José Luis Fontecha 1, Daniel Matatagui 1,2,
Isabel Sayago 1, Maria Carmen Horrillo 1 and Isabel Gracia 3
1 GRIDSEN, Instituto de Tecnologías Físicas y de la Información (ITEFI-CSIC), Madrid 28006,
Spain; E-Mails: [email protected] (M.J.F.); [email protected] (J.L.F.);
[email protected] (D.M.); [email protected] (I.S.);
[email protected] (M.C.H.) 2 Fotónica de Microondas, CCADET, Universidad Nacional Autónoma de México (UNAM),
04510 DF, Mexico 3 Instituto de Microelectrónica de Barcelona (IMB-CNM-CSIC), Barcelona 08193, Spain;
E-Mail: [email protected]
* Author to whom correspondence should be addressed; E-Mail: [email protected];
Tel.: +34-915-618-806; Fax: +34-914-117-651.
External Editor: W. Rudolf Seitz
Received: 21 October 2014; in revised form: 1 December 2014 / Accepted: 10 December 2014 /
Published: 16 December 2014
Abstract: A new method of depositing tin dioxide nanofibers in order to develop chemical
sensors is presented. It involves an electrospinning process with in-plane electrostatic
focusing over micromechanized substrates. It is a fast and reproducible method. After an
annealing process, which can be performed by the substrate heaters, it is observed that the
fibers are intertwined forming porous networks that are randomly distributed on the
substrate. The fiber diameters oscillate from 100 nm to 200 nm and fiber lengths reach
several tens of microns. Each fiber has a polycrystalline structure with multiple
nano-grains. The sensors have been tested for the detection of acetone and hydrogen
peroxide (precursors of the explosive triacetone triperoxide, TATP) in air in the ppm range.
High and fast responses to these gases have been obtained.
OPEN ACCESS
Sensors 2014, 14 24232
Keywords: electrospinning; tin oxide; nanofiber sensors; TATP detection
1. Introduction
One-dimensional nanostructured SnO2 with a high surface to volume ratio has attracted special
attention in the last years. These types of structures, with different morphologies such as SnO2
nanowires, nanobelts, nanorods and nanofibers, are being fabricated via thermal oxidation, thermal
evaporation, self-catalytic growth, molten salt synthesis and electrospinning [1–6]. Among the
above-mentioned techniques, electrospinning has important advantages such as simplicity, low-cost,
and easy mass production. It is one of the most useful methods for the fabrication of 1-D composite
nanofibers by electrostatic stretching [6,7].
In the electrospinning process, fibers are usually produced by applying a high voltage to a viscous
solution. Under the effect of a strong electric field, a solution drop formed at the end of a metal tip is
highly electrified. It experiences two major types of electrostatic forces: a Coulombic force exerted by
the external electric field and an electrostatic repulsion between surface charges [8]. With these
electrostatic interactions, the droplet is distorted into a conical object (known as Taylor cone). As the
voltage reaches a critical value, the electrostatic forces overcome the surface tension of the solution
and an electrified jet is produced. The jet is subsequently stretched to form a continuous fiber.
Early works on electrospinning were realized with conventional organic polymers of high molecular
weight [9], however as from the middle of this decade, great interest has emerged in the development
of metal oxide fibers, such as CuO, SnO2, TiO2, ZnO, CeO2, Ta2O5, through electrospinning of
polymer solutions incorporating metal precursors and annealing processes [10–14]. In the electrospun
process various reactions such as hydrolysis, condensation and gelation of the precursors are involved
in the morphological and microstructural evolution of the fibers and after a final annealing process at
elevated temperatures (≥300 °C), the organic components decompose and the inorganic precursors
oxidize forming metal oxide nanofibers on the substrate. Due to their morphological properties, the
nanofibers of metal oxides and the coupled oxide nanocomposites nanofibers are being used in gas
sensor applications because they improve the gas-sensitive properties of the sensors [15–24]. It is well
known that nanostructured shapes such as nanowires and nanofibers are very useful for fabricating gas
sensors because of the high conductivity changes produced by the adsorption or desorption of very low
concentrations of chemical species on the surface. Therefore in order to use them in gas sensors, it is
necessary to identify the morphological parameters that define the surface of the nanofibers. It has
been seen by microscopic techniques that individual electrospun nanofibers of oxide materials usually
consist of nanosized grains and in addition, nanofiber networks are highly porous, which enhances the
process of adsorption-desorption of gases [25,26]. The sensors are often coated with a thin layer of the
sensitive material, in which the reaction with the volatiles takes place. In this case the sensitive area
equals the active area of the device. The morphology of the sensing layer plays an important role in the
molecular adsorption-desorption process, sensor response and sensitivity. In order to take advantage of
the larger surface of reaction of the nanostructured materials, they can be used as sensitive layer
instead of a thin layer, improving the sensitivity and velocity of the reaction. Therefore, sensitive
Sensors 2014, 14 24233
layers of nanostructured materials could provide better sensitivity than sensitive continuous thin films
deposited by methods such as drop, airbrush or spinning.
In the present work, a new method of preparing SnO2 nanofibers synthesized by electrospinning is
proposed. It involves a focused electrospinning system and annealing process after electrospinning a
PVA/SnCl4·5H2O composite. Scanning electron microscopy (SEM) and X-ray diffractometry (XRD)
were used for characterizing the nanofibers. The sensors have been tested for the detection of low
concentrations of acetone and hydrogen peroxide, precursors of triacetone triperoxide (TATP) used in
improvised explosive devices (IEDs) [27].
2. Materials and Methods
2.1. Electrospinning Precursor
An electrospinning method was used to synthesize SnO2 nanofibers. The electrospun solution was
prepared from a PVA/SnCl4·5H2O composite. First, a solution of poly(vinyl alcohol) (PVA) with
molecular weight of Mw ~170,000 (Sigma-Aldrich, St. Louis, MO, USA) was prepared by dissolving
the PVA powder (8%) in deionized water and stirring at 90 °C during 4 h. A solution of tin (IV)
chloride pentahydrate (SnCl4·5H2O, Sigma-Aldrich, 2 g) in deionized H2O (2 g) was prepared at room
temperature as the precursor material. This solution was slowly added into the PVA solution (20 g) and
stirred at room temperature for 2 h. The inorganic/organic composite solution prepared was loaded into
syringe with a stainless steel needle whose external diameter was 0.6 mm.
2.2. Electrospinning Setup and Electrospinning Process (ESEP)
In the electrospinning process, the solution in the syringe is extruded from the needle tip to the
collector, where the device is placed. When high voltage is applied between the needle and the
collector, an electrostatic force is induced on the droplets of the solution that are in the needle tip. The
interaction between this electrostatic force and surface tension causes the droplets to stretch, forming
thin jets of polymer solution which dry in flight and then are deposited onto the collector.
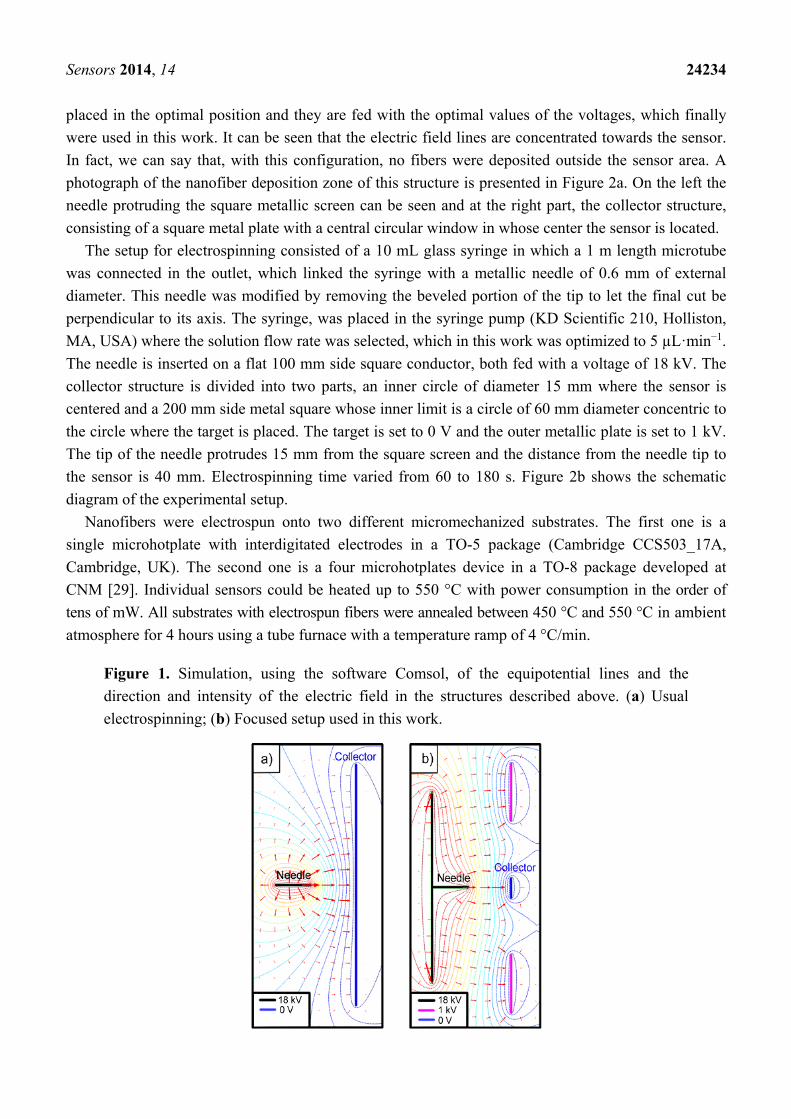
In the usual electrospinning setup, the needle is connected to a high-voltage power supply and
directed to the grounded collector, a conductor plate, obtaining random fibers, because of the wide
distribution of the electric field generated by the needle and the collector when a high voltage is
applied between them (Figure 1a). Therefore, it is difficult to electrospin fibers in specific positions.
Taking into account that our target area is small (the whole sensor has a diameter of about 10 mm), it is
essential to reduce the area of deposition of the nanofibers in order to avoid that they could be torn
when the sensor is handled after the nanofiber deposition. Usually the focusing is achieved with
electrostatic lens systems, which have ring electrodes between the needle and the substrate [28]. We
propose a new simpler method: in plane focusing.
A study of the electric field distribution has been carried out for reducing the fibers deposition area
modifying the electrode and collector shape and reducing the needle to collector distance. To perform
the required simulations of the modified deposition system, the simulation software Comsol was used.
The study took account of the shapes of electrodes, the distance between them and the voltages applied
to all them. Figure 1b shows the configuration of the electric field lines when the components are
Sensors 2014, 14 24234
placed in the optimal position and they are fed with the optimal values of the voltages, which finally
were used in this work. It can be seen that the electric field lines are concentrated towards the sensor.
In fact, we can say that, with this configuration, no fibers were deposited outside the sensor area. A
photograph of the nanofiber deposition zone of this structure is presented in Figure 2a. On the left the
needle protruding the square metallic screen can be seen and at the right part, the collector structure,
consisting of a square metal plate with a central circular window in whose center the sensor is located.
The setup for electrospinning consisted of a 10 mL glass syringe in which a 1 m length microtube
was connected in the outlet, which linked the syringe with a metallic needle of 0.6 mm of external
diameter. This needle was modified by removing the beveled portion of the tip to let the final cut be
perpendicular to its axis. The syringe, was placed in the syringe pump (KD Scientific 210, Holliston,
MA, USA) where the solution flow rate was selected, which in this work was optimized to 5 µL·min−1.
The needle is inserted on a flat 100 mm side square conductor, both fed with a voltage of 18 kV. The
collector structure is divided into two parts, an inner circle of diameter 15 mm where the sensor is
centered and a 200 mm side metal square whose inner limit is a circle of 60 mm diameter concentric to
the circle where the target is placed. The target is set to 0 V and the outer metallic plate is set to 1 kV.
The tip of the needle protrudes 15 mm from the square screen and the distance from the needle tip to
the sensor is 40 mm. Electrospinning time varied from 60 to 180 s. Figure 2b shows the schematic
diagram of the experimental setup.
Nanofibers were electrospun onto two different micromechanized substrates. The first one is a
single microhotplate with interdigitated electrodes in a TO-5 package (Cambridge CCS503_17A,
Cambridge, UK). The second one is a four microhotplates device in a TO-8 package developed at
CNM [29]. Individual sensors could be heated up to 550 °C with power consumption in the order of
tens of mW. All substrates with electrospun fibers were annealed between 450 °C and 550 °C in ambient
atmosphere for 4 hours using a tube furnace with a temperature ramp of 4 °C/min.
Figure 1. Simulation, using the software Comsol, of the equipotential lines and the
direction and intensity of the electric field in the structures described above. (a) Usual
electrospinning; (b) Focused setup used in this work.
Sensors 2014, 14 24235
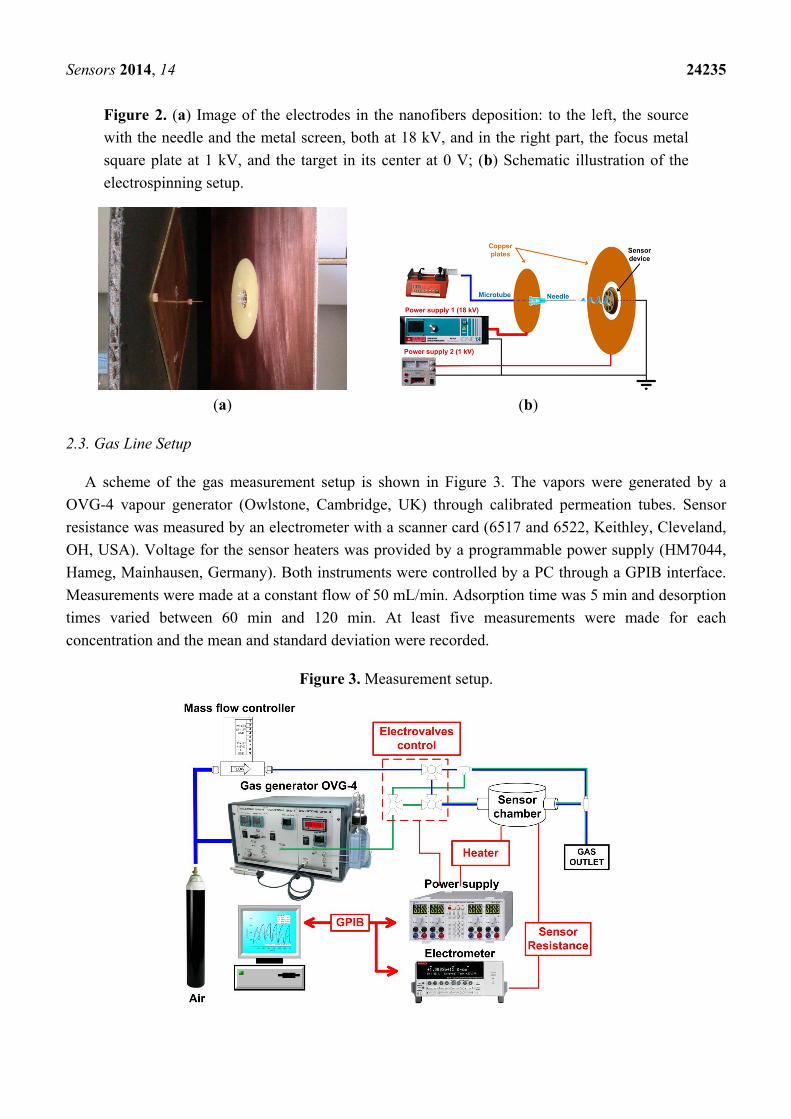
Figure 2. (a) Image of the electrodes in the nanofibers deposition: to the left, the source
with the needle and the metal screen, both at 18 kV, and in the right part, the focus metal
square plate at 1 kV, and the target in its center at 0 V; (b) Schematic illustration of the
electrospinning setup.
(a) (b)
2.3. Gas Line Setup
A scheme of the gas measurement setup is shown in Figure 3. The vapors were generated by a
OVG-4 vapour generator (Owlstone, Cambridge, UK) through calibrated permeation tubes. Sensor
resistance was measured by an electrometer with a scanner card (6517 and 6522, Keithley, Cleveland,
OH, USA). Voltage for the sensor heaters was provided by a programmable power supply (HM7044,
Hameg, Mainhausen, Germany). Both instruments were controlled by a PC through a GPIB interface.
Measurements were made at a constant flow of 50 mL/min. Adsorption time was 5 min and desorption
times varied between 60 min and 120 min. At least five measurements were made for each
concentration and the mean and standard deviation were recorded.
Figure 3. Measurement setup.
Sensors 2014, 14 24236
3. Results and Discussion
3.1. Morphological Characterization
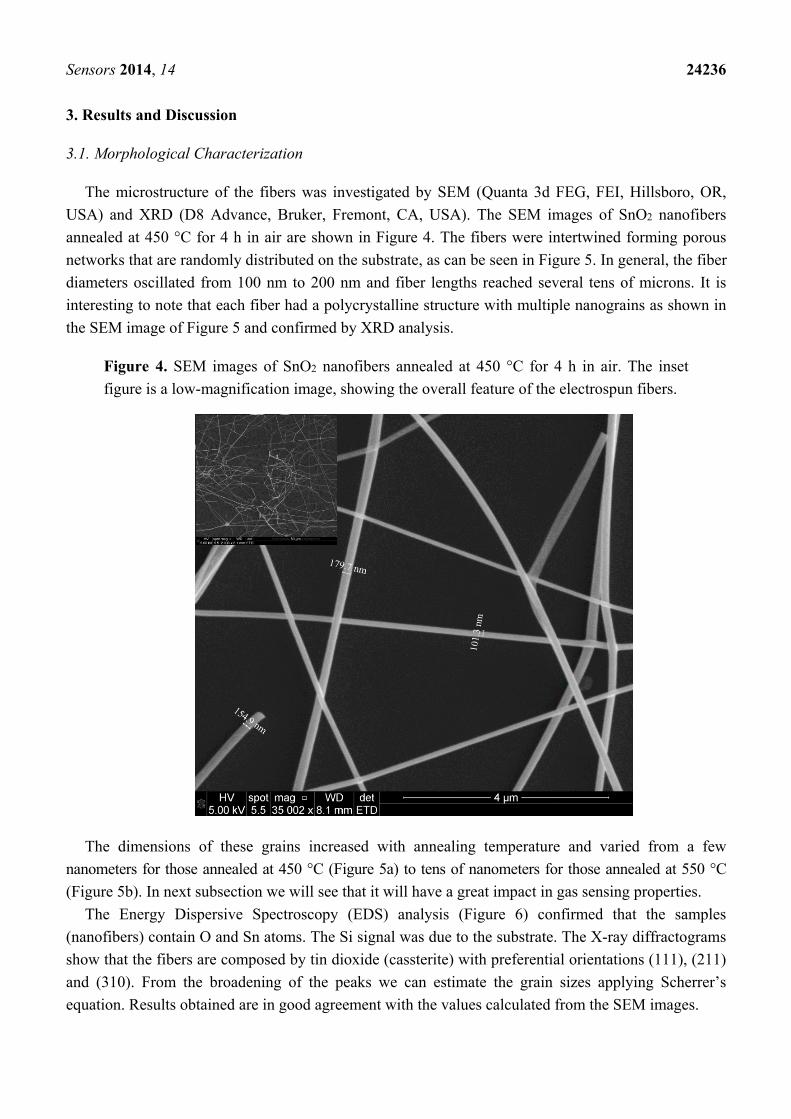
The microstructure of the fibers was investigated by SEM (Quanta 3d FEG, FEI, Hillsboro, OR,
USA) and XRD (D8 Advance, Bruker, Fremont, CA, USA). The SEM images of SnO2 nanofibers
annealed at 450 °C for 4 h in air are shown in Figure 4. The fibers were intertwined forming porous
networks that are randomly distributed on the substrate, as can be seen in Figure 5. In general, the fiber
diameters oscillated from 100 nm to 200 nm and fiber lengths reached several tens of microns. It is
interesting to note that each fiber had a polycrystalline structure with multiple nanograins as shown in
the SEM image of Figure 5 and confirmed by XRD analysis.
Figure 4. SEM images of SnO2 nanofibers annealed at 450 °C for 4 h in air. The inset
figure is a low-magnification image, showing the overall feature of the electrospun fibers.
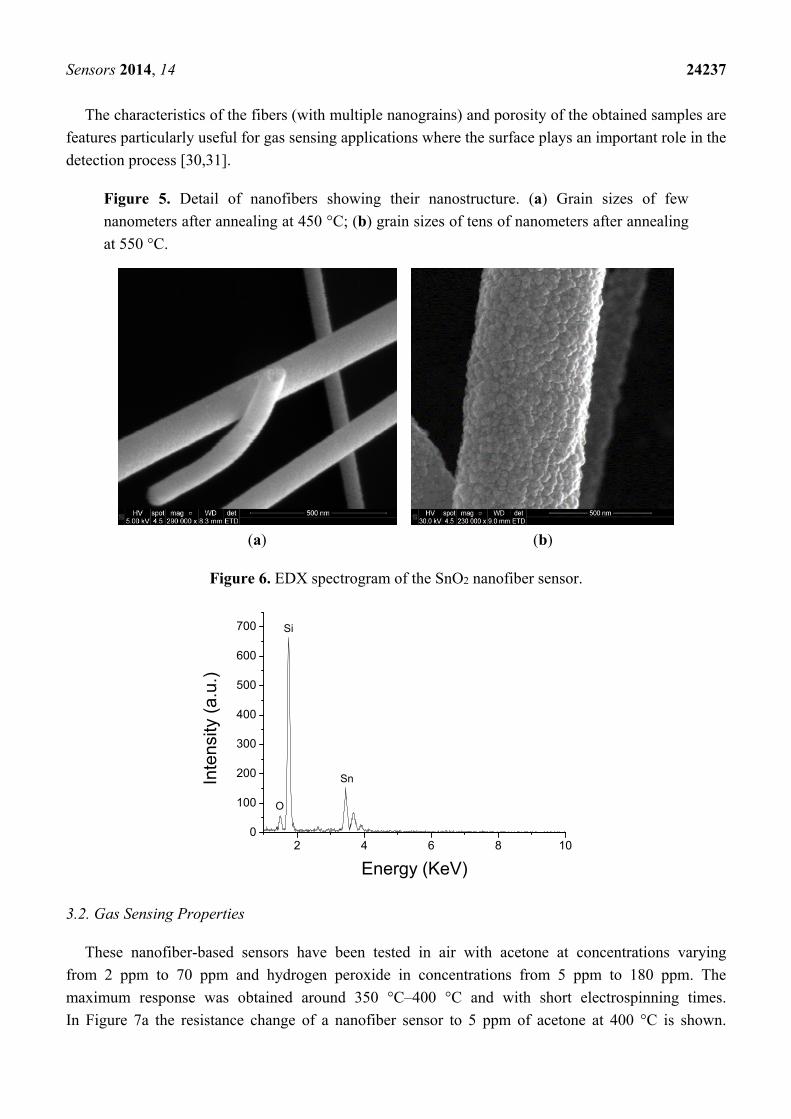
The dimensions of these grains increased with annealing temperature and varied from a few
nanometers for those annealed at 450 °C (Figure 5a) to tens of nanometers for those annealed at 550 °C
(Figure 5b). In next subsection we will see that it will have a great impact in gas sensing properties.
The Energy Dispersive Spectroscopy (EDS) analysis (Figure 6) confirmed that the samples
(nanofibers) contain O and Sn atoms. The Si signal was due to the substrate. The X-ray diffractograms
show that the fibers are composed by tin dioxide (cassterite) with preferential orientations (111), (211)
and (310). From the broadening of the peaks we can estimate the grain sizes applying Scherrer’s
equation. Results obtained are in good agreement with the values calculated from the SEM images.
Sensors 2014, 14 24237
The characteristics of the fibers (with multiple nanograins) and porosity of the obtained samples are
features particularly useful for gas sensing applications where the surface plays an important role in the
detection process [30,31].
Figure 5. Detail of nanofibers showing their nanostructure. (a) Grain sizes of few
nanometers after annealing at 450 °C; (b) grain sizes of tens of nanometers after annealing
at 550 °C.
(a) (b)
Figure 6. EDX spectrogram of the SnO2 nanofiber sensor.
2 4 6 8 100
100
200
300
400
500
600
700
Inte
nsity
(a.
u.)
Energy (KeV)
Sn
O
Si
3.2. Gas Sensing Properties
These nanofiber-based sensors have been tested in air with acetone at concentrations varying
from 2 ppm to 70 ppm and hydrogen peroxide in concentrations from 5 ppm to 180 ppm. The
maximum response was obtained around 350 °C–400 °C and with short electrospinning times.
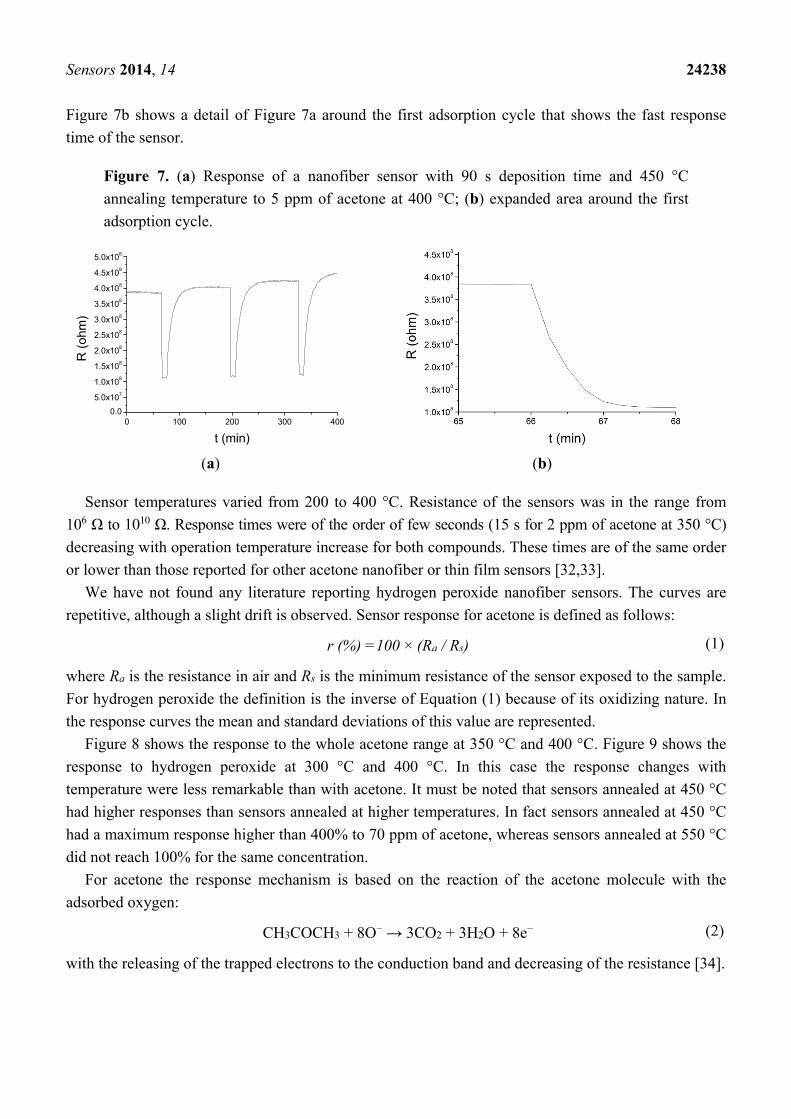
In Figure 7a the resistance change of a nanofiber sensor to 5 ppm of acetone at 400 °C is shown.
Sensors 2014, 14 24238
Figure 7b shows a detail of Figure 7a around the first adsorption cycle that shows the fast response
time of the sensor.
Figure 7. (a) Response of a nanofiber sensor with 90 s deposition time and 450 °C
annealing temperature to 5 ppm of acetone at 400 °C; (b) expanded area around the first
adsorption cycle.
(a) (b)
Sensor temperatures varied from 200 to 400 °C. Resistance of the sensors was in the range from
106 Ω to 1010 Ω. Response times were of the order of few seconds (15 s for 2 ppm of acetone at 350 °C)
decreasing with operation temperature increase for both compounds. These times are of the same order
or lower than those reported for other acetone nanofiber or thin film sensors [32,33].
We have not found any literature reporting hydrogen peroxide nanofiber sensors. The curves are
repetitive, although a slight drift is observed. Sensor response for acetone is defined as follows:
r (%) =100 × (Ra / Rs) (1)
where Ra is the resistance in air and Rs is the minimum resistance of the sensor exposed to the sample.
For hydrogen peroxide the definition is the inverse of Equation (1) because of its oxidizing nature. In
the response curves the mean and standard deviations of this value are represented.
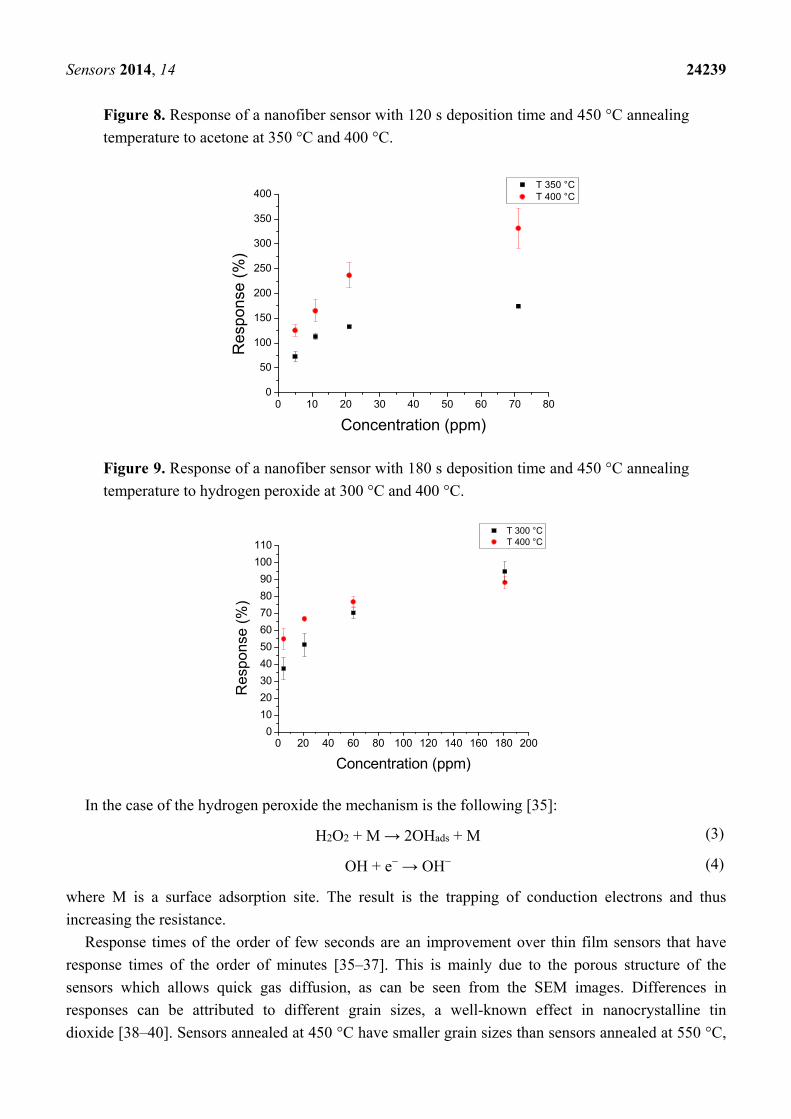
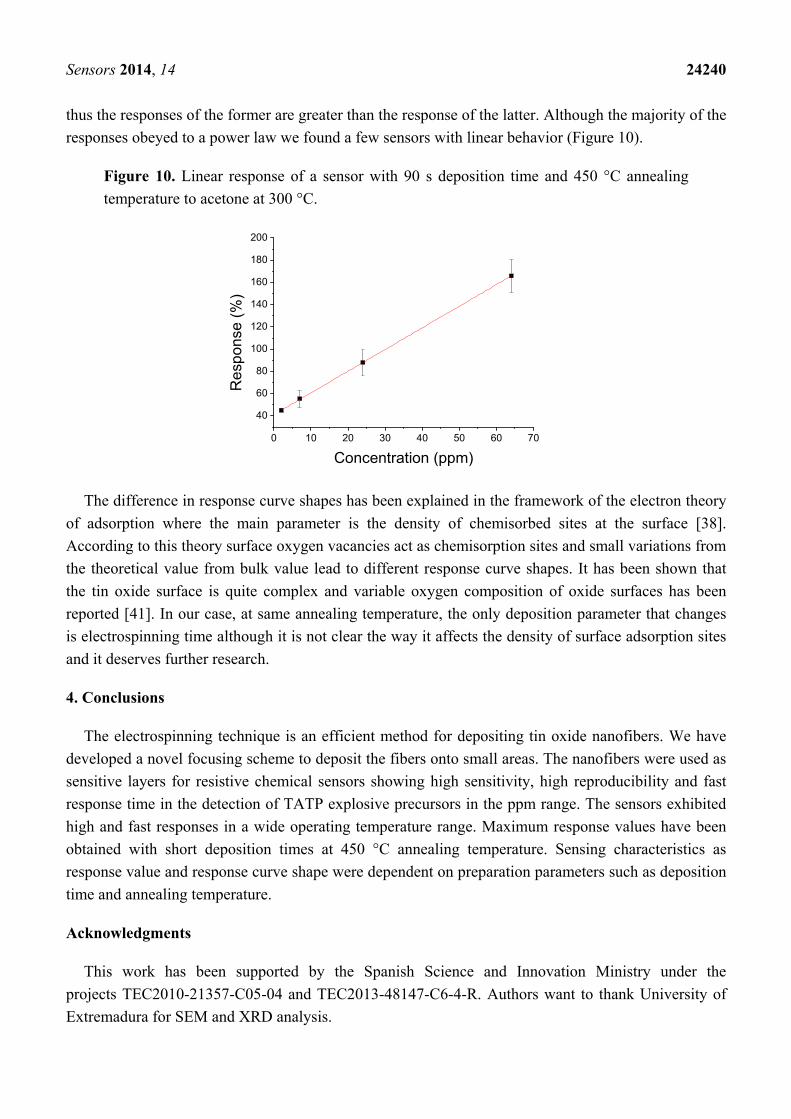
Figure 8 shows the response to the whole acetone range at 350 °C and 400 °C. Figure 9 shows the
response to hydrogen peroxide at 300 °C and 400 °C. In this case the response changes with
temperature were less remarkable than with acetone. It must be noted that sensors annealed at 450 °C
had higher responses than sensors annealed at higher temperatures. In fact sensors annealed at 450 °C
had a maximum response higher than 400% to 70 ppm of acetone, whereas sensors annealed at 550 °C
did not reach 100% for the same concentration.
For acetone the response mechanism is based on the reaction of the acetone molecule with the
adsorbed oxygen:
CH3COCH3 + 8O− → 3CO2 + 3H2O + 8e− (2)
with the releasing of the trapped electrons to the conduction band and decreasing of the resistance [34].
0 100 200 300 4000.0
5.0x10⁷
1.0x10⁸
1.5x10⁸
2.0x10⁸
2.5x10⁸
3.0x10⁸
3.5x10⁸
4.0x10⁸
4.5x10⁸
5.0x10⁸
R (
oh
m)
t (min)
Sensors 2014, 14 24239
Figure 8. Response of a nanofiber sensor with 120 s deposition time and 450 °C annealing
temperature to acetone at 350 °C and 400 °C.
0 10 20 30 40 50 60 70 800
50
100
150
200
250
300
350
400 T 350 °C T 400 °C
Res
pons
e (%
)
Concentration (ppm)
Figure 9. Response of a nanofiber sensor with 180 s deposition time and 450 °C annealing
temperature to hydrogen peroxide at 300 °C and 400 °C.
0 20 40 60 80 100 120 140 160 180 2000
10
20
30
40
50
60
70
80
90
100
110 T 300 °C T 400 °C
Res
pons
e (%
)
Concentration (ppm)
In the case of the hydrogen peroxide the mechanism is the following [35]:
H2O2 + M → 2OHads + M (3)
OH + e− → OH− (4)
where M is a surface adsorption site. The result is the trapping of conduction electrons and thus
increasing the resistance.
Response times of the order of few seconds are an improvement over thin film sensors that have
response times of the order of minutes [35–37]. This is mainly due to the porous structure of the
sensors which allows quick gas diffusion, as can be seen from the SEM images. Differences in
responses can be attributed to different grain sizes, a well-known effect in nanocrystalline tin
dioxide [38–40]. Sensors annealed at 450 °C have smaller grain sizes than sensors annealed at 550 °C,
Sensors 2014, 14 24240
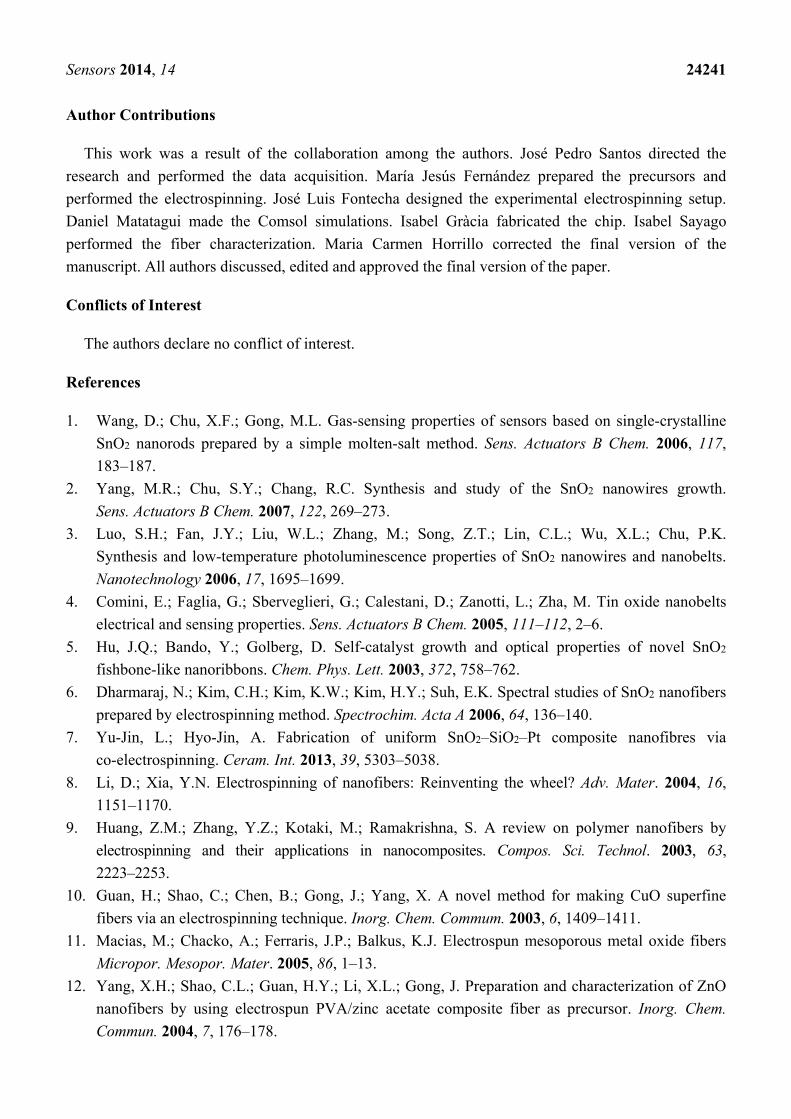
thus the responses of the former are greater than the response of the latter. Although the majority of the
responses obeyed to a power law we found a few sensors with linear behavior (Figure 10).
Figure 10. Linear response of a sensor with 90 s deposition time and 450 °C annealing
temperature to acetone at 300 °C.
0 10 20 30 40 50 60 70
40
60
80
100
120
140
160
180
200R
esp
on
se (
%)
Concentration (ppm)
The difference in response curve shapes has been explained in the framework of the electron theory
of adsorption where the main parameter is the density of chemisorbed sites at the surface [38].
According to this theory surface oxygen vacancies act as chemisorption sites and small variations from
the theoretical value from bulk value lead to different response curve shapes. It has been shown that
the tin oxide surface is quite complex and variable oxygen composition of oxide surfaces has been
reported [41]. In our case, at same annealing temperature, the only deposition parameter that changes
is electrospinning time although it is not clear the way it affects the density of surface adsorption sites
and it deserves further research.
4. Conclusions
The electrospinning technique is an efficient method for depositing tin oxide nanofibers. We have
developed a novel focusing scheme to deposit the fibers onto small areas. The nanofibers were used as
sensitive layers for resistive chemical sensors showing high sensitivity, high reproducibility and fast
response time in the detection of TATP explosive precursors in the ppm range. The sensors exhibited
high and fast responses in a wide operating temperature range. Maximum response values have been
obtained with short deposition times at 450 °C annealing temperature. Sensing characteristics as
response value and response curve shape were dependent on preparation parameters such as deposition
time and annealing temperature.
Acknowledgments
This work has been supported by the Spanish Science and Innovation Ministry under the
projects TEC2010-21357-C05-04 and TEC2013-48147-C6-4-R. Authors want to thank University of
Extremadura for SEM and XRD analysis.
Sensors 2014, 14 24241
Author Contributions
This work was a result of the collaboration among the authors. José Pedro Santos directed the
research and performed the data acquisition. María Jesús Fernández prepared the precursors and
performed the electrospinning. José Luis Fontecha designed the experimental electrospinning setup.
Daniel Matatagui made the Comsol simulations. Isabel Gràcia fabricated the chip. Isabel Sayago
performed the fiber characterization. Maria Carmen Horrillo corrected the final version of the
manuscript. All authors discussed, edited and approved the final version of the paper.
Conflicts of Interest
The authors declare no conflict of interest.
References
1. Wang, D.; Chu, X.F.; Gong, M.L. Gas-sensing properties of sensors based on single-crystalline
SnO2 nanorods prepared by a simple molten-salt method. Sens. Actuators B Chem. 2006, 117,
183–187.
2. Yang, M.R.; Chu, S.Y.; Chang, R.C. Synthesis and study of the SnO2 nanowires growth.
Sens. Actuators B Chem. 2007, 122, 269–273.
3. Luo, S.H.; Fan, J.Y.; Liu, W.L.; Zhang, M.; Song, Z.T.; Lin, C.L.; Wu, X.L.; Chu, P.K.
Synthesis and low-temperature photoluminescence properties of SnO2 nanowires and nanobelts.
Nanotechnology 2006, 17, 1695–1699.
4. Comini, E.; Faglia, G.; Sberveglieri, G.; Calestani, D.; Zanotti, L.; Zha, M. Tin oxide nanobelts
electrical and sensing properties. Sens. Actuators B Chem. 2005, 111–112, 2–6.
5. Hu, J.Q.; Bando, Y.; Golberg, D. Self-catalyst growth and optical properties of novel SnO2
fishbone-like nanoribbons. Chem. Phys. Lett. 2003, 372, 758–762.
6. Dharmaraj, N.; Kim, C.H.; Kim, K.W.; Kim, H.Y.; Suh, E.K. Spectral studies of SnO2 nanofibers
prepared by electrospinning method. Spectrochim. Acta A 2006, 64, 136–140.
7. Yu-Jin, L.; Hyo-Jin, A. Fabrication of uniform SnO2–SiO2–Pt composite nanofibres via
co-electrospinning. Ceram. Int. 2013, 39, 5303–5038.
8. Li, D.; Xia, Y.N. Electrospinning of nanofibers: Reinventing the wheel? Adv. Mater. 2004, 16,
1151–1170.
9. Huang, Z.M.; Zhang, Y.Z.; Kotaki, M.; Ramakrishna, S. A review on polymer nanofibers by
electrospinning and their applications in nanocomposites. Compos. Sci. Technol. 2003, 63,
2223–2253.
10. Guan, H.; Shao, C.; Chen, B.; Gong, J.; Yang, X. A novel method for making CuO superfine
fibers via an electrospinning technique. Inorg. Chem. Commum. 2003, 6, 1409–1411.
11. Macias, M.; Chacko, A.; Ferraris, J.P.; Balkus, K.J. Electrospun mesoporous metal oxide fibers
Micropor. Mesopor. Mater. 2005, 86, 1–13.
12. Yang, X.H.; Shao, C.L.; Guan, H.Y.; Li, X.L.; Gong, J. Preparation and characterization of ZnO
nanofibers by using electrospun PVA/zinc acetate composite fiber as precursor. Inorg. Chem.
Commun. 2004, 7, 176–178.
Sensors 2014, 14 24242
13. Onozuka, K.; Ding, B.; Tsuge, Y.; Naka, T.; Yamazaki, M.; Sugi, S.; Ohno, S.; Yoshikawa, M.;
Shiratori, S. Electrospinning processed nanofibrous TiO2 membranes for photovoltaic applications.
Nanotechnology 2006, 17, 1026–1031.
14. Yang, X.H.; Shao, C.L.; Liu, Y.C.; Mu, R.X.; Guan, H.Y. Nanofibers of CeO2 via an
electrospinning technique. Thin Solid Films 2005, 478, 228–231.
15. Ding, B.; Wang, M.; Yu, J.; Sun, G. Gas Sensors Based on Electrospun Nanofibers. Sensors 2009,
9, 1609–1624.
16. Ding, B.; Kim, J.; Miyazaki, Y.; Shiratori, S. Electrospun nanofibrous membrane coated quartz
crystal microbalance as gas sensor for NH3 detection. Sens. Actuators B Chem. 2004, 101,
373–380.
17. Liu, H.Q.; Kameoka, J.; Czaplewski, D.A.; Craighead, H.G. Polymeric nanowire chemical sensor.
Nano Lett. 2004, 4, 671–675.
18. Kessick, R.; Tepper, G. Electrospun polymer composite fiber arrays for the detection and
identification of volatile organic compounds. Sens. Actuators B Chem. 2006, 117, 205–210.
19. Luoh, R.; Hahn, H.T. Electrospun nanocomposite fiber mats as gas sensors Compos. Sci. Technol.
2006, 66, 2436–2441.
20. Kim, I.D.; Rothschild, A.; Lee, B.H.; Kim, D.Y.; Jo, S.M.; Tuller, H.L. Ultrasensitive
chemiresistors based on electrospun TiO2 nanofibers. Nano Lett. 2006, 6, 2009–2013.
21. Zhang, Y.; He, X.L.; Li, J.P.; Miao, Z.J.; Huang, F. Fabrication and ethanol-sensing properties of
micro gas sensor based on electrospun SnO2 nanofibers. Sens. Actuators B Chem. 2008, 132,
67–73.
22. Wang, G.; Ji, Y.; Huang, X.R.; Yang, X.Q.; Gouma, P.I.; Dudley, M. Fabrication and
characterization of polycrystalline WO3 nanofibers and their application for ammonia sensing.
J. Phys. Chem. B 2006, 110, 23777–23782.
23. Khorami, H.A.; Keyanpour-Rad, M.; Reza Vaezi, M. Synthesis of SnO2/ZnO composite
nanofibers by electrospinning method and study of its ethanol sensing properties. Appl. Surf. Sci.
2011, 257, 7988–7992.
24. Zhao, Y.; He, X.; Li, J.; Cao, X.; Jia, J. Porous CuO/SnO2 composite nanofibers fabricated by
electrospinning and their H2S sensing properties. Sens. Actuators B Chem. 2012, 165, 82–87.
25. Park, J.Y.; Asokan, K.; Choi, S.W.; Kim, S. Growth kinetics of nanograins in SnO2 fibers and size
dependent sensing properties. Sens. Actuators B Chem. 2011, 152, 254–260.
26. Zhang, Y.; Li, J.; An, G.; He, X. Highly porous SnO2 fibers by electrospinning and oxygen
plasma etching and its ethanol-sensing properties. Sens. Actuators B Chem. 2010, 144, 43–48.
27. Önnerud, H.; Wallin, S.; Östmark, H.; Menning, D.; Ek, S.; Ellis, H.; Kölhed, M. Localisation of
threat substances in urban society-LOTUS: A viable tool for finding illegal bomb factories in
cities. In Sensors, and Command, Control, Communications, and Intelligence (C3I) Technologies
for Homeland Security and Homeland Defense X; SPIE: Bellingham, WA, USA; 2011.
28. Neubert, S.; Pliszka, D.; Góra, A.; Jaworek, A.; Wintermantel, E.; Ramakrishna, S. Focused
deposition of electrospun polymer fibers. J. Appl. Polym. Sci. 2011, 125, 820–827.
29. Horrillo, M.C.; Martí, J.; Matatagui, D.; Santos, J.P.; Sayago, I.; Gutiérrez, J.; Martin-Fernandez, I.;
Ivanov, P.; Gràcia, I.; Cané, C. Single-walled carbon nanotube microsensors for nerve agent
simulant detection. Sens. Actuators B Chem. 2011, 157, 1253–1259.
Sensors 2014, 14 24243
30. Rickerby, D.G.; Horrillo, M.C.; Santos, J.P.; Serrini, P. Microstructural characterization of
nanograin tin oxide gas sensors. Nanostr. Mat. 1997, 9, 43–52.
31. Agapito, J.A.; Santos, J.P. The interaction of low NO2 concentrations in air with degenerate
nanocrystalline tin dioxide thin films. Sens. Actuators B Chem. 1996, 31, 93–98.
32. Cheng, L.; Ma, S.Y.; Li, X.B.; Luo, J.; Li, W.Q.; Li, F.M.; Mao, Y.Z.; Wang, T.T.; Li, Y.F.
Highly sensitive acetone sensors based on Y-doped SnO2 prismatic hollow nanofibers synthesized
by electrospinning. Sens. Actuators B Chem. 2014, 200, 181–190.
33. Choi, J.; Lee, J.; Choi, J., Jung, D.; Shim, S.E. Electrospun PEDOT: PSS/PVP nanofibers as the
chemiresistor in chemical vapour sensing. Synth. Met. 2010, 160, 1415–1421.
34. Qin, L.; Xu, J.; Dong, X.; Pan, Q.; Cheng, Z.; Xiang, Q.; Li, F. The template-free synthesis of
square-shaped SnO2 nanowires: the temperature effect and acetone gas sensors. Nanotechnology
2008, 19, 185705–185712.
35. Hiroki, A.; La Verne, J.A. Decomposition of Hydrogen Peroxide at Water-Ceramic Oxide
Interfaces. J. Phys. Chem. B 2005, 109, 3364–3370.
36. Rella, R.; Spadavecchia, J.; Manera, M.G.; Capone, S.; Taurino, A.; Martino, M.; Caricato, A.P.;
Tunno, T. Acetone and ethanol solid-state gas sensors based on TiO2 nanoparticles thin film
deposited by matrix assisted pulsed laser evaporation. Sens. Actuators B Chem. 2007, 127,
426–431.
37. Patil, S.B.; Patil, P.P.; More, M.A. Acetone vapour sensing characteristics of cobalt-doped SnO2
thin films. Sens. Actuators B Chem. 2007, 125, 126–130.
38. Santos, J.P.; Agapito, J.A. The interaction of oxygen with nanocrystalline SnO2 thin films in the
framework of the electron theory of adsorption. Thin Solid Films 1999, 338, 276–280.
39. Panchapakesan, B.; Cavicchi, R.; Semancik, S.; De Voe, D.L. Sensitivity, selectivity and stability
of tin oxide nanostructures on large area arrays of microhotplates. Nanotechnology 2006, 17,
415–425.
40. Rothschild, A.; Komem, Y. The effect of grain size on the sensitivity of nanocrystalline
metal-oxide gas sensors. J. Appl. Phys. 2004, 95, 6374–6380.
41. Batzill, M. Surface Science Studies of Gas Sensing Materials: SnO2. Sensors 2006, 6, 1345–1366.
© 2014 by the authors; licensee MDPI, Basel, Switzerland. This article is an open access article
distributed under the terms and conditions of the Creative Commons Attribution license
(http://creativecommons.org/licenses/by/4.0/).