Embed Size (px)
Citation preview
1
Supporting Information The Nature of Non-FRET Photoluminescence Quenching in
Nanoassemblies from Semiconductor Quantum Dots and Dye Molecules
Aleksander P. Stupaka, Thomas Blaudeckb#, Eduard I. Zenkevichc, Stefan
Krauseb,&, and Christian von Borczyskowskib*
aB. I. Stepanov Institute of Physics, National Academy of Sciences of Belarus,Prospect Nezavisimosti 70, 220072 Minsk, Belarus
bInstitute of Physics and Center for Nanostructured Materials and Analytics, Technische Universität Chemnitz, Reichenhainer Str. 70, D-09107 Chemnitz, Germany
cDepartment of Information Technologies and Robotics, National Technical University of Belarus, Prospect Nezavisimosti 65, 220013 Minsk, Belarus
#Present address: Department of Electrical Engineering and Information Technology, Center for Microtechnologies, Technische Universität Chemnitz, Reichenhainer Str. 70, D-09107 Chemnitz, Germany
&Present address: Department of Chemistry, University of Copenhagen, Universitätsparken 5, 2100 Copenhagen, Denmark
*Corresponding Author: C. von Borczyskowski: [email protected]
S1 Analysis of QD PL Intensity Quenching
For the analysis of the PL intensity quenching as a function of the number of porphyrin
molecules per QD, the well-known Stern-Volmer formalism [1] was modified. In our more
generalized approach, the luminescence quenching can be described by
. (S1)dxxKxI
I
)(1)( 0
0
(x) and represent the integrated PL intensity of the QD in presence ( (x)) and absence
I
I0
I
( ) of the chromophores, respectively. In this approach, the Stern-Volmer function
I0 )(xK
depends explicitly on the ratio x of (m-Pyr)4H2P to QD molar concentrations and can be
expressed by the first derivative KSVD(x of the experimental data plotted in conventional
Stern-Volmer representation [2, 3]. “D” stands for the QD as a possible donor in FRET
related processes. Using this approach, the corresponding KSVA values have been derived from
the acceptor A (H2P) fluorescence enhancement measurements at every titration step.
References[1] B. Valeur. Wiley-VCH (2002) Weinheim.
Electronic Supplementary Material (ESI) for Physical Chemistry Chemical Physics.This journal is © the Owner Societies 2018
2
[2] T. Blaudeck, E. Zenkevich, M. Abdel-Mottaleb, K. Szwaykowska, D. Kowerko, F. Cichos, C. von Borczyskowski. Formation Principles and Ligand Dynamics for Nanoassemblies of CdSe Quantum Dots and Functionalized Dye Molecules. ChemPhysChem (2012) 13 959-972.
[3] T. Blaudeck, E. Zenkevich, F. Cichos, C. von Borczyskowski. Probing Wave Functions at Semiconductor Quantum Dot Surfaces by Non-FRET Photoluminescence Quenching. J. Phys. Chem. C (2008) 112 20251–20257.
S2 QD PL Donor Quenching and Acceptor Fluorescence Enhancement Efficiencies
Experimental QD PL quenching efficiencies quench = 1 – I(x)/I(0) are obtained for every
QD at every step of titration by (m-Pyr)4H2P in toluene at ambient temperature, where I(0) is
the integrated intensity of the QD PL band without porphyrin, I(x) is the corresponding
intensity at a given molar ratio x.
Porphyrin fluorescence enhancement efficiencies FRET caused by FRET have been
obtained by two alternative approaches. In the first method, at every titration step, FRET
efficiencies FRET have been calculated from the direct measurements of the corresponding
intensities in fluorescence excitation spectra and optical densities (OD) in absorption spectra
of QD-porphyrin mixture using the equation [1, 2]
. (S2)
)nm590(OD)nm465(OD)nm465(OD:
)nm590(I)nm465(I)nm465(I
A
ADA
exA
exAexDAFRET
Here, IDA corresponds to the porphyrin fluorescence intensity at em = 651 nm for “QD-
porphyrin” nanoassemblies , whereas IA is the fluorescence intensity of porphyrin at the same
molar ratio at two different excitation wavelengths (465 and 590 nm). OD are the
corresponding optical densities of the solution at a given molar ratio x. The difference
reflects the increase of the acceptor emission intensity )465()465( nmInmI exAexDA
due to FRET. ex = 590 nm corresponds to the wavelength, where the absorption of QD is at
minimum. Additionally, the corresponding porphyrin fluorescence intensity has to be
corrected for the residual QD PL at 651 nm as a function of x assuming a linear superposition
of PL signals from QD and porphyrin.
FRET efficiencies have been in most of our experiments evaluated on the basis of the
measured porphyrin fluorescence intensity using an alternative approach described in [1, 3-6]
according to
(S3) nFFF
AexcD
AADexcAFRET
)(
where FAD corresponds to the acceptor (A, porphyrin) fluorescence intensity in the presence
of a QD donor D and measured at em = 651 nm (maximum of Q(0,0) band of porphyrin
fluorescence) while exciting at the strong donor absorption exc = 465 nm. FA corresponds to
3
emission under the same em and exc conditions in the absence of the QD (donor). n is the
number of A-molecules per D-QD, A and D are molar extinction coefficients of A and D,
respectively, at the excitation wavelength ex.
References
[1] E. Zenkevich, F. Cichos, A. Shulga, E. Petrov, T. Blaudeck, C. von Borczyskowski. Nanoassemblies designed from semiconductor quantum dots and molecular arrays. J. Phys. Chem. B (2005) 109 8679-8692.
[2] E.I. Zenkevich, E.I. Sagun, V.N. Knyukshto, A.S. Stasheuski, V.A. Galievsky, A.P. Stupak, T. Blaudeck, C. von Borczyskowski. Quantitative Analysis of Singlet Oxygen (1O2) Generation via Energy Transfer in Bioconjugates Based on Semiconductor Quantum Dots and Porphyrin Ligands. J. Phys. Chem. C (2011) 115 21535-21545.
[3] E. Zenkevich, A. Shulga, A. Chernook, Gurinovich. Migration of energy of electronic excitation in the chemical dimers of the cyclopentaneporphyrins. J. Appl. Spectr. (1986) 45 984-991.
[4] A. Clapp, I. Medintz, J. Mauro, B. Fisher, M. Bawendi, H. Mattoussi. Fluorescence resonance energy transfer between quantum dot donors and dye-labeled protein acceptors. J. Am. Chem. Soc. (2004) 126 301-310.
[5] K. E. Knowles, D. B. Tice, E. A. McArthur, G. C. Solomon, E. A. Weiss, E. A. Chemical control of the photoluminescence of CdSe quantum dot-organic complexes with a series of para-substituted aniline ligands. J. Am. Chem. Soc. (2010) 132 1041–1050.
[6] J. R. Lakowicz. Principles of Fluorescence Spectroscopy. Springer (2006) New York.
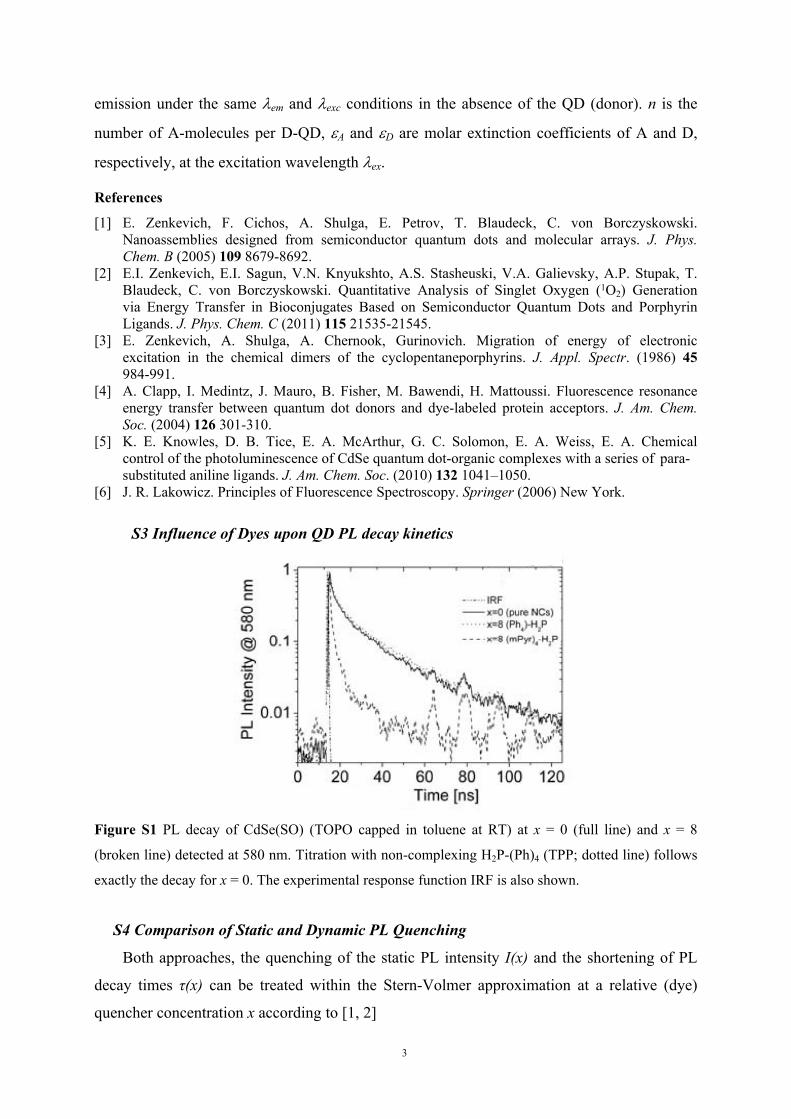
S3 Influence of Dyes upon QD PL decay kinetics
Figure S1 PL decay of CdSe(SO) (TOPO capped in toluene at RT) at x = 0 (full line) and x = 8
(broken line) detected at 580 nm. Titration with non-complexing H2P-(Ph)4 (TPP; dotted line) follows
exactly the decay for x = 0. The experimental response function IRF is also shown.
S4 Comparison of Static and Dynamic PL Quenching
Both approaches, the quenching of the static PL intensity I(x) and the shortening of PL
decay times τ(x) can be treated within the Stern-Volmer approximation at a relative (dye)
quencher concentration x according to [1, 2]
4
, (S4)
)(
11)(
00
0
xxkxK
xII
qD
SV
where I0 and <τ0> apply at x = 0. Since the PL decay has to be fitted by 3 exponential decay
terms we determined <τ0> and <τ(x)> according to Equ. 4 in the manuscript. KSVD(x)
corresponds to the (differential) Stern-Volmer constant and kq to the quenching rate with τ0kq
= KSVD(x) [3]. Equ. (S4) is only valid in case there is only one unique quenching mechanism.
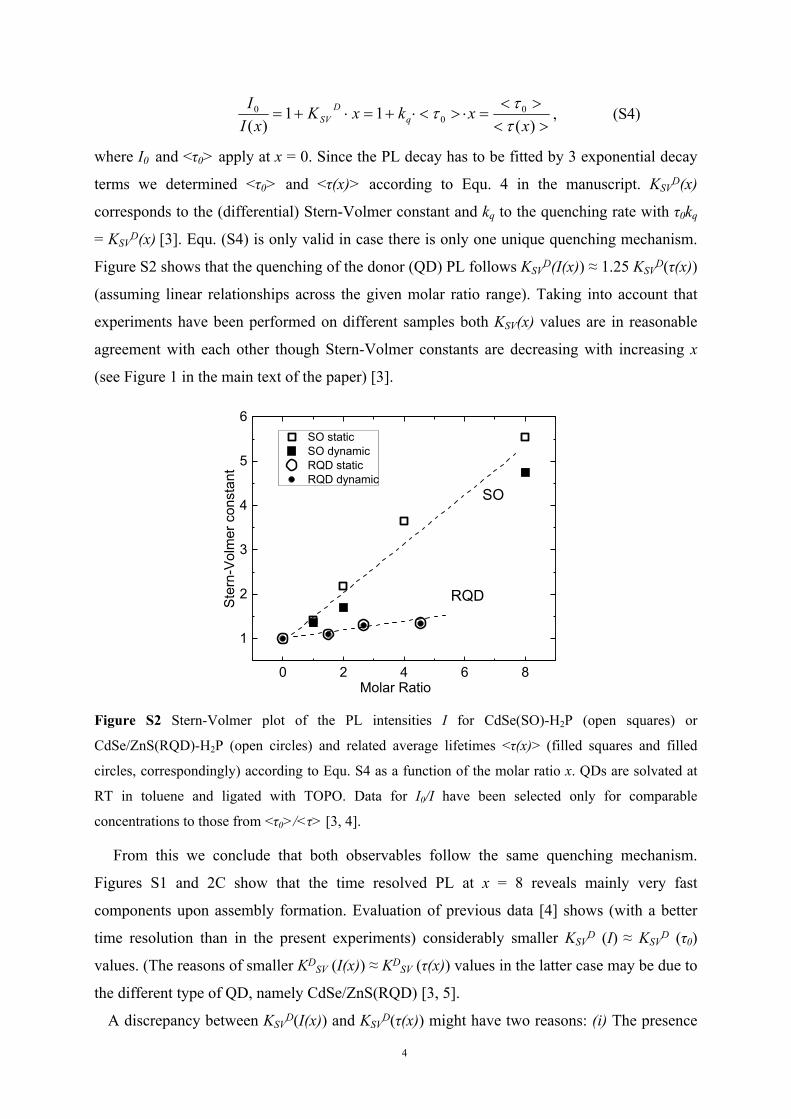
Figure S2 shows that the quenching of the donor (QD) PL follows KSVD(I(x)) ≈ 1.25 KSV
D(τ(x))
(assuming linear relationships across the given molar ratio range). Taking into account that
experiments have been performed on different samples both KSV(x) values are in reasonable
agreement with each other though Stern-Volmer constants are decreasing with increasing x
(see Figure 1 in the main text of the paper) [3].
0 2 4 6 8
1
2
3
4
5
6
RQD
SO static SO dynamic RQD static RQD dynamic
Ste
rn-V
olm
er c
onst
ant
Molar Ratio
SO
Figure S2 Stern-Volmer plot of the PL intensities I for CdSe(SO)-H2P (open squares) or
CdSe/ZnS(RQD)-H2P (open circles) and related average lifetimes <τ(x)> (filled squares and filled
circles, correspondingly) according to Equ. S4 as a function of the molar ratio x. QDs are solvated at
RT in toluene and ligated with TOPO. Data for I0/I have been selected only for comparable
concentrations to those from <τ0>/<τ> [3, 4].
From this we conclude that both observables follow the same quenching mechanism.
Figures S1 and 2C show that the time resolved PL at x = 8 reveals mainly very fast
components upon assembly formation. Evaluation of previous data [4] shows (with a better
time resolution than in the present experiments) considerably smaller KSVD (I) ≈ KSV
D (τ0)
values. (The reasons of smaller KDSV (I(x)) ≈ KD
SV (τ(x)) values in the latter case may be due to
the different type of QD, namely CdSe/ZnS(RQD) [3, 5].
A discrepancy between KSVD(I(x)) and KSV
D(τ(x)) might have two reasons: (i) The presence
5
of at least 2 different quenching mechanisms e. g. one in the ground state and another one in
the excited state or/and (ii) experimental time resolution is limited thus missing extremely fast
decay processes (faster than 800 fs) which contribute to the PL intensity quenching as “dark”
states but are missed in time-resolved experiments. We never observed changes in absorption
upon assembly formation which makes reason (i) very unlikely to apply.
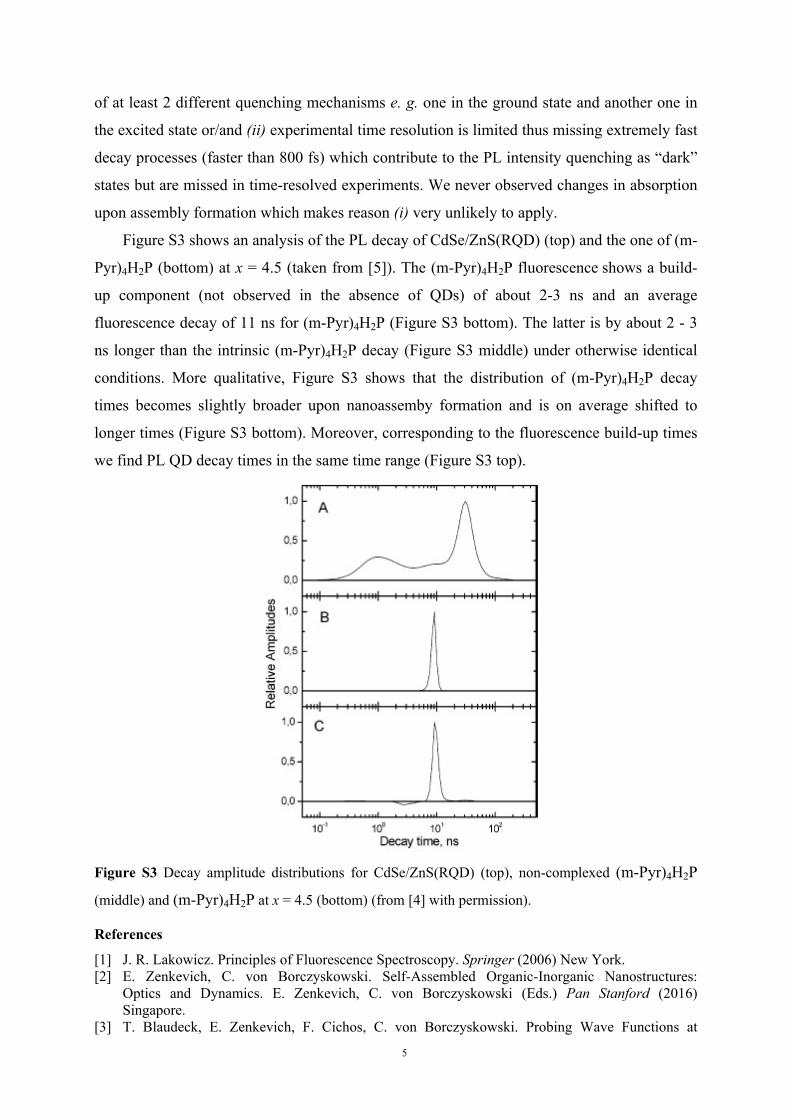
Figure S3 shows an analysis of the PL decay of CdSe/ZnS(RQD) (top) and the one of (m-
Pyr)4H2P (bottom) at x = 4.5 (taken from [5]). The (m-Pyr)4H2P fluorescence shows a build-
up component (not observed in the absence of QDs) of about 2-3 ns and an average
fluorescence decay of 11 ns for (m-Pyr)4H2P (Figure S3 bottom). The latter is by about 2 - 3
ns longer than the intrinsic (m-Pyr)4H2P decay (Figure S3 middle) under otherwise identical
conditions. More qualitative, Figure S3 shows that the distribution of (m-Pyr)4H2P decay
times becomes slightly broader upon nanoassemby formation and is on average shifted to
longer times (Figure S3 bottom). Moreover, corresponding to the fluorescence build-up times
we find PL QD decay times in the same time range (Figure S3 top).
Figure S3 Decay amplitude distributions for CdSe/ZnS(RQD) (top), non-complexed (m-Pyr)4H2P
(middle) and (m-Pyr)4H2P at x = 4.5 (bottom) (from [4] with permission).
References
[1] J. R. Lakowicz. Principles of Fluorescence Spectroscopy. Springer (2006) New York.[2] E. Zenkevich, C. von Borczyskowski. Self-Assembled Organic-Inorganic Nanostructures:
Optics and Dynamics. E. Zenkevich, C. von Borczyskowski (Eds.) Pan Stanford (2016) Singapore.
[3] T. Blaudeck, E. Zenkevich, F. Cichos, C. von Borczyskowski. Probing Wave Functions at
6
Semiconductor Quantum Dot Surfaces by Non-FRET Photoluminescence Quenching. J. Phys. Chem. C (2008) 112 20251–20257.
[4] E. Zenkevich, F. Cichos, A. Shulga, E. Petrov, T. Blaudeck, C. von Borczyskowski. Nanoassemblies designed from semiconductor quantum dots and molecular arrays. J. Phys. Chem. B (2005) 109 8679-8692.
[5] T. Blaudeck, E. Zenkevich, M. Abdel-Mottaleb, K. Szwaykowska, D. Kowerko, F. Cichos, C. von Borczyskowski. Formation Principles and Ligand Dynamics for Nanoassemblies of CdSe Quantum Dots and Functionalized Dye Molecules. ChemPhysChem (2012) 13 959-972.
S5 Spectral Properties of Intra-Gap Emission (IGE)
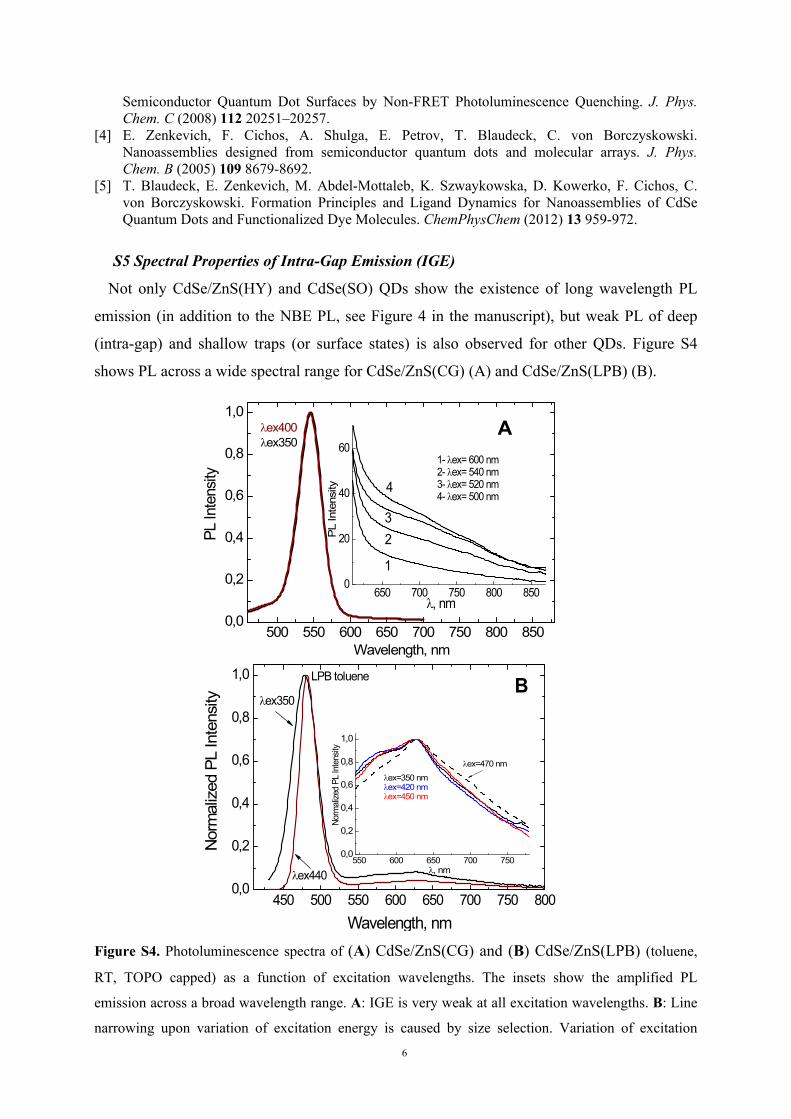
Not only CdSe/ZnS(HY) and CdSe(SO) QDs show the existence of long wavelength PL
emission (in addition to the NBE PL, see Figure 4 in the manuscript), but weak PL of deep
(intra-gap) and shallow traps (or surface states) is also observed for other QDs. Figure S4
shows PL across a wide spectral range for CdSe/ZnS(CG) (A) and CdSe/ZnS(LPB) (B).
500 550 600 650 700 750 800 8500,0
0,2
0,4
0,6
0,8
1,0
ex350ex400
PL In
tens
ity
Wavelength, nm
A
650 700 750 800 8500
20
40
60
4
32
1- ex= 600 nm2- ex= 540 nm3- ex= 520 nm4- ex= 500 nm
PL
Inte
nsity
, nm
1
450 500 550 600 650 700 750 8000,0
0,2
0,4
0,6
0,8
1,0
ex350
LPB toluene
Nor
mal
ized
PL
Inte
nsity
Wavelength, nm
B
ex440550 600 650 700 750
0,0
0,2
0,4
0,6
0,8
1,0
ex=470 nmex=350 nmex=420 nmex=450 nm
Norm
alize
d PL
Inte
nsity
, nm
Figure S4. Photoluminescence spectra of (A) CdSe/ZnS(CG) and (B) CdSe/ZnS(LPB) (toluene,
RT, TOPO capped) as a function of excitation wavelengths. The insets show the amplified PL
emission across a broad wavelength range. A: IGE is very weak at all excitation wavelengths. B: Line
narrowing upon variation of excitation energy is caused by size selection. Variation of excitation
7
reveals the presence of 3 distinct bands, a narrow one at 628 nm and 2 broad ones between 550 – 625
nm and 630 – 750 nm, respectively. The latter one is more effectively excited with NBE excitation.
The narrow band was not observed in earlier spectra (see Figure 4) and is probably due to formation of
lager CdSe/ZnS(LPB) QDs upon long time investigations.
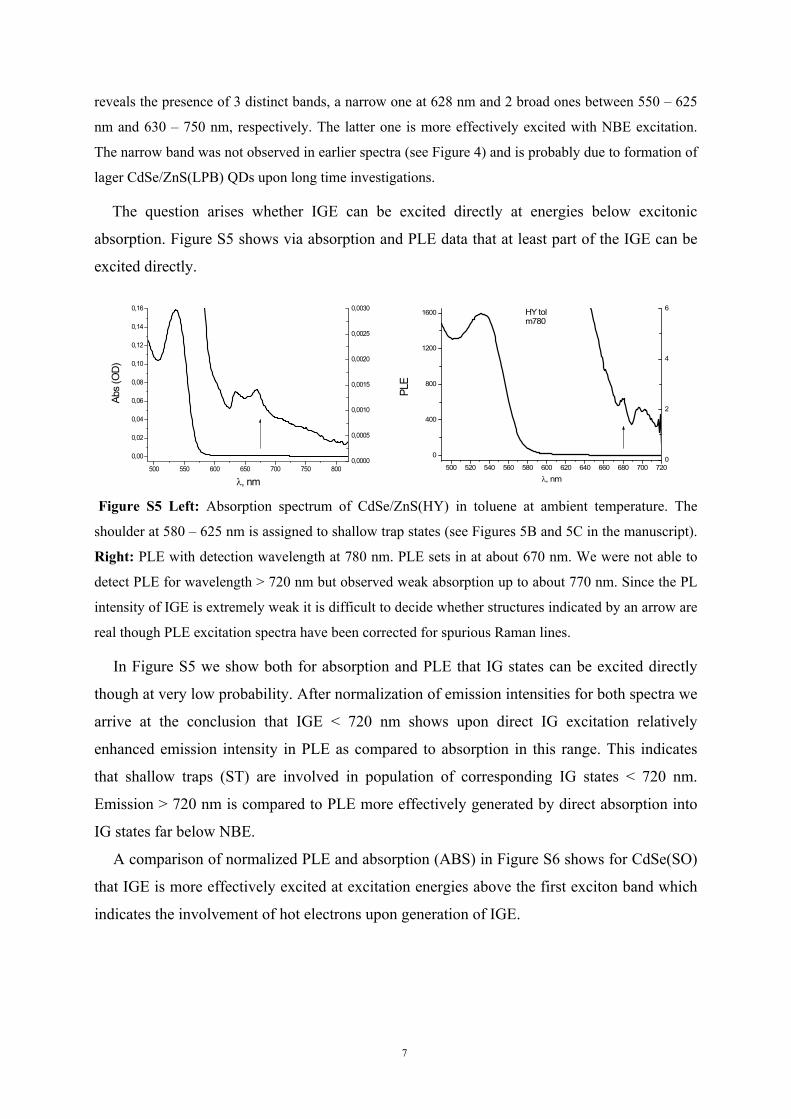
The question arises whether IGE can be excited directly at energies below excitonic
absorption. Figure S5 shows via absorption and PLE data that at least part of the IGE can be
excited directly.
Figure S5 Left: Absorption spectrum of CdSe/ZnS(HY) in toluene at ambient temperature. The
shoulder at 580 – 625 nm is assigned to shallow trap states (see Figures 5B and 5C in the manuscript).
Right: PLE with detection wavelength at 780 nm. PLE sets in at about 670 nm. We were not able to
detect PLE for wavelength > 720 nm but observed weak absorption up to about 770 nm. Since the PL
intensity of IGE is extremely weak it is difficult to decide whether structures indicated by an arrow are
real though PLE excitation spectra have been corrected for spurious Raman lines.
In Figure S5 we show both for absorption and PLE that IG states can be excited directly
though at very low probability. After normalization of emission intensities for both spectra we
arrive at the conclusion that IGE < 720 nm shows upon direct IG excitation relatively
enhanced emission intensity in PLE as compared to absorption in this range. This indicates
that shallow traps (ST) are involved in population of corresponding IG states < 720 nm.
Emission > 720 nm is compared to PLE more effectively generated by direct absorption into
IG states far below NBE.
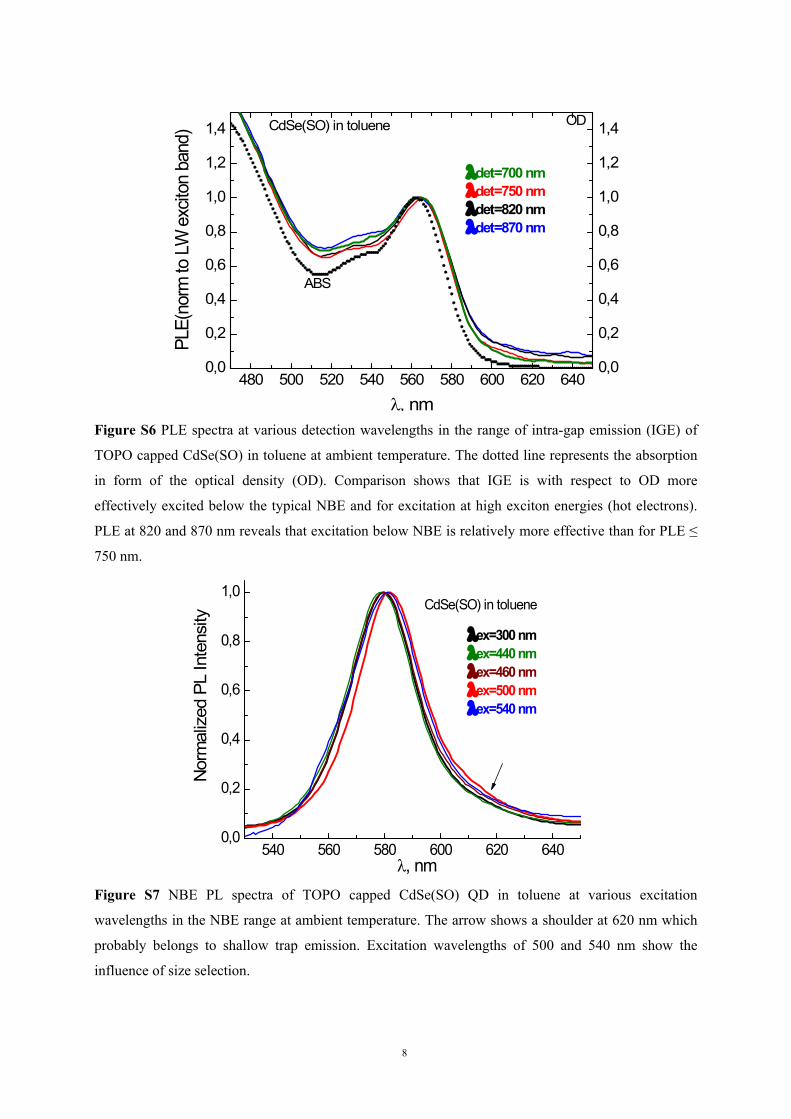
A comparison of normalized PLE and absorption (ABS) in Figure S6 shows for CdSe(SO)
that IGE is more effectively excited at excitation energies above the first exciton band which
indicates the involvement of hot electrons upon generation of IGE.
500 550 600 650 700 750 800
0,00
0,02
0,04
0,06
0,08
0,10
0,12
0,14
0,16
0,0000
0,0005
0,0010
0,0015
0,0020
0,0025
0,0030
Abs
(OD
)
, nm500 520 540 560 580 600 620 640 660 680 700 720
0
400
800
1200
1600
0
2
4
6
PLE
, nm
HY tolm780
8
480 500 520 540 560 580 600 620 6400,0
0,2
0,4
0,6
0,8
1,0
1,2
1,4
0,0
0,2
0,4
0,6
0,8
1,0
1,2
1,4
CdSe(SO) in toluene
PLE(
norm
to L
W e
xcito
n ba
nd)
, nm
det=700 nmdet=750 nmdet=820 nmdet=870 nm
OD
ABS
Figure S6 PLE spectra at various detection wavelengths in the range of intra-gap emission (IGE) of
TOPO capped CdSe(SO) in toluene at ambient temperature. The dotted line represents the absorption
in form of the optical density (OD). Comparison shows that IGE is with respect to OD more
effectively excited below the typical NBE and for excitation at high exciton energies (hot electrons).
PLE at 820 and 870 nm reveals that excitation below NBE is relatively more effective than for PLE ≤
750 nm.
540 560 580 600 620 6400,0
0,2
0,4
0,6
0,8
1,0
ex=300 nmex=440 nmex=460 nmex=500 nmex=540 nm
CdSe(SO) in toluene
Nor
mal
ized
PL
Inte
nsity
, nmFigure S7 NBE PL spectra of TOPO capped CdSe(SO) QD in toluene at various excitation
wavelengths in the NBE range at ambient temperature. The arrow shows a shoulder at 620 nm which
probably belongs to shallow trap emission. Excitation wavelengths of 500 and 540 nm show the
influence of size selection.
9
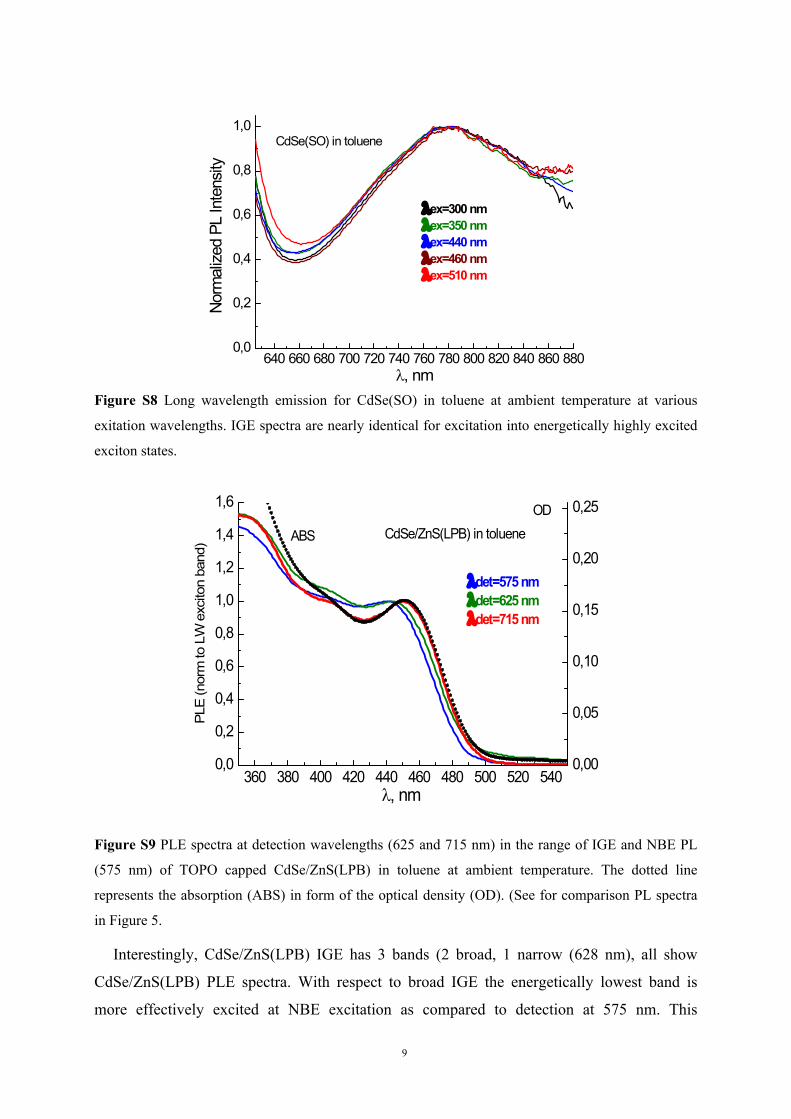
640 660 680 700 720 740 760 780 800 820 840 860 8800,0
0,2
0,4
0,6
0,8
1,0
ex=300 nmex=350 nmex=440 nmex=460 nmex=510 nm
CdSe(SO) in toluene
Norm
alize
d PL
Inte
nsity
, nmFigure S8 Long wavelength emission for CdSe(SO) in toluene at ambient temperature at various
exitation wavelengths. IGE spectra are nearly identical for excitation into energetically highly excited
exciton states.
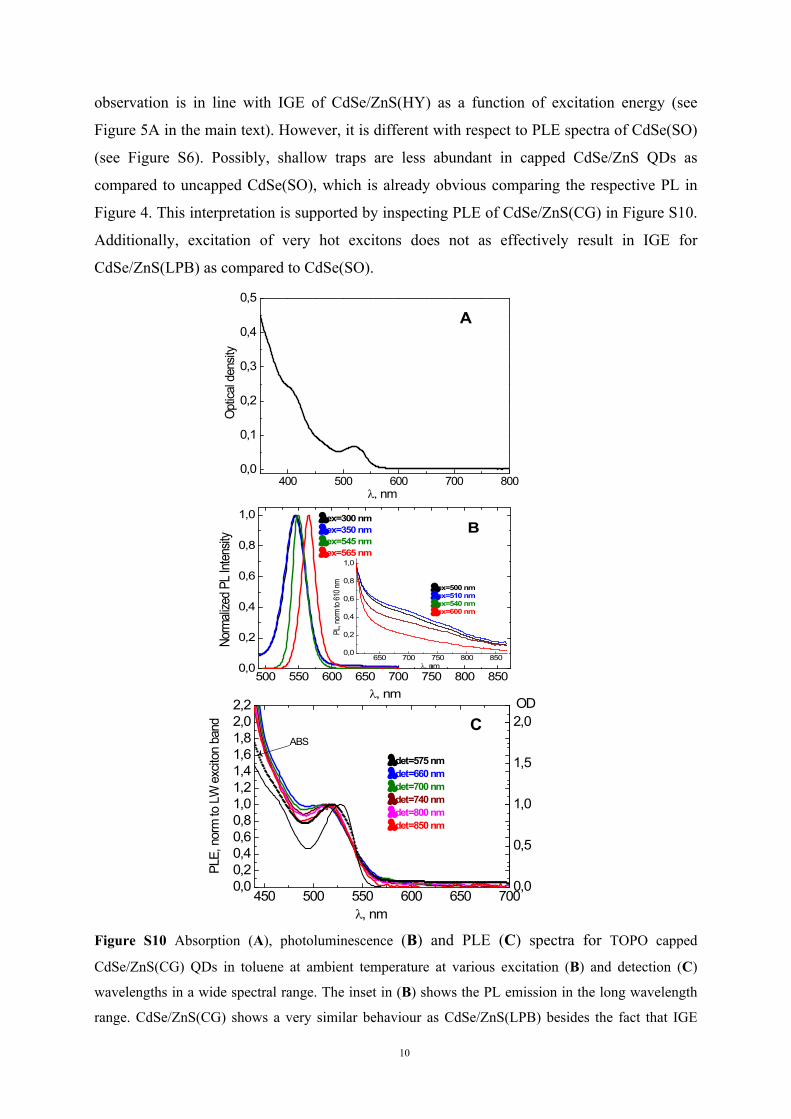
360 380 400 420 440 460 480 500 520 5400,0
0,2
0,4
0,6
0,8
1,0
1,2
1,4
1,6
0,00
0,05
0,10
0,15
0,20
0,25
det=575 nmdet=625 nmdet=715 nm
PLE
(nor
m to
LW
exc
iton
band
)
, nm
CdSe/ZnS(LPB) in tolueneOD
ABS
Figure S9 PLE spectra at detection wavelengths (625 and 715 nm) in the range of IGE and NBE PL
(575 nm) of TOPO capped CdSe/ZnS(LPB) in toluene at ambient temperature. The dotted line
represents the absorption (ABS) in form of the optical density (OD). (See for comparison PL spectra
in Figure 5.
Interestingly, CdSe/ZnS(LPB) IGE has 3 bands (2 broad, 1 narrow (628 nm), all show
CdSe/ZnS(LPB) PLE spectra. With respect to broad IGE the energetically lowest band is
more effectively excited at NBE excitation as compared to detection at 575 nm. This
10
observation is in line with IGE of CdSe/ZnS(HY) as a function of excitation energy (see
Figure 5A in the main text). However, it is different with respect to PLE spectra of CdSe(SO)
(see Figure S6). Possibly, shallow traps are less abundant in capped CdSe/ZnS QDs as
compared to uncapped CdSe(SO), which is already obvious comparing the respective PL in
Figure 4. This interpretation is supported by inspecting PLE of CdSe/ZnS(CG) in Figure S10.
Additionally, excitation of very hot excitons does not as effectively result in IGE for
CdSe/ZnS(LPB) as compared to CdSe(SO).
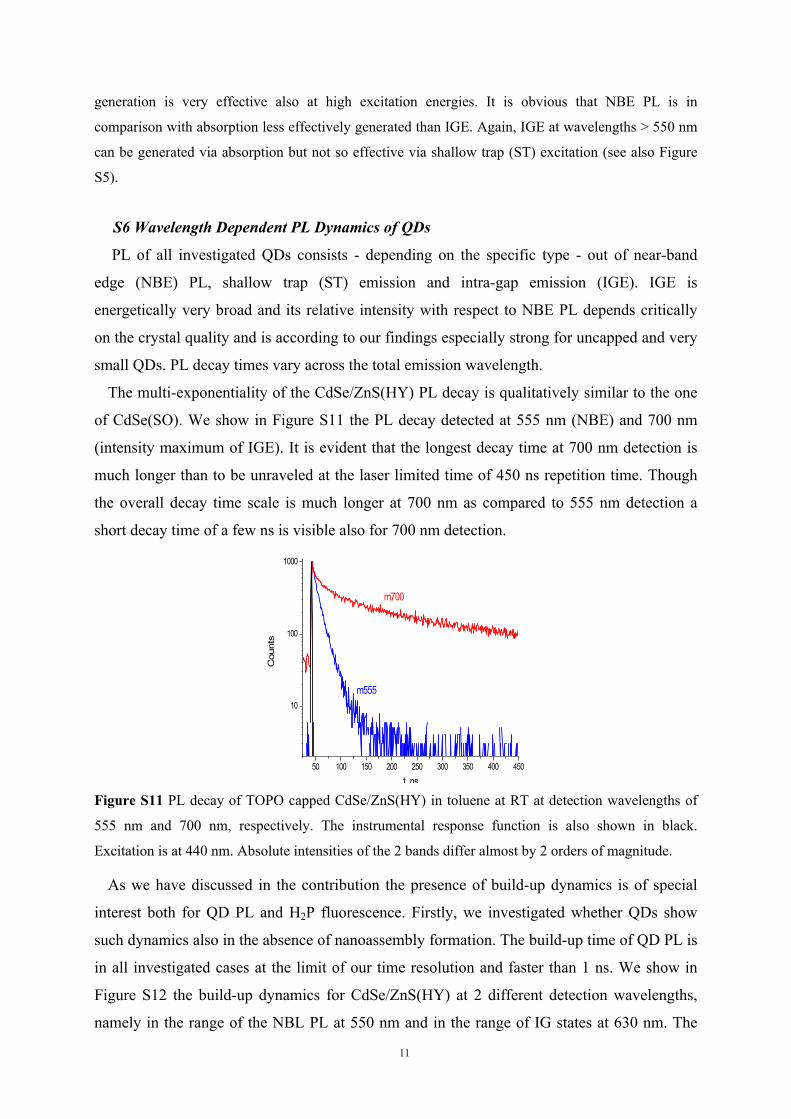
450 500 550 600 650 7000,00,20,40,60,81,01,21,41,61,82,02,2
0,0
0,5
1,0
1,5
2,0
det=575 nmdet=660 nmdet=700 nmdet=740 nmdet=800 nmdet=850 nm
PLE,
nor
m to
LW
exc
iton
band
, nm
CABS
OD
400 500 600 700 8000,0
0,1
0,2
0,3
0,4
0,5
Opt
ical d
ensit
y
, nm
A
500 550 600 650 700 750 800 8500,0
0,2
0,4
0,6
0,8
1,0
ex=300 nmex=350 nmex=545 nmex=565 nm
Norm
alize
d PL I
ntens
ity
, nm
B
650 700 750 800 8500,0
0,2
0,4
0,6
0,8
1,0
ex=500 nmex=510 nmex=540 nmex=600 nm
PL, n
orm
to 61
0 nm
, nm
Figure S10 Absorption (A), photoluminescence (B) and PLE (C) spectra for TOPO capped
CdSe/ZnS(CG) QDs in toluene at ambient temperature at various excitation (B) and detection (C)
wavelengths in a wide spectral range. The inset in (B) shows the PL emission in the long wavelength
range. CdSe/ZnS(CG) shows a very similar behaviour as CdSe/ZnS(LPB) besides the fact that IGE
11
generation is very effective also at high excitation energies. It is obvious that NBE PL is in
comparison with absorption less effectively generated than IGE. Again, IGE at wavelengths > 550 nm
can be generated via absorption but not so effective via shallow trap (ST) excitation (see also Figure
S5).
S6 Wavelength Dependent PL Dynamics of QDs
PL of all investigated QDs consists - depending on the specific type - out of near-band
edge (NBE) PL, shallow trap (ST) emission and intra-gap emission (IGE). IGE is
energetically very broad and its relative intensity with respect to NBE PL depends critically
on the crystal quality and is according to our findings especially strong for uncapped and very
small QDs. PL decay times vary across the total emission wavelength.
The multi-exponentiality of the CdSe/ZnS(HY) PL decay is qualitatively similar to the one
of CdSe(SO). We show in Figure S11 the PL decay detected at 555 nm (NBE) and 700 nm
(intensity maximum of IGE). It is evident that the longest decay time at 700 nm detection is
much longer than to be unraveled at the laser limited time of 450 ns repetition time. Though
the overall decay time scale is much longer at 700 nm as compared to 555 nm detection a
short decay time of a few ns is visible also for 700 nm detection.
50 100 150 200 250 300 350 400 450
10
100
1000
m555
m700
Cou
nts
t, ns
Figure S11 PL decay of TOPO capped CdSe/ZnS(HY) in toluene at RT at detection wavelengths of
555 nm and 700 nm, respectively. The instrumental response function is also shown in black.
Excitation is at 440 nm. Absolute intensities of the 2 bands differ almost by 2 orders of magnitude.
As we have discussed in the contribution the presence of build-up dynamics is of special
interest both for QD PL and H2P fluorescence. Firstly, we investigated whether QDs show
such dynamics also in the absence of nanoassembly formation. The build-up time of QD PL is
in all investigated cases at the limit of our time resolution and faster than 1 ns. We show in
Figure S12 the build-up dynamics for CdSe/ZnS(HY) at 2 different detection wavelengths,
namely in the range of the NBL PL at 550 nm and in the range of IG states at 630 nm. The
12
build-up time is within the experimental response at 550 nm while it is slightly slowed down
to about 1 ns at 630 nm. The same applies at 700 nm (see Figure S12). This can be explained
by assuming that intra-gap states are at least partly populated via short lived near band edge
states.
20 40 60 80 100 120
10
100
1kHY CdSe/ZnS QD toluene 293 Kex=410 nm em=550 nm
coun
ts
t, ns
A
20 40 60 80 100 120
10
100
1kHY CdSe/ZnS QD toluene 293 Kex=410 nm em=630 nm
coun
tst, ns
B
Figure S12 PL decay of CdSe/ZnS(HY) in toluene at RT and 410 nm excitation wavelength. Also
shown is the experimental response function in red. A: Near-band-edge emission at 550 nm. B: Intra-
gap emission at 630 nm.
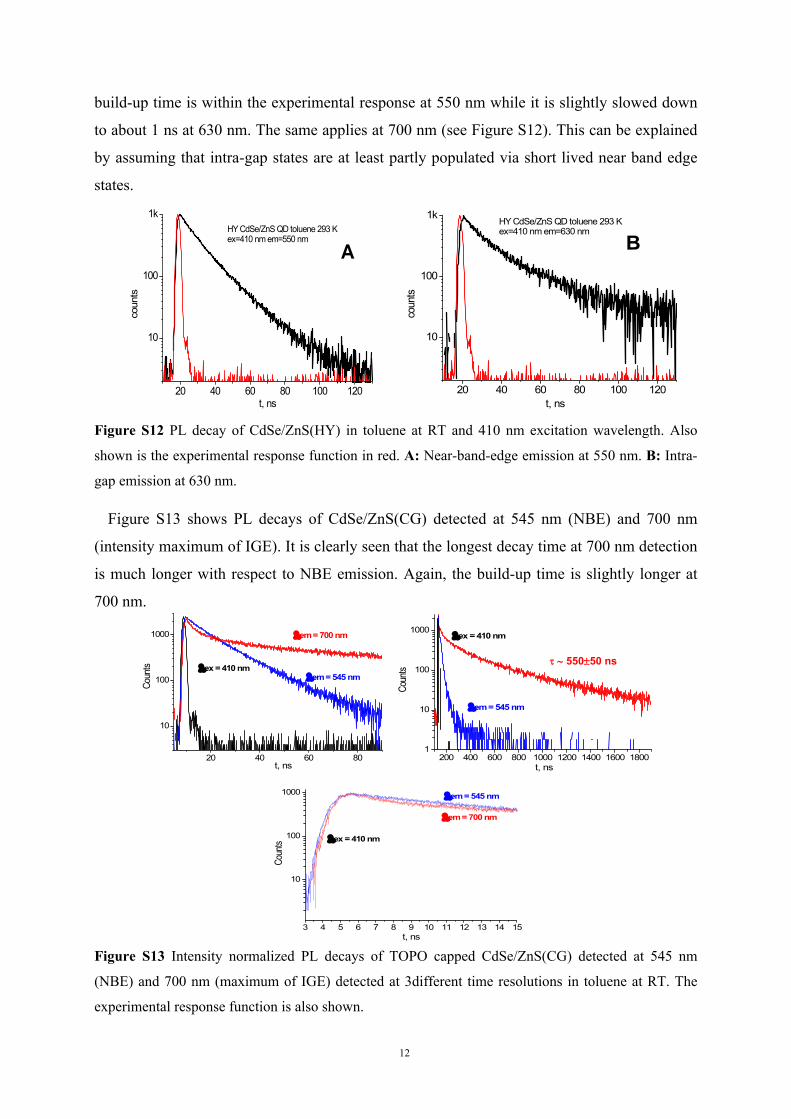
Figure S13 shows PL decays of CdSe/ZnS(CG) detected at 545 nm (NBE) and 700 nm
(intensity maximum of IGE). It is clearly seen that the longest decay time at 700 nm detection
is much longer with respect to NBE emission. Again, the build-up time is slightly longer at
700 nm.
Figure S13 Intensity normalized PL decays of TOPO capped CdSe/ZnS(CG) detected at 545 nm
(NBE) and 700 nm (maximum of IGE) detected at 3different time resolutions in toluene at RT. The
experimental response function is also shown.
20 40 60 80
10
100
1000
em = 545 nm
em = 700 nm
ex = 410 nm
Coun
ts
t, ns
3 4 5 6 7 8 9 10 11 12 13 14 15
10
100
1000 em = 545 nm
em = 700 nm
ex = 410 nm
Coun
ts
t, ns
200 400 600 800 1000 1200 1400 1600 18001
10
100
1000ex = 410 nm
em = 545 nm
Coun
ts
t, ns
55050 ns
13
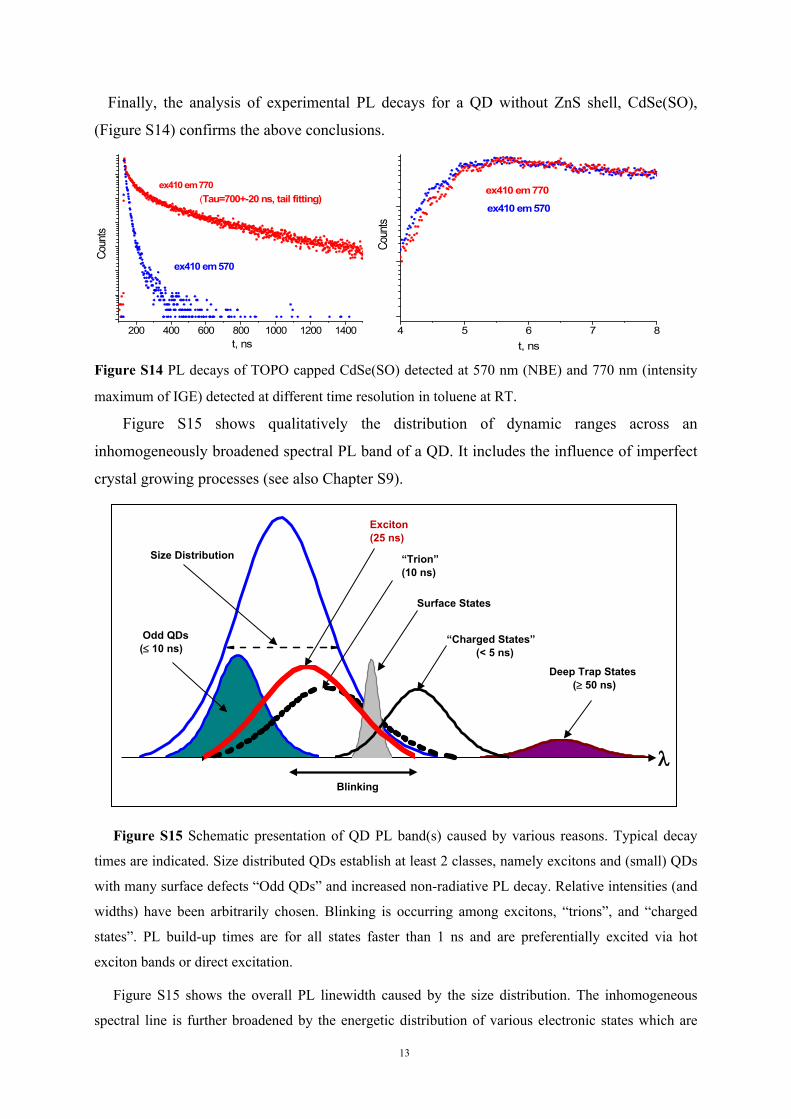
Finally, the analysis of experimental PL decays for a QD without ZnS shell, CdSe(SO),
(Figure S14) confirms the above conclusions.
Figure S14 PL decays of TOPO capped CdSe(SO) detected at 570 nm (NBE) and 770 nm (intensity
maximum of IGE) detected at different time resolution in toluene at RT.
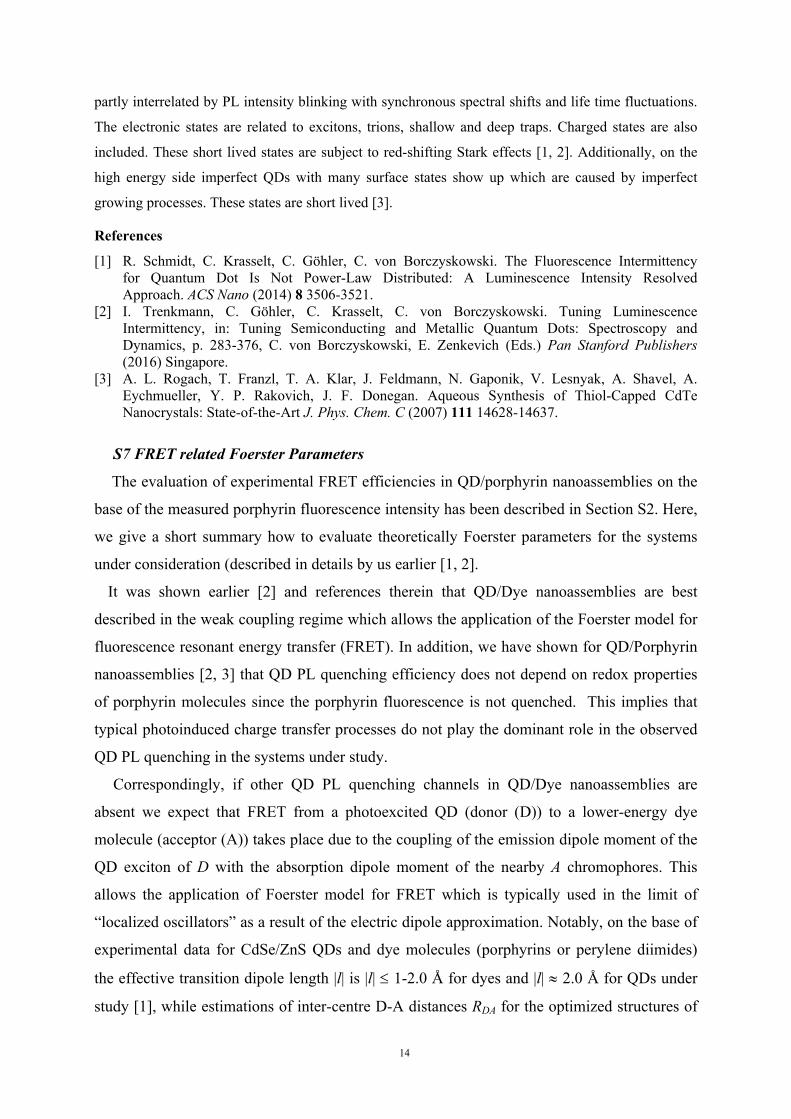
Figure S15 shows qualitatively the distribution of dynamic ranges across an
inhomogeneously broadened spectral PL band of a QD. It includes the influence of imperfect
crystal growing processes (see also Chapter S9).
Figure S15 Schematic presentation of QD PL band(s) caused by various reasons. Typical decay
times are indicated. Size distributed QDs establish at least 2 classes, namely excitons and (small) QDs
with many surface defects “Odd QDs” and increased non-radiative PL decay. Relative intensities (and
widths) have been arbitrarily chosen. Blinking is occurring among excitons, “trions”, and “charged
states”. PL build-up times are for all states faster than 1 ns and are preferentially excited via hot
exciton bands or direct excitation.
Figure S15 shows the overall PL linewidth caused by the size distribution. The inhomogeneous
spectral line is further broadened by the energetic distribution of various electronic states which are
200 400 600 800 1000 1200 1400
(Tau=700+-20 ns, tail fitting)ex410 em 770
ex410 em 570
Coun
ts
t, ns4 5 6 7 8
ex410 em 770
ex410 em 570
Coun
ts
t, ns
Size Distribution
Odd QDs( 10 ns)
Blinking
Deep Trap States ( 50 ns)
Exciton(25 ns)
“Trion”(10 ns)
“Charged States” (< 5 ns)
Surface States
14
partly interrelated by PL intensity blinking with synchronous spectral shifts and life time fluctuations.
The electronic states are related to excitons, trions, shallow and deep traps. Charged states are also
included. These short lived states are subject to red-shifting Stark effects [1, 2]. Additionally, on the
high energy side imperfect QDs with many surface states show up which are caused by imperfect
growing processes. These states are short lived [3].
References
[1] R. Schmidt, C. Krasselt, C. Göhler, C. von Borczyskowski. The Fluorescence Intermittency for Quantum Dot Is Not Power-Law Distributed: A Luminescence Intensity Resolved Approach. ACS Nano (2014) 8 3506-3521.
[2] I. Trenkmann, C. Göhler, C. Krasselt, C. von Borczyskowski. Tuning Luminescence Intermittency, in: Tuning Semiconducting and Metallic Quantum Dots: Spectroscopy and Dynamics, p. 283-376, C. von Borczyskowski, E. Zenkevich (Eds.) Pan Stanford Publishers (2016) Singapore.
[3] A. L. Rogach, T. Franzl, T. A. Klar, J. Feldmann, N. Gaponik, V. Lesnyak, A. Shavel, A. Eychmueller, Y. P. Rakovich, J. F. Donegan. Aqueous Synthesis of Thiol-Capped CdTe Nanocrystals: State-of-the-Art J. Phys. Chem. C (2007) 111 14628-14637.
S7 FRET related Foerster Parameters
The evaluation of experimental FRET efficiencies in QD/porphyrin nanoassemblies on the
base of the measured porphyrin fluorescence intensity has been described in Section S2. Here,
we give a short summary how to evaluate theoretically Foerster parameters for the systems
under consideration (described in details by us earlier [1, 2].
It was shown earlier [2] and references therein that QD/Dye nanoassemblies are best
described in the weak coupling regime which allows the application of the Foerster model for
fluorescence resonant energy transfer (FRET). In addition, we have shown for QD/Porphyrin
nanoassemblies [2, 3] that QD PL quenching efficiency does not depend on redox properties
of porphyrin molecules since the porphyrin fluorescence is not quenched. This implies that
typical photoinduced charge transfer processes do not play the dominant role in the observed
QD PL quenching in the systems under study.
Correspondingly, if other QD PL quenching channels in QD/Dye nanoassemblies are
absent we expect that FRET from a photoexcited QD (donor (D)) to a lower-energy dye
molecule (acceptor (A)) takes place due to the coupling of the emission dipole moment of the
QD exciton of D with the absorption dipole moment of the nearby A chromophores. This
allows the application of Foerster model for FRET which is typically used in the limit of
“localized oscillators” as a result of the electric dipole approximation. Notably, on the base of
experimental data for CdSe/ZnS QDs and dye molecules (porphyrins or perylene diimides)
the effective transition dipole length |l| is |l| 1-2.0 Å for dyes and |l| 2.0 Å for QDs under
study [1], while estimations of inter-centre D-A distances RDA for the optimized structures of
15
QD/Dye nanoassemblies give values RDA 2636.6 Å [1, 2, 3, 4, 5]. Since |l| << RDA the point
dipole-dipole approximation is still valid or QD/Dye nanoassemblies.
Consequently, FRET rate constant kFRET for an isolated D-A pair at distance RDA is
calculated according to [6, 7]
, (S5)6
60
0
1
DADFRET R
Rk
where D0 is the emission decay time of the individual donor in absence of the acceptor and
RDA is the inter-center distance of the interacting dipoles. R0 is the critical Foerster radius
which may be calculated as
. (S6) 4A0
DA
45
0D
26theor
0df
Nn128k10ln9000R
where NA =6.022·1023 M-1 is Avogadro number, D0 the emission quantum efficiency in the
absence of FRET and n the refraction index of the solvent. The orientation factor is
k2=[cos(D, A) - 3 cos(D, rDA) cos(A, rDA)]2, where (D, A) is the angle between transition
dipole moment vectors of the D and A subunits. (D, rDA) and (A, rDA) denote the angles
between the dipole vectors of D and A and the direction DA, respectively. For a random
static distribution of interacting dipoles k2 becomes 0.476 [7]. This is the case for QD-Dye
nanoassemblies. The spectral overlap integral
(S7)
0
4ADd)()(fJ
is calculated on the basis of experimental acceptor molecular absorption and donor (QD) PL
spectra, where () corresponds to the molar decimal extinction coefficient of A, fD () to the
D quantum emission spectrum normalized to unity by area on a wave number scale. The
detailed analysis of theoretical dependencies of spectral overlap, Foerster critical radius R0,
donor-acceptor distance RDA, FRET efficiencies, and reciprocal FRET rate as a function of the
QD size represented by the respective PL emission wavelength and one type of porphyrin (m-
Pyr)4H2P molecule has been described by us recently [2].
Furthermore, if FRET plays the dominant role in QD PL quenching in nanoassemblies, the
theoretical FRET efficiency FRETtheor for (1:1) pair interaction QD-Dye can be calculated as
. (S8)16
theor0
DAtheorFRET R
R1
When a finite number of acceptors become attached to the QD surface, the excitonic energy
is spread among n acceptors on one QD with equal probability. Generally speaking, the
16
probability of an exciton transfer to particular acceptor molecules scales inversely
proportional to the total number of n acceptors A per donor D. Thus, Eq. S8 becomes [8]
. (S9) 16
theor0
DAtheorFRET R
Rn11n
Based on these physical backgrounds the comparative theoretical analysis of FRET
parameters for various QD/Dye nanoassemblies has been carried out in our group [1, 5, 9].
These calculations yield that if FRET is the only reason of QD PL quenching in
nanoassemblies, already upon attachment of one single acceptor molecule, the maximal
achievable FRET efficiency may reach up to 50-70% for various CdSe/ZnS QDs (depending
on the QD PL quantum yield). Additionally, theoretical estimations show that for the
nanoassembly containing CdSe/ZnS QD (dCdSe 3 nm, 2 ZnS monolayers) or CdSe(SO) QD
(dCdSe = 3.5 nm) with attached meta-pyridyl substituted porphyrin, FRET should be realized
within a time scale longer than 10 ns (even up to 3037 ns for CdSe/ZnS(RQD), see Table 1
in [1]).
In addition, it should be mentioned that FRET dynamics between a CdSe/ZnS QD and a
porphyrin molecule in a QD/porphyrin nanoassembly have also been studied by ab initio
electronic structure calculations (reduced density matrix formalism) combined with a
molecular dynamic approach [4]. According to this approach in the case of even smaller
Cd33Se33/Zn78S78 QDs with an attached porphyrin molecule, FRET QDPorphyrin should
occur on a nanosecond time scale shorter than 7 ns.
As a consequence, if one does not take into account a competition with other reasons for
QD PL quenching, the real transfer time based on atomistic details derived from PL
quenching in QD/Porphyrin nanoassemblies may be fully described in the framework of the
Foerster model. Theoretically predicted FRET times should range from 7 ns to 37 ns.
We like to discuss at this point previously reported FRET dynamics for CdSe/ZnS(RQD)
QDs which should have much less effective FRET compared to CdSe(SO) [1, 2]. Previously
we have shown [10] that if a FRET donor decay time is longer than the one of the acceptor
there will be still energy transfer lasting longer than the acceptors intrinsic decay time
resulting in an apparent lengthening of the fluorescence decay which is in fact observed for
CdSe/ZnS(RQD) as is shown in Figure S3 (and CdSe(SO), see manuscript). In such case we
expect for CdSe/ZnS(RQD) nanoassemblies a bi-exponential decay of the acceptor
fluorescence with kH2P and an additional “effective” energy transfer rate according to (kFRET +
kQD). Taking the PL decay of the CdSe/ZnS (RQD) based nanoassemblies of 20 ns and the
FRET transfer time of 30 ns [1] we obtain 12 ns for the second component of the postulated
17
bi-exponential H2P decay which is qualitatively in agreement with a broadening of the
fluorescence decay time of H2P (see Figure S3).
The observed short build-up component of 3 ns is much too fast to be responsible for FRET
QDporphyrin for this kind of QD (dCdSe = 3.2 nm, 3 ZnS monolayers). Therefore, we assign
this component also for CdSe/ZnS(RQD) to the population time of those intra-gap trap states
induced by H2P or effectively populated in the presence of H2P molecules on a QD surface.
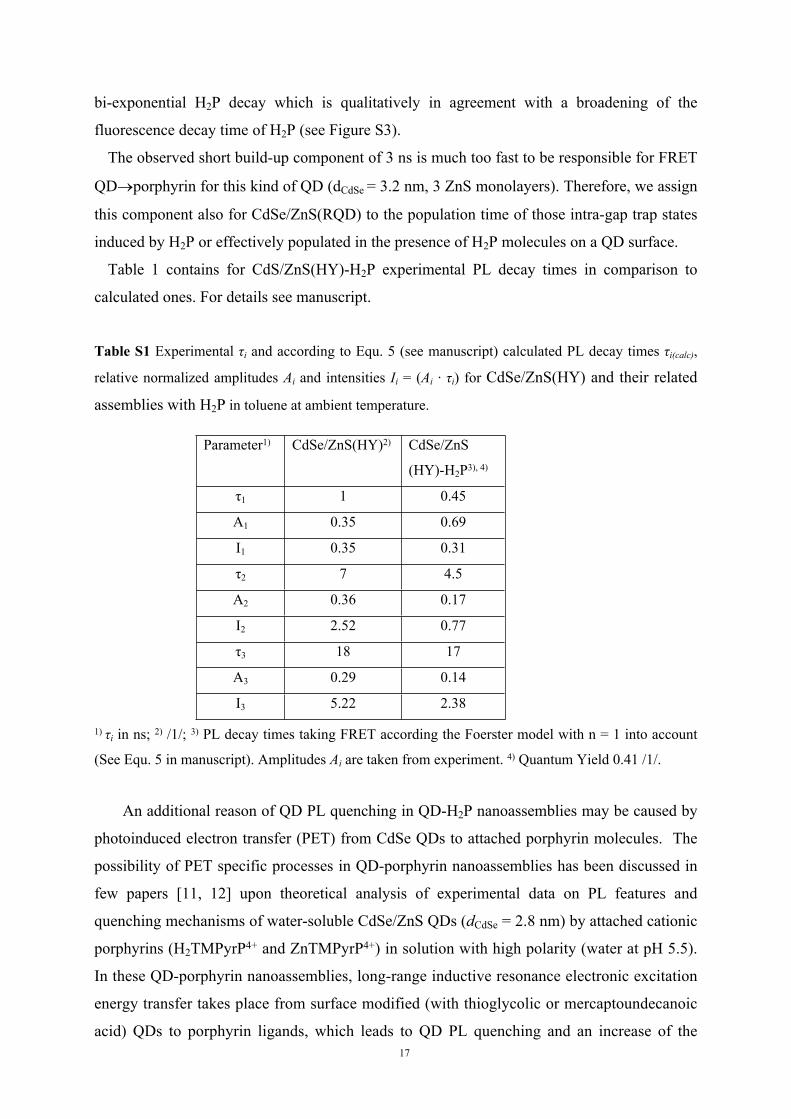
Table 1 contains for CdS/ZnS(HY)-H2P experimental PL decay times in comparison to
calculated ones. For details see manuscript.
Table S1 Experimental τi and according to Equ. 5 (see manuscript) calculated PL decay times τi(calc),
relative normalized amplitudes Ai and intensities Ii = (Ai ∙ τi) for CdSe/ZnS(HY) and their related
assemblies with H2P in toluene at ambient temperature.
1) τi in ns; 2) /1/; 3) PL decay times taking FRET according the Foerster model with n = 1 into account
(See Equ. 5 in manuscript). Amplitudes Ai are taken from experiment. 4) Quantum Yield 0.41 /1/.
An additional reason of QD PL quenching in QD-H2P nanoassemblies may be caused by
photoinduced electron transfer (PET) from CdSe QDs to attached porphyrin molecules. The
possibility of PET specific processes in QD-porphyrin nanoassemblies has been discussed in
few papers [11, 12] upon theoretical analysis of experimental data on PL features and
quenching mechanisms of water-soluble CdSe/ZnS QDs (dCdSe = 2.8 nm) by attached cationic
porphyrins (H2TMPyrP4+ and ZnTMPyrP4+) in solution with high polarity (water at pH 5.5).
In these QD-porphyrin nanoassemblies, long-range inductive resonance electronic excitation
energy transfer takes place from surface modified (with thioglycolic or mercaptoundecanoic
acid) QDs to porphyrin ligands, which leads to QD PL quenching and an increase of the
Parameter1) CdSe/ZnS(HY)2) CdSe/ZnS
(HY)-H2P3), 4)
τ1 1 0.45
A1 0.35 0.69
I1 0.35 0.31
τ2 7 4.5
A2 0.36 0.17
I2 2.52 0.77
τ3 18 17
A3 0.29 0.14
I3 5.22 2.38
18
porphyrin fluorescence intensity. It has been shown that, when mercaptoundecanoic acid is
used as a QD shell, the QD luminescence quenching efficiency by porphyrins follows the
Förster-Galanin theory and depends on the overlap integral between the CdSe/ZnS
luminescence band and the absorption spectra of free-base porphyrin H2TMPyrP4+ and its
metal complex ZnTMPyrP4+. It has been found that upon decrease of QDs ↔ Zn-porphyrin
intercenter distance from 39.1 (mercaptoundecanoic acid) to 30.1, a considerable QD PL
quenching is observed. However, FRET efficiency substantially decreases, from 55% in the
former case to 23% in the latter one. Based on quantum-chemical calculations (density
function theory and polarisable continuum model) it has been concluded that in polar
solvents the PL low quantum yield for CdSe/ZnS QDs passivated by residues of
mercaptocarboxylic acids S−(CH2) n COO− and its dependence on the number of CH2 groups
are related to the possibility of photoinduced electron transfer from the HOMO of
passivating molecules to QDs (QD* ⇐ S−(CH2)nCOO− hole transfer). It has been shown that
QD PL quenching in nanoassemblies CdSe/ZnS(thioglycolic acid) - ZnTMPyrP4+, which is
complementary to the energy transfer, may be caused also by the photoinduced electron
transfer that involves the participation of the LUMO of the ZnTMPyrP4+ molecule (QD* ⇒
ZnTMPyrP4+). So, for QD-porphyrin nanoassemblies in non-polar solvents, the realization of
effective photoinduced charge transfer processes with participation of excited states of
porphyrin ligand seems to be low probable.
References
[1] E. Zenkevich, F. Cichos, A. Shulga, E. Petrov, T. Blaudeck, C. von Borczyskowski. Nanoassemblies designed from semiconductor quantum dots and molecular arrays. J. Phys. Chem. B (2005) 109 8679-8692.
[2] E. Zenkevich, C. von Borczyskowski. Structural and Energetic Dynamics in Quantum Dot- Dye Nanoassemblies, in: Self-Assembled Organic-Inorganic Nanostructures: Optics and Dynamics, p. 1-147. E. Zenkevich, C. von Borczyskowski (Eds.), Pan Stanford Publishers (2016) Singapore.
[3] T. Blaudeck. Self-Assembly of Functionalized Porphyrin Molecules on Semiconductor Nanocrystal Surfaces. PhD Thesis (2007) TU Chemnitz.
[4] D. S. Kilin, K. Tsemekhman, O. V. Prezhdo, E. I. Zenkevich, C. von Borczyskowski. Ab Initio Study of Transfer Dynamics from a Core-Shell Semiconductor Quantum Dot to a Porphyrin Sensitizer. J. Photochem. Photobiol. A (2007) 190 342-351.
[5] D. Kowerko, J. Schuster, N. Amecke, M. Abdel-Mottaleb, R. Dobrawa, F. Würthner, C. von Borczyskowski. FRET and ligand related NON-FRET processes in single quantum dot-perylene bisimide assemblies. PhysChemChemPhys (2010) 12 4112-4123.
[6] Foerster, T. Modern Quantum Chemistry. O. Sinanoglu (Ed.) Academic Press (1965) New York)[7] V. M. Agranovich, M. D. Galanin. Electronic Excitation Energy Transfer in Condensed Matter.
North-Holland Pub. Co. (1982) Amsterdam, New York.[8] A. Clapp, I. Medintz, J. Mauro, B. Fisher, M. Bawendi, H. Mattoussi. Fluorescence resonance
energy transfer between quantum dot donors and dye-labeled protein acceptors. J. Am. Chem. Soc. (2004) 126 301-310.
[9] C. von Borczyskowski, E. Zenkevich. Formation Principles and Exciton Relaxation in Semiconductor Quantum Dot-Dye Nanoassemblies, in: Quantum Dot Molecules, Lecture Notes in Nanoscale Science and Technology, p. 77-148. J. Wu, Z. M. Wang (Eds.) Springer (2014) New
19
York, Heidelberg, Dordrecht, London.[10] U. Rempel, S. Meyer, B. von Maltzan, C. von Borczyskowski. Energy transfer and distance
independent charge separation in self-organised porphyrin-quinone aggregates. J. Luminesc. (1989) 78 97-110.
[11] N.V. Ivashin, E.E. Shchupak, E.I. Sagun. Photoinduced energy and electron transfer processes in self-assembling complexes of CdSe/ZnS water-soluble nanocrystals and cationic porphyrins. In Proceedings of the International Conference “Nanomeeting-2013”. Physics, Chemistry and Applications of Nanostructures. Reviews and Short Notes (May 28-31, 2013; V.E. Borisenko, S. V. Gaponenko, V. S. Gurin, C.H. Kam, Eds.), World Scientific Publishing Co., New Jersey, London, Singapore, Bejing, Shanghai, Hong-Kong, Taipei, Chennai. (2013) p. 573-576.
[12] E.I. Sagun, V.N. Knyukshto, N.V. Ivashin, E.E. Shchupak, G.K. Zhavnerko, N.V. Karatai, V.E. Agabekov. Photoinduced relaxation processes in self-assembling complexes based on water-soluble CdSe/ZnS nanocrystals and cationic porphyrins. Optics and Spectroscopy (2012) 113, 165-178.
S8 Nanoassembly Formation
It is known [1-3] than in liquid non-polar solutions only about 30% of the dangling (Zn)
bonds of the investigated CdSe/ZnS QDs (with dCdSe=2.53.0 nm and 2 ZnS monolayers of
l=1 nm) are “saturated” by TOPO ligands due to ligand-related steric constraints. This
conclusion is confirmed also by X-ray data [4]. Porphyrin-type ligands [5,6] as well other
organic molecules with appropriate functionalized side anchoring groups [7-11] are expected
to bind to QD surface sites by substitution of the surfactant ligands (TOPO or long-chain
amines or thiols) present from the synthesis stage. As we have shown earlier [5] the formation
of nanoassemblies based on TOPO-capped CdSe/ZnS QDs and (5, 10, 15, 20)-meta-pyridyl-
porphyrin molecules is realized via two-point interaction of two meta-nitrogens of two meso-
phenyl rings with two Zn atoms of QD surface (see Scheme 1 in the manuscript text).
Based on titration experiments and using pyridyl-substituted porphyrins with various
number of pyridyls and different positions of nitrogens (ortho-, meta- and para-) we have
argued [5] that because of steric reasons, relatively large volume of porphyrin molecule and
small anchoring meso-pyridyl substituents as well as ligand exchange competition
(TOPOporphyrin) on the QD surface, H2P(m-Pyr)4 and H2P(p-Pyr)4 molecules are
displaced almost perpendicular on QD surface, while H2P(o-Pyr)4 or H2P(o-Pyr)4 do not
practically interact with QD surface. This conclusion has been proven also [12] using
molecular mechanics calculations within the HyperChem software package for the geometry
optimization (with VASP) for CdSe/ZnS QD-H2P(m-Pyr)4 nanoassembly.
It should be mentioned that the arrangement of porphyrin molecules on QD surface in
nanoassemblies may be dependent on few reasons: (i) the nature (and size) of passivating
surfactant ligands; (ii) number of functionalized side anchoring groups (tether chains); (iii)
length and flexibility of these tether chains. For instance, recently it was shown (based on a
combination of 1H NMR, absorption, and fluorescence spectroscopies) [11] that porphyrin
20
molecules carrying one carboxylate function can interact with monodisperse CdSe QDs with
dCdSe=2.2-2,3 nm (coated exclusively with relatively small oleate ligands) to form “porphyrin
- CdSe QD” nanoassemblies with porphyrins stacked upright on the CdSe QD surface. On the
other hand, it was found in this study [11] that porphyrins having few (3 and 4) long
anchoring alkyl-type tether chains (the so-called polydentate porphyrin ligands) are able to
bind to QD surface more strongly than monodentate porphyrin. Such polydentate porphyrin
ligands attach themselves to QD flat-on, i.e., parallel to the crystal surface. In addition, it was
observed that the formation of QD-porphyrin-QD structures (containing one porphyrin ligand
being attached to 2 QDs) as well as a larger polymeric nanoassemblies [QD-porphyrin-QD]n
is followed by precipitation process and loss of colloidal stability.
Precipitation effects were not observed in our experiments. The low probability for the
formation QD-porphyrin-QD or polymeric [QD-porphyrin-QD]n nanoassemblies in our case
seems to be due to few reasons: (i) because of a large hydrodynamic volume of QDs the
diffusion of QDs is restricted essentially, and at low concentration (C10-5 M) the near
displacement of two QDs may not be efficiently realized; (ii) steric hindrances between to one
QD attached tetra-pyridyl porphyrin molecule and TOPO molecules belonging to the other
QD should prevent and effective ligand exchange leading to the attachments of the second
QD to QD-H2P nanoassembly. Additionally, one has to consider the following: (i) at molar
ratio x = 1 not all constituents might form assemblies, even less than expected according to a
Poisson distribution; (ii) As has been discussed [13], there might be an upper limit of dye
molecules per QD which might be taken into account according to recent publications [13-
15].
Finally, it should be mentioned that according to our earlier results [5] the normalization
of CdSe/ZnS QD PL quenching to the number of meso-pyridyl substituents for various
porphyrins showed still more quenching (by roughly a factor of 2 above molar ratio x =
CPorphyrin/CQD =2) for 4-pyridyl as compared to 2-pyridyl. It follows from the above discussion
that this difference in QD PL quenching might not be considered as indication for binding of
2 QDs to one porphyrin molecule. According to [7, 11], for a given QD concentration and
molar ratio x, due to the chelate effect polydentate ligands should bind to the QD surface
significantly more strongly than monodentate ligands. Correspondingly, from thermodynamic
point of view, the attachment of tetra-pyridyl substituted porphyrin with QD surface is more
effective with respect to that for di-pyridyl substituted porphyrin molecule. Namely this
difference may be considered as the main reason of the different quenching effect observed
21
for QD PL upon self-assembly at the same conditions with porphyrin ligands having 2 and 4
meso-pyridyl anchoring substituents.
As has been shown in Section S2 FRET efficiencies depend in principle on Poisson
statistics of assembly formation [5, 16-19] since a single QD might be statistically assembled
with several dye molecules. We identify assembly formation not only via QD PL quenching
and FRET enhancement dynamics but also by spectral changes observed for the H2P acceptor
dynamics. It is known that H2P fluorescence is in first order electric dipole forbidden due to
symmetry reasons which results in a relatively long fluorescence decay time (≈ 8 ns) and a
relative decrease of the intensity of the Q(0,0) electronic transition compared to that for the
vibronic Q(0,1) band [5, 20]. The fluorescence becomes partly allowed by an out-of-plane
distortion of the molecule [5].
We explain the lengthening of the H2P decay upon assembly formation as being due to
intercalation of the acceptor into the TOPO ligand shell of the QD which forces H2P to a more
strictly planar conformation. Additional confirmation of our conjecture is provided by recent
observations that the assembly formation is accompanied by spectral shifts and changes in the
Franck-Condon overlap [5]. We found that H2P fluorescence in QD-dye nanoassemblies is up
to x ≈ 2 slightly blue-shifted while the intensity of the vibrational band is relatively increased
[5]. This indicates that the fluorescence becomes even more forbidden which goes in line with
an increase of the decay time. From this we tentatively conclude that the planarity of H2P is
enforced by the TOPO ligands upon assembly formation and the binding of 2 pyridyl groups
to the QD surface. Similar effects have been reported for nanoassemblies formed from QDs
and diimide dye molecules [21].
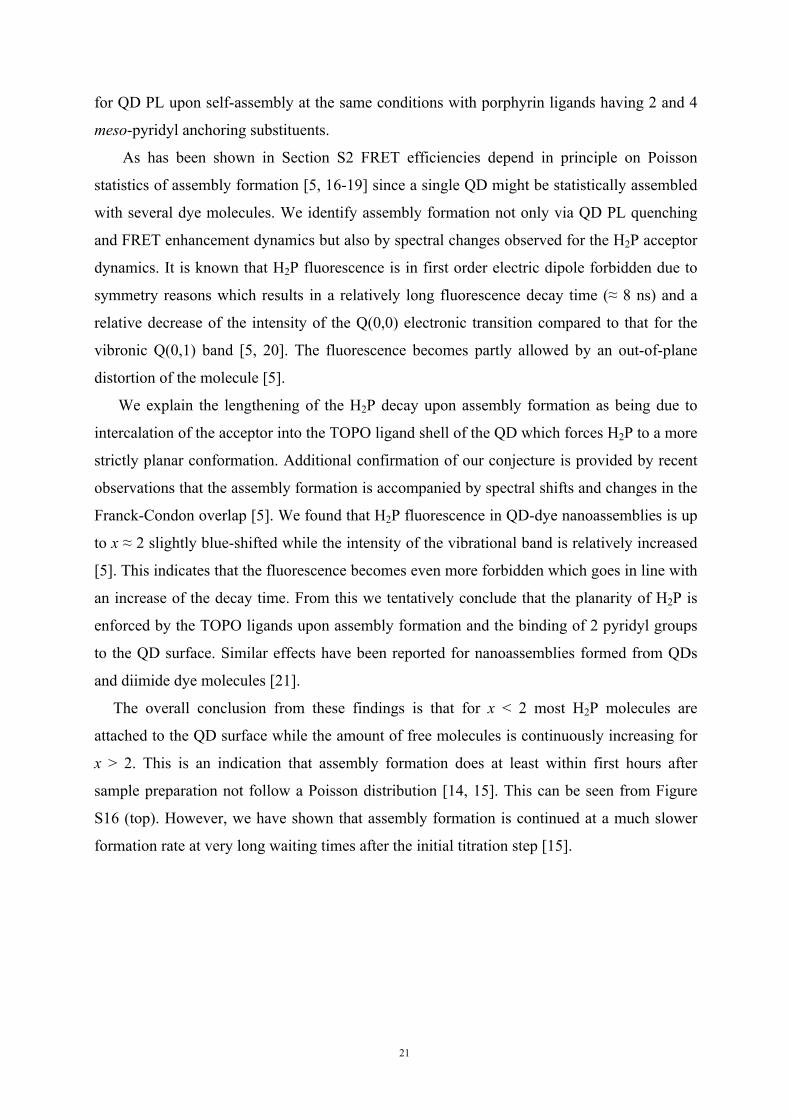
The overall conclusion from these findings is that for x < 2 most H2P molecules are
attached to the QD surface while the amount of free molecules is continuously increasing for
x > 2. This is an indication that assembly formation does at least within first hours after
sample preparation not follow a Poisson distribution [14, 15]. This can be seen from Figure
S16 (top). However, we have shown that assembly formation is continued at a much slower
formation rate at very long waiting times after the initial titration step [15].
22
0 2 4 6 8 10 120,0
0,2
0,4
0,6
0,8
1,0
B C
B
F
Norm
alize
d In
tens
ity
Molar Ratio
1 – TPP2 - propylamine 3 – BDMT4 - pyridine
4
3
2
1
Figure S16 Top: Titration of TOPO capped CdSe(SO) by (m-Pyr)4H2P in toluene at RT. The black
line corresponds to the increase of H2P fluorescence intensity in the absence of QDs. At the highest
concentration (which corresponds to x ≈ 4) fluorescence of H2P is increasing with a similar slope as
in the absence of QDs. This indicates that H2P is no longer assembled with QDs or FRET has
reached its maximal efficiency. Bottom: PL quenching upon titration of CdSe(SO) with various
functionalized molecules in toluene at RT: (2) propylamine, (3) benzenedimethanethiol (BDMT)
and (4) pyridine which all cause considerable PL quenching. For comparison, under the same
experimental conditions and molar ratios non-functionalized porphyrin molecule (TPP) quenches
QD PL only very weakly (1). In the latter case, neither the donor quenching (QD) nor the acceptor
enhancement (TPP) is existent. For comparison, PL quenching by (m-pyr)4H2P becomes ≈ 0.5 at x
= 2 and behaves very similar to BDMT up to x ≈ 4 and levels off for x > 4.
References
[1 ] C. Bullen, Mulvaney, P. The Effects of Chemisorption on the Luminescence of CdSe Quantum Dots. Langmuir (2006) 22, 3007–3013.
[2] Ji, X.; Copenhaver, D.; Sichmeller, C.; Peng, X. Ligand Bonding and Dynamics on Colloidal Nanocrystals at Room Temperature: The Case of Alkylamines on CdSe Nanocrystals. J. Am.
23
Chem. Soc. (2008) 130, 5726–5735.[3] Kowerko, D.; Schuster, J.; Amecke, N.; Abdel-Mottaleb, M.; Dobrawa, R.; Würthner, F.; von
Borczyskowski, C. FRET and ligand related NON-FRET processes in single quantum dot-perylene bisimide assemblies. PhysChemChemPhys. (2010) 12, 4112-4123.
[4] Bowen-Katari, J. E.; Colvin, V. L.; Alivisatos A. P. X-ray Photoelectron Spectroscopy of CdSe Nanocrystals with Application to Studies of the Nanocrystal Surface. J. Phys. Chem. (1994) 98, 4109-4117.
[5] E. Zenkevich, F. Cichos, A. Shulga, E. Petrov, T. Blaudeck, C. von Borczyskowski. Nanoassemblies designed from semiconductor quantum dots and molecular arrays. J. Phys. Chem. B (2005) 109 8679-8692.
[6] Blaudeck, T.; Zenkevich, E. I.; Cichos, F.; von Borczyskowski, C. Probing Wave Functions at Semiconductor Quantum-Dot Surfaces by NON-FRET Photoluminescence Quenching. J. Phys. Chem. C (2008) 112, 20251-20257.
[7] Knowles, K. E.; Tice, D. B.; McArthur, E. A.; Solomon, G. C.; Weiss, E. A. Chemical Control of the Photoluminescence of CdSe Quantum Dot-Organic Complexes with a Series of Para-Substituted Aniline Ligands. J. Am. Chem. Soc. (2010) 132, 1041–1050.
[8] Munro, A. M.; Ginger, D. S. Photoluminescence Quenching of Single Nanocrystals by Ligand Adsorption. Nano Lett. (2008) 8, 2585–2590.
[9] Moreels, I.; Martins, J. C.; Hens, Z. Ligand Adsorption/Desorption on Sterically Stabilized InP Colloidal Nanocrystals: Observation and Thermodynamic Analysis. ChemPhysChem. (2006) 7, 1028–1031.
[10] Moreels, I.; Martins, J. C.; Hens, Z. Solution NMR Techniques for Investigating Colloidal Nanocrystal Ligands: A Case Study on Trioctylphosphine Oxide at InP Quantum Dots. Sens. Actuators B. (2007) 126, 283–288.
[11] Chambrier I., Banerjee C., Remiro-Buenamanana S., Chao Y., Cammidge A. N., Bochmann M. Synthesis of Porphyrin−CdSe Quantum Dot Assemblies: Controlling Ligand Binding by Substituent Effects. Inorg. Chem. (2015) 54, 7368−7380.
[12] Kilin, D. S.; Tsemekham, K.; Zenkevich, E. I.; Prezhdo, O. V.; von Borczyskowski, C., Ab Initio Study of Transfer Dynamics from a Core-Shell Semiconductor Quantum Dot to a Porphyrin Sensitizer. J. Photochem. Photobiol. A (2007) 190, 342-351.
[13] G. Beane, K. Boldt, N. Kirkwood, P. Mulvaney. Energy Transfer between Quantum Dots and Conjugated Dye Molecule. J. Phys. Chem. C (2014) 118 18079-18066.
[14] T. Blaudeck. Fluorescence Quenching of Semiconductor Quantum Dots by Multiple Dye Molecules, in: Self-Assembled Organic-Inorganic Nanostructures: Optics and Dynamics, 201-213 (E. Zenkevich, C. von Borczyskowski, Eds.) Pan Stanford Publishers (2016) Singapore.
[15] T. Blaudeck, E. I. Zenkevich, M. Abdel-Mottaleb, K. Szwaykowska, D. Kowerko, F. Cichos, C. von Borczyskowski. Formation Principles and Ligand Dynamics of Nanoassemblies of CdSe Quantum Dots and Functionalised Dye Molecules. ChemPhysChem (2012) 13 959–972
[16] A. R. Clapp, I. L. Medintz, M. Mauro, M. B. R. Fisher, M. G. Bawendi M. G., H. Mattoussi. Fluorescence Resonance Energy Transfer Between Quantum Dot Donors and Dye-Labeled
Protein Acceptors. J. Am. Chem. Soc. (2004) 126 301–310.[17] T. Ren, P. K. Mandal, W. Erker, Z. Liu, Y. Avlasevich, L. Puhl, K. Muellen, T. Basché. A simple
and versatile route to stable quantum dot-dye hybrids in nonaqueous and aqueous solutions. J. Am. Chem. Soc. (2008) 130 17242-17243
[18] G. Beane, K. Boldt, N. Kirkwood, P. Mulvaney. Energy Transfer between Quantum Dots and Conjugated Dye Molecule. J. Phys. Chem. C (2014) 118 18079-18066.
[19] T. Blaudeck. Self-Assembly of Functionalized Porphyrin Molecules on Semiconductor Nanocrystal Surfaces. PhD Thesis (2007) TU Chemnitz.
[20] A. Ghosh. Quantum Chemical Studies of Molecular Structures and Potential Energy Surfaces of Porphyrins and Hemes, in: The Porphyrin Handbook, Vol. 7 - Theoretical and Physical Characterization, Chapter 47, p. 1-38 (K.M. Kadish, K.M. Smith, R. Guilard, Eds.) Academic Press (2000-2003) San Diego.
[21] D. Kowerko, S. Krause, N. Amecke, M. Abdel-Mottaleb, J. Schuster, C. von Borczyskowski.Identification of Different Donor-Acceptor Structures via FRET in Quantum-Dot-Perylene Bisimide Assemblies. Int. J. Mol. Science (2009) 10 5239-5256
24
S9 Short Summary of PL Properties of CdSe Quantum Dots
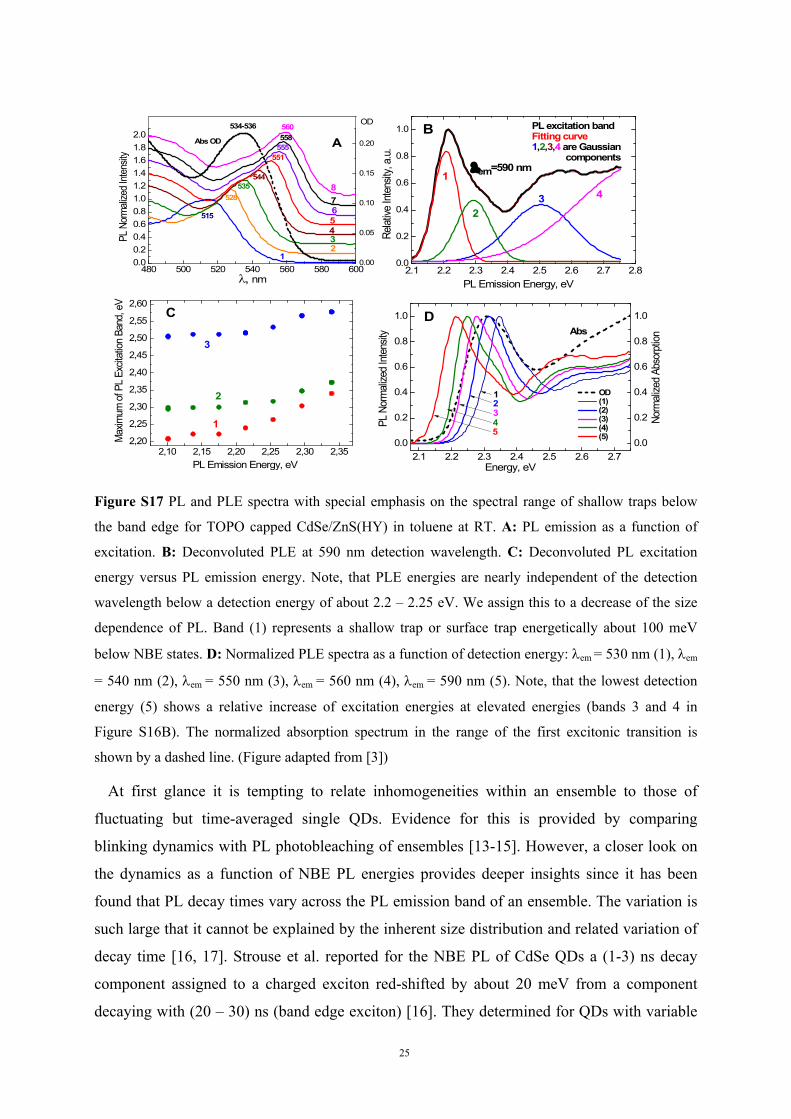
Recently a detailed analysis of the PL emission spectra of CdSe/ZnS QDs (HY) revealed
more details of the NBE PL [1-3]. Additional to the Gaussian size distribution at least 2
(Gaussian) PL bands are needed to describe the NBE PL linewidth across a temperature range
from 90 to 300K. They have been tentatively assigned to PL from core and surface trap
related states [2, 3]. Moreover, PL emission of shallow traps (ST) shows up energetically
close to the band edge [3]. PLE spectra indicate that the PL emission of ST shows only weak
size selection and is most effectively excited via elevated excitonic states (Figure S17) [3].
The distribution of energies near the band edge depends critically on the kind of ligands and
attached dyes showing a strong temperature dependence of these effects [1, 3].
It is commonly reported that the PL decay of colloidal QDs is in almost all cases even
under low excitation power conditions multi-exponential (see also Section S6). Analysis of
the decay dynamics of NBE PL needs at RT at least 2 or 3 decay times in the range from
about 1 ns to 30 ns [1-3]. (Much faster relaxation processes are observed via non-linear
optical experiments and have been attributed to intra-gap relaxation and cooling of hot
electrons or holes [4, 5]). IGE decays at RT within 50 ns to several μs [6]. While a
distribution of PL parameters might be easily explained by inhomogeneities among QDs
within an ensemble it was surprising to find that the PL of single QDs decays also multi-
exponentially (besides at the highest PL intensity during a blinking time trace) in close
relation with PL intensity blinking and spectral diffusion [7-9]. However, at sufficiently short
observation time intervals PL of single QDs becomes mono-exponential at any PL intensity
[10]. Fluctuations (blinking) in PL intensities and decay times have been assigned to charging
processes [11] or interactions with multiple reaction centers [12].
25
480 500 520 540 560 580 6000.00.20.40.60.81.01.21.41.61.82.0
0.00
0.05
0.10
0.15
0.20555558
551
560
544535
528
OD
76
2
4
8
5
3
1
PL N
orma
lized
Inten
sity
, nm
515
AAbs OD
534-536
2,10 2,15 2,20 2,25 2,30 2,352,20
2,25
2,30
2,35
2,40
2,45
2,50
2,55
2,60
3
2
Max
imum
of P
L Ex
citat
ion B
and,
eV
PL Emission Energy, eV
1
C
2.1 2.2 2.3 2.4 2.5 2.6 2.7 2.80.0
0.2
0.4
0.6
0.8
1.0
432
B
PL excitation bandFitting curve1,2,3,4 are Gaussian components
Relat
ive In
tens
ity, a
.u.
PL Emission Energy, eV
em=590 nm1
2.1 2.2 2.3 2.4 2.5 2.6 2.70.0
0.2
0.4
0.6
0.8
1.0
0.0
0.2
0.4
0.6
0.8
1.0
5432
Norm
alize
d Ab
sorp
tion
D
PL N
orm
alize
d In
tens
ity
Energy, eV
OD (1) (2) (3) (4) (5)
Abs
1
Figure S17 PL and PLE spectra with special emphasis on the spectral range of shallow traps below
the band edge for TOPO capped CdSe/ZnS(HY) in toluene at RT. A: PL emission as a function of
excitation. B: Deconvoluted PLE at 590 nm detection wavelength. C: Deconvoluted PL excitation
energy versus PL emission energy. Note, that PLE energies are nearly independent of the detection
wavelength below a detection energy of about 2.2 – 2.25 eV. We assign this to a decrease of the size
dependence of PL. Band (1) represents a shallow trap or surface trap energetically about 100 meV
below NBE states. D: Normalized PLE spectra as a function of detection energy: em = 530 nm (1), em
= 540 nm (2), em = 550 nm (3), em = 560 nm (4), em = 590 nm (5). Note, that the lowest detection
energy (5) shows a relative increase of excitation energies at elevated energies (bands 3 and 4 in
Figure S16B). The normalized absorption spectrum in the range of the first excitonic transition is
shown by a dashed line. (Figure adapted from [3])
At first glance it is tempting to relate inhomogeneities within an ensemble to those of
fluctuating but time-averaged single QDs. Evidence for this is provided by comparing
blinking dynamics with PL photobleaching of ensembles [13-15]. However, a closer look on
the dynamics as a function of NBE PL energies provides deeper insights since it has been
found that PL decay times vary across the PL emission band of an ensemble. The variation is
such large that it cannot be explained by the inherent size distribution and related variation of
decay time [16, 17]. Strouse et al. reported for the NBE PL of CdSe QDs a (1-3) ns decay
component assigned to a charged exciton red-shifted by about 20 meV from a component
decaying with (20 – 30) ns (band edge exciton) [16]. They determined for QDs with variable
26
sizes differing radiative and non-radiative rates for the 2 identified decay components. Xiao et
al. also found 2 decay components (2-5 and 15- 20 ns, respectively) [17]. The short
component increases strongly across the NBE PL band with increasing PL energy. They
tentatively assigned the long-lived component (contributing predominantly to the QY) to
surface related PL. Petrov et al. identified for CdSe/ZnS(RQD) QDs excited resonantly into
the lowest absorption band a 3-exponential decay (1ns, 10 ns and (20 – 22) ns) [18]. The fast
decay contributes predominantly at high energies of the PL band but also to a much lesser
content at the low energy edge of the PL band which can be seen via initial time dependent
spectral red shifts (at high PL energies) and blue shifts (at low PL energies) (Fig. 6 of the
respective reference [18]). In that sense their results combine the observations of Strouse et al.
[16] and Xiao et al. [17].
It should be mentioned that Petrov et al. found also a very weak ≈ (50 – 100) ns decay at
the very red edge of the NBE PL [18, 20]. Similar results have been reported previously for
CdSe/ZnS(HY) [1, 11] and are shown also for CdSe(SO) in Figure S14.
How do these results - which are qualitatively in accordance with each other though
obtained for different kinds of CdSe QD ensembles - compare with single QD data? Recently
we have shown that intermittent PL intensities of a single QD are uniquely related with
fluctuations in PL decay times and PL energies: short decay times (that is low PL intensities)
correspond with low PL energies [1, 9, 11]. At first glance the finding of short decay times
predominantly at low PL energies seems to be in contradiction to what has been observed in
the majority of ensemble experiments, namely short decay times both at high and to a less
extent at low energies. In principle, the apparent contradiction between ensemble and single
QD experiments can be solved remembering that ensemble experiments cover
inhomogeneities of QD properties. We assume that a certain fraction of QDs, namely those,
which are during most of the observation time characterized all the time by a very short and
thus basically non-radiative decay, is mostly missed in single QD experiments since such
single QDs will be not identified according to their low QY.
But why should such heavily quenched QDs be observed systematically more often in the
high energy range of the NBE PL? Such a systematic dependence has been explained
previously by Rogach et al. as being due to the consequences of Oswald ripening [20]. To
understand their findings, we have to remember that the width of a PL band is governed by
the size distribution remaining in an ensemble after chemical synthesis. During this synthesis
the QDs finally found in the centre of the PL band are those which grew in a dynamic
equilibrium during the ripening process while the growing dynamics heavily deviate from
27
equilibrium for smaller sized QDs (typically observed at high PL energies). Deviation from a
growing process in dynamic equilibrium results in an increase of surface defects and is
responsible for fast non-radiative trapping of excitons [20]. Inhomogeneous distributions of
surface trapping of excitons have already been identified earlier [21] for ensembles of CdSe
QDs. Obviously, single QD detection misses fast decaying QDs in the high NBE energy
range due to their extremely low QY but can identify those QDs intermittent between high
and low QYs. The latter are due to the quantized Stark effect red-shifted to low PL energies
by (20 – 50) meV [9, 11]. The essential conclusion is (see Scheme in Figure S15) that an
ensemble of QDs is subject to both a (static) distribution of QDs with a systematically
distributed large range of PL QYs and to intermittency of (probably) all QDs. On the other
hand, single QD detection misses in most cases those QDs (in this case at the high energy
range of the PL band) with extremely low QYs [22].
How do these findings correspond with the PL quenching upon assembly formation with
H2P-type molecules? We found that the ratio between slow and fast decaying components is
at 290 K without any significant PL energy related dependence increased considerably in
favor of the shortest one [1, 2]. From this we conclude that PL quenching is related to both
increase of the (i) concentration of quenching surface traps in the high energy range (also
detected by ensemble experiments on QDs without attached dyes) and (ii) intermittent
“charged” states detected by ensemble and single QD experiments in the low energy range of
PL.
The situation is somewhat different at 77 K at which we did not find a 1 ns component at
the low energy side of the PL band of CdSe/ZnS which implies that surface related defects are
only present in the high energy range [3]. (The difference between low and high temperature
results has been explained by an intermediate phase transition of ligands [1, 2, 23].) We
observed a kind of phase transition of ligands at about 230 K which results at 77 K in the
formation of a series of trap states shifted below the NBE PL. We found that all PL decay
times are noticeably shortened below the phase transition temperature [1, 2]. Again, we
observe an overall in-growth of the fast decay component upon assembly formation which is
now distributed like at RT across the total PL band [1, 2]. The ratio of the fast to slow
components at high or respectively low PL energy is increased most significantly for
CdSe/ZnS-CuP nanoassemblies (containing tetrapyridyl substituted Cu-porphyrin) which we
ascribed to the in comparison to CdSe/ZnS-H2P nanoassemblies more strongly induced
depletion of TOPO ligands by TOPO-complexing CuP [2, 23].
The blue-shifted and short decay NBE component is (at 77 K) enhanced with increasing
28
polarity of the solvent which we take as an indication that charging is involved with this
component similar to findings obtained for blinking processes [11, 15, 24-26]. However, long
lived PL exciton decay times do not depend substantially on solvent polarity at a given
temperature but the switching time among different PL intensities with inherently related
shortened decay times is further considerably shortened with increasing ε [9]. Qualitatively
similar results with respect to the relation of PL energy and QY have been reported by
Kowerko et al. also showing that attachment of perylene diimide molecules enhances
considerably the bluing of CdSe/ZnS QDs with amine ligands [27]. Polarity effects on PL of
single QDs have also been reported elsewhere [28, 29]
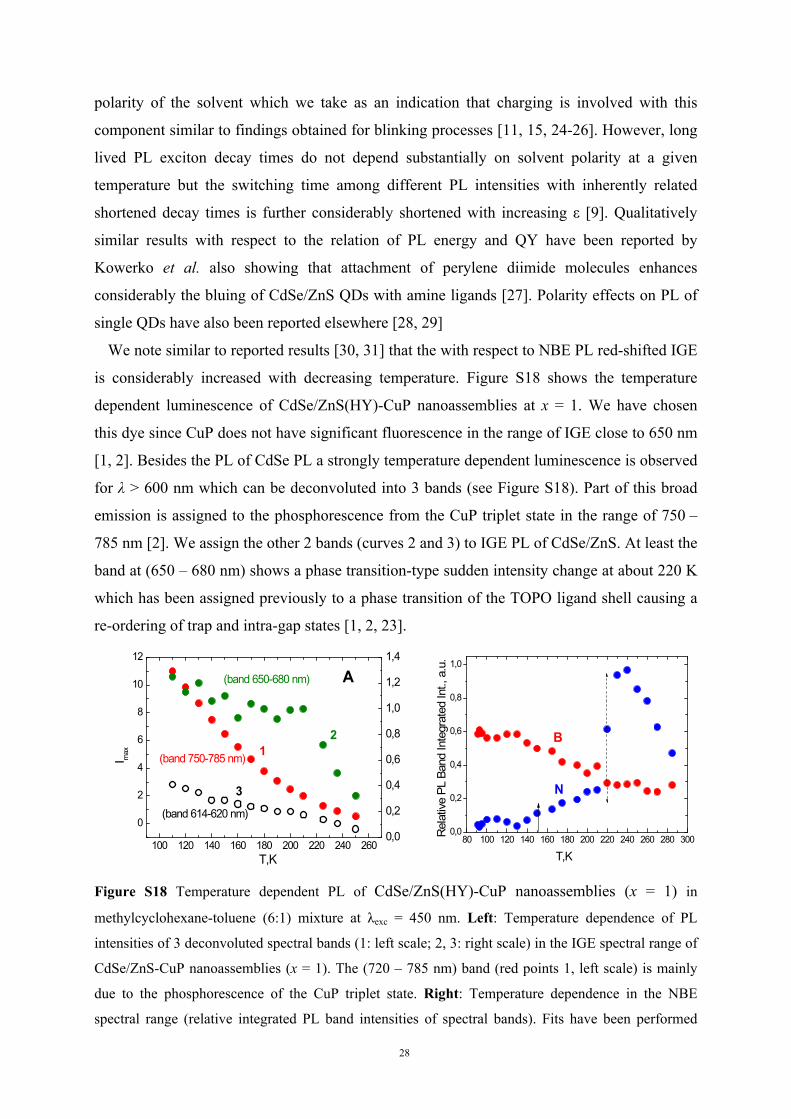
We note similar to reported results [30, 31] that the with respect to NBE PL red-shifted IGE
is considerably increased with decreasing temperature. Figure S18 shows the temperature
dependent luminescence of CdSe/ZnS(HY)-CuP nanoassemblies at x = 1. We have chosen
this dye since CuP does not have significant fluorescence in the range of IGE close to 650 nm
[1, 2]. Besides the PL of CdSe PL a strongly temperature dependent luminescence is observed
for λ > 600 nm which can be deconvoluted into 3 bands (see Figure S18). Part of this broad
emission is assigned to the phosphorescence from the CuP triplet state in the range of 750 –
785 nm [2]. We assign the other 2 bands (curves 2 and 3) to IGE PL of CdSe/ZnS. At least the
band at (650 – 680 nm) shows a phase transition-type sudden intensity change at about 220 K
which has been assigned previously to a phase transition of the TOPO ligand shell causing a
re-ordering of trap and intra-gap states [1, 2, 23].
100 120 140 160 180 200 220 240 260
0
2
4
6
8
10
12
0,0
0,2
0,4
0,6
0,8
1,0
1,2
1,4
3
2
I max
T,K
A
1
(band 614-620 nm)
(band 650-680 nm)
(band 750-785 nm)
80 100 120 140 160 180 200 220 240 260 280 3000,0
0,2
0,4
0,6
0,8
1,0
N
B
T,K
Rel
ativ
e PL
Ban
d In
tegr
ated
Int.,
a.u
.
Figure S18 Temperature dependent PL of CdSe/ZnS(HY)-CuP nanoassemblies (x = 1) in
methylcyclohexane-toluene (6:1) mixture at λexc = 450 nm. Left: Temperature dependence of PL
intensities of 3 deconvoluted spectral bands (1: left scale; 2, 3: right scale) in the IGE spectral range of
CdSe/ZnS-CuP nanoassemblies (x = 1). The (720 – 785 nm) band (red points 1, left scale) is mainly
due to the phosphorescence of the CuP triplet state. Right: Temperature dependence in the NBE
spectral range (relative integrated PL band intensities of spectral bands). Fits have been performed
29
with two Gaussian components, termed B (broad) and N (narrow). The temperature Tcrit (≈ 220 K) of a
phase transition of the capping TOPO layer is indicated by the dashed arrow. The glass transition
temperature is at 151.6 K for a methylcyclohexane/toluene (6:1) mixture and indicated by a solid
arrow [1].
The intensity of this band increases with decreasing temperature below the phase transition
temperature. This is opposite with to what is observed for the NBE PL of CdSe/ZnS(HY)-
CuP nanoassemblies which show a very strong decrease of PL intensity below phase
transition temperature [1, 2]. Such an observation is in agreement with the temperature
dependence reported for IGE [30, 31]. The IGE band at (614-620 nm) is in the range of
shallow trap emission and shows a similar behavior as the (650-680 nm) band which implies
that shallow traps are more effectively generated and/or populated with decreasing
temperature.
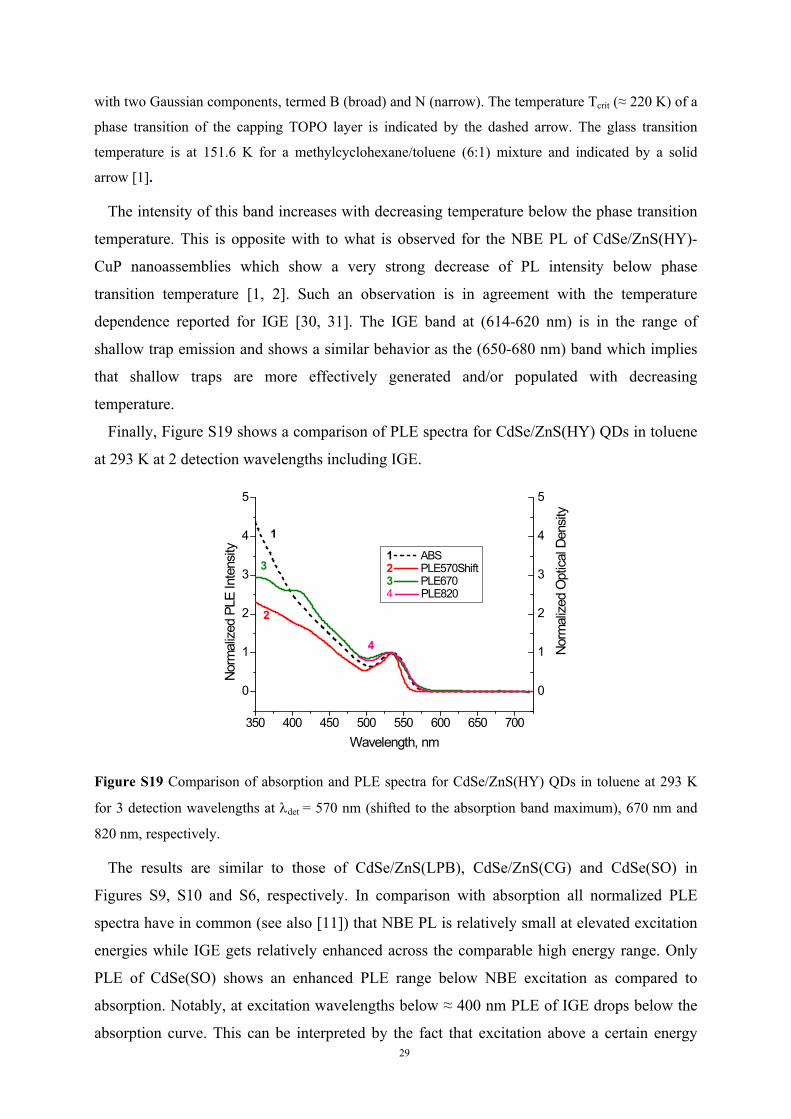
Finally, Figure S19 shows a comparison of PLE spectra for CdSe/ZnS(HY) QDs in toluene
at 293 K at 2 detection wavelengths including IGE.
350 400 450 500 550 600 650 700
0
1
2
3
4
5
0
1
2
3
4
5
4
3
2
Norm
alize
d O
ptica
l Den
sity
Norm
alize
d PL
E In
tens
ity
Wavelength, nm
1 ABS2 PLE570Shift3 PLE6704 PLE820
1
Figure S19 Comparison of absorption and PLE spectra for CdSe/ZnS(HY) QDs in toluene at 293 K
for 3 detection wavelengths at det = 570 nm (shifted to the absorption band maximum), 670 nm and
820 nm, respectively.
The results are similar to those of CdSe/ZnS(LPB), CdSe/ZnS(CG) and CdSe(SO) in
Figures S9, S10 and S6, respectively. In comparison with absorption all normalized PLE
spectra have in common (see also [11]) that NBE PL is relatively small at elevated excitation
energies while IGE gets relatively enhanced across the comparable high energy range. Only
PLE of CdSe(SO) shows an enhanced PLE range below NBE excitation as compared to
absorption. Notably, at excitation wavelengths below ≈ 400 nm PLE of IGE drops below the
absorption curve. This can be interpreted by the fact that excitation above a certain energy
30
does not result in any detectable IGE but is either followed by the formation of completely
radiationless states or a very fast deactivation to lower exciton states circumventing IG state
formation. The latter assumption is supported by the observation that PLE of NBE PL does
not show such a bending of the PLE curve above a certain energy [32].
References
[1] E. I. Zenkevich, A. Stupak, D. Kowerko, C. von Borczyskowski. Influence of single dye molecules on temperature and time dependent optical properties of CdSe/ZnS quantum dots: Ensemble and single nanoassembly detection. Chem. Phys. (2012) 406 21 – 29.
[2] E. Zenkevich, A. Stupak, C. Goehler, C. Krasselt, C. von Borczyskowski. Tuning Electronic States of a CdSe/ZnS Quantum Dot by Only One Functional Dye Molecule. ACS Nano (2015) 9 2886-2907.
[3] E. Zenkevich, A. Stupak, C. von Borczyskowski. New Insights: Photophysics of CdSe Quantum Dots - A Temperature Related Approach, in: Tuning Semiconducting and Metallic Quantum Dots: Spectroscopy and Dynamics, p. 41- 102, C. von Borczyskowski, E. Zenkevich (Eds.) Pan Stanford Publishing (2016) Singapore.
[4] V. Klimov, P. Haring Bolivar, H. Kurz. Ultrafast carrier dynamics in semiconductor quantum dots. Phys. Rev. B (1996) 53 1463.
[5] C. Burda, T. C. Green , S. Link, M. A. El-Sayed. Electron Shuttling Across the Interface of CdSe Nanoparticles Monitored by Femtosecond Laser Spectroscopy. J. Phys. Chem. B (1999) 103 1783–1788.
[6] C. Burda, S. Link, M. Mohamed, M El-Sayed. The Relaxation Pathways of CdSe Nanoparticles Monitored with Femtosecond Time-Resolution from the Visible to the IR: Assignment of the Transient Features by Carrier Quenching. J. Phys. Chem. B (2001) 105 12286–12292.
[7] G. Schlegel, J. Bohnenberger, I. Potapova, A. Mews. Fluorescence decay time of single semiconductor nanocrystals. Phys. Rev. Lett. (2002) 88 137401.
[8] B. R. Fisher, H.-J. Eisler, N. E. Stott, M. G. Bawendi. Emission Intensity Dependence and Single-Exponential Behavior in Single Colloidal Quantum Dot Fluorescence Lifetimes. J. Phys. Chem. B (2004) 108143–148.
[9] R. Schmidt, C. Krasselt, C. Göhler, C. von Borczyskowski. The Fluorescence Intermittency for Quantum Dot Is Not Power-Law Distributed: A Luminescence Intensity Resolved Approach. ACS Nano (2014) 8 3506-3521.
[10] J. Cui, A. P. Beyler, T S. Bischof, M. W. B. Wilson, M. G. Bawendi. Deconstructing the photon stream from single nanocrystals: from binning to correlation. Chem. Soc. Rev. (2014) 43 1287-1310.
[11] I. Trenkmann, C. Göhler, C. Krasselt, C. von Borczyskowski. Tuning Luminescence Intermittency, in: Tuning Semiconducting and Metallic Quantum Dots: Spectroscopy and Dynamics, p. 283-376, C. von Borczyskowski, E. Zenkevich (Eds.) Pan Stanford Publishers (2016) Singapore.
[12] P. A. Frantsuzov, S. Volkán-Kacsó, B. Jankó. Universality of the Fluorescence Intermittency in Nanoscale Systems: Experiment and Theory. Nano Lett. (2013) 13 402–408.
[13] I. Chung, M. G. Bawendi. Relationship between single quantum-dot intermittency and fluorescence intensity decays from collections of dots. Phys. Rev. B (2004) 70 165304.
[14] F. Cichos, J. Martin, C. von Borczyskowski. Emission intermittency in silicon nanocrystals. Phys. Rev. B (2004) 70 1153141.
[15] F. Cichos, C. von Borczyskowski, M. Orrit. Power-law intermittency of single emitters. Curr. Op. Coll. Interf. Science (2007) 12 272-284.
[16] A. Javier, D. Magana, T. Jennings, F. Strouse. Nanosecond exciton recombination dynamics in colloidal CdSe quantum dots under ambient condition. Appl. Phys. Lett. (2003) 8 1423-1425.
[17] X. Wang, L. Qu, J. Zhang, X. Peng, M. Xiao. Surface-Related Emission in Highly Luminescent CdSe Quantum Dots. Nano Lett (2003) 3 1103-1106.[18] E. P. Petrov, F. Cichos, C. von Borczyskowski. Intrinsic photophysics of semiconductor
nanocrystals in dielectric media: Formation of surface states. J. Luminesc. (2006) 119-120 412-
31
417.[19] E. Zenkevich, F. Cichos, A. Shulga, E. Petrov, T. Blaudeck, C. von Borczyskowski.
Nanoassemblies designed from semiconductor quantum dots and molecular arrays. J. Phys. Chem. B (2005) 109 8679-8692.
[20] A. L. Rogach, T. Franzl, T. A. Klar, J. Feldmann, N. Gaponik, V. Lesnyak, A. Shavel, A. Eychmueller, Y. P. Rakovich, J. F. Donegan. Aqueous Synthesis of Thiol-Capped CdTe Nanocrystals: State-of-the-Art. J. Phys. Chem. C (2007) 111 14628-14637.
[21] R. A. Jense, I. C. Huang, O. Chen, J. T. Choy, T. S. Bischof, M. Lonca, M. G. Bawendi. Optical Trapping and Two-Photon Excitation of Colloidal Quantum Dots Using Bowtie Apertures. ACS Photonics (2016) 3 423-427.
[22] S. F. Lee, M. A. Osborne. Photodynamics of a Single Quantum Dot: Fluorescence Activation, Enhancement, Intermittency, and Decay. J. Am. Chem. Soc. (2007) 129 8936–8937.
[23] E. Zenkevich, C. von Borczyskowski. Structural and Energetic Dynamics in Quantum Dot- Dye Nanoassemblies, in: Self-Assembled Organic-Inorganic Nanostructures: Optics and Dynamics, p. 1-147, E. Zenkevich, C. von Borczyskowski (Eds.) Pan Stanford Publishers (2016) Singapore.
[24] A. Issac, C. von Borczyskowski, F. Cichos. Correlation between photoluminescence intermittency of CdSe quantum dots and self-trapped states in dielectric media. Phys. Rev. B (2005) 71 161302.
[25] A. Issac, C. Krasselt, F. Cichos, C. von Borczyskowski. Influence of the Dielectric Environment on the Photoluminescence Intermittency of CdSe Quantum Dots. ChemPhysChem (2012) 13 3223–3230.
[26] C. von Borczyskowski, E. Zenkevich. Formation Principles and Exciton Relaxation in SemiconductorQuantum Dot-Dye Nanoassemblies, in: Quantum Dot Molecules, Lecture Notes in Nanoscale Science and Technology, p. 77-148, J. Wu, Z. M. Wang (Eds.) Springer (2014) New York, Heidelberg, Dordrecht, London.
[27] D. Kowerko. Interrelation of Assembly Formation and Ligand Depletion in Colloidal Quantum Dots, in: Self-Assembled Organic-Inorganic Nanostructures: Optics and Dynamics, 149-200, E. Zenkevich, C. von Borczyskowski (Eds.) Pan Stanford Publishers (2016) Singapore.
[28] D. E. Gomez, J. van Embden, P. Mulvaney. Spectral diffusion of single semiconductor nanocrystals: The influence of the dielectric environment. Appl. Phys. Lett. (2006) 88 154106.
[29] S. F. Lee, M. A. Osborne. Brightening, blinking, bluing and bleaching in the life of a quantum dot: friend or foe? ChemPhysChem (2009) 10 2174-2191.
[30] P. Nemec, P. Malý. Temperature Study of Trap-related Photoluminescence Decay in CdSxSe1-x nanocrystals in Glass. J. Appl. Phys. (2000) 87 3342-3348.
[31] J. Mooney, M. M. Krause, J. I. Saari, P. Kambhampati. A microscopic picture of surface charge trapping in semiconductor nanocrystals. J. Chem. Phys. (2013) 138 204705.
[32] W. Hoheisel, V. L. Colin, C. S. Johnson, A. P. Alivisatos. Threshold for quasicontinuum absorption and related luminescence efficiency in CdSe nanocrystals. J. Chem. Phys. (1994) 101 8455-8460.


![Optimizing the Cooling Air Flow of a Formula Car using CFD · PDF fileexpressed as a combination of Darcy’s law and an inertial loss term which from Fluent [7] ... In addition, it](https://img.pdfslide.us/doc/110x75/5a80029c7f8b9aee018c0dc3/optimizing-the-cooling-air-flow-of-a-formula-car-using-cfd-as-a-combination-of-darcys.jpg)
![Beta Process Joint Dictionary Learning for Coupled Feature ...openaccess.thecvf.com/content_cvpr_2013/papers/He...KSVD [1], online dictionary learning [12], efficient sparse coding](https://img.pdfslide.us/doc/110x75/60f83314d4f34228c539bc2b/beta-process-joint-dictionary-learning-for-coupled-feature-ksvd-1-online.jpg)