Embed Size (px)
Citation preview

THESE TERMS GOVERN YOUR USE OF THIS DOCUMENT
Your use of this Ontario Geological Survey document (the “Content”) is governed by the terms set out on this page (“Terms of Use”). By downloading this Content, you (the
“User”) have accepted, and have agreed to be bound by, the Terms of Use.
Content: This Content is offered by the Province of Ontario’s Ministry of Northern Development and Mines (MNDM) as a public service, on an “as-is” basis. Recommendations and statements of opinion expressed in the Content are those of the author or authors and are not to be construed as statement of government policy. You are solely responsible for your use of the Content. You should not rely on the Content for legal advice nor as authoritative in your particular circumstances. Users should verify the accuracy and applicability of any Content before acting on it. MNDM does not guarantee, or make any warranty express or implied, that the Content is current, accurate, complete or reliable. MNDM is not responsible for any damage however caused, which results, directly or indirectly, from your use of the Content. MNDM assumes no legal liability or responsibility for the Content whatsoever. Links to Other Web Sites: This Content may contain links, to Web sites that are not operated by MNDM. Linked Web sites may not be available in French. MNDM neither endorses nor assumes any responsibility for the safety, accuracy or availability of linked Web sites or the information contained on them. The linked Web sites, their operation and content are the responsibility of the person or entity for which they were created or maintained (the “Owner”). Both your use of a linked Web site, and your right to use or reproduce information or materials from a linked Web site, are subject to the terms of use governing that particular Web site. Any comments or inquiries regarding a linked Web site must be directed to its Owner. Copyright: Canadian and international intellectual property laws protect the Content. Unless otherwise indicated, copyright is held by the Queen’s Printer for Ontario. It is recommended that reference to the Content be made in the following form: <Author’s last name>, <Initials> <year of publication>. <Content title>; Ontario Geological Survey, <Content publication series and number>, <total number of pages>p. Use and Reproduction of Content: The Content may be used and reproduced only in accordance with applicable intellectual property laws. Non-commercial use of unsubstantial excerpts of the Content is permitted provided that appropriate credit is given and Crown copyright is acknowledged. Any substantial reproduction of the Content or any commercial use of all or part of the Content is prohibited without the prior written permission of MNDM. Substantial reproduction includes the reproduction of any illustration or figure, such as, but not limited to graphs, charts and maps. Commercial use includes commercial distribution of the Content, the reproduction of multiple copies of the Content for any purpose whether or not commercial, use of the Content in commercial publications, and the creation of value-added products using the Content. Contact:
FOR FURTHER INFORMATION ON PLEASE CONTACT: BY TELEPHONE: BY E-MAIL:
The Reproduction of Content
MNDM Publication Services
Local: (705) 670-5691 Toll Free: 1-888-415-9845, ext.
5691 (inside Canada, United States)
The Purchase of MNDM Publications
MNDM Publication Sales
Local: (705) 670-5691 Toll Free: 1-888-415-9845, ext.
5691 (inside Canada, United States)
Crown Copyright Queen’s Printer Local: (416) 326-2678 Toll Free: 1-800-668-9938
(inside Canada, United States)

LES CONDITIONS CI-DESSOUS RÉGISSENT L'UTILISATION DU PRÉSENT DOCUMENT.
Votre utilisation de ce document de la Commission géologique de l'Ontario (le « contenu ») est régie par les conditions décrites sur cette page (« conditions d'utilisation »). En
téléchargeant ce contenu, vous (l'« utilisateur ») signifiez que vous avez accepté d'être lié par les présentes conditions d'utilisation.
Contenu : Ce contenu est offert en l'état comme service public par le ministère du Développement du Nord et des Mines (MDNM) de la province de l'Ontario. Les recommandations et les opinions exprimées dans le contenu sont celles de l'auteur ou des auteurs et ne doivent pas être interprétées comme des énoncés officiels de politique gouvernementale. Vous êtes entièrement responsable de l'utilisation que vous en faites. Le contenu ne constitue pas une source fiable de conseils juridiques et ne peut en aucun cas faire autorité dans votre situation particulière. Les utilisateurs sont tenus de vérifier l'exactitude et l'applicabilité de tout contenu avant de l'utiliser. Le MDNM n'offre aucune garantie expresse ou implicite relativement à la mise à jour, à l'exactitude, à l'intégralité ou à la fiabilité du contenu. Le MDNM ne peut être tenu responsable de tout dommage, quelle qu'en soit la cause, résultant directement ou indirectement de l'utilisation du contenu. Le MDNM n'assume aucune responsabilité légale de quelque nature que ce soit en ce qui a trait au contenu. Liens vers d'autres sites Web : Ce contenu peut comporter des liens vers des sites Web qui ne sont pas exploités par le MDNM. Certains de ces sites pourraient ne pas être offerts en français. Le MDNM se dégage de toute responsabilité quant à la sûreté, à l'exactitude ou à la disponibilité des sites Web ainsi reliés ou à l'information qu'ils contiennent. La responsabilité des sites Web ainsi reliés, de leur exploitation et de leur contenu incombe à la personne ou à l'entité pour lesquelles ils ont été créés ou sont entretenus (le « propriétaire »). Votre utilisation de ces sites Web ainsi que votre droit d'utiliser ou de reproduire leur contenu sont assujettis aux conditions d'utilisation propres à chacun de ces sites. Tout commentaire ou toute question concernant l'un de ces sites doivent être adressés au propriétaire du site. Droits d'auteur : Le contenu est protégé par les lois canadiennes et internationales sur la propriété intellectuelle. Sauf indication contraire, les droits d'auteurs appartiennent à l'Imprimeur de la Reine pour l'Ontario. Nous recommandons de faire paraître ainsi toute référence au contenu : nom de famille de l'auteur, initiales, année de publication, titre du document, Commission géologique de l'Ontario, série et numéro de publication, nombre de pages. Utilisation et reproduction du contenu : Le contenu ne peut être utilisé et reproduit qu'en conformité avec les lois sur la propriété intellectuelle applicables. L'utilisation de courts extraits du contenu à des fins non commerciales est autorisé, à condition de faire une mention de source appropriée reconnaissant les droits d'auteurs de la Couronne. Toute reproduction importante du contenu ou toute utilisation, en tout ou en partie, du contenu à des fins commerciales est interdite sans l'autorisation écrite préalable du MDNM. Une reproduction jugée importante comprend la reproduction de toute illustration ou figure comme les graphiques, les diagrammes, les cartes, etc. L'utilisation commerciale comprend la distribution du contenu à des fins commerciales, la reproduction de copies multiples du contenu à des fins commerciales ou non, l'utilisation du contenu dans des publications commerciales et la création de produits à valeur ajoutée à l'aide du contenu. Renseignements :
POUR PLUS DE RENSEIGNEMENTS SUR VEUILLEZ VOUS
ADRESSER À : PAR TÉLÉPHONE : PAR COURRIEL :
la reproduction du contenu
Services de publication du MDNM
Local : (705) 670-5691 Numéro sans frais : 1 888 415-9845,
poste 5691 (au Canada et aux États-Unis)
l'achat des publications du MDNM
Vente de publications du MDNM
Local : (705) 670-5691 Numéro sans frais : 1 888 415-9845,
poste 5691 (au Canada et aux États-Unis)
les droits d'auteurs de la Couronne
Imprimeur de la Reine
Local : 416 326-2678 Numéro sans frais : 1 800 668-9938
(au Canada et aux États-Unis)

Ontario Geological Survey Miscellaneous Paper 99
A Guide to Prospectingby theSelf-Potential Method
byS.V. Burr
1982
Ministry of ,H,on Alan w.PopeJ Minister
Natural . AITCW.T. Foster Deputy Minister
Ontario

OMNR-OGS 1982 ISSN 0704-2752 Printed in Canada ISBN 0-7743-7531-0
Publications of the Ontario Ministry of Natural Resources and price lists are available through the
Ministry of Natural Resources, Public Service CentreRoom 1640, Whitney Block, Queen's Park, Toronto,
Ontario, M7A 1W3 (personal shopping and mail orders)
and reports only from the
Ontario Government Bookstore, Main Floor, 880 Bay St., Toronto for personalshopping.
Out-of-town customers write to Ministry of Government Services, Publications Ser vices Section, 5th Floor, 880 Bay St., Toronto, Ontario, M7A 1N8. Telephone 965- 6015. Toll-free long distance 1 -800-268-7540, in Area Code 807 dial 0-Zenith 67200.
Orders for publications should be accompanied by cheque or money order payable to the Treasurer of Ontario.
Every possible effort is made to ensure the accuracy of the information contained in this report but the Ministry of Natural Resources does not assume any liability for er rors that may occur Source references are included in the report and users may wish to verify critical information.
Parts of this publication may be quoted if credit is given. It is recommended that ref erence to this report be made in the following form:
Burr, S.V.1982: A Guide to Prospecting by the Self-Potential Method: Ontario Geological Sur
vey, Miscellaneous Paper 99, 15p
1000-100-82-Maple Leaf
ii

FOREWORD
A GUIDE TO PROSPECTING BY THE SELF-POTENTIAL METHOD
This guide to the self-potential method of geophysical prospecting represents part of continuing efforts by the Ontario Geological Survey to assist explorationists, and to support the development and implementation of sound mineral exploration technologies suited to Ontario conditions.
The self-potential method is small-scaled, versatile, and provides a simple, reliable and economical means of near-surface electrical prospecting for certain base metal sul phides and other mineral resources. In Canada, discoveries of important sulphide ore bod ies by the SP method attest to its proven exploration value. Additionally, through research and development of the method, there should be further possible refinements and applica tions for SP.
E.G. Pye Director Ontario Geological Survey
m


CONTENTSPAGE
METRIC CONVERSION TABLE ........................................................ .viINTRODUCTION ........................................................................ 1IMPORTANT FACTS .................................................................... 1BRIEF HISTORY ......................................................................... 2BRIEF THEORY ......................................................................... 2COMPARISON OF ELECTRICAL GEOPHYSICAL METHODS......................... 3LIMITATIONS OF THE SELF-POTENTIAL METHOD ................................... 4SELF-POTENTIAL EQUIPMENT ........................................................ 5INSTRUCTIONS
(1) Operation of SP Equipment...................................................... 5The Pots ...................................................................... 5Jellying the Pots.............................................................. 6Pot Difference ................................................................ 6The Millivoltmeter-Potentiometer ............................................ 6The Reel of Wire.............................................................. 6The Walkie-Talkies ........................................................... 6
(2) Conducting an SP Survey ....................................................... 7Magnetic Storms ............................................................. 9
(3) Alternative Field Methods ......................................................10Topographic Problems .....................................................10Magnetic Storm Problems ..................................................11
(4) Notes on the Interpretation of SP Survey Results .............................. 12(5) Mineral Prospecting with the SP Method .......................................12
CONCLUSIONS ........................................................................ 14REFERENCES ..........................................................................15
TABLES
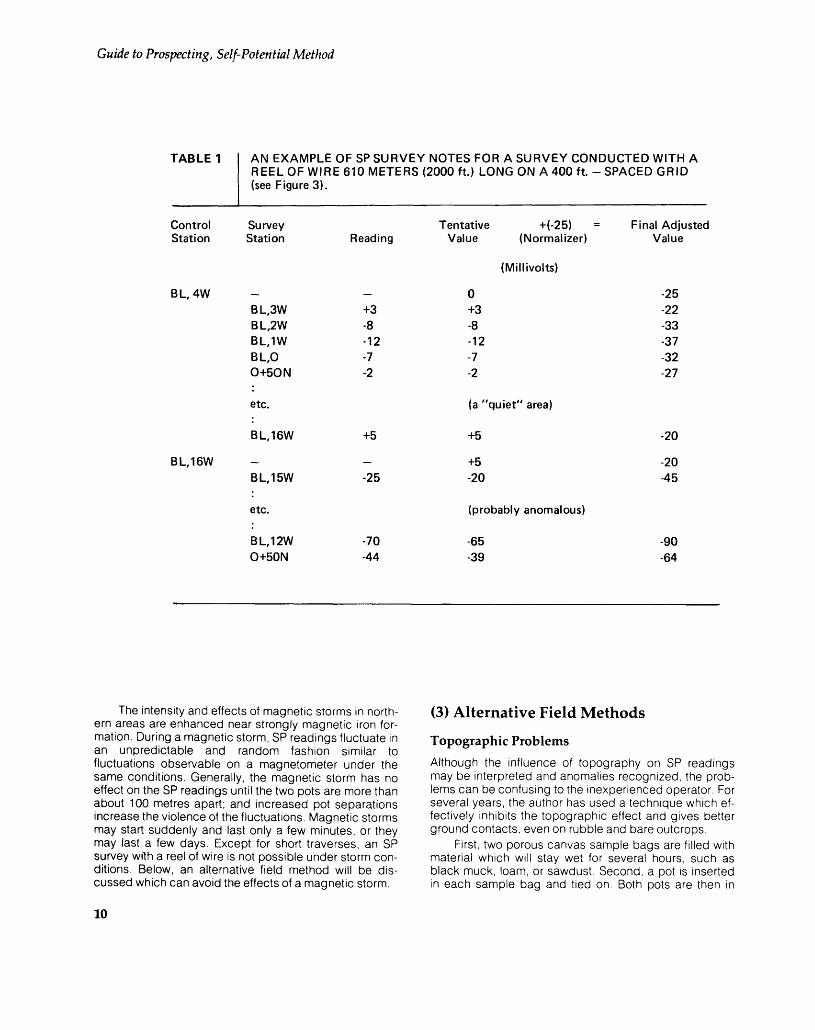
1. An example of SP survey notes for a survey conducted with a reel of wire 610 m (2000 ft) long ........................................................................10
2. An example of SP survey notes for a survey conducted using the "leapfrog" method with a fixed length of wire ...................................................12
FIGURES
1. Schematic representation of spontaneously generated electric current flow near a sulphide body ........................................................................ 2
2. Schematic representation of various naturally occurring configurations of electrical equipotential fields ................................................................... 3
3. An example of logistical details for an SP survey conducted with 610m (2000 ft) of wire ................................................................................... 7
4. An example of logistical details for an SP survey conducted with 244 m (800 ft) of wire ................................................................................... 8
5. Theoretical SP readings showing the effects of topography ........................ 96. An example of the "leapfrog" method of SP surveying .............................117. An example of an SP anomaly detailed by cross-traverse lines ................... 138 An example of dip determination using SP data ....................................139. An example of detailed follow-up surveying used to located a maximum SP
peak .................................................................................1410. The "spiderweb" method of SP surveying ........................................14

Conversion Factors forMeasurements in Ontario Geological SurveyPublicationsIf the reader wishes to convert imperial units to SI (metric) units or SI units to imperial units the following multipliers should be used:
CONVERSION FROM SI TO IMPERIAL
SI Unit Multiplied by Gives
CONVERSION FROM IMPERIAL TO SI
Multiplied byImperial Unit LENGTH
1mm 0.03937 inches 1 inch 1 cm 0.393 70 inches 1 inch 1m 3.28084 feet 1 foot 1 m 0.049 709 7 chains 1 chain 1 km 0.621 371 miles (statute) 1 mile (statute)
AREA1cm2 0.1550 square inches 1 square inch 1m2 10.7639 square feet 1 square foot 1km2 0.38610 square miles 1 square mile 1 ha 2.471054 acres 1 acre
VOLUME1 cm3 0.061 02 cubic inches 1 cubic inch 1m3 35.3147 cubic feet 1 cubic foot 1m3 1.3080 cubic yards 1 cubic yard
CAPACITY1 L 1.759755 pints 1 pint 1L 0.879877 quarts 1 quart 1L 0.219969 gallons 1 gallon
MASS1g 0.03527396 ounces (avdp) 1 ounce (avdp) 1g 0.03215075 ounces (troy) 1 ounce (troy) 1 kg 2.204 62 pounds (avdp) 1 pound (avdp) 1kg 0.0011023 tons (short) 1 ton (short) 1t 1.102311 tons (short) 1 ton (short) 1 kg 0.000 984 21 tons (long) 1 ton (long) 1 t 0.984 206 5 tons (long) 1 ton (long)
CONCENTRATION 1 g/t 0.0291666 ounce (troy)/ 1 ounce (troy)/
ton (short) ton (short)1 g/t 0.583 333 33 pennyweights/ 1 pennyweight/
ton (short) ton (short) OTHER USEFUL CONVERSION FACTORS
1 ounce (troy)Aon (short) 20.0 pennyweights/ton (short) 1 pennyweight/ton (short) 0.05 ounce (troyXton (short)
Gives
25.42.540.304 8
20.11681.609344
6.451 60.092 903 042.5899880.404 685 6
16.3870640.028316850.764 555
0.5682611.1365224.546 090
28.349 52331.1034768
0.453 592 37907.18474
0.907184741016.0469088
1.0160469088
34.2857142
1.7142857
mmcmmmkm
cm2m2km2ha
cm3m3m3
LLL
ggkgkgtkgt
g/t
g/t
NOTE Conversion factors which are in bold type are exact. The conversion factors have been taken from or have been derived from factors given in the Metric Practice Guide for the Canadian Mining and Metallurgical Industries published by The Mining Association of Canada in coop eration with the Coal Association of Canada.
vi

A Guide to Prospectingby the
Self-Potential Method
by S.V. Burr1
INTRODUCTION
The author has used the self-potential or spontaneous polarization (SP) prospecting method extensively for 35 years in surveying mining claims, and considers it the best of the electrical geophysical methods.
Recently, interest in the method has revived, proba bly due to renewed gold exploration. Most gold deposits are not good conductors, but do contain some sulphides which can be detected by the SP method.
The few available textbooks which mention the SP method are brief in their descriptions of field prospecting methods, and some prospectors, who have tried the method with insufficient understanding of the technique, have become discouraged and added to the misconcep tions about it. Good practical descriptions of the SP method are contained in "Prospecting in Canada" by Lang (1970) and in "Mining Geophysics, Second Edition" by Parasnis(1975).
This guide incorporates and updates information from a previous paper by the author (Burr 1960) and is in tended to instruct the layperson in the routine prospect ing use of the method and to encourage more geophysi cal research of the SP phenomenon. Much of the material presented is unavailable elsewhere and was derived by experience through field applications.
IMPORTANT FACTS
Although the author has endeavoured to dispell some misconceptions, and to add some new facts on the SP method in the body of this guide, some isolated facts
'Consulting geologist-geophysicist, 2111 Carlton Plaza, 140 Carlton St., Toronto, Ontario M5A 3W7,Manuscript approved for publication (March 15, 1981) and pub lished with the permission of E.G. Pye, Director, Ontario Geologi cal Survey.
could be emphasized at the beginning:1) Hydro and telephone lines, which plague some of the other electrical methods, do not affect SP2) Iron formation, which acts as a "good conductor" with some of the other electrical methods, does not af fect SP unless sulphides or graphite are associated with it. One major iron formation at the Sherman Iron Mine, Temagami, Ontario, contains graphite. The SP method begins to detect this anomaly at least two miles away. On the basis of one long north-south trav erse conducted by the author, a peak of 4000 mv (4 volts) was obtained over or near this iron formation.3) Buried or grounded metal objects can produce spurious SP "spot anomalies". A buried long metal pipe can produce a linear and sometimes genuine- looking (pseudo)anomaly. Graphite cathodes are used beside gas pipe lines to prevent corrosion and can produce an abnormally high negative SP anoma ly. Similarly, it can be demonstrated that an axe, pick or knife driven into the ground beside the forward pot (an SP ground electrode) produces a high negative reading in the instrument.4) Several years ago in Northern Quebec, the author discovered a graphite SP anomaly of 1 volt at a pot separation of 300 feet. An unsuccessful experiment was conducted to try and achieve a 6 volt potential and power a radio. An additional pot merely cut the potential to .05 volts. Apparently the current strength or "ground amperage" in a near-surface self-potential electrical field is not proportional to the number of pots used.5) Natural SP anomalies of a few hundred to over a thousand millivolts, and of negative sign by conven tion, are caused by the iron sulphides pyrite and pyr rhotite, the copper sulphide chalcopyrite, and the na tive element graphite. Graphite gives the strongest SP reaction, followed by pyrrhotite, pyrite, and chalcopy rite. Strong negative anomalies have also been re ported over chalcocite, covellite and anthracite (Sato and Mooney 1960). Because of the many other factors influencing the strength of an SP response, it is not possible to predict which type of sulphide is responsi ble for the anomaly. A magnetometer or dip needle survey may help to determine whether the magnetic

Guide to Prospecting, Self-Potential Method
iron sulphide pyrrhotite is present or not.6) Magnetic storms, dealt with in the "Instructions" section of this guide, are a natural phenomenon which can be detected by the SP instrument. It has been suggested that approaching earthquakes, or an atomic explosion anywhere in the world could be de tected by a monitoring SP instrument. In California, the method is used to locate water leaks in pipelines; in Australia, to detect salt springs; and it can also be used in geothermal exploration and in structural stud ies. Other applications are also possible but await fur ther research of the SP method.7) Manganese oxides (psilomelane and pyrolusite wads) have been observed to give positive SP ano malies. In Jamaica, the author detected high grade manganese "veins" or "dykes" which gave strong positive anomalies. The sedimentary Sibley Formation in the District of Thunder Bay, Ontario contains a man ganese oxide unit which produces alternating high positive and high negative readings which the author interprets as a possible indication of the presence of graphite.8) Finally, the peak of an SP anomaly is detected with the measuring pot positioned directly above the source. This is in contrast to other electrical methods which can be responsive to the dip of the anomalous source, and through misinterpretation have led to some drill holes that have overshot, or have been spotted too far from or too near the target.
BRIEF HISTORY
The SP method is the earliest electrical geophysical method to be discovered or invented. It was first applied in England by Robert Fox (1830) who conducted SP re search around the tin mines of Cornwall, and later by Carl Barus (1882) who applied the method at the Comestock Lode in Nevada. The first sulphide orebody discovered by an electrical method was detected by SP at Nautenen, Lapland, Sweden in 1907 (Lundberg 1948).
BRIEF THEORY
Most explanations of the SP phenomenon propose that a "wet" sulphide (or graphite) body develops negative and positive electrical potentials at its top and bottom, result ing in a both metallically and electrolytically mediated "flow" of electrochemical^ generated current around and through the body as shown in Figure 1.
It is possible that sulphide and graphite bodies in co ntact with ground water electrolytes induce a "spontane ous" DC flow of current, but local ground currents are not solely related to potential differences arising from sponta neous polarization of a conducting body. The author con siders that the natural telluric fields and currents encir cling the earth provide a natural applied electrical
Figure 1 Schematic representation of spontaneously generated electric current flow near a sulphide body, showing cur rent paths through the ground and the SP apparatus (after Lang 1970),

field which close to an electrolyte-bathed SP body can give rise to a "conductive" spontaneous polarization effect which distorts the local primary geosymmetry of natural electrical fields near the earth's surface.
For example, if these ground currents are flowing through an electrically isotropic and homogeneous rock type, they are like the parallel, equispaced strings of a harp, and a uniform potential difference field is devel oped (see A in Figure 2). If they are passing through dif ferent rock types with different conductivities, some of the nearby "harp strings" will converge slightly to take ad vantage of a better conducting rock unit, resulting in a "resistivity" map which differentiates between different conductivities of the rock types (see B in Figure 2). If the currents come upon sulphides or graphite they will be drawn towards such bodies in an attempt to flow through them, resulting in a high potential or anomaly (see C in Figure 2). Finally, in a strong magnetic storm, the harp strings will quiver as if they were being stroked (see D in Figure 2). The effect of a magnetic storm will be dis cussed at greater length in the "Instructions" section.
COMPARISON OF ELECTRICAL GEOPHYSICAL METHODS
Although the SP method was extensively and routinely used during the 1930's and 40's by many well-known pro fessional geophysicists, currently, it is generally misun derstood or overlooked as a useful and economical geo physical prospecting method.
The first orebody found in Canada by electrical methods was surveyed by Hans Lundberg (1928) at the Buchan's Mine in Newfoundland, where conductive ore was detected using the SP method. At least one orebody was found in the Noranda area and Lundberg (1948, p. 179) reports:"...a lead-zinc-copper orebody was found in the Eastern Townships of Quebec. This survey was carried out by A.R. Clark and H.G. Honeyman, and the re sults were well confirmed by subsequent drilling." He also states: "The outlining of the Flin Flon orebody in Man itoba is perhaps the best known example of his [Sherwin Kelly's] surveys."
HOMOGENEOUS ISOTROPIC ROCK
SULPHIDES/GRAPHITE
B
BETTER CONDUCTING ROCK UNIT
MAGNETIC STORM
Figure 2 Schematic representation of various naturally occurring configurations of electrical equipotential fields.

Guide to Prospecting, Self-Potential Method
The author was involved in early field surveying ex periments with the resistivity method, using formulae de veloped by Dr. Arthur Brant, University of Toronto. This method requires the "pushing" of alternating current into the ground and can provide an excellent interpretive model of the geological stratigraphy and structure. Resis tivity surveying can also detect conducting anomalies which may correlate with buried sulphides or graphite. However, the method was found to be cumbersome and slow, and soon gave way to the faster, more portable, but less informative electromagnetic (EM) methods. More re cently the induced polarization (IP) method has been de veloped and applied. It also "pushes" current [as DC pul ses which naturally decay] into the ground but is much more cumbersome than the resistivity method, and much more expensive than most of the EM methods. It is con sidered to be a composite of the resistivity and SP meth ods and is capable of detecting low resistivity "good" conductors and disseminated sulphides (including oxi dized orebodies).
Unfortunately, the interpretation procedure is compli cated and the method will equally well detect iron oxides and other semimetallic uneconomic minerals. A draw back with the resistivity, EM and IP methods is that they measure secondary electrical fields which are sometimes difficult to interpret. They also respond to unmineralized wet shears, faults, and fissure zones. Perhaps the most common cause of "false" anomalies with these methods is the variable depth of overburden over the rock surface. If there is a subsurface valley buried by overburden, all the above methods will yield a "psuedoanomaly" similar to an anomaly observable over a massive sulphide zone.
Alternatively, the SP method does not determine sec ondary fields, so survey results are much easier to inter pret. It does not respond to subsurface valleys, wet clay, shears, or faults; and, in the author's experience, the SP method does not provide results which could lead to a false anomaly. In over 500 SP anomalies which were stripped or drilled, the author always found the source of the SP anomaly to be sulphides and/or graphite in the un derlying rock.
The SP method responds to good conducting sul phides (both oxidized and unoxidized bodies), graphite, and nonconducting (disseminated) sulphides if these sul phides are oxidizing. The author has encountered only two cases where disseminated sulphides were not de tected by the SP method. In one case, an exposure of disseminated pyrite showed no oxidation "rust" (gossan) whatsoever; in another, sulphides of a pyrite-chalcopy- rite-bearing copper orebody were also fresh, and the pH of the ground water was found to be 10.0, too basic to ox idize the pyrite. According to Lundberg (1948, p. 179): "The self-potential method must be used with some cau tion....and many orebodies may not cause any anomalies at all, owing to certain ground-water or overburden condi tions." The proportion of nonoxidizing, nonconducting sulphide bodies is unknown, but the author expects that the number in Canada is probably very small. It is this small percentage of nonconducting sulphide bodies which prevents one from saying the SP is a "Yes" or "No"
method in geophysical prospecting for sulphide ores. It is a Yes or No method for the detection of good conductors only, but not necessarily for disseminated sulphides.
Another feature of the SP method is its ability to dif ferentiate between anomalies caused by sulphides and anomalies caused by graphite. Sulphides produce a range of up to 350 millivolts between the most positive and most negative SP readings, graphite has a higher range. The SP method also has the ability to "smell" an anomaly some distance away and can smell graphite at a greater distance than sulphides.
One of the popular misconceptions about the SP method is that it is limited to shallow depths as its detect ing ability is dependent on the presence of oxidizing sul phides which usually occur close to surface of the earth. Lundberg (1948, p.179) states: "The self-potential method is based on the fact that slowly proceeding weathering in the upper portion of a sulphide body is ac companied by electrical potential differences between the surficial oxidiation zone and the deeper nonoxidized portions of the orebody". Lang (1970, p.162) contends this idea by noting that graphite is not oxidizing. The au thor has located disseminated sulphides under 25 m of sand (including a quicksand layer), and a weak conduc tor under 36 m of overburden. Lang (1970, p.162) also states: "...reactions at the surface may become too weak to interpret when the overburden is more than about 300 feet [91 m] thick." The author has located "heavy" sul phides capped by 7.6 m of barren rock, with no apparent indications of oxidation.
Another misconception is that one can derive a for mula to determine the percentage of sulphides in an SP anomaly based on the strength of the readings. Lang (1970, p. 162) states: "The strength of the potential gener ated depends largely on the concentration of sulphides." One cannot, however, determine any variations in the strength of anomalies as dependent on the concentration of sulphides. For example, the strongest SP value along the strike of an anomaly does not occur where the sul phides are most highly concentrated, but where the source of the anomaly is closest to surface. With a little practice, one can determine whether the source of the anomaly is close enough to the surface to be exposed by stripping. Details are given in the section "Mineral Pro specting with the SP Method".
Although the author has stated that the SP method does not give false anomalies, certain operator errors can produce them. To help operators avoid such errors is one of the objectives of this guide.
LIMITATIONS OF THE SELF- POTENTIAL METHOD
As no one geophysical method is all-embracing, the fol lowing limitations of the SP method should be borne in mind when planning surveys:
1) The SP method cannot be used over water. How

ever, Lang (1970, p.162) states: "Where sulphide depos its lie beneath lake waters, the method is not usually ap plicable except over the ice in the winter". Further re search is needed to refine this technique.
2) Winter surveys are now possible through snow cover using high impedance voltmeters, but damp ness can short-circuit the instrument, extreme cold can weaken the batteries, and ice can encrust the pots and prevent ground contact. Preventive mea sures include addition of glycerine to the pots, and carefully planned quick checks over target areas, to maximize surveying before prolonged frigid tempera tures can affect the equipment.3) An SP anomaly does not indicate whether conduct ing sulphides are disseminated or massive. Accord ingly, the anomaly could be tested by another electri cal method such as VLF (very low frequency) to determine whether it is a good conductor. At the same time, the anomaly could be checked with a magne tometer to determine whether the magnetic iron sul phide pyrrhotite is present.4) As mentioned in the section "Important Facts", the SP method responds to pyrrhotite, pyrite, and chalco pyrite. It does not respond to zinc, lead, gold, or silver minerals. However, some iron or copper sulphides are generally present with these other metals and, if oxi dizing, will result in an SP anomaly.5) In the case of a strong and obvious graphite SP anomaly, the method cannot indicate the presence or absence of associated sulphides. Presently, only one instrument, the RONKA EM-15, can resolve associ ated sulphides, but only if the anomalous source is shallow, and if any associated sulphides are good conductors. For reasons not fully understood, this in strument only responds to good conducting sul phides, but not to graphite.
SELF-POTENTIAL EQUIPMENT
A millivoltmeter-potentiometer is used to take SP read ings by a needle and scale, digital readout, or an adjusta ble dial which brings a needle or audio signal to a null po sition. The operator will likely make fewer mistakes in recording with a digital readout. Readings should be double-checked for precision, particularly at established control stations.
A basic requirement is a reel of wire. In most cases, more than 600 m of wire is desirable. Another useful and timesaving item in conjunction with the use of a long wire is a pair of walkie-talkies. Lastly, the most important items are the porous pots. If these do not function properly, the survey becomes a wasted endeavour. Occasionally the millivoltmeter may get wet and short-circuited. This con dition is easy to detect if not to rectify. Also, the wire may develop a bare spot which may make contact with the wet ground and give a sudden strong negative reading. This is also easily identified, though of infrequent occur
rence. In some circumstances, an unmonitored pot may change its potential along a survey line and produce false anomalous readings. The pots are crucial to the successful operation of the SP equipment, and accord ingly, will be discussed first in the "Instructions" section.
INSTRUCTIONS
(1) Operation of SP Equipment
The Pots
The two pots are generally made of porcelain ceramic in hollow cylindrical forms with porous bottoms. From the caps, copper electrodes are suspended down into the pots. A saturated copper sulphate solution is used as the medium to connect the porous pot contact with the ground, which establishes a mediated electrical contact with the copper electrodes suspended in solution. If two bare metal electrodes made contact with the ground, there would be an instantaneous surge in polarization be tween them which would then drop quickly to zero. With the copper sulphate solution as the mediator of the ground contact, no net polarization effect involving a dis charge of current takes place and the relative potential difference between two survey stations can be measured with considerable accuracy.
Occasionally, the two pots will have, or may develop an inherent potential difference between them. If this is only a few millivolts, no harm is done in running survey lines with the reel and not correcting the individual read ings. An error of a few millivolts will not result in false or obscured anomalies. However, a high pot potential differ ence can be very critical in some situations as discussed below.
The reason for an original pot difference is^ probably due to slight variations in construction making one pot more porous than the other, and thereby, of a slightly dif ferent conductive response. This is usually a fixed and unchanging condition which does not hamper the SP sur vey. However, a sudden change in pot difference may be caused by a crack, by contact of the porous part of the pot with metal or sulphides, by the drying out of one pot, or by the solution in one or both pots becoming undersa turated in copper sulphate. The pot difference should be checked often; for example, at the start of the day, at noon, at the end of the day, and at each control station and tie-in point.
The filling of the pots must be carried out with care, the level of the solution checked often, and additional crystals or powder added frequently as required. Without ample copper sulphate solids in contact with the solution, a rise in temperature of one or both pots may result in un- dersaturation. This is because of the increased solubility of copper sulphate at higher temperatures. To make the saturated copper sulphate solution, it is advisable to heat the water as the crystals are being added, until the solu-

Guide to Prospecting, Self-Potential Method
tion is hot and solid crystals are still present. A pyrex bowl is recommended, as the solution is corrosive, and a wooden spoon or stick is useful for stirring.
Jellying the Pots
If the pots are to be used for a week or more, it is timesav- ing to make a jelly of the solution. Only enough jellied so lution to fill the two pots is required. The operation is simi lar to making any jelly, except it is advisable to add two or three times as much gelatin to the water to make a good set. The hot water plus gelatin solution should be well stir red as the copper sulphate crystals are added. After the solution has cooled, a few crystals should be added to each pot. The jelly solution can then be poured into the pots, capped, and allowed to set. One set of jellied pots should last an entire prospecting season of 3 or 4 months.
However, the pots should always be stored under moist conditions away from excessive heat to prevent evaporation and danger of drying out.
Pot Difference
Once the pots have been filled and allowed to cool it is possible to determine by a simple procedure whether there is any inherent pot difference:
(1) The pots are placed on or in the ground, close to gether, with one pot connected to wire running from the positive ("far") connection of the millivoltmeter, and the other pot connected by wire to the negative ("near") connection. A first reading is taken.(2) The pots are now reversed leaving the same wires attached to the positive and negative connections of the millivoltmeter, and a second reading is taken.(3) The formula for calculating the pot difference is:(1st Reading -t- 2nd Reading)72. For example, if the 1st Reading is -8 millivolts and the
2nd Reading is -i-10 millivolts, the pot difference is ((-8) + (-M0))72 = -M mv. These relatively high readings in dicate that the potential difference between the ground and each pot is 9 millivolts, suggesting that the pot differ ence was measured in an anomalous area. However, as long as the correct procedure is followed, the true pot dif ference is obtainable anywhere. Once the magnitude of the pot difference is established, the positive and nega tive pots should not be interchanged during the course of SP survey readings. An alligator clamp on the "forward" positive pot is ample identification, and is useful for en gaging and disengaging the end of the wire. The pot dif ference should be regularly monitored and carefully mea sured at each control station and tie-in point.
The Millivoltmeter-Potentiometer
Most voltmeters are accompanied by full operating in structions which describe how to read the instrument. It is important to emphasize that by convention the forward advancing pot should be linked to the positive or far in strument connection and the stationary or rear control station
pot should linked to the negative near connection (Figure 1). With the positive pot moving "ahead", anomalies are negative after the traditional Carl Barus method which is the currently accepted convention. If the negative pot is inadvertently sent ahead, strong positive readings would be anomalous.
The Reel of Wire
Wire used in SP prospecting should be strong, thin, light, flexible, and well-insulated with a smooth surface. De pending on the roughness of the terrain, thickness of un- derbush, and straightness of the traverse line, a 0.8 km length of wire can be pulled off a reel to its end. Wire should be attached to the forward pot by a clove hitch knot, with a bared end connected to the copper electrode which protrudes above the pot cap. The connection should be made with a short piece of insulated wire se curely attached at one end to the pot electrode, and to an alligator clamp at the other end in order to make contact with the reel wire. With this arrangement, an SP surveyor can pull the wire and the forward pot with one hand with out danger of disengagement of the pot connection.
Theoretically, the potential difference due to the SP effect could be measured with the two pots several kilom eters apart. Although impracticable, a longer wire is pref erable as more readings can be taken with the millivolt meter and rear pot set up at a single control station, and fewer control stations are needed as discussed below.
A reel with only 244 m (800 ft) of wire should not be spliced onto an extra length of wire. Regardless of how well the wire is spliced and insulated, it will come apart or become entangled under most field conditions. The time gained from avoiding such survey delays will more than compensate for the cost of an appropriate length (e.g. 610 m (2000 ft.) of wire.
The positive wire from the millivoltmeter should have an alligator clamp to attach to the reel wire, as it is gener ally necessary to disengage the clamp before the reel un winds.
The Walkie-Talkies
Although the two SP operators can shout for a few hun dred meters and then send messages by tugs on the taut wire, a faster and more reliable survey can result from use of walkie-talkies for voice communication. The forward operator can describe the topography (e.g. swamps, creeks, up-hill, down-hill, etc.) to the note-taker operating the millivoltmeter, and can notify when the forward pot is in ground contact and ready for a reading. Often, the reel will stop, the instrument operator will attach the millivolt meter at the rear control station wire, and then the reel will suddenly move forward, resulting in possible damage. The instrument operator can also inform the forward oper ator of the trend of the readings, and, if "smelling" an anomaly, to cut down the readings from, for example, 20 m intervals to 10 m or less for a preliminary detailed sur vey of the anomaly.
The walkie-talkies should not be so powerful as to in terfere with nearby citizens bands.

(2) Conducting an SP Survey
After the pots have been prepared and the initial pot dif ference measured, they may be combined with the milli- voltmeter, the reel of wire, the walkie-talkies, and weath erproof note-taking materials in preparation for an SP survey along a predetermined line grid. The starting pro cedure will depend on the size of the grid and the length of wire on the reel. For example, the grid shown in Figure 3 is oriented with a base line (BL) parallel to the structure or strike of rock units and cross lines at right angles.
With 610 m (2000 ft) of wire a survey moving from east to west could effectively cover the area as follows: (1) The first control station is established on the base line at cross line 4W. This station is given a tentative value of O mv. (2) The pot difference is recorded, and (3) SP survey
measurements are recorded along with pot locations and other notes, north and south on lines O, 4W and 8W, as well as readings along the base line between line O and line 8W. Readings should never be taken at forward pot spacing intervals of over 15 m (50 ft), except possibly along the base line. In exploration for narrow vein depos its, the intervals should be shortened to define the peak. Bends in the wire of 90 degrees or even 360-degree loops do not affect the readings.
After line 8W has been traversed, readings are taken along the base line to line 16W where a careful measure ment is taken and added to the inverse of the pot differ ence. Next, the second control station at BL.16W is es tablished. If the tentative value of the second control station is -1-5 mv, then all readings taken from the second control station set-up along lines 12W, 16W, 20W, and
2C
LITHOLOGIC STRIKE
<^ ^>
2ndControl
(stationa (
)W 16
+5 mv
W 12
-.
BASE
w m
**~~
400ft *-(122m)*
LINE ,
N 4\
t
1320ft Mm m\
1stControlStation ,^ '
Omv '
Sg
\
N
i
i
;
t
i
'
r
(3
CROSS GRID LINES
Figure 3 An example of logistical details for an SP survey conducted with 610m (2000 ft) of wire (see also Table 1).

Guide to Prospecting, Self-Potential Method
the rest of the base line are relative to a value of 4- 5 mv. For example, a reading of -25 mv gives a tentative value for that point, or survey station, of -20 mv. All readings or final adjusted values may be plotted on suitably scaled maps beside the appropriate survey stations.
With only 244 m (800 ft) of wire, an SP survey con ducted over the same grid would require more set-ups, or control stations (Figure 4). In such a situation the first con trol station is set up at 7 + OON on line O (tentative value O mv), and readings taken north, and south to the base line. Along the base line the pot positions should be carefully marked for tie-in with other control stations south of the base line. After the northern part of line O has been run, a reading is taken at 4W,7 + OON and the inverse of pot dif ference is added. After this, the rear operator traverses over to 4W,7 + OON where a second control station is es tablished. The rest of the northern part of line 4W, includ ing the base line, is surveyed and the procedure is re peated across the northern section of the grid to control station 20W, 7 + OON. Next the pots, millivoltmeter, and reel of wire are moved to 20W.7 + OOS. The southern sec tion of line 20W is traversed, tieing-in at the base line sta
tion. Assuming the value at BL.20W had been given as -23 mv from the control station at line 20W.7 + DON; then, if the reading (including pot difference) from the new con trol station at 20W.7 + OOS is +10 mv, it follows that the new control station is 10 mv more negative than the base line at line 20W thus -33 mv. The survey is continued eastward in the same fashion as the north section. It is un likely that the rest of the base line tie-ins will check as the potential will have changed somewhat because of mois ture and temperature variations. Any discrepancies should not produce or hide anomalies. Nevertheless, it is obvious from the above examples that a longer wire pro vides better control of background SP variations over a larger area (2 control stations versus 12 control stations and 6 tie-ins), and allows a faster and more efficient sur vey to be run.
When following the normal procedure of placing the pots on or in the ground, it is possible to obtain variations of up to 110 mv due to the varying acidity and bioelectric activity of soils. Wet swamps tend to give positive SP va lues, and dry hills negative ones. In areas where there is a more uniform type of soil cover, the background range is
CM /*N Control n o W Stations
20W 16W 12W 8W 4W
Figure 4—An example of logistical details for an SP survey conducted with 244 m (800 ft) of wire.

much less. As an extreme example of this, a detailed trav erse across a 244 m (800 ft) wide tailings pond may give a range in readings from 4-1 to -1 mv, probably due to the uniform acidity of the tailings. The author observed similar small variations in the residual soils of Jamaica. Lang (1970, p.162) states: "Pronounced slopes...- sometimes introduce a topographic effect..." Fortunately, in Canada this potential variation of the background agrees with the topography, and, in nonanomalous areas of swamps and hills, the SP contours correlate to topo graphic features. This is one reason why the topography at each station should be noted. Another important rea son is shown in Figure 5.
Figure 5 represents hypothetical SP values along one line. In example A SP measurements occur on a "flat" map showing no topography, such that the weak negatives opposite the ? would normally be ignored. Ex ample B shows a small rise which would explain the neg ative readings in terms of normal background topo graphic variation. However, if there is a swamp, as in
- 0
- 3
- *2
- 1
-* f *- 17
- '28 w ? t
- -32
- 12tyff
- 2 typ
r+3
- 0
- -6
- 1
-*2
- 0
- 3
- 0
- 3
- ^2
- 1
^ 8 -./fl^
- -17^ ~~~~Mi
- -28 NORMAL
- -32
- 12 *
- 2 -nf
- * 3 ~~~*vZ
- 0
- -6
- -1
- +1
- 0
- -3
- 0
i- 3
- ±2
~ -'
:1-"'"" -17 ^
- -28
ANOMALY - -32
- 12 s\//
^-2. ^"
K 1 3 **"*'
- 0
- -6
- 1
- 4-2
- 0
- 3
AB c
Figure 5—Theoretical SP readings showing the effects of topography.
example C, these weak negatives would definitely be anomalous.
Under favourable conditions an SP survey such as that depicted by Figure 3 could cover the area with a few hundred readings in one or two days, traversing approxi mately 4 km of grid. If an SP survey detects strong ano malous negatives and has also covered a few swampy areas, it is likely that the greatest positive and negative values of the survey have been encountered. As an ex ample, SP survey notes might read as shown in Table 1.
If the range of values is of the order of 250-300 mv, or more, about one third of that range is probably back ground variation due to the varying acidity of the soils. In this case, if the most positive tentative value is near -i-100 mv, or near f 10 mv, it should be given an adjusted value of -f 50 mv and the other tentative values adjusted ac cordingly. For example, if the most positive tentative va lue is + 75 mv, it is adjusted to -i- 50 mv, and it follows that a normalizeroi -25 mv must be added to all the tentative values, as in Table 1, to yield the final adjusted value.
If the most positive tentative value is between -i-40 and +60 mv, no adjustment is necessary. In most cases the most positive value is over a swamp or low wet ground.
In some localized anomalous areas the range from most positive to most negative readings may be 150 mv, or less, and is probably due to a more uniform soil cover. In such a case, the most positive tentative value should be adjusted to about -i-25 mv. In most circumstances, one does not know at the time when the first control sta tion is set-up, what anomalous conditions will occur. On more than one occasion, the author has unknowingly set up a first control station over an anomaly and all the sub sequent readings were positive to high positive.
The purpose of the adjustment is to attain a final bal anced background range about the zero value, such that the anomalous signals are more readily recognized and interpreted. The background is the range of electrical self-potential which is due mostly to variations in topogra phy or soil pH. For example, a final adjusted value of -50 mv on top of a hill would not necessarily be anomalous. A value of -70 mv, or more negative, would be. In the sec ond case above, with a background range of 50 mv or less, an adjusted value of -25 mv on top of a hill would not necessarily be anomalous. A value of -40 mv would be. It should be stressed that over a swamp, as illustrated above, an anomaly due to buried sulphides might be much less negative, or in some cases, a low positive. SP anomalies under swamps and deep overburden are much weaker than on hills and shallow overburden. Thus, topographic information is needed in this type of electri cal survey. Below, in the section on "Alternative Field Methods", a simple technique which minimizes the topo graphic effect is discussed.
Magnetic Storms
Solar flares produce geomagnetic disturbances which are related to the phenomenon of the aurora borealis and can cause magnetic storms of several days duration.
Guide to Prospecting, Self-Potential Method
TABLE 1 AN EXAMPLE OF SP SURVEY NOTES FOR A REEL OF WIRE 610 METERS (2000 ft.) LONG (see Figure 3).
Control Survey Station Station Reading
Tentative Value
SURVEY CONDUCTED WITH ON A 400 ft. - SPACED GRID
+1-25) (Normalizer)
A
= Final Adjusted Value
BL,4WBL,3WBL,2WBL,1WBL,0O+50N
-1-3-8-12-7-2
O-K3-Q-12-7-2
(Millivolts)
-25-22-33-37-32-27
BL,16W
etc.
BL,16W
BL,15W
etc.
BL,12W 0+50N
-25
-70-44
(a "quiet" area)
-1-5
-1-5-20
(probably anomalous)
-65-39
-20
-20-45
-90-64
The intensity and effects of magnetic storms in north ern areas are enhanced near strongly magnetic iron for mation. During a magnetic storm, SP readings fluctuate in an unpredictable and random fashion similar to fluctuations observable on a magnetometer under the same conditions. Generally, the magnetic storm has no effect on the SP readings until the two pots are more than about 100 metres apart; and increased pot separations increase the violence of the fluctuations. Magnetic storms may start suddenly and last only a few minutes, or they may last a few days. Except for short traverses, an SP survey with a reel of wire is not possible under storm con ditions. Below, an alternative field method will be dis cussed which can avoid the effects of a magnetic storm.
(3) Alternative Field Methods
Topographic Problems
Although the influence of topography on SP readings may be interpreted and anomalies recognized, the prob lems can be confusing to the inexperienced operator. For several years, the author has used a technique which ef fectively inhibits the topographic effect and gives better ground contacts, even on rubble and bare outcrops.
First, two porous canvas sample bags are filled with material which will stay wet for several hours, such as black muck, loam, or sawdust. Second, a pot is inserted in each sample bag and tied on. Both pots are then in
10

contact with a medium of constant pH, and the influence of varying acidity is strongly attenuated. As a result, read ings become more uniform, the background displays a narrower range, anomalies in swamps are better defined, and anomalies on hills are less negative and less exag gerated. A final adjusted value of +10 mv for the most positive value is adequate, and a -25 mv value may be anomalous.
Magnetic Storm Problems
A magnetic storm can hamper or preclude an SP survey conducted with a reel of wire. However, by moving both pots at a constant separation along a survey line, it is possible to overcome the effects of a magnetic storm. Only on rare occasions such as in northern latitudes near strongly magnetic iron formation, could there be any fluctuation with a pot separation of about 15 metres (50 ft) or so.
There are two alternative methods by which two op erators can move aong a survey line without the reel, but linked together by about 20 m of wire, to allow for 15 me tre-spaced (50 ft) readings in rugged topography. Both methods are much faster than a survey conducted with a reel since it is not necessary to walk back along a line and reel the wire in. From the base line the operators can sur vey along the longest lines, traverse across along a tie- line or through the bush to an adjoining line, and survey along it back to the base line, and over to the starting sta tion to tie in similar to magnetic surveying methods.
One method requires that the rear negative pot be moved up to the same ground contact location on which the forward positive pot was positioned. Under field sur vey conditions this method is impracticable due to the dif ficulty of placing the rear pot on the exact ground contact position of the forward pot, such that every station be comes an uncontrolled "control station".
A preferable alternative for SP surveying during magnetic storms is the "leapfrog method" shown in Fig ure 6.
This method solves the problem of uncontrolled con trol stations, but adds to the arithmetic computations of the operator taking notes since each station has to be evaluated before the next station is "read". Both of the methods involve adding the inverse pot difference to each reading.
For example, the leapfrog pattern can be started from an established control station on the base line with an assigned tentative value of O mv. An example of typi cal survey notes is shown in Table 2.
The control station, with a tentative value of O mv, reads the positive pot at 0 + 50N. The reading is -i- 5 mv; thus, with a pot difference (P.O.) of -1 mv, the corrected reading is +G mv and the tentative value is 0 + 6 = -i-6 mv. Next, the negative pot is moved to 1 +OON and reads station 0 + 50N. The corrected reading is -9 mv. Thus, 0 + 50N is 9 mv more negative than 1 +OON; or 1 +OON is 9 mv more positive than 0 + 50N. Thus 1+OON has a transposed reading of +Q mv (see Table 2), and the ten tative value at 1 + OON is (+ 6) -t- (+ 9) = -f 15 mv. The positive pot is then moved from 0 + 50N to 1 -i-SON. Sta tion 1 + 50N has a tentative value of +31 mv. The nega tive pot is then moved to 2 -h OON and reads 1 + 50N. If the corrected reading is +S6 mv, then the transposed read ing of -36 mv means that 2 + OON is 36 mv more negative than 1 + 50N and thus has a tentative value of -5 mv.
To ensure that results are meaningful, it is important to keep a careful record of each reading and calculation for later rechecking. On returning to the base line, the readings should be tied-in to the control station from which the traverse started. An exact tie-in or equivalence of starting and finishing readings at the control station is unlikely, but depending on the number of stations read, one can treat the tie-in error as one would treat correc tions for magnetic diurnal variation during a magnetic survey. For example if the tie-in reading is +50 mv after 50 readings, then working backwards one would distrib ute the discrepancy by adding -50 to the last reading, -49 to the second last, and so on. However, if the change in readings at the control station is several hundred milli-
- — — 1st Reading + B mv
0+50N- — —|f——— 2nd Reading
II —10 mv
OON— —3rd Reading ——
-M 5 mv
1 f BON— -i,- — —4th Reading-
+ S5 mv
2+OON
Figure 6—An example of the "leapfrog" method of SP surveying with a fixed length of wire (see also Table 2).
11

Guide to Prospecting, Self-Potential Method
TABLE 2 AN EXAMPLE OF SP SURVEY NOTES FOR A SURVEY CONDUCTED USING THE "LEAPFROG" METHOD WITH A FIXED LENGTH OF WIRE (see Figure 6).
Control Survey Station Station
BL,O 0-HDO0+50N1-K)ON1+50N2+OON
Pot
(-)W
W
Reading plus inversePot Difference
P.O. M-1)
+5+1+1 h+6 -KH+1H-9 +15+(+1)=+16
TransposedReading at
Negative Pot
(Millivolts)
-(-9)
+1+16)-1+36)
Tentative Value
O 46 +15 +31 -5
FinalAdjusted
Value
volts it is necessary to recheck calculations or resurvey the lines.
Although faster, this alternative method is somewhat complicated, requires careful arithmetic, and usually in volves an adjustment to bring the relative values into rea sonable perspective for interpretation. Despite savings in time, it is not recommended unless one is obliged to use it due to magnetic storms or a shortage of wire.
(4) Notes on the Interpretation of SP Survey Results
The results of an SP survey can be effectively repre sented and interpreted by using maps on which the final adjusted values are shown along with SP line profiles, or more preferably, SP contours of appropriate intervals. If a good background range is established, most anomalies are well delineated as more negative areas.
Anomalies of -450 mv, or more negative, are due to graphite, but anomalies of -350 to -400 mv can occur in a variety of lithologic or mineralized conditions. Generally, detailed follow-up readings along the strike of the ano maly can resolve some of the possibilites.
Another situation sometimes encountered during an SP survey is a line of values which are more negative than the values along the adjacent lines on each side. This means that the anomalous SP contours run along the line at right angles to the base line and also to the regional strike. This condition may either be due to a loss of con trol, or the presence of a crosscutting conducting body which may contain sulphides. Loss of control may be due to a sudden change in pot difference, an erroneous read ing (value) of the control station, or location of the control
station over an anomaly. Similar to magnetic surveys, SP surveys are better controlled from nonanomalous control stations. If control stations are to be set up on the base line, it is preferable to first survey the base line, back and forth if necessary, to establish reliable values. Then, if some parts of the base line are anomalous, these should be avoided as control stations if possible. Since slight variations in moisture or temperature can change the electrical potential of any station, it is likely that in an ano malous area the change will be greater. To determine the cause of an anomalous line of values, the readings along it should be repeated. Repeated surveys of SP anomalies due to buried conductors are generally replicative; al though, they may change in strength due mainly to varia tions in the level of the water table. A low water table produces stronger negatives than a high water table.
If duplicate readings should substantiate that an anomaly follows along a survey line, some follow-up cross traverses perpendicular to the line may be required in order to detail the anomaly as depicted in Figure 7.
In some cases the line profiles or contours of SP va lues may be used to approximately indicate the direction of dip of a conducting body (see Figure 8). This is particl- uarly so in level areas of no topographical effect or when using the canvas sample-bag method (see "Alternative Field Methods").
(5) Mineral Prospecting with the SP Method
The main procedures of the SP method are described un der the heading "Conducting an SP Survey". SP pro specting may be conducted with a reel of wire; or, at a constant pot separation, depending on which is more
12

CROSS TRAVERSE LINES
Figure 7—An example of an SP anomaly (arbitrary contour values) detailed by cross traverse lines.
convenient. Normally, it is not necessary to cut picketed grid lines for prospecting, as pace-and-compass trav erses provide sufficient control over location of anoma lies.
When an anomaly has been detected it should be "peaked up". This means that the forward pot is moved back along the survey line until the highest reading on that traverse line is accurately located. This may require moving the pot only a few centimetres along the line. Next, the rear pot and millivoltmeter are moved up close to the anomaly, preferably at or near a surveyed station so that the new control station can be tied-in to the rest of the survey values. As an example, the peak on the survey line in Figure 9 is -225 mv; since somewhere along strike the peak could rise to a "graphite" level, it is necessary to
maintain some control over the relative magnitude of SP values. Assuming the new control station is found to be valued at -125 mv, it is possible to do a further check per pendicular to the traverse line to establish the location of the anomaly peak more accurately. If there is higher ground to the right and lower ground to the left, it is pref erable to test the higher ground first by a detailed parallel traverse line some 5 to 10 m from the original survey line, as shown in Figure 9.
If a second peak of -285 mv is located to the right, this means that the best direction was chosen, and an other detailed traverse line should be surveyed farther to the right. The third peak may be only -105 mv. Thus the strongest vaule is near -285 mv. Next, it is possible to pin point the SP target by "potting" along strike until the maxi-
SURFACE S. P. SURVEY STATIONS S. P. LINE PROFILE S. P. CONTOURS
.
.Q...Q...Q...Q -e o , Q e-
X X ^gi^cON DUCTING \. lX PJJ& SULPHIDE N. 1
7
9
\
f
\
t9-
\X /^ X BODY X ^"-. S
^g^^f x x x x -*-DIP -*
A
\ y
\ \
-e-
v/ y 7-DIP
ABC
Figure 8—An example of dip determination using SP data.(A)—cross-section of a dipping sulphide body.(B)—line profile of SP readings over (A) showing smooth gentle slope on the down-dip side and steep abrupt slope on the up-dip side.(C)—contours of SP readings over (A) showing wider spacing interval down-dip and a closer interval up-dip.
13

Guide to Prospecting, Self-Potential Method
SURVEY DETAILED FOLLOW-UP LINES LINE
NewControlStatior
—125 mv
MAXIMUMPEAK 320 mv '
: PEAK y -225 mv **
s a
X PEAK -285 mv
' PEAK k -105 mv
STRIKE
Figure 9—An example of detailed follow-up surveying used to locate a maximum SP peak.
Surveyed Claim Lines
\s\\
s\
sControl ^Station ̂V ̂
XX
Xx
xx
xx
/x
xx
xx
xx
s7\. S. P. Survey
S Lines
\/N
NN
N
STRIKE
Figure 10—The "spiderweb" method of SP surveying.
CONCLUSIONS
mum peak is located, probably between the original trav erse line and the -285 mv value for the above example. Assuming the highest peak value is -320 mv, this is where the source of the anomaly is closest to surface. To evalu ate whether the anomaly can be exposed by stripping, it is necessary to "pot" around the highest peak by taking a dozen or so readings over an area of about 30x30 cm2 (1 ft2).
If the readings around the peak vary by only 1 to 5 mv within the square area, then the source of the anomaly is probably below the water table and inaccessible by or dinary overburden stripping. If the readings vary by 5 to 15 mv or more, the anomaly is above the water table and probably may be exposed by stripping off the overbur den with a shovel and pick. If the peak area varies by 25 to 50 mv or more, the source of the anomaly is probably graphite which may, or may not, be above the water ta ble.
An alternative to the grid prospecting method for sur veying well-staked contiguous claims is the "spiderweb" technique illustrated in Figure 10.
Four claims can be covered from a single control sta tion. This method is recommended for base metal pro specting in areas where only large sulphide bodies are of interest. It is not recommended for gold prospecting.
Lang (1970, p. 162) states: "Of all the geophysical meth ods applicable to the search for sulphides, the spontane ous polarization technique provides the quickest field procedure and also furnishes highly definite information as to the occurrence or absence of sulphide mineraliza tion...With the exception of graphite there are but few in significant factors to lead the geophysicist astray when interpreting the spontaneous polarization results."
Nevertheless, because varying concentrations of iron sulphide are common near the surface of the earth's crust, and are readily detected by the SP method, there may be a considerable number of SP anomalies which are due to uneconomic mineralization. Thus SP should "be combined with other prospecting methods when the na ture of mineralization is in doubt. Also, laboratory and field research into several important aspects of the SP method are lacking. For example, the feasibility and ef fectiveness of SP surveys over ice are not well estab lished. Other areas of possible investigation include the effects of magnetic storms, the extra intensity of these storms near major iron formations, the effect of hydrother mal alteration on SP anomalies, improvement of the can vas sample-bag technique (see "Alternative Field Meth ods") to eliminate potentials due to varying soil acidity, derivation and refinement of topographic correction tech niques, and use of the SP method to monitor earthquakes or atomic explosions.
14

References
Barus, Carl W.1882: On the Electrical Activity of Ore Bodies in Geology of the
Comstock Lode, edited by George F. Belcher, Monograph III. United States Geological Survey, Chapter X, p.309.
Burr, S.V.1960: The Self-Potential Method for the Prospector, Canadian In
stitute of Mining and Metallurgy, Transactions, Vol.LXIII, p.591-597.
Fox, Robert W.1830: On the Electromagnetic Properties of Metalliferous Veins
in the Mines of Cornwall, Proc. Roy. Soc. London, Vol.2, p.411.
Kelly, Sherwin F.1957: Spontaneous Polarization, or Self-Potential Method in
Methods and Case Histories in Mining Geophysics, edited by J.P. deWet, Sixth Commonwealth Mining and Metallurgi cal Congress, p.53-59.
Lang, A.M.1970: Prospecting in Canada, Economic Geology Report No. 7,
Geological Survey of Canada. 4th edition, 308p.Lundberg, Hans1928: The Present Status of Geophysical Methods of Prospect
ing, Canadian Institute of Mining and Metallurgy, Transac tions, Vol.XXXI, p.209-221.
1948: On the History of Geophysical Exploration, Canadian Insti tute of Mining and Metallurgy, Volume 41, No. 431, p.171- 185.
Parasnis, D.S.1975: Mining Geophysics (2nd edition), Elsevier Scientific Pub
lishing Company, p.80-97.Sato, Motoaki and Mooney, H.M.1960: The Electrochemical Mechanism of Sulfide Self-Potentials,
Geophysics, Vol.XXV(1), p.226-249.
15