Embed Size (px)
Citation preview
5/17/2018 Nano Science_ Colloidal and Inter Facial Aspects - slidepdf.com
http://slidepdf.com/reader/full/nano-science-colloidal-and-inter-facial-aspects 1
2 Effects of Nanoparticles onForces between Colloids in
Solution
John Y. Walz
CONTENTS
2.1 Introduction . . . . . . . . . . . . . . . . . . . . . . . . . . . . . . . . . . . . . . . . . . . . . . . . . . . . . . . . . . . . . . . . . . . . . . . . . . . . . . . . . . . 31
2.2 The Asakura–Oosawa Interaction Potential .. .. .. .. .. .. .. .. .. .. .. .. .. .. .. .. .. .. .. .. .. .. .. .. . 32
2.3 Effect of Charge . . . . . . . . . . . . . . . . . . . . . . . . . . . . . . . . . . . . . . . . . . . . . . . . . . . . . . . . . . . . . . . . . . . . . . . . . . . . . . 33
2.4 Higher-Order Concentration Effects .. .. .. .. .. .. .. .. .. .. .. .. .. .. .. .. .. .. .. .. .. .. .. .. .. .. .. .. 35
2.5 Experimental Measurements.. . . . . . . . . . . . . . . . . . . . . . . . . . . . . . . . . . . . . . . . . . . . . . . . . . . . . . . . . . . . . . . . 36
2.5.1 Solution Stability.. . . . . . . . . . . . . . . . . . . . . . . . . . . . . . . . . . . . . . . . . . . . . . . . . . . . . . . . . . . . . . . . . . . . . 36
2.5.2 Direct Measurement of Depletion Force and Energy .. .. .. . .. .. .. .. .. .. .. .. .. .. .. .. 40
2.6 Other Complicating Factors . . . . . . . . . . . . . . . . . . . . . . . . . . . . . . . . . . . . . . . . . . . . . . . . . . . . . . . . . . . . . . . . . 42
2.6.1 Polydispersity . . . . . . . . . . . . . . . . . . . . . . . . . . . . . . . . . . . . . . . . . . . . . . . . . . . . . . . . . . . . . . . . . . . . . . . . . 42
2.6.2 Nonspherical Nanoparticle Shape .. .. .. .. .. .. .. .. .. .. .. .. .. .. .. .. .. .. .. .. .. .. .. .. .. .. 43
2.7 Summary and Future Challenges . . . . . . . . . . . . . . . . . . . . . . . . . . . . . . . . . . . . . . . . . . . . . . . . . . . . . . . . . . . . 47
References . . . . . . . . . . . . . . . . . . . . . . . . . . . . . . . . . . . . . . . . . . . . . . . . . . . . . . . . . . . . . . . . . . . . . . . . . . . . . . . . . . . . . . . . . . . 47
2.1 INTRODUCTION
The addition of nanoparticles to a dispersion of larger colloidal particles can have a substantial impact
on dispersion stability. Obviously, adsorption of the nanoparticles can produce some of the same
effects that arise upon adsorption of a polymer or polyelectrolyte, such as charge neutralization or
reversal, or the development of a finite distance of closest approach between two particles or a particle
and another surface. This chapter will focus, however, on the effect of nonadsorbed nanoparticles,
since in many ways the resulting impact on dispersion stability is much more interesting and complex
than that produced from adsorbed nanoparticles.
At the simplest level, nonadsorbed nanoparticles create an attractive depletion force between two
surfaces dueto theexclusion of the nanoparticles between thegaps upon approach of thesurfaces. This
force, which had been observedexperimentally since the early1900s, was first explained satisfactorily
by Asakura and Oosawa in 1954 and has been studied extensively since. As explained in the chapter,
not only is the depletion force important in many systems, it also provides researchers an ideal tool
for manipulating interparticle interactions.
Recent work has suggested, however, that the impact of nonadsorbed nanoparticles can be far more
complicated, specifically when the effects of the charge, concentration, and shape of nanoparticles
are considered. While a significant amount of research into such systems has been performed, there
remains much that is not understood about the effects of such factors on colloidal behavior.
31
5/17/2018 Nano Science_ Colloidal and Inter Facial Aspects - slidepdf.com
http://slidepdf.com/reader/full/nano-science-colloidal-and-inter-facial-aspects 2
32 Nanoscience
This chapter will present an overview of some of the work that has been performed in these
systems, starting with the pioneering work of Asakura and Oosawa and ending with some recent dis-
coveries. Much of the work will be that of the author; however, other relevant work will be described
as appropriate.
2.2 THE ASAKURA–OOSAWA INTERACTION POTENTIALNot surprisingly, the earliest observations of the depletion force involved systems with nonadsorbed
polymer molecules as opposed to nonadsorbed nanoparticles. In 1925, Traube1 reported that natural
rubbers could be creamed by the addition of a water-soluble polymer. Bondy2 showed that such
flocculation could be reversed by dilution and that the cycle of flocculation–redispersion–flocculation
could be repeated many times. While numerous theories were put forward to explain these effects,
such as the formation of a cross-linked network of nonadsorbed polymers that bound the particles
together,3,4 none of these theories could explain all of the observed phenomena.
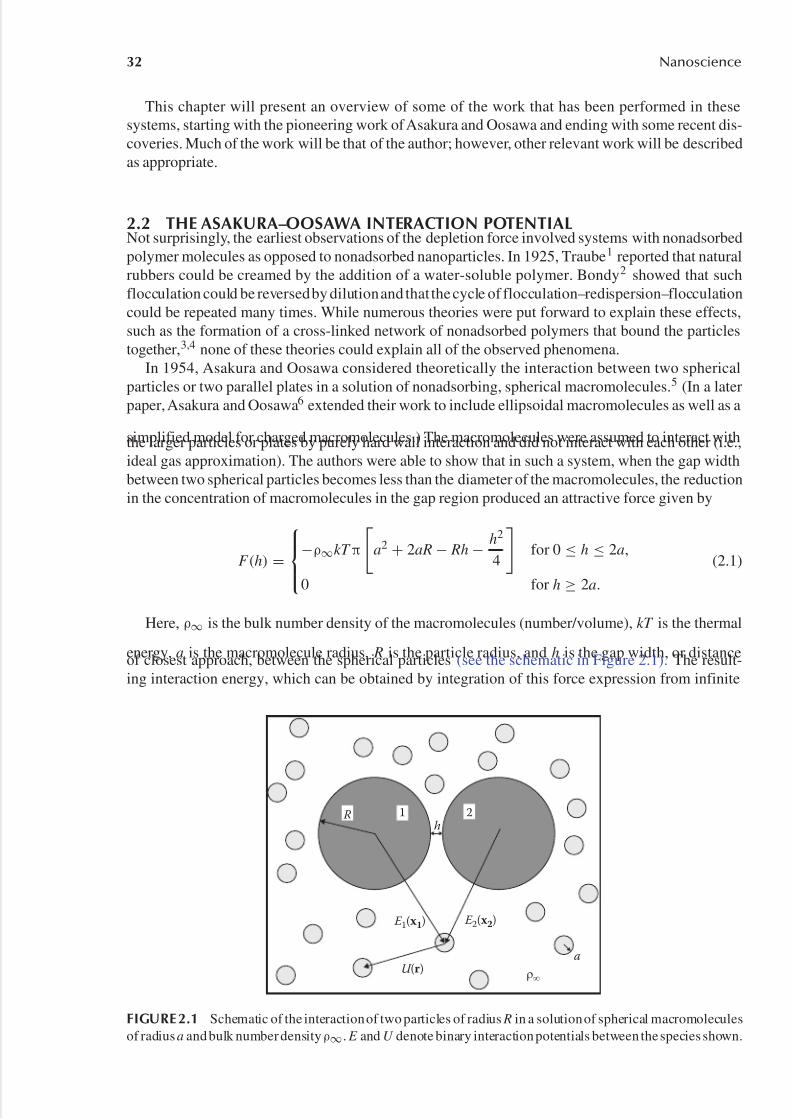
In 1954, Asakura and Oosawa considered theoretically the interaction between two spherical
particles or two parallel plates in a solution of nonadsorbing, spherical macromolecules.5 (In a later
paper, Asakura and Oosawa6 extended their work to include ellipsoidal macromolecules as well as a
simplified model for charged macromolecules.) The macromolecules were assumed to interact withthe larger particles or plates by purely hard wall interaction and did not interact with each other (i.e.,
ideal gas approximation). The authors were able to show that in such a system, when the gap width
between two spherical particles becomes less than the diameter of the macromolecules, the reduction
in the concentration of macromolecules in the gap region produced an attractive force given by
F (h) =
−ρ∞kT π
a2 + 2aR− Rh− h2
4
for 0 ≤ h ≤ 2a,
0 for h ≥ 2a.
(2.1)
Here, ρ∞ is the bulk number density of the macromolecules (number/volume), kT is the thermal
energy, a is the macromolecule radius, R is the particle radius, and h is the gap width, or distanceof closest approach, between the spherical particles (see the schematic in Figure 2.1). The result-
ing interaction energy, which can be obtained by integration of this force expression from infinite
E 1(x 1)
R 1 2h
E 2(x 2)
a
U (r) ρ∞
FIGURE 2.1 Schematic of the interaction of two particles of radius R in a solution of spherical macromolecules
of radius a and bulk number densityρ∞. E and U denote binary interaction potentials between the species shown.
5/17/2018 Nano Science_ Colloidal and Inter Facial Aspects - slidepdf.com
http://slidepdf.com/reader/full/nano-science-colloidal-and-inter-facial-aspects 3
Effects of Nanoparticles on Forces between Colloids in Solution 33
separation to any separation distance h, is given by
E (h) =
−ρ∞kT π
4
3a3 + 2a2 R− a2h − 2aRh+ Rh2
2+ h3
12
for 0 ≤ h ≤ 2a,
0 for h ≥ 2a.
(2.2)
The Asakura–Oosawa force of Equation 2.1 can be derived via two different approaches. The first
involves calculating the bulk osmotic pressure solution (equal to ρ∞kT ) acting on a circular plate
with a radius equal to the size of the exclusion region between the two spheres. This radius is zero
when the gap width is greater than the diameter of the macromolecules and reaches a maximum of √ a2 + 2aR at the point of contact of the two particles.
The second approach involves calculating the reduction in the system volume that is excluded from
the macromolecules upon approach of the two particles. Specifically, each of the larger particles in
the bulk has an excluded shell around it of thickness equal to the macromolecule radius, a. When
two particles approach separation less than 2a, these excluded shells overlap, meaning that the total
excluded volume decreases (free volume increases), which is energetically favorable. For a dilute
concentration of macromolecules, the resulting force can be calculated using
F = −kT ρ∞∂V excl
∂h, (2.3)
where ∂V excl
∂h is the change in excluded volume with particle–particle separation distance.
Equation2.2 illustrates some of the unique features of depletion interaction. Consider, for example,
two 1-µm-diameter spherical particles immersed in a solution of 10-nm-diameter spherical macro-
molecules at a bulk concentration of 5% vol. The interaction energy at contact will be approximately
7.5 kT , which is clearly sufficient to induce a phase change in the system.
The other useful aspect of the depletion interaction is that both the magnitude and the range of the
depletion force can be manipulated by varying the concentration and/or size of the nanoparticles. This
feature has been used by researchers interested in studying gelation, crystallization, and self-assembly
of colloidal particles.7,8
2.3 EFFECT OF CHARGE
While the Asakura–Oosawa potential is mathematically simple and easy to apply, it is nonetheless
limited, because it ignores several potentially important effects. One such effect is electrostatic
interactions between charged particles and nanoparticles, which are common in aqueous solvents.
Walz and Sharma9 developed a force–balance model for calculating the depletion force between
two spherical microparticles in a solution of nonadsorbing nanoparticles. In their approach, the force
exerted on microparticle 1 (see Figure 2.1) by the surrounding nanoparticles, F, was calculated as
F = x1
ρ(x1) E 1(x1) dx1, (2.4)
where ρ(x1) is the local nanoparticle density at position x1, E is the gradient of the microparticle–
nanoparticle interaction pair potential (i.e., the force of interaction between a microparticle and a
nanoparticle), and the integral is over the system volume. In the dilute nanoparticle limit, the density
distribution of nanoparticles could be expressed using a Boltzmann distribution of the form
ρ(x1) = ρ∞ exp
− E 1(x1)+ E 2(x2)
kT
. (2.5)
5/17/2018 Nano Science_ Colloidal and Inter Facial Aspects - slidepdf.com
http://slidepdf.com/reader/full/nano-science-colloidal-and-inter-facial-aspects 4
34 Nanoscience
Here, ρ∞ is the bulk number density and E i(xi) is the interaction energy (pair potential) of a
nanoparticle interacting with microparticle i (see Figure 2.1).
In the Walz and Sharma model, the interaction energies, E 1(x1) and E 2(x2), each consisted of
a hard wall interaction plus an electrostatic interaction that was calculated using a superposition
of potentials approximation. The depletion force was calculated by inserting these interactions into
Equation 2.5 and then numerically integrating Equation 2.4 over the system volume. For a single
microparticle in a solution of nanoparticles, the integral of Equation 2.4 is zero due to symmetryin the nanoparticle distribution. The presence of either a wall or another microparticle disrupts this
symmetry and produces a finite force. For the case where the electrostatic interaction is replaced
by a simple hard wall interaction, Equations 2.4 and 2.5 yield the Asakura–Oosawa potential of
Equation 2.1.
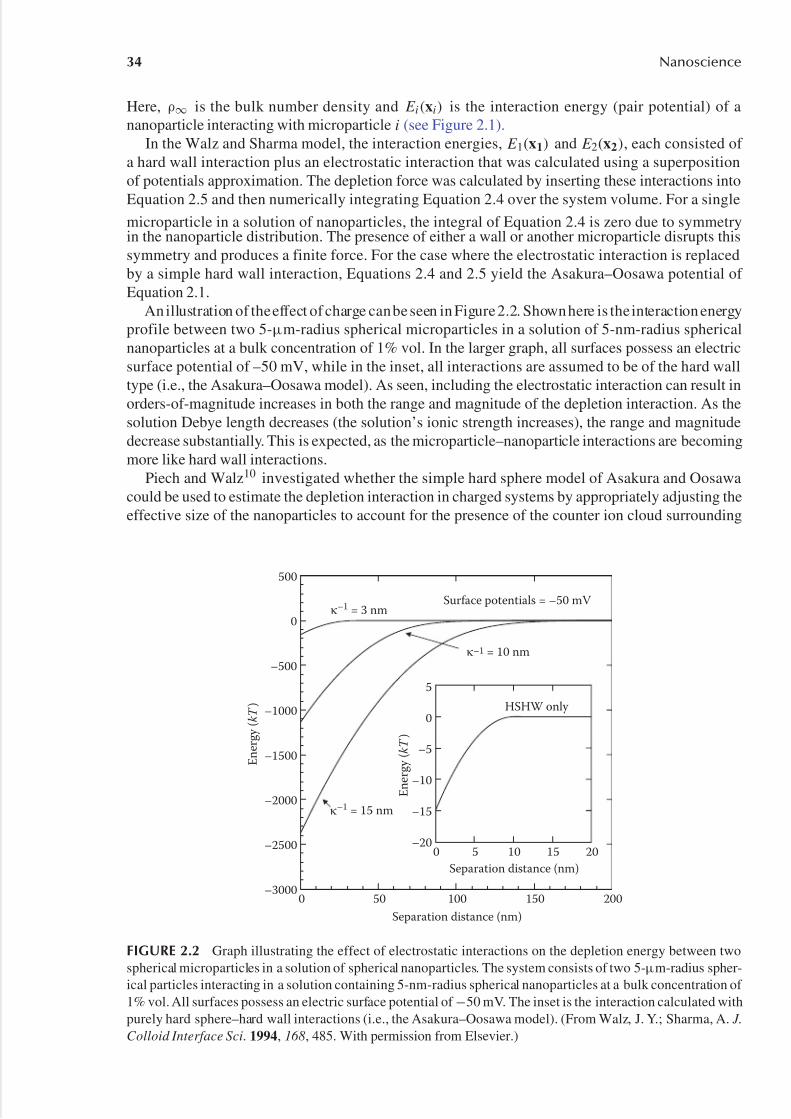
An illustration of the effect of charge can be seen in Figure 2.2. Shown here is the interaction energy
profile between two 5-µm-radius spherical microparticles in a solution of 5-nm-radius spherical
nanoparticles at a bulk concentration of 1% vol. In the larger graph, all surfaces possess an electric
surface potential of –50 mV, while in the inset, all interactions are assumed to be of the hard wall
type (i.e., the Asakura–Oosawa model). As seen, including the electrostatic interaction can result in
orders-of-magnitude increases in both the range and magnitude of the depletion interaction. As the
solution Debye length decreases (the solution’s ionic strength increases), the range and magnitude
decrease substantially. This is expected, as the microparticle–nanoparticle interactions are becoming
more like hard wall interactions.
Piech and Walz10 investigated whether the simple hard sphere model of Asakura and Oosawa
could be used to estimate the depletion interaction in charged systems by appropriately adjusting the
effective size of the nanoparticles to account for the presence of the counter ion cloud surrounding
Separation distance (nm)
0 50 100 150 200
E n e r g y
( k T )
–3000
–2500
–2000
–1500
–1000
–500
0
500
Separation distance (nm)
0 5 10 15 20
E n e r g y
( k T )
–20
–15
–10
–5
0
5
Surface potentials = –50 mV
HSHW only
κ–1 = 15 nm
κ–1 = 10 nm
κ–1 = 3 nm
FIGURE 2.2 Graph illustrating the effect of electrostatic interactions on the depletion energy between two
spherical microparticles in a solution of spherical nanoparticles. The system consists of two 5-µm-radius spher-
ical particles interacting in a solution containing 5-nm-radius spherical nanoparticles at a bulk concentration of
1% vol. All surfaces possess an electric surface potential of −50 mV. The inset is the interaction calculated with
purely hard sphere–hard wall interactions (i.e., the Asakura–Oosawa model). (From Walz, J. Y.; Sharma, A. J.
Colloid Interface Sci. 1994, 168, 485. With permission from Elsevier.)
5/17/2018 Nano Science_ Colloidal and Inter Facial Aspects - slidepdf.com
http://slidepdf.com/reader/full/nano-science-colloidal-and-inter-facial-aspects 5
Effects of Nanoparticles on Forces between Colloids in Solution 35
the charged surfaces. The approach was to determine the value of δ in the equation aeff = a + δ
that provided the best match between Equations 2.1 and 2.4 (i.e., the effective radius was used in
Equation 2.1). It was found that a good choice of δ was the microparticle–nanoparticle separation
distance at which the pair potential equaled 0.5 kT . This finding was also consistent with the work by
Odiachi and Prieve,11 who used theAsakura–Oosawa model to match the experimental measurements
of the depletion interaction between a sphere and a plate in solutions of charged, nanometer-sized
Laponite clay particles.
2.4 HIGHER-ORDER CONCENTRATION EFFECTS
A second limitation to the Asakura–Oosawa model is its neglect of interactions between the nanopar-
ticles themselves, which is equivalent to treating the nanoparticles as an ideal gas. While this is a
valid assumption at low nanoparticle concentrations, these interactions must be considered as the
concentration increases. This is especially true in charged systems in which the nanoparticles can
interact through screened Coulombic interactions.
The effects of such interactions can be included via several different methods. Walz and Sharma
extended their model such that a second-order virial expansion of the single particle distribution
function was used to predicted the density distribution of nanoparticles around the microparticles.9
Thus,
ρ(x1) = ρ∞ exp
− E 1(x1)+ E 2(x2)
kT
1+ ρ∞[b1(x1)+ b2(x2)] , (2.6)
where the second-order virial coefficients, b1(x1) and b2(x2), are functions of both the interaction
energy between a nanoparticle and particles 1 and 2, respectively, as well as the interaction between
two nanoparticles, U (r).12−14 Again, all interactions were assumed to consist of a hard sphere
interaction plus a screened Coulombic interaction.
Separation distance (nm)0 50 100 150
E n e r g y
( k T )
–1800
–1600
–1400
–1200
–1000
–800
–600
–400
–200
0
200
Separation distance (nm)
0 5 10 15 20
E n e r g y
( k T )
–20
–15
–10
–5
0
5
HSHW onl y
κ–1 = 3 nm
κ–1 = 10 nm
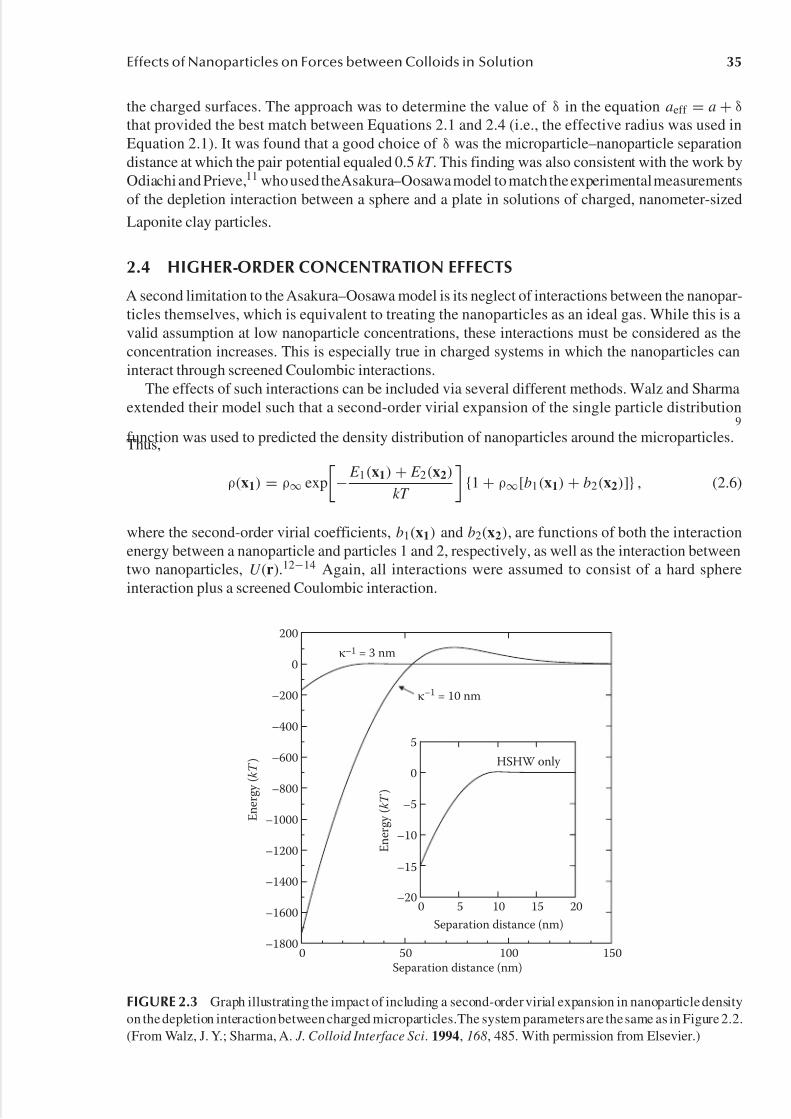
FIGURE 2.3 Graph illustrating the impact of including a second-order virial expansion in nanoparticle density
on the depletion interaction between charged microparticles.The system parameters are the same as in Figure 2.2.
(From Walz, J. Y.; Sharma, A. J. Colloid Interface Sci. 1994, 168, 485. With permission from Elsevier.)
5/17/2018 Nano Science_ Colloidal and Inter Facial Aspects - slidepdf.com
http://slidepdf.com/reader/full/nano-science-colloidal-and-inter-facial-aspects 6
36 Nanoscience
The effect of including these nanoparticle–nanoparticle interactions can be seen in Figure 2.3,
which plots the depletion energy between two 5µm spherical particles in a solution of 5 nm
nanoparticles at 1% volume bulk concentration (the same system as in Figure 2.2). Both the
microparticles and nanoparticles are assumed to have surface potentials of –50 mV, and the Debye
length is indicated on each plot. The inset shows the effect for a purely hard sphere–hard wall system.
The interaction potentials shown here should be compared with those in Figure 2.2 in which
nanoparticle–nanoparticle interactions were not included. As seen, in purely hard sphere systems atlow concentrations (order 1% by volume of nanoparticles), the effect of second-order interactions
is relatively small. This is clearly not the case, however, when long-range electrostatic interactions
are present between the microparticles and nanoparticles. Now, these higher-order concentration
effects increase significantly the magnitude of the depletion interaction. This is not surprising, since
repulsive interactions between the nanoparticles will increase the bulk osmotic pressure.
What is perhaps more interesting, however, is that the interaction is no longer strictly attractive,
but can actually be repulsive at larger separations. As explained by Walz and Sharma, this repul-
sion arises due to an ordering of the nanoparticles under confinement into layers. More detailed
computer simulations performed by various researchers have shown that the true interaction profile
actually oscillates between attraction and repulsion with an amplitude that decays to zero at large
separations.15
−22 Because the Walz and Sharma model uses only a second-order virial expansion,
however, only the first repulsive barrier is predicted. This oscillatory profile is discussed in greater
detail next.
2.5 EXPERIMENTAL MEASUREMENTS
2.5.1 SOLUTION STABILITY
The earliest experimental measurements studying the depletion interaction focused on the effect of
nonadsorbed polymers on the stability of a dispersion of colloidal particles. Li-in-on et al. 23 mea-
sured the flocculation rate of polystyrene particles coated with polystyrene-poly(ethylene oxide)
(PEO) block copolymer in the presence of added PEO homopolymer. The authors found that increas-
ing amounts of PEO caused flocculation initially, but higher concentration actually restabilized thedispersion. In a similar work, Cowell et al. 24 observed that as the concentration of homopolymer is
first increased, a critical point is reached, termed the critical flocculation concentration (v*), at which
rapid flocculation occurs. As the polymer concentration is increased further, a second critical point,
termed the critical restabilization concentration (v**), is reached at which the particles redisperse.
It was further observed that both the critical flocculation and restabilization values decreased with
increasing homopolymer molecular weight.
Sperry et al.25 studied the flocculation of latex spheres (diameters ranging from 0.35 to 0.85 µm)
by hydroxyethyl cellulose, a water-soluble polymer. The critical flocculation concentration was found
to be in the range of 0.1–0.3% wt and was observed to decrease with increasing molecular weight
of the polymer. In addition, the critical flocculation concentration decreased with added electrolyte.
In an attempt to explain these results, Sperry26 developed a model in which the total interaction
energy between spherical particles in the presence of a nonadsorbed polymer was calculated as
the sum of an electrostatic repulsion, a van der Waals attraction, and a depletion attraction. The
depletion component was calculated using the Asakuara–Oosawa interaction model. By assuming
that a secondary potential of approximately 3 kT was required for flocculation, the authors obtained
good agreement between measured and predicted values of the critical flocculation concentration.
Seebergh and Berg27 measured the stability of sterically stabilized latex spheres (stabilized with
a coating of PEO/poly(propylene) oxide/PEO triblock copolymer) in a solution containing solu-
ble PEO. As found by other researchers, the critical flocculation concentration was observed to
decrease with increasing PEO molecular weight. The authors also studied the effect of added elec-
trolyte on stability, observing v* to increase with increasing NaCl concentration. Restabilization
5/17/2018 Nano Science_ Colloidal and Inter Facial Aspects - slidepdf.com
http://slidepdf.com/reader/full/nano-science-colloidal-and-inter-facial-aspects 7
Effects of Nanoparticles on Forces between Colloids in Solution 37
at higher PEO concentration was not observed. Depletion flocculation has also been observed in
nonpolar systems28−33 and in aqueous systems containing surfactants above their critical micelle
concentration.34−38
The effect of added nanoparticles on the stability of dispersion of larger particles was studied by
Sharma et al.,39 who studied the effect of adding negatively charged, nanometer-sized silica spheres to
an aqueous dispersion of negatively charged polystyrene particles of either 0.4 or 0.9µm in diameter.
Without added nanoparticles, the dispersion of polystyrene particles was stable against aggregationdue to electrostatic repulsive forces. The state of aggregation of the latex particles was monitored
using various methods, including optical turbidity and direct size measurement.
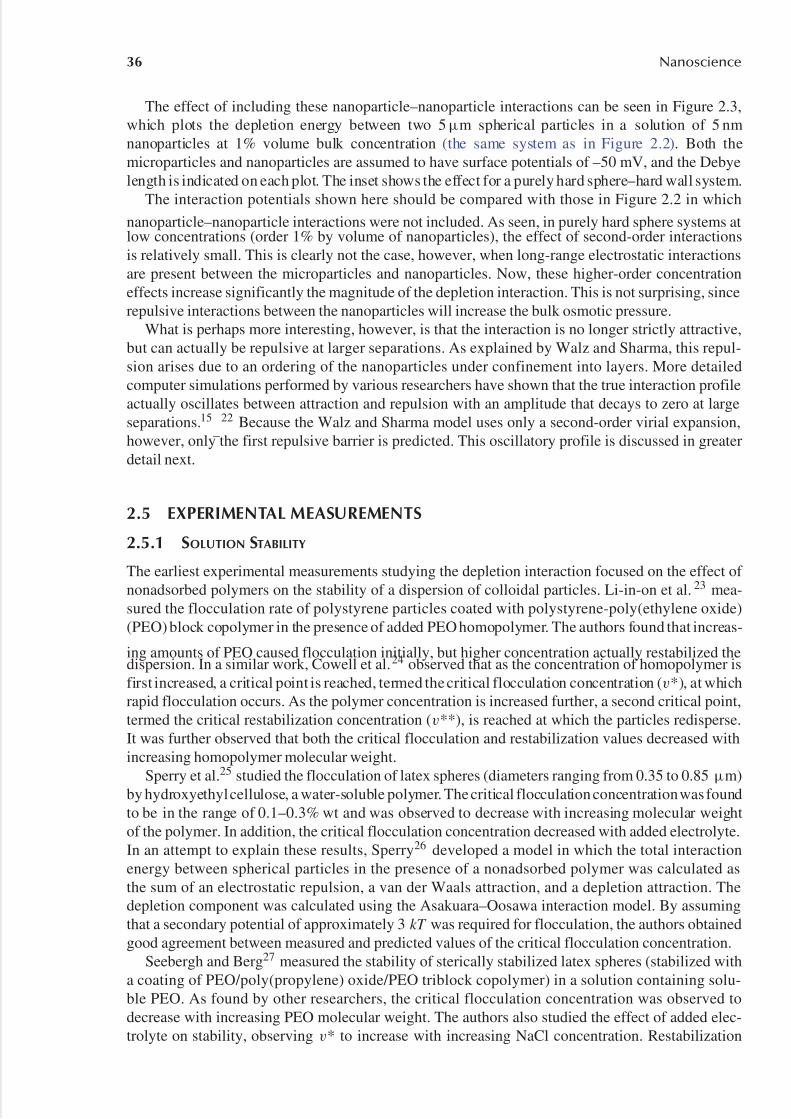
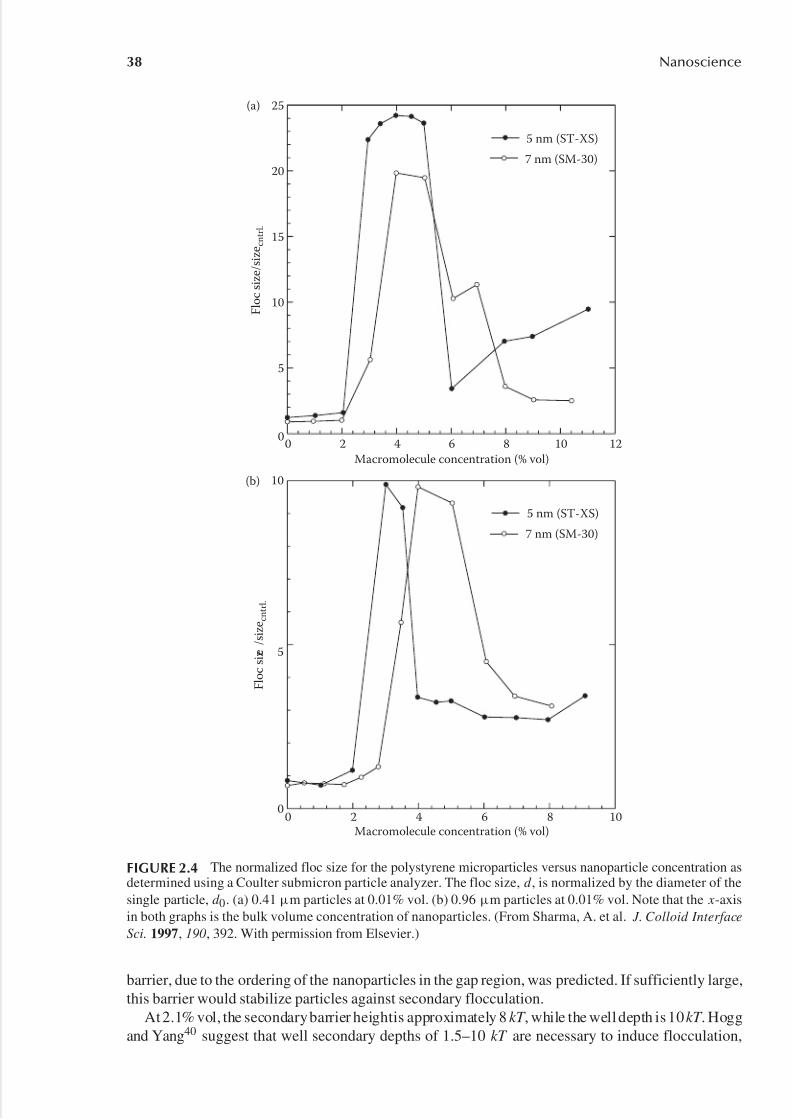
The authors found that the nanoparticles had little impact on stability until a critical nanoparticle
concentration was reached, at which point the floc size increased rapidly. Similar to the results
obtained with added polymers, Sharma et al.39 termed this as the critical flocculation concentration,
v*. As the concentration of the nanoparticles was increased further, a point was reached where the
system restabilized again, which the authors termed the critical restabilization concentration, v**.
(It should be mentioned that these nanoparticle additions were not done sequentially on a single
sample but were instead done by adding various amounts of nanoparticles to a series of samples and
then analyzing the stability of each sample.) This trend can be seen in Figure 2.4, which plots the
normalized floc size (floc size divided by individual particle size) versus the concentration of added
silica nanoparticles for both the 0.4 and 0.9 µm particles. Each graph shows the results for 5- and
7-nm-diameter silica nanospheres.
The measured critical flocculation and restabilization concentrations obtained from these graphs
are listed in Table 2.1. As can be seen, the system is unstable over a relatively small range of
nanoparticle concentrations (i.e., roughly between 2% and 7% vol).
Several trends from these results should be mentioned. First, increasing the size of the added
nanoparticles tends to increase both the flocculation and restabilization concentrations. While pos-
sibly seeming counterintuitive at first, it should be remembered that the concentrations are reported
here as volume fractions. Thus, while the number density of nanoparticles required to induce floccu-
lation or stabilization gets smaller as the nanoparticle size increases, the nanoparticle volume fraction
actually increases.
Second, increasing the microparticle size reduces slightly the volume fraction of nanoparticlesrequired to produce flocculation. This effect is more subtle, since altering the microparticle size
increases both the attractive depletion force that favors flocculation as well as the repulsive electro-
static force that prevents it. Because both forces are affected, the overall change in v* and v** is
relatively small.
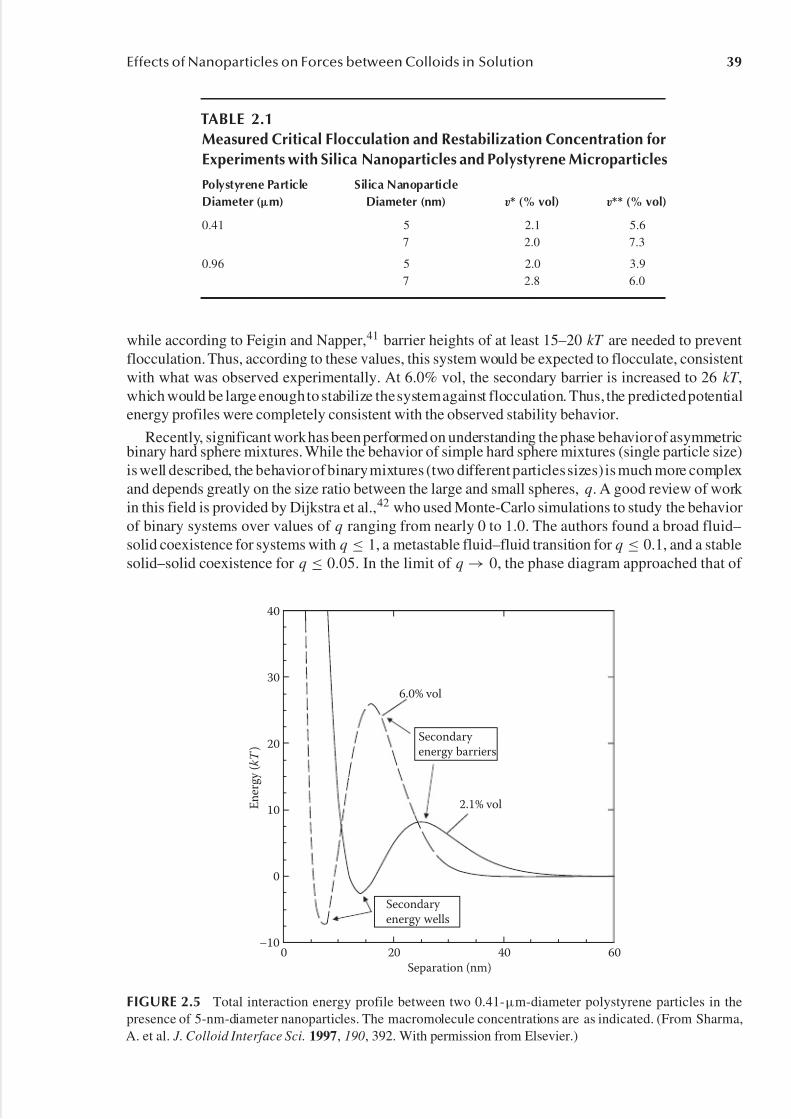
Using the force-balance model described before, Sharma et al.39 calculated the potential energy
profiles describing the interaction between two identical polystyrene microparticles. The depletion
interaction was added to the microparticle–microparticle electrostatic interaction to obtain the total
pair potential between the two particles. Shown in Figure 2.5 is the predicted pair potential between
two 0.4-µm-diameter latex particles in the presence of 5 nm silica nanoparticles at 2.1% and 6.0% vol
nanoparticles, which are approximately equal to the measured values of v* and v** for this particular
system. In these experiments, the values of all parameters needed for the model (Debye length and
electric surface potentials) were independently measured.
As can be seen, in these systems, the depletion interaction results in longer-range, secondary
energy wells that arise from the trade-off between the attractive depletion force and the repulsive
electrostatic force. At very small separations, such as less than 5 nm, attractive van der Waals forces,
which were not included in these calculations, would produce a very deep primary energy well. In
order for the particles to reach this primary well however, they would need to overcome a very large
primary energy barrier, produced by the strong electrostatic repulsion between the particles. In these
systems, this barrier was large enough to effectively prevent primary flocculation. Flocculation could
occur, however, in the longer-range secondary energy well indicated on the graphs, provided this
well was sufficient to hold particles against separation. At even large distances, a secondary energy
5/17/2018 Nano Science_ Colloidal and Inter Facial Aspects - slidepdf.com
http://slidepdf.com/reader/full/nano-science-colloidal-and-inter-facial-aspects 8
38 Nanoscience
Macromolecule concentration (% vol)
0 2 4 6 8 10 12
F l o c s i z e / s i z e c n t r l .
0
5
10
15
20
25(a)
(b)
5 nm (ST-XS)
7 nm (SM-30)
Macromolecule concentration (% vol)0 2 4 6 8 10
F l o c s i z e / s i z e c n t r
l .
0
5
10
5 nm (ST-XS)
7 nm (SM-30)
FIGURE 2.4 The normalized floc size for the polystyrene microparticles versus nanoparticle concentration asdetermined using a Coulter submicron particle analyzer. The floc size, d , is normalized by the diameter of the
single particle, d 0. (a) 0.41 µm particles at 0.01% vol. (b) 0.96 µm particles at 0.01% vol. Note that the x-axis
in both graphs is the bulk volume concentration of nanoparticles. (From Sharma, A. et al. J. Colloid Interface
Sci. 1997, 190, 392. With permission from Elsevier.)
barrier, due to the ordering of the nanoparticles in the gap region, was predicted. If sufficiently large,
this barrier would stabilize particles against secondary flocculation.
At 2.1% vol, the secondary barrier heightis approximately 8 kT , while the well depth is 10 kT . Hogg
and Yang40 suggest that well secondary depths of 1.5–10 kT are necessary to induce flocculation,
5/17/2018 Nano Science_ Colloidal and Inter Facial Aspects - slidepdf.com
http://slidepdf.com/reader/full/nano-science-colloidal-and-inter-facial-aspects 9
Effects of Nanoparticles on Forces between Colloids in Solution 39
TABLE 2.1
Measured Critical Flocculation and Restabilization Concentration for
Experiments with Silica Nanoparticles and Polystyrene Microparticles
Polystyrene Particle Silica Nanoparticle
Diameter (µm) Diameter (nm) v* (% vol) v** (% vol)
0.41 5 2.1 5.6
7 2.0 7.3
0.96 5 2.0 3.9
7 2.8 6.0
while according to Feigin and Napper,41 barrier heights of at least 15–20 kT are needed to prevent
flocculation. Thus, according to these values, this system would be expected to flocculate, consistent
with what was observed experimentally. At 6.0% vol, the secondary barrier is increased to 26 kT ,
which would be large enough to stabilize the system against flocculation. Thus, the predicted potential
energy profiles were completely consistent with the observed stability behavior.
Recently, significant work has been performed on understanding the phase behavior of asymmetricbinary hard sphere mixtures. While the behavior of simple hard sphere mixtures (single particle size)
is well described, the behavior of binary mixtures (two different particles sizes) is much more complex
and depends greatly on the size ratio between the large and small spheres, q. A good review of work
in this field is provided by Dijkstra et al.,42 who used Monte-Carlo simulations to study the behavior
of binary systems over values of q ranging from nearly 0 to 1.0. The authors found a broad fluid–
solid coexistence for systems with q ≤ 1, a metastable fluid–fluid transition for q ≤ 0.1, and a stable
solid–solid coexistence for q ≤ 0.05. In the limit of q → 0, the phase diagram approached that of
Separation (nm)
0 20 40 60
E n e r g y
( k T )
–10
0
10
20
30
40
2.1% vol
6.0% vol
Secondary energy barriers
Secondary energy wells
FIGURE 2.5 Total interaction energy profile between two 0.41-µm-diameter polystyrene particles in the
presence of 5-nm-diameter nanoparticles. The macromolecule concentrations are as indicated. (From Sharma,
A. et al. J. Colloid Interface Sci. 1997, 190, 392. With permission from Elsevier.)
5/17/2018 Nano Science_ Colloidal and Inter Facial Aspects - slidepdf.com
http://slidepdf.com/reader/full/nano-science-colloidal-and-inter-facial-aspects 1
40 Nanoscience
a single sphere system with a net attractive potential between the spheres (similar to the systems
described before with attraction depletion interactions).
Adams et al.43,44 and Dogic et al.45,46 studied extensively the effects of nonadsorbing nanospheres
and polymers on the long-range ordering of a suspension of colloidal rods. By varying the amount of
nonadsorbing species, various rod/sphere microstructures could be obtained. Lekkerkerker et al.47−56
performed theoretical and experimental investigations on a variety of biomorphic systems, including
suspensions containing combinations of spheres, rods, and platelets of varying sizes. In many of these systems, a depletion force was thought to be the underlying cause of the observed microphases.
Bates and Frenkel57 used computer simulations and perturbation theory to predict the phase behavior
of colloidal plates, modeled as infinitely thin disks, and a nonadsorbed polymer. Isotropic fluid–
fluid coexistence, in addition to isotropic–nematic transition, was predicted. Simulations on a similar
system were performed by Zhang et al.58 using scaled particle theory. Chen and Schweizer59 used
liquid-state integral equation methods to investigate the thermodynamic and structural properties of
mixtures of hard and repulsive rigid rods with hard spheres.
2.5.2 DIRECT MEASUREMENT OF DEPLETION FORCE AND ENERGY
Developments in experimental tools for detecting colloidal forces have allowed direct measurement
of the depletion force and depletion energy in a variety of experimental systems. One of the earliest
measurements was that of Richetti and Kékicheff,60 who used the surface forces apparatus (SFA)
to measure the force profile between two crossed sheets of mica in the presence of cetyltrimethy-
lammonium bromide (CTAB) micelles (the mica sheets were also coated with a layer of adsorbed
CTAB surfactant molecules, giving all surfaces a net positive charge). The authors observed a sec-
ondary attractive well, which was not predicted by Derjaguin–Landau–Verwey–Overbeek theory,
plus oscillations in the force profile that were attributed to the ordering of the micelles between the
surfaces. Some examples of other such measurements include that of Milling and Biggs,61 who used
an atomic force microscope (AFM) to measure the depletion force profile between a stearylated
silica sphere and plate in a cyclohexane solution containing poly(dimethylsiloxane) polymer, and
Mondain-Monval et al.,62 who used a chaining technique developed by Leal-Calderon et al.63 to
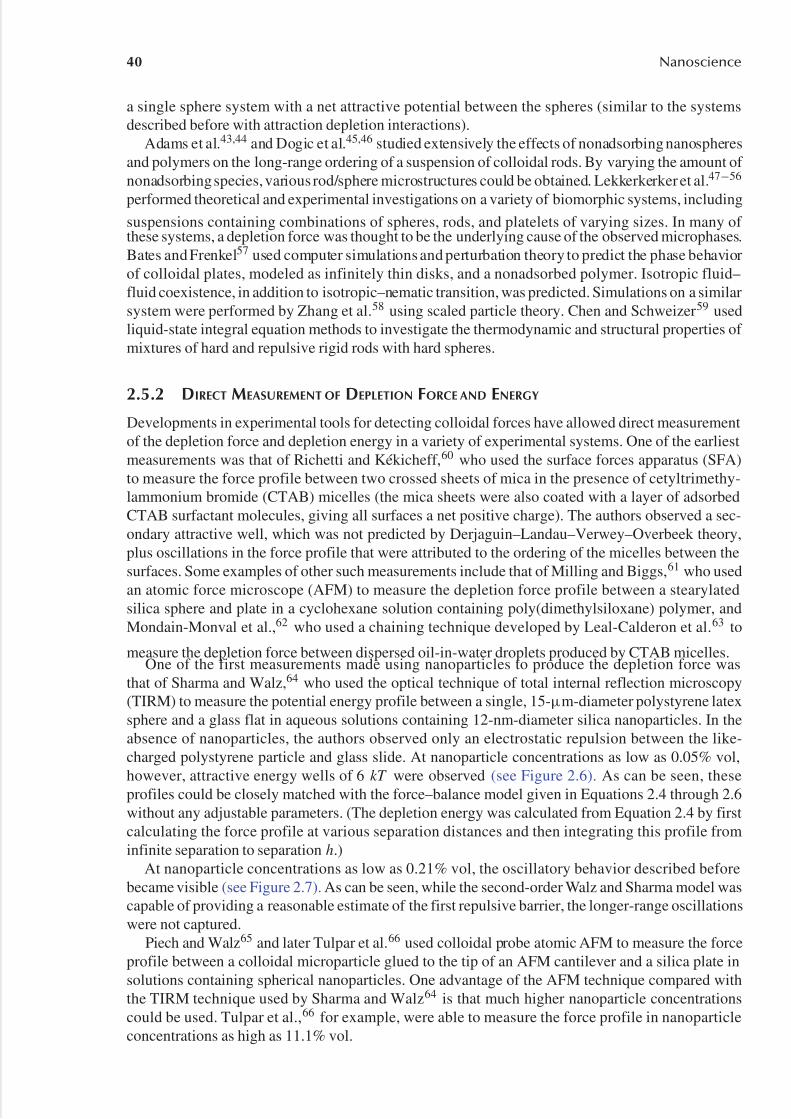
measure the depletion force between dispersed oil-in-water droplets produced by CTAB micelles.One of the first measurements made using nanoparticles to produce the depletion force was
that of Sharma and Walz,64 who used the optical technique of total internal reflection microscopy
(TIRM) to measure the potential energy profile between a single, 15-µm-diameter polystyrene latex
sphere and a glass flat in aqueous solutions containing 12-nm-diameter silica nanoparticles. In the
absence of nanoparticles, the authors observed only an electrostatic repulsion between the like-
charged polystyrene particle and glass slide. At nanoparticle concentrations as low as 0.05% vol,
however, attractive energy wells of 6 kT were observed (see Figure 2.6). As can be seen, these
profiles could be closely matched with the force–balance model given in Equations 2.4 through 2.6
without any adjustable parameters. (The depletion energy was calculated from Equation 2.4 by first
calculating the force profile at various separation distances and then integrating this profile from
infinite separation to separation h.)
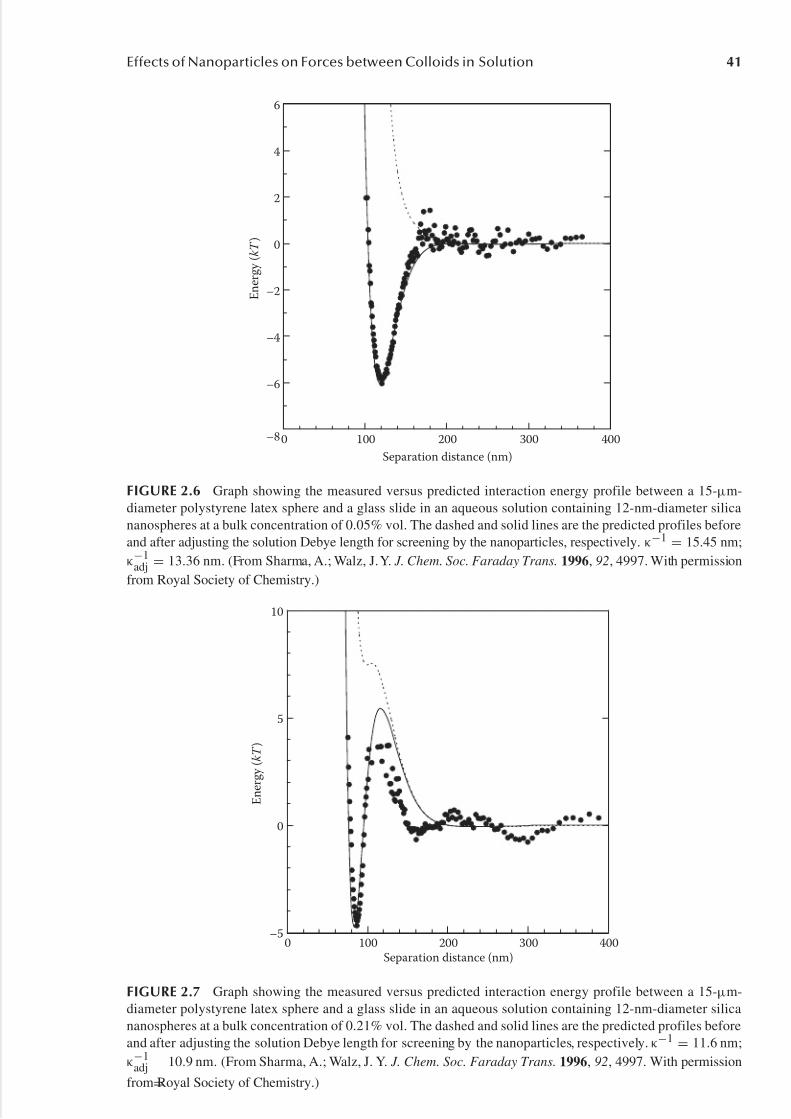
At nanoparticle concentrations as low as 0.21% vol, the oscillatory behavior described before
became visible (see Figure 2.7). As can be seen, while the second-order Walz and Sharma model was
capable of providing a reasonable estimate of the first repulsive barrier, the longer-range oscillations
were not captured.
Piech and Walz65 and later Tulpar et al.66 used colloidal probe atomic AFM to measure the force
profile between a colloidal microparticle glued to the tip of an AFM cantilever and a silica plate in
solutions containing spherical nanoparticles. One advantage of the AFM technique compared with
the TIRM technique used by Sharma and Walz64 is that much higher nanoparticle concentrations
could be used. Tulpar et al.,66 for example, were able to measure the force profile in nanoparticle
concentrations as high as 11.1% vol.
5/17/2018 Nano Science_ Colloidal and Inter Facial Aspects - slidepdf.com
http://slidepdf.com/reader/full/nano-science-colloidal-and-inter-facial-aspects 1
Effects of Nanoparticles on Forces between Colloids in Solution 41
Separation distance (nm)
0 100 200 300 400
E n e r g y
( k T )
–8
–6
–4
–2
0
2
4
6
FIGURE 2.6 Graph showing the measured versus predicted interaction energy profile between a 15-µm-
diameter polystyrene latex sphere and a glass slide in an aqueous solution containing 12-nm-diameter silica
nanospheres at a bulk concentration of 0.05% vol. The dashed and solid lines are the predicted profiles before
and after adjusting the solution Debye length for screening by the nanoparticles, respectively. κ−1 = 15.45 nm;
κ−1adj
= 13.36 nm. (From Sharma, A.; Walz, J. Y. J. Chem. Soc. Faraday Trans. 1996, 92, 4997. With permission
from Royal Society of Chemistry.)
Separation distance (nm)0 100 200 300 400
E n e r g y
( k T )
–5
0
5
10
FIGURE 2.7 Graph showing the measured versus predicted interaction energy profile between a 15-µm-
diameter polystyrene latex sphere and a glass slide in an aqueous solution containing 12-nm-diameter silica
nanospheres at a bulk concentration of 0.21% vol. The dashed and solid lines are the predicted profiles before
and after adjusting the solution Debye length for screening by the nanoparticles, respectively. κ−1 = 11.6 nm;
κ−1adj
=10.9 nm. (From Sharma, A.; Walz, J. Y. J. Chem. Soc. Faraday Trans. 1996, 92, 4997. With permission
from Royal Society of Chemistry.)
5/17/2018 Nano Science_ Colloidal and Inter Facial Aspects - slidepdf.com
http://slidepdf.com/reader/full/nano-science-colloidal-and-inter-facial-aspects 1
42 Nanoscience
Separation (nm)
0 100 200 300
F o r c e / R ( m N - m – 1 )
0.0
0.1
0.2
0.3
0.4
5.4% vol.
6.4% vol.
8.1% vol.
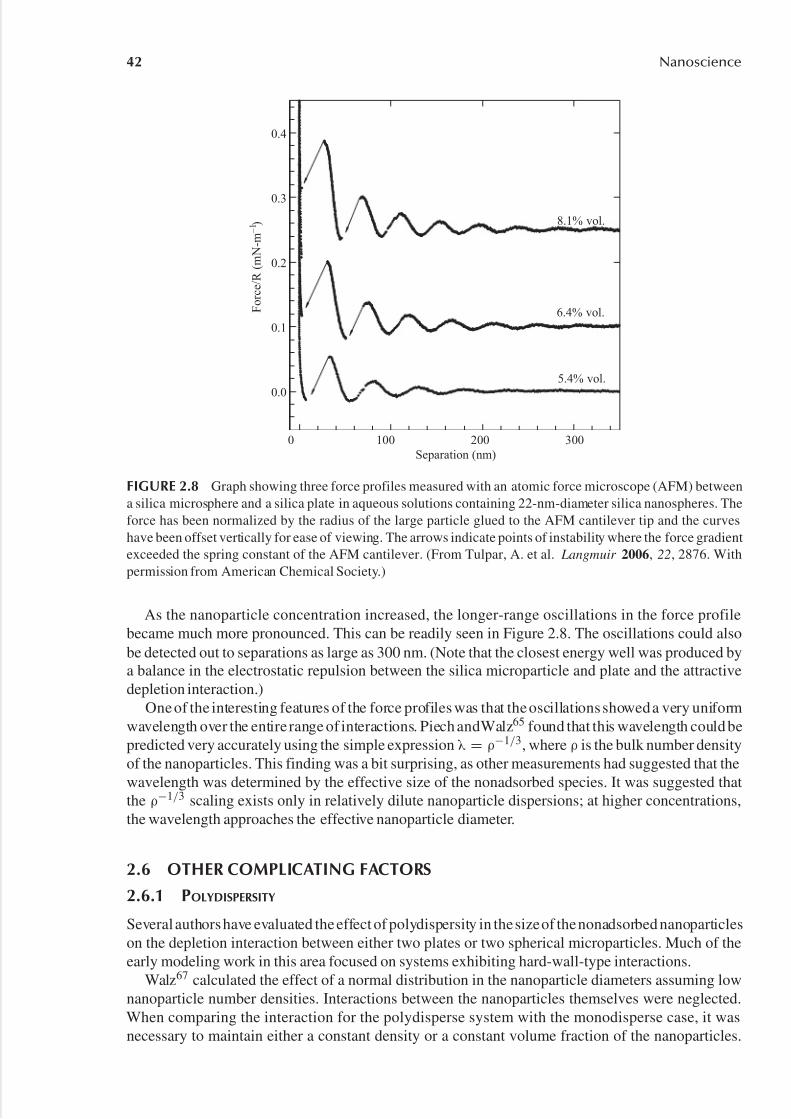
FIGURE 2.8 Graph showing three force profiles measured with an atomic force microscope (AFM) between
a silica microsphere and a silica plate in aqueous solutions containing 22-nm-diameter silica nanospheres. The
force has been normalized by the radius of the large particle glued to the AFM cantilever tip and the curves
have been offset vertically for ease of viewing. The arrows indicate points of instability where the force gradient
exceeded the spring constant of the AFM cantilever. (From Tulpar, A. et al. Langmuir 2006, 22, 2876. With
permission from American Chemical Society.)
As the nanoparticle concentration increased, the longer-range oscillations in the force profile
became much more pronounced. This can be readily seen in Figure 2.8. The oscillations could also
be detected out to separations as large as 300 nm. (Note that the closest energy well was produced by
a balance in the electrostatic repulsion between the silica microparticle and plate and the attractive
depletion interaction.)
One of the interesting features of the force profiles was that the oscillations showed a very uniform
wavelength over the entire range of interactions. Piech andWalz65 found that this wavelength could be
predicted very accurately using the simple expressionλ = ρ−1/3, where ρ is the bulk number density
of the nanoparticles. This finding was a bit surprising, as other measurements had suggested that the
wavelength was determined by the effective size of the nonadsorbed species. It was suggested that
the ρ−1/3 scaling exists only in relatively dilute nanoparticle dispersions; at higher concentrations,
the wavelength approaches the effective nanoparticle diameter.
2.6 OTHER COMPLICATING FACTORS
2.6.1 POLYDISPERSITY
Several authors have evaluated the effect of polydispersity in the size of the nonadsorbed nanoparticles
on the depletion interaction between either two plates or two spherical microparticles. Much of the
early modeling work in this area focused on systems exhibiting hard-wall-type interactions.
Walz67 calculated the effect of a normal distribution in the nanoparticle diameters assuming low
nanoparticle number densities. Interactions between the nanoparticles themselves were neglected.
When comparing the interaction for the polydisperse system with the monodisperse case, it was
necessary to maintain either a constant density or a constant volume fraction of the nanoparticles.
5/17/2018 Nano Science_ Colloidal and Inter Facial Aspects - slidepdf.com
http://slidepdf.com/reader/full/nano-science-colloidal-and-inter-facial-aspects 1
Effects of Nanoparticles on Forces between Colloids in Solution 43
Interestingly, the direction of the change in the depletion attraction was different for the two cases.
At fixed nanoparticle number density, Walz67 found that increasing the degree of polydispersity
increased the magnitude of the depletion attraction, while at constant volume fraction the effect was
the opposite (i.e., the depletion attraction decreased with increasing polydispersity). Each of these
trends can be understood by considering the dependence of the depletion energy on the nanoparticle
sizeand concentration at small separations (h
→0)expressed in Equation2.2, which is approximately
ρ∞a2 R. Rewriting this in terms of the nanoparticle volume fraction, φ, yields a scaling of φ R
a. Atconstant number density, the a2 dependence on nanoparticle radius would increase the interaction
with increasing polydispersity, assuming a symmetrical distribution in size (i.e., the large radius
nanoparticles are more heavily weighted). On the other hand, at constant volume fraction, the a−1
dependence means that the smaller nanoparticles would be more heavily weighted. In both cases,
increasing polydispersity increased the range of the depletion interaction.
At increasing nanoparticle concentrations, polydispersity also affects the ordering of the nanopar-
ticles in the gap region, such that the structural interaction is altered. Nikolov and Wasan68 observed
that thin liquid films containing two different sizes of silica nanospheres were less stable than those
containing a single size of nanoparticles. Mao69 studied the effect of polydispersity on the depletion
interaction between two spherical particles in hard sphere systems in which the nanoparticle size
was distributed log-normally. It was found that both the depth of the attractive depletion well and theheight of the repulsive barrier decreased with increasing polydispersity when the nanoparticle vol-
ume fraction was held constant. A similar result was observed by Chu et al.70 using a Percus–Yevick
solution to the Ornstein–Zernike equation.
Piech and Walz71 modified the force–balance model of Walz and Sharma9 to allow for a log-
normal distribution in either the size or the electric surface potential of the nonadsorbed spherical
nanoparticles in charged systems. For the case of a distribution in nanoparticle size, comparisons with
the monodisperse case were again made under the conditions of either constant nanoparticle number
density or nanoparticle volume fraction. At constant volume fraction, polydispersity decreased the
magnitude of both the depletion attraction and the longer-range repulsion between two identical
spherical microparticles. At constant number density, increasing polydispersity actually increased
the magnitude of the long-range repulsion, although the effect on both the attraction and repulsion
was much smaller than the case of constant volume fraction. Polydispersity in the magnitude of theelectric surface potential of the nanoparticles was found to decrease the magnitude of the attractive
and repulsive components of the energy profile; however, the effect was surprisingly small.
In a separate work, Piech and Walz72 used the AFM to measure the effect of polydispersity in
nanoparticle size and surface potential on the interaction force profile between a 3.5-µm-diameter
silica sphere and a silica plate in an aqueous solution containing silica and polystyrene nanoparticles.
To create polydispersity in nanoparticle size, mixtures of two different-sized silica nanoparticles
were created (21 and 31 nm), while to create polydispersity in surface potential, similarly sized
polystyrene and silica nanoparticles were used. The trends in the magnitude of the depletion attraction
and repulsion were the same as those predicted using the modified force–balance model.
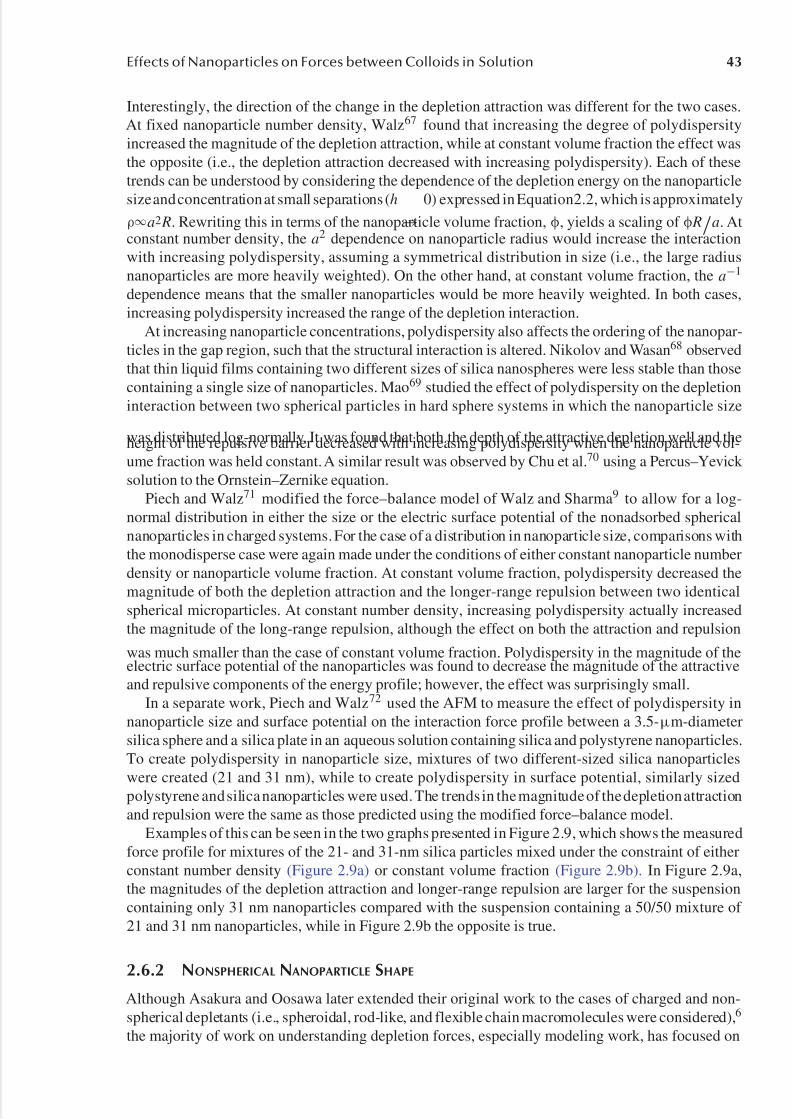
Examples of this can be seen in the two graphs presented in Figure 2.9, which shows the measured
force profile for mixtures of the 21- and 31-nm silica particles mixed under the constraint of either
constant number density (Figure 2.9a) or constant volume fraction (Figure 2.9b). In Figure 2.9a,
the magnitudes of the depletion attraction and longer-range repulsion are larger for the suspension
containing only 31 nm nanoparticles compared with the suspension containing a 50/50 mixture of
21 and 31 nm nanoparticles, while in Figure 2.9b the opposite is true.
2.6.2 NONSPHERICAL NANOPARTICLE SHAPE
Although Asakura and Oosawa later extended their original work to the cases of charged and non-
spherical depletants (i.e., spheroidal, rod-like, and flexible chain macromolecules were considered),6
the majority of work on understanding depletion forces, especially modeling work, has focused on
5/17/2018 Nano Science_ Colloidal and Inter Facial Aspects - slidepdf.com
http://slidepdf.com/reader/full/nano-science-colloidal-and-inter-facial-aspects 1
44 Nanoscience
Separation (nm)
35 70 105 140 175 210 245
F o r c e / r a d i u s ( m N / m )
–5.0e-3
–2.5e-3
0.0
2.5e-3
5.0e-3
7.5e-3(a)
(b)
21 nm: 100%21/31 nm: 50/50%31 nm: 100%
1.2 mM KNO3
Solution composition
Separation (nm)
30 60 90 120 150 180 210
F o r c e / r a d i u s ( m N / m )
–1.2e-2
–6.0e-3
0.0
6.0e-3
1.2e-2
1.8e-2
21 nm: 100%21/31 nm: 50/50%
31 nm: 100%
0.87 mM KNO3
Solution composition
FIGURE 2.9 Effect of polydipsersity in nanoparticle diameter on the depletion interaction between a 3.5-µm-
diameter silica particle and a silica substrate in KNO3 solutions at pH = 4.0. Force curves are shown for
nanoparticle-free solution (cross-hair symbols) and suspensions with different proportions of smaller (21-nm-
dimameter polystyrene) and larger (31-nm-diameter polystyrene) nanoparticles with (a) nanoparticle number
density held constant at 2.0 × 10²¹ nanoparticles/m3 and (b) nanoparticle volume fraction held constant at 2.4%
vol. (From Piech, M.; Walz, J. Y. J. Colloid Interface Sci. 2002, 253, 117. With permission from Elsevier.)
hard, spherical nanoparticles. Only very recently have rod-like nanoparticles and macromolecules
been considered, although such shapes are present in a variety of natural and synthetic systems.
Mao et al.73 investigated the depletion interaction between two large spherical particles of radius
R in a solution of mutually avoiding thin hard rods of length L, diameter D, and bulk number density
ρ∞. The osmotic pressure exerted on a wall by a solution of such rods was calculated from the
density of rod ends in contact with the wall. The magnitude of the attraction at contact between
the spheres was of order ρ∞kTRL2, which is the same scaling as the depletion energy produced by
small nanospheres with diameter equal to the rod length. As expected, because the number density
of rods can greatly exceed the number density of spheres at the same volume fraction, much larger
attractions were possible with the rods. This was confirmed experimentally by Koenderink et al.74
who found evidence for a depletion-induced fluid–solid transition in a mixture of silica spheres and
silica-coated boehmite rods in dimethylformamide solutions at rod concentrations well below the
isotropic–nematic transition.
Ina later work, Mao et al.75 solved a self-consistent integral equation describing the density profile
of rods between two parallel plates and then extended this result to the interaction of two spherical
particles using the Derjaguin approximation. Their calculations, correct to the third order in rod
concentration, indicated that typical colloidal sphere/rod mixtures will exhibit a smaller repulsive
barrier than the thermal energy, kT , throughout the semidilute concentration range of the rods. It
5/17/2018 Nano Science_ Colloidal and Inter Facial Aspects - slidepdf.com
http://slidepdf.com/reader/full/nano-science-colloidal-and-inter-facial-aspects 1
Effects of Nanoparticles on Forces between Colloids in Solution 45
should be noted, however, that these calculations were only valid in the limit of L/ D 1 and were
subject to corrections of order D / L.
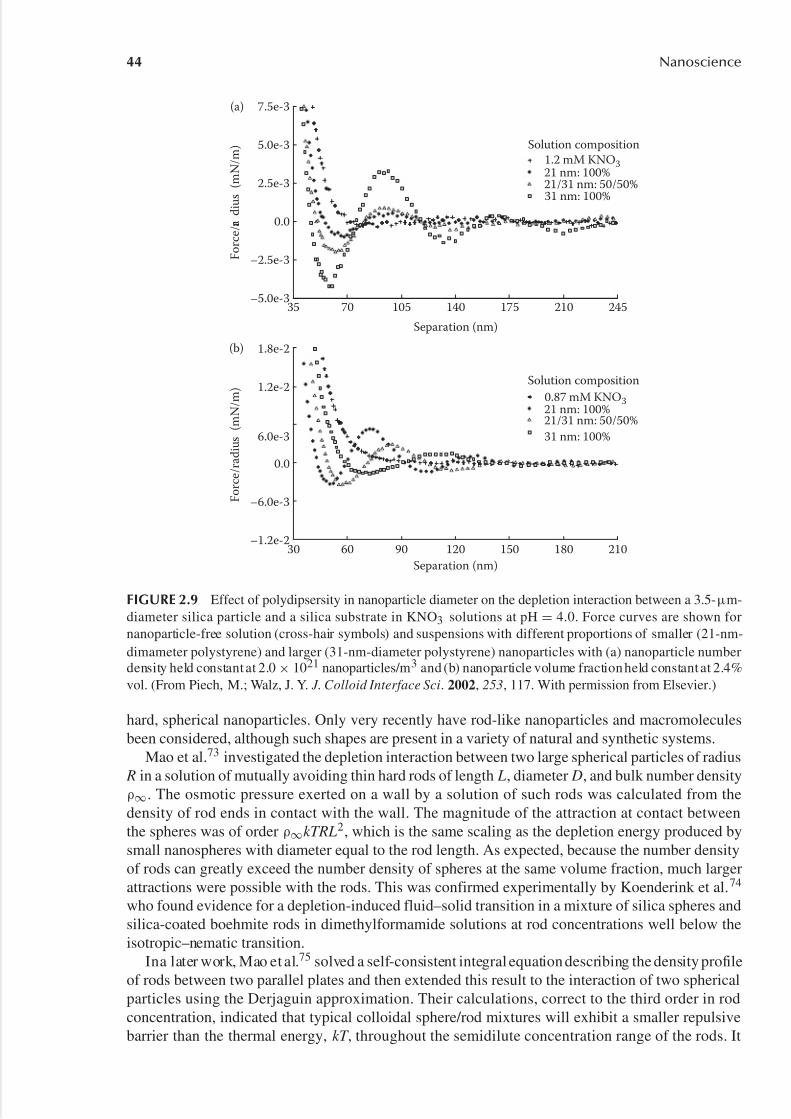
PiechandWalz76 extendedthe force–balance model of Walz and Sharma9 to calculate the depletion
interaction between two spherical microparticles in a solution containing spheroidal nanoparticles.
One of the advantages of the general spheroidal shape was that a range of shapes (e.g., needles,
thin disks, spheres, and prolate or oblate spheroids of arbitrary aspect ratio) could be represented by
simply varying the size parameters. The model was correct to first order in nanoparticle concentra-tion, meaning that interactions between the nanoparticles themselves were not considered; however,
electrostatic interactions between the spherical particles and nanoparticles were included using the
perturbation expansion method of Hsu and Liu.77,78
The primary difficulty in modeling depletion interactions produced by nonspherical nanoparticles
is that the various interactions now depend not only on separation but also on orientation. Piech and
Walz assumed that the interparticle depletion force produced by different nanoparticle orientations
could be added together (valid at low nanoparticles densities). Thus, the force–balance equation
(Equations 2.4 and 2.5) was modified as
F
= Ω
x1
ρ
∞exp−
E 1(x1,Ω)+ E 2(x2,Ω)
kT E (x1,Ω) dx1 dΩ, (2.7)
whereΩ is the orientation of a nanoparticle located at position x1 (see Figure 2.10). While the form
of the equation is similar to that for purely spherical nanoparticles presented before, the fact that the
integration must be carried out over all positions and orientations makes the calculation much more
time consuming.
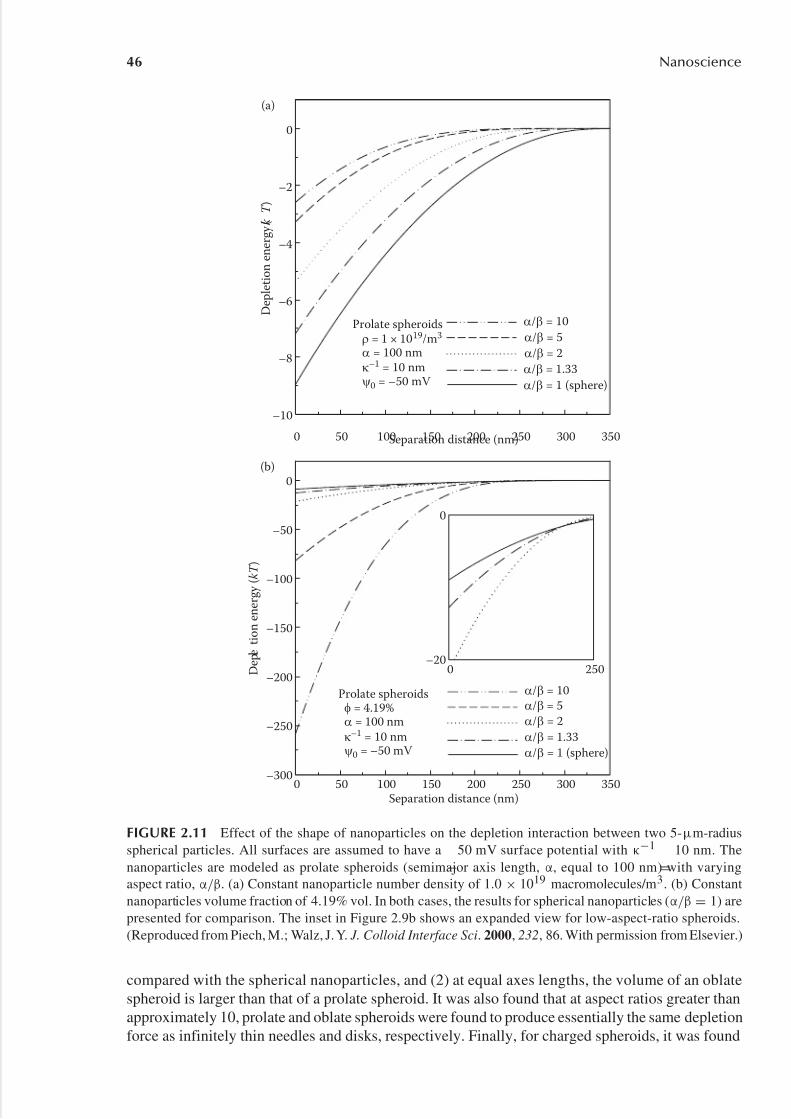
Piech and Walz found that at constant number density, the magnitude of the depletion attraction
decreased with increasing aspect ratio, assuming that the semimajor axis length, α, remains fixed (see
Figure 2.11). At constant volume fraction, however, the opposite was true. In addition, at constant
volume fraction, the attraction produced by prolate spheroids was larger than that of the oblate
spheroids of equal axis lengths. The results could be explained by the fact that (1) rod-like or disk-
like nanoparticles could more easily access the gap regions between two spherical particles when
E 1(x1)
Rh
1 2
β α Ω
ρ∞
E 2(x2)
FIGURE 2.10 Schematic showing the interaction of two spherical microparticles in a solution of prolate
spheroids. E 1 and E 2 represent the interaction energy between a spheroid and particles 1 and 2, respectively,
while Ω is the orientation of the spheroid at position x1. The bulk number density of spheroids is ρ∞ and the
parameters α and β represent the semimajor and semiminor axes, respectively.
5/17/2018 Nano Science_ Colloidal and Inter Facial Aspects - slidepdf.com
http://slidepdf.com/reader/full/nano-science-colloidal-and-inter-facial-aspects 1
46 Nanoscience
Separation distance (nm)0 50 100 150 200 250 300 350
D e p
l e t i o n e n e r g y
( k
T )
–10
–8
–6
–4
–2
0
(a)
(b)
α/β = 10
α/β = 5
α/β = 2
α/β = 1.33
α/β = 1 (sphere)
Prolate spheroidsρ = 1 × 10¹⁹/m3
α = 100 nmκ–1 = 10 nmψ0 = –50 mV
Separation distance (nm)0 50 100 150 200 250 300 350
D e p
l e t i o n e n e r g y
( k T )
–300
–250
–200
–150
–100
–50
0
α/β = 10
α/β = 5
α/β = 2
α/β = 1.33
α/β = 1 (sphere)
0 250–20
0
Prolate spheroidsφ = 4.19%α = 100 nm
κ–1 = 10 nmψ0 = –50 mV
FIGURE 2.11 Effect of the shape of nanoparticles on the depletion interaction between two 5-µm-radius
spherical particles. All surfaces are assumed to have a
−50 mV surface potential with κ−1
=10 nm. The
nanoparticles are modeled as prolate spheroids (semimajor axis length, α, equal to 100 nm) with varying
aspect ratio, α/β. (a) Constant nanoparticle number density of 1.0 × 10¹⁹ macromolecules/m3. (b) Constant
nanoparticles volume fraction of 4.19% vol. In both cases, the results for spherical nanoparticles (α/β = 1) are
presented for comparison. The inset in Figure 2.9b shows an expanded view for low-aspect-ratio spheroids.
(Reproduced from Piech, M.; Walz, J. Y. J. Colloid Interface Sci. 2000, 232, 86. With permission from Elsevier.)
compared with the spherical nanoparticles, and (2) at equal axes lengths, the volume of an oblate
spheroid is larger than that of a prolate spheroid. It was also found that at aspect ratios greater than
approximately 10, prolate and oblate spheroids were found to produce essentially the same depletion
force as infinitely thin needles and disks, respectively. Finally, for charged spheroids, it was found
5/17/2018 Nano Science_ Colloidal and Inter Facial Aspects - slidepdf.com
http://slidepdf.com/reader/full/nano-science-colloidal-and-inter-facial-aspects 1
Effects of Nanoparticles on Forces between Colloids in Solution 47
that once the thickness of the charged double-layer became greater than the length of the semimajor
and semiminor axes of the spheroids (either prolate or oblate spheroids), the depletion interaction
became essentially the same as that produced by spheres with a radius equal to the semimajor axis
length.
2.7 SUMMARY AND FUTURE CHALLENGESThanks to advances in both computing power and techniques for detecting colloidal forces, a tremen-
dous amount of progress has been made in understanding how the presence of nanoparticles in
solution alters the interactions between larger colloidal particles. Models incorporating the effects of
charge, nanoparticle concentration, polydispersity, and nanoparticle shape have been developed and
tested.
Nonetheless, there are still numerous areas in which substantial research is still needed. One
such area, for example, is the impact of these nanoparticles on the hydrodynamic interaction of the
particles. Although clearly not a simple problem, some recent experimental and theoretical work has
already been performed.79−81
Perhaps even more fruitful is the topic of finding new applications for the depletion interaction.
As mentioned earlier, it has already been used by researchers as a tool for precisely controllinginterparticle potentials in studies focused on colloidal crystallization or even a novel separation
scheme. The unique attributes of the interaction should, however, offer the potential for use in select
commercial processes. For example, Weronski et al.82 showed that depletion forces could be used
to control the rate of transport of colloidal size particles through a porous bed, which offers the
possibility of a novel particle separation tool.
Several researchers performed investigations using the interaction as a tool for controlling the
self-assembly of colloidal particles. For example, Lin et al.83 used dissolved nonadsorbing polymers
to assemble particles onto a patterned substrate. In order to maximize the free volume of the sys-
tem, the particles were preferentially pushed into corners or against walls on the substrate. One of
the attractions of using the depletion interaction to control self-assembly is that the magnitude of
the attraction can be easily tuned with specific solution parameters. For example, Savage et al.84
performed an experimental study in which surfactant micelles were used to induce crystallization of colloidal spheres above a solid surface. Because the size and concentration of the micelles, which
induced a depletion attraction between the colloidal particles and plate, were sensitive to the solution
temperature, the authors were able to induce either crystal formation or melting by simply altering
the system temperature. The ability to precisely and reversibly manipulate colloidal forces in this
manner could be extremely useful in controlling the self-assembly of the particles.
REFERENCES
1. Traube, I. Gummi Ztg. 1925, 39, 434, 1647.
2. Bondy, C. Trans. Faraday Soc. 1939, 35, 1093.
3. Vester, C. F. Kolloid-Z . 1938, 84, 63.
4. Twiss, D. F.; Carpenter, A. S. Proc. Rubber Technol. Conf. Lond. II 1938, 81.
5. Asakura, S.; Oosawa, F. J. Chem. Phys. 1954, 22, 1255.
6. Asakura, S.; Oosawa, F. J. Polym. Sci. 1958, 33, 183.
7. Kim, A. J.; Biancaniello, P. L.; Crocker, J. C. Langmuir 2006, 22, 1991.
8. Pham, K. N.; Egelhaaf, S. U.; Pusey, P. N.; Poon, W. C. K. Phys. Rev. E 2004, 69, 011503.
9. Walz, J. Y.; Sharma, A. J. Colloid Interface Sci. 1994, 168, 485.
10. Piech, M.; Walz, J. Y. Langmuir 2000, 16 , 7985.
11. Odiachi, P. C.; Prieve, D. C. Colloids Surf. A 1999, 146 , 315.
12. Bellemans, A. Physica 1962, 28, 617.
13. Fischer, J. Mol. Phys. 1977, 33, 75.
14. Glandt, E. D. J. Colloid Interface Sci. 1980, 77 , 512.
5/17/2018 Nano Science_ Colloidal and Inter Facial Aspects - slidepdf.com
http://slidepdf.com/reader/full/nano-science-colloidal-and-inter-facial-aspects 1
48 Nanoscience
15. Botzelmann, B.; Evans, R.; Dietrich, S. Phys. Rev. E 1998, 57 , 6785.
16. Roth, R.; Evans, R.; Dietrich, S. Phys. Rev. E 2000, 62, 5360.
17. Bechinger, C.; Rudhardt, D.; Leiderer, P.; Roth, R.; Dietrich, S. Phys. Rev. Lett . 1999, 83, 3960.
18. Biben, T.; Hansen, J. P. J. Phys. Condens. Matter 1991, 3, F65.
19. Biben, T.; Hansen, J. P. Phys. Rev. Lett . 1991, 66 , 2215.
20. Biben, T.; Bladon, P.; Frenkel, D. J. Phys. Condens. Matter 1996, 8, 10799.
21. Louis, A. A.; Allahyarov, E.; Lowen, H.; Roth, R. Phys. Rev. E 2002
, 65, 061407.22. Jonsson, B.; Broukhno, A.; Forsman, J.; Akesson, T. Langmuir 2003, 19, 9914.
23. Li-in-on, F. K.; Vincent, B.; Waite, F. A. ACS Symp. Ser ., 1975, 9, 165.
24. Cowell, C.; Li-in-on, R.; Vincent, B. J. Chem. Soc. Faraday Trans. 1978, 74, 337.
25. Sperry, P. R.; Hopfenberg, H. B.; Thomas, N. L. J. Colloid Interface Sci. 1993, 82, 62.
26. Sperry, P. R. J. Colloid Interface Sci. 1982, 87 , 375.
27. Seebergh, J. E.; Berg, J. C. Langmuir 1994, 10, 454.
28. De Hek, H.; Vrij, A. J. Colloid Interface Sci. 1979, 70, 592.
29. De Hek, H.; Vrij, A. J. Colloid Interface Sci. 1981, 84, 409.
30. Clarke, J.; Vincent, B. J. Colloid Interface Sci. 1981, 82, 208.
31. Vincent, B.; Clarke, J.; Barnett, K. G. Colloids Surf . 1986, 17 , 51.
32. Vincent, B.; Edwards, J.; Emmet, S.; Croot, R. Colloids Surf . 1988, 31, 267.
33. Ye, X.; Narayanan, T.; Tong, P.; Huang, J. S.; Lin, M. Y.; Carvalho, B. L.; Fetters, L. J. Phys. Rev. E 1996,
54, 6500.34. Cockbain, E. G. Trans. Faraday Soc. 1952, 4, 185.
35. Ma, C. Colloids Surf . 1987, 28, 1.
36. Aronson, M. P. Langmuir 1989, 5, 494.
37. Aronson, M. P. Colloids Surf . 1991, 58, 195.
38. Bibette, J.; Roux, D.; Nallet, F. Phys. Rev. Lett . 1990, 65, 2470.
39. Sharma, A.; Tan, S.; Walz, J.Y. J. Colloid Interface Sci. 1997, 190, 392.
40. Hogg, R.;Yang, K. C. J. Colloid Interface Sci. 1976, 56 , 573.
41. Feigin, R. I.; Napper, D. H. J. Colloid Interface Sci. 1980, 75, 525.
42. Dijkstra, M.; van Roij, R.; Evans, R. Phys. Rev. E 1999, 59, 5744.
43. Adams, M.; Dogic, Z.; Keller, S. L.; Fraden, S. Nature 1998, 393, 349.
44. Adams, M.; Fraden, S. Biophys. J. 1998, 74, 669.
45. Dogic, Z.; Frenkel, D.; Fraden, S. Phys. Rev. E 2000, 62, 3925.
46. Dogic, Z.; Purdy, K. R.; Grelet, E.; Adams, M.; Fraden, S. Phys. Rev. E 2004, 69, 051702/1.
47. Lekkerkerker, H. N. W.; Coulon, P.; Van der Haegen, R.; Deblieck, R. J. Chem. Phys. 1984, 80, 3427.
48. van der Kooij, F. M.; Lekkerkerker, H. N. W. Langmuir 2000, 16 , 10144.
49. van der Kooij, F. M.; Lekkerkerker, H. N. W. Phys. Rev. Lett. 2000, 84, 781.
50. van der Kooij, F. M.; van der Beek, D.; Lekkerkerker, H. N. W. J. Phys. Chem. B 2001, 105, 1696.
51. van der Kooij, F. M.; Vogel, M.; Lekkerkerker, H. N. W. Phys. Rev. E 2000, 62, 5397.
52. van der Beek, D.; Lekkerkerker, H. N. W. Langmuir 2004, 20, 8582.
53. Oversteegen, S. M.; Lekkerkerker, H. N. W. Phys. Rev. E 2003, 68, 021404/1.
54. Oversteegen, S. M.; Lekkerkerker, H. N. W. J. Chem. Phys. 2004, 120, 2470.
55. Oversteegen, S. M.; Vonk, C.; Wijnhoven, J. E. G. J.; Lekkerkerker, H. N. W. Phys. Rev. E 2005, 71,
041406/1.
56. Oversteegen, S. M.; Wijnhoven, J. G. E. J.; Vonk, C.; Lekkerkerker, H. N. W. J. Phys. Chem. B 2004, 108,
18158.57. Bates, M. A.; Frenkel, D. Phys. Rev. E 2000, 62, 5225.
58. Zhang, S.-D.; Reynolds, P. A.; Van Duijneveldt, J. S. Mol. Phys. 2002, 100, 3041.
59. Chen, Y.-L.; Schweizer, K. S. J. Chem. Phys. 2002, 117 , 1351.
60. Richetti, P.; Kékicheff, P. Phys. Rev. Lett . 1992, 68, 1951.
61. Milling, A.; Biggs, S. J. Colloid Interface Sci. 1995, 170, 604.
62. Mondain-Monval, O.; Leal-Calderon, F.; Phillip, J.; Bibetter, J. Phys. Rev. Lett . 1995, 75, 3364.
63. Leal-Calderon, F.; Stora, T.; Mondain-Monval, O.; Poulin, P.; Bibette, J. Phys. Rev. Lett . 1994, 72, 2959.
64. Sharma, A.; Walz, J. Y. J. Chem. Soc. Faraday Trans. 1996, 92, 4997.
65. Piech, M.; Walz, J. Y. J. Phys. Chem. B 2004, 108, 9177.
66. Tulpar, A.; Van Tassel, P. R.; Walz, J. Y. Langmuir 2006, 22, 2876.
5/17/2018 Nano Science_ Colloidal and Inter Facial Aspects - slidepdf.com
http://slidepdf.com/reader/full/nano-science-colloidal-and-inter-facial-aspects 1
Effects of Nanoparticles on Forces between Colloids in Solution 49
67. Walz, J.Y. J. Colloid Interface Sci. 1996, 178, 505.
68. Nikolov, A. D.; Wasan, D. T. Langmuir 1992, 8, 2985.
69. Mao, Y. J. Phys. II 1995, 5, 1761.
70. Chu, X. L.; Nikolov, A.; Wasan, D. T. J. Chem. Phys. 1995, 103, 6653.
71. Piech, M.; Walz, J. Y. J. Colloid Interface Sci. 2000, 225, 134.
72. Piech, M.; Walz, J. Y. J. Colloid Interface Sci. 2002, 253, 117.
73. Mao, Y.; Cates, M. E.; Lekkerkerker, H. N. W. Phys. Rev. Lett .1995
, 75, 4548.74. Koenderink, G. H.; Vliegenthart, G. A.; Kluijtmans, S. G. J. M.; van Blaaderen, A.; Philipse, A. P.;
Lekkerkerker, H. N. W. Langmuir 1999, 15, 4693.
75. Mao, Y.; Cates, M. E.; Lekkerkerker, H. N. W. J. Chem. Phys. 1997, 106 , 3721.
76. Piech, M.; Walz, J. Y. J. Colloid Interface Sci. 2000, 232, 86.
77. Hsu, J. P.; Liu, B. T. J. Colloid Interface Sci. 1997, 192, 481.
78. Hsu, J. P.; Liu, B. T. Langmuir 1998, 14, 5383.
79. Tulpar, A.; Walz, J. Y. Colloids Surf. A 2007, 300, 268.
80. Oetama, R. J.; Walz, J. Y. Langmuir 2006, 22, 8318.
81. Bhattacharya, S.; Blawzdziewicz, J.; Wajnryb, E. Phys. Fluids 2006, 18, 053301.
82. Weronski, P.; Walz, J. Y.; Elimelech, M. J. Colloid Interface Sci. 2003, 262, 372.
83. Lin, K.; Crocker, J. C.; Prasad, V.; Schofield, A.; Weitz, D. A.; Lubensky, T. C.; Yodh, A. G. Phys. Rev.
Lett . 2000, 85, 1770.
84. Savage, J. R.; Blair, D. W.; Levine, A. J.; Guyer, R. A.; Dinsmore, A. D. Science 2006, 314, 795.


![Science_-_May_2_2014 [Pages 17 - 18]](https://img.pdfslide.us/doc/110x75/577ccd3c1a28ab9e788bd9a2/science-may22014-pages-17-18.jpg)