Embed Size (px)
Citation preview
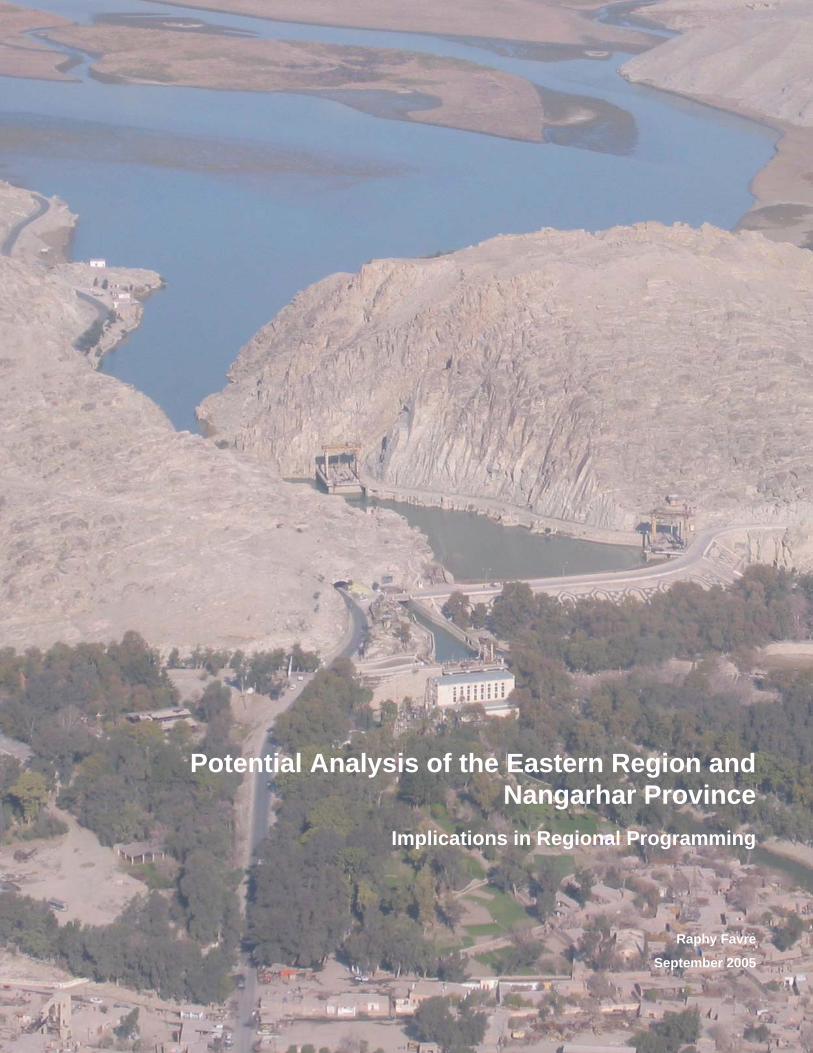
Potential Analysis of the Eastern Region and Nangarhar Province
Implications in Regional Programming
Raphy Favre
September 2005
AKNOWLEDGMENTS AND DISCLAIMER An earlier version of this paper was produced by the author in January 2005 for CNFA in view of possible involvement in development work in the eastern region of Afghanistan. This document contains the view of the author and does not necessarily represent the positions of CNFA.
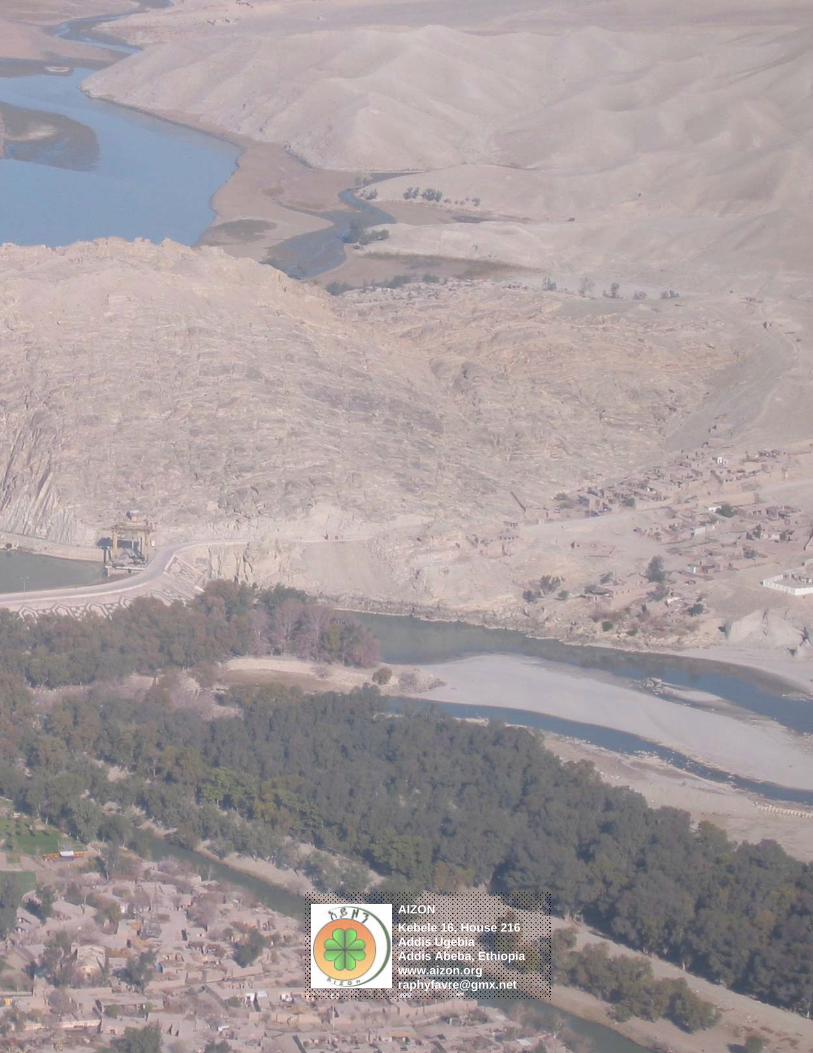
Picture Front and Back Cover Pages
Aerial view of Darunta dam, Nangarhar, 30 December 2003 Photographer: Juan Gonzales, Louis Berger Group.
1
TABLE OF CONTENT
1. FAO Regional Division
2. Region Potential Analysis
2.2 Landcover Forest Water and hydro-electricity Irrigation Proposed Check Dams Riparian Issues
2.2 Cereal Production 2.3 Cultivated Fruits 2.4 Vegetables 2.5 Other crops 2.6 Livestock 2.7 Some Projects in Nangarhar
IFHope nursery Gulestan Ltd. Olive farm and processing plant
2.8 Industrial Park 3. Main Development Issues and Conclusion
BIBLIOGRAPHY
ANNEXES
2
Tables Table 1: Availability of Farming Land by Region Table 2: Availability of Other Landcover Resources Table 3: Summary of Hydro-Power Project of the Draft Power Sector Master Plan
EIA : Environmental Impact Assessment Table 4: Formal Irrigation Scheme of Nangarhar Table 5: Comparison of Cereal Production by Region in MT Table 6 Comparison of Cultivated Fruits Production by Region in MT Table 7: Comparison of Cultivated Fruits Production by Region in MT Table 8: Comparative Advantages of Fruit Tree Cultivation in Afghanistan Table 9: Comparison of Vegetable Production by Region in MT Table 10: Comparison of Vegetable Production by Region in MT Table 11: Comparison of Vegetable Production by Region in MT Table 12: Number of cows and milking cows per family Figures Figure 1: Forest Cover Change, Nangarhar, Nuristan and Kunar provinces between
1977 and 2002 Figure 2: Market opportunities matrix on local markets (Afghanistan) Figure 3: Market opportunities matrix on the regional markets (Pakistan and India) Figure 4: Comparison of Cash Flow (all Costs included) of Adult Commercial
Orchards and Opium Poppy Figure 5: Afghanistan Import/Export of Vegetable. Source: Favre & all, 2004a Figure 6: Map of the Horticulture Products Wholesale Markets and Size of Trade Figure 7: Elevation Differential between Afghanistan and Pakistan offers Counter-
season Opportunities Pictures Pictures 1, 5: Aerial view of Darunta dam in Nangarhar (back and front page cover) Picture 2: View of dying olive orchards in Nangarhar Picture 3: Almond grafted seedlings raised on IFHope nursery in Jalalabad Picture 4: Aerial view of olive farms located above the irrigation canals Maps Map 1: FAO Regional Division of Afghanistan Map 2: Aerial View of Irrigated Area in Nangarhar Map 3: Location of Proposed Water Reservoirs
3
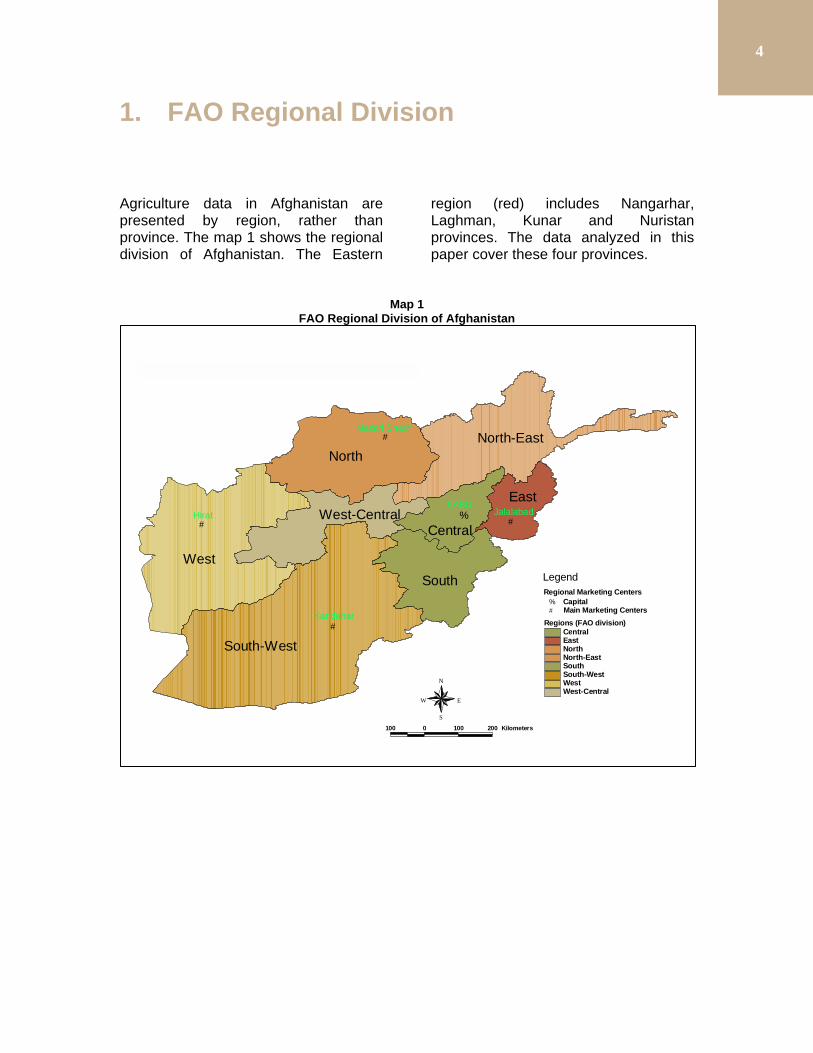
1. FAO Regional Division Agriculture data in Afghanistan are presented by region, rather than province. The map 1 shows the regional division of Afghanistan. The Eastern
region (red) includes Nangarhar, Laghman, Kunar and Nuristan provinces. The data analyzed in this paper cover these four provinces.
Map 1 FAO Regional Division of Afghanistan
# #
#
#
%
West
South-West
North
South
North-East
East
CentralWest-Central
KABUL
Mazari Sharif
Kandahar
JalalabadHirat
FAO Regional Divisions and Main Marketing Centers
N
EW
S
100 0 100 200 Kilometers
Regions (FAO division)CentralEastNorthNorth-EastSouthSouth-WestWestWest-Central
# Main Marketing Centers% Capital
Regional Marketing Centers
Legend
4

2. Region Potential Analysis
2.2 Landcover The table 1 shows that the eastern region is not a main production area in Afghanistan as it represents only 6% of the permanently irrigated land and 3% of the intermittently irrigated land. The
total irrigated land covers only 145,280 hectares. The availability of rainfed land is very small (< 1% of total) and mostly located in the upper valleys of Kunar province.
Table 1
Availability of Farming Land by Region (in ha). Source: FAO, Landcover 19931
Region Permanently Irrigated %
Intermittently Irrigated % Rainfed %
TOTAL 1559654 100 1648136 100 4517714 100 North 356375 23 414604 25 2210298 49 Northeast 255921 16 26653 2 1022384 23 West 189025 12 277445 17 858690 19 West Central 41973 3 63968 4 151823 3 Central 132022 8 41406 3 58256 1 South 223640 14 252047 15 90021 2 Southwest 262355 17 525074 32 120227 3 East 98342 6 46939 3 6014 0
Table 2
Availability of Other Landcover Resources. Source: FAO, Landcover 19932
Region Forest % Rangeland % Waterbodies % Snow % TOTAL 1337582 100 29176732 100 665750 100 1463101 100 North 47830 4 4790748 16 53702 8 33585 2 Northeast 26315 2 3500094 12 71923 11 1002909 69 West 40238 3 4549186 16 169948 26 0 0 West Central 0 0 4503436 15 13035 2 14119 1 Central 14301 1 1457932 5 2542 0 94723 6 South 402434 30 4035075 14 66344 10 12427 1 Southwest 722 0 5697093 20 276057 41 317 0 East 805740 60 643169 2 12198 2 305021 21
1 FAO, “Landcover Atlas of Afghanistan, 1993”, printed in 1999. 2 FAO, Ibid., 1999.
5
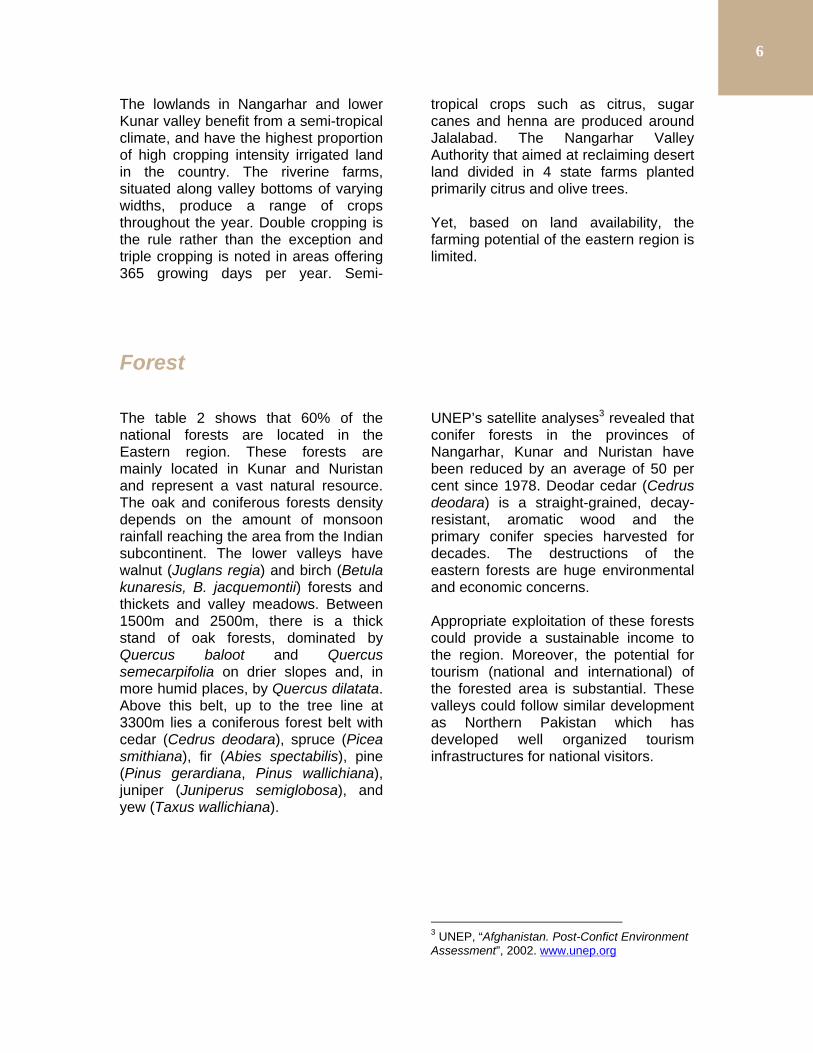
The lowlands in Nangarhar and lower Kunar valley benefit from a semi-tropical climate, and have the highest proportion of high cropping intensity irrigated land in the country. The riverine farms, situated along valley bottoms of varying widths, produce a range of crops throughout the year. Double cropping is the rule rather than the exception and triple cropping is noted in areas offering 365 growing days per year. Semi-
tropical crops such as citrus, sugar canes and henna are produced around Jalalabad. The Nangarhar Valley Authority that aimed at reclaiming desert land divided in 4 state farms planted primarily citrus and olive trees. Yet, based on land availability, the farming potential of the eastern region is limited.
Forest The table 2 shows that 60% of the national forests are located in the Eastern region. These forests are mainly located in Kunar and Nuristan and represent a vast natural resource. The oak and coniferous forests density depends on the amount of monsoon rainfall reaching the area from the Indian subcontinent. The lower valleys have walnut (Juglans regia) and birch (Betula kunaresis, B. jacquemontii) forests and thickets and valley meadows. Between 1500m and 2500m, there is a thick stand of oak forests, dominated by Quercus baloot and Quercus semecarpifolia on drier slopes and, in more humid places, by Quercus dilatata. Above this belt, up to the tree line at 3300m lies a coniferous forest belt with cedar (Cedrus deodara), spruce (Picea smithiana), fir (Abies spectabilis), pine (Pinus gerardiana, Pinus wallichiana), juniper (Juniperus semiglobosa), and yew (Taxus wallichiana).
UNEP’s satellite analyses3 revealed that conifer forests in the provinces of Nangarhar, Kunar and Nuristan have been reduced by an average of 50 per cent since 1978. Deodar cedar (Cedrus deodara) is a straight-grained, decay-resistant, aromatic wood and the primary conifer species harvested for decades. The destructions of the eastern forests are huge environmental and economic concerns. Appropriate exploitation of these forests could provide a sustainable income to the region. Moreover, the potential for tourism (national and international) of the forested area is substantial. These valleys could follow similar development as Northern Pakistan which has developed well organized tourism infrastructures for national visitors.
3 UNEP, “Afghanistan. Post-Confict Environment Assessment”, 2002. www.unep.org
6
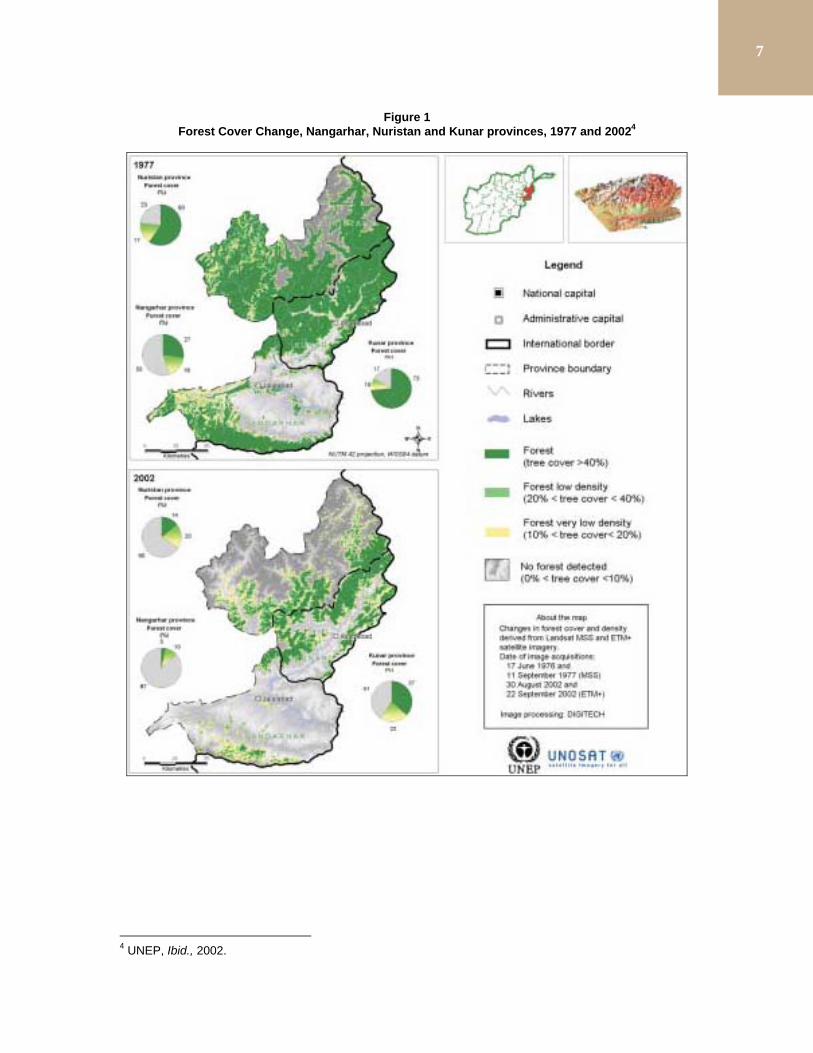
Figure 1
Forest Cover Change, Nangarhar, Nuristan and Kunar provinces, 1977 and 20024
4 UNEP, Ibid., 2002.
7
Water and hydro-electricity The Eastern region also account for 21% of the total permanent snow in the country (table 2). The whole region is part of the Kabul river basin. The watersheds of the various rivers flowing into the eastern region are much larger than the region itself. The Kunar River takes its sources on the other side of the border from glaciers in the region of the Teraj Mir Mountain (7,750 m asl) in the Karakoum range of Pakistan. The mean annual volume of river discharge for the Kabul river basin flowing into the eastern region is 21,650 mtn m3. This represents 26% of the total river discharge in the country (one quarter)5. 5 Favre, Raphy and Monowar, Golam, “Watershed Atlas of Afghanistan. Working Document for Planners”, FAO/UNDP/MIRWE/AREU/SDC, 2004.
Hydro-electrical infrastructures on the Kabul River were the best developed in Afghanistan. Yet, hydro-power potential still remains very important. The main hydro-electrical structures built in the Eastern region are: 1. Surobi dam built with German
assistance. Norconsult-Norplan (2003) notes the equipment is robust and has been comparatively well maintained with the limited means available. The units can still be operated close to their original output and the station has had a regular energy production throughout the years.
2. The Darunta hydro-power plant was constructed by the USSR and commissioned in 1967 with an initial capacity of 11,000 kW. Darunta dam and the fish-breeding centre were established in 1965 with the assistance of China. The status of the dam was not evaluated by the Norconsult-Norplan power sector review. Yet, it appears that the hydro-electrical capacity of the dam have been severely reduced in the past two decades.
The hydro-power potential of the Kunar river, which alone represents 18% of the total river discharge in Afghanistan (annual mean discharge: 15,250 mtn m3) is untouched. The river offers a huge hydro-potential. The table 3 shows the proposed hydro-electrical project by Norconsult-Norplan (2003).
8
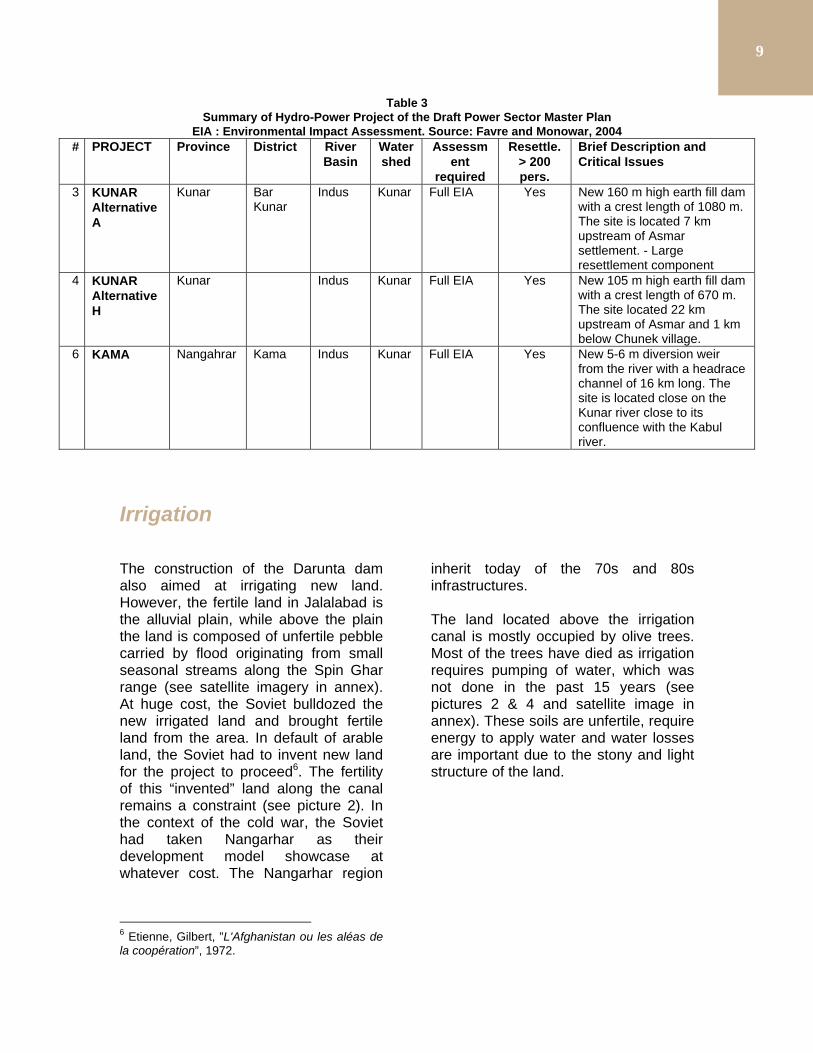
Table 3 Summary of Hydro-Power Project of the Draft Power Sector Master Plan
EIA : Environmental Impact Assessment. Source: Favre and Monowar, 2004 # PROJECT Province District River
Basin Watershed
Assessment
required
Resettle. > 200 pers.
Brief Description and Critical Issues
3 KUNAR Alternative A
Kunar Bar Kunar
Indus Kunar Full EIA Yes New 160 m high earth fill dam with a crest length of 1080 m. The site is located 7 km upstream of Asmar settlement. - Large resettlement component
4 KUNAR Alternative H
Kunar Indus Kunar Full EIA Yes New 105 m high earth fill dam with a crest length of 670 m. The site located 22 km upstream of Asmar and 1 km below Chunek village.
6 KAMA Nangahrar Kama Indus Kunar Full EIA Yes New 5-6 m diversion weir from the river with a headrace channel of 16 km long. The site is located close on the Kunar river close to its confluence with the Kabul river.
Irrigation The construction of the Darunta dam also aimed at irrigating new land. However, the fertile land in Jalalabad is the alluvial plain, while above the plain the land is composed of unfertile pebble carried by flood originating from small seasonal streams along the Spin Ghar range (see satellite imagery in annex). At huge cost, the Soviet bulldozed the new irrigated land and brought fertile land from the area. In default of arable land, the Soviet had to invent new land for the project to proceed6. The fertility of this “invented” land along the canal remains a constraint (see picture 2). In the context of the cold war, the Soviet had taken Nangarhar as their development model showcase at whatever cost. The Nangarhar region
6 Etienne, Gilbert, ”L'Afghanistan ou les aléas de la coopération”, 1972.
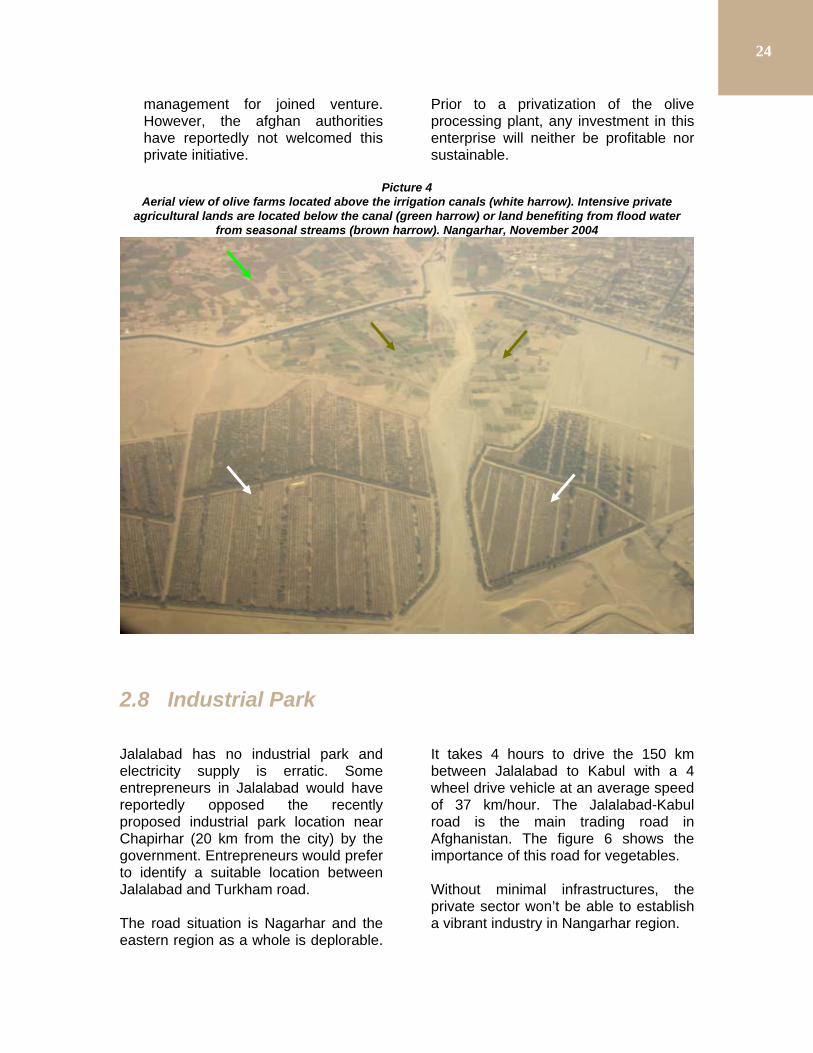
inherit today of the 70s and 80s infrastructures. The land located above the irrigation canal is mostly occupied by olive trees. Most of the trees have died as irrigation requires pumping of water, which was not done in the past 15 years (see pictures 2 & 4 and satellite image in annex). These soils are unfertile, require energy to apply water and water losses are important due to the stony and light structure of the land.
9
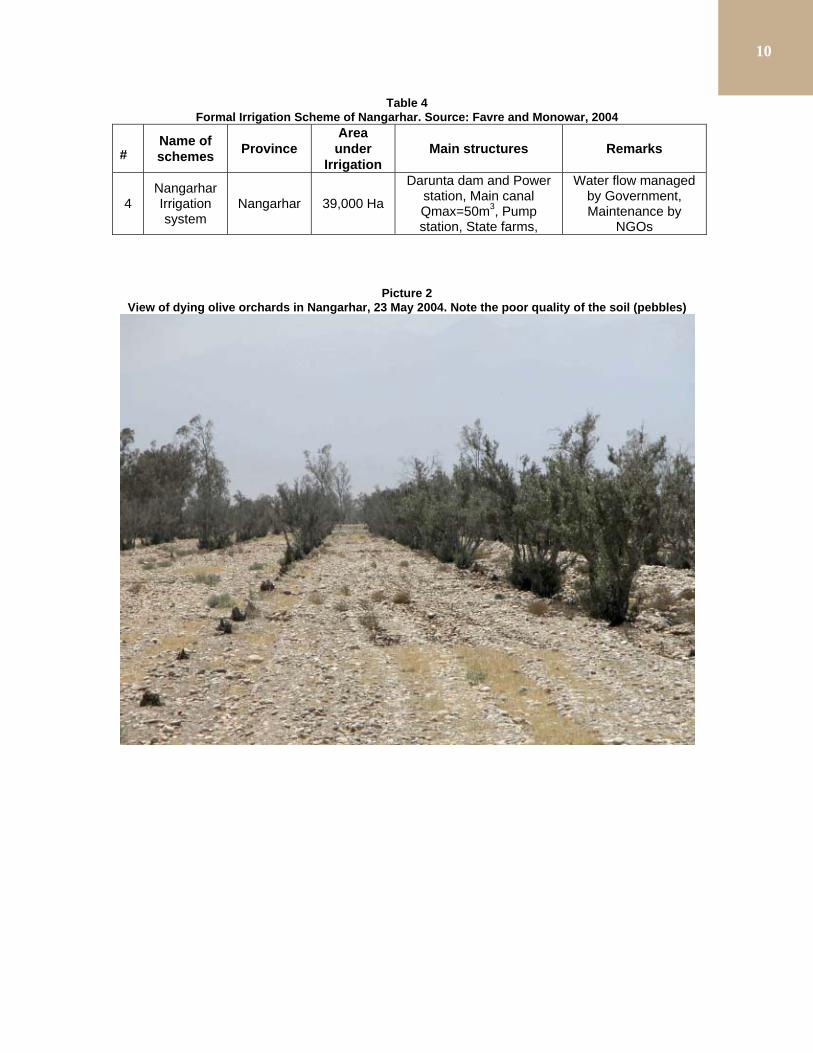
Table 4 Formal Irrigation Scheme of Nangarhar. Source: Favre and Monowar, 2004
# Name of schemes Province
Area under
Irrigation Main structures Remarks
4 Nangarhar Irrigation system
Nangarhar 39,000 Ha
Darunta dam and Power station, Main canal Qmax=50m3, Pump station, State farms,
Water flow managed by Government, Maintenance by
NGOs
Picture 2 View of dying olive orchards in Nangarhar, 23 May 2004. Note the poor quality of the soil (pebbles)
10
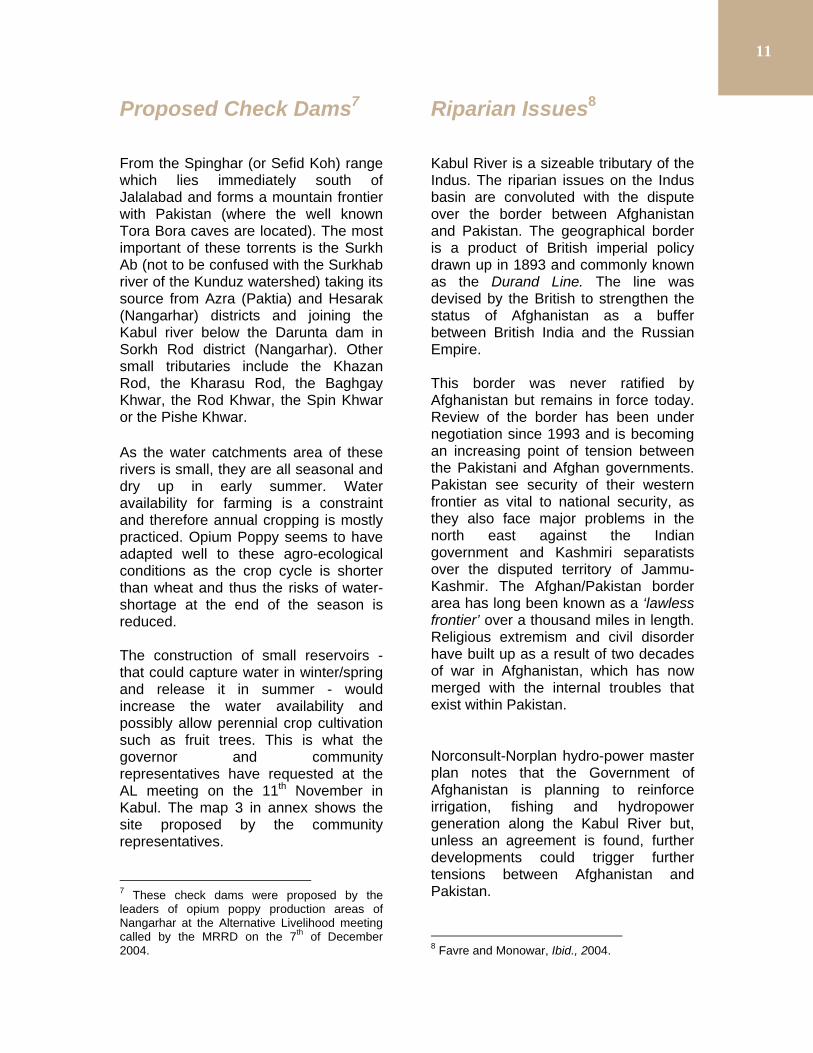
Proposed Check Dams7 From the Spinghar (or Sefid Koh) range which lies immediately south of Jalalabad and forms a mountain frontier with Pakistan (where the well known Tora Bora caves are located). The most important of these torrents is the Surkh Ab (not to be confused with the Surkhab river of the Kunduz watershed) taking its source from Azra (Paktia) and Hesarak (Nangarhar) districts and joining the Kabul river below the Darunta dam in Sorkh Rod district (Nangarhar). Other small tributaries include the Khazan Rod, the Kharasu Rod, the Baghgay Khwar, the Rod Khwar, the Spin Khwar or the Pishe Khwar. As the water catchments area of these rivers is small, they are all seasonal and dry up in early summer. Water availability for farming is a constraint and therefore annual cropping is mostly practiced. Opium Poppy seems to have adapted well to these agro-ecological conditions as the crop cycle is shorter than wheat and thus the risks of water-shortage at the end of the season is reduced. The construction of small reservoirs - that could capture water in winter/spring and release it in summer - would increase the water availability and possibly allow perennial crop cultivation such as fruit trees. This is what the governor and community representatives have requested at the AL meeting on the 11th November in Kabul. The map 3 in annex shows the site proposed by the community representatives.
7 These check dams were proposed by the leaders of opium poppy production areas of Nangarhar at the Alternative Livelihood meeting called by the MRRD on the 7th of December 2004.
Riparian Issues8
Kabul River is a sizeable tributary of the Indus. The riparian issues on the Indus basin are convoluted with the dispute over the border between Afghanistan and Pakistan. The geographical border is a product of British imperial policy drawn up in 1893 and commonly known as the Durand Line. The line was devised by the British to strengthen the status of Afghanistan as a buffer between British India and the Russian Empire. This border was never ratified by Afghanistan but remains in force today. Review of the border has been under negotiation since 1993 and is becoming an increasing point of tension between the Pakistani and Afghan governments. Pakistan see security of their western frontier as vital to national security, as they also face major problems in the north east against the Indian government and Kashmiri separatists over the disputed territory of Jammu-Kashmir. The Afghan/Pakistan border area has long been known as a ‘lawless frontier’ over a thousand miles in length. Religious extremism and civil disorder have built up as a result of two decades of war in Afghanistan, which has now merged with the internal troubles that exist within Pakistan. Norconsult-Norplan hydro-power master plan notes that the Government of Afghanistan is planning to reinforce irrigation, fishing and hydropower generation along the Kabul River but, unless an agreement is found, further developments could trigger further tensions between Afghanistan and Pakistan.
8 Favre and Monowar, Ibid., 2004.
11
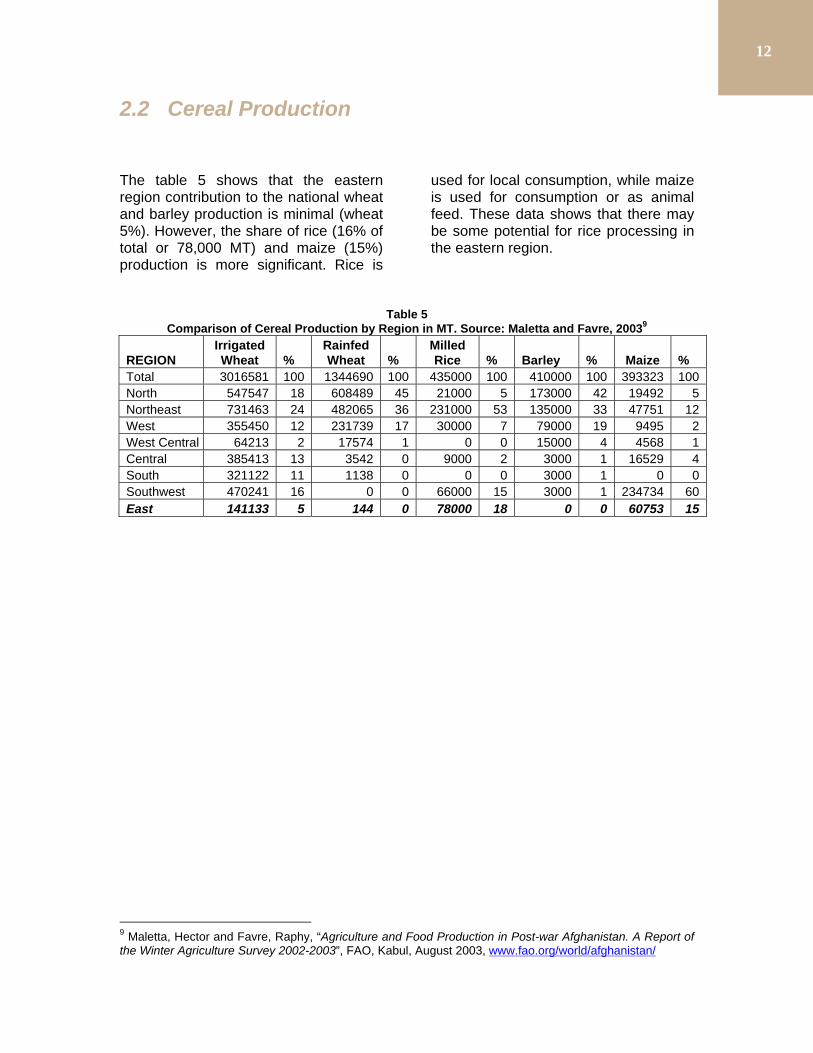
2.2 Cereal Production The table 5 shows that the eastern region contribution to the national wheat and barley production is minimal (wheat 5%). However, the share of rice (16% of total or 78,000 MT) and maize (15%) production is more significant. Rice is
used for local consumption, while maize is used for consumption or as animal feed. These data shows that there may be some potential for rice processing in the eastern region.
Table 5 Comparison of Cereal Production by Region in MT. Source: Maletta and Favre, 20039
REGION Irrigated Wheat %
Rainfed Wheat %
Milled Rice % Barley % Maize %
Total 3016581 100 1344690 100 435000 100 410000 100 393323 100 North 547547 18 608489 45 21000 5 173000 42 19492 5 Northeast 731463 24 482065 36 231000 53 135000 33 47751 12 West 355450 12 231739 17 30000 7 79000 19 9495 2 West Central 64213 2 17574 1 0 0 15000 4 4568 1 Central 385413 13 3542 0 9000 2 3000 1 16529 4 South 321122 11 1138 0 0 0 3000 1 0 0 Southwest 470241 16 0 0 66000 15 3000 1 234734 60 East 141133 5 144 0 78000 18 0 0 60753 15
9 Maletta, Hector and Favre, Raphy, “Agriculture and Food Production in Post-war Afghanistan. A Report of the Winter Agriculture Survey 2002-2003”, FAO, Kabul, August 2003, www.fao.org/world/afghanistan/
12
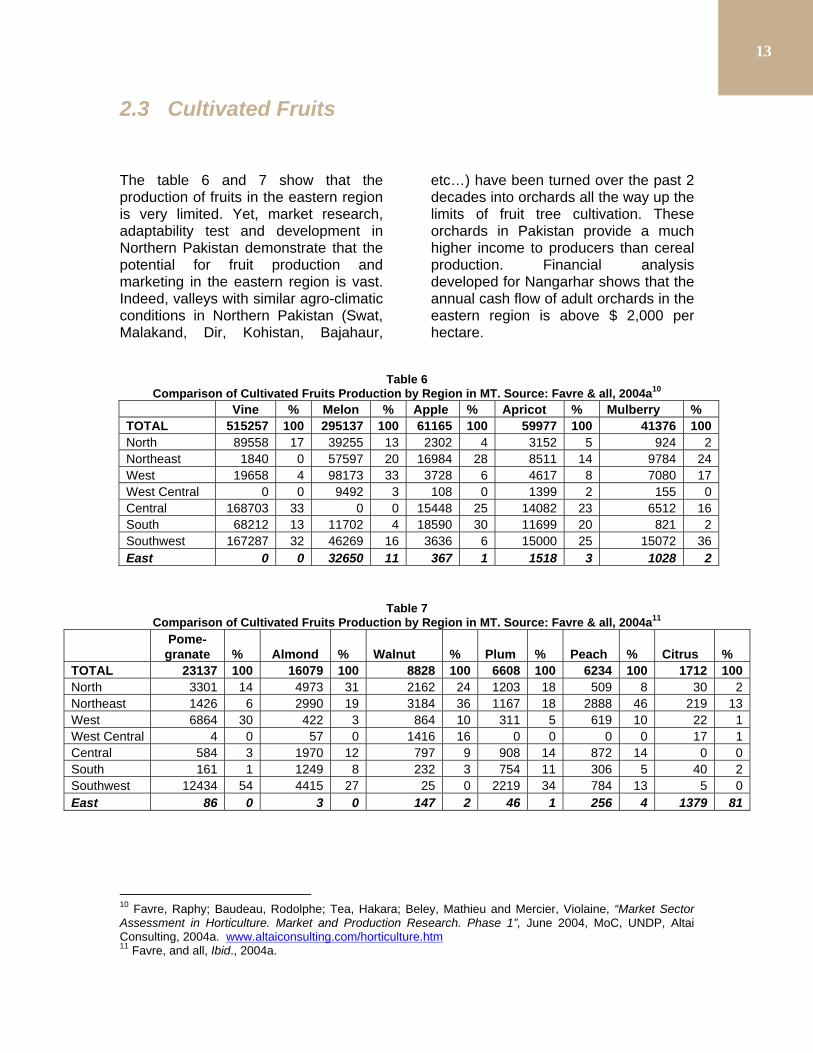
2.3 Cultivated Fruits The table 6 and 7 show that the production of fruits in the eastern region is very limited. Yet, market research, adaptability test and development in Northern Pakistan demonstrate that the potential for fruit production and marketing in the eastern region is vast. Indeed, valleys with similar agro-climatic conditions in Northern Pakistan (Swat, Malakand, Dir, Kohistan, Bajahaur,
etc…) have been turned over the past 2 decades into orchards all the way up the limits of fruit tree cultivation. These orchards in Pakistan provide a much higher income to producers than cereal production. Financial analysis developed for Nangarhar shows that the annual cash flow of adult orchards in the eastern region is above $ 2,000 per hectare.
Table 6 Comparison of Cultivated Fruits Production by Region in MT. Source: Favre & all, 2004a10
Vine % Melon % Apple % Apricot % Mulberry % TOTAL 515257 100 295137 100 61165 100 59977 100 41376 100 North 89558 17 39255 13 2302 4 3152 5 924 2 Northeast 1840 0 57597 20 16984 28 8511 14 9784 24 West 19658 4 98173 33 3728 6 4617 8 7080 17 West Central 0 0 9492 3 108 0 1399 2 155 0 Central 168703 33 0 0 15448 25 14082 23 6512 16 South 68212 13 11702 4 18590 30 11699 20 821 2 Southwest 167287 32 46269 16 3636 6 15000 25 15072 36 East 0 0 32650 11 367 1 1518 3 1028 2
Table 7 Comparison of Cultivated Fruits Production by Region in MT. Source: Favre & all, 2004a11
Pome-
granate % Almond % Walnut % Plum % Peach % Citrus % TOTAL 23137 100 16079 100 8828 100 6608 100 6234 100 1712 100 North 3301 14 4973 31 2162 24 1203 18 509 8 30 2 Northeast 1426 6 2990 19 3184 36 1167 18 2888 46 219 13 West 6864 30 422 3 864 10 311 5 619 10 22 1 West Central 4 0 57 0 1416 16 0 0 0 0 17 1 Central 584 3 1970 12 797 9 908 14 872 14 0 0 South 161 1 1249 8 232 3 754 11 306 5 40 2 Southwest 12434 54 4415 27 25 0 2219 34 784 13 5 0 East 86 0 3 0 147 2 46 1 256 4 1379 81
10 Favre, Raphy; Baudeau, Rodolphe; Tea, Hakara; Beley, Mathieu and Mercier, Violaine, “Market Sector Assessment in Horticulture. Market and Production Research. Phase 1”, June 2004, MoC, UNDP, Altai Consulting, 2004a. www.altaiconsulting.com/horticulture.htm 11 Favre, and all, Ibid., 2004a.
13
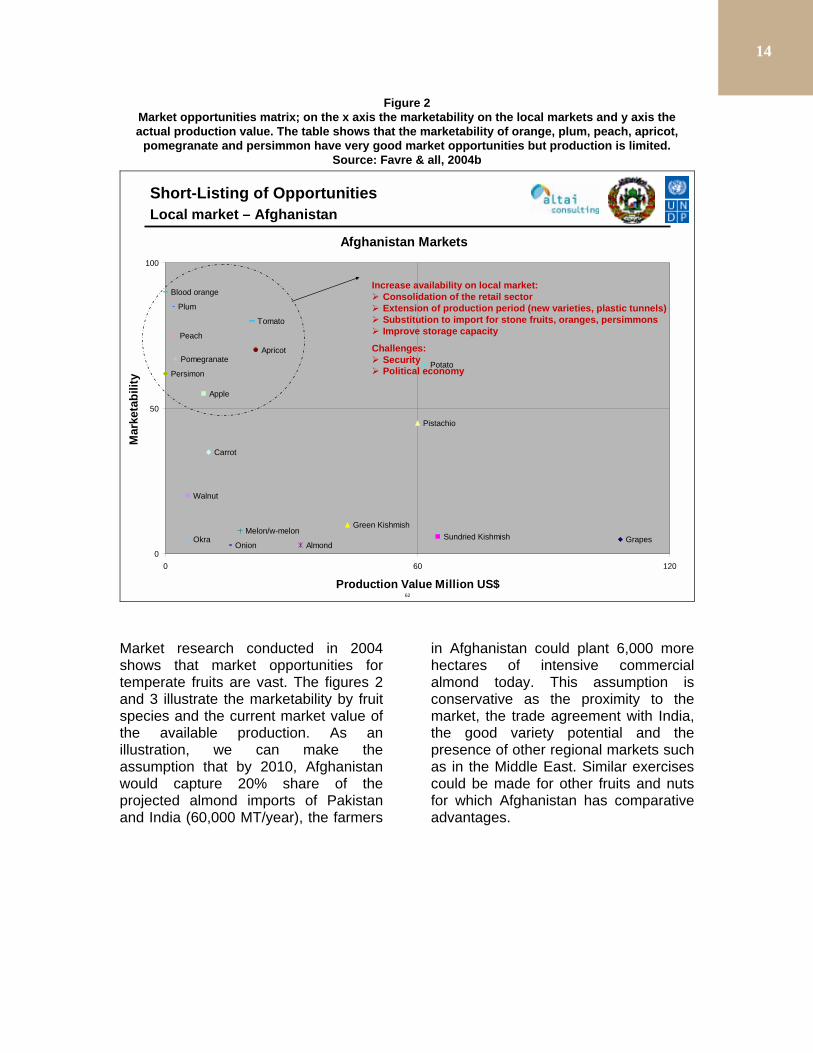
Figure 2 Market opportunities matrix; on the x axis the marketability on the local markets and y axis the actual production value. The table shows that the marketability of orange, plum, peach, apricot,
pomegranate and persimmon have very good market opportunities but production is limited. Source: Favre & all, 2004b
62
Afghanistan Markets
GrapesSundried KishmishGreen Kishmish
Almond
Apricot
Melon/w-melon
Onion
Tomato
Carrot
Pistachio
Peach
Walnut
Blood orange
PersimonPotato
Apple
Okra
Pomegranate
Plum
0
50
100
0 60 120
Production Value Million US$
Mar
keta
bilit
y
Short-Listing of OpportunitiesLocal market – Afghanistan
Increase availability on local market: ! Consolidation of the retail sector! Extension of production period (new varieties, plastic tunnels)! Substitution to import for stone fruits, oranges, persimmons! Improve storage capacity
Challenges:! Security! Political economy
Market research conducted in 2004 shows that market opportunities for temperate fruits are vast. The figures 2 and 3 illustrate the marketability by fruit species and the current market value of the available production. As an illustration, we can make the assumption that by 2010, Afghanistan would capture 20% share of the projected almond imports of Pakistan and India (60,000 MT/year), the farmers
in Afghanistan could plant 6,000 more hectares of intensive commercial almond today. This assumption is conservative as the proximity to the market, the trade agreement with India, the good variety potential and the presence of other regional markets such as in the Middle East. Similar exercises could be made for other fruits and nuts for which Afghanistan has comparative advantages.
14
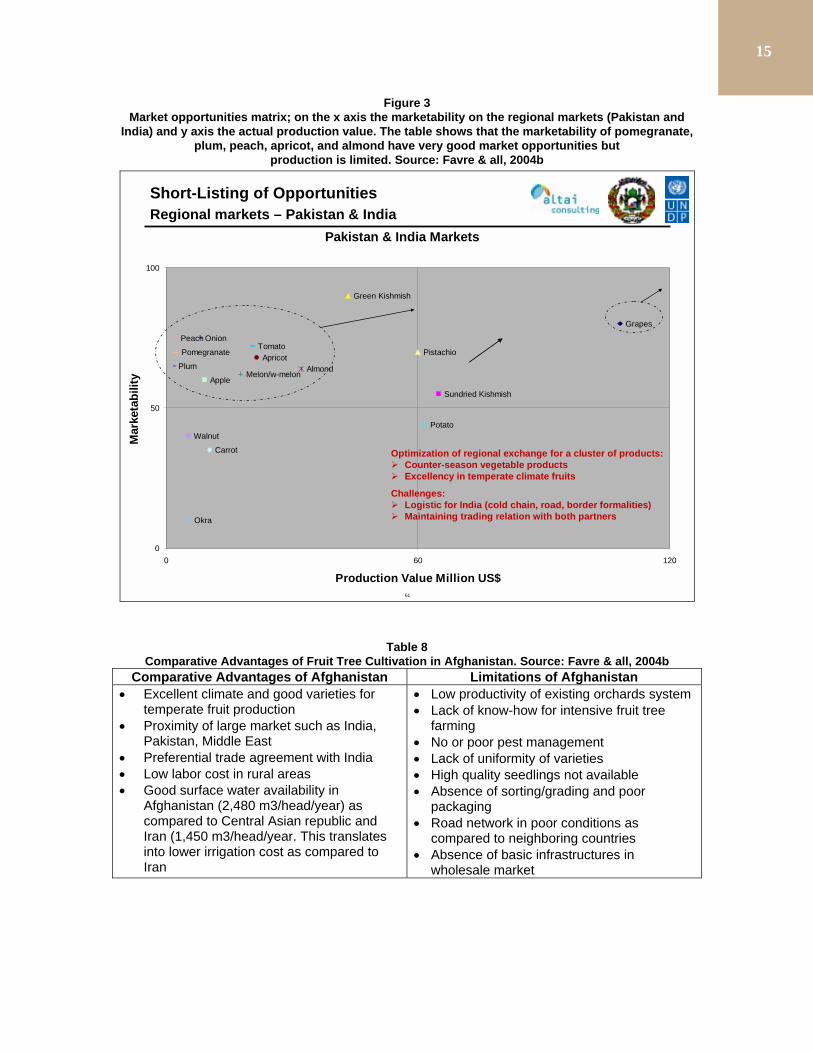
Figure 3 Market opportunities matrix; on the x axis the marketability on the regional markets (Pakistan and
India) and y axis the actual production value. The table shows that the marketability of pomegranate, plum, peach, apricot, and almond have very good market opportunities but
production is limited. Source: Favre & all, 2004b
61
Pakistan & India Markets
Grapes
Sundried Kishmish
Green Kishmish
AlmondApricot
Melon/w-melon
OnionTomato
Carrot
Pistachio
Peach
WalnutPotato
Apple
Okra
Pomegranate
Plum
0
50
100
0 60 120
Production Value Million US$
Mar
keta
bilit
y
Short-Listing of OpportunitiesRegional markets – Pakistan & India
Optimization of regional exchange for a cluster of products:! Counter-season vegetable products! Excellency in temperate climate fruits
Challenges:! Logistic for India (cold chain, road, border formalities)! Maintaining trading relation with both partners
Table 8 Comparative Advantages of Fruit Tree Cultivation in Afghanistan. Source: Favre & all, 2004b
Comparative Advantages of Afghanistan Limitations of Afghanistan • Excellent climate and good varieties for
temperate fruit production • Proximity of large market such as India,
Pakistan, Middle East • Preferential trade agreement with India • Low labor cost in rural areas • Good surface water availability in
Afghanistan (2,480 m3/head/year) as compared to Central Asian republic and Iran (1,450 m3/head/year. This translates into lower irrigation cost as compared to Iran
• Low productivity of existing orchards system • Lack of know-how for intensive fruit tree
farming • No or poor pest management • Lack of uniformity of varieties • High quality seedlings not available • Absence of sorting/grading and poor
packaging • Road network in poor conditions as
compared to neighboring countries • Absence of basic infrastructures in
wholesale market
15
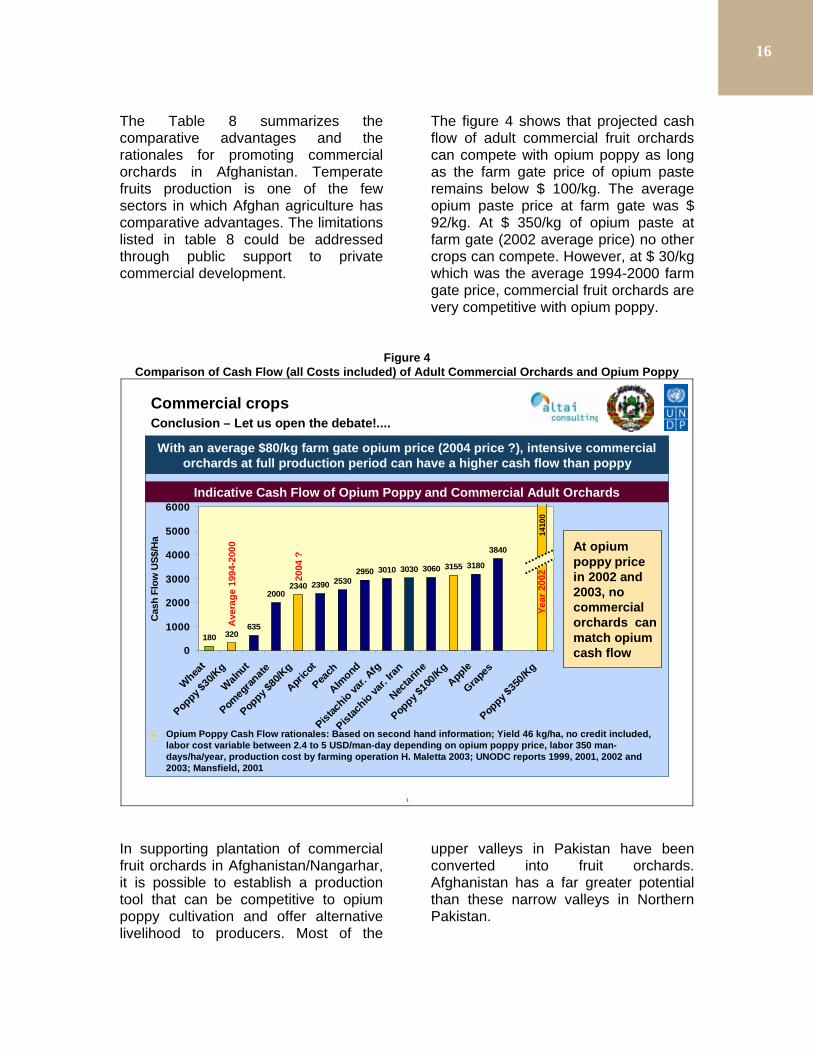
The Table 8 summarizes the comparative advantages and the rationales for promoting commercial orchards in Afghanistan. Temperate fruits production is one of the few sectors in which Afghan agriculture has comparative advantages. The limitations listed in table 8 could be addressed through public support to private commercial development.
The figure 4 shows that projected cash flow of adult commercial fruit orchards can compete with opium poppy as long as the farm gate price of opium paste remains below $ 100/kg. The average opium paste price at farm gate was $ 92/kg. At $ 350/kg of opium paste at farm gate (2002 average price) no other crops can compete. However, at $ 30/kg which was the average 1994-2000 farm gate price, commercial fruit orchards are very competitive with opium poppy.
Figure 4 Comparison of Cash Flow (all Costs included) of Adult Commercial Orchards and Opium Poppy
1
Commercial cropsConclusion – Let us open the debate!....
With an average $80/kg farm gate opium price (2004 price ?), intensive commercial orchards at full production period can have a higher cash flow than poppy
Indicative Cash Flow of Opium Poppy and Commercial Adult Orchards
At opium poppy price in 2002 and 2003, no commercial orchards can match opium cash flow
320635
20002340 2390 2530
2950 3010 3030 3060 3155 3180
3840
1800
1000
2000
3000
4000
5000
6000
Wheat
Poppy $
30/K
g
Walnut
Pomeg
ranate
Poppy $
80/K
g
Aprico
t
Peach
Almond
Pistac
hio va
r. Afg
Pistac
hio va
r. Iran
Nectar
ine
Poppy $
100/K
gApp
le
Grapes
Poppy $
350/K
g
Cas
h Fl
ow U
S$/H
a 1410
0
Ave
rage
199
4-20
00
Year
200
22004
?
Opium Poppy Cash Flow rationales: Based on second hand information; Yield 46 kg/ha, no credit included, labor cost variable between 2.4 to 5 USD/man-day depending on opium poppy price, labor 350 man-days/ha/year, production cost by farming operation H. Maletta 2003; UNODC reports 1999, 2001, 2002 and 2003; Mansfield, 2001
In supporting plantation of commercial fruit orchards in Afghanistan/Nangarhar, it is possible to establish a production tool that can be competitive to opium poppy cultivation and offer alternative livelihood to producers. Most of the
upper valleys in Pakistan have been converted into fruit orchards. Afghanistan has a far greater potential than these narrow valleys in Northern Pakistan.
16
In Afghanistan, commercial orchards are sometimes intercropped with fodder legumes (clover or alfalfa). This offers very interesting opportunities of simultaneous development with livestock/dairy sector. Such potential synergies have not been studied thoroughly but casual field observation shows that milk availability is higher in fruit production areas than in other
regions. In Kabul, the FAO milk collection scheme is collecting milk from 14 centers in Wardak and Logar provinces (south of Kabul) which valleys are planted with apple and apricot trees. A recent FAO dairy survey in Parwan (North of Kabul), renown for its vineyard rather than orchards, showed that milk is not available in sufficient quantities.
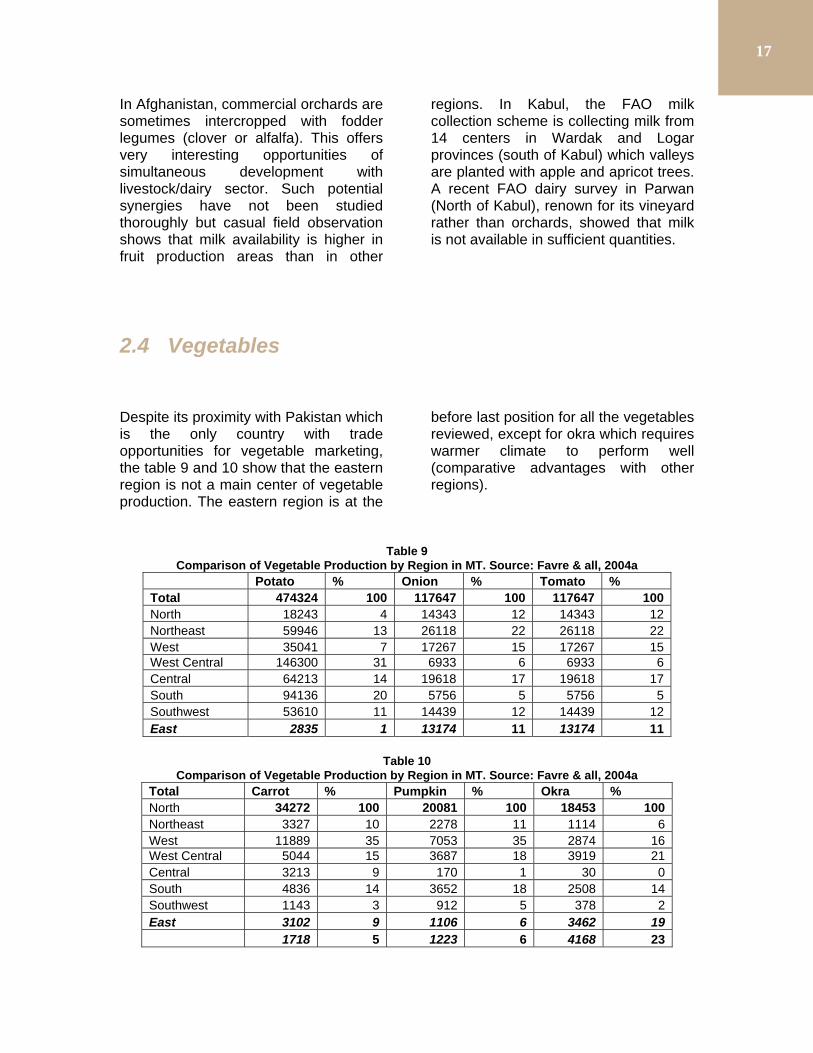
2.4 Vegetables Despite its proximity with Pakistan which is the only country with trade opportunities for vegetable marketing, the table 9 and 10 show that the eastern region is not a main center of vegetable production. The eastern region is at the
before last position for all the vegetables reviewed, except for okra which requires warmer climate to perform well (comparative advantages with other regions).
Table 9 Comparison of Vegetable Production by Region in MT. Source: Favre & all, 2004a
Potato % Onion % Tomato % Total 474324 100 117647 100 117647 100 North 18243 4 14343 12 14343 12 Northeast 59946 13 26118 22 26118 22 West 35041 7 17267 15 17267 15 West Central 146300 31 6933 6 6933 6 Central 64213 14 19618 17 19618 17 South 94136 20 5756 5 5756 5 Southwest 53610 11 14439 12 14439 12 East 2835 1 13174 11 13174 11
Table 10
Comparison of Vegetable Production by Region in MT. Source: Favre & all, 2004a Total Carrot % Pumpkin % Okra % North 34272 100 20081 100 18453 100 Northeast 3327 10 2278 11 1114 6 West 11889 35 7053 35 2874 16 West Central 5044 15 3687 18 3919 21 Central 3213 9 170 1 30 0 South 4836 14 3652 18 2508 14 Southwest 1143 3 912 5 378 2 East 3102 9 1106 6 3462 19 1718 5 1223 6 4168 23
17
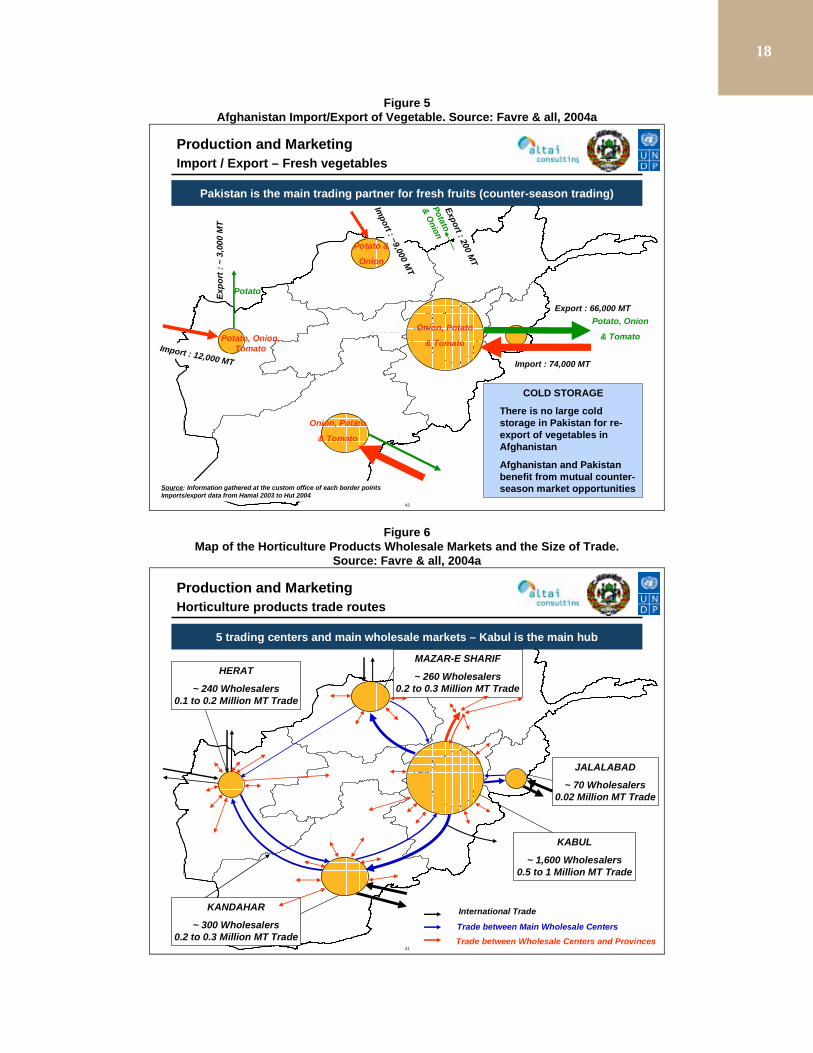
Figure 5 Afghanistan Import/Export of Vegetable. Source: Favre & all, 2004a
43
Production and Marketing Import / Export – Fresh vegetables
West
South-West
North
South
North-East
EastWest-Central
Export : 66,000 MT
Import : 74,000 MT
Import : 12,000 MT
Expo
rt :
~ 3,
000
MT
Import : ~9,000 M
T
Export : 200 MT
Potato &
Onion
Onion, Potato
& Tomato
Potato, Onion
& Tomato
Potato
& Onion
Pakistan is the main trading partner for fresh fruits (counter-season trading)
COLD STORAGE
There is no large cold storage in Pakistan for re-export of vegetables in Afghanistan
Afghanistan and Pakistan benefit from mutual counter-season market opportunities
Potato, Onion,Tomato
Potato
Source: Information gathered at the custom office of each border pointsImports/export data from Hamal 2003 to Hut 2004
Onion, Potato
& Tomato
Figure 6 Map of the Horticulture Products Wholesale Markets and the Size of Trade.
Source: Favre & all, 2004a
41
West
South-West
North
South
North-East
EastWest-Central
Production and Marketing Horticulture products trade routes
Trade between Wholesale Centers and ProvincesTrade between Main Wholesale Centers
International Trade
KABUL
~ 1,600 Wholesalers0.5 to 1 Million MT Trade
JALALABAD
~ 70 Wholesalers0.02 Million MT Trade
MAZAR-E SHARIF
~ 260 Wholesalers0.2 to 0.3 Million MT Trade
HERAT
~ 240 Wholesalers0.1 to 0.2 Million MT Trade
5 trading centers and main wholesale markets – Kabul is the main hub
KANDAHAR
~ 300 Wholesalers0.2 to 0.3 Million MT Trade
18
The figure 5 shows that Pakistan is by far the main trading partner for vegetables. Most of the trade is going trough Turkham border in Nangarhar. Yet, this trade is occurring outside the whole-sale market of Jalalabad as vegetables are transiting directly to Pakistan from wholesale market in
Kabul or farmers fields in the eastern region. The figure 6 shows the relative small size of Jalalabad with other wholesale markets in Afghanistan. The size of the wholesale market in Jalalabad illustrates both the limited market demand of a small size town and the limited production in the region.
Figure 7 Elevation Differential between Afghanistan and Pakistan offers Counter-season Opportunities.
Source: Favre & all, 2004a
96
Central & South Regions Production Potential Analysis" Plateau in mid/high elevation: between 1300 m absl in Kapisa (Tagao) and 2200 m in Wardak
and Gazni (Kabul 1800 m)" Counter-season with Pakistan and India low land" 210 days free frost days in Kabul: 2 crops/year possible
Peshawar/Mardan plain:< 500 m absl
Shomali plain:>1500 m abslLandsat-5 Thematic
Mapper scenes acquired within one or two years of 1990 The
image mosaic was spectrally enhanced
using EarthSat’sLOCAL enhancement
technique. This custom approach to contrast adjustment
allows the preservation of spatial information across large areas of extreme brightness
differences. Mosaicedand colour enhanced
by Earth Satellite Corporation
(www.earthsat.com)
Hindus River
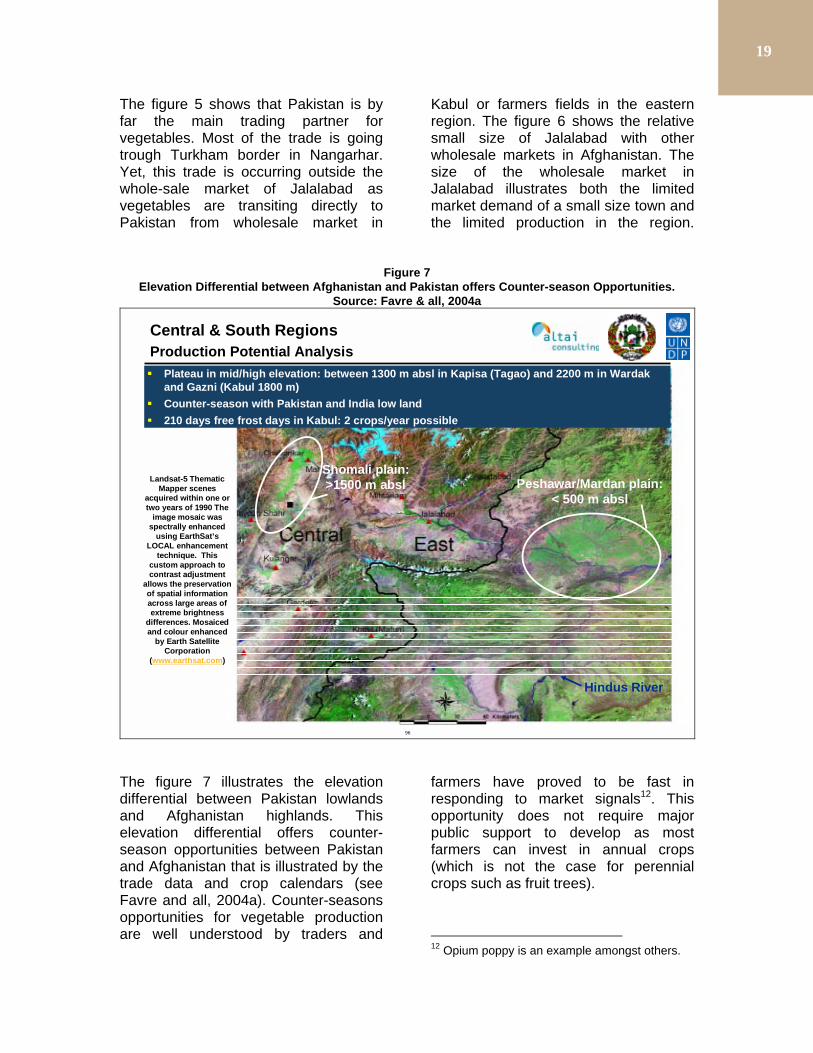
The figure 7 illustrates the elevation differential between Pakistan lowlands and Afghanistan highlands. This elevation differential offers counter-season opportunities between Pakistan and Afghanistan that is illustrated by the trade data and crop calendars (see Favre and all, 2004a). Counter-seasons opportunities for vegetable production are well understood by traders and
farmers have proved to be fast in responding to market signals12. This opportunity does not require major public support to develop as most farmers can invest in annual crops (which is not the case for perennial crops such as fruit trees).
12 Opium poppy is an example amongst others.
19
The window of opportunity for vegetable production in Nangarhar is narrow and limited to a few weeks transition period toward the end of the Pakistan production and before the Afghan highlands enters into production (see the position of the eastern region on the figure 7). Another window of opportunity is winter vegetable production before Pakistan enters into production again. These narrow windows of opportunities
explain the low production level of vegetables in Nangarhar. Market research has shown that vegetable price at farm gate in Afghanistan are more expensive than Pakistan (see Favre and all, 2004a). This is limiting the opportunities for vegetable processing industries such as tomato paste in Afghanistan.
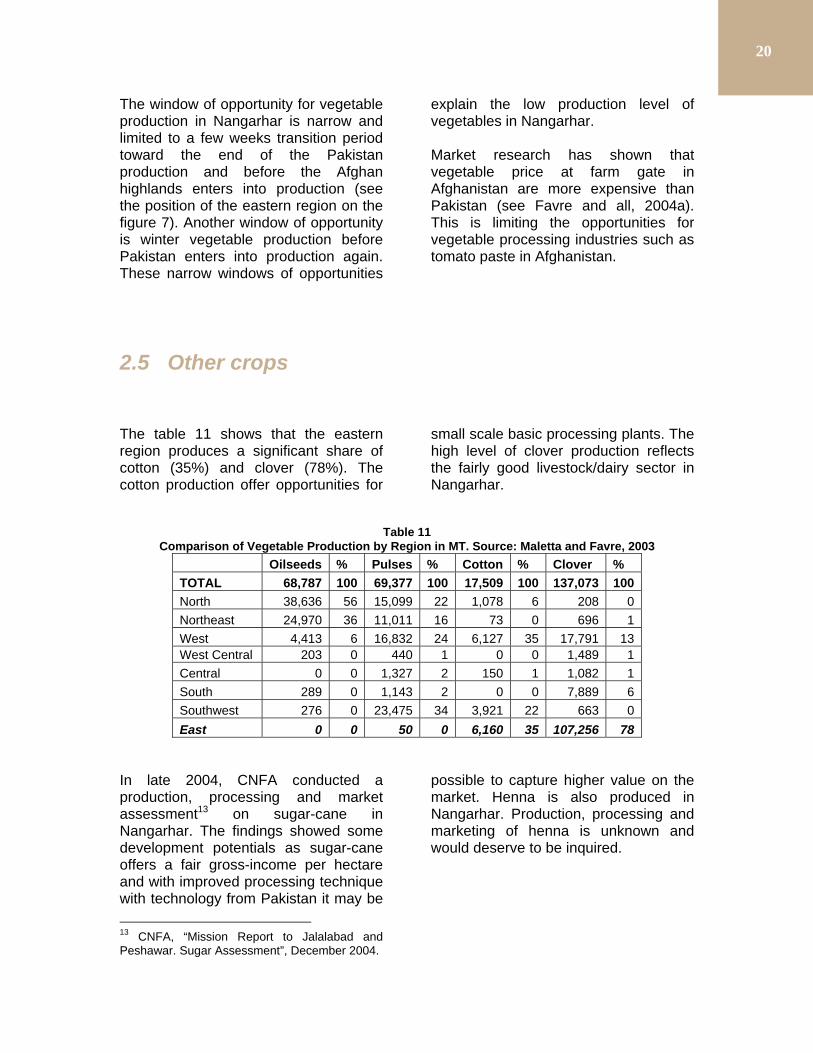
2.5 Other crops The table 11 shows that the eastern region produces a significant share of cotton (35%) and clover (78%). The cotton production offer opportunities for
small scale basic processing plants. The high level of clover production reflects the fairly good livestock/dairy sector in Nangarhar.
Table 11 Comparison of Vegetable Production by Region in MT. Source: Maletta and Favre, 2003
Oilseeds % Pulses % Cotton % Clover % TOTAL 68,787 100 69,377 100 17,509 100 137,073 100 North 38,636 56 15,099 22 1,078 6 208 0
Northeast 24,970 36 11,011 16 73 0 696 1
West 4,413 6 16,832 24 6,127 35 17,791 13 West Central 203 0 440 1 0 0 1,489 1
Central 0 0 1,327 2 150 1 1,082 1
South 289 0 1,143 2 0 0 7,889 6
Southwest 276 0 23,475 34 3,921 22 663 0
East 0 0 50 0 6,160 35 107,256 78 In late 2004, CNFA conducted a production, processing and market assessment13 on sugar-cane in Nangarhar. The findings showed some development potentials as sugar-cane offers a fair gross-income per hectare and with improved processing technique with technology from Pakistan it may be
13 CNFA, “Mission Report to Jalalabad and Peshawar. Sugar Assessment”, December 2004.
possible to capture higher value on the market. Henna is also produced in Nangarhar. Production, processing and marketing of henna is unknown and would deserve to be inquired.
20
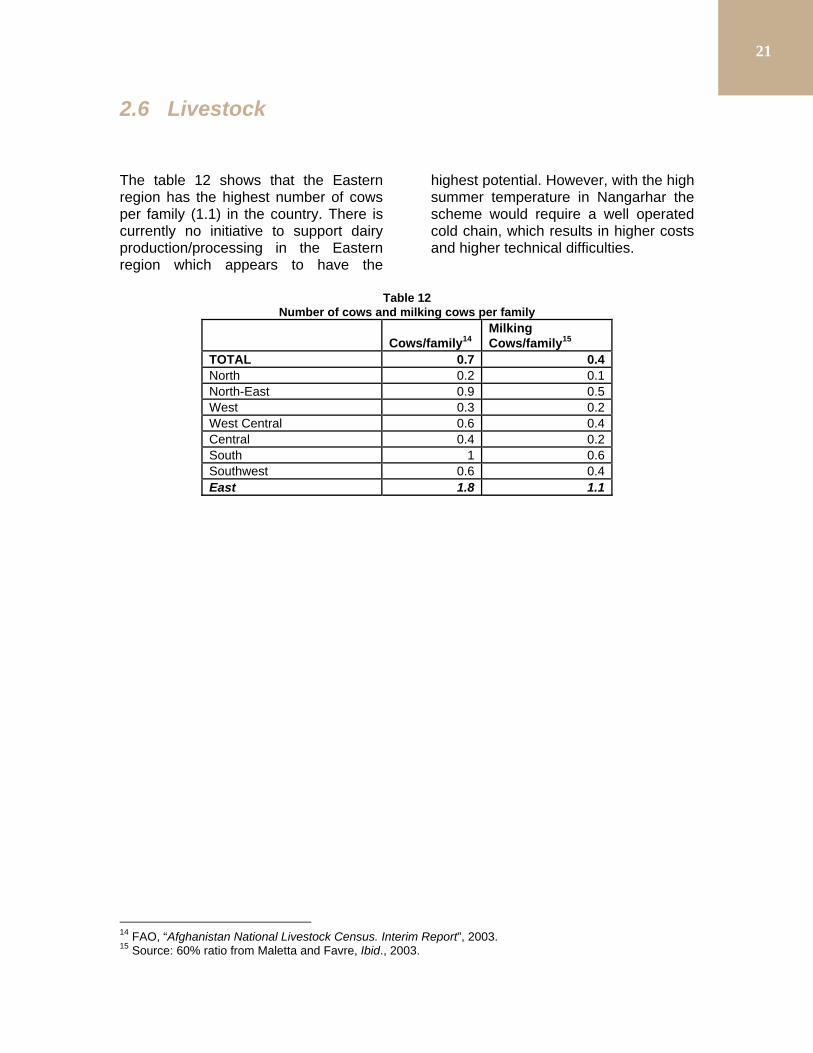
2.6 Livestock The table 12 shows that the Eastern region has the highest number of cows per family (1.1) in the country. There is currently no initiative to support dairy production/processing in the Eastern region which appears to have the
highest potential. However, with the high summer temperature in Nangarhar the scheme would require a well operated cold chain, which results in higher costs and higher technical difficulties.
Table 12
Number of cows and milking cows per family
Cows/family14 Milking Cows/family15
TOTAL 0.7 0.4 North 0.2 0.1 North-East 0.9 0.5 West 0.3 0.2 West Central 0.6 0.4 Central 0.4 0.2 South 1 0.6 Southwest 0.6 0.4 East 1.8 1.1
14 FAO, “Afghanistan National Livestock Census. Interim Report”, 2003. 15 Source: 60% ratio from Maletta and Favre, Ibid., 2003.
21
2.7 Some Projects in Nangarhar
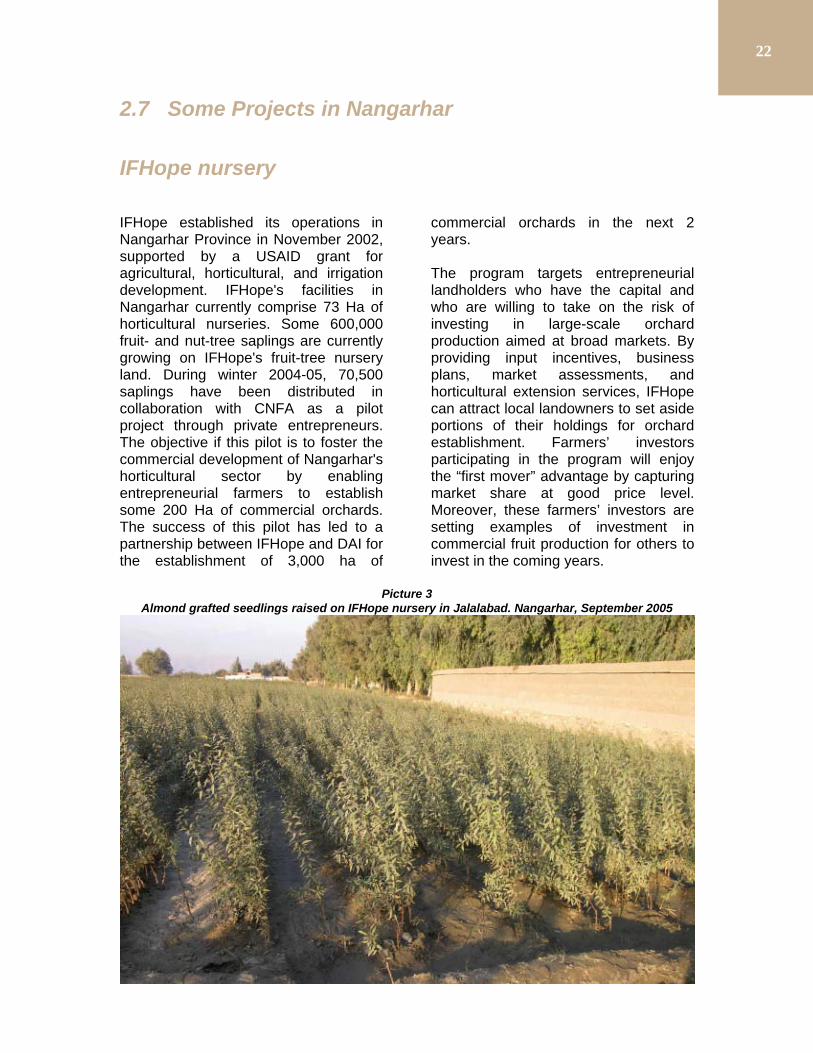
IFHope nursery IFHope established its operations in Nangarhar Province in November 2002, supported by a USAID grant for agricultural, horticultural, and irrigation development. IFHope's facilities in Nangarhar currently comprise 73 Ha of horticultural nurseries. Some 600,000 fruit- and nut-tree saplings are currently growing on IFHope's fruit-tree nursery land. During winter 2004-05, 70,500 saplings have been distributed in collaboration with CNFA as a pilot project through private entrepreneurs. The objective if this pilot is to foster the commercial development of Nangarhar's horticultural sector by enabling entrepreneurial farmers to establish some 200 Ha of commercial orchards. The success of this pilot has led to a partnership between IFHope and DAI for the establishment of 3,000 ha of
commercial orchards in the next 2 years. The program targets entrepreneurial landholders who have the capital and who are willing to take on the risk of investing in large-scale orchard production aimed at broad markets. By providing input incentives, business plans, market assessments, and horticultural extension services, IFHope can attract local landowners to set aside portions of their holdings for orchard establishment. Farmers’ investors participating in the program will enjoy the “first mover” advantage by capturing market share at good price level. Moreover, these farmers’ investors are setting examples of investment in commercial fruit production for others to invest in the coming years.
Picture 3 Almond grafted seedlings raised on IFHope nursery in Jalalabad. Nangarhar, September 2005
22
Gulestan Ltd. Gulestan is a Kabul-based, Afghan company established in 2004 which intends to produce essential oils for the cosmetics and well-being markets worldwide. Gulestan is an example of private sector development in post-Taleban Afghanistan. The founders of Gulestan includes founders of Jacques Andhrel cosmetic, director of research and director of marketing of Loreal, Afghan-American businessmen and economic adviser to Karzai and Director of Studies at the Center on International Cooperation at New York University. Nangarhar will be the first place of Gulestan to start its activities. Orange flowers, daffodils, coriander, basil are
already cultivated in the region and will be distilled in order to achieve sizeable production. This production will be sold to Loreal and other interested companies who already expressed their interest in Afghan product as a source of diversification of their supplies but also for R&D with Loreal. This project offer interesting opportunities to add-value to existing production in Nangarhar. Gulistan activities could optimize the economic return on sour orange commercial orchards and other aromatic plants cultivated in the region.
Olive farm and processing plant The olive farm is a visible feature of Nangarhar landscape. A detailed discussion of the olive farm and processing plant is not possible here and only some key points are presented: • Ownership: The olive farm and
processing plant is totally owned by the state (MAAH) which results in extremely low productivity.
• Olive production: Initially 2,700 ha in 4 farms planted in the early 1980s. Farms 2, 3 and 4 benefits from gravity water while farm 1 requires irrigation pump. Currently approximately 2,000 ha could be rehabilitated. Some olive trees have been pruned, fertilized and irrigated with FAO and Italian government support.
• Olive oil equipment: Machineries rehabilitated by the Italian government. Machines were flown to
Italy, repaired and sent back to Jalalabad. The Italian government also provided 2 new oil presses and 2 oil/water separators. With the new equipment provided by the Italian government, quality olive oil could be produced. The quality of the variety of olives could not be asserted. The fruits seen at the factory were of much smaller size than the one seen in Helmand (US olive varieties imported before the war).
• Coming season: the farm management anticipates a 400 MT olive harvest this winter; WFP will provide the farm management with food for olive harvesting; last year and before last year production are still not marketed;
• Private sector interest: a Pakistani company (zeitun-e Pakistan Ltd.) had approached the farm
23
management for joined venture. However, the afghan authorities have reportedly not welcomed this private initiative.
Prior to a privatization of the olive processing plant, any investment in this enterprise will neither be profitable nor sustainable.
Picture 4 Aerial view of olive farms located above the irrigation canals (white harrow). Intensive private
agricultural lands are located below the canal (green harrow) or land benefiting from flood water from seasonal streams (brown harrow). Nangarhar, November 2004
2.8 Industrial Park Jalalabad has no industrial park and electricity supply is erratic. Some entrepreneurs in Jalalabad would have reportedly opposed the recently proposed industrial park location near Chapirhar (20 km from the city) by the government. Entrepreneurs would prefer to identify a suitable location between Jalalabad and Turkham road. The road situation is Nagarhar and the eastern region as a whole is deplorable.
It takes 4 hours to drive the 150 km between Jalalabad to Kabul with a 4 wheel drive vehicle at an average speed of 37 km/hour. The Jalalabad-Kabul road is the main trading road in Afghanistan. The figure 6 shows the importance of this road for vegetables. Without minimal infrastructures, the private sector won’t be able to establish a vibrant industry in Nangarhar region.
24
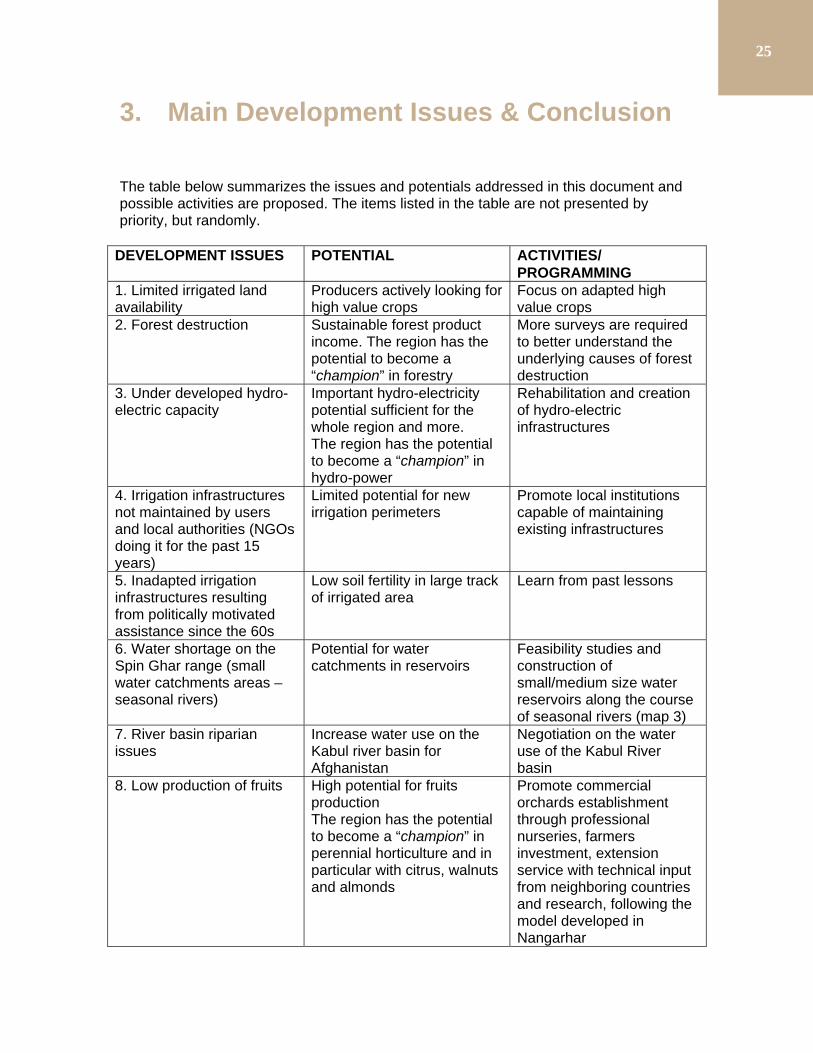
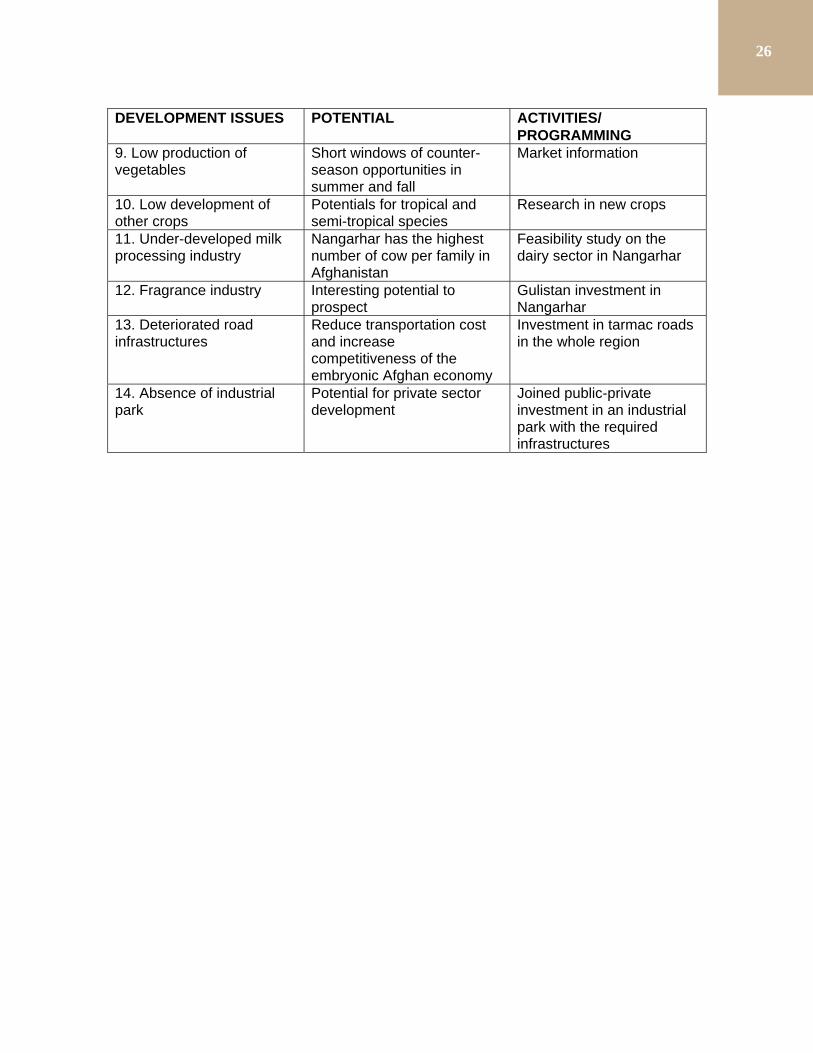
3. Main Development Issues & Conclusion The table below summarizes the issues and potentials addressed in this document and possible activities are proposed. The items listed in the table are not presented by priority, but randomly.
DEVELOPMENT ISSUES POTENTIAL ACTIVITIES/ PROGRAMMING
1. Limited irrigated land availability
Producers actively looking for high value crops
Focus on adapted high value crops
2. Forest destruction Sustainable forest product income. The region has the potential to become a “champion” in forestry
More surveys are required to better understand the underlying causes of forest destruction
3. Under developed hydro-electric capacity
Important hydro-electricity potential sufficient for the whole region and more. The region has the potential to become a “champion” in hydro-power
Rehabilitation and creation of hydro-electric infrastructures
4. Irrigation infrastructures not maintained by users and local authorities (NGOs doing it for the past 15 years)
Limited potential for new irrigation perimeters
Promote local institutions capable of maintaining existing infrastructures
5. Inadapted irrigation infrastructures resulting from politically motivated assistance since the 60s
Low soil fertility in large track of irrigated area
Learn from past lessons
6. Water shortage on the Spin Ghar range (small water catchments areas – seasonal rivers)
Potential for water catchments in reservoirs
Feasibility studies and construction of small/medium size water reservoirs along the course of seasonal rivers (map 3)
7. River basin riparian issues
Increase water use on the Kabul river basin for Afghanistan
Negotiation on the water use of the Kabul River basin
8. Low production of fruits High potential for fruits production The region has the potential to become a “champion” in perennial horticulture and in particular with citrus, walnuts and almonds
Promote commercial orchards establishment through professional nurseries, farmers investment, extension service with technical input from neighboring countries and research, following the model developed in Nangarhar
25
DEVELOPMENT ISSUES POTENTIAL ACTIVITIES/ PROGRAMMING
9. Low production of vegetables
Short windows of counter-season opportunities in summer and fall
Market information
10. Low development of other crops
Potentials for tropical and semi-tropical species
Research in new crops
11. Under-developed milk processing industry
Nangarhar has the highest number of cow per family in Afghanistan
Feasibility study on the dairy sector in Nangarhar
12. Fragrance industry Interesting potential to prospect
Gulistan investment in Nangarhar
13. Deteriorated road infrastructures
Reduce transportation cost and increase competitiveness of the embryonic Afghan economy
Investment in tarmac roads in the whole region
14. Absence of industrial park
Potential for private sector development
Joined public-private investment in an industrial park with the required infrastructures
26
BIBLIOGRAPHY CNFA, “Mission Report to Jalalabad and
Peshawar. Sugar Assessment”, December 2004
CNFA “Small Grant Applications for Gur
(raw sugar) Investors”, January 2005 FAO, “Afghanistan National Livestock
Census. Interim Report”, 2003 FAO, “Landcover Atlas of Afghanistan,
1993”, printed in 1999 Etienne, Gilbert, ”L'Afghanistan ou les
aléas de la coopération”, 1972 Favre, Raphy; Baudeau, Rodolphe; Tea,
Hakara; Beley, Mathieu and Mercier, Violaine, “Market Sector Assessment in Horticulture. Market and Production Research. Phase 1”, June 2004, MoC, UNDP, Altai Consulting, 2004a. www.altaiconsulting.com/dyn/consulting/projects/horticulture.html
Favre, Raphy; Baudeau, Rodolphe; Tea, Hakara; Beley, Mathieu and Mercier, Violaine, “Market Sector Assessment in Horticulture. Feasibility Studies and Business Plans. Phase 2-3” August 2004, MoC, UNDP, Altai Consulting, 2004b, www.altaiconsulting.com/dyn/consulting/projects/horticulture.html
Favre, Raphy and Monowar, Golam,
“Watershed Atlas of Afghanistan. Working Document for Planners”, FAO/UNDP/MIRWE/AREU/SDC, 2004
Maletta, Hector and Favre, Raphy,
“Agriculture and Food Production in Post-war Afghanistan. A Report of the Winter Agriculture Survey 2002-2003”, FAO, Kabul, August 2003, www.fao.org/world/afghanistan/
UNEP, “Afghanistan. Post-Confict
Environment Assessment”, 2002. www.unep.org
27
ANNEXES
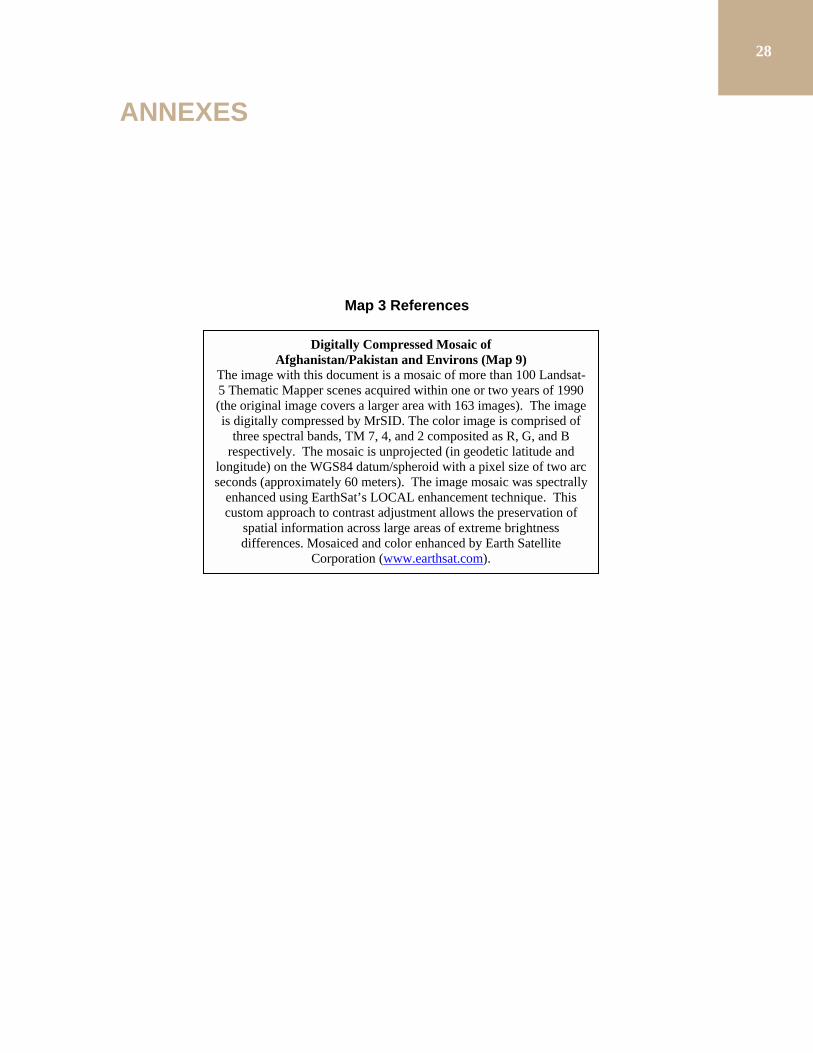
Map 3 References
Digitally Compressed Mosaic of Afghanistan/Pakistan and Environs (Map 9)
The image with this document is a mosaic of more than 100 Landsat-5 Thematic Mapper scenes acquired within one or two years of 1990 (the original image covers a larger area with 163 images). The image is digitally compressed by MrSID. The color image is comprised of
three spectral bands, TM 7, 4, and 2 composited as R, G, and B respectively. The mosaic is unprojected (in geodetic latitude and
longitude) on the WGS84 datum/spheroid with a pixel size of two arc seconds (approximately 60 meters). The image mosaic was spectrally
enhanced using EarthSat’s LOCAL enhancement technique. This custom approach to contrast adjustment allows the preservation of
spatial information across large areas of extreme brightness differences. Mosaiced and color enhanced by Earth Satellite
Corporation (www.earthsat.com).
28
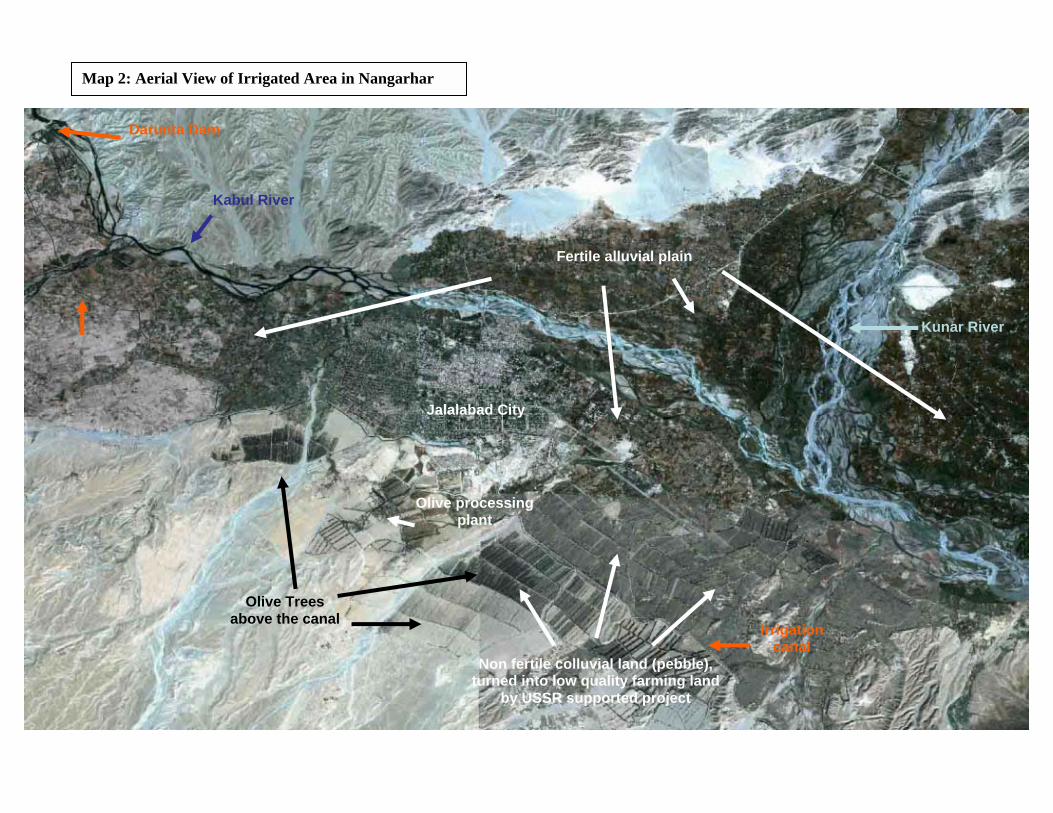
Olive Trees above the canal
Kunar River
Darunta Dam
Kabul River
Fertile alluvial plain
Jalalabad City
Olive processing plant
Irrigation canal
Non fertile colluvial land (pebble), turned into low quality farming land
by USSR supported project
Map 2: Aerial View of Irrigated Area in Nangarhar
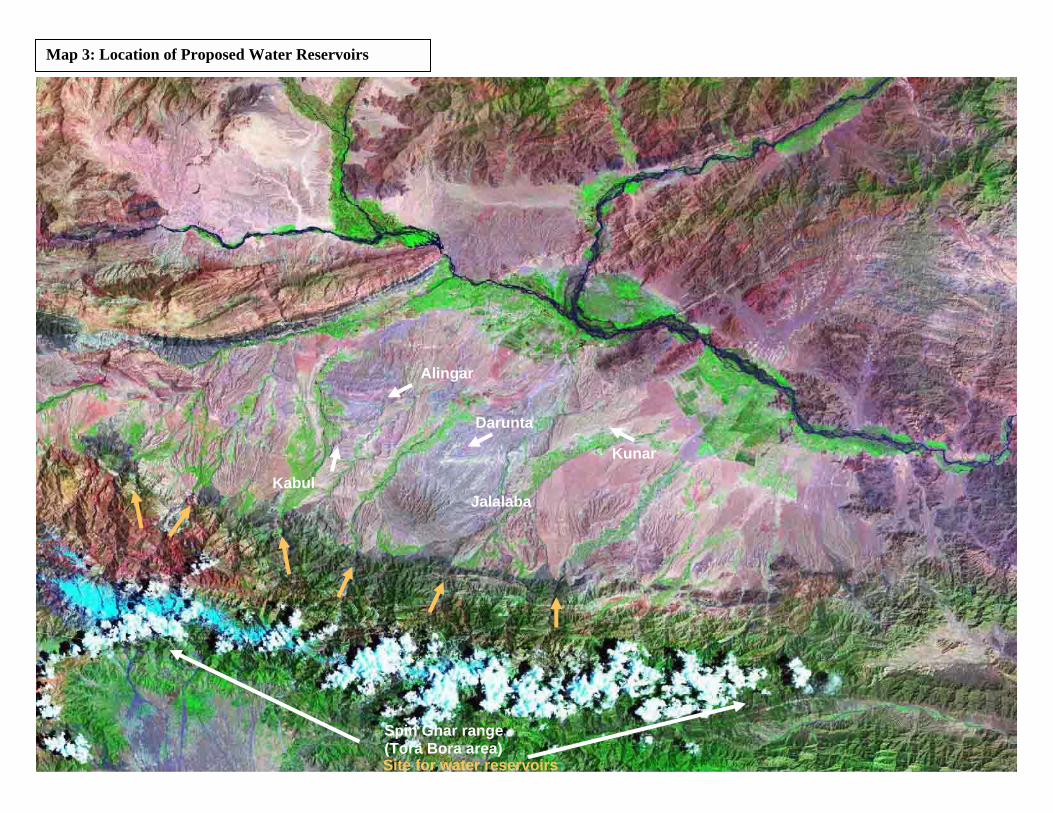
Spin Ghar range (Tora Bora area)
Map 3: Location of Proposed Water Reservoirs
Site for water reservoirs
Jalalaba
Darunta
Alingar
Kunar
Kabul