Embed Size (px)
Citation preview

1
Stock code: 6504
NAN LIU Enterprise Co., Ltd. and Subsidiary
Consolidated Financial Statements for the first quarter of 2016 and
2015 and Independent Accountants’ Review Report
Company Address: No.88, Bixiu Road, Qiaotou District, Kaohsiung City
Telephone: 07-6116616
The reader is advised that these consolidated financial statements have been prepared originally in Chinese. In
the event of a conflict between these financial statements and the original Chinese version or difference
interpretation between the two versions, the Chinese language financial statements shall prevail.

2
NAN LIU Enterprise Co., Ltd. and Subsidiary
First quarter financial statement of 2016
Table of contents
Article Pages
1. Front page 1
2. Table of contents 2
3. Independent accountants’ review report 3
4. Consolidated balance sheets 4~5
5. Consolidated statements of comprehensive income 6
6. Consolidated statements of changes in equity 7
7. Consolidated statements of cash flows 8~9
8. Notes to the consolidated financial statements 10~49
(1) Company history 10
(2) The date of authorization for issuance of the consolidated financial statements
and procedures for authorization 10
(3) Application of new standards, amendments and interpretations 10~12
(4) Summary of significant accounting policies 13~14
(5) Critical accounting judgements, estimates, and key sources of assumption
uncertainty 14
(6) Details of significant accounts 14~31
(7) Related party transactions 31~33
(8) Pledged assets 33
(9) Significant contingencies and unrecognized contract commitments 33~34
(10) Significant disaster loss 34
(11) Significant subsequent events 34
(12) Others 34~41
(13) Additional disclosures 41~47
(14) Operating segment information 48~49

3
INDEPENDENT ACCOUNTANTS’ REVIEW REPORT
The Board of Directors and Shareholders Nanliu Enterprise Company Limited We have reviewed the accompanying consolidated balance sheets of Nanliu Enterprise
Company Limited and subsidiaries (the “Company”) as of March 31, 2016 and 2015, and the
related consolidated statements of comprehensive income, changes in equity and cash flows for
the three months ended March 31, 2016 and 2015. These consolidated financial statements are
the responsibility of the Company’s management. Our responsibility is to issue a report on these
consolidated financial statements based on our reviews. We conducted our reviews in accordance with Statement of Auditing Standards No. 36, “Review
of Financial Statements,” issued by the Auditing Standards Committee of the Accounting Research
and Development Foundation of the Republic of China. A review consists principally of applying
analytical procedures to financial data and making inquiries of persons responsible for financial and
accounting matters. It is substantially less in scope than an audit conducted in accordance with
auditing standards generally accepted in the Republic of China, the objective of which is the
expression of an opinion regarding the consolidated financial statements taken as a whole.
Accordingly, we do not express such an opinion. Based on our reviews, we are not aware of any material modifications that should be made to
the consolidated financial statements referred to above for them to be in conformity with the
Guidelines Govern Preparation of Financial Reports by Securities Issuers and International
Accouting Standard 34, “Interim Financial Reporting,” endorsed by the Financial Supervisory
Commission of the Republic of China.
YANGTZE CPAS & Co., May 11, 2016 Notice to Readers The accompanying consolidated financial statements are intended only to present the consolidated
financial position, results of operations and cash flows in accordance with accounting principles
and practices generally accepted in the Republic of China and not those of any other jurisdiction.
The standards, procedures and practices to review such consolidated financial statements are those
generally accepted and applied in the Republic of China. For the convenience of readers, the accountants’ review report and the accompanying financial
statements have been translated into English from the original Chinese version prepared and used in
the Republic of China. If there is any conflict between the English version and the original Chinese
version or any difference in the interpretation of the two versions, the Chinese-language
accountant’s review report and consolidated financial statements shall prevail.

4
NAN LIU ENTERPRISE CO., LTD AND SUBSIDIARIES Consolidated Balance Sheets
(All Amounts Expressed In Thousands of New Taiwan Dollars)
March 31, 2016 December 31, 2015 March 31, 2015
(Reviewed) (Audited) (Reviewed)
ASSETS Note Amount % Amount % Amount %
CURRENT ASSETS
1100 Cash and cash equivalents 6(1) $ 567,223 10.87 $ 529,058 9.82 $ 373,409 7.25
1150 Notes receivable, net 6(2) and 7 62,891 1.21 58,691 1.09 67,891 1.32
1170 Accounts receivable, net 6(3) and 7 1,034,237 19.83 1,119,267 20.79 1,127,404 21.88
1200 Other receivables 1,095 0.02 1,495 0.03 24,504 0.48
1220 Income tax assets 6(13) - - - - - -
1310 Inventories 6(4) 965,126 18.50 991,811 18.42 799,686 15.52
1410 Prepayments 281,539 5.40 354,415 6.58 450,073 8.74
1470 Other current assets 8 64,269 1.23 44,938 0.83 58,661 1.14
Total current assets 2,976,380 57.06 3,099,675 57.56 2,901,628 56.33
NONCURRENT ASSETS
1600 Property , plant and equipment 6(5) and 8 2,016,675 38.65 2,054,428 38.15 1,851,691 35.95
1780 Intangible assets 6 - - 24 0.00 133 0.00
1840 Deferred income tax assets 6(13) 27,094 0.52 29,230 0.54 28,317 0.55
1915 Prepayments for equipment 73,178 1.40 76,135 1.41 244,775 4.75
1920 Refundable deposit 9 21,497 0.41 21,550 0.40 15,538 0.30
1985 Prepaid investments 99,479 1.91 101,322 1.88 106,612 2.07
1990 Other assets 2,413 0.05 2,463 0.06 2,491 0.05
Total noncurrent assets 2,240,336 42.94 2,285,152 42.44 2,249,557 43.67
1xxx Total assets $ 5,216,716 100.00 $ 5,384,827 100.00 $ 5,151,185 100.00
The accompanying notes are an integral part of these consolidated financial statements.

5
NAN LIU ENTERPRISE CO., LTD AND SUBSIDIARIES Consolidated Balance Sheets
(All Amounts Expressed In Thousands of New Taiwan Dollars) March 31, 2016 December 31, 2015 March 31, 2015
(Reviewed) (Audited) (Reviewed)
LIABILITIES AND EQUITY Note Amount % Amount % Amount %
CURRENT LIABILTIES
2100 Short-term loans 6(6) $ 369,653 7.09 $ 207,307 3.85 $ 373,790 7.26
2111 Short-term bills payable , net 6(7) 149,967 2.87 164,931 3.06 79,960 1.55
2150 Notes payable 486,786 9.33 540,796 10.04 453,760 8.81
2170 Accounts payable 429,068 8.22 523,562 9.72 638,250 12.40
2200 Other payable 156,073 2.99 160,252 2.98 142,714 2.77
2213 Payables on equipment 19,165 0.37 37,893 0.70 25,621 0.50
2230 Current tax liabilities 6(13) 95,965 1.84 81,986 1.52 102,875 2.00
2311 Unearned receipts 8,852 0.17 9,569 0.18 12,493 0.24
2322 Current portion of long-term bank borrowi 6(8) 87,617 1.68 169,288 3.14 54,775 1.06
2399 Other current liabilities 2,586 0.05 2,973 0.06 2,374 0.05
Total current liabilities $ 1,805,732 34.61 1,898,557 35.25 1,886,612 36.64
NONCURRENT LIABILTIES
2540 Long-term bank borrowing 6(8) 559,237 10.72 722,425 13.42 703,875 13.66
2571 Deferred income tax liabilities-Land
7,386
0.14
7,386 0.14
7,386
0.14 value increment tax
2572 Deferred income tax liabilities-income
6(13)
1,533
0.03
2,744 0.05
532
0.01 tax
2640 Accrued pension liabilities 6(9) 75,549 1.45 89,756 1.67 80,655 1.57
2645 Guarantee deposits 497 0.01 500 0.01 504 0.01
Total noncurrent liabilities 644,202 12.35 822,811 15.29 792,952 15.39
Total liabilities 2,449,934 46.96 2,721,368 50.54 2,679,564 52.03
EQUITY ATTRIBUTABLE TO SHAREHOLDERS OF THE PARENT
Owners equity
3100 Capital stock 6(10) 726,000 13.92 726,000 13.49 726,000 14.09
3200 Capital surplus 6(10) 453,467 8.69 453,467 8.42 453,467 8.80
3300 Retained earnings 6(10)
3310 Legal reserve 201,355 3.86 201,355 3.74 159,340 3.09
3320 Special reserve 44,348 0.85 44,348 0.82 44,348 0.86
3350 Unappropriated earnings 1,270,389 24.35 1,153,679 21.42 974,497 18.92
3400 Other 6(10)
3410 Financial statements translation differences for 71,223 1.37 84,610 1.57 113,969 2.21
foreign operations
Equity attributable to shareholders of the parent 2,766,782 53.04 2,663,459 49.46 2,471,621 47.97
Total liabilities and equity $ 5,216,716 100.00 $ 5,384,827 100.00 $ 5,151,185 100.00
The accompanying notes are an integral part of these consolidated financial statements.

6
NAN LIU ENTERPRISE CO., LTD AND SUBSIDIARIES Consolidated Statements of Comprehensive income
(All Amounts Expressed In Thousands of New Taiwan Dollars, Except Earnings Per Share) (Reviewed, Not Audited)
Three Months Ended March 31
2016 2015
Item Note Amount % Amount %
4110 Sales revenue $ 1,455,764 101.32 $ 1,498,416 100.57
4170 Less: Sales return (10,224) (0.71) (3,823) (0.26)
4190 Less: Sales allowances (8,756) (0.61) (4,652) (0.31)
4000 Net Sales 6(11) and 7 1,436,784 100.00 1,489,941 100.00
5000 Cost of goods sold 6(4) (1,165,072) (81.09) (1,206,484) (80.98)
5900 Gross profit 271,712 18.91 283,457 19.02
6000
Operating expenses
6100 Promotion expenses (52,862) (3.68) (62,549) (4.20)
6200 Management expenses (67,051) (4.67) (48,298) (3.24)
6300 Research expenses (5,718) (0.40) (7,697) (0.52)
6000 Total Operating expenses (125,631) (8.75) (118,544) (7.96)
6900 Operating profit 146,081 10.16 164,913 11.06
7000
Other non-operating income and expenses
7020 Other income 6(12) 17,870 1.24 34,595 2.32
7050 Finance costs 6(12) (4,626) (0.32) (6,036) (0.41)
7000 Other non-operating income and expenses 13,244 0.92 28,559 1.91
7900 Income before income tax 159,325 11.08 193,472 12.97
7950 Income tax expense 4 and 6(13) (42,615) (2.97) (42,680) (2.86)
8200 Net Income 116,710 8.11 150,792 10.11
8300
Other comprehensive income (loss)
8360 Items that may be reclassified subsequently to profit or loss
8361 Financial statements translation 6(10) (13,387) (0.93) (24,429) (1.64)
differences for foreign operations
8399 Income tax benefit (expense) related to - - - -
components of other comprehensive
income that may be reclassified subsequently
8300 Other comprehensive income(loss)for the period ,net of income tax (13,387) (0.93) (24,429) (1.64)
8500 Total comprehensive income for the period $ 103,323 7.18 $ 126,363 8.47
8600
Net income attributable to :
8610 Owners of parent 116,710 8.11 150,792 10.11
8620 Non-controlling interests - - - -
Net income 116,710 8.11 150,792 10.11
8700
Comprehensive income attributable to :
8710 Owners of parent 103,323 7.18 126,363 8.47
8720 Non-controlling interests - - - -
Total comprehensive income for the period 103,323 7.18 126,363 8.47
9750 Basic earnings per share(NT dollars) 6(15) $ 1.61 $ 2.08
9850 Diluted earnings per share(NT dollars) 6(15) $ 1.61 $ 2.08
The accompanying notes are an integral part of these consolidated financial statements.

7
NAN LIU ENTERPRISE CO., LTD AND SUBSIDIARIES
Consolidated Statements of Changes in Equity
(All Amounts Expressed In Thousands of New Taiwan Dollars, Except Earnings Per Share)
(Reviewed, Not Audited)
Equity attributable to owners of parent
Stock Retained Earnings Other equity items
Capital Surplus
Unappropriated
Financial statements Total Equity
Ordinary shares Amounts
Legal Reserve Special Reserve translation differences
Earnings
for foreign operations
Balance as of January 1, 2015 72,600 $ 726,000 $ 453,467 $ 159,340 $ 44,348 $ 823,705 $ 138,398 $ 2,345,258
Net income for the three months ended March -
-
-
-
-
150,792
-
150,792
31,2015
Other comprehensive income for the three
months ended March 31, 2015, net of income - - - - - - (24,429) (24,429)
tax
Balance as of March 31, 2015 72,600 $ 726,000 $ 453,467 $ 159,340 $ 44,348 $ 974,497 $ 113,969 $ 2,471,621
Balance as of January 1, 2016 72,600 $ 726,000 $ 453,467 $ 201,355 $ 44,348 $ 1,153,679 $ 84,610 $ 2,663,459
Net income for the three months ended March -
-
-
-
-
116,710
-
116,710
31,2016
Other comprehensive income for the three months -
-
-
-
-
-
(13,387)
(13,387)
ended March 31, 2016, net of income tax
Balance as of March 31, 2016 72,600 $ 726,000 $ 453,467 $ 201,355 $ 44,348 $ 1,270,389 $ 71,223 $ 2,766,782
The accompanying notes are an integral part of these consolidated financial statements.

8
NAN LIU ENTERPRISE CO., LTD AND SUBSIDIARIES
Consolidated Statements of Cash Flows
(All Amounts Expressed In Thousands of New Taiwan Dollars)
(Reviewed, Not Audited) Three Months Ended March 31
2016 2015
Cash flows from operating activities
Consolidated Profit before income tax $ 159,325 $ 193,472
Adjustments for::
Depreciation expense 73,999 64,646
Amortization expense 1,623 1,590
Provision for doubtful accounts 15,169 12,011
Other expense 54 -
Interest expense 4,626 6,036
Interest income (681) (736)
(Reversal of allowance) Provision for inventory market 2,149
-
price decline
Loss on disposal of inventory 1,465 3
Loss on disposal of assets 1,398 798
(Reversal) Impairment of Assets (2,283) (551)
Foreign exchange loss (gain) 623 (386)
Total adjustments to reconcile profit or loss 98,142 83,411
Changes in operating assets and liabilities
(Increase) in notes receivable (4,200) (14,478)
Decrease (Increase) in accounts receivable 64,312 (80,324)
Decrease (Increase) in other receivable 377 (21,021)
Decrease (Increase) in inventories 23,071 (28,904)
Decrease (Increase) Decrease in prepayments 76,176 (88,828)
(Increase) Decrease in other current assets (25,572) 12,271
(Decrease) in notes payable (52,168) (76,114)
(Decrease) Increase in accounts payable (88,333) 91,195
(Decrease) in other payable (4,119) (14,034)
(Decrease) in unearned receipts (717) (1,344)
(Decrease) Increase in accrued pension liabilities (14,207) 562
Total Changes in Operating Assets and Liabilities (25,380) (221,019)
Cash generated from operating 232,087 55,864
Interest received 704 939
Income taxes paid (27,711) (20,060)
Net cash generated by operating activities 205,080 36,743
(Continued)

9
Cash flows from investing activities
Acquisition of property , plant and equipment (38,153) (61,382)
(Increase) in prepayments for equipment (26,313) (54,611)
Decrease in restricted assets 6,310 11,664
(Increase) Decrease in Instead of payment (69) 739
Decrease in other noncurrent assets - 146
(Increase) in refundable deposits - (68)
Net cash used in investing activities (58,225) (103,512)
Cash Flows From Financing Activities
Interest paid (4,650) (5,792)
Increase in short-term loans 162,346 115,032
(Decrease) in short-term bills payable (15,000) (10,000)
(Decrease) Increase in long-term loans (245,359) 17,278
(Decrease) Increase in other current liabilities (387) 98
Net cash used in financing activities (103,050) 116,616
Effect of exchange rate changes on cash and cash
(5,640)
(15,773)
equivalents
Net Increase in cash and cash equivalents 38,165 34,074
Cash and cash equivalents, beginning of period 529,058 339,335
Cash and cash equivalents, end of period $ 567,223 $ 373,409
The accompanying notes are an integral part of the consolidated financial statements. (Concluded)

10
NAN LIU Enterprise Co., Ltd. and Subsidiary
Notes to Consolidated financial statements
for the Three Months Ended March 31 of the 2016 and 2015
(After review, not in accordance with generally accepted auditing standards)
(Except for particular note, the unit is based on NT$1000)
1. Company history
NAN LIU Enterprise Co., Ltd. (hereinafter referred to as the company) was established
in 1973 and approved by the Ministry of Economic Affairs with the registered address of
No.88, Bixiu Road, Qiaotou District, Kaohsiung City. NAN LIU Company was listed for
trading in the Taiwan Stock Exchange Corporation on May 7th of 2013. The NAN LIU
Group consolidated financial statements consist of NAN LIU Company and its Subsidiary,
a group of associated enterprises and joint ventures controlled under individual rights
(hereinafter referred to as the group), and concluded on March 31st of 2016. NAN LIU
Group is engaged in selling air-through nonwovens, spunlace nonwovens, wet napkins,
facial masks and skin care products as shown in appendix 14. The functional currency of the
consolidated financial statements is the New Taiwan (NT) dollar.
2. The date of authorization for issuance of the consolidated financial statements and procedures
for authorization
Consolidated financial statements were approved and authorized for issue by the board of
directors on May 11th of 2016.
3. Application of new standards, amendments and interpretations
(1) We have adopted the criteria for international financial reports approved by the Financial
Supervisory Commission (FSC): None
(2) We have not adopted the new announcements and amendments of the criteria for
international financial reports approved by FSC: None
The International Accounting Standards Board (ASB) has announced the criteria for
international financial reports without approval by the Financial Supervisory Commission
IFRS, IAS, IFRIC and SIC (hereafter referred as IFRSs) that have been announced by the
ASB but have not been approved by the Financial Supervisory Commission are not suitable
for NAN LIU Group. The Commission on March 10th of 2016 published IFRSs has been
approved in 2017. The IASB announced on January 1st of 2016, that IFRSs took effect, not
including IFRS9 for "financial instruments" and IFRS15 for "customer contract income"
that had not been confirmed on the availability date of the IFRSs. In addition, the

11
Commission announced that public companies in Taiwan should begin employing IFRS15
in 2018. The FSC had not released a new correction/revision of its guidelines or other
criteria than the effective dates before the publishing date of these consolidated financial
reports.
New releases/corrections/amendments to the guidelines and
explanations
The International
Accounting
Standards Board as
of the effective date
The 9th International Financial Reporting Standard on "financial
instruments"
On January 1st, 2018
The 7th and 9th International Financial Reporting Standards
"mandatory effective date and transition revealed"
On January 1st, 2018
The 10th International Financial Reporting Standard and the 28th
International Accounting Standard "investors asset sale between
associated companies and joint ventures or invest"
Undecided
New releases/corrections/amendments to the guidelines and
explanations
The International
Accounting
Standards Board as
of the effective date
The 10th, 12th International Financial Reporting Standards and the
28th International Accounting Standard "investment entities: applying
the consolidation exception"
On January 1st, 2016
Amendment to International Financial Reporting Standard 11
"accounting for acquisitions of interests in joint operations”
On January 1st, 2016
The 14th International Financial Reporting Standard "regulatory
deferral accounts"
On January 1st, 2016
The 15th International Financial Reporting Standard "revenue from
contracts with customers"
On January 1st, 2018
Amendment to the 15th International Financial Reporting Standard
"clarifications to revenue from contracts with customers"
On January 1st, 2018
The 16th International Financial Reporting Standard "leases"
On January 1st, 2019
Amendment to the 11th International Accounting Standard "disclosure
initiative"
On January 1st, 2016
Amendment to the 7th International Accounting Standard "disclosure
initiative"
On January 1st, 2017
Amendment to the 12th International Financial Reporting Standard
"recognition of deferred tax assets for unrealized losses"
On January 1st, 2017
Amendment to the 16th and 38th International Accounting Standards
to clarify "acceptable methods of depreciation and amortization"
On January 1st, 2016

12
Amendment of the 16th and 41st International Accounting Standards
"agriculture: bearer plants"
On January 1st, 2016
Amendment to the 19th International Accounting Standard
"defined benefit plans: employee contributions"
On July 1st, 2014
Amendment to the 27th International Accounting Standard “equity
method in separate financial statements”
On January 1st, 2016
Amendment to the 36th International Accounting Standard
"recoverable amount disclosures for non-financial assets"
On January 1st, 2014
Amendment to the 39th International Accounting Standard
“continuing hedge accounting after novation”
On January 1st, 2014
Interpretations of the 21st International Financial Reporting Standard
"taxation"
On January 1st, 2014
The improvements to International Financial Reporting Standards
from 2010 to 2012
On July 1st, 2014
The improvements to International Financial Reporting Standards
from 2011 to 2013
On July 1st, 2014
The improvements to International Financial Reporting Standards
from 2012 to 2014
On January 1st, 2016
The NAN LIU Company continues to assess these criteria and an explanation of the
impact of financial position and operating results will be revealed when the assessment
is completed.

13
4. Summary of significant accounting policies
(1) Statement of Compliance
The consolidated financial statements are prepared in conformity with the “Regulations
Governing the Preparation of Financial Reports by Securities Issuers” (hereinafter "the
guidelines") and FSC recognized the 34th International Accounting Standard "interim
financial reporting". The consolidated financial report does not contain data in
accordance with FSC approved International Financial Reporting Standards,
explanations and interpretations (hereinafter "FSC approved International Financial
Reporting Standards"). Preparation of the annual consolidated financial statements
should reveal all the necessary information.
Apart from the described in the following paragraphs, the consolidated quarterly
statements adopted by major accounting policies is incorporated in the same
consolidated financial statements of the 2015. Related information refers to
consolidated financial statements noted as IV in 2015.
(2) Basis of Consolidation
Consolidated financial quarterly statement principles were consistent with consolidated
financial statements in 2015. Please refer to note IV for related information.
Consolidated financial statements of subsidiaries including: Percentage of ownership
Investment company
name Subsidiary name Business features 105.3.31 104.12.31 104.3.31
Nan Liu Enterprise
Co., Ltd.
NANLIU
ENTERPRISE
(SAMOA) CO.,
LTD.
Overseas investment
holding company
100 100 100
NANLIU
ENTERPRISE
(SAMOA) CO.,
LTD.
Nanliu Enterprises
(Pinghu) Ltd.
Production and sales
of special textiles,
hair care, skin care,
cosmetics and
hygiene products
100
100
100
(3) Other significant accounting policies
1. Income tax
This group is in accordance with the 34th International Accounting Standard
"interim financial statements", referred to paragraph B12 regulations.
Measurement and disclosure of income tax expenses
Income tax expense to net profit before tax for the period is multiplied by
management for the best estimate of the annual effective tax rate to measure and
recognize as income tax expenses for the current period.
Income tax expenses are recognized directly in equity projects or other
comprehensive income items, related assets and liabilities. The carrying amount for

14
financial statement purposes and their tax bases of temporary differences are based
on the expected realization or the applicable tax rate to be measured.
2. Employee benefits
Pensions with benefit plan figures adopt previous year reports in accordance with
the actuarial pension cost ratio. This is based on annual measurement, the reports of
major future market fluctuations, significant cuts, liquidity or other significant
events to be adjusted.
5. Critical accounting judgements and key sources of estimation and uncertainty
Management level is in accordance with the 34th International Accounting Standards
approved by FSC of "interim financial reporting". The above states that consolidated
financial statements must make judgments, estimations and assumptions that influence
accounting policies of adopting assets, liabilities, income and expenses. Actual results and
estimates will be differed.
When preparing the consolidated quarterly financial statements, management adopts
combined company accounting policies to make significant judgments and estimates the
main source of uncertainty that is consistent with consolidated financial statements, as note
V.
6. Details of significant accounts
(1) Cash and cash equivalents Items March 31, 2016 December 31, 2015 March 31, 2015
Cash $ 1,673 $ 2,296 $ 2,625
Demand deposits 264,229 260,375 236,174
Checking account 75 84 72
Foreign currency deposits 291,750 230,838 120,886
Time deposits 9,496 35,465 13,652
Total $ 567,223 $ 529,058 $ 373,409
1. NAN LIU Group possesses good credit with financial institutions and interacts with
several financial institutions to diversify credit risk. The anticipated possibility of
default is very low, and the balance sheet figure for exposure cash amount on maximum
credit risks is same as cash equivalents
2. NAN LIU Group's cash and cash equivalents had not been provided to pledge.
(2) Notes receivable, net Items March 31, 2016 December 31, 2015 March 31, 2015
Non-related parties $ 62,891 $ 58,691 $ 70,513
Related parties - - -
Less: Allowance for
doubtful receivables - - (2,622)
Net $ 62,891 $ 58,691 $ 67,891
NAN LIU Group does not have collateral as security for receivable notes

15
(3) Accounts receivable, net
Items March 31, 2016 December 31, 2015 March 31, 2015
Non-related parties $ 1,061,370 $ 1,131,076 $ 1,141,508
Related parties - 182 311
//Less: allowance for
doubtful receivables (27,133) (11,991) (14,415)
Net $ 1,034,237 $ 1,119,267 $ 1,127,404
1. Overdue but not in impairment of the financial assets aging analysis
March 31, 2016 December 31, 2015 March 31st, 2015
Neither past due nor
impaired $ 1,029,368 $ 1,082,913 $ 1,096,373
Past due but not impaired
Within 60 days 37,719 86,525 90,337
From 61 to 90 days 18,229 7,361 7,884
From 91 to 180 days 11,472 1,149 658
Over 180 days 340 10 43
Total $ 1,097,128 $ 1,177,958 $ 1,195,295
2. Movements of the allowance for doubtful receivables:
From January 1st to March 31st of 2016
Individually
assessed for impairment
Collectively
assessed for impairment
Total
On January 1st, 2016 $ 1,625 $ 11,991 $ 13,616
Provision (reversal) for
impairment (20) 15,189 15,169
Exchange difference (3) (47) (50)
On March 31st, 2016 $ 1,602 $ 27,133 $ 28,735
From January 1st to March 31st of 2015
Individually
assessed for impairment
Collectively
assessed for impairment
Total
On January 1st, 2015 $ 3,174 $ 5,054 $ 8,228
Provision (reversal) for
impairment (34) 12,045 12,011
Exchange difference - (62) (62)
On March 31st, 2015 $ 3,140 $ 17,037 $ 20,177
3. The asset impairment loss assessment of individual accounts receivable is located in
the column, "other non-current assets".

16
4. For NAN LIU Group's accounts receivable on March 31st, 2016, December 31st and
March 31st, the exposure amount of maximum credit risk is the book value for
receivables.
5. NAN LIU Group did not hold collateral for accounts receivable.
(4) Net inventories March 31, 2016
Cost Allowance for price
decline of inventories Book value
Raw materials $ 376,373 $ 4,360 $ 372,013
Supplies 77,884 6,323 71,561
Work in process 17,905 1,755 16,150
Finished goods 491,838 10,647 481,191
Merchandise
inventory 4,730 838 3,892
Inventory in transit 20,319 - 20,319
Total $ 989,049 $ 23,923 $ 965,126
December 31, 2015
Cost Allowance for price
decline of inventories Book value
Raw material $ 386,122 $ 7,081 $ 379,041
Supplies 78,262 2,485 75,777
Work in process 19,140 2,400 16,740
Finished goods 505,934 9,110 496,824
Merchandise
inventory 7,823 698 7,125
Inventory in transit 16,304 - 16,304
Total $ 1,013,585 $ 21,774 $ 991,811
March 31, 2015
Cost Allowance for price
decline of inventories Book value
Raw material $ 299,808 $ 9,545 $ 290,263
Supplies 81,464 2,832 78,632
Work in process 26,340 2,608 23,732
Finished goods 356,415 6,711 349,704
Merchandise
inventory 11,147 78 11,069
Inventory in transit 46,286 - 46,286
Total $ 821,460 $ 21,774 $ 799,686
1.Inventories are provided without guarantee or pledge as of March 31st of 2016,
December 31st and March 31st of 2015.
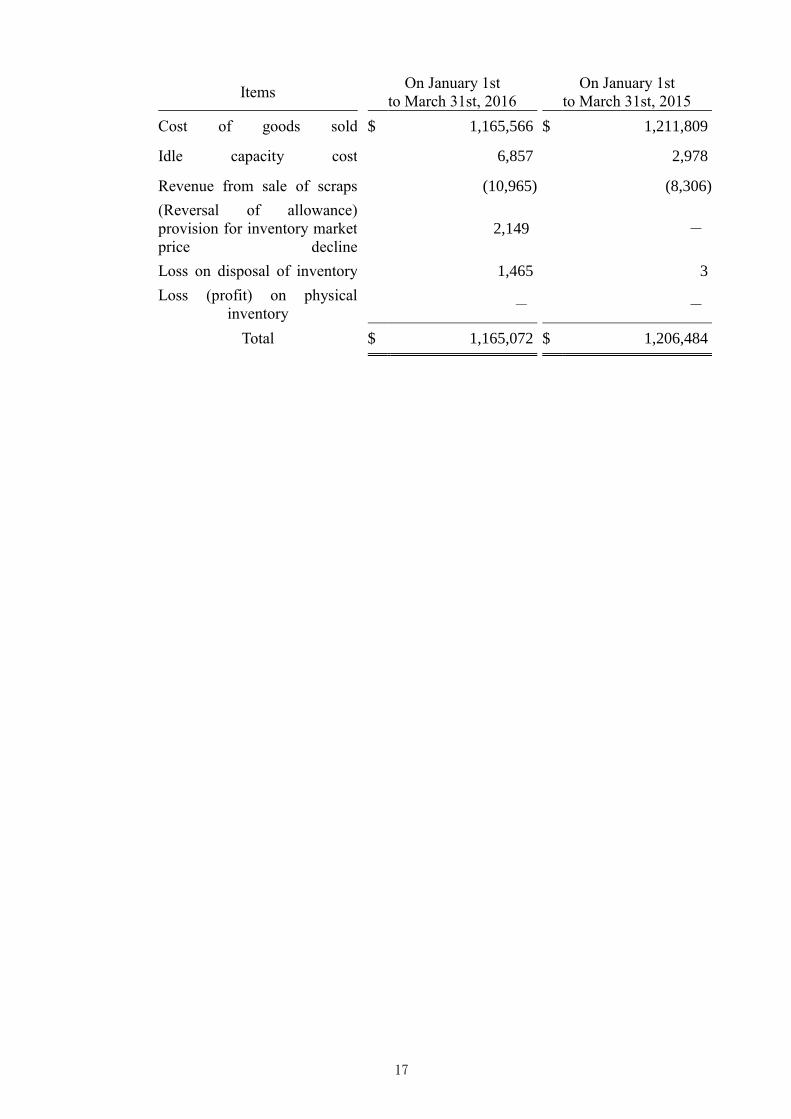
2. Inventory related to charges recognized in the losses of the current period is detailed as
follows:
17
Items On January 1st
to March 31st, 2016
On January 1st
to March 31st, 2015
Cost of goods sold $ 1,165,566 $ 1,211,809
Idle capacity cost 6,857 2,978
Revenue from sale of scraps (10,965) (8,306)
(Reversal of allowance)
provision for inventory market
price decline
2,149 -
Loss on disposal of inventory 1,465 3
Loss (profit) on physical
inventory - -
Total $ 1,165,072 $ 1,206,484

18
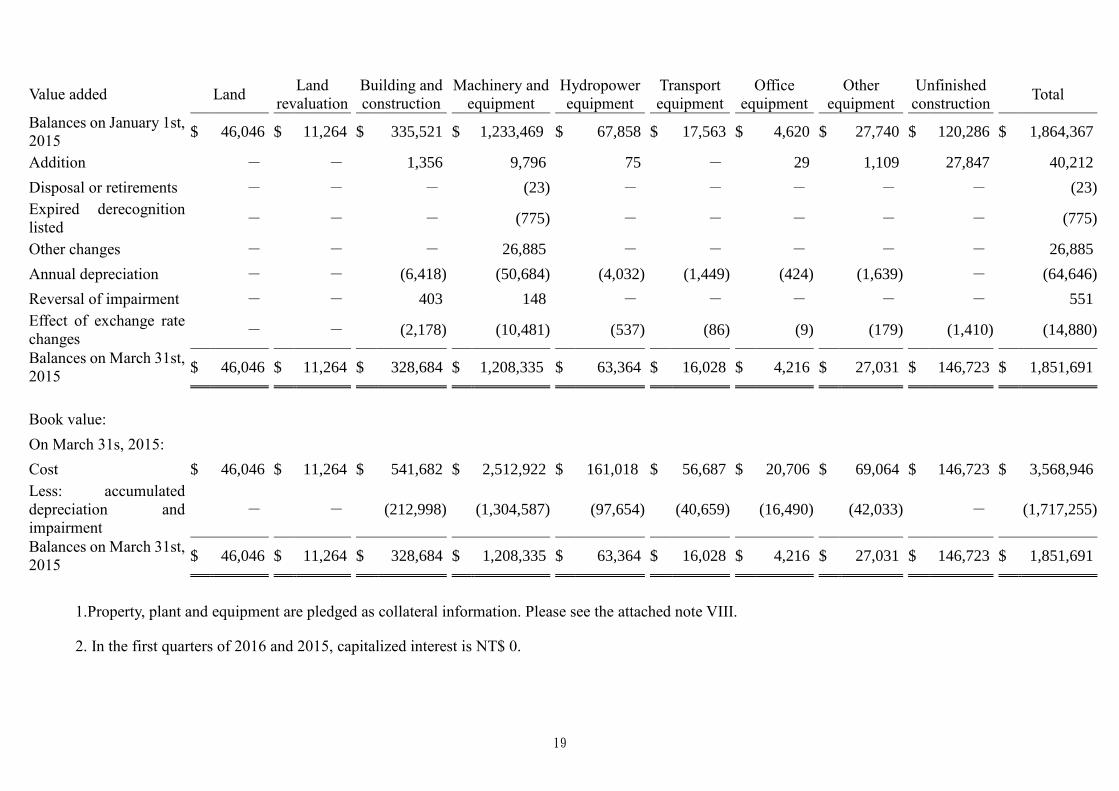
(5) Property, plant and equipment
Value added Land Land revaluation
Building and construction
Machinery and equipment
Hydropower equipment
Transport equipment
Office equipment
Other equipment
Construction in progress
Total
Balance on January 1st, 2016
$ 46,046 $ 11,264 $ 419,111 $ 1,377,970 $ 105,233 $ 19,082 $ 3,208 $ 26,186 $ 46,328 $ 2,054,428
Added - - 108 13,220 - - 26 1,813 2,416 17,583
Disposals or retirements - - - (1,398) - - - - - (1,398)
Deconsolidation - - - - - - - - - -
Other changes - - - 25,101 - - - 654 - 25,755
Annual depreciation - - (7,585) (58,210) (4,462) (1,550) (416) (1,776) - (73,999)
Reversal of impairment - - 392 1,891 - - - - - 2,283
Effect of exchange rate changes
- - (2,179) (5,158) (444) (29) (3) (77) (87) (7,977)
Balance on March 31st, 2016
$ 46,046 $ 11,264 $ 409,847 $ 1,353,416 $ 100,327 $ 17,503 $ 2,815 $ 26,800 $ 48,657 $ 2,016,675
Carrying value:
On March 31st, 2016:
Cost $ 46,046 $ 11,264 $ 647,777 $ 2,846,762 $ 209,396 $ 55,167 $ 20,625 $ 74,828 $ 48,657 $ 3,960,522
Less: Accumulated depreciation and impairment
- - (237,930) (1,493,346) (109,069) (37,664) (17,810) (48,028) - (1,943,847)
Balance on March 31st, 2016
$ 46,046 $ 11,264 $ 409,847 $ 1,353,416 $ 100,327 $ 17,503 $ 2,815 $ 26,800 $ 48,657 $ 2,016,675
Carrying value:
On December 31st, 2015:
Cost $ 46,046 $ 11,264 $ 649,814 $ 2,822,677 $ 210,135 $ 55,241 $ 20,632 $ 72,526 $ 46,328 $ 3,934,663
Less: Accumulated depreciation and impairment
- - (230,703) (1,444,707) (104,902) (36,159) (17,424) (46,340) - (1,880,235)
Balances on December 31st, 2015
$ 46,046 $ 11,264 $ 419,111 $ 1,377,970 $ 105,233 $ 19,082 $ 3,208 $ 26,186 $ 46,328 $ 2,054,428
19
Value added Land Land
revaluation Building and
construction Machinery and
equipment Hydropower
equipment
Transport
equipment
Office
equipment
Other
equipment
Unfinished
construction Total
Balances on January 1st,
2015 $ 46,046 $ 11,264 $ 335,521 $ 1,233,469 $ 67,858 $ 17,563 $ 4,620 $ 27,740 $ 120,286 $ 1,864,367
Addition - - 1,356 9,796 75 - 29 1,109 27,847 40,212
Disposal or retirements - - - (23) - - - - - (23)
Expired derecognition
listed - - - (775) - - - - - (775)
Other changes - - - 26,885 - - - - - 26,885
Annual depreciation - - (6,418) (50,684) (4,032) (1,449) (424) (1,639) - (64,646)
Reversal of impairment - - 403 148 - - - - - 551
Effect of exchange rate
changes - - (2,178) (10,481) (537) (86) (9) (179) (1,410) (14,880)
Balances on March 31st,
2015 $ 46,046 $ 11,264 $ 328,684 $ 1,208,335 $ 63,364 $ 16,028 $ 4,216 $ 27,031 $ 146,723 $ 1,851,691
Book value:
On March 31s, 2015:
Cost $ 46,046 $ 11,264 $ 541,682 $ 2,512,922 $ 161,018 $ 56,687 $ 20,706 $ 69,064 $ 146,723 $ 3,568,946
Less: accumulated
depreciation and
impairment
- - (212,998) (1,304,587) (97,654) (40,659) (16,490) (42,033) - (1,717,255)
Balances on March 31st,
2015 $ 46,046 $ 11,264 $ 328,684 $ 1,208,335 $ 63,364 $ 16,028 $ 4,216 $ 27,031 $ 146,723 $ 1,851,691
1.Property, plant and equipment are pledged as collateral information. Please see the attached note VIII.
2. In the first quarters of 2016 and 2015, capitalized interest is NT$ 0.
20
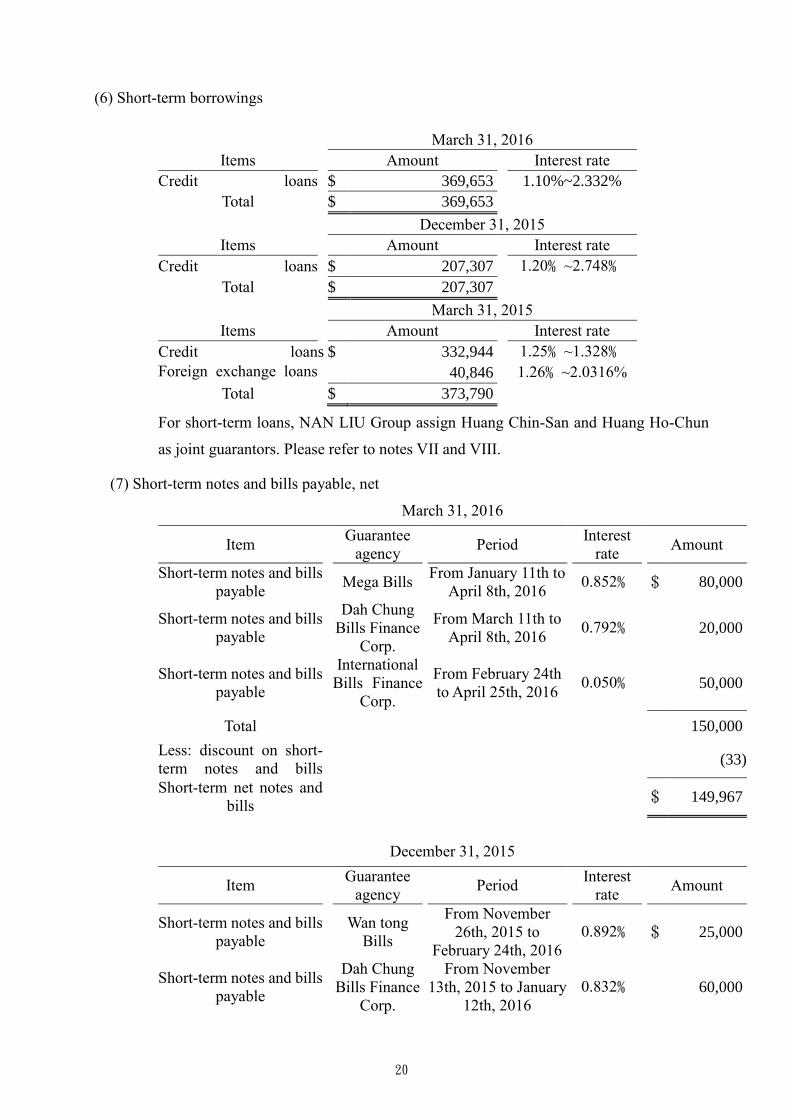
(6) Short-term borrowings
March 31, 2016
Items Amount Interest rate
Credit loans $ 369,653 1.10%~2.332%
Total $ 369,653
December 31, 2015
Items Amount Interest rate
Credit loans $ 207,307 1.20﹪~2.748﹪
Total $ 207,307
March 31, 2015
Items Amount Interest rate
Credit loan s $ 332,944 1.25﹪~1.328﹪
Foreign exchange loans 40,846 1.26﹪~2.0316%
Total $ 373,790
For short-term loans, NAN LIU Group assign Huang Chin-San and Huang Ho-Chun
as joint guarantors. Please refer to notes VII and VIII.
(7) Short-term notes and bills payable, net
March 31, 2016
Item Guarantee
agency Period
Interest
rate Amount
Short-term notes and bills
payable Mega Bills
From January 11th to
April 8th, 2016 0.852﹪ $ 80,000
Short-term notes and bills
payable
Dah Chung
Bills Finance
Corp.
From March 11th to
April 8th, 2016 0.792﹪ 20,000
Short-term notes and bills
payable
International
Bills Finance
Corp.
From February 24th
to April 25th, 2016 0.050﹪ 50,000
Total 150,000
Less: discount on short-
term notes and bills (33)
Short-term net notes and
bills $ 149,967
December 31, 2015
Item Guarantee
agency Period
Interest
rate Amount
Short-term notes and bills
payable
Wan tong
Bills
From November
26th, 2015 to
February 24th, 2016
0.892﹪ $ 25,000
Short-term notes and bills
payable
Dah Chung
Bills Finance
Corp.
From November
13th, 2015 to January
12th, 2016
0.832﹪ 60,000

21
Short-term notes and bills
payable
International
Bills Finance
Corporation
From December 1st,
2015 to January 11th,
2016
0.962﹪ 80,000
Total 165,000
Less: discount on Short-
term notes and bills (69)
Short-term net notes and
bills $ 164,931
March 31, 2015
Item Guarantee
agency Period
Interest
rate Amount
Short-term notes and bills
payable
Wan tong
Bills
From January 22nd
to April 22nd, 2015 0.860﹪ $ 50,000
Short-term notes and bills
payable
China Bills
Finance
Corporation
From January 26th to
April 24th, 2015 0.782﹪ 30,000
Total 80,000
Less: discount on short-
term notes and bills
discount
(40)
Short-term net notes and
bills $ 79,960
(8) Long-term bank borrowing and current portion of long-term bank borrowing March 31, 2016 December 31, 2015 March 31, 2015
Credit loans $ 646,854 $ 891,713 $ 758,650
Secured bank borrowings - - -
Subtotal 646,854 891,713 758,650
Less: current portion of
long-term bank
borrowings
(87,617) (169,288) (54,775)
Total $ 559,237 $ 722,425 $ 703,875
Range of maturity dates From January 2015
to March 2022
From January 2014
to March 2022
From January 2012
to March 2022
Range of interest rates 1.359﹪~1.71% 1.51﹪~1.95﹪ 1.75﹪~4.20﹪
1. NAN LIU Group pledges some part of its assets as collateral against the loans listed
above. Please refer to note VIII.
2. NAN LIU Group's Subsidiary borrowed money from Mega Bank. Aside from other
regulations affecting company operation of its financial ratio, the first half and annual
consolidated financial statements is limited to (1) contract average annual use rate
under 60% (covering) with an interest rate according to the currency added 0.1% (these

22
conditions have been canceled as of July 1st, 2015) and (2) a cash flow management
account, in that the loaning bank and this Group should remit payment, receivable notes
or other cash flows to the cash flow management account. Please review the Group's
parent company half-year remittances from the contract approved date. In the next
month, if the total amount does not exceed 400 million dollars, the interest rates shall
be raised by 0.1%.
(9) Pensions
:1. Defined benefit plan;
(1) There were no major market fluctuations, significant reductions, liquidations or
other significant events. Thus, NAN LIU Group adopted the actuarial cost
method to measure and report the pension costs during the period of 2015 and
December 31st, 2014.
(2) NAN LIU Group recognized the cost and details of each item in the statements
of comprehensive income areas follows:
First quarter of
2016
First quarter of
2015
Cost of goods sold $ 317 $ 350
Selling expenses 23 24
General and administrative
expenses 217 187
Research and development
expenses 78 107
Total $ 635 $ 668
2. Contribution plans
The pension costs (including pension insurance) under the Group’s defined
contribution pension plans for the quarter ending on March 31, 2016 and 2015 were
$4,042 thousand and $4,022 thousand, respectively.
(10) Capital and other equity
1. Common stock
Up to March 31st, 2016, the nominal capital of NAN LIU Group's parent company is
NT$ 1,000,000 thousand , and paid-in stock capital is NT$ 726,000 thousand.
2. Additional paid-in capital
March 31, 2016 December 31,
2015 March 31, 2015
Additional paid-in capital $ 439,404 $ 439,404 $ 439,404
Employee stock options 14,063 14,063 14,063
Total $ 453,467 $ 453,467 $ 453,467

23
According to the provisions of the Company Act concerning the face value of share
premiums, gifts of assets donated to additional paid-in capital are to be used for
covering any deficit. If there is no accumulated deficit in the company, the company
shall issue new shares with the existing shares or cash ratio to shareholders. According
to the relevant provisions of the Securities Exchange Act, allocated capital from
additional paid-in capital, its maximum not exceeding the limit of 10% of the paid-up
capital each year and the company in surplus reserves filling the capital loss still
remaining insufficient, may not be complemented by additional paid-in capital.
3. Retained earnings and dividend policy
(1) According to the Company’s Articles of Incorporation (to be resolved by the
Shareholders' Meeting on June 13, 2015):
a. Over 1% of the current year’s earnings, if there were earnings, shall be
distributed as employee bonuses and less than 2% as director and supervisor
remuneration. However, if the Company still has accumulated loss, the
compensation shall be kept.
b. Remuneration of employees shall be paid by stock or cash, including
employees of affiliated companies who meet certain criteria. Remuneration
of directors and supervisors may be paid in cash.
c. 10% of the annual net income, after offsetting any loss from prior years and
paying all taxes and dues, shall be set aside as legal reserve. Then, special
reserve is set aside or reserved according to laws or competent authority. The
appropriation of the remaining amount, along with any unappropriated
earnings, shall be proposed by the Board of Directors and resolved by the
shareholders to be distributed as dividends. Cash dividends, however, shall
be no less than 20% of total dividends.
d. Aforementioned distribution of earnings shall be resolved and recognized in
the shareholders' meeting held in the following year.
(2) The legal reserve shall not be used for any purpose other than covering
accumulated deficit or issuing new stocks or cash to shareholders in proportion
to their share of ownership. The use of legal reserve for the issuance of stocks
or cash to shareholders in proportion to their share ownership is permitted,
provided that the distribution of the reserve is limited to the portion in excess
of 25% of the Company’s paid-in capital.

24
(3) NAN LIU Company accrued profit sharing bonus to employees based on a
percentage of net income before income tax, profit sharing bonus to employees
and compensation to directors during the period, which amounted to NT$1,469
thousand for the three months ended March 31, 2016. NAN LIU Company
accrued profit sharing bonus to employees based on certain percentage of net
income during the period, which amounted to NT$2,714 thousand for the three
months ended March 31, 2015. Compensation to directors was expensed based
on estimated amount payable. If there is a change in the proposed amounts after
the annual consolidated financial statements are authorized for issue, the
differences are recorded as a change in accounting estimate.
(4) NAN LIU’s profit sharing bonus to employees and compensation to directors in
the amounts of NT$8,448 thousand and NT$4,224 thousand in cash for 2015,
respectively, had been approved by the Board of Directors on March 18, 2016.
The aforementioned approved amount has no difference with the one recognized
in the consolidated financial statements for the years ended December 31, 2015.
The distribution of profits for 2015 will be resolved by shareholders on June 13th,
2016.
(5) The distributions of retained earnings for 2014 and 2013 were approved by the
shareholders’ meeting on June 2, 2015 and June 6, 2014, respectively. The
appropriations and dividends per share were as follows: 2014 2013
Dividends per
share (NT$) Sum
Dividends per
share (NT$) Amount
Cash 2.8 $ 203,280 2.2 $ 159,720
Shares - - - -
$ 203,280 $ 159,720
Bonus to
employees - cash $ 7,563 $ 6,782
Remuneration to
directors and
supervisors
3,781 3,391
$ 11,344 $ 10,173
The appropriations of Earnings of 2014 were as follows:
2014
The amount to be allocated by
the Board of Directors
allotment case
Estimated annual cost
recognized in the
Differences

25
estimated
amount
1. Distribution
Cash bonus to
employees $ 7,563 $ 7,563 $ -
Remuneration of
directors and
supervisors
$ 3,781 $ 3,781 $ -
Distribution of 2014 retained earnings was the same as proposal by the
Board of Directors on May 12, 2015 and the shareholder resolution made on
June 2, 2015. Please refer to the Taiwan Stock Exchange website under
“Market Observation Post System” for the resolutions of the Board of
Directors and shareholders’ meeting.
4. Other equity
Foreign Currency
Translation Difference
On January 1st, 2016 $ 84,610
Currency translation differences
(after tax) (13,387)
On March 31st, 2016 $ 71,223
On January 1st, 2015 $ 138,398
Currency translation differences
(after tax) (24,429)
On March 31st, 2015 $ 113,969
The conversion of foreign-operating agency net assets to company currency will cause
exchange differences. This can be recognized as other comprehensive income and
accumulated in the conversion of financial statements due to the foreign operating
agency exchange differences.
(11) Net Sales First quarter of 2016 First quarter of 2015
Sale of goods $ 1,436,661 $ 1,489,933
Sale of processing 123 8
Total $ 1,436,784 $ 1,489,941
(12) Non-operating income and expenses
1. Other First quarter of 2016 First quarter of 2015

26
Interest income
$ 681 $ 736
Impairment (reversal gain) of
PPE 2,283 551
(gain) on disposal of PPE (1,398) (798)
Net currency exchange gain (4,575) 10,802
Other income 20,879 23,304
Total $ 17,870 $ 34,595
2. Financial costs
First quarter of 2016 First quarter of 2015
Interest expense (Bank loans) $ 4,626 $ 6,036
(13) Income taxes
NAN LIU Group is in compliance with the 34th International Accounting Standard
"interim financial reporting". Paragraph B12 provides the measurement and
disclosure of income tax expenses during the period.
1. Income tax expense
(1) Components of income tax expense:
Items First quarter of 2016 First quarter of 2015
Current income tax
Income tax incurred in current
period
$ 41,690 $ 50,603
10% tax on unappropriated
earnings - -
Income tax adjustments on prior
years - 426
Deferred income tax expense
Recognition and reversal of
temporary differences 925 (8,349)
Income tax expense $ 42,615 $ 42,680
(2) The income tax (gains) related to components of other comprehensive income is as
follows:
Items First quarter of 2016 First quarter of 2015
Currency translation differences $ - $ -
Actuarial gains/losses on defined
benefit obligations - -
Total $ - $ -
2. Reconciliation between income tax expense and accounting profit:

27
First quarter of 2016 First quarter of 2015
Income before tax $ 159,325 $ 193,472
Income tax expense at the statutory
17% tax rate $ 27,085 $ 32,890
Nondeductible (deductible) items in
determining taxable income 3,595 7,871
10% tax on unappropriated earnings - -
Prior year income tax
underestimation - 426
10% dividend tax through
capitalization of retained earnings
by subsidiaries
11,010 9,842
Changes of deferred tax
Temporary differences 925 (8,349)
Income tax expense $ 42,615 $ 42,680
3. Deferred tax assets or liabilities resulting from temporary differences, loss
carryforwards and investment tax credits are as follows: First quarter of 2016
Items Beginning
balance
Recognized
in
(Loss)
benefit
Recognized
in other
Comprehensi
ve (loss)
benefit
Ending
balance
Temporary differences
Impairment of assets $ 2,534 $ (66) $ - $ 2,468
Loss on inventory market
value decline 1,741 - - 1,741
(Continue on next page)
(Continued from previous page)
Unrealized gross profit 5,983 - - 5,983
Exchange gain or loss (1,539) 1,590 - 51
Investment income with
equity method (Note) - - - -
Net defined benefit
liability 15,259 (2,797) - 12,462
Currency translation
differences
(Note)
- - - -
Others 2,508 348 - 2,856
$ (925) $ -
Deferred income tax
benefit (expense) $ 26,486 $ 25,561

28
The balance sheet information is as
follows:
Deferred income tax
assets $ 29,230 $ 27,094
Deferred income tax
liabilities $ 2,744 $ 1,533
First quarter of 2015
Items Beginning
balance
Recognized
in
(Loss)
benefit
Recognized
in other
Comprehensi
ve (loss)
benefit
Ending
balance
Temporary differences
Impairment of assets $ 2,807 $ (69) $ - $ 2,738
Loss on inventory market
value decline 1,741 - - 1,741
Unrealized gross profit 1,463 5,890 - 7,353
Exchange gain or loss (1,820) 1,808 - (12)
Investment income with
equity method (Note) - - - -
Net defined benefit
liabilities 13,616 105 - 13,721
Currency translation
differences
(Note)
- - - -
Others 1,629 615 - 2,244
Deferred income tax
benefit (expense) $ 8,349 $ -
Deferred income tax
assets (liability), net $ 19,436 $ 27,785
The information in the balance sheet is as
follows:
Deferred income tax
assets $ 22,175 $ 28,317
Deferred income tax
liabilities $ 2,739 $ 532
NAN LIU Company controls its subsidiary’s dividends and plans to support its
subsidiary in establishing nonwoven fabric at the Science and Technology Park in
Yanchao District through earnings distribution. Because the company’s current funds
are sufficient and a new factory is not a major capital expenditure at this stage, it is
unnecessary for the subsidiary to allocate its earnings. At the same time, NAN LIU
Company actively plans to apply retained earnings to extend subsidiary operations.
Therefore, undistributed profits and foreign conversion differences were evaluated for
the future without rotation in 2013. According to IAS12’s 39th provision for investment
subsidiaries related to taxable temporary differences (including subsidiaries’

29
undistributed earnings and foreign currency conversion differences), the above are not
accounted- as deferred income tax liabilities.
4. NAN LIU Group's parent company annual profit-seeking enterprise income tax for last
year had been approved by tax agency in 2014.
5. NAN LIU Group’s subsidiary income tax was calculated according to the income tax
rates approved by the agency in 2014.
6. Unappropriated retained earnings:
Items March 31, 2016 December 31,
2015 March 31, 2015
Before 1997 $ 27,961 $ 27,961 $ 27,961
From 1998 to 2009 - - -
After 2010 1,242,428 1,125,718 946,536
Total $ 1,270,389 $ 1,153,679 $ 974,497
7. Imputation credit account and creditable ratio:
March 31, 2016 December 31,
2015 March 31, 2015
Imputation credit account balance $ 79,074 $ 79,074 $ 55,463
2015 (forecast) 2015 (forecast) 2014-(actual)
Tax deduction ratio 13.45﹪ 13.45﹪ 11.23%
Tax deduction ratio of forecast in 2015 and actual earnings in 2014 were 13.45% and
11.23%, respectively. However, according to the 66th new amended income tax law
article 6, the tax deductible rate for shareholders living in the territory of the Republic
China can be cut in half. Surplus allocation became available since January 1st, 2015.
Actual distribution to shareholders' deductible tax is shareholders account balances for
deduction, because the tax deduction ratio based on planned earnings distributions may
vary from the tax deduction ratio of actual shareholder distributions.
(14) Additional information on expenses by nature and employee benefit expense: First quarter of 2016
Operating cost Operating
expenses Total
Employee benefit expense $ 66,166 $ 27,641 $ 93,807
Wages and salaries 55,202 24,474 79,676
Labor and health
insurance costs 6,772 1,891 8,663
Pension and severance
expenses 1,206 920 2,126

30
Other personnel expenses-
food expenses 2,986 356 3,342
Depreciation 71,630 2,369 73,999
Amortization 58 1,565 1,623
First quarter of 2015
Operating cost Operating
expenses Total
Employee benefit expense $ 62,821 $ 29,970 $ 92,791
Wages and salaries 52,239 26,953 79,192
Labor and health
insurance expenses 6,095 1,766 7,861
Pension and severance
expenses 1,321 917 2,238
Other personnel expenses-
food 3,166 334 3,500
Depreciation 62,568 2,078 64,646
Amortization 12 1,578 1,590
There were 786 and 836 workers in NAN LIU Company in the first quarter of 2016
and 2015, respectively.
(15) Earnings per share
1. Basic earnings per share
Earnings per share were attributed to the common equity holders of NAN LIU Group
parent company's profit and losses and divided by the weighted average number of
shares for the calculations for the current period.
2. Dilute earnings per share
The effect of diluted earnings per share indicates the number of adjustments to all
diluted potential common shares, and was attributable to the equity holders of the
parent company's common stock profit and loss calculation and the weighted average
number of shares outstanding. First quarter of 2016
After-tax
amount
Weighted average
number of
outstanding shares
(thousand shares)
Earnings per
share (NT$)
Basic earnings per share
Profit attributable to common
stock holders of the parent $ 116,710 72,600 $ 1.61
Diluted earnings per share
Assumed conversion of all
dilutive potential common stocks - 10

31
Profit attributable to common
stock holders plus assumed
conversion of all dilutive
potential common stocks
$ 116,710 72,610 $ 1.61
First quarter of 2015
After-tax
amount
Weighted average
number of
outstanding shares
(thousand shares)
Earnings per
share (NT$)
Basic earnings per share
Profit attributable to common
stock holders of the parent $ 150,792 72,600 $ 2.08
Diluted earnings per share
Assumed conversion of all
dilutive potential common stocks - 17
Profit attributable to common
stock holders plus assumed
conversion of all dilutive
potential common stocks
$ 150,792 72,617 $ 2.08
If enterprises choose to offer employees remuneration or profits in the way of shares or
cash, in order to calculate the diluted earnings per share, employee remuneration (or
employee profits issued with stock that has a dilution effect on potential ordinary shares)
should be included in the weighted average number of outstanding shares. Calculating
diluted earnings per share is based on the closing price reported on the end period date
of potential ordinary shares (taking into account the ex-right and ex-dividend effect) as
a basis for judging the number of shares. The following year of resolution staff
remuneration or issuance of profit shares will continue to take into account the dilution
effects to potential ordinary shares when calculating the diluted earnings per share.
7. Related party transactions
(1) Name of related parties and relationship
Name of related party Relationship with the company
Huang Chin-San Chairman of NAN LIU Group's parent
company
Huang Hsieh Mei-Yun Spouse, Chairman of NAN LIU Group's
parent company
Huang Ho-Chun Directors of NAN LIU Group's parent
company
BEAUTY EXPRESS CO. Deemed related party of the parent company
(2) Significant transactions and balances with related parties:
1. Purchasing: none.
2. Sales:

32
First quarter of 2016 First quarter of 2015
Related party Total Percentage Total Percentage
BEAUTY EXPRESS CO. $ - - $ 243 0.02
The selling prices between NAN LIU Group and the related party are same as trading
prices. Payment terms are based on general business conditions.
3. Notes and accounts payable: None.
4. Notes and accounts receivable:
March 31, 2016 December 31, 2015 March 31, 2015
Related party Subjects Total Percentage Total Percentage Total Percentage
BEAUTY
EXPRESS CO.
Notes
receivable $ - - $ - - $ - -
BEAUTY
EXPRESS CO.
Accounts
receivable - - 182 0.02 311 0.03
5. Property transactions: none.
6.Rent expenses:
(1) NAN LIU Company rented the house located in Loung-Shua Lane, No.11 and No.19
in Bixiu Road, Qiaotou District, Kaohsiung City from the related parties Huang Hsieh
Mei-Yun and Huang Ho-Chun in February, 2008 as a staff dormitory. The lease time
was from February 1st, 2008 to December 31st, 2014, and the rent was NT 8000 per
month. From December 31st, 2014, the contract was renewed until December 31st,
2017. The first quarter of rent was NT$ 50 thousand in 2016 and 2015, and all
payments were met as of 2016 and March, 31st, 2015.
(2)NAN LIU Company rented the land in Bixiu No 613, Qiaotou District, Kaohsiung
City with NT$ 10 thousand per month from related parties, Huang Hsieh Mei-Yun
and Huang Ho-Chun in July of 2011. The lease time was from July 1st, 2011 to
December 31st, 2015, which the contract was extended to December 31st, 2018. The
first quarter of rent of NT$ 60 thousand has been paid off for 2016 and 2015. As of
March, 31st, 2015 and 2016, the above amounts were settled.
7. Others:
(1) NAN LIU Group borrowed money from banks that was paid off in advance in
June, 2015. However, NAN LIU Group's subsidiary borrowed money from
Mega Bank by Huang Chin-San, with Huang Ho-Chun and Huang Hsieh Mei-
Yun as guarantors for purchasing machines. Thus, the rest of the debt was
possessed by related parties, Huang Chin-San and Huang Ho-Chun.
(2) The main management remuneration information is as follows:

33
Items First quarter of 2016 First quarter of 2015
Salary $ 2,753 $ 2,420
Bonus 2,645 2,683
Service allowance 90 90
Distribution of surplus
items - -
Total $ 5,488 $ 5,193
A. Salary structure includes salary, allowances, pensions, severance, etc.
B. Bonus structure includes bonuses, incentives, etc.
C. Service allowances include travelling expenses, special allowances,
various allowances, dormitories, company cars, etc.
D. Earnings distribution item refers to the payment of director remunerations
and employee bonuses.
E. For related information, please refer NAN LIU annual report.
8. Pledged Assets
The Groups assets pledged as collateral were as follows:
Items March 31, 2016 December 31,
2015 March 31, 2015
Restricted assets $ 37,797 $ 44,107 $ 32,107
Land 48,744 48,744 48,744
Building 1,275 1,697 2,125
Total $ 87,816 $ 94,548 $ 82,976
9. Major commitments and contingencies
1. NAN LIU Group's commitments and contingent liabilities are as follows:
Items March 31, 2016 December 31,
2015 March 31, 2015
Guarantee notes payable issued
for loans and purchases. NTD 260,000 NTD 355,000 NTD 360,000
Guarantee notes payable issued
for loans and purchases. USD - USD - USD 3,000
2. Amounts of unused letters of credit and deposits were as follows:
March 31, 2016 December 31, 2015 March 31, 2015
Letter of credit L/C deposit Letter of credit L/C deposit Letter of credit L/C deposit
USD 3,410 $ - USD 1,697 $ - USD 3,339 $ -
EUR - $ - EUR 165 $ - EUR 165 $ -
3. In September 2011, the Company signed a superficies agreement with Taiwan Sugar
Corporation for 4 pieces of land located at No. 4 Dai Tien Fu Section, Yanchao,

34
Kaohsiung as the land for a new factory. NAN LIU Group's parent company has paid
NT$ 8,153 thousand already as a rent deposit and accounted for "refundable deposits".
As Taiwan Sugar Corporation completed land changes according to the superficies
agreements and signed official contracts, NAN LIU Group paid a 10-year premium of
NT$ 46,680 thousand to Taiwan Sugar Corporation. As of December 31st, 2013, the
land changes were approved by Kaohsiung Government, and notarization of the
superficies agreements was finalized on January 10th, 2014. The duration of the
superficies agreements ends on January 9th, 2024. When the agreement expires, an
extended contract shall be negotiated by both parties after submitting the premium.
However, the duration of superficies shall not exceed 50 years, so the expiration of 50
years shall not be extended.
10. Major damage losses: none.
11. Major subsequent events: none.
12, Others:
(1) Capital risk management
The main goal of NAN LIU Group's capital management is to maintain integrated and
positive capital ratios in order to support business operations and maximize
shareholders' equity. NAN LIU Group manages and adjusts its capital structure based
on economic conditions and debt ratios. It may adjust dividends or issue new shares to
achieve the goal of maintaining and adjusting the capital structure. NAN LIU Group
controls finance by reviewing its debt equity ratio, and the debt equity ratio for
reporting is as follows:
Items March 31, 2016 December 31,
2015 March 31, 2015
Total liabilities $ 2,449,934 $ 2,721,368 $ 2,679,564
Total equity 2,766,782 2,663,459 2,471,621
Debt to equity ratio 88.55% 102.17﹪ 108.41﹪
(2) Financial instruments
1. The totality of financial instruments and fair value information
(1) Company mergers’ financial assets, debt book value, and fair value are listed as
below. These include fair value hierarchy information. However, this cannot
be used for measuring financial instruments’ book value to meet reasonable
approximations of fair value and the active market without a quote. Also, fair

35
value cannot be provided through the equity method. It is unnecessary to
reveal fair value information according to provisions.
March 31, 2016
The fair value of
Items Book value The first
level The second
level
The third
level Total
Financial assets:
Loans and account
receivables
Cash and cash equivalents $ 567,223 $ - $ - $ - $ -
Notes and accounts
receivable 1,098,223 - - - -
Restricted assets 37,797 - - - -
Other current assets 26,103 - - - -
Refundable deposit 21,497 - - - -
Financial liabilities:
Financial liabilities measured
at amortized costs
Short-term loans 369,653 - - - -
Short-term bills payable 149,967 - - - -
Notes payable and
payment 1,071,927 - - - -
Equipment payment 19,165 - - - -
Long-term liabilities due
within a year 87,617 - - - -
Long-term liabilities 559,237 - - - -
December 31, 2015
The fair value
Items Book value The first
level The second
level
The third
level Total
Financial assets:
Loans and account
receivables
Cash and cash equivalents $ 529,058 $ - $ - $ - $ -
Notes and accounts
receivable 1,179,453 - - - -
Restricted assets 44,107 - - - -
Other current assets 531 - - - -
Refundable deposit 21,550 - - - -
Financial liabilities:
Financial liabilities measured at amortized costs
Short-term loans 207,307 - - - -
Short-term notes and bills
payable 164,931 - - - -
Notes and accounts
payable 1,224,610 - - - -

36
Equipment payment 37,893 - - - -
Long-term liabilities due
within a year 169,288 - - - -
Long-term liabilities 722,425 - - - -
March 31, 2015
The fair value
Items Book value The first
level The second
level
The third
level Total
Financial assets:
Loans and account
receivables
Cash and cash equivalents $ 373,409 $ - $ - $ - $ -
Notes and accounts
payable 1,219,799 - - - -
Restricted assets 32,107 - - - -
Other current assets 26,092 - - - -
(Continued on next page)
(Continued from previous page)
Refundable deposit 15,538 - - - -
Financial liabilities:
Financial liabilities
measured at amortized
costs
373,790 - - - -
Short-term notes and bills
payable 79,960 - - - -
Notes payable and
payment 1,234,724 - - - -
Equipment payment 25,621 - - - -
Long-term liabilities due
within a year 54,775 - - - -
Long-term liabilities 703,875 - - - -
(2) Fair value evaluation technique for financial instruments not measured at fair
value.
The methods and assumptions adopted by the combined company to estimate
financial instruments not measured at fair value are as follows:
If financial liabilities measured at amortized costs have transactions or quote
data within market makers, then the most recent closing price and quote price
data are the basis for assessment of fair value. If there is no market price as the
reference, the evaluation method is then used for estimation. Estimates and
assumptions reached through the evaluation method are discounted cash flows
used to estimate the fair value.
(3) Fair value evaluation techniques for financial instruments measured at fair value
A. Non-derivative financial instruments
37
If financial instruments have open quotes in active markets, these quotes
represent the fair value. The market prices of major exchanges and notes
considered popular in over-the-counter market government bonds are all used
as the basis of the fair value for the equity instruments of listed companies and
debt instruments with open quotes in active markets. If open quotes of
financial instruments can regularly be obtained in a timely fashion from
exchanges, brokers, underwriters, industry associations, pricing service
institutions or competent authorities, and the prices actually and regularly
foster fair market trading, then the financial instrument has open quotation in
an active market. If the aforementioned conditions are not met, the market is
considered not active. In General, wide bid/offer spread, significant increase
of trading spreads, or slim trading volume are indicators of an inactive market.
The combined company holds financial assets that have standard terms and
conditions and are trading in active markets, such as shares from listed
companies, mutual funds and bonds, their fair value is determined by market
price quotes.
Fair value for other financial instruments other than the aforementioned
financial instruments with active markets is obtained through evaluation
techniques or quotes made by counterparties.
B. Derivatives financial instruments
The combined company currently has no derivatives financial instruments.
(4) Transfer between Class 1 and Class 2
There was no transfer in the first quarter of 2016 and 2015.
2. Financial risk management policies
The Group uses a comprehensive risk management and control system to clearly and
effectively identify, measure and control all of its risks (including market, credit,
liquidity and cash flow risk).
The Group’s management evaluates economic conditions and the effects of market
value risks to control the related risks effectively, optimize its risk position, and
maintain proper liquidity and central control of market risks.
3. Market risk
Market risk refers to the result of changes in market prices, such as exchange rates,
interest rates, and equity instrument price changes that will affect the Company's risk-
benefit or value of financial instruments. The objective of market risk management is

38
to control the degree of market risk within bearable range and to maximize the return
on investment.
(1) Foreign exchange risk:
The Group operates internationally and is exposed to foreign exchange risk arising
from various currency exposures, primarily with respect to the USD, RMB and EUR.
Foreign exchange risk arises from future commercial transactions, recognized assets
and liabilities, and net investments in foreign operations.
A. Exchange rate risk exposures
At the balance sheet date, the book value of monetary assets and liabilities that
denominated in non-functional currency were as follows. This includes offset
currency items denominated in non-functional monetary items of consolidated
financial statements. March 31, 2016 December 31, 2015 March 31, 2015
Items Foreign
currency Exchange
rates NTD
Foreign
currency Exchange
rates NTD
Foreign
currency Exchange
rates NTD
Financial
assets
Monetary
items
USD $ 24,893 32.185 $ 801,170 $ 23,639 32.83 $ 775,956 $ 21,676 31.30 $ 678,474
RMB 7,460 4.972 37,092 375 5.00 1,873 7,129 5.04 35,961
Euro 57 36.510 2,090 57 35.88 2,053 11 33.65 3,738
Financial
liabilities
Monetary
items
USD 15,536 32.185 500,028 17,146 32.83 562,817 27,067 31.30 847,199
Euro 8,750 36.510 319,469 9,407 33.88 337,524 2,987 33.65 100,525
Yen - - - 120 0.2727 32 6,600 0.26 1,719
B. Sensitivity analysis
The Group's exchange rate risk mainly arises from the conversion of cash
and cash equivalents, receivables (payable), other receivables (payable), and
loans that are denominated in nonfunctional currency. As of three months
ended June 30, 2016 and 2015, if the NTD/USD, NTD/RMB, NTD//EUR
exchange rate appreciates/depreciates by 1% with all other factors remaining
constant, As of three months ended June 30, 2016 and 2015,the company’s
income before income tax would increase/decrease by $207 thousand and
$2,313 thousand respectively. The analysis uses the same basis as the one
used in the prior period.
(2) Interest rate risk:

39
The Group's loans are based on a floating rate and do not have interest rate
swap contracts to change from a floating to a fixed rate. In response to interest
rate risk, the Group assesses the bank and currency borrowing rates regularly
and maintains good relations between financial institutions to decrease
financing costs, strengthen the management of working capital, reduce its
reliance on banks and diversify the risk of interest rate changes.
The Group’s exposure to interest risk to its financial liabilities is described in
the liquidity risk of the Note. The following sensitivity analysis is according
to the non-derivative instrument’s interest risk at the reporting date. The
analysis assumed that the amount of floating interest rate bank loans at the
end of the reporting period had been outstanding for the entire period. When
reporting interest rate to top management of the Group, the floating interest
rate used should increase or decrease by 1%, which also represents a
reasonable possible change assessment by management.
All variables remaining the same, a hypothetical increase/decrease of 1% in
the interest rate would result in an increase/decrease in the Group's net income
by approximately $2,916 thousand and $3,031 thousand for three months
ended June 30, 2016 and 2015, mainly due to floating rate loans.
(3) Credit risk:
The Group's primary credit risk is the collection of receivables. Consequently,
the Group has continuously assessed the collectability of accounts and notes
receivable, and reserved provision for doubtful accounts. Therefore, the
Group’s credit risk is very low.
(4) Liquidity risk:
The Group manages and maintains sufficient cash and cash equivalents to
support its operations and ease the effects of fluctuations in cash flows. The
Group's management supervises the utilization of bank facilities to ensure
compliance with loan agreements.
Bank loans are an important source of liquidity for the Group. The following
table analyzes non-derivative financial liabilities based on the earliest possible
repayment date.
Items
March 31, 2016
Less than 1
year Between 1 and
3 years
Between 3
and 5 years More than 5
years
Contractual
cash flows
Short-term loans $ 369,653 $ - $ - $ - $ 369,653
Short-term notes and
bills payable 149,967 - - - 149,967

40
Notes payable 486,786 - - - 486,786
Accounts payable 429,068 - - - 429,068
Other accounts payable 175,238 - - - 175,238
Long-term loans
(including one year or
one business operating
cycle)
87,617 531,107 27,890 240 646,854
Items
December 31, 2015
Less than 1
year Between 1 and
3 years
Between 3
and 5 years More than 5
years
Contractual
cash flows
Short-term loans $ 207,307 $ - $ - $ - $ 207,307
Short-term notes and
bills payable 164,931 - - - 164,931
Notes payable 540,796 - - - 540,796
Accounts payable 523,562 - - - 523,562
Other accounts payable 198,145 - - - 198,145
Long-term loans
(including one year or
one business operating
cycle)
169,288 694,295 27,890 240 891,713
Items
March 31, 2015
Less than 1
year Between 1 and
3 years
Between 3
and 5 years More than 5
years
Contractual
cash flows
Short-term loans $ 373,790 $ - $ - $ - $ 373,790
Short-term notes and
bills payable 79,960 - - - 79,960
Notes payable 453,760 - - - 453,760
Accounts payable 638,250 - - - 638,250
Other accounts payable 168,335 - - - 168,335
Long-term loans
(including one year or
one business operating
cycle)
54,775 626,913 76,805 157 758,650
(5) The cash flow risk of changes in interest rate:
Changes in the Group's cash flow risk primarily comes from floating rate bank
loans. The Group's bank loans are based on a long-term floating rate. When
interest rates rise, the Group negotiates to decrease interest rates or borrow
short-term loans to manage its interest rate risk. Overall, the Group's cash flow
risk from changes in interest rates is low.
(C) Financial instruments with off-balance sheet credit risk
(1) The Group provides endorsement and guarantees commitment to subsidiaries
in accordance with “Regulations Governing Endorsements and Guarantees”.
Because the Group has full control over the subsidiaries’ credit status, no

41
collateral was requested. In case of the default of subsidiaries, the possible loss
is the same amount as the guarantee or endorsement provided.
(2) Financial instruments with off-balance sheet credit risk
Items March 31, 2016 December 31, 2015 March 31, 2015
Endorsements / guarantees
provided to subsidiaries USD 23,209 USD 23,657 USD 33,625
(4) Fair value estimation
The Group does not engage in transactions of financial instruments measured by fair value..
13. Additional disclosures
(A) Major transactions (B) Related information of reinvestments:
A. Financings provided: None.
B. Endorsement/guarantee provided: Please see Table 1, attached.
C. Marketable securities held (excluding investments in subsidiaries, associates
and jointly control identities): None.
D. Marketable securities acquired and disposed of at prices of at least NT $300
million or 20% of the paid-in capital: None.
E. Acquisition of individual real estate properties at costs of at least NT $300
million or 20% of the paid-in capital: None.
F. Disposal of individual real estate properties at prices of at least NT $300
million or 20% of the paid-in capital: None.
G. Total purchases from or sales to related parties of at least NT $100 million or
20% of the paid-in capital: Please see Table 2, attached.
H. Receivables from related parties amounting to at least NT $100 million or 20%
of the paid-in capital: None.
I. Information about the derivative financial instruments transaction: None.
J. Other: The business relationship between the parent and subsidiaries and
significant transactions between them: Please see Table 3, attached.
K. Names, locations, and related information of investees over which the
Company exercises significant influence: Please see Table 4, attached.
(C) Information on investment in Mainland China:

42
1. The name of the investee in Mainland China, the main businesses and products,
issued capital, method of investment, information on inflow or outflow of
capital, percentage of ownership, income (losses) of the investee, share of
profits/losses of investee, ending balance, amount received as dividends from
the investee, and the limitations on investee: Please see Table 5, attached.
2. Significant direct or indirect transactions with the investee, its prices and terms
of payment, unrealized gain or loss:
(1) Purchase amount and percentage and ending accounts payable balances and
percentage: Please see Table 2, attached.
(2) Sale amount and percentage and ending accounts receivable balances and
percentage: None.
(3) Assets transaction amount, gain and loss: None.
(4) Ending balance of endorsement/guarantee or collateral provided and
purposes: Please see Table 1, attached.
(5) Maximum balance of financing, ending balance, interest rate range and
total interest in the period: None.
(6) Transactions with significant impact on gain, loss or financial conditions
for the period, such as providing or receiving services: None.

43
NAN LIU Enterprise Co., Ltd. and Subsidiary
ENDORSEMENTS/GUARANTEES PROVIDED
FOR THE THREE MONTHS ENDED MARCH 31, 2016
Note I Unit: Thousand NT$
No Endorsement
guarantor
Company name
Guarantee object by endorsement
Limits on
Endorsement/Gu
arantee Amount
Provided to Each
Guaranteed Party
Maximum
Balance of
Endorsement/
Guarantee for
the Period
Ending
Balance
of
Endorsement/
Guarantee
Amount
Actually
Drawn
Amount of
Endorsement
/ Guarantee
Collateralize
d by
Properties
Ratio of
Accumulated
Endorsement/
Guarantee to
Net Equity per
Latest
Financial
Statements
Endorsement/
Guarantee
Maximum
Amount
Guarant
ee
Provided
by
Parent
Compan
y
Guarant
ee
Provided
by A
Subsidia
ry
Guarant
ee
Provided
to
Subsidia
ries in
Mainlan
d China
Remarks Company name
Nature of Relationship
0 Nan Liu Enterprise Co., Ltd.
NAN LIU ENTERPRISE (SAMOA)
CO., LTD.
Directly possesses more than 50% shares of common stock of the subsidiary
$ 5,533,564 $ 596,004 $ 581,295 $62,470 $ - 21.01% $ 5,533,564 Y N N
0 Nan Liu Enterprise Co., Ltd.
Nan Liu Enterprise (Pinghu)
Corporation limited
Combined common stock owned by subsidiary and parent Company more than 50% of investee companies
5,533,564 180,538 180,538 98,475 - 6.53% 5,533,564 Y N Y
Note 1: The numbers filled in for the endorsements/guarantees provided by the Company or subsidiaries are as follows: (1) Enter ‘0’ for the Issuer. (2) The investees are numbered in serial order starting from ‘1’. Note 2: Relationship between the endorser/guarantor and the Company is classified into the following six categories (just mark the category number): (1) Companies with business relationship. (2) The endorser/guarantor parent company owns directly more than 50% voting shares of the endorsed/guaranteed subsidiary. (3) The endorser/guarantor parent company and its subsidiaries jointly own more than 50% voting shares of the endorsed/guaranteed company. (4) More than 50% voting shares of the subsidiary directly held by the endorser/guarantor parent company or indirectly held by subsidiary. (5) Companies which guarantee each other according to contract based on contractor relationship. (6) Joint venture endorsed/guaranteed by shareholders based on their holding ratio.

44
NAN LIU Enterprise Co., Ltd. and Subsidiary
TOTAL PURCHASES FROM OR SALES TO RELATED PARTIES OF AT LEAST NT$100 MILLION OR 20% OF THE PAID-IN CAPITAL
FOR THE THREE MONTHS ENDED MARCH 31, 2016
Note II Unit: Thousand NT$
Purchase (sales)
company Related Party
Nature of Relationship
Transaction Details Abnormal Transaction Notes/Accounts Payable or Receivable
Remarks Purchases/
Sales Amount
% to Total
Payment Terms
Unit Price Payment Terms
Ending Balance
% of Total
Nan Liu Enterprise
Corporation limited
Nan Liu Enterprise (Pinghu)
Corporation limited
The investee company, NANLIU ENTERPRISE (SAMOA)CO., LTD. adopts equity methods to evaluate
Purchase $ 314,186 26.78% Same as usual trading terms
0 0 $ 197,279 21.54% 0
Note 1: If related party transaction terms are different from general terms, situations and reasons for the differences should be specified in the unit price and credit period columns. Note 2: In case of advance payment (prepayment), reasons, terms of the contract agreement, amount and differences from the general situation shall be specified in the note column. Note 3: Paid-in capital refers to the parent company's paid-in capital. When the issuer's shares have no denomination, or its denomination is not NT $10, regarding a maximum transaction amount on 20% of paid-in capital, the amount is calculated based on 10% of ownership's equity attributable to the parent company in the balance sheet.

45
NAN LIU Enterprise Co., Ltd. and Subsidiary
INTERCOMPANY RELATIONSHIPS AND SIGNIFICANT INTERCOMPANY TRANSACTIONS
FOR THE THREE MONTHS ENDED MARCH 31, 2016
Note III Unit: Thousand NT$
No Company Name Counter Party Nature of
Relationship
Intercompany Transactions
Financial statements item Amount Terms
Percentage of Consolidated Net
Revenue or Total Assets
0 Nan Liu Enterprise
Co., Ltd.
Nanliu Enterprise
(Pinghu) Ltd.
1 Income from sales $ 3,555 Same as general
vendors
0.24%
0 Nan Liu Enterprise
Co., Ltd.
Nanliu Enterprise
(Pinghu) Ltd.
1 Accounts receivable 4,171 Same as general
vendors
0.08%
0 Nan Liu Enterprise
Co., Ltd.
Nanliu Enterprise
(Pinghu) Ltd.
1 Purchase 314,186 Same as general
vendors
21.87%
0 Nan Liu Enterprise
Co., Ltd.
Nanliu Enterprise
(Pinghu) Ltd.
1 Accounts payable 197,279 Same as general
vendors
3.78%
Note 1: Business operating information between the parent company and subsidiary shall be indicated in the column number and number shall be filled in as follows: 1. The parent company fills out 0. 2. The subsidiary company starting from the Arabic number 1 in the sequence. Note 2: There are three types of relations with dealers. They are marked as follows: 1. The parent company to subsidiary. 2. The subsidiary to the parent company. 3. The subsidiary to subsidiary. Note 3: In employing the ratio of trading conditions for combined revenue or assets, if it belongs as an asset liability item, the balance calculation includes the consolidated total assets. If it belongs as a profit and loss item, the balance is calculated considering the interim cumulative amount in total. Note 4: Whether important transactions are listed in table shall be decided by the company according to the major principles.
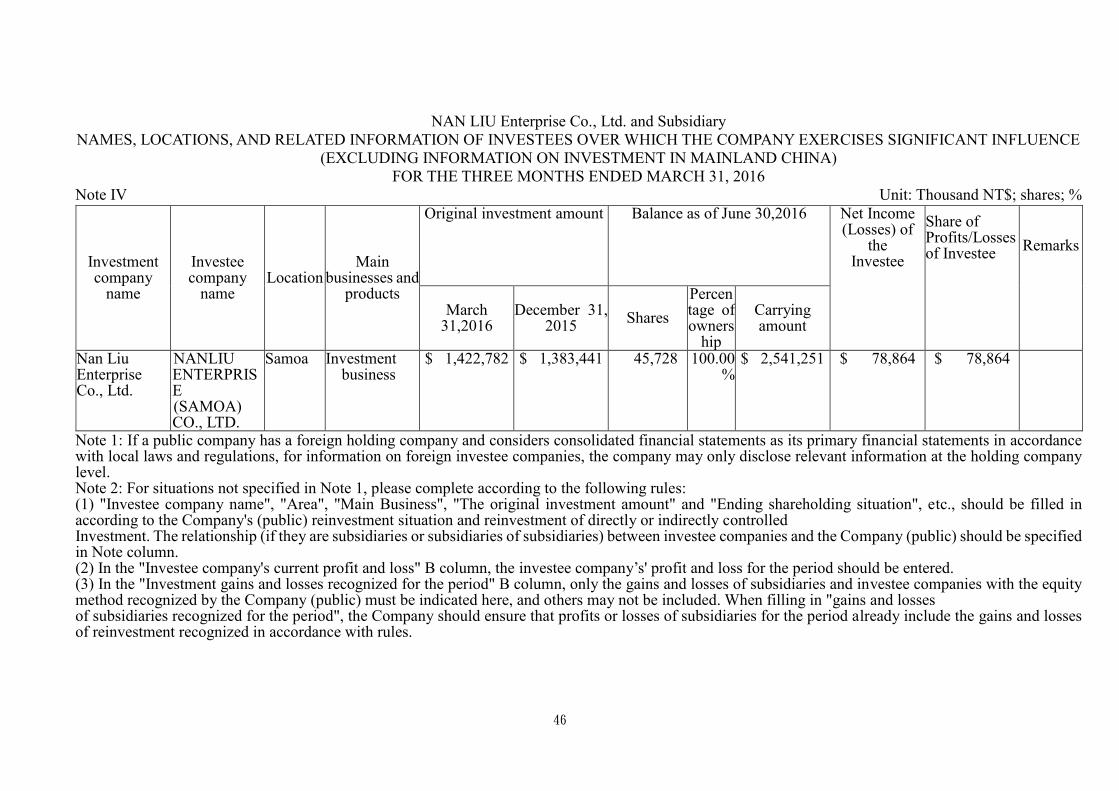
46
NAN LIU Enterprise Co., Ltd. and Subsidiary
NAMES, LOCATIONS, AND RELATED INFORMATION OF INVESTEES OVER WHICH THE COMPANY EXERCISES SIGNIFICANT INFLUENCE
(EXCLUDING INFORMATION ON INVESTMENT IN MAINLAND CHINA)
FOR THE THREE MONTHS ENDED MARCH 31, 2016
Note IV Unit: Thousand NT$; shares; %
Investment company
name
Investee company
name Location
Main businesses and
products
Original investment amount Balance as of June 30,2016 Net Income (Losses) of
the Investee
Share of Profits/Losses of Investee
Remarks
March 31,2016
December 31, 2015
Shares
Percentage of owners
hip
Carrying amount
Nan Liu Enterprise Co., Ltd.
NANLIU ENTERPRISE (SAMOA) CO., LTD.
Samoa Investment business
$ 1,422,782 $ 1,383,441 45,728 100.00%
$ 2,541,251 $ 78,864 $ 78,864
Note 1: If a public company has a foreign holding company and considers consolidated financial statements as its primary financial statements in accordance with local laws and regulations, for information on foreign investee companies, the company may only disclose relevant information at the holding company level. Note 2: For situations not specified in Note 1, please complete according to the following rules: (1) "Investee company name", "Area", "Main Business", "The original investment amount" and "Ending shareholding situation", etc., should be filled in according to the Company's (public) reinvestment situation and reinvestment of directly or indirectly controlled Investment. The relationship (if they are subsidiaries or subsidiaries of subsidiaries) between investee companies and the Company (public) should be specified in Note column. (2) In the "Investee company's current profit and loss" B column, the investee company’s' profit and loss for the period should be entered. (3) In the "Investment gains and losses recognized for the period" B column, only the gains and losses of subsidiaries and investee companies with the equity method recognized by the Company (public) must be indicated here, and others may not be included. When filling in "gains and losses of subsidiaries recognized for the period", the Company should ensure that profits or losses of subsidiaries for the period already include the gains and losses of reinvestment recognized in accordance with rules.

47
NAN LIU Enterprise Co., Ltd. and Subsidiary
Information on Investment in Mainland China
FOR THE THREE MONTHS ENDED MARCH 31, 2016
Note v Unit: Thousand NT$
Investee Company
Main Businesses
and Products
Total Amount of
Paid-in Capital
Method of
Investme
nt
Accumulated Outflow of Investment
from Taiwan as of January 1, 2016
Investment Flows Accumulated Outflow
of Investment
from Taiwan as of March 31,
2016
Net Income (Losses) of the Investee
Company
Percentage of
Ownership
Share of Profits/Loss
es
Carrying Amount as of March 31, 2016
Accumulated
Inward Remittan
ce of Earnings
as of March
31, 2016
Remarks Outflow Inflow
Nan Liu Enterprise (Pinghu)
Corporation limited
Nonwoven fabric manufacturing
$ 1,846,701
2 $ 1,383,441 $ 39,341 $ - $ 1,422,782
$ - 100.00
%
$ 83,636 $ 2,917,262
$ -
Accumulated Investment in Mainland China as of
March 31, 2016
Investment Amounts Authorized by
Investment Commission, MOEA
Upper Limit on Investment by
Investment Commission, MOEA
$ 1,422,782 $ 1,877,537 $ - Note 1: There are three types of investment methods, marked as follows:
(1) Investment in China
(2) Invest in China through the third region company (please note the third region company)
(3) Others
Note 2: The current recognized investment loss and profit in column:
(1) If the company is in preparation status and no investment loss and profit occurs, it shall be noted.
(2) There are three types of recognized investment loss and profit. They are and shall be noted as follows:
A. The financial statements certified by international accounting firms that have relationships with CPA Republic of China
B. The financial statements certified by accountant through Taiwan parent company
C. Others
Note 3: The amount shall be listed in NTD in column.

48
14. Operating segments information:
(1) General information:
The Group has four reportable segments, including Thermal-bonded nonwovens
fabrics, Spunlace nonwovens fabrics, Biotechnology, and B2 Post-processing. They are
mainly engaged in manufacturing and subcontracting thermal-bonded nonwoven
fabrics, wet wipes, facial masks and skin care products. The segments are classified
based on the nature of the products.
In accordance with SFAS 41 “Disclosures about Segments", operating and reporting
segments are identified. If operating segments reach the quantitative thresholds, core
principles of the compilation should be taken into account to determine whether to
separately or collectively disclose reportable segments. If the operating segments do
not reach the quantitative thresholds, they are included in other segments. The
measured amount is provided to major decision makers to allocate resources to
segments and assess performance. In addition, accounting policies adopted by
operating segments and a summary of significant accounting policies is described in
Note 2. There are no significant inconsistencies.
(2) Measurement of segment information:
The Group's segments use the same accounting policy as the Group. The Group uses
the net income from operations as the measurement for segment profit and the basis for
performance assessment.
(3) Segment profit/losses and asset information : For the three months ended March 31, 2016
Items
Air -through
nonwoven
fabric
Spunlace Bio-
technology B2 Processing
line Others Total
Net revenue
from external
customers
$ 318,837 $ 374,490 $ 504,714 $ 234,581 $ 4,162 $ 1,436,784
Net revenue
from sales
among
intersegments
- - - - - -
Segment
revenue $ 318,837 $ 374,490 $ 504,714 $ 234,581 $ 4,162 $ 1,436,784
Segment
income $ 35,276 $ 29,084 $ 22,788 $ 57,386 $ 1,547 $ 146,081
Segment assets $ 559,747 $ 909,251 $ 442,531 $ 83,450 $ 94,874 $ 2,089,853
For the three months ended March 31, 2015
Items Air-through
nonwovens
Spunlace
fabric
Bio-
technology B2 Processing
line Others Total

49
Net revenue
from external
customers
$ 314,520 $ 348,326 $ 622,576 $ 198,822 $ 5,697 $ 1,489,941
Net revenue
from sales
among
intersegments
- - - - - -
Segment
revenue $ 314,520 $ 348,326 $ 622,576 $ 198,822 $ 5,697 $ 1,489,941
Segment
income $ 37,290 $ 21,879 $ 78,435 $ 24,300 $ 3,009 $ 164,913
Segment assets $ 518,826 $ 996,108 $ 430,157 $ 96,172 $ 55,203 $ 2,096,466
(4) Reconciliation for segment income (loss):
(a). Measurement of segments gain or loss:
The Group's segments use the same accounting policy as the Group. The Group uses
income from operations as its measurement for segment profit and the basis for
performance assessment.
(b) Reconciliation for segment income (loss):
The segment’s operating income reported to the chief operating decision-maker was
measured in a manner consistent with revenue and expenses in the income statement.
The Group did not provide the amount of total assets and total liabilities to the chief
operating decision-maker for decision making. The reconciliation of reportable
segment income or loss and income before tax for operating segments is provided as
follows::
First quarter of
2016
First quarter of
2015
Reportable segments income $ 146,081 $ 164,913
Unallocated amounts:
Non-operating income and
expense 13,244 28,559
Income before income tax $ 159,325 $ 193,472