Embed Size (px)
Citation preview
GSJ: Volume 7, Issue 5, May 2019 ISSN 2320-9186
GSJ© 2019 www.globalscientificjournal.com
GSJ: Volume 7, Issue 5, May 2019, Online: ISSN 2320-9186
www.globalscientificjournal.com
ANALYSIS OF HARVESTED RAINWATER USING EARTHEN, PLASTIC AND CONCRETE POT FOR DRINKING PURPOSE COLLECTED FROM KHULNA CITY CORPORATION AREA, BANGLADESH Author: Kazi Nabila Haque, Khulna University, Khulna, Bangladesh.
Keywords: Rainwater harvesting, drinking purpose, direct catch, roof runoff, storage pots, physico-chemical parameters, microbiological parameters
Abbreviations:
KCC for Khulna City Corporation BSTI for Standards and Testing Institution WHO for World Health Organization
Abstract
Rainwater is natural fresh water. In Bangladesh because of salinity, flood and many more different disasters people
rely on rainwater. The main causes of water scarcity in South-East region and North-western region of Bangladesh are
salinity and drought. The paper contains analysis of physical, chemical and microbiological parameters of harvested
rainwater. The study is done at Nirala (ward no 24 of KCC), Khulna (southeast region of Bangladesh). For the
harvesting of storage rainwater three types of pots (earthen, plastic and concrete pot) had been used. Rainwater was
collected through direct catch and runoff from roof (galvanized iron sheet roof and concrete roof). All the samples were
collected in monsoon period (July to September). Physical and chemical parameters ( Na+, K+, Ca2+, Mg2+, HCO3-, Cl-,
SO42-, NO3
- , PO43- ) decreased but microbial parameters (E. Coli, faecal coliform, total coliform) increased in stored
rainwater day by day. Coliform bacteria were found in water which was collected from concrete roof and Galvanized
iron sheet roof due to the presence of feces of birds and animals in roofs. By comparing with WHO and BSTI standards
it is found that harvested rainwater can be used for drinking purposes as well as for household works in dry season in
494

GSJ: Volume 7, Issue 5, May 2019 ISSN 2320-9186
GSJ© 2019 www.globalscientificjournal.com
KCC. But in Bangladesh it is not a well known approach. So initiatives should be taken for the better uses and
management of rainwater.
495
GSJ: Volume 7, Issue 5, May 2019 ISSN 2320-9186
GSJ© 2019 www.globalscientificjournal.com
Introduction
Background of the Study
The demands on potable water supply are escalating in line with increasing population growth, particularly in urban areas, along with increases in industrial output and commerce. Countries that have investigated the potential benefits of RHRW for these uses include Australia, Canada, Denmark, Germany, India, Japan, New Zealand, Thailand, and the United States (Despins etal., 2009; Evans etal.2006; Uba and Aghogho, 2000). For example, 10% of Australian people currently use RWH as a major source of their drinking water, and an approximate additional 5% use RWH as potable replacement for showering, toilet flushing, and clothes laundering (Mendez etal., 2010).
Much actual or potential water shortages can be relieved if rainwater harvesting is practiced more widely. People collect and store rainwater in buckets, tanks, ponds and wells. This is commonly referred to as rainwater harvesting and has been practiced for centuries. Rainwater can be used for multiple purposes ranging from irrigating crops to washing, cooking and drinking. Rainwater harvesting is a simple low-cost technique that requires minimum specific expertise or knowledge and offers many benefits. Collected rainwater can supplement other water sources when they become scarce or are of low quality like brackish rain water or polluted surface water in the rainy season. The collected rainwater is a valuable supplement that would otherwise be lost by surface run-off or evaporation (Radaideh etal, 2009).
During the past decade, RWH has been actively reintroduced by local organizations as an option for increasing access to water in currently underserved areas (rural or urban). Unfortunately decision-makers, planners, engineers and builders often overlook this action. The reason that RWH is rarely considered is often simply due to lack of information on feasibility both technical and otherwise. During the past decade the technology has, however, quickly regained popularity as users realize the benefits of a relatively clean, reliable and affordable water source at home (Farreny etal., 2010).
Most of the developing countries have limited access to safe water for household uses. Recently water demand is tremendously increasing due to economic development and population growth. So Rain water is an option, which has been adopted in many areas of the world where conventional water supply systems are not available or have failed to meet the needs and expectations of the people. It is a technique of water collection, which has been used since antiquity. It is easy, cheap and is sustainable for use (Saleem etal., 2012).
In Bangladesh rainfall occurs most in June, July, August and September. Amount of rainfall is medium in May, September and October. Other six months of a year have very little rainfall intensity. In Khulna the numbers of days with rainfall of more than 50 mm and 100 are not high. Average rainfall is 1,605 mm. In Khulna the highest rainfall occurs in the month of July. It is 650 mm. The lowest rainfall occurs in December (Internet).
Khulna is in the coastal region. Salinity and scarcity of water are the main water problems of this area. Water level is also decreasing day by day. Use of rain water is a very good option. But it is not so popular in Bangladesh as well as in Khulna. Research work has not been done yet for the quality monitoring or rainwater harvesting in Khulna City Corporation (KCC) area. So I have worked to find out the water quality of rainwater and possible ways for rainwater harvesting so that we can use it as an alternative source of drinking and other household works.
Objectives
The main objective of this study is to find out the suitability of rainwater use for drinking purpose.
The specific objectives of the study are to:
To assess the harvested rain water chemistry and microbial quality using different types of storage pots.
496
GSJ: Volume 7, Issue 5, May 2019 ISSN 2320-9186
GSJ© 2019 www.globalscientificjournal.com
To identify the potential use of monsoon rain water quality for drinking water purpose in KCC area.
Literature Review
Kus etal (2011) conducted a study to find out the Water Quality in Rainwater Tanks in Rural and Metropolitan Areas of New South Wales, Australia during 2010. Rainwater collected and stored in rainwater tanks has been used for a variety of non-potable purposes. In Australia this use has become very popular as a means of augmenting dwindling water supplies. However no prior testing and analysis has been done to assess the adequacy of this practice.
Islam etal (2010) conducted a study to find out the quality of stored rainwater as well as the feasibility of harvesting monsoon rainwater as a source of drinking water in Dhaka, Bangladesh during 2010. They have selected the chemical analyses according to the standard methods for the examination of water and wastewater (APHA, AWWA & WEF, 1998). Microbiological tests were performed for Total Coliform (TC), Fecal Coliform (FC), COD, and BOD. They have done The quality tests (color, total solids, total dissolved solids, lead, turbidity, hardness, acidity, pH, nitrate, fluoride, total Coliform, fecal Coliform, COD, and BOD) for all samples. From this research it was clear that for the water scarce areas, the rainwater harvesting would be a useful and acceptable potential source of safe drinking, cooking and dishwashing water. In the scarce safe drinking water areas like Dhaka where the demand is increasing tremendously, it might be very useful. They also suggested that further study should emphasize careful handling of the tank and closing of the inlet and more rainwater storage tanks may be used in future studies as well.
Review for microbiological analysis of harvested rain water:
Despins etal (2009) conducted a study for the assessment of rainwater quality from rainwater harvesting systems in Ontario, Canada during October 2006 to October 2007. They have analyzed the samples for pH, turbidity, colour, total and fecal Coliforms, total organic carbon, total nitrogen and UV absorbance (254 nm). They have used the analytical procedures outlined in Standard Methods for the Examination of Water and Wastewater for measuring pH, turbidity, total and fecal Coliforms. Season, temperature and extent of treatment had the greatest impact on the microbiological quality of the rainwater. During the summer and fall seasons total and faecal Coliforms were detected in a greater proportion of samples, and were also detected in greater numbers. The pH of rainwater stored in plastic cisterns tended to be slightly acidic, whereas rainwater pH was slightly basic when stored in concrete. The quality of harvested rainwater appears to depend, in part, on the location in which RWH systems are operated.
Materials and Methods
Materials and methods includes data collection (primary data collection of water samples, analysis of water samples, field investigation, laboratory analysis; secondary data), procedure for determination of physical, chemical, and microbiological parameters and flow chart of the whole activities under materials and methods.
Information and Data sources
The main sources of data and information are two types:
Primary sources The primary data sources mainly come from laboratory analysis of rain water quality parameter and field investigations.
Secondary sources Secondary sources are: Bangladesh Water Development Board (BWDB) Bangladesh Bureau of Statistics (BBS) Institute of water and flood management, Bangladesh University of Engineering & Technology
497
GSJ: Volume 7, Issue 5, May 2019 ISSN 2320-9186
GSJ© 2019 www.globalscientificjournal.com
Khulna Municipality Web sites
Sampling
Rainwater harvesting was done from August to October, 2018 at Nirala, Khulna, Bangladesh.
Nine samples were collected at the starting of harvest. After 15 days of storage another nine samples were collected from the storage pots. Last nine samples were collected after 30 days of harvesting. Total number of rainwater harvested samples was 27 from Nirala.
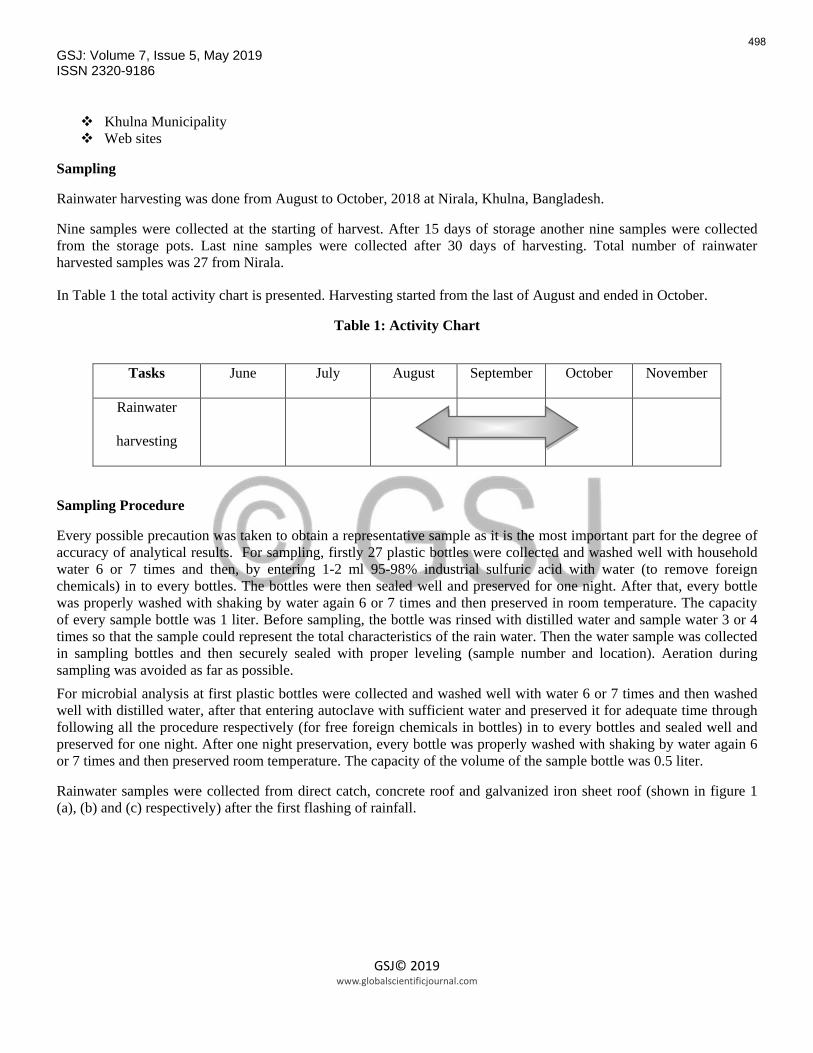
In Table 1 the total activity chart is presented. Harvesting started from the last of August and ended in October.
Table 1: Activity Chart
Tasks June July August September October November
Rainwater
harvesting
Sampling Procedure
Every possible precaution was taken to obtain a representative sample as it is the most important part for the degree of accuracy of analytical results. For sampling, firstly 27 plastic bottles were collected and washed well with household water 6 or 7 times and then, by entering 1-2 ml 95-98% industrial sulfuric acid with water (to remove foreign chemicals) in to every bottles. The bottles were then sealed well and preserved for one night. After that, every bottle was properly washed with shaking by water again 6 or 7 times and then preserved in room temperature. The capacity of every sample bottle was 1 liter. Before sampling, the bottle was rinsed with distilled water and sample water 3 or 4 times so that the sample could represent the total characteristics of the rain water. Then the water sample was collected in sampling bottles and then securely sealed with proper leveling (sample number and location). Aeration during sampling was avoided as far as possible. For microbial analysis at first plastic bottles were collected and washed well with water 6 or 7 times and then washed well with distilled water, after that entering autoclave with sufficient water and preserved it for adequate time through following all the procedure respectively (for free foreign chemicals in bottles) in to every bottles and sealed well and preserved for one night. After one night preservation, every bottle was properly washed with shaking by water again 6 or 7 times and then preserved room temperature. The capacity of the volume of the sample bottle was 0.5 liter.
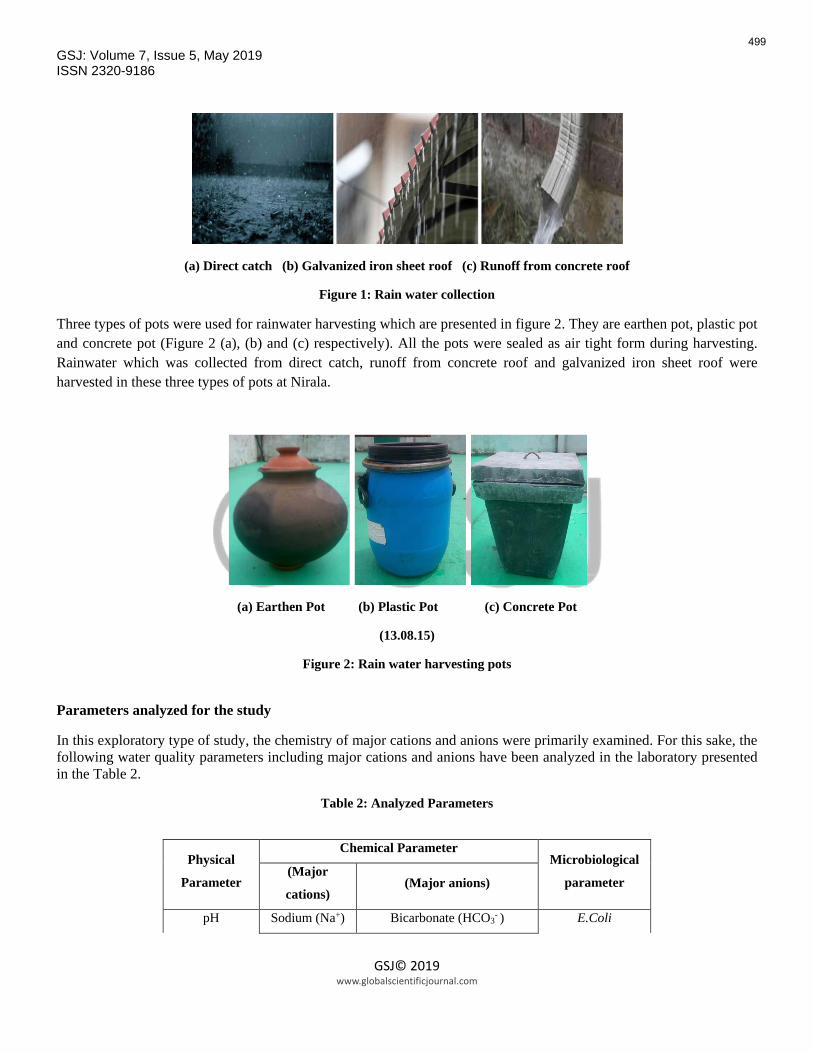
Rainwater samples were collected from direct catch, concrete roof and galvanized iron sheet roof (shown in figure 1 (a), (b) and (c) respectively) after the first flashing of rainfall.
498
GSJ: Volume 7, Issue 5, May 2019 ISSN 2320-9186
GSJ© 2019 www.globalscientificjournal.com
(a) Direct catch (b) Galvanized iron sheet roof (c) Runoff from concrete roof
Figure 1: Rain water collection
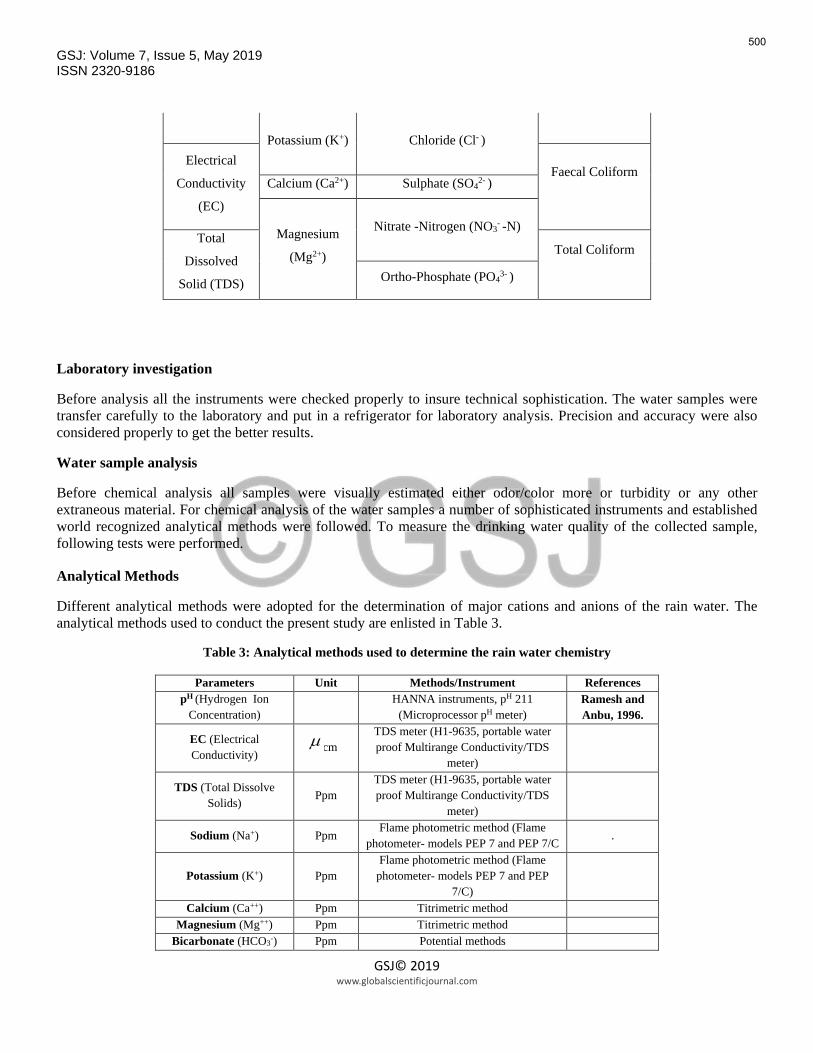
Three types of pots were used for rainwater harvesting which are presented in figure 2. They are earthen pot, plastic pot and concrete pot (Figure 2 (a), (b) and (c) respectively). All the pots were sealed as air tight form during harvesting. Rainwater which was collected from direct catch, runoff from concrete roof and galvanized iron sheet roof were harvested in these three types of pots at Nirala.
(a) Earthen Pot (b) Plastic Pot (c) Concrete Pot
(13.08.15)
Figure 2: Rain water harvesting pots
Parameters analyzed for the study
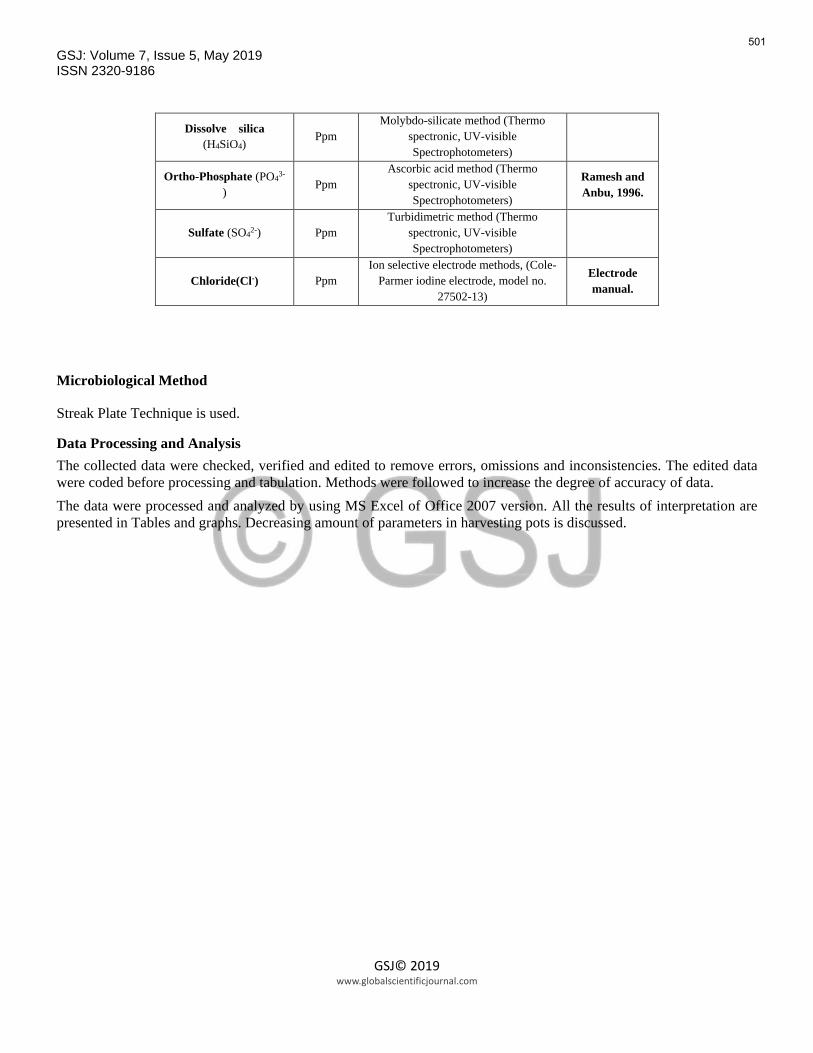
In this exploratory type of study, the chemistry of major cations and anions were primarily examined. For this sake, the following water quality parameters including major cations and anions have been analyzed in the laboratory presented in the Table 2.
Table 2: Analyzed Parameters
Physical
Parameter
Chemical Parameter Microbiological
parameter (Major
cations) (Major anions)
pH Sodium (Na+) Bicarbonate (HCO3- ) E.Coli
499
GSJ: Volume 7, Issue 5, May 2019 ISSN 2320-9186
GSJ© 2019 www.globalscientificjournal.com
Potassium (K+) Chloride (Cl- ) Electrical
Conductivity
(EC)
Faecal Coliform
Calcium (Ca2+) Sulphate (SO4
2- )
Magnesium
(Mg2+)
Nitrate -Nitrogen (NO3- -N)
Total
Dissolved
Solid (TDS)
Total Coliform
Ortho-Phosphate (PO43- )
Laboratory investigation
Before analysis all the instruments were checked properly to insure technical sophistication. The water samples were transfer carefully to the laboratory and put in a refrigerator for laboratory analysis. Precision and accuracy were also considered properly to get the better results.
Water sample analysis
Before chemical analysis all samples were visually estimated either odor/color more or turbidity or any other extraneous material. For chemical analysis of the water samples a number of sophisticated instruments and established world recognized analytical methods were followed. To measure the drinking water quality of the collected sample, following tests were performed.
Analytical Methods
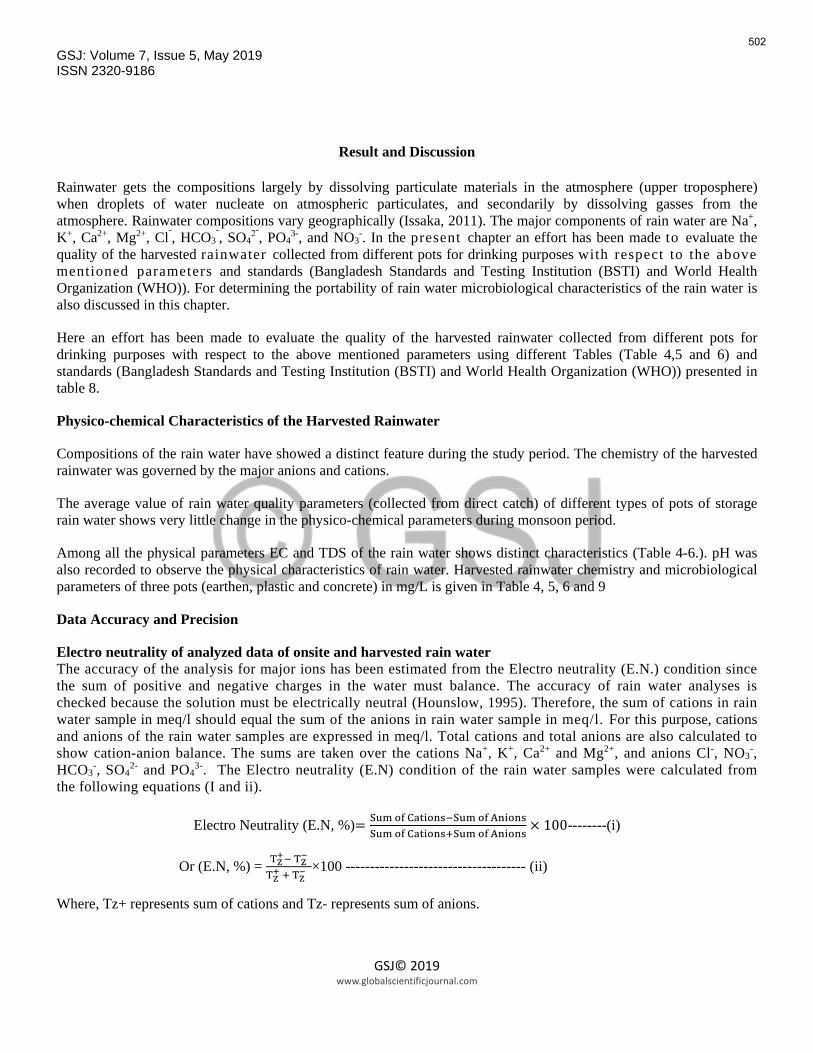
Different analytical methods were adopted for the determination of major cations and anions of the rain water. The analytical methods used to conduct the present study are enlisted in Table 3.
Table 3: Analytical methods used to determine the rain water chemistry
Parameters Unit Methods/Instrument References pH (Hydrogen Ion
Concentration) HANNA instruments, pH 211
(Microprocessor pH meter) Ramesh and Anbu, 1996.
EC (Electrical Conductivity) s/cm
TDS meter (H1-9635, portable water proof Multirange Conductivity/TDS
meter)
TDS (Total Dissolve Solids) Ppm
TDS meter (H1-9635, portable water proof Multirange Conductivity/TDS
meter)
Sodium (Na+) Ppm Flame photometric method (Flame
photometer- models PEP 7 and PEP 7/C .
Potassium (K+) Ppm Flame photometric method (Flame
photometer- models PEP 7 and PEP 7/C)
Calcium (Ca++) Ppm Titrimetric method Magnesium (Mg++) Ppm Titrimetric method
Bicarbonate (HCO3-) Ppm Potential methods
500
GSJ: Volume 7, Issue 5, May 2019 ISSN 2320-9186
GSJ© 2019 www.globalscientificjournal.com
Dissolve silica (H4SiO4)
Ppm Molybdo-silicate method (Thermo
spectronic, UV-visible Spectrophotometers)
Ortho-Phosphate (PO43-
) Ppm Ascorbic acid method (Thermo
spectronic, UV-visible Spectrophotometers)
Ramesh and Anbu, 1996.
Sulfate (SO42-) Ppm Turbidimetric method (Thermo
spectronic, UV-visible Spectrophotometers)
Chloride(Cl-) Ppm Ion selective electrode methods, (Cole-
Parmer iodine electrode, model no. 27502-13)
Electrode manual.
Microbiological Method
Streak Plate Technique is used.
Data Processing and Analysis The collected data were checked, verified and edited to remove errors, omissions and inconsistencies. The edited data were coded before processing and tabulation. Methods were followed to increase the degree of accuracy of data. The data were processed and analyzed by using MS Excel of Office 2007 version. All the results of interpretation are presented in Tables and graphs. Decreasing amount of parameters in harvesting pots is discussed.
501
GSJ: Volume 7, Issue 5, May 2019 ISSN 2320-9186
GSJ© 2019 www.globalscientificjournal.com
Result and Discussion
Rainwater gets the compositions largely by dissolving particulate materials in the atmosphere (upper troposphere) when droplets of water nucleate on atmospheric particulates, and secondarily by dissolving gasses from the atmosphere. Rainwater compositions vary geographically (Issaka, 2011). The major components of rain water are Na+, K+, Ca2+, Mg2+, Clˉ, HCO3
ˉ, SO42ˉ, PO4
3-, and NO3-. In the present chapter an effort has been made to evaluate the
quality of the harvested rainwater collected from different pots for drinking purposes with respect to the above mentioned parameters and standards (Bangladesh Standards and Testing Institution (BSTI) and World Health Organization (WHO)). For determining the portability of rain water microbiological characteristics of the rain water is also discussed in this chapter.
Here an effort has been made to evaluate the quality of the harvested rainwater collected from different pots for drinking purposes with respect to the above mentioned parameters using different Tables (Table 4,5 and 6) and standards (Bangladesh Standards and Testing Institution (BSTI) and World Health Organization (WHO)) presented in table 8.
Physico-chemical Characteristics of the Harvested Rainwater
Compositions of the rain water have showed a distinct feature during the study period. The chemistry of the harvested rainwater was governed by the major anions and cations.
The average value of rain water quality parameters (collected from direct catch) of different types of pots of storage rain water shows very little change in the physico-chemical parameters during monsoon period.
Among all the physical parameters EC and TDS of the rain water shows distinct characteristics (Table 4-6.). pH was also recorded to observe the physical characteristics of rain water. Harvested rainwater chemistry and microbiological parameters of three pots (earthen, plastic and concrete) in mg/L is given in Table 4, 5, 6 and 9
Data Accuracy and Precision
Electro neutrality of analyzed data of onsite and harvested rain water The accuracy of the analysis for major ions has been estimated from the Electro neutrality (E.N.) condition since the sum of positive and negative charges in the water must balance. The accuracy of rain water analyses is checked because the solution must be electrically neutral (Hounslow, 1995). Therefore, the sum of cations in rain water sample in meq/l should equal the sum of the anions in rain water sample in meq/l. For this purpose, cations and anions of the rain water samples are expressed in meq/l. Total cations and total anions are also calculated to show cation-anion balance. The sums are taken over the cations Na+, K+, Ca2+ and Mg2+, and anions Cl-, NO3
-, HCO3
-, SO42- and PO4
3-. The Electro neutrality (E.N) condition of the rain water samples were calculated from the following equations (I and ii).
Electro Neutrality (E.N, %)= Sum of Cations−Sum of AnionsSum of Cations+Sum of Anions
× 100--------(i)
Or (E.N, %) = TZ+− TZ
−
TZ+ + TZ
− ×100 ------------------------------------- (ii)
Where, Tz+ represents sum of cations and Tz- represents sum of anions.
502
GSJ: Volume 7, Issue 5, May 2019 ISSN 2320-9186
GSJ© 2019 www.globalscientificjournal.com
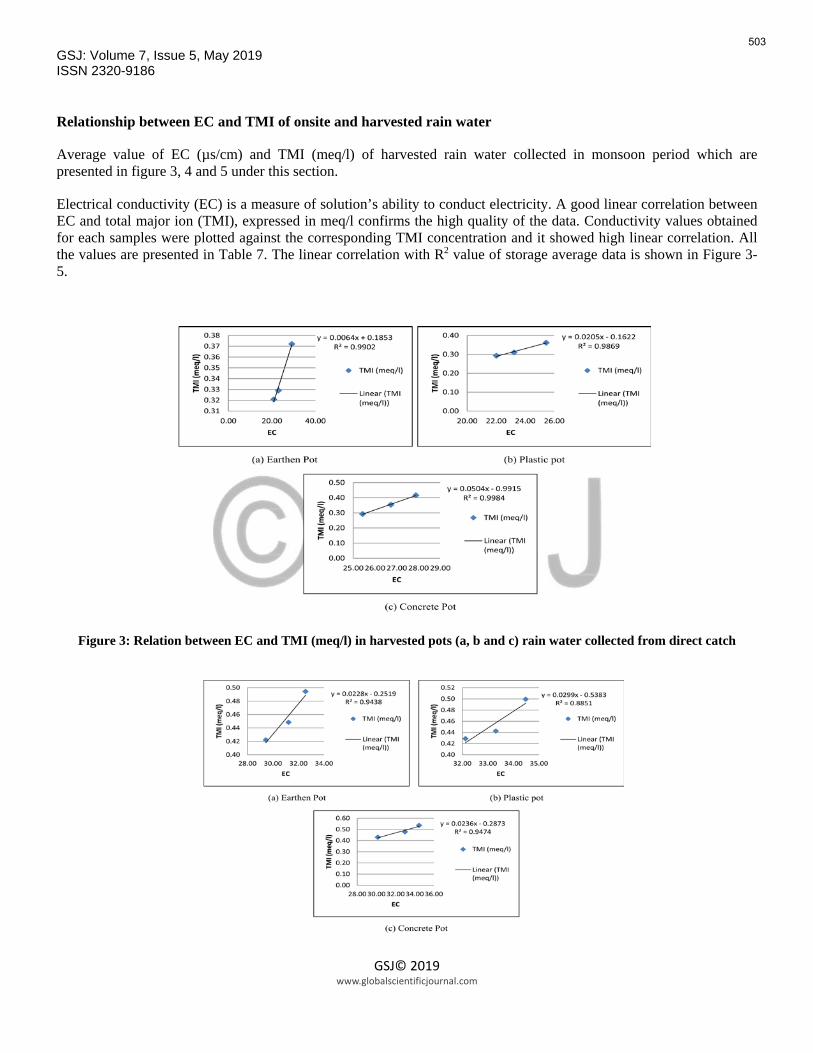
Relationship between EC and TMI of onsite and harvested rain water
Average value of EC (µs/cm) and TMI (meq/l) of harvested rain water collected in monsoon period which are presented in figure 3, 4 and 5 under this section.
Electrical conductivity (EC) is a measure of solution’s ability to conduct electricity. A good linear correlation between EC and total major ion (TMI), expressed in meq/l confirms the high quality of the data. Conductivity values obtained for each samples were plotted against the corresponding TMI concentration and it showed high linear correlation. All the values are presented in Table 7. The linear correlation with R2 value of storage average data is shown in Figure 3- 5.
Figure 3: Relation between EC and TMI (meq/l) in harvested pots (a, b and c) rain water collected from direct catch
503
GSJ: Volume 7, Issue 5, May 2019 ISSN 2320-9186
GSJ© 2019 www.globalscientificjournal.com
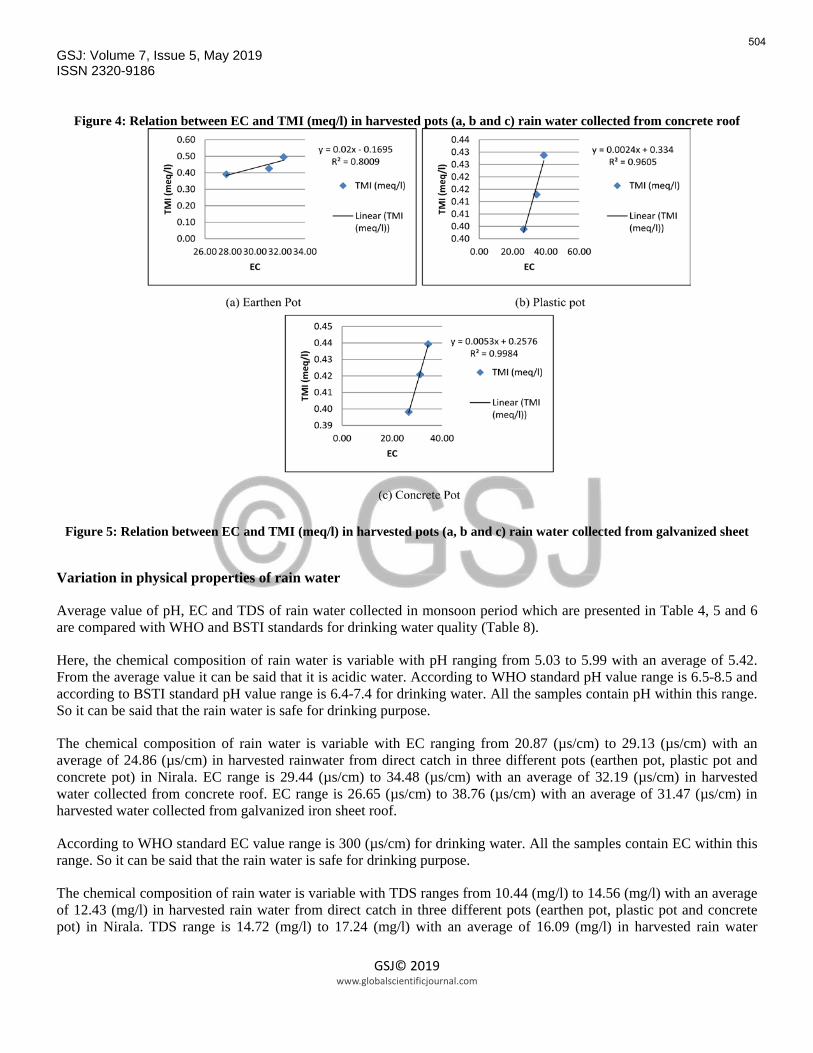
Figure 4: Relation between EC and TMI (meq/l) in harvested pots (a, b and c) rain water collected from concrete roof
Figure 5: Relation between EC and TMI (meq/l) in harvested pots (a, b and c) rain water collected from galvanized sheet
Variation in physical properties of rain water
Average value of pH, EC and TDS of rain water collected in monsoon period which are presented in Table 4, 5 and 6 are compared with WHO and BSTI standards for drinking water quality (Table 8).
Here, the chemical composition of rain water is variable with pH ranging from 5.03 to 5.99 with an average of 5.42. From the average value it can be said that it is acidic water. According to WHO standard pH value range is 6.5-8.5 and according to BSTI standard pH value range is 6.4-7.4 for drinking water. All the samples contain pH within this range. So it can be said that the rain water is safe for drinking purpose.
The chemical composition of rain water is variable with EC ranging from 20.87 (µs/cm) to 29.13 (µs/cm) with an average of 24.86 (µs/cm) in harvested rainwater from direct catch in three different pots (earthen pot, plastic pot and concrete pot) in Nirala. EC range is 29.44 (µs/cm) to 34.48 (µs/cm) with an average of 32.19 (µs/cm) in harvested water collected from concrete roof. EC range is 26.65 (µs/cm) to 38.76 (µs/cm) with an average of 31.47 (µs/cm) in harvested water collected from galvanized iron sheet roof.
According to WHO standard EC value range is 300 (µs/cm) for drinking water. All the samples contain EC within this range. So it can be said that the rain water is safe for drinking purpose.
The chemical composition of rain water is variable with TDS ranges from 10.44 (mg/l) to 14.56 (mg/l) with an average of 12.43 (mg/l) in harvested rain water from direct catch in three different pots (earthen pot, plastic pot and concrete pot) in Nirala. TDS range is 14.72 (mg/l) to 17.24 (mg/l) with an average of 16.09 (mg/l) in harvested rain water
504
GSJ: Volume 7, Issue 5, May 2019 ISSN 2320-9186
GSJ© 2019 www.globalscientificjournal.com
collected from concrete roof. TDS range is 13.33 (mg/l) to 19.38 (mg/l) with an average of 15.74 (mg/l) in harvested rain water collected from galvanized iron sheet roof.
According to WHO standard TDS value range is 1000 mg/l and according to BSTI standard TDS value range is 500 mg/l for drinking water. All the samples contain TDS within this range. So it can be said that the rain water is safe for drinking purpose.
Variation in ion chemistry of rain water
Average value of Na+, K+, Ca2+, Mg2+, Clˉ, HCO3ˉ, SO42ˉ, PO4
3-, and NO3- of rain water collected in monsoon period which are presented in mg/l in 4,5 and 6 and compared with WHO and BSTI standards presented in table 8.
All the sample values Na+, K+, Ca2+, Mg2+, Clˉ, HCO3ˉ, SO42ˉ, PO4
3-, and NO3- of harvested rain water collected in monsoon period are within the range. So it can be said that the water is safe for drinking purposes.
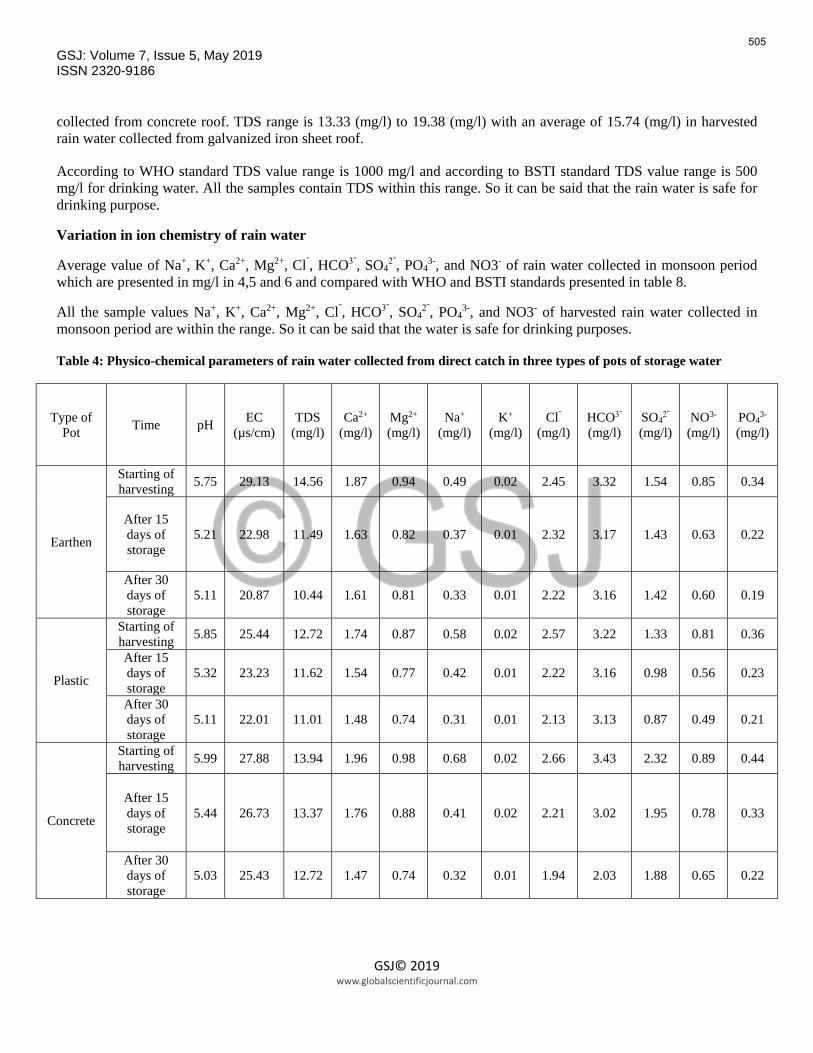
Table 4: Physico-chemical parameters of rain water collected from direct catch in three types of pots of storage water
Type of Pot Time pH EC
(µs/cm) TDS
(mg/l) Ca2+
(mg/l) Mg2+ (mg/l)
Na+ (mg/l)
K+ (mg/l)
Clˉ (mg/l)
HCO3ˉ (mg/l)
SO42ˉ
(mg/l) NO3-
(mg/l) PO4
3- (mg/l)
Earthen
Starting of harvesting 5.75 29.13 14.56 1.87 0.94 0.49 0.02 2.45 3.32 1.54 0.85 0.34
After 15 days of storage
5.21 22.98 11.49 1.63 0.82 0.37 0.01 2.32 3.17 1.43 0.63 0.22
After 30 days of storage
5.11 20.87 10.44 1.61 0.81 0.33 0.01 2.22 3.16 1.42 0.60 0.19
Plastic
Starting of harvesting 5.85 25.44 12.72 1.74 0.87 0.58 0.02 2.57 3.22 1.33 0.81 0.36
After 15 days of storage
5.32 23.23 11.62 1.54 0.77 0.42 0.01 2.22 3.16 0.98 0.56 0.23
After 30 days of storage
5.11 22.01 11.01 1.48 0.74 0.31 0.01 2.13 3.13 0.87 0.49 0.21
Concrete
Starting of harvesting 5.99 27.88 13.94 1.96 0.98 0.68 0.02 2.66 3.43 2.32 0.89 0.44
After 15 days of storage
5.44 26.73 13.37 1.76 0.88 0.41 0.02 2.21 3.02 1.95 0.78 0.33
After 30 days of storage
5.03 25.43 12.72 1.47 0.74 0.32 0.01 1.94 2.03 1.88 0.65 0.22
505
GSJ: Volume 7, Issue 5, May 2019 ISSN 2320-9186
GSJ© 2019 www.globalscientificjournal.com
From Table 4 it can be concluded that rain water collected from direct catch have lowest EC and TDS in earthen pot after 30 days of storage. But all other parameters present in lowest amount in rain water collected from direct catch in concrete pot after 30 days of harvesting.
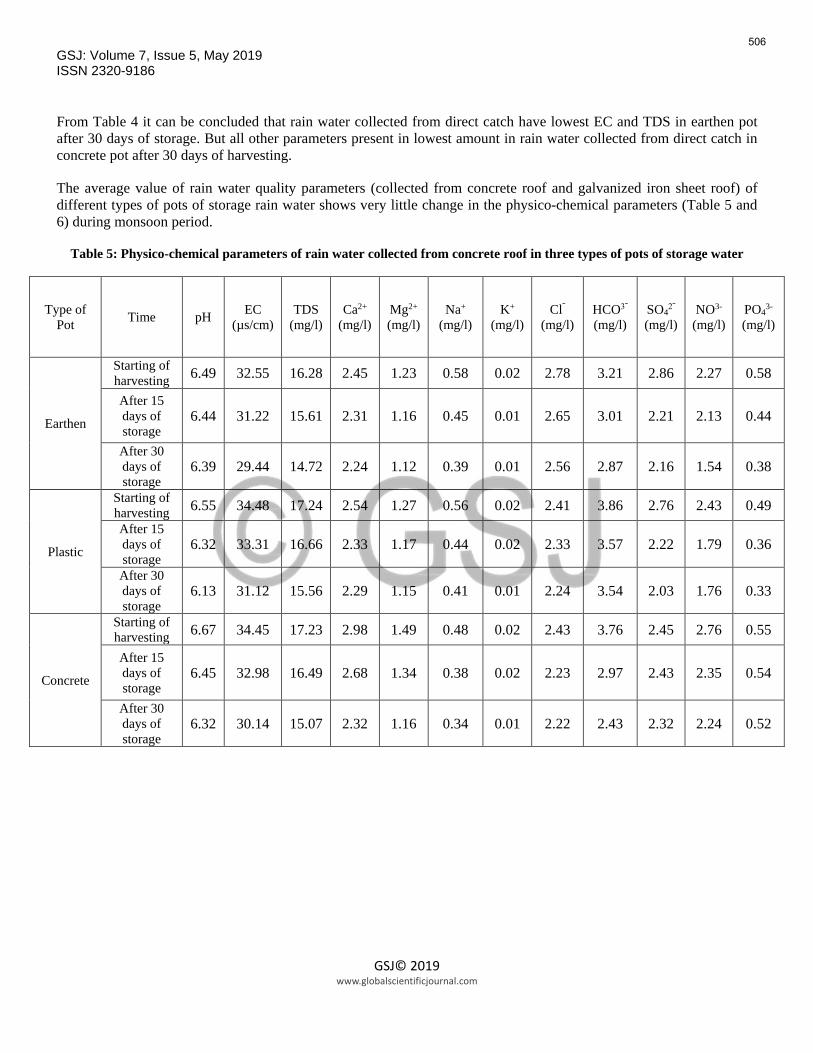
The average value of rain water quality parameters (collected from concrete roof and galvanized iron sheet roof) of different types of pots of storage rain water shows very little change in the physico-chemical parameters (Table 5 and 6) during monsoon period.
Table 5: Physico-chemical parameters of rain water collected from concrete roof in three types of pots of storage water
Type of Pot Time pH EC
(µs/cm) TDS
(mg/l) Ca2+
(mg/l) Mg2+ (mg/l)
Na+ (mg/l)
K+ (mg/l)
Clˉ (mg/l)
HCO3ˉ (mg/l)
SO42ˉ
(mg/l) NO3-
(mg/l) PO4
3- (mg/l)
Earthen
Starting of harvesting 6.49 32.55 16.28 2.45 1.23 0.58 0.02 2.78 3.21 2.86 2.27 0.58
After 15 days of storage
6.44 31.22 15.61 2.31 1.16 0.45 0.01 2.65 3.01 2.21 2.13 0.44
After 30 days of storage
6.39 29.44 14.72 2.24 1.12 0.39 0.01 2.56 2.87 2.16 1.54 0.38
Plastic
Starting of harvesting 6.55 34.48 17.24 2.54 1.27 0.56 0.02 2.41 3.86 2.76 2.43 0.49 After 15 days of storage
6.32 33.31 16.66 2.33 1.17 0.44 0.02 2.33 3.57 2.22 1.79 0.36
After 30 days of storage
6.13 31.12 15.56 2.29 1.15 0.41 0.01 2.24 3.54 2.03 1.76 0.33
Concrete
Starting of harvesting 6.67 34.45 17.23 2.98 1.49 0.48 0.02 2.43 3.76 2.45 2.76 0.55
After 15 days of storage
6.45 32.98 16.49 2.68 1.34 0.38 0.02 2.23 2.97 2.43 2.35 0.54
After 30 days of storage
6.32 30.14 15.07 2.32 1.16 0.34 0.01 2.22 2.43 2.32 2.24 0.52
506
GSJ: Volume 7, Issue 5, May 2019 ISSN 2320-9186
GSJ© 2019 www.globalscientificjournal.com
Table 6: Physico-chemical parameters of rain water collected from galvanized sheet in three types of pots of storage water
Type Of Pot Time pH EC
(µs/cm) TDS
(mg/l) Ca2+
(mg/l) Mg2+ (mg/l)
Na+ (mg/l)
K+ (mg/l)
Clˉ (mg/l)
HCO3ˉ (mg/l)
SO42ˉ (mg/l)
NO3-
(mg/l) PO43- (mg/l)
Earthen
Starting of harvesting 7.77 32.29 16.15 2.67 1.34 0.55 0.03 3.54 3.76 1.87 0.94 0.37
After 15 days of storage
7.65 31.12 15.56 2.22 1.11 0.46 0.02 3.42 3.47 1.47 0.54 0.33
After 30 days of storage
7.54 27.67 13.84 1.98 0.99 0.44 0.02 3.23 3.43 1.32 0.46 0.27
Plastic
Starting of harvesting 7.49 38.76 19.38 2.16 1.08 0.43 0.03 3.34 3.45 1.82 0.92 0.29
After 15 days of storage
7.43 34.43 17.22 2.13 1.07 0.37 0.02 3.24 3.31 1.77 0.76 0.24
After 30 days of storage
6.57 26.65 13.33 2.11 1.06 0.33 0.02 3.21 3.21 1.65 0.54 0.18
Concrete
Starting of harvesting 7.43 34.44 17.22 2.32 1.16 0.37 0.03 3.23 3.44 1.97 0.94 0.24
After 15 days of storage
6.89 31.23 15.62 2.26 1.13 0.33 0.02 3.22 3.24 1.76 0.89 0.17
After 30 days of storage
6.65 26.65 13.33 2.20 1.10 0.29 0.01 3.12 3.18 1.34 0.76 0.15
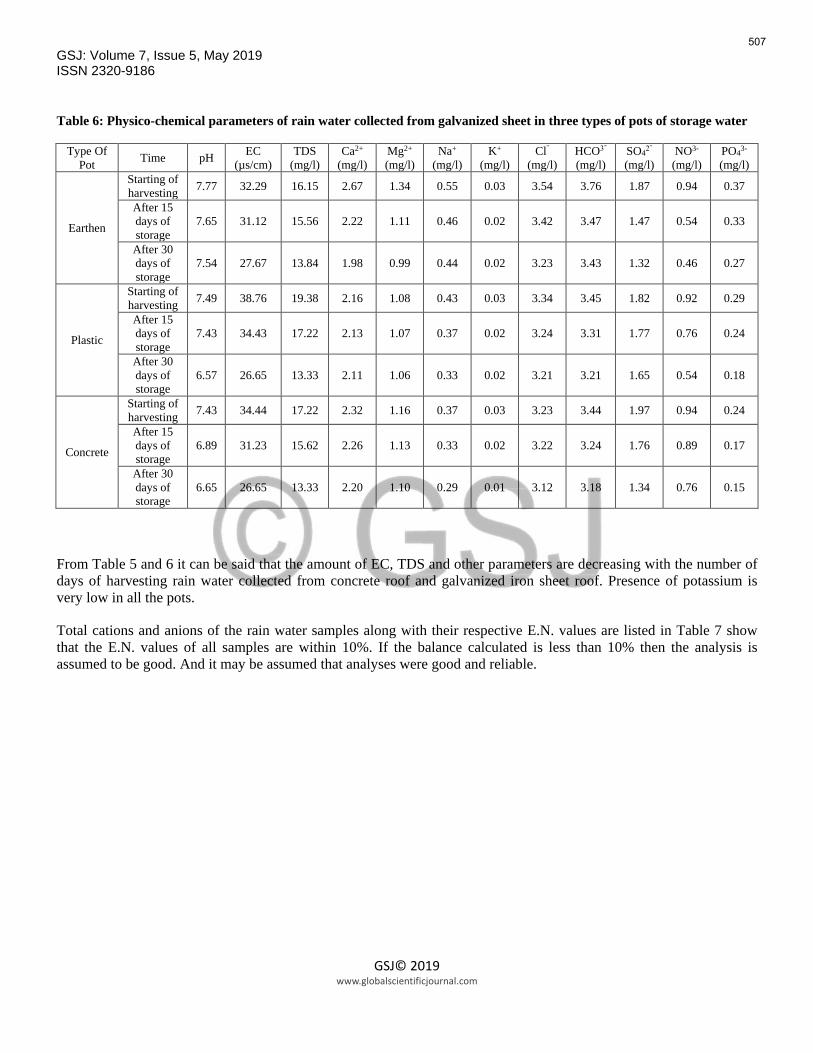
From Table 5 and 6 it can be said that the amount of EC, TDS and other parameters are decreasing with the number of days of harvesting rain water collected from concrete roof and galvanized iron sheet roof. Presence of potassium is very low in all the pots.
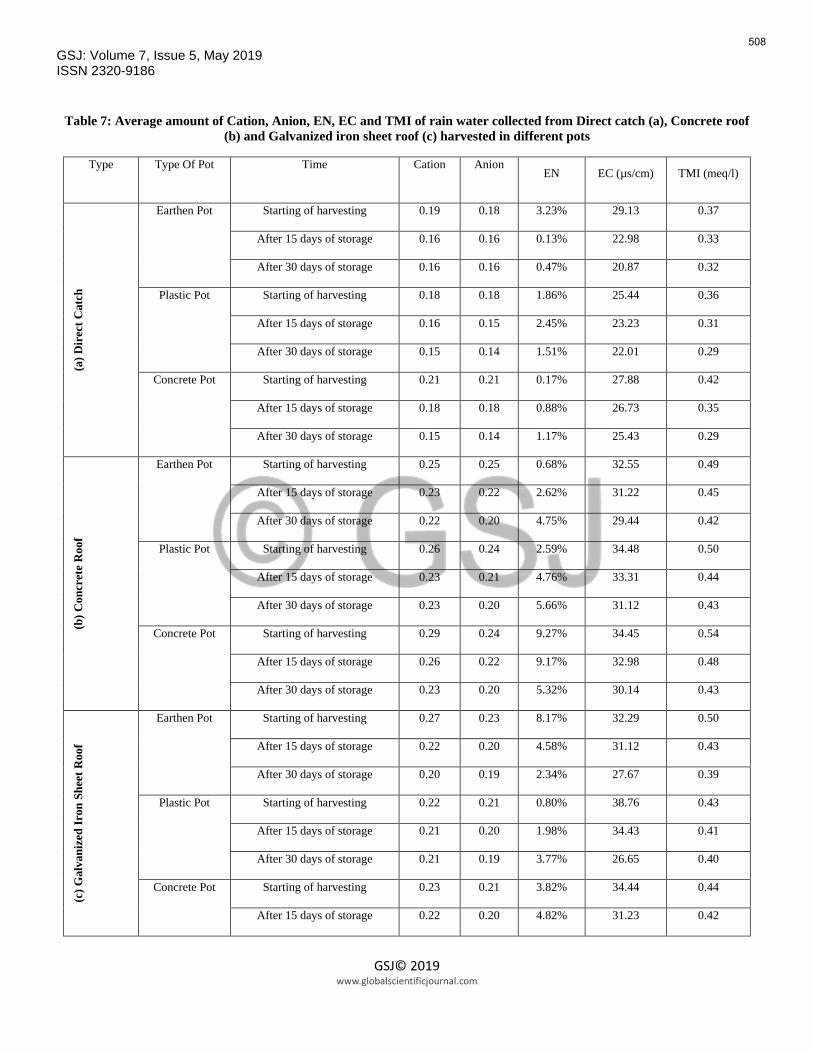
Total cations and anions of the rain water samples along with their respective E.N. values are listed in Table 7 show that the E.N. values of all samples are within 10%. If the balance calculated is less than 10% then the analysis is assumed to be good. And it may be assumed that analyses were good and reliable.
507
GSJ: Volume 7, Issue 5, May 2019 ISSN 2320-9186
GSJ© 2019 www.globalscientificjournal.com
Table 7: Average amount of Cation, Anion, EN, EC and TMI of rain water collected from Direct catch (a), Concrete roof (b) and Galvanized iron sheet roof (c) harvested in different pots
Type Type Of Pot Time Cation Anion EN EC (µs/cm) TMI (meq/l)
(a) D
irec
t Cat
ch
Earthen Pot Starting of harvesting 0.19 0.18 3.23% 29.13 0.37
After 15 days of storage 0.16 0.16 0.13% 22.98 0.33
After 30 days of storage 0.16 0.16 0.47% 20.87 0.32
Plastic Pot Starting of harvesting 0.18 0.18 1.86% 25.44 0.36
After 15 days of storage 0.16 0.15 2.45% 23.23 0.31
After 30 days of storage 0.15 0.14 1.51% 22.01 0.29
Concrete Pot Starting of harvesting 0.21 0.21 0.17% 27.88 0.42
After 15 days of storage 0.18 0.18 0.88% 26.73 0.35
After 30 days of storage 0.15 0.14 1.17% 25.43 0.29
(b) C
oncr
ete
Roo
f
Earthen Pot Starting of harvesting 0.25 0.25 0.68% 32.55 0.49
After 15 days of storage 0.23 0.22 2.62% 31.22 0.45
After 30 days of storage 0.22 0.20 4.75% 29.44 0.42
Plastic Pot Starting of harvesting 0.26 0.24 2.59% 34.48 0.50
After 15 days of storage 0.23 0.21 4.76% 33.31 0.44
After 30 days of storage 0.23 0.20 5.66% 31.12 0.43
Concrete Pot Starting of harvesting 0.29 0.24 9.27% 34.45 0.54
After 15 days of storage 0.26 0.22 9.17% 32.98 0.48
After 30 days of storage 0.23 0.20 5.32% 30.14 0.43
(c) G
alva
nize
d Ir
on S
heet
Roo
f
Earthen Pot Starting of harvesting 0.27 0.23 8.17% 32.29 0.50
After 15 days of storage 0.22 0.20 4.58% 31.12 0.43
After 30 days of storage 0.20 0.19 2.34% 27.67 0.39
Plastic Pot Starting of harvesting 0.22 0.21 0.80% 38.76 0.43
After 15 days of storage 0.21 0.20 1.98% 34.43 0.41
After 30 days of storage 0.21 0.19 3.77% 26.65 0.40
Concrete Pot Starting of harvesting 0.23 0.21 3.82% 34.44 0.44
After 15 days of storage 0.22 0.20 4.82% 31.23 0.42
508
GSJ: Volume 7, Issue 5, May 2019 ISSN 2320-9186
GSJ© 2019 www.globalscientificjournal.com
After 30 days of storage 0.21 0.19 7.06% 26.65 0.40
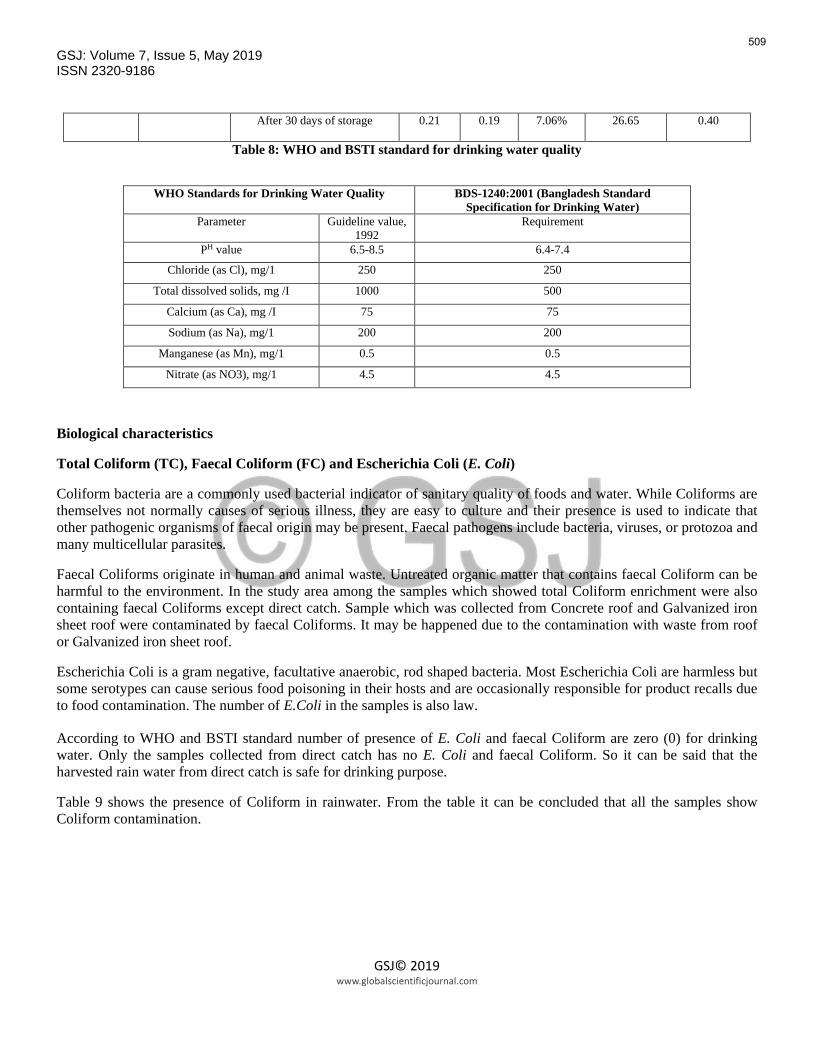
Table 8: WHO and BSTI standard for drinking water quality
WHO Standards for Drinking Water Quality BDS-1240:2001 (Bangladesh Standard Specification for Drinking Water)
Parameter Guideline value, 1992
Requirement
PH value 6.5-8.5 6.4-7.4
Chloride (as Cl), mg/1 250 250
Total dissolved solids, mg /I 1000 500
Calcium (as Ca), mg /I 75 75
Sodium (as Na), mg/1 200 200
Manganese (as Mn), mg/1 0.5 0.5
Nitrate (as NO3), mg/1 4.5 4.5
Biological characteristics
Total Coliform (TC), Faecal Coliform (FC) and Escherichia Coli (E. Coli)
Coliform bacteria are a commonly used bacterial indicator of sanitary quality of foods and water. While Coliforms are themselves not normally causes of serious illness, they are easy to culture and their presence is used to indicate that other pathogenic organisms of faecal origin may be present. Faecal pathogens include bacteria, viruses, or protozoa and many multicellular parasites.
Faecal Coliforms originate in human and animal waste. Untreated organic matter that contains faecal Coliform can be harmful to the environment. In the study area among the samples which showed total Coliform enrichment were also containing faecal Coliforms except direct catch. Sample which was collected from Concrete roof and Galvanized iron sheet roof were contaminated by faecal Coliforms. It may be happened due to the contamination with waste from roof or Galvanized iron sheet roof.
Escherichia Coli is a gram negative, facultative anaerobic, rod shaped bacteria. Most Escherichia Coli are harmless but some serotypes can cause serious food poisoning in their hosts and are occasionally responsible for product recalls due to food contamination. The number of E.Coli in the samples is also law.
According to WHO and BSTI standard number of presence of E. Coli and faecal Coliform are zero (0) for drinking water. Only the samples collected from direct catch has no E. Coli and faecal Coliform. So it can be said that the harvested rain water from direct catch is safe for drinking purpose.
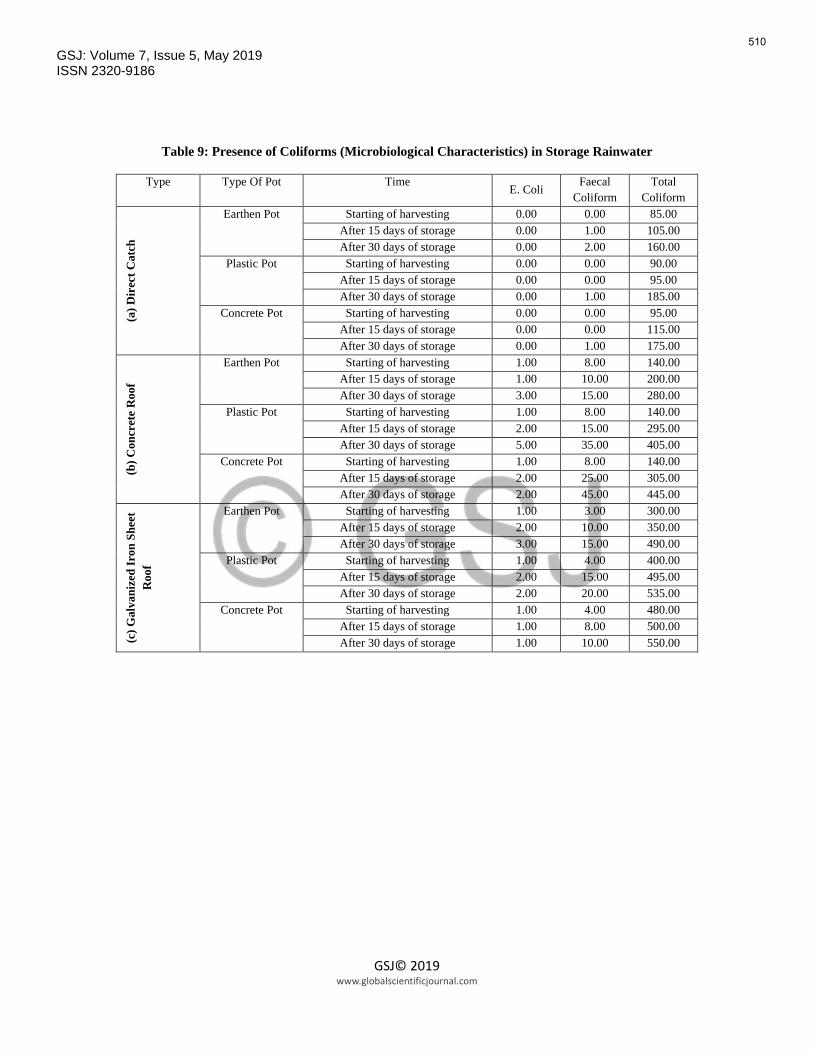
Table 9 shows the presence of Coliform in rainwater. From the table it can be concluded that all the samples show Coliform contamination.
509
GSJ: Volume 7, Issue 5, May 2019 ISSN 2320-9186
GSJ© 2019 www.globalscientificjournal.com
Table 9: Presence of Coliforms (Microbiological Characteristics) in Storage Rainwater
Type Type Of Pot Time E. Coli
Faecal Coliform
Total Coliform
(a) D
irec
t Cat
ch
Earthen Pot Starting of harvesting 0.00 0.00 85.00 After 15 days of storage 0.00 1.00 105.00 After 30 days of storage 0.00 2.00 160.00
Plastic Pot Starting of harvesting 0.00 0.00 90.00 After 15 days of storage 0.00 0.00 95.00 After 30 days of storage 0.00 1.00 185.00
Concrete Pot Starting of harvesting 0.00 0.00 95.00 After 15 days of storage 0.00 0.00 115.00 After 30 days of storage 0.00 1.00 175.00
(b) C
oncr
ete
Roo
f
Earthen Pot Starting of harvesting 1.00 8.00 140.00 After 15 days of storage 1.00 10.00 200.00 After 30 days of storage 3.00 15.00 280.00
Plastic Pot Starting of harvesting 1.00 8.00 140.00 After 15 days of storage 2.00 15.00 295.00 After 30 days of storage 5.00 35.00 405.00
Concrete Pot Starting of harvesting 1.00 8.00 140.00 After 15 days of storage 2.00 25.00 305.00 After 30 days of storage 2.00 45.00 445.00
(c) G
alva
nize
d Ir
on S
heet
R
oof
Earthen Pot Starting of harvesting 1.00 3.00 300.00 After 15 days of storage 2.00 10.00 350.00 After 30 days of storage 3.00 15.00 490.00
Plastic Pot Starting of harvesting 1.00 4.00 400.00 After 15 days of storage 2.00 15.00 495.00 After 30 days of storage 2.00 20.00 535.00
Concrete Pot Starting of harvesting 1.00 4.00 480.00 After 15 days of storage 1.00 8.00 500.00 After 30 days of storage 1.00 10.00 550.00
510
GSJ: Volume 7, Issue 5, May 2019 ISSN 2320-9186
GSJ© 2019 www.globalscientificjournal.com
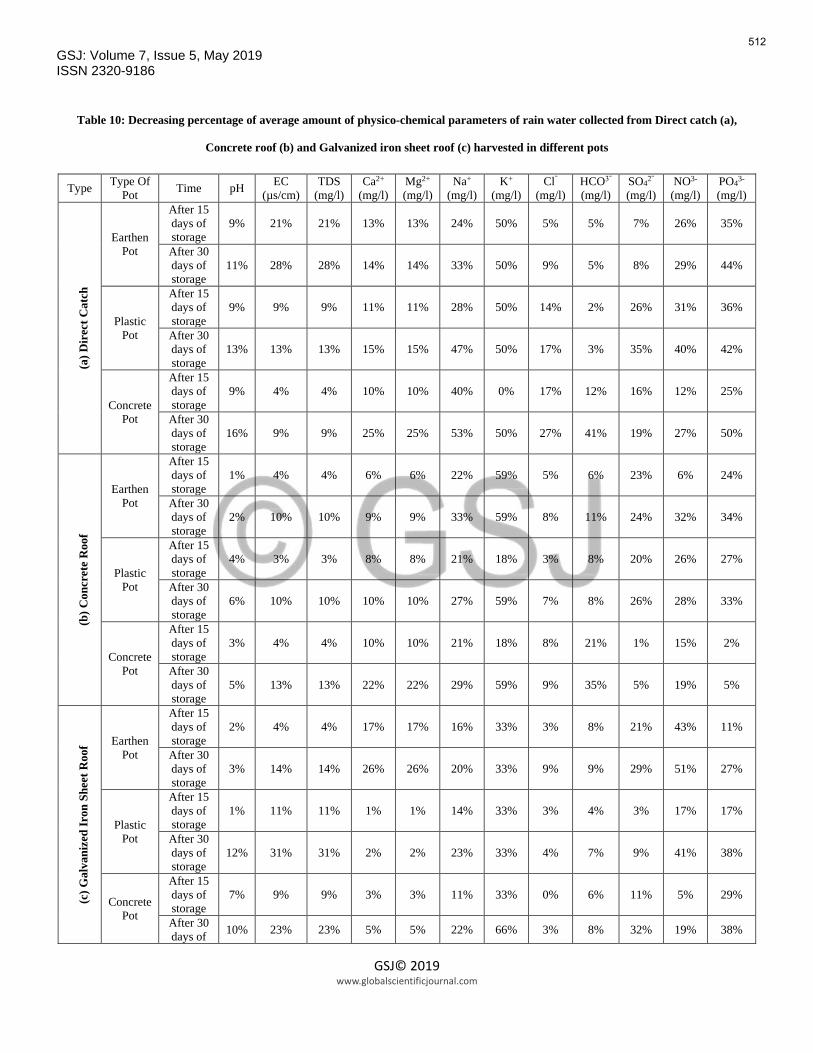
Rainwater Quality of Physico-chemical Parameters in Harvested Pots
From Table 10 it is found that the amount of physico-chemical parameters decreases with the increasing number of harvesting days. Water stored in harvested pots collected from direct catch shows most of the parameters decrease from 5% to 33%. Water stored in concrete pot collected from concrete roof shows no change in potassium after 15 days of harvesting but shows 50% decrease rate after 30 days of harvesting. Water stored in harvested post collected from concrete roof shows most of the parameters decrease from 1% to 59%. Sulphate has the lowest decrease rate and potassium has the highest decrease rate. Water stored in harvested post collected from galvanized iron sheet roof shows most of the parameters decrease from 1% to 66%. Here, calcium and magnesium have the lowest decrease rate and potassium has the highest decrease rate.
Rainwater (Collected from direct catch) quality of physico-chemical parameters in harvested pots
From Table 10 (a) (direct catch), it is found that pH (16%), Ca2+ and Mg2+ (25%), Na+ (53%), Cl- (27%), HCO3-
(41%) and PO43- (50%) decrease in highest amount in rain water collected from concrete pot which has been stored
for 30 days after harvesting. Decrease rate of potassium (K+) (50%) is almost equal in every pot except rain water present in concrete pot after 15 days of harvesting. No change occurs here.
Rainwater (Collected from concrete roof) quality of physico-chemical parameters in harvested pots
From Table 10 (b) (concrete roof), it is found that EC (13%), TDS (13%), Ca2+ (22%), Mg2+ (22%), K+ (59%), Cl- (9%) and HCO3
- (35%) decrease in highest amount in rain water collected from concrete pot which has been stored for 30 days after harvesting. pH (6%) and SO4
- (26%) decrease in highest amount in plastic pot after 30 days of harvesting. Na+ decrease in highest amount (33%) after 30 days of storage in earthen pot. NO3
- (32%) and PO4-
(34%) decrease rate is highest in earthen pot after 30 days of storage.
Rainwater (Collected from galvanized iron sheet roof) quality of physico-chemical parameters in harvested pots
From Table 10 (c) (galvanized iron sheet roof), it is found that the decrease rate of all the parameters is very close in earthen pot, plastic pot and concrete pot. pH (12%), EC (13%), TDS (31%), Na+ (23%) and PO4
- (38%) decrease in high amount in plastic pot after 30 days of harvesting. Ca2+ (26%), Mg2+ (26%), Cl- (9%) and HCO3
- (9%) decrease in highest amount in rain water collected from earthen pot which has been stored for 30 days after harvesting. SO4
2-
(32%) and PO43- (38%) decrease rate is highest in concrete pot after 30 days of storage
511
GSJ: Volume 7, Issue 5, May 2019 ISSN 2320-9186
GSJ© 2019 www.globalscientificjournal.com
Table 10: Decreasing percentage of average amount of physico-chemical parameters of rain water collected from Direct catch (a),
Concrete roof (b) and Galvanized iron sheet roof (c) harvested in different pots
Type Type Of
Pot Time pH EC (µs/cm)
TDS (mg/l)
Ca2+ (mg/l)
Mg2+ (mg/l)
Na+ (mg/l)
K+ (mg/l)
Clˉ (mg/l)
HCO3ˉ (mg/l)
SO42ˉ (mg/l)
NO3-
(mg/l) PO43- (mg/l)
(a) D
irec
t Cat
ch
Earthen Pot
After 15 days of storage
9% 21% 21% 13% 13% 24% 50% 5% 5% 7% 26% 35%
After 30 days of storage
11% 28% 28% 14% 14% 33% 50% 9% 5% 8% 29% 44%
Plastic Pot
After 15 days of storage
9% 9% 9% 11% 11% 28% 50% 14% 2% 26% 31% 36%
After 30 days of storage
13% 13% 13% 15% 15% 47% 50% 17% 3% 35% 40% 42%
Concrete Pot
After 15 days of storage
9% 4% 4% 10% 10% 40% 0% 17% 12% 16% 12% 25%
After 30 days of storage
16% 9% 9% 25% 25% 53% 50% 27% 41% 19% 27% 50%
(b) C
oncr
ete
Roo
f
Earthen Pot
After 15 days of storage
1% 4% 4% 6% 6% 22% 59% 5% 6% 23% 6% 24%
After 30 days of storage
2% 10% 10% 9% 9% 33% 59% 8% 11% 24% 32% 34%
Plastic Pot
After 15 days of storage
4% 3% 3% 8% 8% 21% 18% 3% 8% 20% 26% 27%
After 30 days of storage
6% 10% 10% 10% 10% 27% 59% 7% 8% 26% 28% 33%
Concrete Pot
After 15 days of storage
3% 4% 4% 10% 10% 21% 18% 8% 21% 1% 15% 2%
After 30 days of storage
5% 13% 13% 22% 22% 29% 59% 9% 35% 5% 19% 5%
(c) G
alva
nize
d Ir
on S
heet
Roo
f Earthen Pot
After 15 days of storage
2% 4% 4% 17% 17% 16% 33% 3% 8% 21% 43% 11%
After 30 days of storage
3% 14% 14% 26% 26% 20% 33% 9% 9% 29% 51% 27%
Plastic Pot
After 15 days of storage
1% 11% 11% 1% 1% 14% 33% 3% 4% 3% 17% 17%
After 30 days of storage
12% 31% 31% 2% 2% 23% 33% 4% 7% 9% 41% 38%
Concrete Pot
After 15 days of storage
7% 9% 9% 3% 3% 11% 33% 0% 6% 11% 5% 29%
After 30 days of 10% 23% 23% 5% 5% 22% 66% 3% 8% 32% 19% 38%
512

GSJ: Volume 7, Issue 5, May 2019 ISSN 2320-9186
GSJ© 2019 www.globalscientificjournal.com
Rainwater Quality of Physico-chemical Parameters in Harvested Pots
After all the discussion of rain water quality (physic chemical and microbiological) from the study, it can be said that concrete pot was good for rain water harvesting. Plastic pot is also preferable for rain water harvesting in urban area like Khulna city. The installment and movement of plastic pot is much easier than concrete pot. Earthen pot can also be a good option. But installment and movement of earthen pot in urban area is not so easy. So, from the study only concrete pot and plastic pot are recommended for rain water harvesting in urban area like Khulna city.
storage
513
GSJ: Volume 7, Issue 5, May 2019 ISSN 2320-9186
GSJ© 2019 www.globalscientificjournal.com
Conclusion
The problem of water scarcity, together with increasing environmental awareness, the development of more stringent regulations on water quality and use and the need for sustainable approaches in water management related activities have increased the potential for alternative water resources. In this framework, the analysis of alternative water resources, such as rainwater, is becoming increasingly popular as a sustainable source of water with a reduced impact on the environment. So rainwater harvesting is a very good option for the sustainable management of drinking water. In Bangladesh it is not very popular way but some people use it for household works. From the study it has found that rainwater in urban area like residential area of KCC is clean and safe to use. Harvested rainwater from direct catch is more preferable than rainwater collected from concrete roof and GI sheet. Concrete pot and plastic pot are better option than earthen pot for harvesting of rain water. So rain water as potential source of drinking water can be used in KCC area.
Further study is suggested for the better and easy management of storage rain water along with instrumental set up in broad. Trace elements test of rain water will improve future study.
514

GSJ: Volume 7, Issue 5, May 2019 ISSN 2320-9186
GSJ© 2019 www.globalscientificjournal.com
ACKNOWLEDGEMENT
At the very outset, with all the inclination of my heart, I would like to express appreciation, praise and gratitude to the universal owner, Almighty Allah, the most beneficent and merciful creator who has enabled me to complete this study.
Then, I would like to express my sincere appreciation and deepest gratitude to Masudur Rahaman, Assistant Professor, Environmental Science Discipline, Khulna University, Khulna, Bangladesh, for his kind support, systematic supervision, guidance and extremely valuable suggestions throughout this study. I would like to thank to Nazia Hasan, Assistant Professor, Environmental Science Discipline, Khulna University, Khulna, Next, I wish to express many thanks to all teachers of Environmental Science Discipline.
I would like to give special thanks and gratefulness to Shangkar Kumar Sarkar and Morzina Begum, Section Officer (Lab.), Environmental Science Discipline, Khulna University for her co-operation and assistance during the laboratory analysis. I would like to give special thanks to my husband Md. Saogatullah Hasan and all of my friends specially Sadhon Chandra Sarnokar for the support in the field of sampling and computer assistance. Finally, to all those who are freely offered their advice and encouragement in this Endeavour; I offer my most sincere appreciation for them
515
GSJ: Volume 7, Issue 5, May 2019 ISSN 2320-9186
GSJ© 2019 www.globalscientificjournal.com
REFERENCES
[1] APHA, 1992. Standard Methods for the Examination of Water and Wastewater. 18th edition. American Public
Health Association (APHA), American Water Works Association (AWWA) and Water Pollution Control
Federation (WPCF), Washington, DC.
[2] Banglapedia. 2011. National Encyclopedia of Bangladesh. Dhaka, Bangladesh.
[3] Berner, E.K. and Berner, R.A. 1987. The Global Water Cycle. Prentice-Hall, Inc., Englewood Cliffs, New
Jersey 07632, pp. 185-235.
[4] Davis, A.P., McCuen, R.H., 2005. Stormwater Management for Smart Growth. Springer, United States.
[5] EPA, 2001. Parameters of Water Quality- Interpretation and Standards.Environmental Protection Agency,
Ireland, ISBN 1-84096-015-3, 26-116pp.
[6] Evans, C.A., Coombes, P.J., Dunstan, R.H., 2006. Wind, rain and bacteria: the effect of weather on the
microbial composition of roof-harvested rainwater. Water Research 40 (1), 37e44.
[7] Farreny, R., Gabarrell, X., Rieradevall, J., 2011. Cost-efficiency of rainwater harvesting strategies in dense
Mediterranean neighbourhoods. Resources, Conservation and Recycling. (accessed 12-08 -2010).
[8] Farreny, 2011. Roof selection for rainwater harvesting: Quantity and quality assessments in Spain, Elsevier,
Bercelona, Spain.
[9] Issaka, M.S, 2011. Appropriate Rainwater Harvesting And Domestic Water Quality A Case Study Of Central
Gonja District. M.S.C Thesis, Kwame Nkrumah University of Science and Technology, gonja, Ghana, Africa, 4 pp
[10] Nath, K. J., Bloomfield, S. F., and Jones, M. (2006). Household water storage, handling and point-of-use
treatment. A review commissioned by IFH. [http://www.ifh-homehygiene.org], (accessed 05-05 -2010).
[11] Pathak and Heijnen, 2000. Rainwater Harvesting and Health Aspects- Working on WHO guidance, searo,
Nepal
[12] Sean, 2012, Physicochemical and microbiological quality of water from a pilot domestic rainwater harvesting
facility in Ireland, Dublin, Ireland.
[13] Uba, B.N., Aghogho, O., 2000. Rainwater quality from different roof catchments in the Port Harcourt district,
Rivers State, Nigeria. Journal of Water Supply Research and Technology. (http://www.ifh-scarlet.org), (accessed
13-05 -2011).
516