Embed Size (px)
Citation preview
NAGRA SKB UKDOE
NTB90-23 TR 90-14 WR 90-045
Poços de Caldas Report No. 5
Geomorphological and hydrogeological features of the Poços de Caldas caldera and the Osamu Utsumi mine and Morro do Ferro analogue study sites, Brazil
An international project with the participation of Brazil, Sweden (SKB), Switzerland (NAGRA), United Kingdom (UK DOE) and USA (US DOE). The project is managed by SKB, Swedish Nuclear Fuel and Waste Management Coo

Geomorphological and hydrogeological features of the Po~os de Caldas caldera and the Osamu Utsumi mine and Morro do Ferro analogue study sites, Brazil.
nc. HOLMESt, A.E. PIT'J.YZ and D.J. NOY!
IBritish Geological Survey, Keyworth, Nottingham, NG12 5GG (U.K.).
2J:ntera Exploration Consultants Ltd., Henley-on-Thames, Oxon, RG9 4PS (U.K.).
Abstract
The Osamu Utsumi mine and Morro do Ferro study sites lie within the POfoS de Caldas
plateau which is roughly circular in outline with a diameter of 35 /an and an area of
approximately 800 /an2• Its general altitude lies between 1300 and 1600 m. The plateau is
the eroded form of a caldera which was initially intruded some 80 million years ago.
Geomorphologically, both sites occupy watershed areas adjacent to small streams in
the centre of the plateau. The climate of the area has a marked wet season from
November to April and is dry the rest of the year. The streams are ephemeral in their upper
reaches, tending to dry up in the dry season as they are fed by a declining base flow. In the
wet season they exhibit flash floods fed by high-intensity rainfall causing overland flow.
The wet season also provides recharge to the groundwater. Natural slopes are steep and
the original vegetation was thin forest cover which is now restricted to the valley bottoms;
usable slopes have poor quality grass cover used for cattle grazing. The plateau is a stable
feature and its surface has been eroding at an average rate of 12 m per million years over
a period of 50 million years.
The mine geology is dominantly volcanic to subvolcanic phonolites that have been
hydrothermally altered. Fracturing of the rock is extensive. Downward diffusion of oxygen
in groundwaters during deep weathering has produced a distinct redox zone seen as a
colour change from green/grey to brown/yellow. Morro do Ferro has a more weathered
version (laterite!clay) of the same geology penetrated by magnetite breccia dykes. Whilst
the area surrounding Morro do Ferro remains untouched, that around the mine has been
seriously disturbed by mining activity which has penetrated the water-table. The existing
mine has modified groundwater flow patterns and disturbed the movement of oxidising
and reducing waters.
i
ii
Zusammenfassung
Die Untersuchungsgelände Osamu Utsumi Mine und Morro do Ferro liegen inner
halb des fast kreisförmigen POfoS de Caldas Plateaus, mit einem Durchmesser von
35 km, das sich über eine Fläche von 800 km2 erstreckt. Seine Höhe liegt meist zwischen
1300 und 1600 m. Das Plateau ist die erodierte Art einer Caldera, in der zuerst vor
80 Millionen Jahren eine Intrusion eifolgte.
Geomorphologisch betrachtet, enthalten beide Gelände Wasserscheidengebiete, die
im Zentrum des Plateaus an kleine Bäche angrenzen. Das Klima des Gebietes hat eine
merkliche Regenperiode von November bis April, während für den Rest des Jahres
Trockenzeit herrscht. Die Bäche sind in den höheren Regionen saisonal mit einer
Tendenz zum Austrocknen während der Trockenzeit, da sie nur durch abnehmende
GrundwasserzuJlüsse gespeist werden. Während der Regenperiode treten Jlutartige
Hochwasser auf, die durch sehr starke Regenfälle gespeist werden und zu Ueberschwem
mungen führen. Während der Regenperiode wird auch die Grundwasserreserve wieder
aufgespeichert. Natürliche Hänge sind steil und die ursprüngliche, dünne Bewaldung
beschränkt sich heute auf die Talebenen; nutzbare Hänge haben minderwertigen Gras
bewuchs und werden als Weiden genutzt. Das Verhalten des Plateaus ist konstant, und
seine Oberfläche erodiert seit 50 Millionen Jahren im Mittel um 12 m pro 1 Million
Jahre.
Die Geologie der Mine besteht vornehmlich aus vulkanischen bis subvulkanischen
Phonoliten, die hydrothermal verändert wurden. Das Gestein ist stark gespalten. Sauer
stoff, der im Verlauf der tiefen Verwitterung nach unten in die Grundwasseströme dringt,
hat eine deutliche Redoxzone verursacht, die als Farbänderung von grün/grau bis
braun/gelb erkennbar ist. Morro do Ferro hat eine stärker verwitterte Version (Interit/
Ton) derselben Geologie, wird aber von Magnetit-Lagen durchdrungen. Während das
umliegende Gebiet um Morro do Ferro unberührt blieb, wurde das Gebiet um die Mine
empfindlich gestört durch den Abbau, der den Grundwasserspiegel durchdrungen hat.
Die vorhandene Mine weist verändertes Fliessverhalten des Grundwassers und gestörte
Bewegungen oxidierender und reduzierender Wässer auf
Résumé
La mine d'Osamu Utsumi et le site de Morro do Ferro sont situés sur le plateau de
Poços de Caldas, qui est de forme approximativement circulaire, d'un diamètre de 30 km
et d'une superficie d'environ 800 km2. Son altitude se situe entre 1300 et 1600 m. Le
plateau constitue la forme érodée d'une caldera dont l'intrusion a eu lieu il y a env.
80 millions d'années.
Géomorphologiquement parlant les deux sites occupent les bassins versants adjacents à
des ruisseaux du centre du plateau. Le climat de la région présente une nette alternance
de saison humide de novembre à avril de saison sèche le reste de l'année. Le débit d'eau
de ces ruisseaux est éphémère dans leur partie supérieure parce que leur alimentation
dépend d'un écoulement de base lui-même décroissant. Durant la saison humide ces
ruisseaux présentent de brusques crues en raison de très fortes précipitations qui les font
déborder. Les eaux souterraines sont en outre réalimentées durant la saison humide. Les
pentes naturelles sont abruptes et la végétation originelle consistait en une légère
couverture forestière qui aujourd'hui n'occupe plus que le fond des vallées. Les pentes
utilisables ne présentent qu'une couverture herbeuse de mauvaise qualité utilisée comme
pâturage pour le bétail. Le plateau forme un élément stable dont la surface a été soumise
à une érosion de l'ordre de 12 m par million d'années au cours des 50 millions dernières
années.
La géologie de la mine est essentiellement constituée de phonolites volcaniques à
subvolcaniques altérées hydrothermalement. La fracturation des roches est importante.
La diffusion de l'oxygène vers le bas dans les eaux souterraines lors de l'altération
profonde a produit une zone rédox très claire qui se manifeste par un changement de
coloration passant d'un vert/gris à un brunljaune. Morro do Ferro présente une version
d'avantage altérée (latérite/argile) de la même géologie pénétrée par des dykes de
brèches de magnetite. Alors que la région entourant Morro do Ferro est restée intacte,
celle située aux alentours de la mine a été sérieusement perturbée par les activités
minières qui ont pénétré dans la nappe phréatique. La mine a modifié la circulation des
eaux souterraines et a perturbé le mouvement des eaux oxydantes et réductrices.
iii
Preface
The~Po~os de Caldas Project was designed to study processes occurring in a natural
environment which contains many features of relevance for the safety assessment of
radioactive waste disposal. The study area, in the State of Minas Gerais, Brazil, is a
region of high natural radioactivity associated with volcanic rocks, geothermal springs
and uranium ore deposits. It contains two sites of particular interest on which the
project work was focussed: the Osamu Utsumi uranium mine and the Morro do Ferro
thorium/rare-earth ore body. The first site is notable in particular for the prominent
redox fronts contained in the rock, while Morro do Ferro was already well-known as
one of the most naturally radioactive locations on the surface of the Earth, owing to
the high thorium ore grade and the shallow, localised nature of the deposit.
The features displayed by these two sites presented the opportunity to study a
number of issues of concern in repository performance assessment. The four
objectives set after the first-year feasibility study were:
1. Testing of equilibrium thermodynamic codes and their associated databases used to
evaluate rock/water interactions and solubility/speciation of elements.
2. Determining interactions of natural groundwater colloids with radio nuclides and
mineral surfaces, with emphasis on their role in radionuclide transport processes.
3. Producing a model of the evolution and movement of redox fronts, with the
additional aim of understanding long-term, large-scale movements of trace
elements and rare-earths over the front (including, if possible, natural Pu and Tc).
4. Modelling migration of rare-earths (REE) and U -Th series radio nuclides during
hydrothermal activity similar to that anticipated in the very near-field of some
spent-fuel repositories.
The project ran for three and a half years from June 1986 until December 1989
under the joint sponsorship of SKB (Sweden), NAGRA (Switzerland), the
Department of the Environment (UK) and the Department of Energy (USA), with
considerable support from a number of organisations in Brazil, notably Nuclebras
(now Uranio do Brasil). The first-year feasibility study was followed by two and a half
years of data collection and interpretation, focussed on the four objectives above.
v
This report is one of a series of 15, summarising the technical aspects of the work and
presenting the background data. A complete list of reports is given below. Those in
series A present data and interpretations of the sites, while those in series B present
the results of modelling the data with performance assessment objectives in mind. The
main findings of the project are presented in a separate summary (no. 15).
This report outlines the geomorphology of the study area, including the origin of the
caldera and its possible evolution over geological time. Rates of erosion of the land
surface have been estimated from several lines of evidence. Present-day conditions of
climate, soils, vegetation and drainage are also discussed.
Desk studies and limited field investigations have revealed groundwater flow
patterns for two sites within the field area. Data from the investigations have been
used to construct mathematical models of groundwater flow to provide estimates of
flow velocities and directions. Flow patterns at one of the sites, the Osamu Utsumi
mine, have been significantly changed by excavating large volumes of rock below the
natural water-table. The other site, Morro do Ferro, remains in a natural state.
Po~os de Caldas Project Report Series
Series A: Data, Descriptive, Interpretation
Report Topic No.
1. The regional geology, mineralogy and geochemistry of the Po~os de Caldas alkaline caldera complex, Minas Gerais, Brazil.
2. Mineralogy, petrology and geochemistry of the Po~os de Caldas analogue study sites, Minas Gerais, Brazil. I: Osamu Utsumi uranium mine.
3. Mineralogy, petrology and geochemistry of the Po~os de Caldas analogue study sites, Minas Gerais, Brazil. II: Morro do Ferro.
4. Isotopic geochemical characterization of selected nepheline syenites and phonolites from the Po~os de Caldas alkaline complex, Minas Gerais, Brazil.
5. Geomorphological and hydrogeological features of the Po~os de Caldas caldera and the Osamu Utsumi mine and Morro do Ferro analogue study sites, Brazil.
6. Chemical and isotopic composition of groundwaters and their seasonal variability at the Osamu Utsumi and Morro do Ferro analogue study sites, Po~os de Caldas, Brazil.
vi
Authors (Lead in Capitals)
SCHORSCHER, Shea.
WABER, Schorscher, Peters.
WABER.
SHEA.
HOLMES, Pitty, Noy.
NORDSTROM, Smellie, Wolf.
Report Topic Authors No. (Lead in
Capitals)
7. Natural radionuclide and stable element studies MacKENZIE, of rock samples from the Osamu Utsumi mine and Scott, Linsalata, Morro do Ferro analogue study sites, Po~s de Miekeley, Caldas, Brazil. Osmond, Curtis.
8. Natural series radionuclide and rare-earth element geo- MIEKELEY, chemistry of waters from the Osamu Utsumi mine and Coutinho de Morro do Ferro analogue study sites, Poc;os de Caldas, Jesus, Porto Brazil. da Silveira,
Linsalata, Morse, Osmond.
9. Chemical and physical characterisation of suspended MIEKELEY, parti~les and colloids in waters from the Osamu Utsumi Coutinho de mine and Morro do Ferro analogue study sites, Poc;os Jesus, Porto da de Caldas, Brazil. Silveira,
Degueldre.
10. Microbiological analysis at the Osamu Utsumi mine and WEST, Vialta, Morro do Ferro analogue study sites, Poc;os de Caldas, McKinley. Brazil.
Series B: Predictive Modelling and Performance Assessment
II. Testing of geochemical models in the Poc;os de Caldas BRUNO, Cross, analogue study. Eikenberg,
McKinley, Read, Sandino, Sellin.
12. Testing models of redox front migration and geo- Ed: McKINLEY, chemistry at the Osamu Utsumi mine and Morro do Cross, Ferro analogue study sites, Poc;os de Caldas, Brazil. Haworth,
Lichtner, MacKenzie, Moreno, Neretnieks, Nordstrom, Read, Romero, Scott, Sharland, Tweed.
13. Near-field high-temperature transport: Evidence from CATHLES, the genesis of the Osamu Utsumi uranium mine, Shea. Poc;os de Caldas alkaline complex, Brazil.
14. Geochemical modelling of water-rock interactions at NORDSTROM, the Osamu Utsumi mine and Morro do Ferro analogue Puigdomenech, study sites, Poc;os de Caldas, Brazil. McNutt.
vii
Report Topic No.
Summary Report
15.
viii
The Po~os de Caldas Project: Summary and implications for radioactive waste management.
Authors (Lead in Capitals)
CHAPMAN, McKinley, Shea, Smellie.
Contents
page Abstract Preface v
1. In trod uction 1
2. Geomorphological description of the Po~s de Caldas plateau 2
2.1. Description and geological origin of the caldera 2 2.1.1. The initial form of the caldera 2 2.1.2. Faulting 5 2.1.3. The caldera rim 5 2.2. Geological evolution of the caldera 7 2.2.1. Recent tectonics and regional erosion patterns 9 2.3. Geomorphological evolution of the caldera 10 2.3.1. Deep weathering 10 2.3.2. Rates of tropical weathering 11 2.3.3. Stream development 12 2.4. Climatic change in the region 12 2.4.1. Tertiary climates 13 2.4.2. Quaternary 13 2.5. Present-day natural environment of the region 14 2.5.1. Climate 14 2.5.2. Vegetation 15 2.5.3. Soils 16 2.6. Land use 17 2.6.1. Soil erosion 18 2.6.2. Biochemical changes 18 2.7. Erosion rates and changes in hydrogeological regime 19 2.7.1. Denudation rates, isovolumetric weathering and tropical
double-front weathering 19 2.7.2. Drainage directions and tectonics 20 2.8. Summary of geomorphological evidence 21
ix

page
3. Hydrogeology of the two study sites 24 3.1. The Osamu Utsumi mine 24 3.1.1. Desk study and previous work 24 3.1.2. Field work data collection 27 3.1.3. Mathematical modelling 34 3.2. The Morro do Ferro area 43 3.2.1. Desk study and previous work 43 3.2.2. Field work data collection 43 3.2.3. Mathematical modelling 49
4. Conclusions 51
5. Acknowledgements 51
6. Bibliography and references 52
x
1. Introduction This report describes the geomorphological and hydrogeological investigations
carried out at the Osamu Utsumi open-cast uranium mine and the nearby, unexploited
thorium and rare-earth deposit of Morro do Ferro. The geomorphological study has
concentrated on establishing a rate of erosion of the land surface over the last few million
years. It has utilised information on climate, soils, landforms and drainage to provide
estimates of the likely rates of erosion and, hence, movement of the oxidation/reduction
fronts that are an important feature of the rock mass in terms of their influence on the
behaviour and distribution of trace elements. Hydrogeological data on groundwater flow
paths and flow rates, past and present, have been collected by desk studies and some
limited field investigations. The groundwater flow pattern establishes the environment
in which the geochemical transport processes occur.
The detailed geology of both sites is described elsewhere (see Schorscher and Shea;
Waber et al. and Waber, this report series; Reps. 1, 2 and 3; Webber, 1959; Loureiro and
Santos, 1988). The Osamu Utsumi mine is composed mainly of volcanic to subvolcanic
phonolites that have been extensively hydrothermally altered. Fracturing of the rock is
pervasive. Downward diffusion of oxygen in groundwaters during weathering has
produced a distinct redox zone seen as a colour change from green/grey to brownlyellow.
The small hill of Morro do Ferro may represent a deeply weathered (laterite/clay)
carbonatite intrusion penetrated by magnetite breccia dykes. Geomorphologically, both
sites occupy watershed areas adjacent to small streams in the centre of the Po~os de
Caldas plateau which is roughly circular in outline, some 35 km in diameter and 800 km2
in area. Its altitude lies between 1300 and 1600 m. The climate of the area has a marked
wet season from November to April, being dry the rest of the year. The total rainfall
averages 1700 mmlyear, varying from 805 to 2700 mmlyear for the period from 1941 to
the present-day. The streams are ephemeral in their upper reaches, tending to dry up in
the dry season as they are fed by a declining base flow. In the wet season they exhibit
flash floods fed by high-intensity rainfall causing overland flow. The wet season also
provides recharge to the groundwater. Natural slopes are steep and the original
vegetation was a thin forest cover which is now restricted to the valley bottoms; the usable
slopes have poor quality grass cover used for cattle grazing. Whilst the area surrounding
Morro do Ferro remains relatively unchanged, that around the mine has been
significantly disturbed by mining activity, which has penetrated the water-table. The
existing quarry has modified groundwater flow patterns and disturbed the movement of
oxidising and reducing waters.
1
This report begins by describing the geomorphology of the P~s de Caldas plateau
and then provides a detailed examination of the two study sites at the Osamu Utsumi
mine and Morro do Ferro. A desk study is presented for each site, with a discussion of
previous relevant work. Methods employed for collecting data in the field are
documented together with the information. This has been used as a basis for a
mathematical model to provide estimates of the rates and direction of groundwater
movement.
2. Geomorphological description of the Po~os de Caldas plateau
2.1. Description and geological origin of the caldera
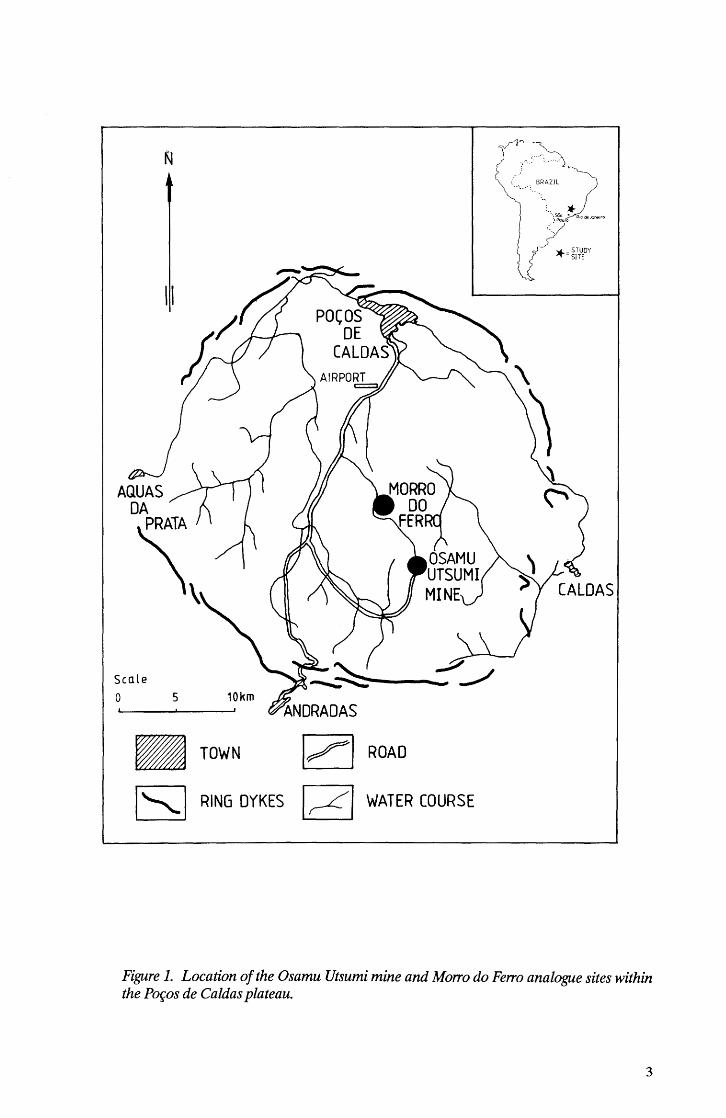
The Po~os de Caldas plateau consists of a volcanic caldera that is roughly circular in
outline, about 35 km in diameter along its NW-SE axis, 30 km along its NE-SW axis and
some 800 km2 in area (Fig. 1). Its general altitude lies between 1300 and 1600 m. Morro
do Ferro, located almost in the centre of the plateau, is about 1 km in diameter and rises
to an altitude of 1541 m.
2.1.1. The initial form of the caldera
A fundamental factor in the long-term landform evolution of the caldera is the nature
of the initial surface, prior to subaerial weathering. The general impression that the
plateau is a "deeply eroded" caldera (Amter, 1989) is misleading and a brief summary of
information about calderas is thus an important preliminary consideration.
The term itself is coined from caldeira, the Portuguese word for kettle or cauldron.
Calderas are large volcanic depressions with an approximately circular planform and
diameters many times greater than those of the included vents (Williams, 1941). Within
the main structure of the Po~os de Caldas caldera, some 14 circular structures occur,
representing minor intrusions (Loureiro and Santos, 1988). In general, few craters
exceed 1.5 km in diameter. Although the ejection of materials is perhaps the most
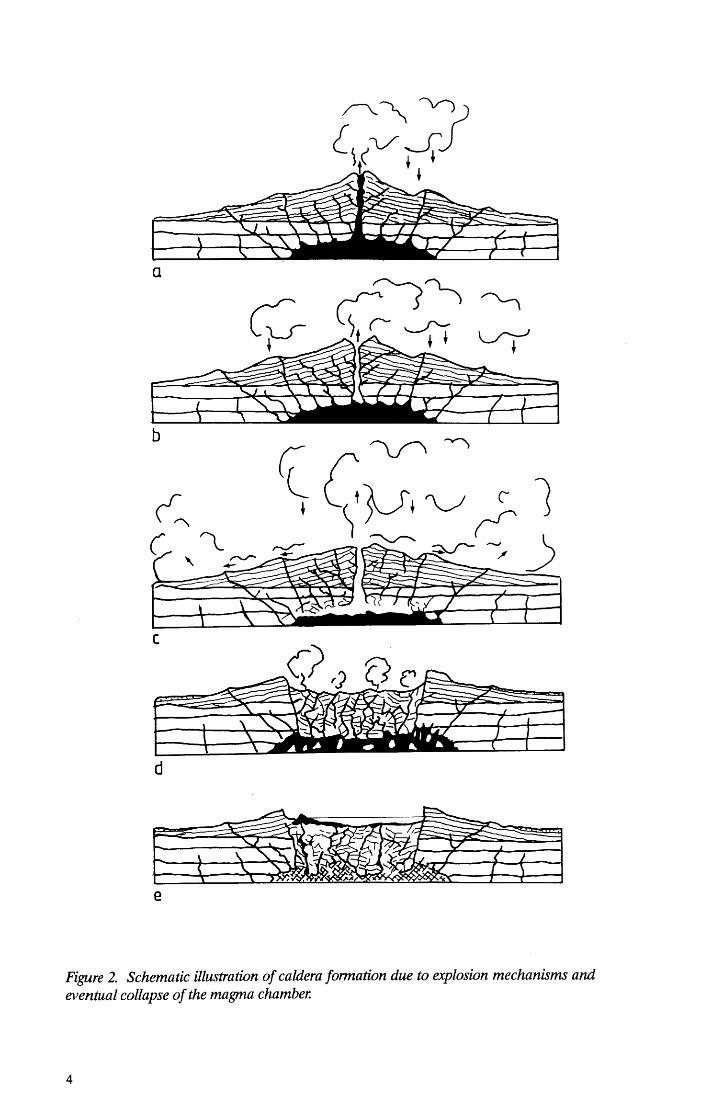
distinctive feature of craters, calderas result primarily from subsidence or collapse.
The essentially circular planform and the saucer-shaped cross-section of the Po~os de
Caldas plateau is the configuration typical of a collapsed caldera, such as Crater Lake,
Oregon (Fig. 2), which is probably the clearest example of a Krakatoa-type caldera
(Williams, 1942). Explosion mechanisms play an important role in the origin of such
2
AQUAS DA
\, Scale
o 5 10km
II TOWN
1 '""'-I RING DYKES
1/1 ROAD
1/1 WATER COURSE
~2 _-"r-- -.. -' .. -:' __ . __ --'--.~:AZll
'-- *' ":560· Q,edeY.:Oetro } Poulo
"'-- _ STUDY ..,.- - SITE
Figure 1. Location of the Osamu Utsumi mine and Morro do Ferro analogue sites within the POf5os de Caldas plateau.
3
a
c
d
Figure 2. Schematic illustration of caldera formation due to explosion mechanisms and eventual collapse of the magma chamber.
4
"Krakatoan calderas". However, the volume of fragmental ejecta derived from
Krakatoan calderas is far less than the volumes of the depressions. This apparent
discrepancy can be accounted for by the collapse of the magma chamber.
Th~ essential feature of calderas, for present purposes, whether due largely to
paroxysmal explosion or to subsidence, is that they assume a comparatively low relief at
a very early stage in their geological evolution. For example, Mt. Katmai in Alaska lost
240 m from its top as recently as 1912 and a 5 km-diameter caldera was produced (OIlier,
1981).
From the broad geological context, it is important to stress that the initial form at
Po~os de Caldas, on which subaerial weathering began, was by no means a cone with a
basal diameter of approx. 30 km. Given that craters are rarely more than 1.5 km in
diameter, the highest points of the initial form at Po~os de Caldas may have been little
more than 500 m above the present plateau surface.
2.1.2. Faulting
Fault patterns are often an important control on the planform of drainage patterns.
The majority of the Brazilian alkaline massifs, intruded into metamorphic rocks, are
controlled structurally by the large regional fault systems which were reactivated at
various times in the past. These bodies may be genetically related to deep-seated E-W
trending faults of probable Archean age, which have been masked by the NE-SW trends
of the Brazilian Cycle (500 -1000 Ma ago) (Loureiro and Santos, 1988).
Within the Po~os de Caldas complex, there are three principal fault systems. The first,
which strikes N 600 W, is the major regional trend since it extends beyond the complex.
These faults were reactivated during uplift. The secondary trend strikes N 400E and is
genetically related to the formation of the collapsed caldera. Thirdly, there are radial
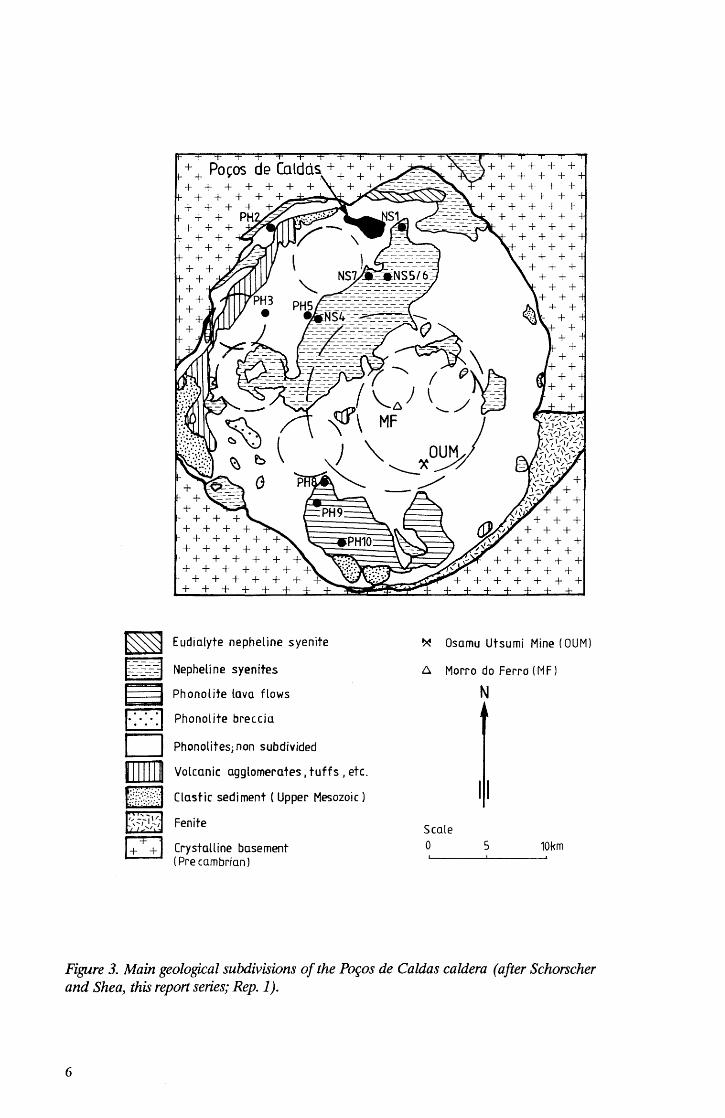
and sub-circular faults, related to various intrusives (Fig. 3).
2.1.3. The caldera rim
The intrusion caused metasomatism around the periphery of the complex,
accentuated in the vicinity of the eastern and south-eastern contacts, where fenitization
was most prevalent (Loureiro and Santos, 1988). Ring dykes, following the periphery of
the complex, were intruded along ring faults (Fig. 3). These probably formed after the
initial stage of subsidence.
5
~ Eudialyte nepheline syenite ~ Dsamu Utsumi Mine (DUM)
U Nepheline syenites t:::. Morro do Ferro (M F) ---
S Phonolite lava flows N ... D Phonolite breccia
D Phonolitesj non subdivided
mrrn Volcanic agglomerates. tuffs. etc.
m Clastic sediment ( Upper Mesozoic) II EL,'J ' .... ',/-1 Fenite Scale
~ Crystalline basement 0 5 10km (Pre cambrian)
Figure 3. Main geological subdivisions of the Po~os de Caldas caldera (after Schorscher and Shea, this report series; Rep. 1).
6
It is important to stress that the upturned rim of the Po\os de Caldas caldera is related
to the metamorphic induration of the surrounding country rock, rather than being a
worn-down perimeter of volcanic material. According to a literature review and study of
aerial photos, Christofoletti (1973) emphasises that the rim is due partly to down-faulting
of fault-bound blocks which parallel the outline of the caldera and lie just within its
perimeter.
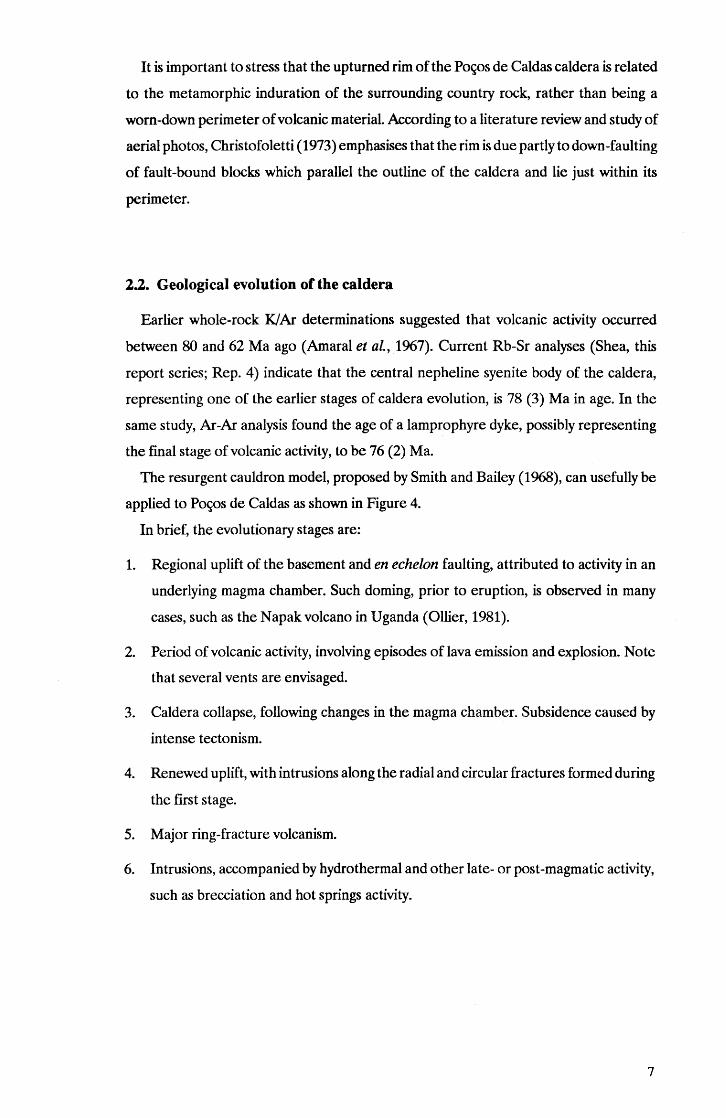
2.2. Geological evolution of the caldera
Earlier whole-rock KlAr determinations suggested that volcanic activity occurred
between 80 and 62 Ma ago (Amaral et al., 1967). Current Rb-Sr analyses (Shea, this
report series; Rep. 4) indicate that the central nepheline syenite body of the caldera,
representing one of the earlier stages of caldera evolution, is 78 (3) Ma in age. In the
same study, Ar-Ar analysis found the age of a lamprophyre dyke, possibly representing
the final stage of volcanic activity, to be 76 (2) Ma.
The resurgent cauldron model, proposed by Smith and Bailey (1968), can usefully be
applied to Po~s de Caldas as shown in Figure 4.
In brief, the evolutionary stages are:
1. Regional uplift of the basement and en echelon faulting, attributed to activity in an
underlying magma chamber. Such doming, prior to eruption, is observed in many
cases, such as the Napak volcano in Uganda (OIlier, 1981).
2. Period of volcanic activity, involving episodes of lava emission and explosion. Note
that several vents are envisaged.
3. Caldera collapse, following changes in the magma chamber. Subsidence caused by
intense tectonism.
4. Renewed uplift, with intrusions along the radial and circular fractures formed during
the first stage.
5. Major ring-fracture volcanism.
6. Intrusions, accompanied by hydrothermal and other late- or post-magmatic activity,
such as brecciation and hot springs activity.
7
1
3 4
5 6
1. Basement elevation, distension, fracturing and erosion.
2 Volcanism: phonolites, volcanoc1astics.
3. Caldera subsidence.
4.] Nepheline intrusions: tinguaites, phonolites, nepheline
5. syenites, in ring dykes and minor circular structures.
6. Intrusion of lujaurites, chibinites and foyaites.
Figure 4. Evolutive model of the Pot;OS de Caldas alkaline igneous complex (after Ellert, 1959).
8
According to Loureiro and Santos (op. cit.), stage 6 " ... was characterised by intense
erosion". Thus, not only was the initial form of a much lower altitude than a cone 30 Ian
in diameter, but initial erosion was also intense. The combination of these two factors
suggests that the relief of the Po~s de Caldas caldera has resembled that of the
present-day for many millions of years. In planform, a major feature of denudation was
the development of annular drainage, a particular feature of some calderas and other
circular or concentric structures (Fig. 4).
Apart from subaerial denudation, there was also periodic faulting. In the ''iV..' ore body
at the Osamu Utsumi mine, a plug-like breccia, which constituted the interior of a
volcanic cone, channeled the primary mineralisation along the regional tectonic trend
(N 6(fW strike). Subsequent faulting, with a N 4<rE strike, resulted in the cutting and
partial dislocation of the ore body. Further, the breccias were again cut by a fault system
with a N 10-25°E strike (Loureiro and Santos, op.cit.).
2.2.1. Recent tectonics and regional erosion patterns
Recent tectonic movements could have a critical influence on changes in river pattern
and orientation. In particular, detailed information from a neighbouring Tertiary
sedimentary basin would be the surest guide to long-term environmental changes. For
example, the Taubate basin, between Rio de Janeiro and Sao Paulo, subsided in the
Neogene and contains two main successions. The lower formation is a bituminous, shaly
saprolite deposited in a swamp or lake in a forested area with a humid climate. Above
this, there is reddened, sandy clay with pebble horizons, suggesting that a semi-arid phase
ensued. Tricart and da Silva (1959) equate the lower deposit with Miocene times (5 - 23
Ma ago) and the upper deposit tentatively with the later Neogene (2 - 23 Ma ago)
"Barreirian Series" of the coastal zone.
Also, soil conditions in tracts beyond the caldera might suggest typical conditions
within it. For instance, Tricart (1958) reports that soils around Andradas, only 12 Ian
south-west of the Osamu Utsumi mine, are not typical clayey latosols. Instead, they are
sandy and resemble those of the woody savanna (agreste) around Pernambuco. This
could, however, be a local factor, relating to the sandstone bedrock which outcrops near
to Andradas. There is also a detailed study of soils immediately to the north of Po~os de
Caldas City, including alluvium on the valley floor of the Antas River, downstream from
the highly significant local base level at the Bride's Veil Falls (Setzer, 1956).
9
Finally, useful inferences can be made as to weathering and tectonic conditions on
land from sediments on the Atlantic Ocean floor (Damuth and Fairbridge, 1970). For
example, in the Santos Basin offshore from Rio de Janeiro, sedimentation was relatively
continuous and rapid during the Neogene (2 - 23 Ma ago), with potential hydrocarbon
source rocks being sealed by mudrocks (Gibbons et af., 1983). The inferences are that
weathering was continuous and effective on land throughout this period, and dominantly
and increasingly biochemical to account for the mudrock succession.
2.3. Geomorphological evolution of the caldera
Very commonly, the broad outline of an assemblage oflandforms is closely linked with
contrasts in lithology. The Po~s de Caldas complex is characterised by a wide variety of
rock types, with a pronounced mineralogical and textural diversity ranging from very
coarse-grained to very fine-grained. In the central parts of the complex, many rocks have
been highly altered by intense potassic metasomatism (Ellert, 1959; Ulbricht 1983;
Waber et af., this report series; Rep. 2). In many locations all the rocks are characterised
by deep weathering.
2.3.1. Deep weathering
The weathered zone includes a thick argillaceous laterite from 10 -100 m depending
on rock-type and hydrothermal alteration (Waber et af., op.cit.). Drill-cores suggest that
the extensive rock alteration, due in part to weathering, was facilitated by hydrothermal
activity (Amaral et af., 1985; Schorscher and Shea; Waber et af.; Waber, this report series;
Reps. 1, 2 and 3). Outcrops are, therefore, rare. Below the laterite, a saprolitic horizon,
highly variable in thickness (1 - 40 m), is developed. In contrast to the laterite, the
original texture of the rock is still preserved, although the primary minerals have been
completely replaced with very little volume change.
According to Ollier (1981), deep weathering profiles, where supergene enrichment
of mineral deposits has occurred, are often ancient and evidently fairly stable. Ollier et
af. (1988) describe the 100 m profile of deep weathering at Norseman in Western
Australia, where they attribute deep weathering to early Cenozoic or even Mesozoic
times, i.e. the approximate age of the P~os de Caldas complex.
10
A four-fold scheme of deep weathering, first outlined by Ruxton and Berry (1957) in
the Sudan and the large number of exposures in Hong Kong, has since been widely
employed in the study of tropical geomorphology. In Zone I, the soil profile of
pedol~gists, there is no remaining trace of rock features. The base of Zone I is the depth
to which plant roots and termites penetrate. Zone II comprises decomposing or rotten
rock, but with traces of rock features such as crystal bands, veins and joints clearly
evident. Although some zones of the rock have been removed by hydrolysis, others have
increased in volume, the end-result being "isovolumetric weathering". The density of
the rock in Zone II is only one-half to one-third that of unweathered bedrock. In Zone
III, weathering remains isovolumetric, but is evident only along joints and other lines of
weakness, where water circulation is good. Nuclei of unweathered rock persist between
such preferred pathways. Such nuclei may persist as core-stones, like the residual blocks
which weathered out from the regolith south of Po~os de Caldas. In Zone Iv, slight
widening of joints by weathering is detectable and groundwater circulation is enhanced.
At the base of Zone Iv, however, there is unweathered bedrock and groundwater
circulation is more limited below this level.
2.3.2. Rates of tropical weathering
An important indication of tropical weathering rates are the widespread bauxite
deposits of the Po~os de Caldas area. Bauxites form particularly on crests of interfluves
where free drainage ensures the progressive removal of silica. Depletion in silica then
allows alumina to remain isolated, instead of combining with dissolved silica to form
kaolinite. This is thought to be a very slow process and, according to Tricart (1972), such
ridges are inevitably ancient residual landforms. The bauxites on the caldera rim
therefore suggest its antiquity as a landform, including the shoulders of the rim which
incline down towards the Antas gorge at the Bride's Veil Falls. Antiquity, in terms of
bauxite formation, usually means several millions of years, at least.
However, some of the Po~os de Caldas bauxites are unique (Webber, 1959) and are
inter-related with drainage history in a striking way. Patches of high alluvium have been
described close to the northern rim. These are now 50 m above incised river courses,
which have already been bauxitized (Webber, op. cit.). This deposit may relate to a time
when a different outlet to the present Bride's Veil gorge was in operation. The
bauxitization of the high alluvium means that either these deposits " ... are unique in
being of demonstrably recent age" or that, given the time that bauxitization usually takes,
11
the Bride's Veil gorge and the associated stream downcutting in the vicinity demonstrably
occurred a "much longer time ago" (Webber, op. cit.).
2.3.3. Stream development
One very significant effect of deep weathering is the paucity of coarse debris in the
stream bed load. The suspended load is dominantly clays, with deposition of mud where
the valley floor is wide enough to form a flood plain. Possibly due to the lack of abrasives,
the base of hillslopes tends not to be undercut and a meandering pattern to the valley
planform does not develop.
The conditions influencing upstream retreat of waterfalls and rapids is very different
in the humid tropics compared with other climatic zones. Probably, therefore, one of the
most distinctively tropical features of the landforms in the Po~s de Caldas area is the
longitudinal stream profile and the significance of the Bride's Veil waterfall on the River
Antas, 3 km to the NW of Po~os de Caldas. This is the point at which the bulk of the
drainage from the Po~os de Caldas plateau passes through the caldera rim. Such rock
bars are extremely frequent on tropical rivers, especially in the forested zone. The larger
ones have a Tertiary origin going back several million years (Tricart, 1972).
The Bride's Veil Falls area is a typical tropical rock bar in that, due to a lack of abrasive
bed load, there is little incision at the lip. Due to the resistance of the rock bar, flat
reaches of stream profiles remain upstream, where deep weathering proceeds.
Significantly, too, the evolution of valley-side hills lopes will have proceeded for long
periods of time as a function of the same local base level.
Thus, according to Tricart (op. cit.) , at a certain distance from the ocean tropical
streams are still at the level which they reached during the Pliocene (i.e. at least 2 - 5
Ma ago). He quotes the Felou Rapids, near Kayes in Mali, as an example of a rock bar
uneroded during the Quaternary, with an upstream valley floor where there has been
no downcutting since the Pliocene.
2.4. Climatic change in the region
Climatic change affects geomorphological processes, partly through the effect on
vegetation cover. Clearly, the opulent vegetation of the tropical rainforest is an
exceptionally effective screen between the atmosphere and the ground surface.
12
2.4.1. Tertiary climates
From changes in sediments in south-east Brazil, Tricart (op. cit.) infers that the
Palaeocene (55 - 65 Ma) was a rather dry episode of tropical climate. This was followed
by a humid climate with associated chemical weathering for the extended period of the
Eocene (36 - 55 Ma), with drier conditions returning during the Neogene (2 - 23 Ma).
This is supported by the progradation of shelf limestones offshore from Rio de Janeiro
during the Miocene (5 - 23 Ma), as described by Gibbons et a1. (1983).
The notable development of bauxite in the P~s de Caldas area is an additional
climatic indicator. Bauxite is not a feature of humid tropics, as this type of environment
impedes leaching of silica by lowering pH. Instead, bauxite formation is a feature of
semi-evergreen or deciduous seasonal forest climates, which restrict acidification whilst,
at the same time, providing sufficient percolating water for some leaching (Tricart, 1972).
2.4.2. Quaternary
Pleistocene
A very wide range of evidence suggests that in South America, where tropical
rain-forest exists today, savannas were widespread during the last glacial period
(Markgraf and Bradbury, 1982). The mineralogy of sediments in Atlantic deep-sea cores
offshore from equatorial South America suggests that semi-arid conditions prevailed
during glacials, in contrast to humid interglacials like that of the present-day (Damuth
and Fairbridge, 1970).
An impression of the relative importance of such changes is perhaps best gained from
the unique 200,000 yr tropica1!lithological record, retained at 650 m altitude in Lynch's
Crater, north-eastern Queensland. This record spans two glacial/interglacial cycles.
Kershaw (1985) shows that rainforest was present four times within this period, but only
for a total of some 40,000 years.
Holocene
In the tropical lowlands of South America, the climates prior to 10,000 Ma were cooler
and certainly drier than at present. The 8,000 to 10,000 Ma interval was moist,
comparable to the present. The interval between 4,000 and 6,000 Ma showed a slight
return to drier and cooler conditions, after which the present moisture and temperature
13
regime seems to have become established (Markgraf and Bradbury, 1982). Again,
instructive records can be identified in other tropical areas, such as the fluctuations in
spatial extent and relative dominance of rainforest, compared with savanna, in West
Africa (Sowunmi, 1986).
Such variations appear to have affected geomorphological processes significantly.
During a seven month reconnaissance, Tricart (1958) became convinced that,
throughout the central Atlantic area of Brazil, there was evidence of erratic episodes in
past climates, in which drought and downpour alternated (P~s de Caldas lies in the
southern quarter and towards the inland margin of this area). The main evidence was
horizons of coarse fluvial gravels in terraces of silty sands, attributed to heavy downpours
in semi-arid environments with reduced vegetation cover. Successions are evident in
cuttings in the Sao Paulo motorway north of Rio de Janeiro, with truncated latosol at
the base, overlain by gravel, and then followed by 1-5 m of clayey silt. Along the interior
basin of the Rio Paraiba, the repeated successions of gravel horizons suggest several
climatic changes.
In summary, the assumption that deep weathering must be linked with warm wet
climates is not necessarily true. '~l that is required for deep weathering is deep
groundwater and plenty of time" (Ollier, 1988).
2.5. Present-day natural environment of the region
2.5.1. Climate
Temperature: The average annual temperature is 19'-'C, reflecting the altitude which
averages about 1300 masl. The maximum is around 36°C with a minimum of around 1°C
(Amaral et al., 1985), the latter figure indicating the possibility of frost during colder
climatic phases in the past, which may explain why duricrusts do not appear to be a
significant feature of the Po~s de Caldas plateau.
Precipitation: Alternating wet/dry seasons are typical. More than 80 percent of
precipitation falls between October and March (Lei, 1984). The 3D-year average annual
precipitation is 1700 mm, although the year-to-year variability is illustrated by a total of
2710 mm in 1983 (Bonotto, 1989). Amaral et al. (1985) give the total maximum annual
rainfall as 1500 mm (1700 mm in Azevedo et al., 1988), with more than 120 days of rain
each year.
14
Regional orographic controls: The climatic range in north-east Brazil is probably as
extensive as that of any long-term climatic change at a particular point. Within a distance
of 200 km, the environment changes from coastal humid tropical rainforest to semi-arid
inland areas with xerophytic shrubs and cacti (llicart, 1958). Although less pronounced,
the comparatively enduring (compared with possible temporal oscillations) climatic
control by the height, alignment and sheer extent of the mountain ranges to the south
and south-east of Po~s de Caldas must be stressed.
Firstly, along the coast there is the Serra do Mar. This extends some 1400 km, from
Santa Catherina to beyond Victoria in the State of Espirito Santo. This barrier is
continued northwards by lower hills for a further 1100 km. Secondly, the parallel range
inland, the Serra da Mantaqueira, is the highest in Brazil, reaching an altitude of some
3,200 m at the Itatiaiaossu peak. The first range induces and, to some extent, restricts
heavy orographic rainfall to the coastal zone. The second range, with the temperature
decline with altitude added, introduces a clear break into the regional climate.
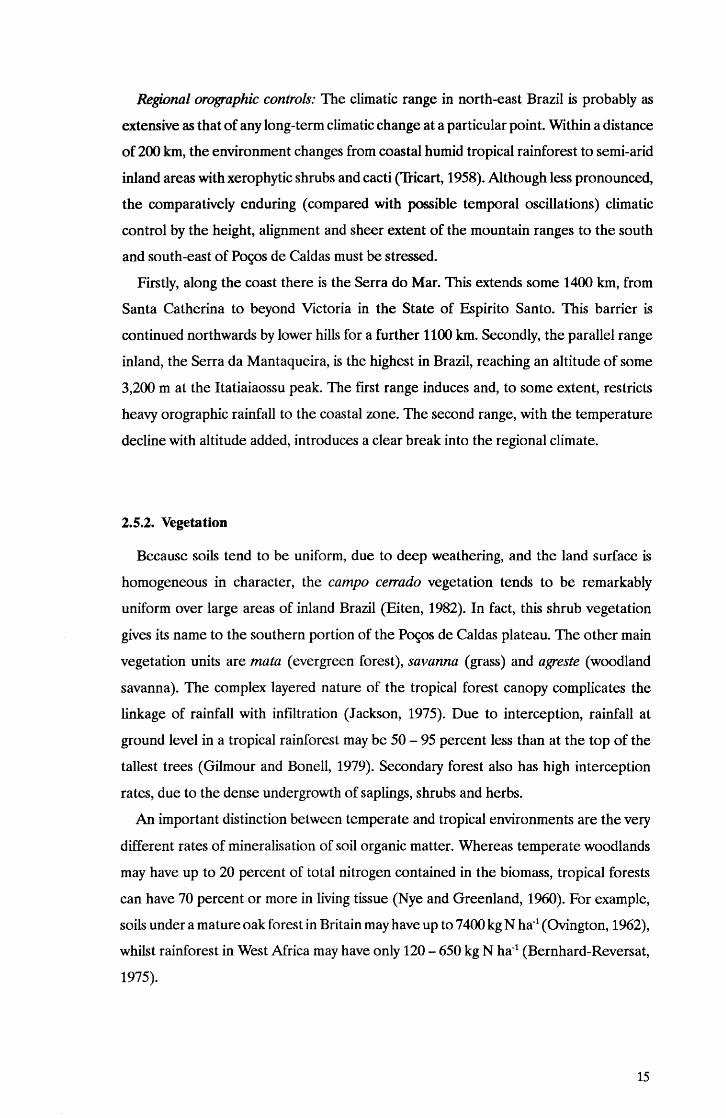
2.5.2. Vegetation
Because soils tend to be uniform, due to deep weathering, and the land surface is
homogeneous in character, the campo cerrado vegetation tends to be remarkably
uniform over large areas of inland Brazil (Eiten, 1982). In fact, this shrub vegetation
gives its name to the southern portion of the P~s de Caldas plateau. The other main
vegetation units are mata (evergreen forest), savanna (grass) and agreste (woodland
savanna). The complex layered nature of the tropical forest canopy complicates the
linkage of rainfall with infiltration (1 ackson, 1975). Due to interception, rainfall at
ground level in a tropical rainforest may be 50 - 95 percent less than at the top of the
tallest trees (Gilmour and Bonell, 1979). Secondary forest also has high interception
rates, due to the dense undergrowth of saplings, shrubs and herbs.
An important distinction between temperate and tropical environments are the very
different rates of mineralisation of soil organic matter. Whereas temperate woodlands
may have up to 20 percent of total nitrogen contained in the biomass, tropical forests
can have 70 percent or more in living tissue (Nye and Greenland, 1960). For example,
soils under a mature oak forest in Britain may have up to 7400 kg N ha-1 (Ovington, 1962),
whilst rainforest in West Africa may have only 120 - 650 kg N ha-1 (Bernhard-Reversat,
1975).
15
Deforestation: The effect of removal of forest cover is to increase runoff significantly.
A large volume of literature has been published on this subject since Hoyt and Troxell
(1932) first demonstrated increases of 15 - 29 percent in catchments in southern
California.
In the tropics, the amplitude of daily temperature oscillations also increases greatly.
Tricart (1972) quotes research at Kiendi, near Bondoulou on the Ivory Coast, showing
that the daily amplitude increased to 22.6°C on exposed duricrust and to 13.2°C beneath
grass, compared with only 3.8°C under forest. The increased desiccation of the soil would
have significant effects on soil biochemistry, notably increased oxidation of humic
compounds and carbonates. Dehydration transforms hydroxides into the more stable
sesquioxide form and iron is precipitated, as is silica, in combination with ferruginous
minerals (Tricart, op. cit.).
Some kilometres to the north of the Po~os de Caldas plateau, due to increased
insolation following drastic devastation of vegetation, mean summer temperatures have
increased by more than 1°C and winter means by O.4°C, in the first half of the 20th century
(Setzer, 1956). Reduced infiltration by scanty winter rains, soil erosion and loss of organic
matter are also confirmed.
Grass: Grass cover has some distinctive effects on soil and slope hydrology and on
biogeochemical cycling. Firstly, its roots reach deeper than those of rainforest and soil
desiccation is more probable, which would favour the formation of concretions. Savanna
grasses are also silica accumulators. 1 - 8 percent of their ashes consist of silica, part of
which is re-cycled, but some is exported by wind and rillwash. Fire immobilises such
biogenic silica. In terms of mechanical processes, grass has a comb-like effect on rillwash,
both in terms of subdividing waterflow and in limiting sediment transport downslope.
2.5.3. Soils
Soils are predominantly silts and clays. Due to the intense weathering of a tropical
climate, surface soils tend to be a fine-textured mixture of kaolinite, gibbsite and
limonite. Kaolinite is particularly abundant at Morro do Ferro and several veins of almost
pure material have been observed (Bonotto, 1989; Waber, this report series; Rep. 3).
In general, tropical regoliths act like a sponge, damping down variations in stream flow
and maintaining spring flow for several weeks after the last rains.
16
Soil fauna: The constant excavation of the soil by mammals and lizards is noteworthy
in south-east Brazil (McLean, 1919). Insect activity is also a distinctively tropical feature,
with amorphous termite mounds scattered throughout the deciduous seasonal forest
areas. In fact, termites are very active on the hillslopes around the Osamu Utsumi mine
and Morro do Ferro, and deserted termitaria are often colonised by much larger
bioturbators, with tunnels approx. 15 cm in diameter. The mounds themselves are some
2 - 4 m3 in bulk.
Stone lines: A distinctive tropical feature is the tendency for resistant residual particles
and clasts to accumulate at a particular shallow depth in the soil profile, roughly parallel
with the slope surface (Fairbridge and Finkl, 1984). They may reflect some climatic
oscillation, in which rillwash has become more marked. Bigarella and Andrade (1965)
suggest that the stone lines in Brazil appears to be late Wisconsin, at ca. 18,000 Ma, when
aridity affected most tropical areas. Alternatively, they may be a product of bioturbation,
with termites and other burrowers able only to transfer particles below a certain size to
the ground surface.
Such stone lines are clearly seen on hillslopes to the north of the Osamu Utsumi mine.
With minor gullying evident on artificially bared lower slopes, perhaps the colluvium
(hillslope sediment) above the stone line here merely reflects the initiation of overland
flow, following deforestation. It is difficult to give a satisfactory explanation for the stone
lines clearly developed in the vicinity of the mine. However, it must be emphasised that
these features are recognised as valuable palaeoenvironmental indicators (Ruhe, 1959).
2.6. Land use
Inland from the strip of rainforest along the Serro do Mar, forest has largely been
removed from the plateau. Often, the ground, cleared of the forest by burning, has been
allowed to degenerate into rough grassland. This is covered by a rank growth of Tristegis
glutinosa, a coarse grass (capimela) which may reach 1 m in height (McLean, 1919).
Burning remains an annual practice on the grassy areas of Morro do Ferro (Bonotto,
1989).
The older parts of the coffee belt in south-east Brazil provide a classic example of a
land-use cycle. In his study of its progression from primary forest through crop and
pasture to secondary forest, Haggett (1961) uses a graphic description from an early
17
visitor. In June 1867, on crossing the Rio Paraiba near Entre Rios, [Captain] Richard
Burton observed that:
"Hereabouts the once luxuriant valley is cleaned out for coffee, and must be
treated with cotton and the plough. The sluice-like rains following the annual
fires have swept away the carboniferous humus from the cleared round hill tops
into the swampy bottoms, ... every stream is a sewer of liquid manure, ... and the
superflCial soil is that of a brickfield. "
The large amount of dissolved organic matter is a feature of tropical streams. It is
evident in the name of the Rio Una ("Blackwater"), a right-bank tributary of the Paraiba,
draining a 300-km section of the Serra do Mar.
However, in the Po~os area, it must be stressed that the annual field burning is a major
reason for little humic debris being observed (Bonotto, 1989).
2.6.1. Soil erosion
In his study area near Taubate, in the Tertiary- and Quaternary-filled rift which is now
the communication corridor between Sao Paulo and Rio de Janeiro, Haggett (1961)
estimated that a topsoil loss of 20 cm ± 5 cm had occurred since around 1850. This is
equivalent to a ground surface lowering in the 1.5 - 2.5 mm yr-l range. This figure is
matched by a calculation for the alluvium-filled bottomlands (varzeas). These strips,
never more than 1 km wide, have increased their area by 2 - 3 times since sedimentation
accelerated. Notably, the volume of this sedimentary infill is equivalent to a 1.6 mm yr-l
loss from the steeply sloping hills (morros). The similarity of the two calculations suggests
that a large proportion of the sediment, derived from the hillslopes, remains within
sub-catchments, rather than being evacuated.
2.6.2. Biochemical changes
With the effects of present-day grass-burning, coupled with those of prior
deforestation, it should be anticipated that anthropogenic practices will have modified
biochemical processes significantly. Several aspects of environmental deterioration, due
to anthropogenic causes, must be taken into account in studies of present-day
biogeochemical cycling. For example, in the broad valley of the Rio Parahibuna, swamps
18
resulting from accelerated sedimentation have killed off forest (McLean, 1919). Some
of these aspects are the subject of research projects; for example experimental work on
the role of fire has been undertaken at the cerrado/mato (savanna/forest) boundary at
Emas2, near Pirassununga, Sao Paulo (Cole, 1987).
In many locations, the inland decline in rainfall is not sufficient to preclude forest
growth. This is evident in the vigorous regeneration of strips of woodland along the
tributary gully courses in the P~s de Caldas area. In fact, rainfall here is well above the
annual total of 1000 -1100 mm which is sufficient to support forest.
2.7. Erosion rates and changes in hydrogeological regime
Visual impressions of the Osamu Utsumi mine area are of undulating valleys and
interfluves resembling in scale and appearance the relief of the early Pleistocene deposits
in Midwest USA As this land surface ranges in age from less than 600 ka yr to over 2.2
Ma (Hallberg, 1980), yet is excavated in weakly resistant glacial drifts, the analogy
suggests that the present-day Po~os de Caldas relief is perhaps at least 2 Ma old. Taking
into consideration the initial form of the caldera (discussed above), a round-figure
maximum reduction of some 500 m relief in 50 Ma seems a reasonable assumption from
a tectonic point of view, bearing in mind that this was not a uniform rate of erosion.
Based on mineralogical and geochemical criteria, the erosion of the rock over the last
90 Ma has been estimated to be 3-9 km in depth (Ulbrich, per. comm. 1988).
2.7.1. Denudation rates, isovolumetric weathering and tropical double-front
weathering
Elsewhere in Brazil, in areas with climatic conditions resembling those of the Po~os
de Caldas plateau, erosion rates are comparatively low. Leprun (1987) calculates erosion
rates for north-east Brazil, where mean annual precipitation is in the 1200 - 2200 mm
range. The Rio Sao Francisco removes 30 t km-2 a-I, significantly less than the Mississippi
(91 t km-2 a-i) or the Irrawaddy (700 t km-2 a-i). Leprun (op. cit.) concludes that a figure
between 0 and 20 t km-2 a-1 is representative for South American conditions. Usefully,
these volumetric units are directly convertible to equivalent ground surface lowering i.e.
the Rio Sao Francisco, with headstreams to the NE of the Po~s de Caldas plateau, is
removing materials equivalent to lowering its catchment, on average, by 30 m in a million
years.
19
A general figure representing denudation in the P~s de Caldas plateau, equivalent
to a surface lowering of 50 m per million years, has been suggested as a useful starting
point. However, isovolumetric weathering means that half or even two-thirds of such
materials are removed without loss in volume and, thus, Webber (1959) observed that
changes in Po~s de Caldas bauxite" ... which have taken place after bauxitization was
completed are of minor volumetric importance ... ". Further, there is the double front
weathering, a hypothesis that assumes additional significant chemical loss from the base
of the superficial groundwater body, where it is in contact with fresh bedrock. For a
workable figure for input to models, therefore, the estimated general denudation figure
could be divided into two, to account for the double front weathering and at least by two
for isovolumetric weathering. This could mean that the actual ground surface lowering
would be 7.5 m per million years, according to the Rio Sao Francisco data, and 12.5 m
per million years for the generalised figure. This figure is comparable to the longest-term
estimate, based on a much reduced elevation, for the initial surface of the caldera.
2.7.2. Drainage directions and tectonics
There is a most striking feature in the pattern of the main drainage from the Po~os de
Caldas plateau, namely the River Antas. One of its headstreams dewaters the Osamu
Utsumi mine from the west before entering the main headstream, the Corrego do
Cercado, which flows SSE for its first 5 km. This is directly opposite to its final direction
of flow. Further, this main drainage pattern is aligned with lower cols in the southern rim
of the caldera, to the NE of Andradas. The lowest point is approx. 1320 masl, which is
no higher than the present altitude of the Corrego do Cercado valley floor at the mine.
Further, the low colon the rim is in an area of horst and graben (Christofoletti, 1973).
It seems reasonable to speculate that this drainage could, at one time, have exited the
plateau directly towards the south, before tectonic disturbances in the fault blocks on
the southern rim modified the drainage pattern. Such disturbances could include the
known continued subsidence of the Parana basin, immediately to the west, with
downtilting in that direction increasingly favouring a circuitous drainage northward
towards the city of Po~os de Caldas.
If this speculative reconstruction is tenable, there should be some subsurface
weathering phenomena caused by the upper surface of groundwater being at approx.
1320 masl for a protracted period.
20
The present pattern of the River Antas, first turning WNW near the Fazendo do
Cercado, has not involved any significant increase in gradient downstream from the
SSE-directed headstream. In fact, it falls at only 0.5 m km-1 for the 10 km WNW, i.e. from
1280 .to 1275 masl.
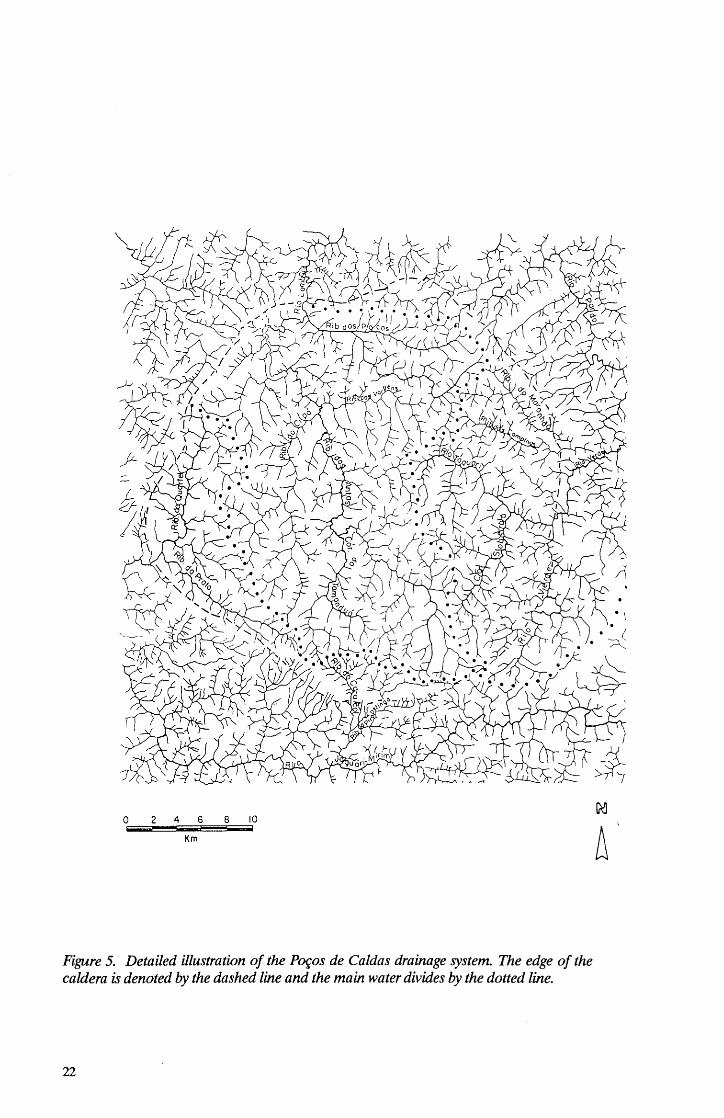
There is a striking contrast in the headstreams of the two main drainage basins which
occupy the "Campo do Cercado", the southern portion of the P<¥ls de Caldas plateau
(Fig. 5). The Antas drains about 70 percent of this region and the Verde about 20 percent.
However, the contrast in steepness of gradients between the headwaters of these two
systems is such that the Verde basin is not utilised for irrigation " ... since the terrain
topography is not suitable for agricultural activities" (Azevedo et aI., 1988). Thus,
compared with the 10 km downvalley gradient of 0.5 m km-1 for the west-flowing Antas
(between 1280 and 1275 masl), the River Soberbo descends for 4 km at 5 m km-I
(between 1220 and 1200 masl).1t then steepens at its first main confluence. This contrast
is evident in the sketch map of relief, centred on the mine (Fig. 6).
To the east, the caldera rim is unusually low in the neighbourhood of Caldas.
Christofoletti (1973) suggests that this is due to down-faulting of a fault-bounded
triangular tract of caldera floor and rim in this direction. Whatever the explanation for
the lower ground to the east, it seems possible that directions of groundwater drainage
progressively changed. It is therefore postulated that earlier near-stagnant conditions,
established over a protracted period of time (i.e. many millions of years) in relation to a
local base level (perhaps at approx. 1320 masl), were gradually replaced by increasingly
efficient dewatering towards the east.
2.S. Summary of geomorphological evidence
Evidence collected during the geomorphological study indicates that flow patterns on
the Po<~os de Caldas plateau have changed little over the last 5 million years. Erosion of
the interfluves has kept pace with that of the valley floors, causing a general lowering of
the land surface at an average rate of 12 m per million years (ranging from values of 1
to 50 m per million years estimated from several lines of evidence). The weathering
mechanisms are thought to have been similar over the last 10 million years. The redox
front penetration would be expected to keep pace with land surface erosion.
21
o 2 4 6 8 10
Km
Figure 5. Detailed illustration of the Pcx;os de Caldas drainage system. The edge of the caldera is denoted by the dashed line and the main water divides by the dotted line.
22
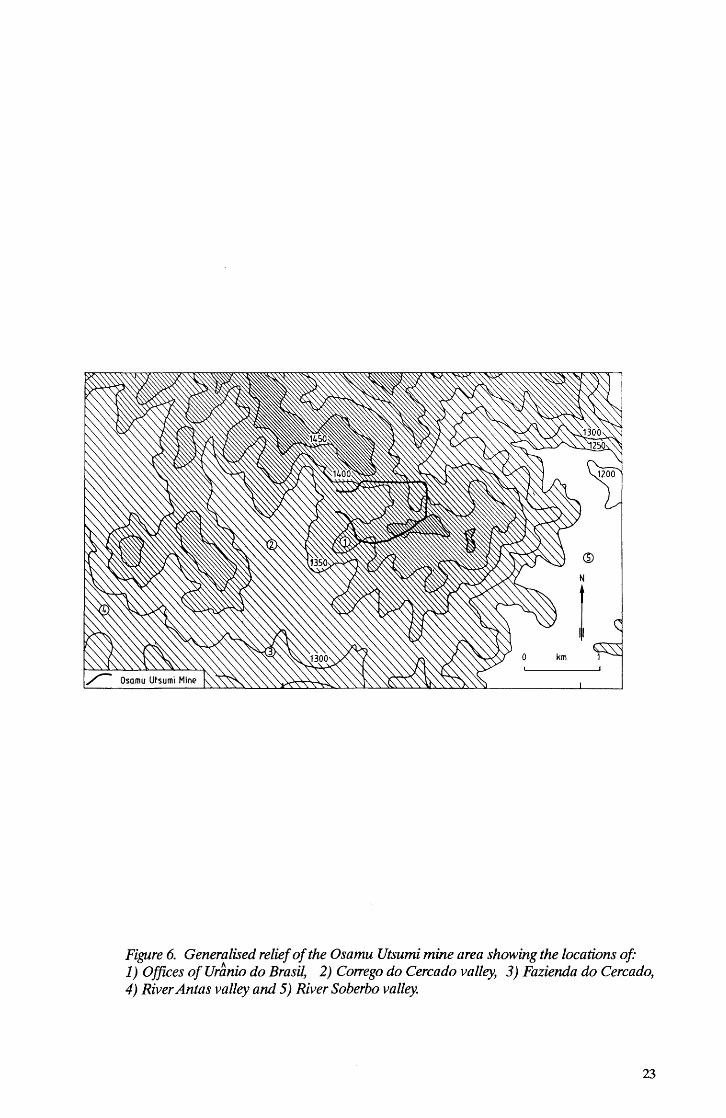
Figure 6. Generalised relief of the Osamu Utsumi mine area showing the locations of" 1) Offices of Ur~nio do Brasil, 2) Corrego do Cercado valley, 3) Fazienda do Cercado, 4) River Antas valley and 5) River Soberbo valley.
23
3. Hydrogeology of the two study sites
3.1. The Osamu Utsumi mine
3.1.1. Desk study and previous work
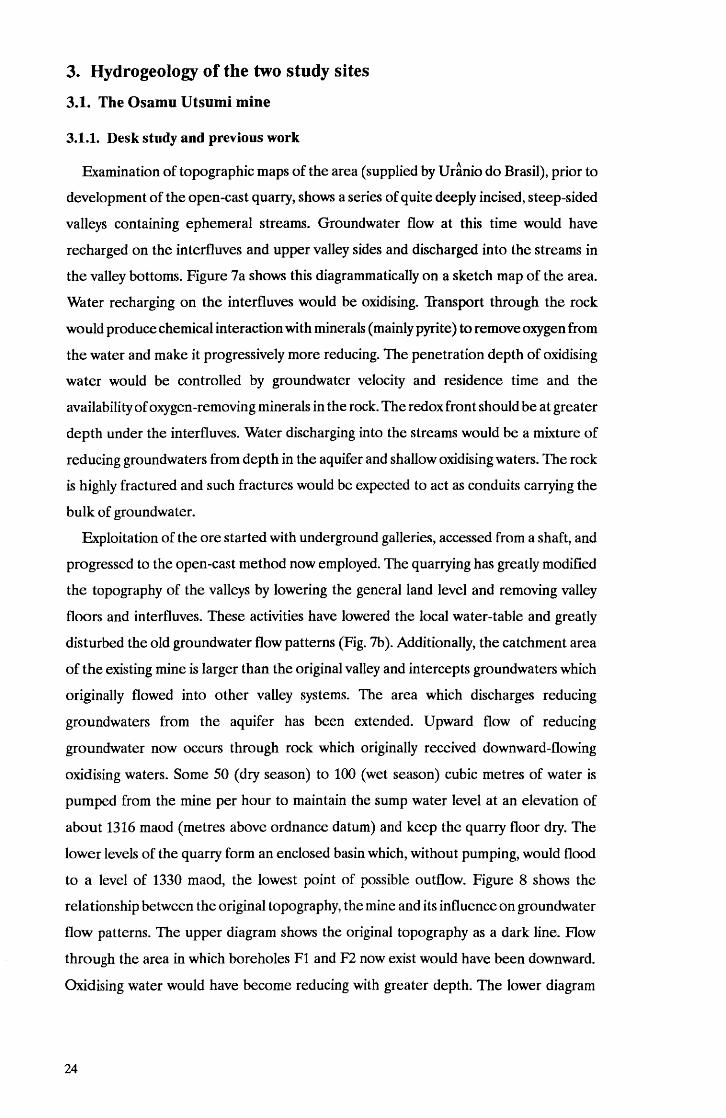
Examination of topographic maps of the area (supplied by Uranio do Brasil), prior to
development of the open-cast quarry, shows a series of quite deeply incised, steep-sided
valleys containing ephemeral streams. Groundwater flow at this time would have
recharged on the interfluves and upper valley sides and discharged into the streams in
the valley bottoms. Figure 7a shows this diagrammatically on a sketch map of the area.
Water recharging on the interfluves would be oxidising. Transport through the rock
would produce chemical interaction with minerals (mainly pyrite) to remove oxygen from
the water and make it progressively more reducing. The penetration depth of oxidising
water would be controlled by groundwater velocity and residence time and the
availability of oxygen -removing minerals in the rock. The redox front should be at greater
depth under the interfluves. Water discharging into the streams would be a mixture of
reducing groundwaters from depth in the aquifer and shallow oxidising waters. The rock
is highly fractured and such fractures would be expected to act as conduits carrying the
bulk of groundwater.
Exploitation of the ore started with underground galleries, accessed from a shaft, and
progressed to the open-cast method now employed. The quarrying has greatly modified
the topography of the valleys by lowering the general land level and removing valley
floors and interfluves. These activities have lowered the local water-table and greatly
disturbed the old groundwater flow patterns (Fig. 7b). Additionally, the catchment area
of the existing mine is larger than the original valley and intercepts groundwaters which
originally flowed into other valley systems. The area which discharges reducing
groundwaters from the aquifer has been extended. Upward flow of reducing
groundwater now occurs through rock which originally received downward-flowing
oxidising waters. Some 50 (dry season) to 100 (wet season) cubic metres of water is
pumped from the mine per hour to maintain the sump water level at an elevation of
about 1316 maod (metres above ordnance datum) and keep the quarry floor dry. The
lower levels of the quarry form an enclosed basin which, without pumping, would flood
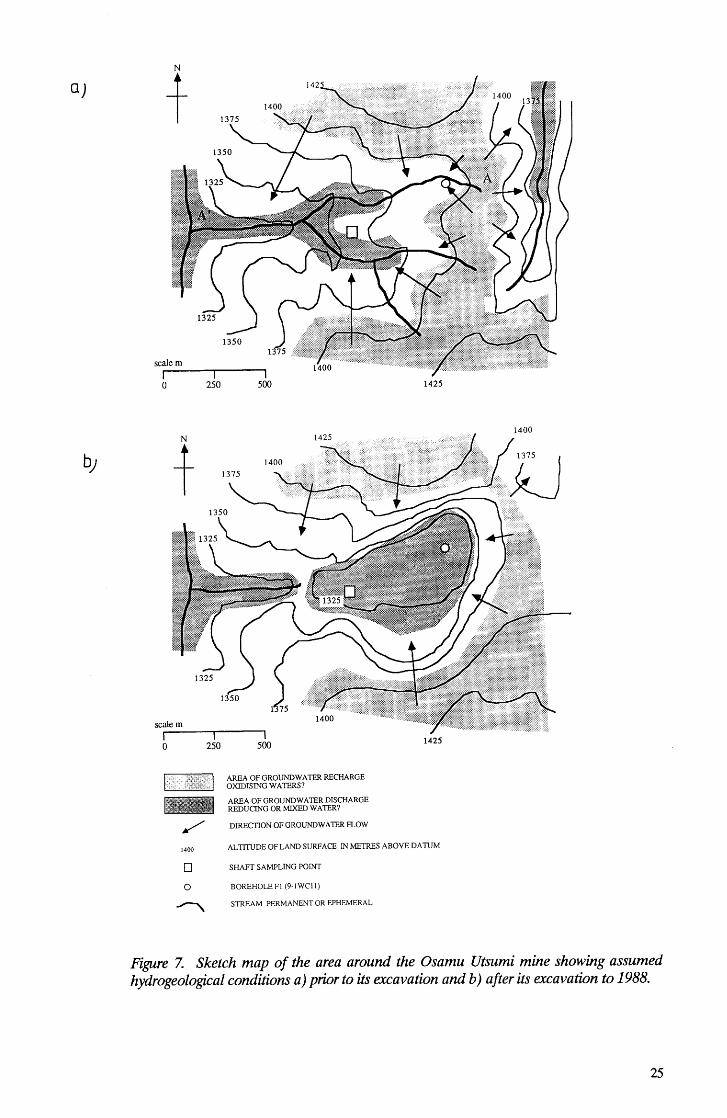
to a level of 1330 maod, the lowest point of possible outflow. Figure 8 shows the
relationship between the original topography, the mine and its influence on groundwater
flow patterns. The upper diagram shows the original topography as a dark line. Flow
through the area in which boreholes Fl and F2 now exist would have been downward.
Oxidising water would have become reducing with greater depth. The lower diagram
24
OJ
b)
N
t
scale m I o
N
t
scalem
I o
1400
o o
I 250
I 250
I 500
I 500
AREA OF GROUNDW A 1ER RECHARGE OXIDISING WATERS?
AREA OF GROUNDWATER DISCHARGE REDUCING OR MIXED WATER?
DIRECTION OF GROUNDWATER FLOW
1425
1425
ALTIl1JDE OF LAND SURFACE IN METRES ABOVE DATUM
SHAFT SAMPLING POINT
BOREHOLE Fl (9-1WCll)
STREAM PERMANENT OR EPHEMERAL
1400
Figure Z Sketch map of the area around the Osamu Utsumi mine showing assumed hydrogeological conditions a) prior to its excavation and b) after its excavation to 1988.
25
AL1ITUDE A MAOD
FLOWS BEFORE QUARRY 1400
1350
A
1300
1250
1200
o 500 1000 1500 2000
DISTANCE FROM STREAM IN METRES
FLOWS WITH QUARRY 1400
1350
1300
1250
1200
o 500 1 ()(X) 1500 2000
Figure 8. Cross-section of the Osamu Utsumi mine area prior to and post-excavation.
26
shows the present topography and groundwater flow. The same area of rock now receives
the upward movement of reducing water. Flow close to the surface of the quarry is
affected by blasting damage which has enhanced permeabilities and generates horizontal
flows to the sump. Additionally, the flow pattern and rates will be affected by the large
number of exploration boreholes drilled into the quarry floor as part of the reserve
estimation programme. Such holes are drilled every 5 to 10 metres to a depth of 40 m
below the floor and provide rapid flow paths for groundwater from that depth to the
existing surface.
Various piezometers, sampling 5-metre-Iong sections at different levels in the mine,
had been installed prior to this study. Water levels measured in these show a steeply
dipping water-table gradient towards the mine sump. Also, those piezometers on the
edge of the mine show a slight vertically downward flow gradient, whilst those near the
centre of the mine show vertically upward flows. Hydraulic conductivities (the ability of
the rock to transport groundwater)· measured in the piezometers range from 1x10⁻¹⁰ to
5xl0-7 ms-1• Water levels responded rapidly to both seasonal rainfall and individual rainfall
events.
3.1.2. Field work data collection
Various boreholes were drilled at the mine to provide access to the rock mass for
making preliminary hydraulic measurements and the collection of water and rock
samples. A pilot hole was drilled using a down-hole hammer driven by compressed air
from the 1324 maod level in the mine. Boreholes Fl and F2 were cored at 75 mm
diameter to a depth of 124 and 100m respectively, also from the 1324 maod level. These
boreholes were tested to determine the distribution of hydraulic conductivity and
environmental head. Boreholes F3 and F4 were drilled for geological information and
had a limited testing programme; borehole F5 was not tested. A series of shallow holes
was drilled to a depth of 10 -15 m to determine the nature of the water-table adjacent
to the sump and borehole F1.
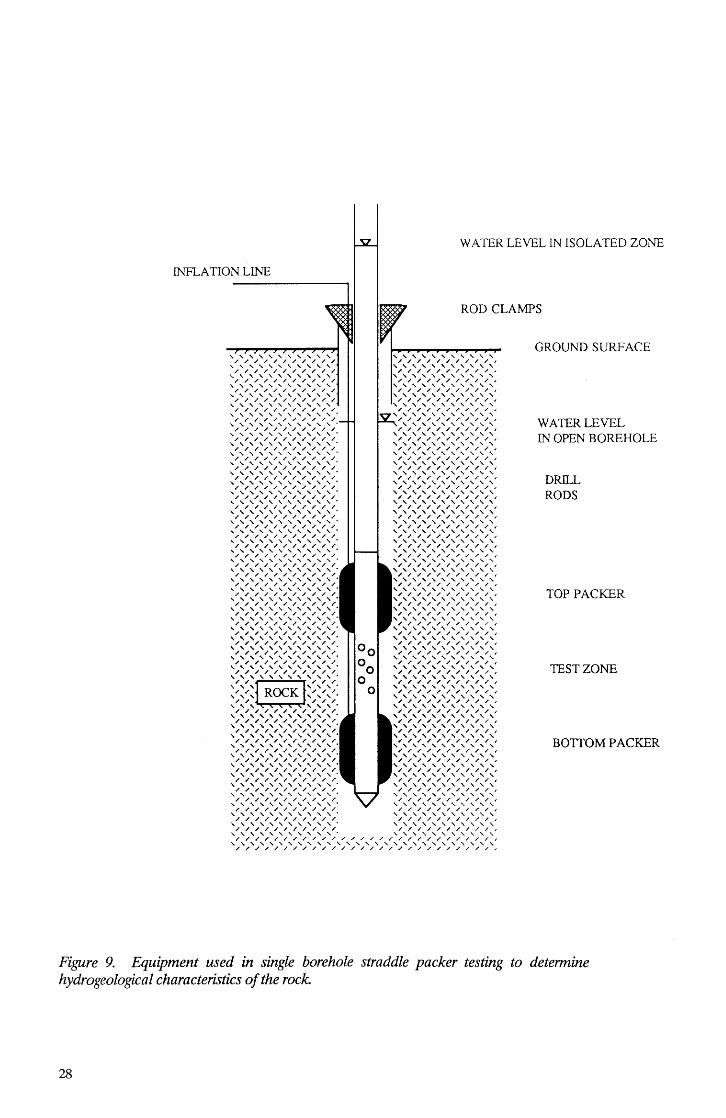
Hydraulic testing was performed using a double packer system shown
diagrammatically in Figure 9. Pneumatically inflated packers with a sealing length of
1.00 m, separated by a 6.55 m straddle, were used to isolate a section of the borehole.
Tests were made every 6.1 m down the boreholes. Drill-rods were used to connect the
packers to the surface. During the initial testing, some leakage of water from the
suspension rods was detected. Great care was then taken to seal all the rod joints using
27
WATER LEVEL IN ISOLATED ZONE
INRA TION LINE
ROD CLAMPS
, , , , , , , , , , , , , , , , , , , , , , , , , , , , , , , , , , , , , , , , , , , , , , , , , , , , , , , , , , , , , , , , , , , , , , , , , , , , , , , , , , , , , , , , , , , , , , , , , , , , , , , , , , , , , , , , , , , , , , , , , , , , , , , , , , , , , , , , , , , , , , , , , , , , , , , , , , , , , , , , , , , , , , , , , , , , , , , , , , , , , , , , , , , , , , , , , , , , , , , , , , , , , / / / / / / / / / / / / / / / / / / / / J , , , , , , , , , , , , , , , , , , , , , , , , , , , , , , , , , , , , , , , , , , , , , , , , , , , , , , , , , , , , , , , , , , , , , , , , , , , , , , , , , , , , , , , , , , , , , , , . , , , , , , , , , , , , , , , , , , , , , , , , , , , , , , , , , , , , , , , , , , , , . , , , , , , , , , , , , , , , , , , , , , , , , , , , , , , , , , , , , , , , , , , , , . , , , , , , , , , , , , , , , , , , , , , , , , , , , , , , , , , , , , , , , , , , , , . , , , , , , , , , , , , , , , , , , , , , , , , , , , , , , , , , , , , , , , , , , , , . , , , , , , , , , , , , , , , , , , , , , , , , , , , , , , , , , , , , , , , , , , , , . , , , , , , , , , , , , , , , , , , , , , , , , , , , , , , , , , , , , , , , , , , , , . , , , , , , , , , , , , , , , , , , , , , , , , , , , , , , , , , , , , , , , , , , , , . , , , , , , , , , , , , , , , , , , , , , , , , , , , , , , , , , , , , , , , , , , , , . , , , , , , , , , , , -, , , , , , , , , , , , , , , , , , , , , , , , , , , , , , , , , . , , , , , , , , , , , , , , , , , , , , , , , , , , , , , , , , , , , , , , , , , , , , . , , , , , , , , , , , , , , , , , , , , , , , , , , , , , , , , , ... , , , , , , , , , , . , , , , , , , , , , , , , , , , , , , , , , , , , , , , , , , , , ... , , , , , , , , , , . , , , , , , , , , , , / / / / / / / / / / / / / / / / / / / / / ~
, ~ , , , , , , , , , 6 , , , , , , , , , , , , , , , , , , , , , , , , , , , , , , , , , , , , , , , , , , , , . , , , , , , , , , , , , , , , , , , , , , , , , , , , , , , , , , ,""""',. """"" / / / / / / / / / / / / / / / / / / / / i , , , , , , , , , , , . , , , , , , , , , , , , , , , , , , , , , , , , , , , , , , ... , , , , , , , , , , . , , , , , , , , , , , , , , , , , , , , , , , , , , , , , , """"",. """"" / / / / / / / / / / / / / / / / / / / / / ~ , , , , , , , , , , , , , , , , , , , , , , , , , , , , , , , , , , , , , , , , , / , , , , , , , , , , , , . , , , , , , , , , , , , , , , , , , , , , , , , , , , , , , / , , , , , , , , , , , , , . , , , , , , , , , , , , , , , , , , , , , , , , , , , , , , , , ,
" " " " " " " " " " '; 00 " " " " " " " " " ',', , , , , , , , , , , , . , , , , , , , , , , , " " " " " " " " " " ,'. 00 " " " " " " " " " ,',' , , , , , , , , , , , , , , , , , , , , , ,
:~:~ ~(~~~l:~ > 0 0 :~:~:~:~ ~~ :~ ~~ ~~:~ ~; :: , , , , , , , , , , , , , , , , , , , , , , . , , , , , , , , , , , , , , , , , , , , , , , , , , , , , , , , , , , , , , , ... ... ... ... ... . ... ... ... ... ... ... , ... ... ... , , , / , / , , , , , , / , / , , , , / , , , , , ... ... , , , ... , , , . ... , , , , , , , , , , , , / / , , , , , , , / , / , / / , / , / , , , , , , ... ... , , , , . , , , , , , , , , , , , , , / / / / / / / / / , , , , , , / / / , , , , , , , , ... , , , . , , , , , , , , , , , / , , , / / , , , , , / / / / / / / / / / , , , , , , , , ... , , , . , , , , , , , , , , , , , / / / / / / , , / , , , , , / , / / / ,
... ,"""",. """"" / / / / / / / , / , / / / / / / / / , / / , , , , , , , , , , , ... . , , , , , , , , , , , , / / / / / / , , , , / / / , / / / / / / ,
... , , , , , , , , , , . , , , , , , , , , , , / , , / / / / , , , / / / / / / / , / / / , , , , , , , ... , , , ... . , , , , , , , , , , , , / / , / , / / / / / / / / , / / / , / / , , , , , , , , , , , ... . , , , , , , , , , , , / / / / / / / / / / / , / / , / / / / , , , , , , , , , , , , , , . , , , , , , , , , , , / , , / / , / / / / / / / / / / / / , / / , , , , , , , , , , , , . , , , , , , , , , , , , / / / / / / / / / / / / , / , , / , , , , , , , , , , , , , , , . , , , , , , , , , , , / / , / / / / / , , / / / / , / / / / / , / / , / , , , , , , , , , , , , , , , , , , , , , , , , , , , , , , , / / , / , / / , / / / / / / / / / / / / , / , / / / , ,
GROUND SURFACE
WATER LEVEL IN OPEN BOREHOLE
DRILL RODS
TOP PACKER
TEST ZONE
BOTTOM PACKER
Figure 9. Equipment used in single borehole straddle packer testing to determine hydrogeologica I characteristics of the rock
28
PTFE tape. In operation, the packers were lowered to the test interval and a water level
dipper was used to measure the level of fluid both inside the rods and the borehole
annulus in relation to fIxed datum height. The values should be identical. The packers
were i!lflated and the water levels periodically measure~ to see how they change. Any
difference which develops between the measurements indicates that the packers are
effectively sealing against the rock. After a period of approximately 30 minutes, each
fluid level approached its own equilibrium value. The level inside the rods is a measure
of the environmental head for the test section. With the head relatively stable, the
hydraulic conductivity was measured using either a slug test or constant head test. In a
slug test the water level in the rods is changed instantaneously using a float. The recovery
level is monitored and compared with a set of type curves (developed by Cooper et al.
(1967» to determine a value of hydraulic conductivity.
In the constant head test, water is injected or removed from the borehole to maintain
a constant head difference from the initial value. Either the change in flow rate or the
flow rate under steady-state conditions can be used to calculate the conductivity. The
method is presented in Walton (1962). Testing proceeded in a systematic manner to cover
the entire depth of the hole. The bottom of each hole was tested beneath a single packer
suspended on rods.
In several zones water was abstracted for geochemical samples using either a small
diameter electric pump or by allowing the borehole to overflow naturally. Care was taken
to remove a sufficient volume from the hole to ensure that water resident in the rock
was collected. Also, great care was taken to ensure that the fluid was collected in the
absence of oxygen.
Permanent completions, comprising a PVC 50 mm internal diameter casing string
fitted with mechanical packers, were installed in boreholes Fl, F2, F3, F4 and F5.
Sufficient pull-down was applied to the casing string to set the packers. The isolated
zones were tested by constant rate abstraction. A simpler completion, using powdered
bentonite, was attempted in the pilot borehole. This, however, was only partially
successful due to diffIculties in emplacing the powder in the narrow borehole annulus.
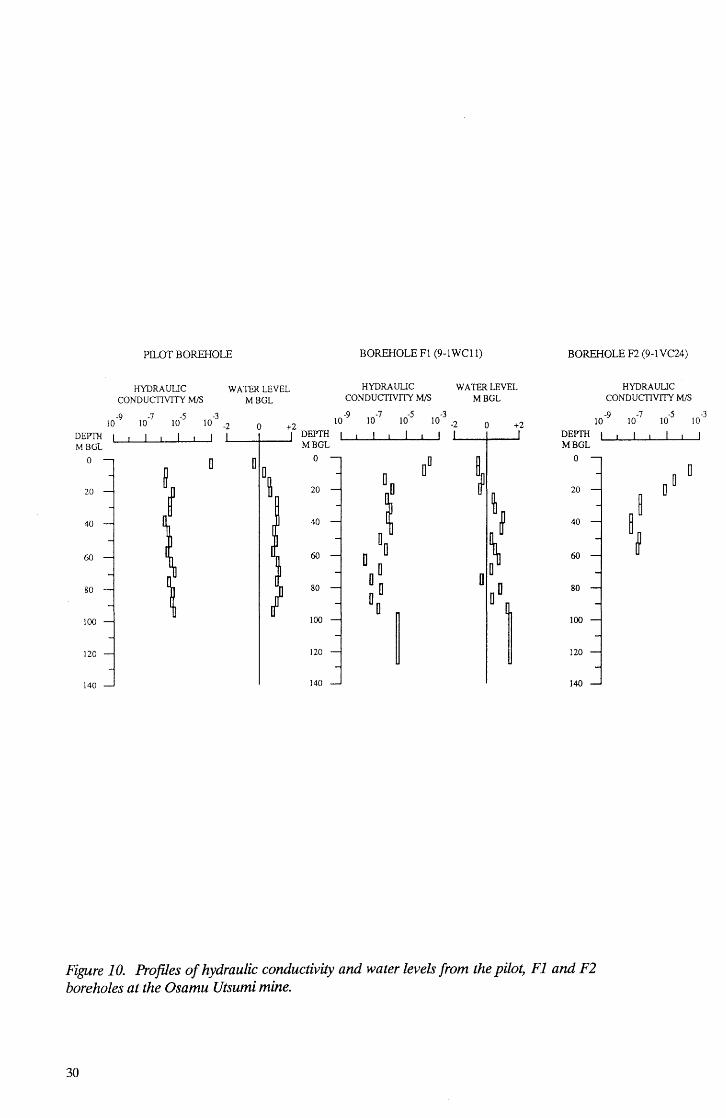
The results of hydraulic testing in the pilot, Fl and F2 boreholes are presented in
Figure 10. Water levels are shown as metres relative to ground level at the time of testing.
Water levels are generally higher at greater depth, resulting in an upward potential for
groundwater flow. The levels in borehole Fl between 50 and 90 metres below ground
level (mbgl) were measured whilst still recovering to equilibrium and would have risen
to higher values on longer recovery. Values for F3 are similar to those in Fl and are not
presented.
29
PILOT BOREHOLE BOREHOLE F1 (9-1WC11) BOREHOLE F2 (9-1 VC24)
HYDRAUUC WATER LEVEL HYDRAUUC WATER LEVEL CONDUCTIVITY MIS MBGL CONDUCTIVITY MIS MBGL
-9 -7 10 -9 -7 -5 -3 10-5 10-3
10 10 10 -2 0 +2 10 10 -2 0 +2 10
DEPTH I I I I I DEPTH I I I I I I DEPTH MBGl MBGL MBGL
0 D
n n~l 0
OD ~ 0
~~ u~ 20 20 20
~~ 40
, 40 40
~ 60 60 o 0 60
~ o 0
o 001 80 80 o 0 80
~ D
~ 100 100 100
120 120 120
140 140 140
Figure 10. Profiles of hydraulic conductivity and water levels from the pilot, Fl and F2 boreholes at the Osamu Utsumi mine.
30
I
HYDRAUUC CONDUCTIVITY MIS
-9 -7 10-5 10
I I I I
o 0 0
~ ~ ~
-3 10
I
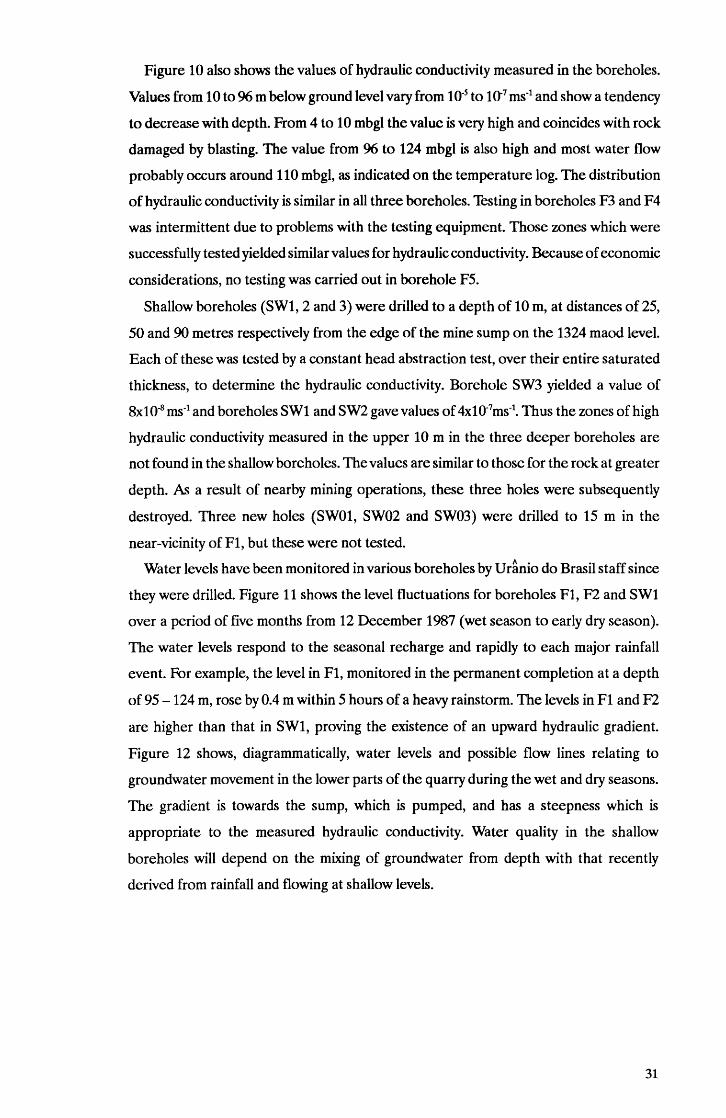
Figure 10 also shows the values of hydraulic conductivity measured in the boreholes.
Values from 10 to 96 m below ground level vary from 10-5 to 1(J7 ms-l and show a tendency
to decrease with depth. From 4 to 10 mbgl the value is very high and coincides with rock
damaged by blasting. The value from 96 to 124 mbgl is also high and most water flow
probably occurs around 110 mbgl, as indicated on the temperature log. The distribution
of hydraulic conductivity is similar in all three boreholes. Testing in boreholes F3 and F4
was intermittent due to problems with the testing equipment. Those zones which were
successfully tested yielded similar values for hydraulic conductivity. Because of economic
considerations, no testing was carried out in borehole F5.
Shallow boreholes (SW1, 2 and 3) were drilled to a depth of 10 m, at distances of 25,
50 and 90 metres respectively from the edge of the mine sump on the 1324 maod level.
Each of these was tested by a constant head abstraction test, over their entire saturated
thickness, to determine the hydraulic conductivity.· Borehole SW3 yielded a value of
8xl0-8 ms-l and boreholes SWl and SW2 gave values of4xl0-7ms-1• Thus the zones of high
hydraulic conductivity measured in the upper 10 m in the three deeper boreholes are
not found in the shallow boreholes. The values are similar to those for the rock at greater
depth. As a result of nearby mining operations, these three holes were subsequently
destroyed. Three new holes (SW01, SW02 and SW03) were drilled to 15 m in the
near-vicinity ofFl, but these were not tested.
Water levels have been monitored in various boreholes by Ur~nio do Brasil staff since
they were drilled. Figure 11 shows the level fluctuations for boreholes Fl, F2 and SWl
over a period of five months from 12 December 1987 (wet season to early dry season).
The water levels respond to the seasonal recharge and rapidly to each major rainfall
event. For example, the level in Fl, monitored in the permanent completion at a depth
of 95 - 124 m, rose by 0.4 m within 5 hours of a heavy rainstorm. The levels in Fl and F2
are higher than that in SW1, proving the existence of an upward hydraulic gradient.
Figure 12 shows, diagrammatically, water levels and possible flow lines relating to
groundwater movement in the lower parts of the quarry during the wet and dry seasons.
The gradient is towards the sump, which is pumped, and has a steepness which is
appropriate to the measured hydraulic conductivity. Water quality in the shallow
boreholes will depend on the mixing of groundwater from depth with that recently
derived from rainfall and flowing at shallow levels.
31
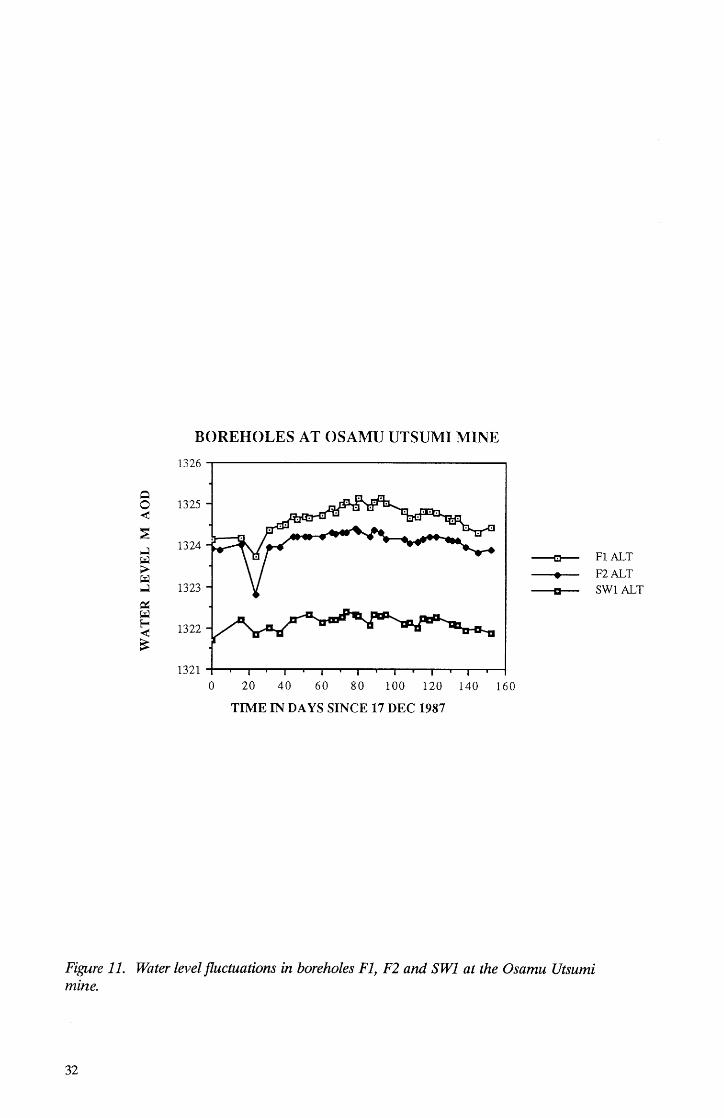
BOREHOLES AT OSAMU UTSUMI MINE
1326~------------------------------~
Q o 1325 ~
:; .J ~ ;;.. ~ .J
~ ~ ~ ~
~
1324
1323
1322
o 20 40 60 80 100 120 140 160
TIME IN DAYS SINCE 17 DEC 1987
~ F1ALT
• F2ALT
a SW1 ALT
Figure 11. Water level fluctuations in boreholes Fl, F2 and SWl at the Osamu Utsumi mine.
32
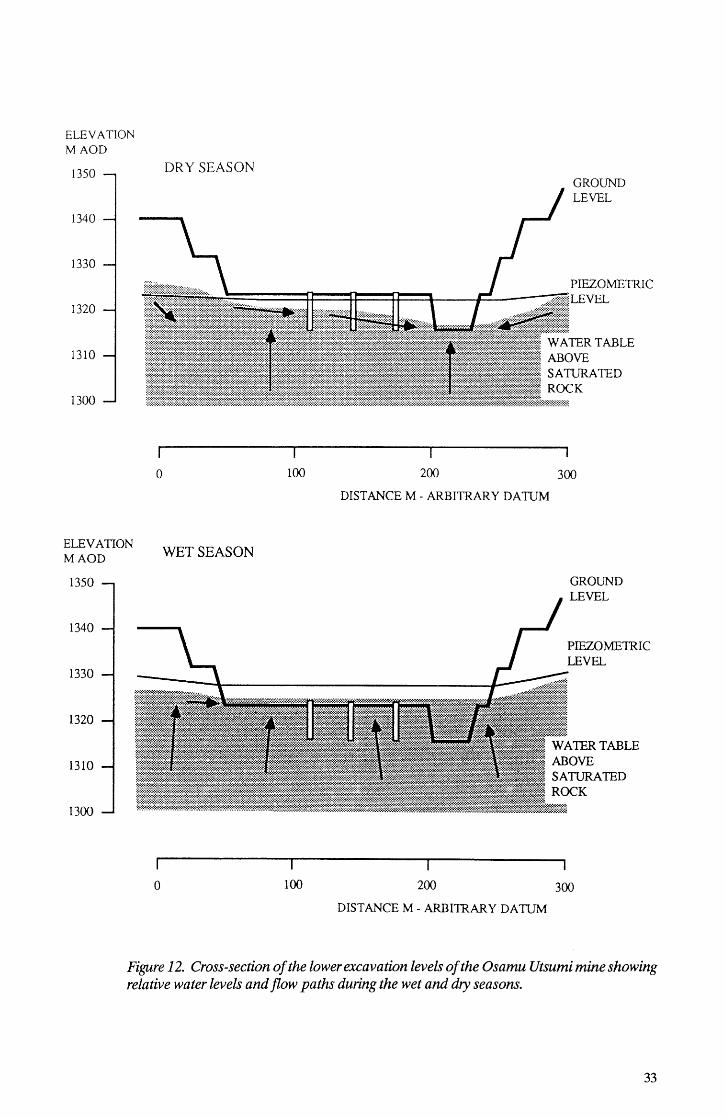
ELEVATION MAOD
1350
1340
1330
1320
1310
1300
ELEVATION MAOD
1350
1340
1330
1320
1310
1300
DRY SEASON
o
WET SEASON
o
100 200
DISTANCE M - ARBITRARY DATIJM
lOO 200
DISTANCE M - ARBITRARY DATUM
GROUND LEVEL
PIEZOMETRIC LEVEL
300
GROUND LEVEL
300
Figure 12. Cross-section of the lower excavation levels of the Osamu Utsumi mine showing relative water levels and flow paths during the wet and dry seasons.
33
The conclusions drawn from testing the boreholes are
1. Groundwater flow has a significant upward vertical component in the vicinity of the
lower levels in the mine. This agrees with results from the desk study and indicates
that the hydrogeology of the site has been greatly modified by excavating the quarry.
2. The distribution of hydraulic conductivity indicates that there are few major fracture
zones in the rock. The exception occurs at 100 m where borehole F1 intersects a
major flow pathway which could have a conductivity as high as 2x10-s ms-1• Flow
through the rock is generally in closely-spaced fractures (less than a few metres
apart), which allows the rock to be treated as a porous medium for volume
calculations.
3.1.3. Mathematical modelling
Data on water levels and hydraulic conductivity collected during the desk study and
field work have been used in the construction of a groundwater flow model to determine
general characteristics of the scale and direction of water movement. The amount of
data was small and many assumptions have had to be made in generating the model. The
existing conditions have been greatly simplified. However, some of the derived
information, notably on flow directions, travel times and water velocities, may be of use
during the interpretation of geochemical data. It should, however, be stressed that the
model should be considered as only indicating the general magnitude of flow parameters
rather than providing absolute values.
This section of the report describes the construction of the model, some of the results
and various conclusions on the groundwater flow at the mine.
Boundary conditions: The Osamu Utsumi mine lies at the head of a valley with high
ground on three sides. As a result, the groundwater flow regime can be expected to be
fully three-dimensional, and a groundwater flow model is required which can
accommodate this. The TRANSFLO package (Noy, 1982; Noy, 1985) was therefore
used. Two separate flow models were created, one for the flow before the mine was
excavated and one for present conditions.
The high ground around much of the mine has been assumed to form no-flow
boundaries. These boundaries enclose the mine on three sides but leave a length of
boundary which it is difficult to specify a priori to the east of the mine where the small
34
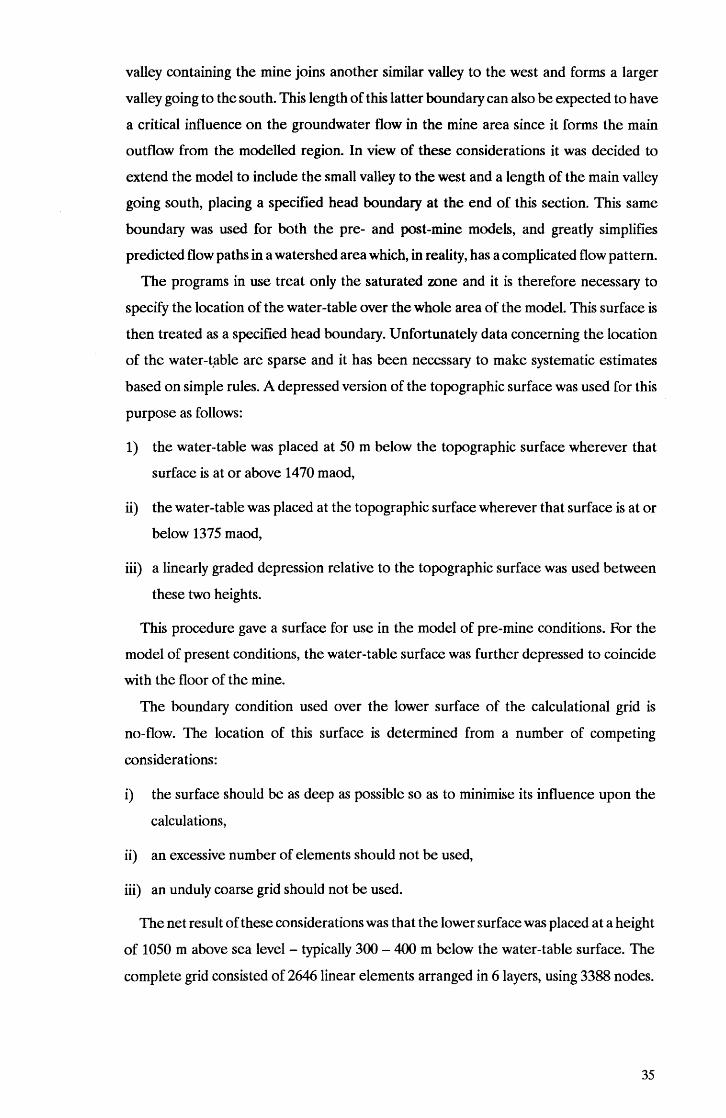
valley containing the mine joins another similar valley to the west and forms a larger
valley going to the south. This length of this latter boundary can also be expected to have
a critical influence on the groundwater flow in the mine area since it forms the main
outflow from the modelled region. In view of these considerations it was decided to
extend the model to include the small valley to the west and a length of the main valley
going south, placing a specified head boundary at the end of this section. This same
boundary was used for both the pre- and post-mine models, and greatly simplifies
predicted flow paths in a watershed area which, in reality, has a complicated flow pattern.
The programs in use treat only the saturated zone and it is therefore necessary to
specify the location of the water-table over the whole area of the model. This surface is
then treated as a specified head boundary. Unfortunately data concerning the location
of the water-t,able are sparse and it has been necessary to make systematic estimates
based on simple rules. A depressed version of the topographic surface was used for this
purpose as follows:
1) the water-table was placed at 50 m below the topographic surface wherever that
surface is at or above 1470 maod,
ii) the water-table was placed at the topographic surface wherever that surface is at or
below 1375 maod,
iii) a linearly graded depression relative to the topographic surface was used between
these two heights.
This procedure gave a surface for use in the model of pre-mine conditions. For the
model of present conditions, the water-table surface was further depressed to coincide
with the floor of the mine.
The boundary condition used over the lower surface of the calculational grid is
no-flow. The location of this surface is determined from a number of competing
considerations:
i) the surface should be as deep as possible so as to minimise its influence upon the
calculations,
ii) an excessive number of elements should not be used,
iii) an unduly coarse grid should not be used.
The net result of these considerations was that the lower surface was placed at a height
of 1050 m above sea level- typically 300 - 400 m below the water-table surface. The
complete grid consisted of 2646 linear elements arranged in 6 layers, using 3388 nodes.
35
Q}
b) A 1370
1340
1350
\360
c )
S'
1360
Mine area
1380 A
Water level contours m AOD
scale metres
100 200 Horizontal to vertical 1: 1
B
1380
1370
scale mclJ'cs
Water level contours mAOD
a 100 20U
Horizonlal to vcnicaJ 1:1
Figure 13. Pre-mine distribution of water levels generated for the Osamu Utsumi mine area (a) and vertical sections showing head distributions along the stream profile; section A -A I (b) and section B-B' (c).
36
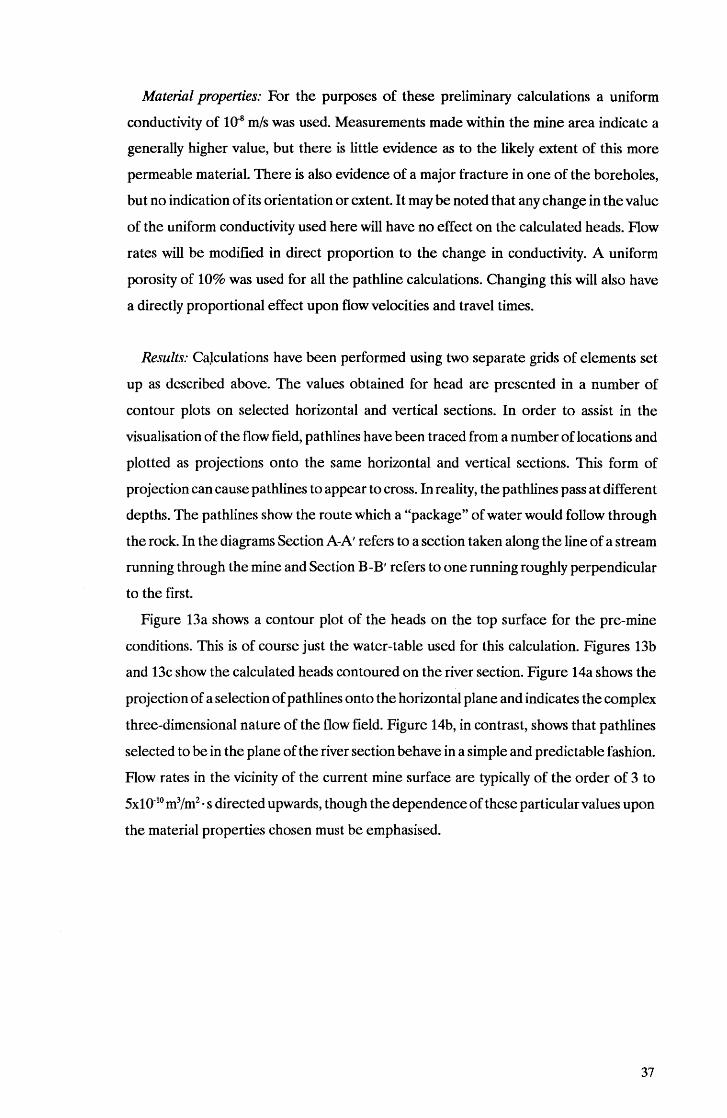
Material properties: For the purposes of these preliminary calculations a uniform
conductivity of lO-S mls was used. Measurements made within the mine area indicate a
generally higher value, but there is little evidence as to the likely extent of this more
permeable material. There is also evidence of a major fracture in one of the boreholes,
but no indication of its orientation or extent. It may be noted that any change in the value
of the uniform conductivity used here will have no effect on the calculated heads. Flow
rates will be modified in direct proportion to the change in conductivity. A uniform
porosity of 10% was used for all the pathline calculations. Changing this will also have
a directly proportional effect upon flow velocities and travel times.
Results: CaJculations have been performed using two separate grids of elements set
up as described above. The values obtained for head are presented in a number of
contour plots on selected horizontal and vertical sections. In order to assist in the
visualisation of the flow field, pathlines have been traced from a number of locations and
plotted as projections onto the same horizontal and vertical sections. This form of
projection can cause pathlines to appear to cross. In reality, the pathlines pass at different
depths. The pathlines show the route which a "package" of water would follow through
the rock. In the diagrams Section A-A' refers to a section taken along the line of a stream
running through the mine and Section B-B' refers to one running roughly perpendicular
to the first.
Figure 13a shows a contour plot of the heads on the top surface for the pre-mine
conditions. This is of course just the water-table used for this calculation. Figures 13b
and 13c show the calculated heads contoured on the river section. Figure 14a shows the
projection of a selection of pathlines onto the horizontal plane and indicates the complex
three-dimensional nature of the flow field. Figure 14b, in contrast, shows that pathlines
selected to be in the plane of the river section behave in a simple and predictable fashion.
Flow rates in the vicinity of the current mine surface are typically of the order of 3 to
5x1 0-10 m3/m2• s directed upwards, though the dependence of these particular values upon
the material properties chosen must be emphasised.
37
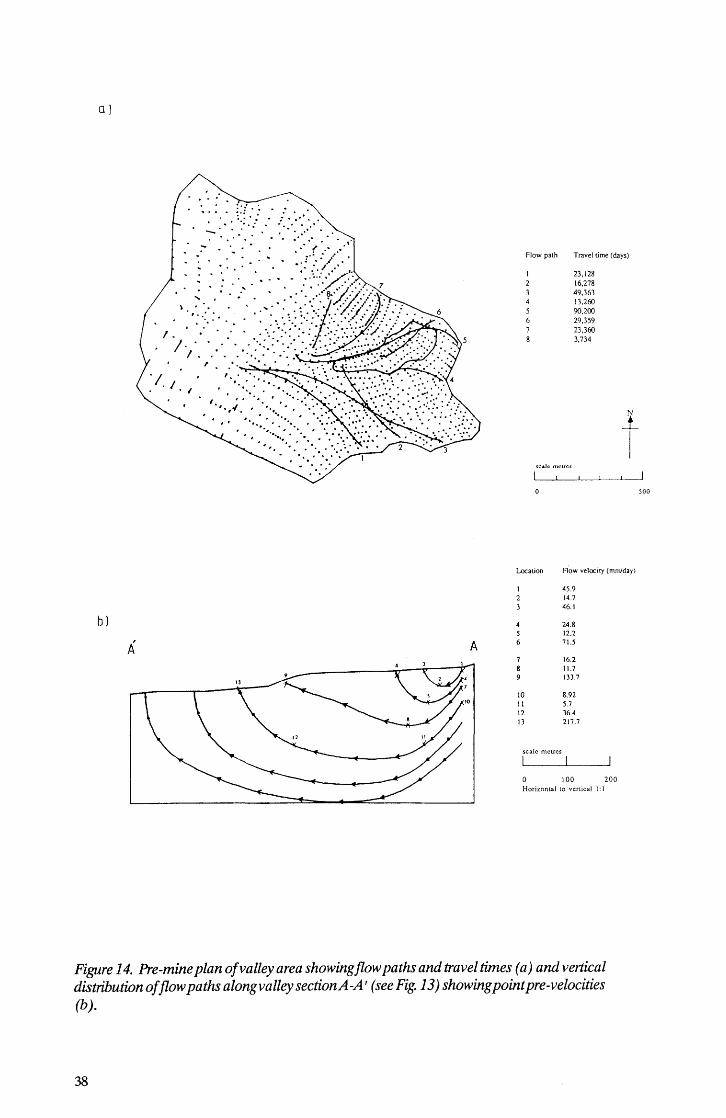
Q)
Flow path Travel time (days)
scale: meLIes
23,128 16,278 49,363 13,260 90.200 29,359 23,360 3.734
t
Location Aow velocity (mmldayl
45.9 14.7 46.1
b) 2A.8 12.2
A A 71.5
16.2 I L7 133.7
10 8.92 11 5.7 12 36.4 13 217.7
scale metres
I
100 200 Horizontal to vertical I: I
Figure 14. Pre-mine plan ofvalley area showingflow paths and travel times (a) and vertical distribution of flow paths along valley section A -A I (see Fig.l3) showingpoint pre-velocities (b).
38
500
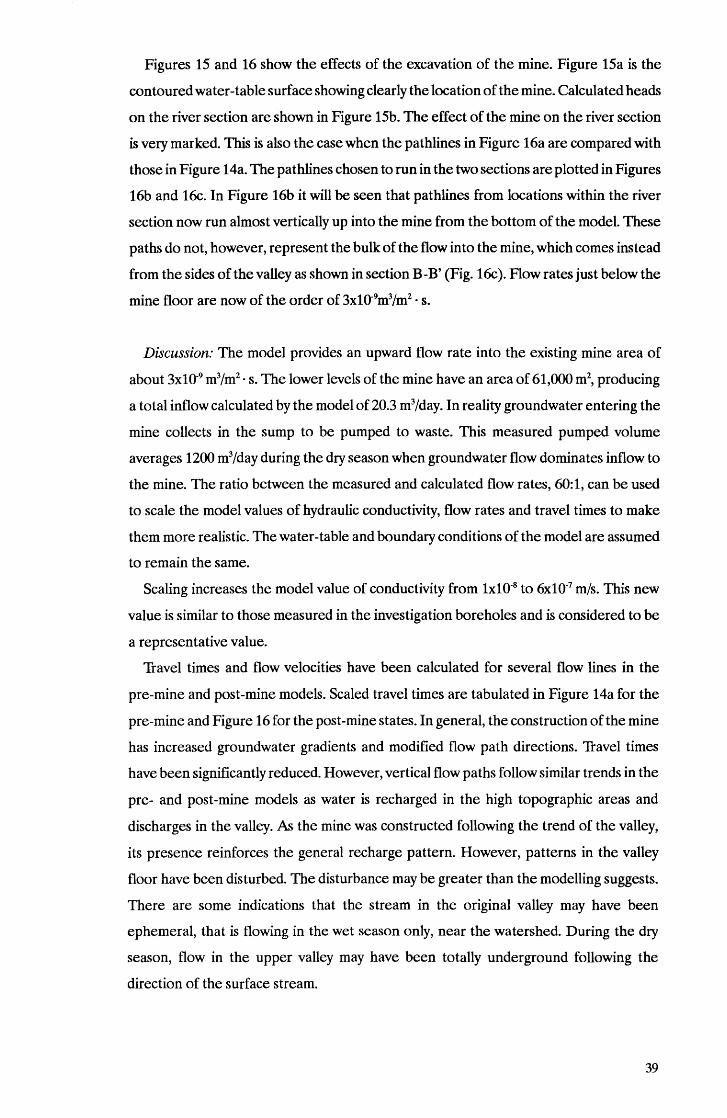
Figures 15 and 16 show the effects of the excavation of the mine. Figure 15a is the
contoured water -table surface showing clearly the location of the mine. Calculated heads
on the river section are shown in Figure 15b. The effect of the mine on the river section
is very marked. This is also the case when the pathlines in Figure 16a are compared with
those in Figure 14a. The pathlines chosen to run in the two sections are plotted in Figures
16b and 16c. In Figure 16b it will be seen that pathlines from locations within the river
section now run almost vertically up into the mine from the bottom of the model. These
paths do not, however, represent the bulk of the flow into the mine, which comes instead
from the sides of the valley as shown in section B-B' (Fig. 16c). Flow rates just below the
mine floor are now of the order of 3xl0-9m3/m2 • s.
Discussion: The model provides an upward flow rate into the existing mine area of
about 3xl0-9 m3/m2• s. The lower levels of the mine have an area of 61,000 m2, producing
a total inflow calculated by the model of 20.3 m3/day. In reality groundwater entering the
mine collects in the sump to be pumped to waste. This measured pumped volume
averages 1200 m3/day during the dry season when groundwater flow dominates inflow to
the mine. The ratio between the measured and calculated flow rates, 60:1, can be used
to scale the model values of hydraulic conductivity, flow rates and travel times to make
them more realistic. The water-table and boundary conditions of the model are assumed
to remain the same.
Scaling increases the model value of conductivity from lxl0-8 to 6xl0-7 m/s. This new
value is similar to those measured in the investigation boreholes and is considered to be
a representative value.
Travel times and flow velocities have been calculated for several flow lines in the
pre-mine and post-mine models. Scaled travel times are tabulated in Figure 14a for the
pre-mine and Figure 16 for the post-mine states. In general, the construction of the mine
has increased groundwater gradients and modified flow path directions. Travel times
have been significantly reduced. However, vertical flow paths follow similar trends in the
pre- and post-mine models as water is recharged in the high topographic areas and
discharges in the valley. As the mine was constructed following the trend of the valley,
its presence reinforces the general recharge pattern. However, patterns in the valley
floor have been disturbed. The disturbance may be greater than the modelling suggests.
There are some indications that the stream in the original valley may have been
ephemeral, that is flowing in the wet season only, near the watershed. During the dry
season, flow in the upper valley may have been totally underground following the
direction of the surface stream.
39
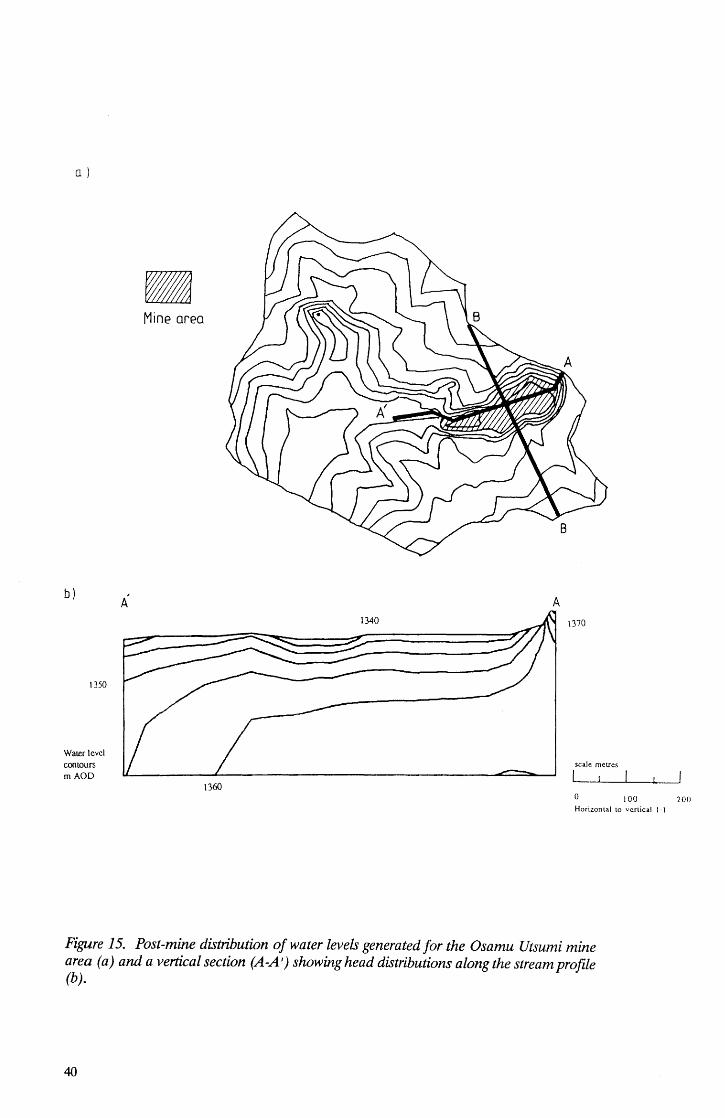
Q)
b)
1350
Water level contours mAOD
• Mine area
1360
A 1340 1370
scale metres
I
100 20U Horizontal to vertical I, I
Figure 15. Post-mine distribution of water levels generated for the Osamu Utsumi mine area (a) and a vertical section (A -A I) showing head distributions along the stream profile (b).
40
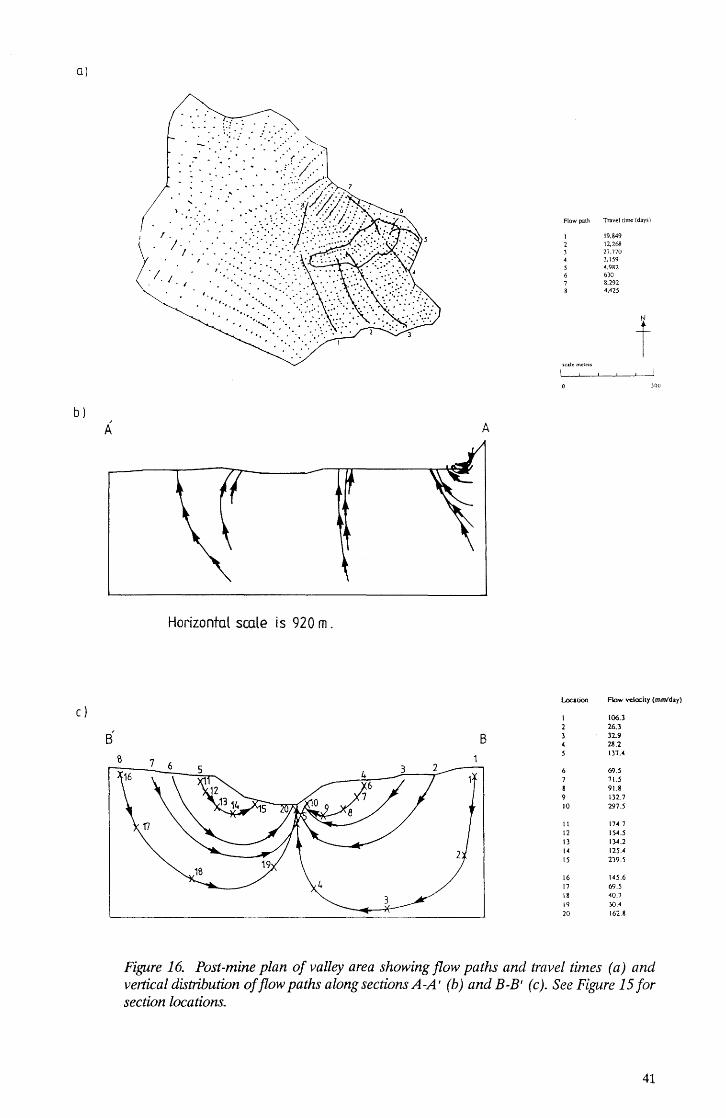
0)
b)
C)
B S
. ~ .~ .. : ~ .: ' .. :." ..
. .
A
Horizontal scale is 920 m.
B
Flow path Travel time (days)
scale metres
Location
10
11 12 13 14 15
16 17 18 19 20
19.849 12.268 27.770 3.159 4.982 630 8.292 4.425
t 100
Flow velocity (mmfday)
106.3 26.3 32.9 28.2 137 .•
69.5 7U 91.8 132.7 197.5
17 •. 7 15·U 13-4.2 125,4 239.5
145.6 69.5 40.7 Y).4 162.8
Figure 16. Post-mine plan of valley area showing flow paths and travel tilnes (a) and vel1ical distribution offlow paths along sections A-A' (b) and B-B' (c). See Figure 15 for section locations.
41
The flow paths for the post-mine model penetrate to great depths and there is some
indication that the mine has lowered local water levels to such an extent that deep
groundwaters (deeper than 400 m) may be mixing with shallow groundwaters.
Flow velocities in pores, for specific points on various flow lines, are tabulated in
Figure 14 for the pre-mine and Figure 16 for the post-mine states. The velocities are
quite high, reflecting the high hydraulic gradients and permeabilities of the area.
Velocities are higher after the construction of the mine. Generally the flow velocities
exceed 20 mm/day and are considerably greater than velocities at which diffusion
processes would dominate the movement of chemical species (velocities of about
0.1 mm/day). The quoted velocities are average values for large volumes of rock. On a
small scale, at which chemical interactions are occurring, the calculation of velocity is
more difficult. Small-scale heterogeneities caused by pore size distributions and fractures
will result in a range of velocities existing in the rock. It is assumed that conductivities
range from lxl0-8 m/s (Waber et al., this report series; Rep. 2) to 5xlQ-6 mls (measured
field value), porosities range from 2 (fracture flow) to 20 percent (porous flow) and the
gradient is 0.02 (field-measured). Velocities will range from 0.08 to 400 mm/day. At the
lower limit some diffusive control of species movement will occur, but at the higher limit
movement will occur by advective flow.
The above velocity calculations assume dry season conditions. During the wet season
hydraulic gradients increase significantly. Measurements at the mine are not reliable but
results from Morro do Ferro show that gradients increase by up to 25%. Flow velocities
may be expected to increase by a similar percentage at the mine.
Conclusions: A three-dimensional flow model of the mine area has been constructed
from sparse data on water levels and hydraulic conductivities. Results have been scaled
or calibrated using measured outflow values. Travel times, flow paths and velocities
calculated by the model can only provide a general indication of groundwater flow in the
area. More specific modelling would require the collection of far more information.
However, the model has yielded some useful findings. Firstly, the topography controls
groundwater flow which moves towards the axis of a stream valley. The excavation of the
mine has reinforced this general flow pattern although the pattern in the valley bottom
has been greatly disturbed. Secondly, travel times and velocities, both pre- and post-mine
excavation, are relatively high, indicating that advection rather than diffusion controls
the movement of chemical species. Residence and interaction times are, probably, quite
short and should be measured in days rather than years.
42
3.2. The Morro do Ferro area
3.2.1. Desk study and previous work
Morro do Ferro is one of the highest points on the caldera. Topographic maps, supplied
by Uranio do Brasil, show that the hill is steep-sided and bounded by deeply incised
streams which drain the groundwater as can be seen on the sketch map (Figure 17). From
previous work reported in IPT (1984), in which 9 piezometers were drilled to sample the
upper part of the saturated wne, the water-table appears to be a subdued reflection of
the topography. Magnetite dykes, which run across the hill, appear to distort the
water-table to a limited extent. At the top of the hill the water-table is at least 80 metres
below the surface. In the valley bottoms the water-table is at or near the surface,
occurring as seepages or discrete springs.
Figure 18 shows diagrammatically the relationship of the water-table to the
topography. The difference in water levels between the wet and dry seasons appears to
be at least 20 metres under the central part of the hill. This represents the water which
is stored and slowly released as base flow to the stream. Rainwater enters the aquifer by
percolating through the unsaturated zone until it meets the water-table. Under the hill,
flow will continue downwards, maintained by a vertical component in the piezometric
gradient. Near the stream the flow direction will change as water drains into the water
course. This groundwater should have had the longest residence time in the rock mass
and therefore have experienced the greatest chemical changes. The groundwater under
the hill may have penetrated the rock mass to some 100 metres or more below the level
of the stream.
3.2.2. Field work data collection
Figure 18 shows the three boreholes drilled for the field investigations. MF10 was
designed to recover good core from the mineralised wne in the ore body and provide
access for making hydrogeological measurements. The rock was very friable and tended
to wash out with standard drilling techniques using water as a flushing medium.
Therefore, a simple dry-pushing method was employed using a short barrel. This slow
technique achieved good recovery to below the water-table, which was intercepted at a
depth of 28.62 m below ground level. Below a depth of 35 m the borehole walls started
to collapse and it became necessary to use a metal casing to support the rock as drilling
proceeded. Below approximately 60 m, water-flush drilling with a double-wall barrel was
43
1425
1425
scalem
I I o 250
1400
•
1450 1450
500
AREA OF GROUNDWATER RECHARGE OXIDISING WATERS?
AREA OF GROUNDWATER DISCHARGE REDUCING OR MIXED WATER?
DIRECTION OF GROUNDWATER FLOW
N
t 1425
1450
ALTTIUDEOFLAND SURFACE IN MEmES ABOVE DATUM
BOREHOLE IN MF SERIES
STREAM PERMANENT OR EPHEMERAL
Figure 17. Sketch map of MOlTO do FelTo showing assumed hydrogeological conditions.
44
ELEVATION MOAD
INFILTRATION 1540
15iO
1480
1450
1420
1390
1360
1330
1300
1270
1240
0 200 400
DISTANCE M - ARBITRARY DATUM
Piezometer Sampling Point
Mineralisation
Simulated Flow Line
Figure 18. Cross-section through Morro do Ferro.
600
Water Table Wet Season
Dry Season
45
days since water level strike
o 2 4 6 8 1 0 1 2 -28-~~1~1.'~'~'~'~'~1_'~'~'~!~!~!~,~I~'~!~I~I~IWI~ILI ~!~!~I~I~!~!~!~I~I~!~!~I !LLI~ILIL'~!~I~I~I~'~' I
0')
.0
E
o
- 2 9
-30
o o o o
Figure 19. Water-level fluctuations in MF10 while drilling.
46
o o
o o o
employed. Recovery of core was reduced but drilling was more rapid. When the borehole
was at a depth of 74 m, with metal casing installed to 62 m, the borehole experienced a
severe cave-in near the bottom. Additionally, the casing became firmly stuck and could
not be removed. The difficult drilling conditions and unstable wall made straddle packer
testing impossible. Some simple slug tests were performed in the open hole as drilling
progressed. A packer with a plastic casing string was installed within the casing of the
borehole to sample the groundwater at a depth of about 70 metres.
Figure 19 shows water level data collected by dipping the borehole every morning
before drilling started, measured in days since first water level strike. Days 0 to 8 show
a steady drop in the level, reflecting the general recession of the water-table as water is
lost from the aquifer to the base flow of the stream. By day 10 the casing was at a depth
of 62 m below ground level and had become stuck in the borehole. Fine-grained rock
material had fallen behind the casing and formed a hydraulic seal. Thus the water level
from days 10 to 12 represents the value found between 62 and 74 m depth in the rock.
This level is about 0.5 metres lower than that measured at first water strike. There
appears, therefore, to be a significant downward vertical hydraulic gradient adjacent to
the borehole. This was verified by completing MF10 at 70 m and drilling another hole
close by to sample water at about 40 m.
Two values for hydraulic conductivity were also measured in the borehole. The first
was made when the hole had penetrated the water -table to a depth of about 6 m (28.62
to 34.94 mbgl). A slug test was performed by raising the water level using a metal rod. A
value of 1.6x10-s ms-1 was determined. 100 litres of water was also collected at this depth
for geochemical analysis. A second slug test was performed in the borehole using a single
packer to isolate the lower section of the borehole from 64 to 74 mbgl. This yielded a
value of 1x10⁻⁶ ms-1•
Borehole MF11 was drilled immediately adjacent to MF10 to a depth of 40 mbgl to
sample groundwater in the vicinity of the water-table for comparison with the deeper
water sampled by MF10.
Another borehole, MF12, was drilled adjacent to the valley bottom (see Fig. 18).
Friable rock was encountered to a depth of 27.52 mbgl and was succeeded by more
competent rock to the final drilling depth of 71.00 m; a redox front was intercepted at
35.71 mbgl. The upper part of MF12 lost significant volumes of fluid during drilling and
is assumed to have a high hydraulic conductivity. Drilling problems meant that the zone
from surface to 40 mbgl could not be tested.
The competent nature of the rock allowed some straddle packer tests to be attempted
and hydraulic conductivity values of3x10-7 ms-1 were measured from 40 to 57 mbgl. From
47
BOREHOLES MF10 AND MF11
1437 ~
1436
1435
1434
1433
1432
o 20 40 60 80 100 120 140 160
TIME IN DAYS SINCE 17 DEC 1987
BOREHOLE MF12
1416.0 -r-----------------...
Q o ~ 1415.5
~ ....J
~ 1415.0 ~ ~
~
~ 1414.5 ~
s:
o 20 40 60 80 100 120 140 160
TIME IN DAYS SINCE 17 DEC 1987
-0-- MF10ALT
• MFll ALT
--[!t- MF12 ALT
Figure 20. Water-level fluctuations in boreholes MF10, MFll and MF12 at Morro do Ferro.
48
58 to 64 mbgl, in competent rock, the value dropped to 7x1O-9 ms·l• Water levels
measured during the testing indicated an upward vertical groundwater flow, as would be
expected adjacent to the stream. The extent of the vertical gradient remains to be
established. A permanent completion, with a mechanical packer, sampling the lower part
of this borehole from 45 to 71 mbgl has been emplaced.
Water levels were monitored in the MF series boreholes for a five month period from
December 1987 and the results are presented in Figure 20. MF10 and MF11 show a rise
of some 2.5 m over this period. The level in MF10 is consistently some 3 m below that
in MF11, showing that a marked vertically downward gradient exists. The level in MF12
rase by some 0.75 m over the same period, reflecting the closeness of the borehole to
the discharge point in the stream bed.
3.2.3. Mathematical modelling
The limited data from the desk study and field investigation have been used to
construct a mathematical model of the Morro do Ferro site to determine flow rates and
directions.
Boundary conditions: As interest concentrated on the single hills lope, a two
dimensional model was selected using a cross-section of the water-table from under the
hill, through boreholes MF10 and MF12, to the stream as the boundary. The unsaturated
zone above the water-table was not considered.
Material properties: The rock mass is assumed to have a homogeneous hydraulic
conductivity of 5x1Q-6 ms·l and a porosity of 0.3. This porosity is assumed to reflect the
weathered nature of the rock. An area some 30 m deep adjacent to the stream is assumed
to have an enhanced hydraulic conductivity of 1x10·s ms·l.
Flows were determined for two steady-state conditions; the first with the water-table
fIXed for the dry season and the second with an elevated water-table reflecting wet season
conditions. The latter water-table was calculated by raising the water divide some 15 m
and leaving the stream fIXed. Points in between were raised in proportion.
Results: For each calculation, a series of pathlines was traced which allowed an
assessment to be made of the flow rates which can be expected in various parts of the
section. In particular, flow rates in the vicinity of the bottom ofMF10 were found to be
1.16x10·7 m3jm2js (dry season) and 1.29x10·7 m3jm2js (wet season). The pore-water
49
EIEVATION M:W)
ELE.VATION M:W)
DRY SEASON PATHS
WET SEASON PATHS
Figure 21. Hydrogeological modelling at Morro do Ferro.
50
velocities for mass transport calculations are obtained by dividing these values by the
porosity. Thus, velocities vary between 33 and 37 mm/day. A package of water starting
at the surface of the water-table near MF10 would take approximately 10,000 days to
reach the stream; from the water divide at the top of the hill it would require about 20,000
days. Figure 21 shows pathlines generated by the modelling. The effects on these
pathlines of the enhanced conductivity zone close to the stream can be clearly seen.
There is little difference between the wet and dry seasons.
4. Conclusions Geomorphological evidence indicates that the land surface of the P~os de Caldas
plateau has been eroding at an average rate of 12 m per million years for the last 10
million years. The penetration of the redox front, a product of the deep weathering in
the tropical climate, has probably keep pace with the land e"rosion. The groundwater
table is generally a subdued reflection of the topography. This is certainly the case at
Morro do Ferro where rainfall recharges on the hills lopes and flows underground to
emerge as base flow in the valley bottoms. Water levels respond to seasonal rainfall and
individual rainfall events. This simple pattern was also found in the area adjacent to the
Osamu Utsumi mine. Excavation of the mine has significantly disturbed the natural flow
patterns. Reducing groundwaters now well up through rock which originally received
downward-moving oxygenated waters.
5. Acknowledgements
The authors would like to thank the coordinators of the project and other co-workers
for stimulating conversations on the influence of geomorphology and hydrogeology on
the movement of chemical species through the rock mass. Special thanks are due to all
the personnel in Brazil who made it a pleasure to work there.
51
6. Bibliography and references
Amaral, G., Bushee, J., Cordani, U.G., Kawashita, K and Reynolds, J.H., 1967.
Potassium-argon ages of alkaline rocks from southern Brazil. Geochim.
Cosmochim.Acta, 31,117-142.
Amaral, E.C.S., Azevedo, H.L.P. and Mendonca, AH., 1985. Pre-operational
environmental sUlVey at the uranium mine and mill site, P~ de Caldas, Minas
Gerais, Brazil. Sci. Tot. Env., 42, 257-266.
Amter, S., 1989. Natural analogues. Eng. Geol., 26, 431-440.
Azevedo, H.L., Amaral, E.C.S. and Godoy, J.M., 1988. Evaluation of the 226Ra transport
by river sediments surrounding the Brazilian uranium mining and milling facilities.
Environ. Pollut., 51, 259-268.
Bernhard-Reversat, E, 1975. Recherches sur l'ecosysteme de la foret subequitoriale de
basse Cote-d'Ivoire. Iv. Les cycles de macroelements. La terre et la vie, (Paris),29,
229-254.
Bigarella, J.J. and Andrade, G.O., 1965. Contribution to the study of the Brazilian
Quaternary. Geol. Soc. Am. Spec. Pap., 84, 433-451.
Bonotto, D.M., 1989. The behavior of dissolved uranium in groundwaters of the Morro
do Ferro thorium deposit, Brazil. I Hydrol. (In press.)
Christofoletti, A, 1973. A unidade morfoestrutural do planalto de P~s de Caldas. Nat.
Geomorfol. (Campinas), 13,77-85.
Cole, M.M., 1987. The savannas. Prog. Phys. Geog., 11,334-355.
Cooper, H.H., Bredehoeft, J.D. and Papadopulos, I.S., 1967. Response of a finite
diameter well to an instantaneous charge of water. Water Resources Res. 3(1), pp
263-269.
Damuth, J.E. and Fairbridge, R. w., 1970. Equatorial Atlantic deep-sea arkosic sands and
Ice-Age aridity in tropical South America. Bull. Geol. Soc. Am., 81, 189-206.
Eiten, G. 1982: Brazilian savannas. In: B.J. Huntley and B.H. Walker (Editors). Ecology
of tropical savannas. Ecological Studies 42, Springer Verlag, Berlin, 25-47.
Ellert, R., 1959. Contribuicao it geologia do maci~o alcalino de P~os de Caldas. Univ.
Silo Paulo, Geol. Bol., 18, 120 pp.
Fairbridge, R.W. and Finkl, C.w., 1984. Tropical stone lines and podzolized sand plains
as paleoclimatic indicators for weathered cratons. Quat. Sci. Rev., 3, 41-72.
52
Gibbons, M.J., Wiliams, AK, Piggott, N. and Williams, G.M., 1983. Petroleum
geochemistry of the Southern Santos Basin, offshore Brazil. I. Geol. Soc. London,
140, 423-430.
Gilmour, D.A and Bonell, M., 1979. Runoff processes in tropical rainforests with special
reference to a study in north-east Australia. In: AF. Pitty (Editor). Geographical
Approaches to Fluvial Processes. GeoAbstracts, Norwich, 73-92.
Haggett, P., 1961. Land use and sediment yield in an old plantation tract of the Serra do
Mar, Brazil. Geog. I., 50--62.
Hallberg, G.R., 1980. Pleistocene stratigraphy in east-central Iowa. Iowa Geol. SUlV.,
Tech. Info. Ser., 10, 168 pp.
Hoyt, WG. and Troxell, H.C., 1932. Forests and streamflow. Am. Soc. Civ. Eng. Pap., 58,
1037-1066.
IPT (Instituto de Pesquisas Tecnol6gicas do Estado de Sao Paulo), 1984. In: F.F.M.
Almeida (Editor). Revision of the bibliography of Morro do Ferro - Po~os de
Caldas - MG. IPT-Report No. 20993, Sao Paulo.
Jackson, I.J., 1975. Relationship between rainfall parameters and interception by
tropical forest. I. Hydrol., 24, 215-238.
Kershaw, AP., 1985. An extended late Quaternary vegetation record from north-eastern
Queensland and its implications for the seasonal tropics of Australia. Proc. Ecol.
Soc. Aust., 13, 179-189.
Lei, W, 1984. Thorium mobilization in a terrestrial environment. Ph.D. Thesis, New York
University, N.Y., 414 pp.
Leprun, J.-C. 1987. ~erosion hydrique dans Ie nord-est du Bresil. In: A Godard and A
Rapp (Editors). Processus et mesure de l'erosion. Presses du CNRS, Paris, 541-549.
Loureiro, F.E.L. and Santos, R.C., 1988. The intra-intrusive uranium deposits ofPo~os
de Caldas, Brazil. Ore Geol. Rev., 3, 227-240.
Markgraf, V. and Bradbury, J.P', 1982. Holocene climatic history of South America.
Striae, 16, 40-45.
McLean, R.C., 1919. Studies of the ecology of tropical rainforest with special reference
to the forests of south Brazil. 1 Ecol., 7, 5-54,121-172.
Noy, D.J., 1982. The development of computer programs for the three dimensional
analysis of groundwater flow and mass transport. Rep. Inst. Geol. Sci., ENPU
82-15.
53
Noy, D.J., 1985. Computer codes for three dimensional mass transport with non-linear
sorption. Rep. British Geol. Sum FLPU 85-4.
Nye, P.H. and Greenland, D.J., 1960. The soil under shifting cultivation. Comm. Bur.
Soils, Tech. Comm., 51, 156 pp.
Ollier, C.D., 1981. Tectonics and landforms. Longman, London, 324 pp.
Ollier, C.D., 1988. Deep weathering, groundwater and climate. GeografiskaAnnr., 70A,
285-290.
Ollier, C.D., Chan, R.A, Craig, M.A and Gibson, D.L., 1988. Aspects of landscape
history and regolith in the Kalgoorlie region, Western Australia. Geophys., 10,
309-321.
Ovington, J.D., 1962. Quantitative ecology and the woodland ecosystem concept. Adv.
Ecol. Res., 1, 103-192.
Ruhe, R.V., 1959. Stone lines in soils. Soil Sci., 87, 223-231.
Ruxton, B. and Berry, L., 1957. Weathering of granite and associated erosional features
in Hong-Kong. Bull. Geol. Soc. Am., 68, 1263-1292.
Setzer, J., 1956. A natureza e as possibilidades do solo no vale do Rio Pardo entre os
municipios de Caconde, Sp, e Po~os de Caldas, MG. Revista Bras. Geog., 18,
287-321.
Smith, D.L. and Bailey, R.A., 1968. Resurgent cauldrons. Geol. Soc. Am. Mem., 116,
613-663.
Sowunmi, M.A, 1986. Change of vegetation with time. In: G.w. Lawson (Editor). Plant
ecology in west Africa: systems and processes. John Wiley, Chichester, 273-307.
Tricart, J., 1958. Division morphoclimatique du Bresil Atlantique central. Rev. Geom.
Dyn.,9, 1-22.
Tricart, J. and da Silva, TC., 1959. Aspects generaux de la sedimentation du bassin de
Taubate (St. Paul, Brasil). Eclog. Geol. Helv., 51, 795-803.
Tricart, J., 1972. The landforms of the humid tropics, forests and savannas. Longman,
London, 306 pp.
Ulbricht, M.N.C., 1983. Aspectos mineral6gicos e petrol6gicos de nefelina sienitos de
Po~os de Caldas, MG-SP. - Sao Paulo, Universidade de Sao Paulo, 369 p. (Tese de
Doutoramento apresentada ao Instituto de Geociencias, USP.)
Walton, WC., 1962. Selected analytical methods for well and aquifer evaluation. Illinois
State Water Supply Bull., 49. 81 pp.
54
Webber, B.N., 1959. Bauxitization in the Po~os de Caldas district, Brazil. Min. Eng.,
805-809.
Williams, H., 1941. Calderas and their origin. Univ. Calif. Publ. Geol. Sci., 25, 239-346.
Williams, H., 1942. The geology of Crater Lake National Park, Oregon. Carnegie Inst.
Wash. Publ., 540,162 pp.
55