Embed Size (px)
Citation preview
An-Najah National University
Faculty of Graduate Studies
Functionalized C,N-Bipyrazole Receptor
Grafted Onto Silica Surface for Arsenic
(As) Adsorption and its Antibacterial
Activity
By
Nagham Tahseen Mohammed Taha
Supervisor
Dr. Ahmad Abu Obaid
Co-supervisor
Dr. Motasem Al-Masri
This Thesis is Submitted in Partial Fulfillment of the Requirements
for the Degree of Master of Environmental Science, Faculty of
Graduate Studies, An-Najah National University, Nablus, Palestine.
2016

III
Dedication.
First of all, my greatest gratitude to Allah,
To my family, especially my father and mother…
To my country "Palestine "…
To my teachers and partners…
To all who helped and encouraged me in any way….
Thank you all

IV
Acknowledgements
First of all, I am so grateful to Allah, who gave me the patience to finish
my thesis.
Special thanks and appreciation to my supervisors, Dr. Ahmed Abu Obaid
and Dr. Motasem Al-Masri, for their supervision , suggestions , time they
spent to help me and their guidance to the last stage .
My thanks to all technical staff of the department of chemistry at An Najah
University , especially Mr. Nafeth Dwikat for his help.
My thanks and gratitude to my lovely family , sister and brothers for their
continuous encouragement .
Endless thanks and regards to all who help me in any way, to all my dear
friends …
VI
Table of contents
No. Contents Page
Dedication III
Acknowledgment IV
Declaration V
Table of contents VI
List of tables VIII
List of figures IX
List of abbreviation X
Abstract XI
Chapter One: Introduction 1
1.1 Heavy metals 4
1.1.1 Arsenic 4
1.2 Traditional techniques 5
1.3 Adsorption 6
1.4 Antibacterial resistance 7
1.5 Novelty 8
1.6 Hypothesis 8
1.7 Objectives 9
1.8 Previous studies 9
Chapter two: Methodology 11
2.1 Chemistry part 12
2.1.1 Preparation of arsenic (III) solutions 12
2.1.2 Preparation of calibration curves 12
2.1.3 Metal quantification 13
2.1.4 Instrumentation 14
2.1.5 Studied parameter 14
2.1.5.1 Effect of temperature 14
2.1.5.2 Effect of pH 14
2.1.5.3 Effect of initial metal ion concentration 15
2.1.5.4 Effect of adsorbent dose 15
2.1.5.5 Optimization of contact time 15
VII
2.2 Biological part 16
2.2.1 Media preparation 16
2.2.2 Adsorbent substance SG2P solution preparation 16
2.2.3 Bacterial suspension preparation 17
2.2.4 Minimum inhibitory concentration procedure 17
Chapter Three: Results and discussion 18
3.1 Effect of pH on As(III) adsorption 19
3.2 Effect of temperature on As(III) adsorption 20
3.3 Effect of initial As(III) concentration 21
3.4 Effects of time contact on As(III) adsorption 23
3.5 Effects of adsorbent dosage on As(III) adsorption 24
3.6 Adsorption isotherm of As(III) 25
3.6.1 Freundlich adsorption isotherm 25
3.6.2 Langmuir adsorption isotherm 28
3.7 Rate order of the adsorption process 29
3.8 Adsorption thermodynamics 32
3.9 Antibacterial activity of SG2P 34
conclusion 36
References 37
ب الملخص
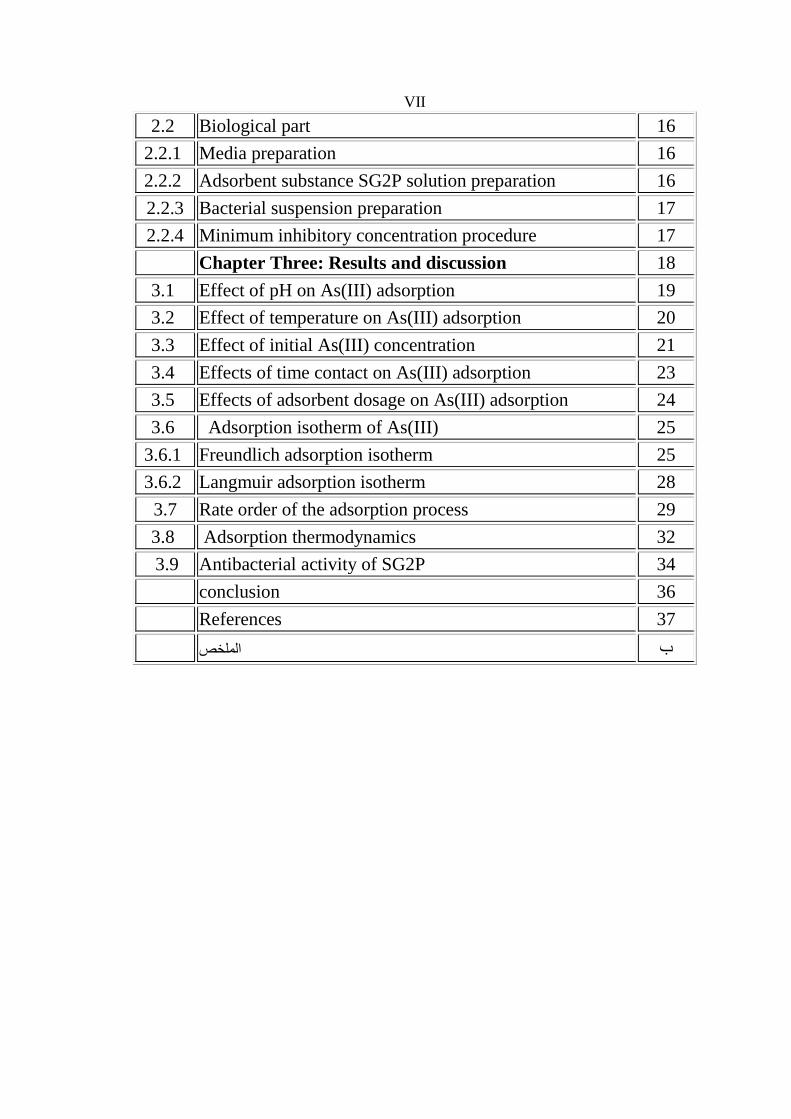
VIII
List of Tables No Table Page
Table 1 Parameters and correlation coefficient of Freundlich
isotherm model for adsorption of As(III) onto SG2P 26
Table 2 Parameters and correlation coefficient of Langmuir
isotherm model for adsorption of As(III) onto SG2P 28
Table 3 Pseudo first- order parameters for As(III) adsorption
onto SG2P at 25ºC 30
Table 4 Pseudo second - order parameters for As(III)
adsorption onto SG2P at 25ºC 31
Table 5 The values of the thermodynamic of As(III)
adsorption atvarious temperatures 33
Table 6 Demonstration of bacterial growth and inhibition by
SG2P 34
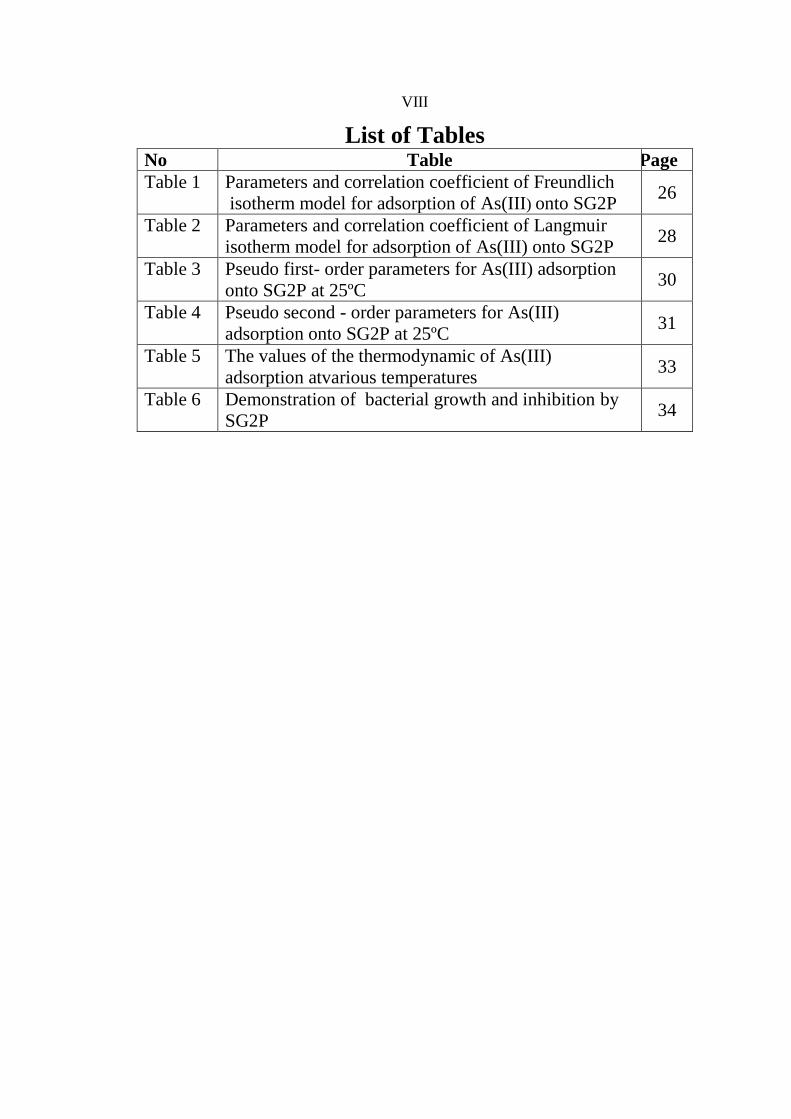
IX
List of Figures No Figure Page
figure 1 Linear calibration curve of absorbance vs. concentration
for As(III) concentrations 13
figure 2 pH effect on As(III) adsorption 20
figure 3 Effect of temperature on As(III) adsorption 21
figure 4 Effect of As(III) concentration on adsorption 22
figure 5 Effects of contact time on As(III) adsorption 23
figure 6 Effect of dosage of adsorbent on the removal of As(III) 24
figure 7 Freundlich plot for As(III) adsorption on SG2P 26
figure 8 Langmuir plot for As(III) adsorption on SG2P 28
figure 9 Pseudo first- order adsorption kinetics of As(III) onto
SG2P 30
figure 10 Pseudo second order adsorption kinetics of As(III) onto
SG2P 31
figure 11 Van't Hoff plot . graph of lnKd vs. 1/T for As(III)
adsorption on SG2P 33
figure 12 Antibacterial activity of SG2P 34
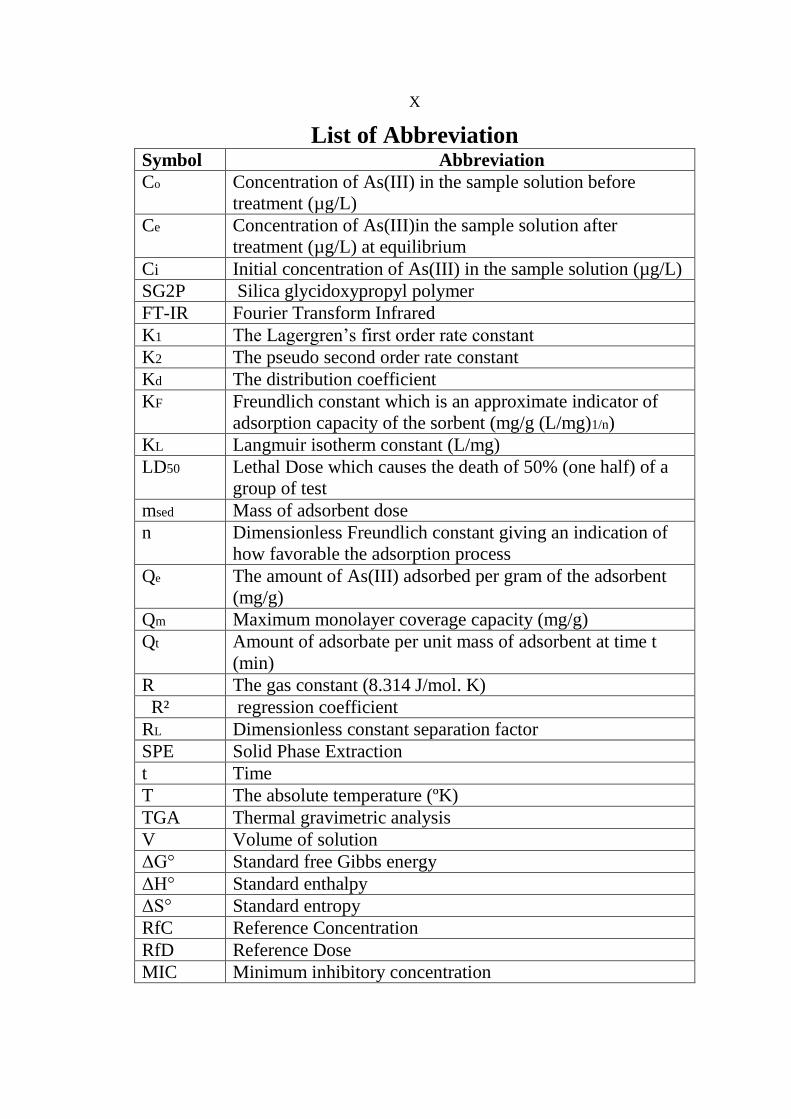
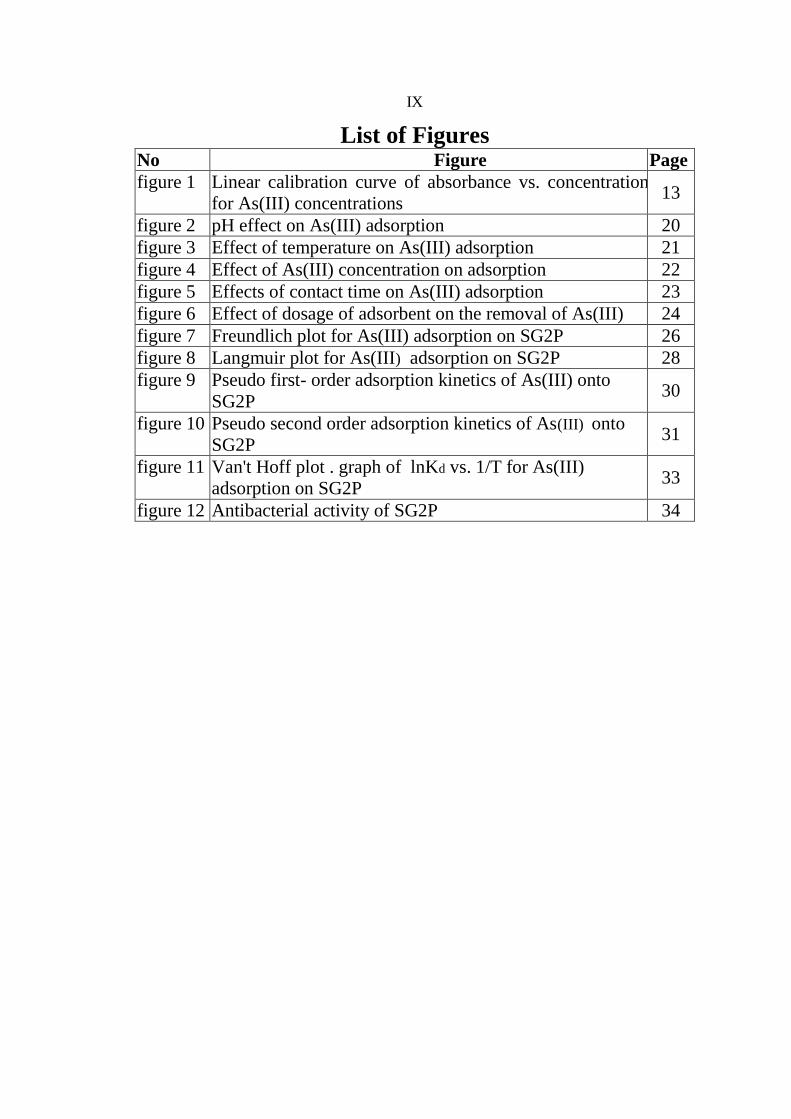
X
List of Abbreviation Symbol Abbreviation
Co Concentration of As(III) in the sample solution before
treatment (µg/L)
Ce Concentration of As(III)in the sample solution after
treatment (µg/L) at equilibrium
Ci Initial concentration of As(III) in the sample solution (µg/L)
SG2P Silica glycidoxypropyl polymer
FT-IR Fourier Transform Infrared
K1 The Lagergren’s first order rate constant
K2 The pseudo second order rate constant
Kd The distribution coefficient
KF Freundlich constant which is an approximate indicator of
adsorption capacity of the sorbent (mg/g (L/mg)1/n)
KL Langmuir isotherm constant (L/mg)
LD50 Lethal Dose which causes the death of 50% (one half) of a
group of test
msed Mass of adsorbent dose
n Dimensionless Freundlich constant giving an indication of
how favorable the adsorption process
Qe The amount of As(III) adsorbed per gram of the adsorbent
(mg/g)
Qm Maximum monolayer coverage capacity (mg/g)
Qt Amount of adsorbate per unit mass of adsorbent at time t
(min)
R The gas constant (8.314 J/mol. K)
R² regression coefficient
RL Dimensionless constant separation factor
SPE Solid Phase Extraction
t Time
T The absolute temperature (ºK)
TGA Thermal gravimetric analysis
V Volume of solution
ΔG° Standard free Gibbs energy
ΔH° Standard enthalpy
ΔS° Standard entropy
RfC Reference Concentration
RfD Reference Dose
MIC Minimum inhibitory concentration
XI
Functionalized C,N-bipyrazole receptor grafted onto silica surface for
Arsenic (As) adsorption and its anti bacterial activity
By
Nagham Tahseen Mohammed Taha
Supervisor
Dr. Ahmad Abu Obaid
Co-supervisor
Dr. Motasem Al-Masri
Abstract
The ability of C,N- bipyrazole receptor grafted onto silica surface (SG2P)
of adsorption arsenic (As) from aqueous solutions was studied. The effect
of various parameter on the adsorption process was investigated. Such
parameters included; PH, contact time, concentration of initial ions of
arsenic in solution and dosage of adsorbent.
The results obtained indicated the percentage removal of arsenic
decreased with the increase of As concentration and pH, while the
percentage removal increased with the increase of contact time, adsorbent
dose and temperature. The removal efficiency for As(III) adsorption
could reach 60% after 24hour was achieved at pH around 3, and
temperature 25ºC, using 0.02g weight of dose, at initial concentration
10ppb for 10mL As(III) solution.
The studied parameter result on adsorption showed the optimal conditions
for arsenic adsorption process were pH around 3 (acidic solution), 45O C,
initial concentration of arsenic ions was at 10 ppb, the optimal time
interval was 20 minutes, and the dosage of adsorbent had maximum
adsorption capacity at 0.15g.
XII
Two kinetics models were applied the adsorption process: pseudo-first
order kinetic model and pseudo second order kinetic model. The results
that adsorption process of arsenic harmonized pseudo second order model.
The adsorption capacity of SG2P was studied using Freundlich and
Langmiur models at equilibrium to determine the behavior of adsorption
process, both models result showed favorable adsorption process.
Thermodynamics parameters such standard enthalpy, standard entropy and
standard free energy were calculated for SG2p adsorbent. The negative
Go values indicate that the adsorption is spontaneous at these
temperatures. The negative value of Ho reflects an exothermic adsorption
and indicates that the adsorption is favored at low temperature. In the other
hand, the positive value of ∆S° suggests that some structural changes occur
on the adsorbent and the randomness at the solid/liquid interface in the
adsorption system increases during the adsorption process.
The antibacterial activity of SG2P was determined against two bacterial
references strains using micro- broth dilution method. The references
strains were Escherichia coli (ATCC25922) and Staphylococcus aureus
(ATCC25932). The SG2P possessed limited antibacterial activity, where it
was able to inhibit growth only at high concentration (MIC =1.5625 mg per
ml).

1
Chapter One
Introduction

2
Chapter One
Introduction
More than two thirds of earth's surface is covered by water; less than a
third is taken up by land. As earth's population continues to increase,
people are causing high pressure on the planet's water resources, also as we
know that pollution is a human problem because it is a relatively recent
development in the planet. As industrialization has spread around the
globe, so the problem of pollution has spread with it. When Earth's
population was much smaller, no one believed pollution would ever present
a serious problem. It was once popularly believed that the oceans were far
too big to pollute. Today, with around 7 billion people on the planet, it has
become apparent that there are limits. Pollution is one of the signs that
humans have exceeded those limits. seriousness of the problem can
appear according to the environmental campaign organization
WWF: "Pollution from toxic chemicals threatens life on this planet. Every
ocean and every continent, from the tropics to the once-pristine polar
regions, is contaminated [1].
Pollution is the process of making land, water, air or other parts of the
environment dirty and unsafe or unsuitable to use. This can be done
through the introduction of a contaminant into a natural environment. Toxic
pollution affects more than 200 million people worldwide, according to
Pure Earth, a non-profit environmental organization. In some of the world’s
worst polluted places, babies are born with birth defects, children have lost
30 to 40 IQ points, and life expectancy may be as low as 45 years because
3
of cancers and other diseases. Water pollution happens when chemicals or
dangerous foreign substances are introduced to water, including chemicals,
sewage, pesticides and fertilizers from agricultural runoff, or metals like
lead or mercury [2].
The need to maintain a cleaner environment for the survival of both aquatic
and terrestrial lives including human beings is very crucial and is a subject
of increasing concern to the environmentalist. Pollution caused by agents
such as heavy metals and dyes are amongst the list which rendered the
environment unwholesome and posed serious health concern to the
populace [3].
The environment is not something distant and separate from our lives. The
environment is everything that surrounds us that gives us life and health.
Destroying the environment ultimately reduces the quality of our own lives.
As a result of that attention in the world is growing with respect to the
idea of accumulation of heavy metals in the environment. Theses metals
are considered as a threat to both human health and environment, especially
when their tolerant levels are exceeded. This results from the fact that the
heavy metals are not biodegradable over time, and accumulate in the
environment. So there is an argent need for stopping heavy metals
releasing in the environment. Heavy metals such as manganese, arsenic,
lead and nickel can reach water mainly through industrial waste and landfill
runoff.
4
1.1. Heavy metals
Heavy metals are naturally occurring elements that have a density at least 5
times greater than that of water[4].
Heavy metals enter the water system from various sources, as agriculture
sources due to use of fertilizers and pesticides that reach the water bodies
through runoff as well as to sewage effluent. Heavy metals are the most
toxicological species found in industrial effluents due to painting
,constructing, etc… that leads to accumulate in living tissues by food
chains, doubling the danger.
In this study arsenic (III) adsorption from contaminated water by SG2P as a
novel adsorbent was investigated.
1.1.1. Arsenic
Arsenic (As) is naturally present at high levels in the groundwater of a
number of countries. Arsenic is highly toxic in its inorganic form.
Contaminated water used for drinking, food preparation and irrigation of
food crops poses the greatest threat to public health from arsenic. Long-
term exposure to arsenic from drinking-water and food can cause cancer
and skin lesions. It has also been associated with developmental effects,
cardiovascular disease neurotoxicity and diabetes [5]. The two forms of
inorganic arsenic, arsenate As (V) and arsenite As(III), are easily taken up
by the cells of the plant root. Once in the cell, As (V) can be readily
converted to As(III), the more toxic of the two forms. As (V) and As(III)
both disrupt plant metabolism, but through distinct mechanisms, in addition
5
to its effects on plants and living creatures in water, and as arsenic
inorganic is the common form in the water. There is an argent need to try
to reduce the arsenic in water to a normal levels. Arsenic is one of WHO’s
10 chemicals of major public health concern. WHO’s work to reduce
arsenic exposure includes setting guideline values, the current
recommended limit of arsenic in drinking-water is 10 μg /litre, although
this guideline value is designated as provisional because of measurement
difficulties and the practical difficulties in removing arsenic from drinking-
water. Where it is difficult to achieve the guideline value, Member States
may set higher values as standards taking into account local circumstances,
resources and risks from low arsenic sources that are contaminated
microbiologically [6].
1.2. Traditional techniques to remove heavy metals:
As heavy metal pollution has become one of the most serious
environmental problems today. The treatment of heavy metals is of special
concern due to their recalcitrance and persistence in the environment so
many methods of treatment of heavy metals were extensively studied.
These technologies include chemical precipitation, filtration, ion-exchange,
flocculation and adsorption [7].
Although precipitation is the most common one, but it only reduces the
dissolved metals concentration to solubility product level with for many
exceed the discharge permit standards and thus leads to extra cleaning
stages [8].
6
Ion exchange is another method used successfully in the industry for the
removal of heavy metals from effluent. An ion exchanger is a solid
capable of exchanging either cations or anions from the surrounding
materials. Commonly used matrix for ion exchange are synthetic organic
ion exchange resins. The disadvantage of this method is that it cannot
handle concentrated metal solution as the matrix gets easily fouled by
organics and other solids in the wastewater. Moreover, ion exchange is
nonselective and is highly sensitive to the pH of the solution [9].
Flocculation techniques are dependent basically on the use of flocculants to
clean wastewater, but they are expensive and produce sludge and saline
effluent [10]. Filtration technique depends on the material of filtrate, the
most common one is the charcoal that is used to remove organic
contaminants from aqueous solution, the extensive use of it for metal
removal from industrial effluents is expensive [11]. The last technique and
the applicable one in this research is adsorption.
1.3. Adsorption
Adsorption (in language) , is the adhesion of atoms, ions, or molecules from
a gas, liquid, or dissolved solid to a surface. This process creates a film of
the adsorbate on the surface of the adsorbent. Adsorption is a surface-
based process [12]. Adsorption is a fundamental process in the
physicochemical treatment of municipal wastewaters, a treatment which
can economically meet today's higher effluent standards and water reuse
requirements. Also it considered as a broad spectrum of physical,
7
biological, and chemical processes and operations in the environmental
field. Purification of gases by adsorption has played a major role in air
pollution control, and adsorption of dissolved impurities from solution has
been widely employed for water purification. Adsorption is now viewed as
a superior method for wastewater treatment and water reclamation [13]. In
this research adsorption on new chemical adsorbent (C,N-bipyrazole with a
3-glycidoxyprpoyl-trimethoxyilane silylant agent) onto a silica surface in
short(SG2P) was used.
1.4. Antibaterial resistance
Nowadays, antimicrobial resistance threatens the effective prevention and
treatment of an ever-increasing range of infections caused by bacteria,
parasites, viruses and fungi. Antimicrobial resistance is an increasingly
serious threat to global public health that requires action across all
government sectors and society. Without effective antibiotics, the success
of major surgery and cancer chemotherapy would be compromised. The
cost of health care for patients with resistant infections is higher than care
for patients with non-resistant infections due to longer duration of illness,
additional tests and use of more expensive drugs [14].
The continuous increase in antimicrobial resistance led to urgent need to
find alternative materials possessing antibacterial activity to help in
reducing the resistance of bacterial activity.
Micro Dilution methods are used to determine the minimum inhibitory
concentrations (MICs) of antimicrobial agents and are the reference
8
methods for antimicrobial susceptibility testing. In micro dilution tests,
microorganisms are tested for their ability to produce visible growth in
micro titration plate wells of broth (broth micro dilution) containing serial
dilutions of the antimicrobial agents. The MIC is defined as the lowest
concentration of an antimicrobial agent that inhibits the growth of a
microorganism [15].
1.5. Novelty
A number of studies have indicated that various complexes are formed in
the adsorption of arsenic. No previous studies worked at adsorption of
arsenic by SG2P. Although the antibacterial activity of numerous
materials against Escherichia coli (ATCC25922) and Staphylococcus
aureus (ATCC25932) was studied ,there is no previous research about the
antibacterial activity of SG2P in both mentioned bacteria.
This research studies the adsorption of arsenic by SG2P in various
standards and the antimicrobial activity of SG2P.
1.6. Hypothesis
This study was related to the hypothesis that the silica surface containing
functionalized groups (SG2P as the example) that able to adsorb certain
amounts of the heavy metal from aqueous solutions and that any new
chemical may have antibacterial activity.
9
1.7. Objectives
The objective of this research was to determine the ability of SG2P to
remove arsenic from aqueous solution. This includes investigating the
optimum conditions of SG2P such as pH, temperature, adsorption time,
binding capacity, concentration of metal ions, and effect of other
competing ions. The kinetics of the adsorption process, as well as, the
adsorption isotherms that would be explored.
In the biological part, the objective was to find out if the studied SG2P
material had any antibacterial activity against Escherichia coli
(ATCC25922) and Staphylococcus aureus (ATCC25932).
1.8. Previous study
One study investigated the functionalized SIO2 in adsorption of Hg+2, Pb2+,
Cu2+ and Zn2+ from aqueous solution. The results showed the maximum
adsorption capacity of 25.07mg/g was assigned to Hg+2 , with the optimal
contact time about 5 minute, whereas other metal ions are less well
extracted (Pb2+ and Cu2+ ) or not extracted (Zn2+ ) [16].
Another study showed that various complexes are formed in the adsorption
of As(V) on ferrihydrite , the result showed that the arsenic(V) is adsorbed
to ferrihydrite as a strongly bonded inner-sphere complex with either
monodentate or bidentate attachment. It has also been reported that
monodentate attachment predominates near the optimal pH of 4 to 5 for
adsorption [17].
10
One of the studies investigated the adsorption of arsenic (III) on
ferrihydritehas at the optimal pH. In this case, adsorption occurs at pH of 8 to
9 [18].
Another study determined the adsorption of As (V), from aqueous
solutions. The study was carried out on the adsorption of As (V) as a function
of pH, contact time, initial concentration, and ionic strength. Maximum
adsorption occurred at pH 3.0. The adsorption capacity did not change
significantly with increasing ionic strength. A kinetics study revealed that
adsorption of As (V) by the goethite/silica nano-composite was rapid:
Equilibrium was reached within 120 min. Adsorption kinetics followed a
pseudo-second-order kinetic model. The adsorption data were analyzed by
both the Langmuir and Freundlich isotherm models. The maximum adsorption
capacity of goethite/silica nanocomposite for As (V) from the Langmuir
isotherm was 17.64 mg per ml [19].
In one of the previous studies, the paper investigated the antimicrobial
properties of a novel silver-silica nanocomposite material, the results
showed that the MICs of silver nitrate varied from 3.9 to 31.2 μg/ml
(corresponding to 2.4 to 19.8 μg Ag/ml), and the MICs of silver zeolite
ranged from 3.9 to 31.2 μg/ml (corresponding to 2 to 12 μg Ag/ml) [20].

11
Chapter Two
Methodology
12
Chapter Two
Methodology
2.1. Chemistry part
2.1.1. Preparation of arsenic(III)solution
As2O3 (arsenic oxide: 197.841 g/mol) was used to prepare 1000ppm arsenic
solution: about 0.222g of As2O3 was weighted and HCL drops were added
until the amount was dissolved, then the solution was transfer to a 1000 ml
flask. In separate flasks, concentrations were prepared, which where 10
ppb, 20ppb, 30ppb,40ppb and 60ppb.
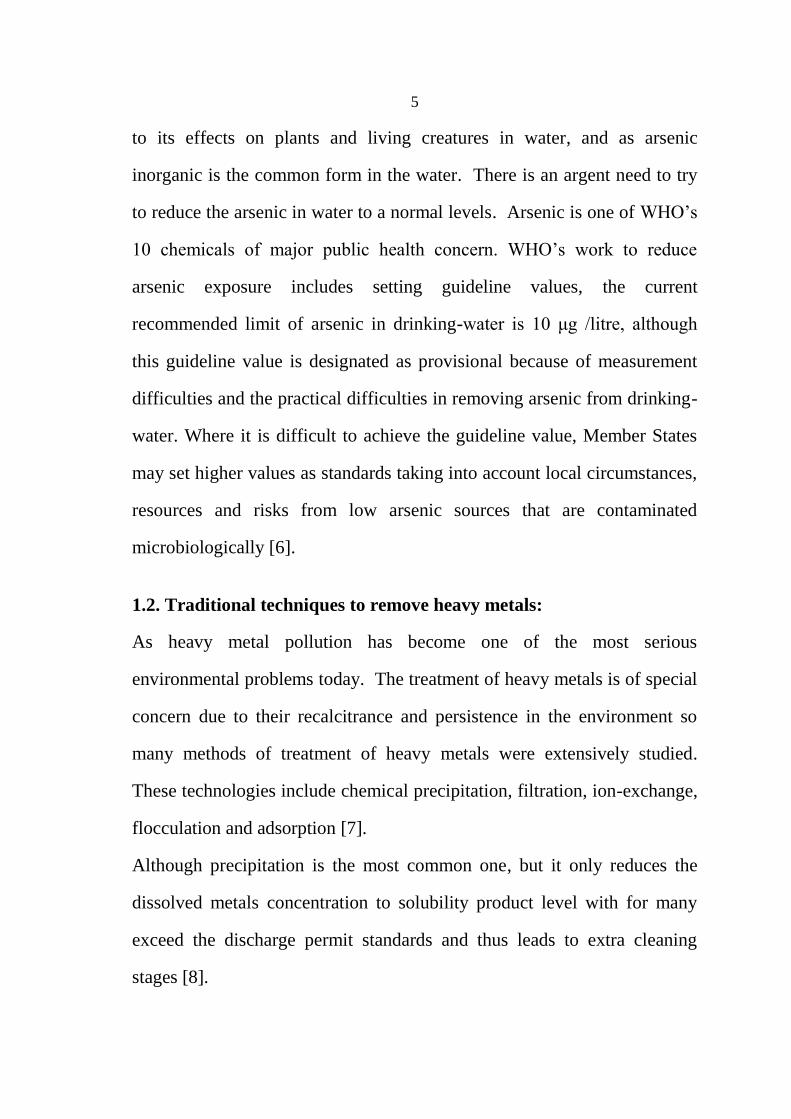
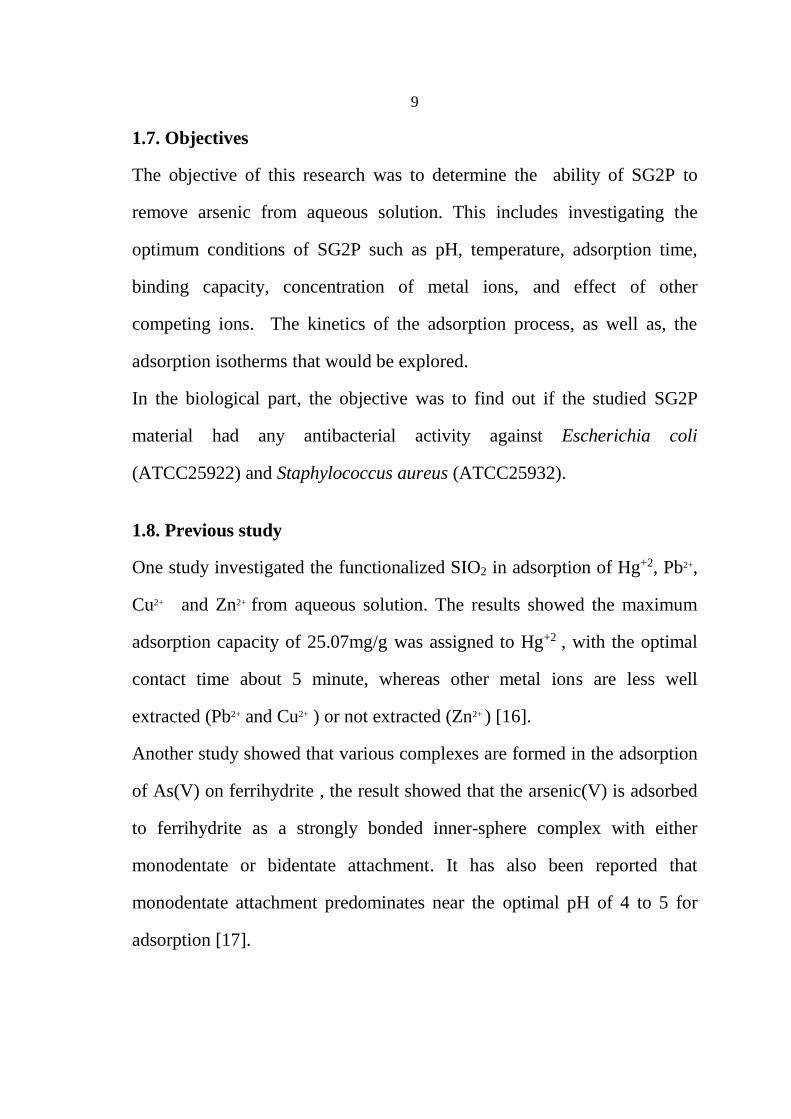
2.1.2. Preparation of calibration curves
A fresh 50 ppm metal ion solution was prepared daily by successive
dilution of the stock 1000 ppm solution. Then 10, 20, 30, 40 and 60 ppb
solutions were prepared by diluting 3, 6, 9 and 12 mL, respectively from
the 50 ppm standard solution into 100 mL volumetric flasks. Volumetric
flasks were soaking in 0.1 M HNO3 before used. The concentration of the
metal ion was followed by measuring the absorbance of the solution by
flame atomic absorption spectrometry (FAAS). A calibration curve of
absorbance versus concentration was constructed at the time of analysis.
Calibration coefficient (R²) was at least 0.983 for all analyses. Deionized
water was aspirated into the instrument before and after the analysis of
each sample to prevent interferences.
13
Figure 1: Linear calibration curve of absorbance vs. concentration for As (III)
concentrations in the range 10-60 µg/L.
2.1.3. Metal quantification
The amount of metal ions that was sorbed and the percent removal of metal
ion by adsorbent were calculated by applying equations 1 and 2,
respectively:
𝑞 = ( 𝐶𝑜 – 𝐶𝑓)÷ 𝑚 .𝑉 (1)
% 𝑅𝑒𝑚𝑜𝑣𝑎𝑙 = (𝐶𝑜 – 𝐶𝑓) ÷ 𝐶𝑜 .100 (2)
Where q is the amount of metal ion sorbed by the adsorbent (mg/g); 𝐶0 is
the initial metal ion concentration; (mg/L), 𝐶𝑓 is the final ion concentration
(mg/L) after the chemo-sorption occurred, V is the volume of aqueous
solution (L) in contact with the adsorbent, and m is the mass (g) of
adsorbent.
y = 0.0082x + 0.0199R² = 0.9839
0
0.1
0.2
0.3
0.4
0.5
0.6
0 20 40 60 80
Ab
sorb
ance
conc (µg ∕ L)
calibration curve-As(III)
Linear (calibration curve-As(III))
14
2.1.4. Instrumentation
1. (ICE 3000 SERIES, Thermo Scientific) Flame atomic absorption
spectrometer with acetylene-air flame was used for absorption
measurements.
2. JENWAY (3510) pH Meter was used to measure pH.
3. (Centurion, Scientific Ltd) Centrifuge was used for separation.
4. Shaking water bath. Incubator (EN500, nüve).
2.1.5. Studied parameters
2.1.5.1. The temperature effect
The effect of temperature was investigated at different degrees, 25, 35, 45
and 55 ºC. For each temperature, a 0.02 g adsorbent (SG2P) samples was
added to 10 mL of As(III) solutions with concentration of 10 µg/L at pH
around 6. Each mixture was placed in shaking water bath (JLabtech) for 30
min. After that the adsorbent was separated by centrifuging at 600 rpm
and supernatant was tested by flame atomic absorption for the residual
concentration of As(III) at 193.7 nm wavelength.
2.1.5.2. Experiment (2) Effect of pH
Effect of initial pH on adsorption of As (III) onto SG2P was investigated in
the pH range 1-12. The pH ranges were adjusted by either adding 0.1 M
HCl or 0.1 M NaOH. For each test tube 0.02 g adsorbent samples were
added to 10 mL of As(III) solutions with concentration of 10 µg/L. The
mixtures were placed in shaking water bath at constant temperature (25°C)
15
for 30 min. At the end of time interval, the adsorbent was separated by
centrifuging at 600 rpm and supernatant was analyzed by flame atomic
absorption for the residual concentration of As (III) at 193.7 nm
wavelength.
2.1.5.3. Experiment (3) Effect of initial concentration of As (III)
Solutions with concentrations of 10, 20, 30, 40 and 60 ppb were
preparedfrom the stock solution to find out the optimum concentration. A
weight of 0.02 g of adsorbent(SG2P) was added to a number of tubes
contains 10 mL of the previous concentrations of As(III) solutions under
optimized temperature (25ºC) and pH 6 for 30 min, the absorbance of the
solution above the solid residue was measured by flame atomic absorption
at 193.7 nm.
2.1.5.4. Experiment (4) Effect of adsorbent dose
In order to find out the optimum adsorbent dose, 0.020, 0.040, 0.10, 0.15 g
and of adsorbent(SG2P) were added to five tubes contains 10 mL of
10µg/L As(III) solution at pH 6. The mixtures were placed in shaking
water bath at constant temperature (25°C) for 30 min. The absorbance of
the solution above the solid residue was measured by flame atomic
absorption at 193.7 nm for the residual concentration of As (III).
2.1.5.5. Experiment (5) Optimization of contact time
The binding time intervals studied were 5,15,40 and 180 minutes, for
studying the time effect on adsorption, 0.02 g adsorbent (SG2P) samples
16
were added to 10 mL of As (III) solutions with concentration of 10 µg/L at
pH around 6. Each mixture was placed in Shaking Water Bath (JLabtech)
at room temperature (25°C) for 30 min. At the end of each time interval,
the adsorbent was separated by centrifuging at 600 rpm and supernatant
was tested by Flame Atomic Absorption for the residual concentration of
As (III) at 193.7 nm wavelength.
2.2. Biological part (antibacterial activity)
Micro-broth dilution method was used to determine antibacterial activity
and minimum inhibitory concentrations (MIC) of SG2P against two
bacterial reference strains. The reference bacterial stains were Escherichia
coli (ATCC25922) and Staphylococcus aureus (ATCC25932). The
included bacterial reference strains were obtained from American Type
Culture Collection (ATCC).
2.2.1 Media preparation
A weight of 4.4g of Mueller Hinton II Broth (USA) was added to 200 ml of
distilled water. The mixture was heated until the media was dissolved
completely. Broth was pipetted in tubes, which were covered with cotton
plugs and sterilized by an autoclave.
2.2.2 Adsorbent substance (SG2P) solution preparation
A 50% DMSO solution was prepared with distilled water. Adsorbent
powder (0.01g) was dissolved in a 50% DMSO.
17
2.2.3 Bacterial suspension preparation
With a sterile loop fresh bacterial isolate (Escherichia coli or
Staphylococcus aureus) was sub cultured into 5 ml Mueller Hinton II broth
(MHB). The turbidity of bacterial suspension in MHB was adjusted to be
equivalent to 0.5 McFarland standards (bacterial concentration is 1.5×10⁸
CFU/ml). The solution was then diluted 1:3 with MHB to have 5×10⁷ CFU/
ml bacterial concentration.
2.2.4. Minimum inhibitory concentration procedure
Using a micropipette, 100 µl of Mueller Hinton broth (MHB) was pipetted
into each well in a micro titer plate. Then 100 µl of adsorbent substances
was transferred to first well and the contents were mixed. A volume of 100
µl of mixture was transferred to following well and mixed before
transferring 100 µl to next well. This dilution was repeated until well
number 11, from which 100 µl was discharged after mixing. Well number
11 was considered the negative control of bacterial growth, where as well
number 12 contained only MHB and was considered as positive control of
bacterial growth. This procedure was applied in the first four rows (A, B,
C, D) . In the other hand in the remains four rows (E, F, G, H), a serial
dilution of 50% DMSO was prepared in parallel to detect antibacterial
activity of DMSO. Then 1 µl of bacterial suspension (5×10⁷ CFU/ ml) was
transferred to each well except well number 11 (negative control of
bacterial growth). Inoculated plates were incubated at 35 °C for 18 hours.
Each substance was examined in duplicate. The lowest concentration of
examined substance that inhibited visible bacterial growth was considered
the MIC.
18
Chapter Three
Results and Discussion
19
Chapter Three
Results and Discussion
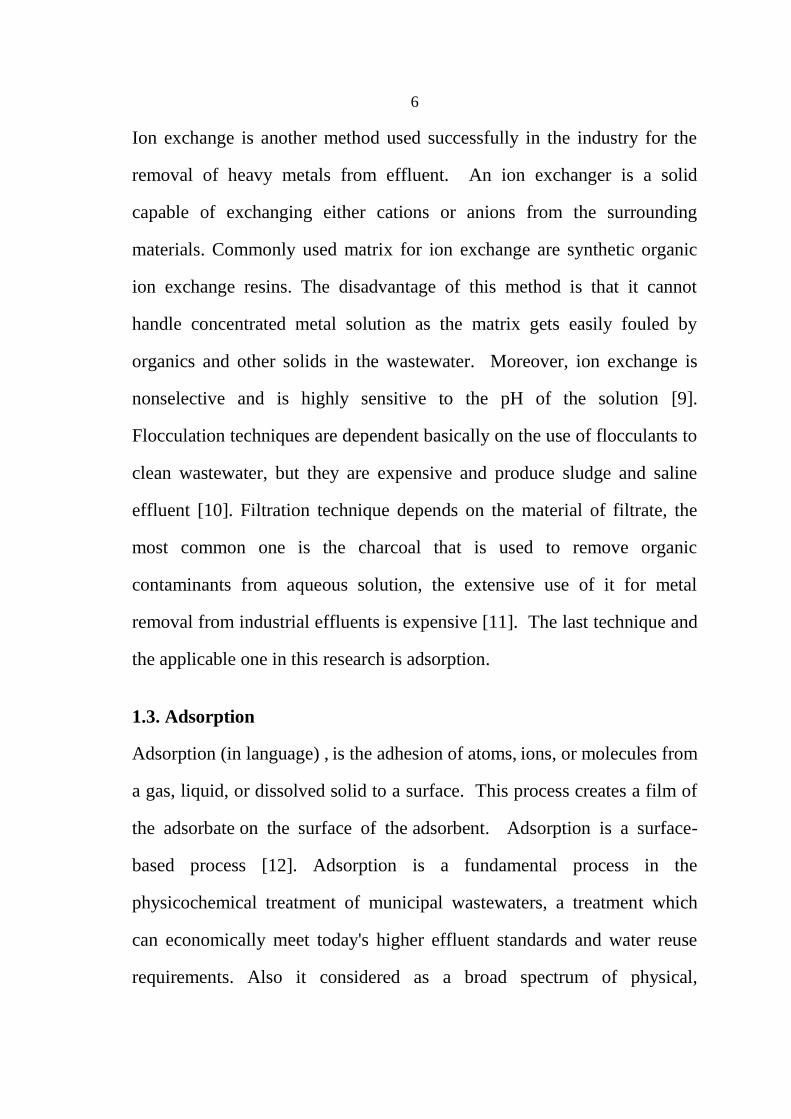
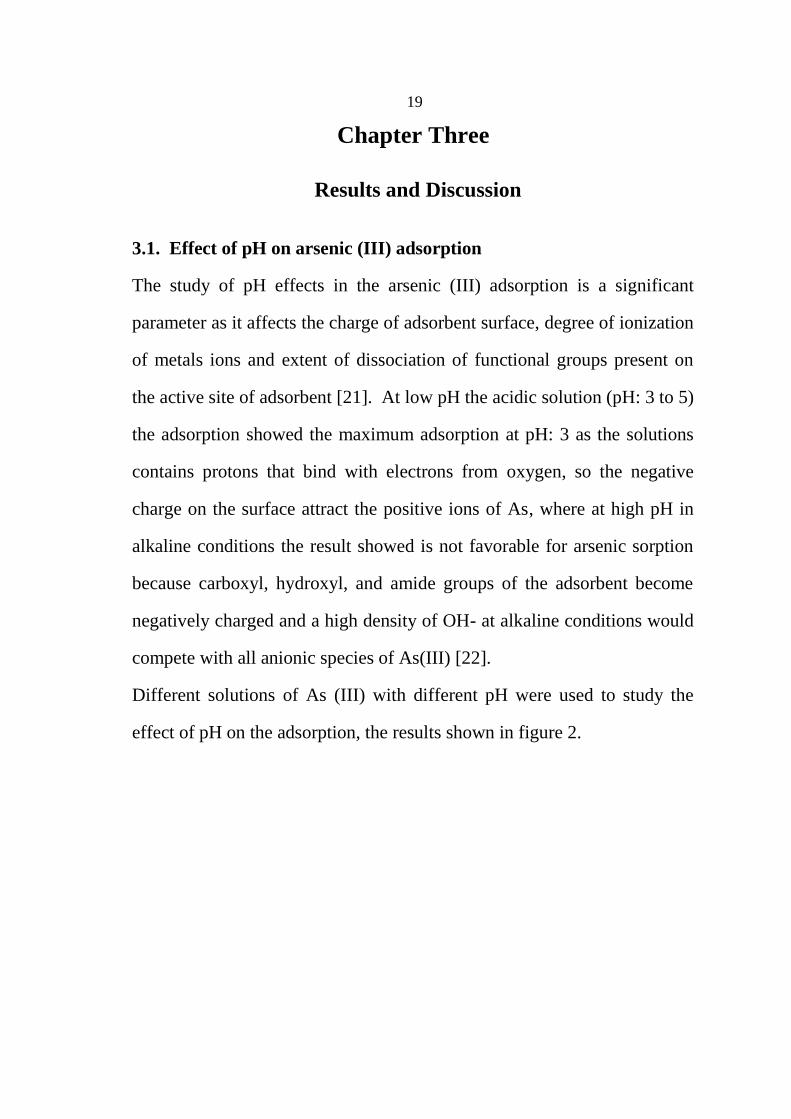
3.1. Effect of pH on arsenic (III) adsorption
The study of pH effects in the arsenic (III) adsorption is a significant
parameter as it affects the charge of adsorbent surface, degree of ionization
of metals ions and extent of dissociation of functional groups present on
the active site of adsorbent [21]. At low pH the acidic solution (pH: 3 to 5)
the adsorption showed the maximum adsorption at pH: 3 as the solutions
contains protons that bind with electrons from oxygen, so the negative
charge on the surface attract the positive ions of As, where at high pH in
alkaline conditions the result showed is not favorable for arsenic sorption
because carboxyl, hydroxyl, and amide groups of the adsorbent become
negatively charged and a high density of OH- at alkaline conditions would
compete with all anionic species of As(III) [22].
Different solutions of As (III) with different pH were used to study the
effect of pH on the adsorption, the results shown in figure 2.
20
Figure 2: pH effect on As (III) adsorption (Cₒ=10µg ∕ L, T=25ºC, adsorbent dose=
0.02g).
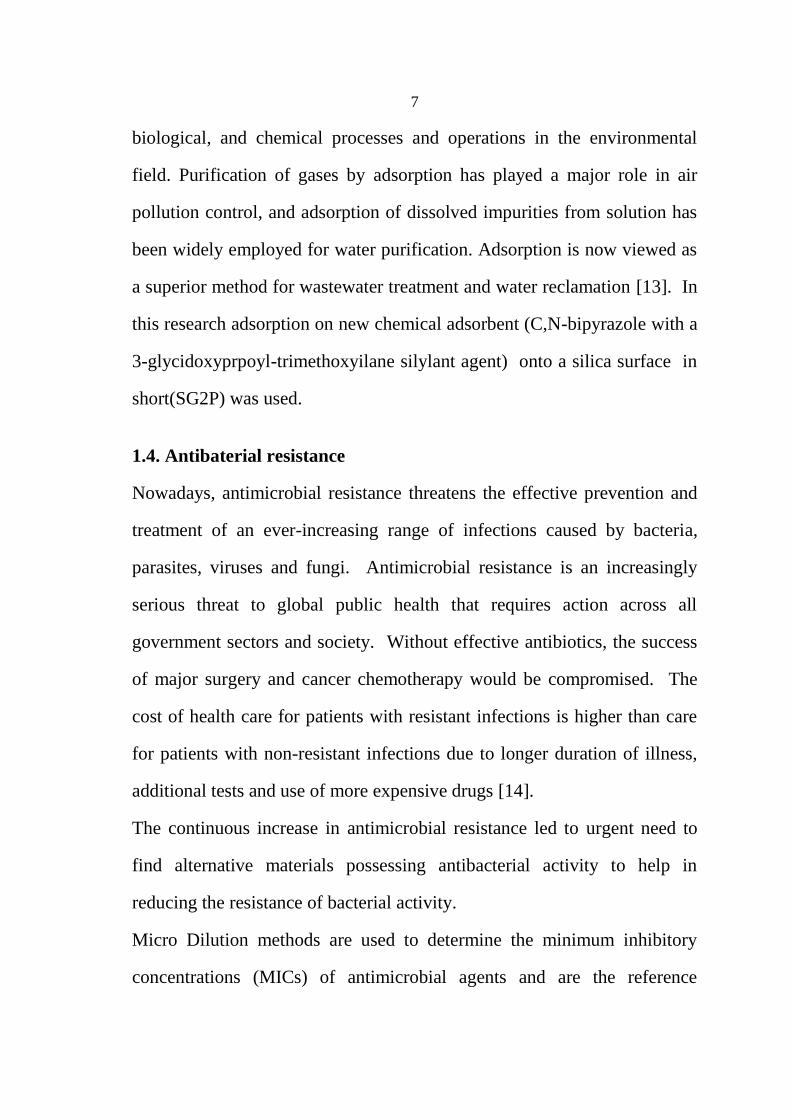
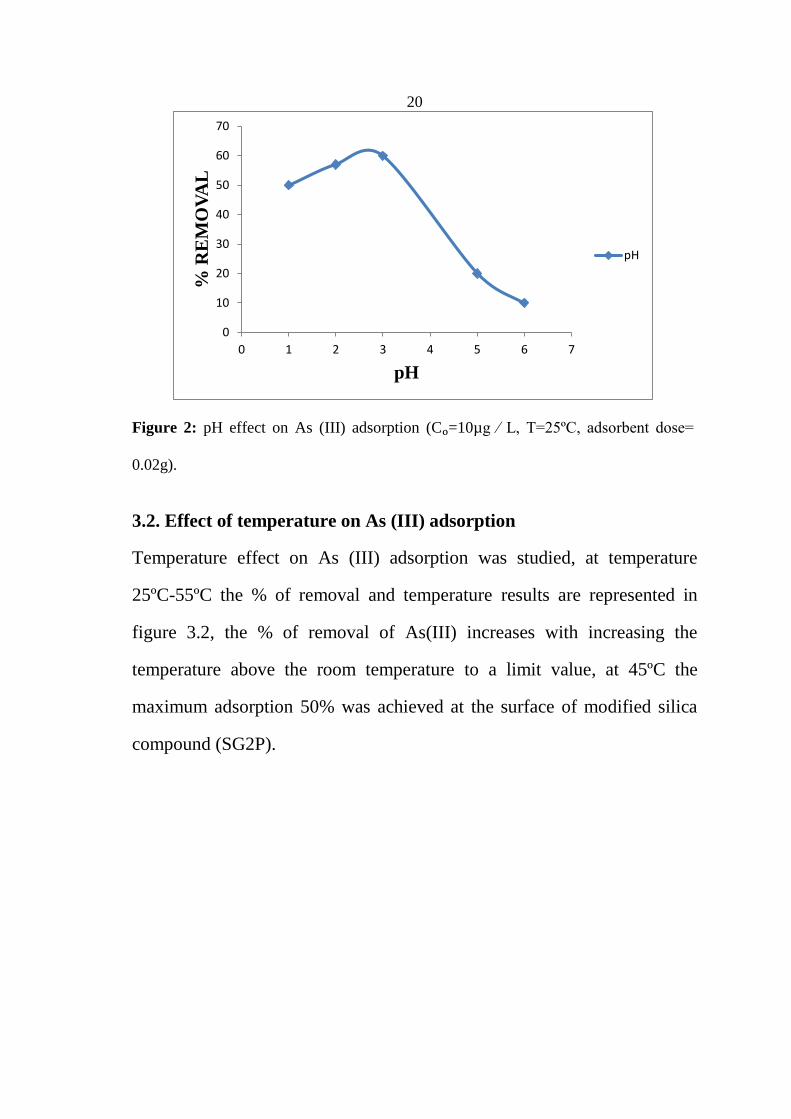
3.2. Effect of temperature on As (III) adsorption
Temperature effect on As (III) adsorption was studied, at temperature
25ºC-55ºC the % of removal and temperature results are represented in
figure 3.2, the % of removal of As(III) increases with increasing the
temperature above the room temperature to a limit value, at 45ºC the
maximum adsorption 50% was achieved at the surface of modified silica
compound (SG2P).
0
10
20
30
40
50
60
70
0 1 2 3 4 5 6 7
% R
EM
OV
AL
pH
pH
21
Figure 3: Effect of temperature on As(III) adsorption (Cₒ=10mg ∕ L, time=60min,
adsorbent dose=0.02gm) .
As expected, increasing temperature will results in increase in mobility of
large metal ions, which indicates that the adsorption process is
endothermic, leads to swelling effect within the internal structure of
adsorbent that in turn, encourages the metal ions to penetrate further and
increase in the kinetic energy of adsorbent particles that increase the
collision between adsorbent and adsorbate molecules results in enhancing
the removal of metals from adsorbent surface [23].
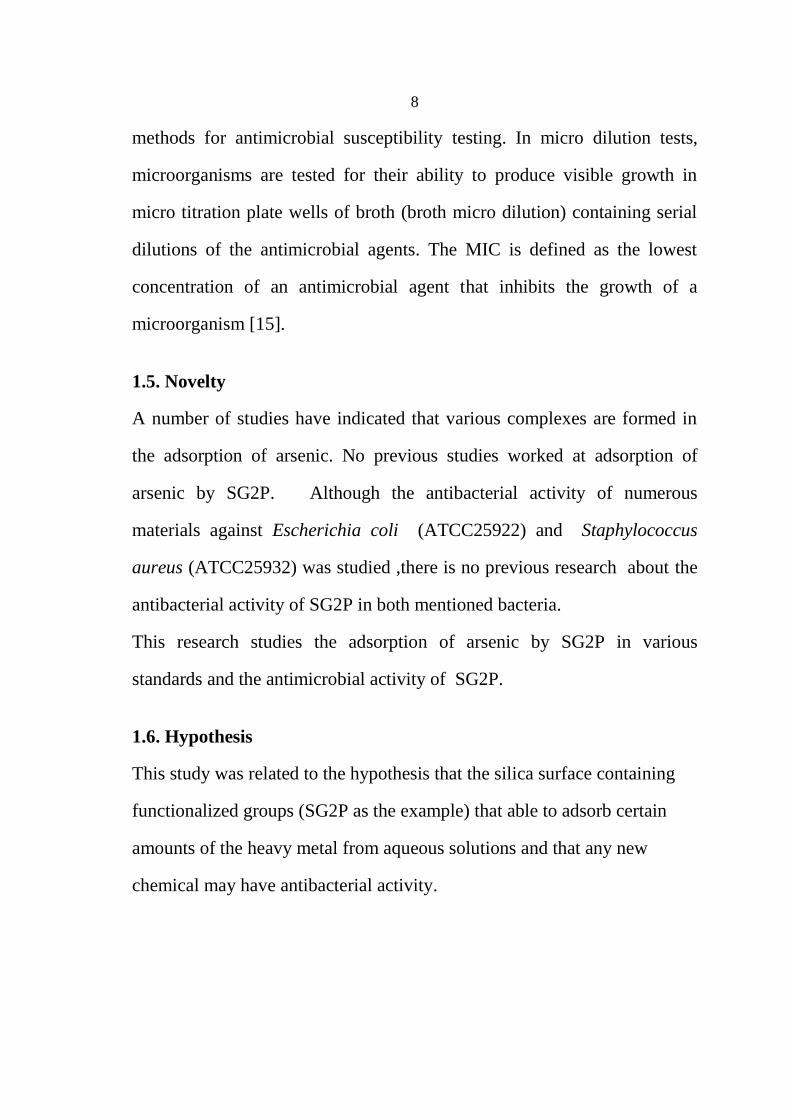
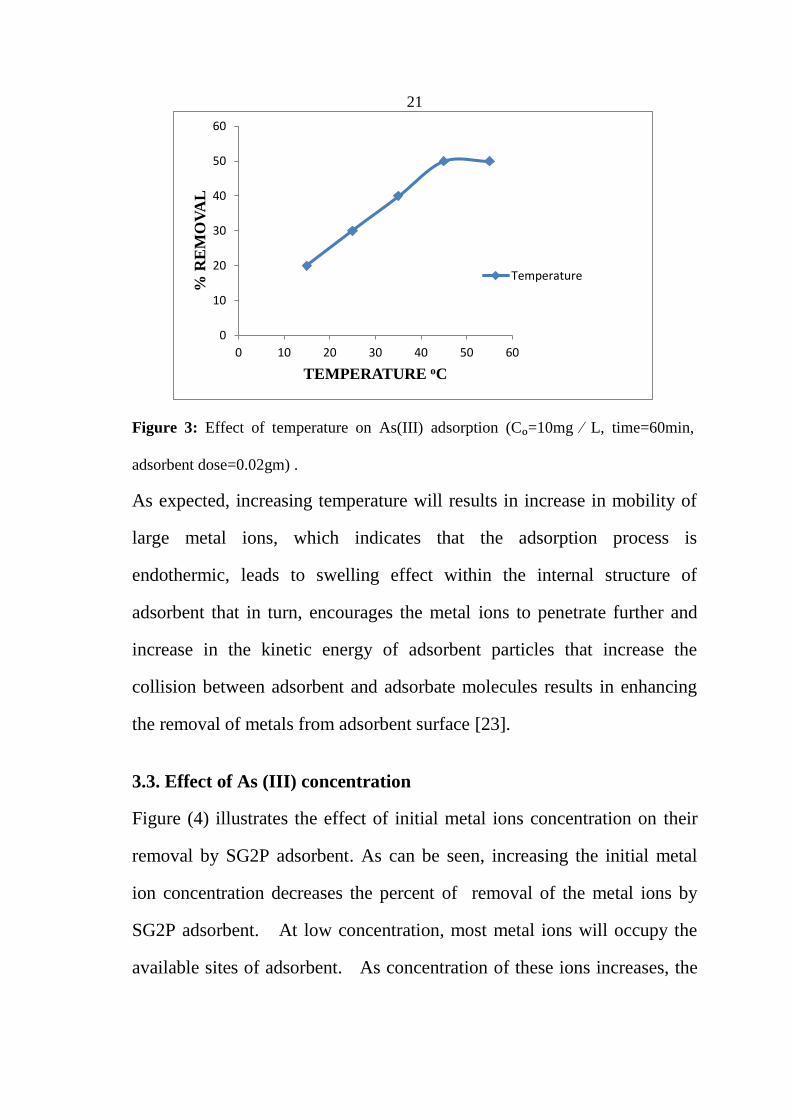
3.3. Effect of As (III) concentration
Figure (4) illustrates the effect of initial metal ions concentration on their
removal by SG2P adsorbent. As can be seen, increasing the initial metal
ion concentration decreases the percent of removal of the metal ions by
SG2P adsorbent. At low concentration, most metal ions will occupy the
available sites of adsorbent. As concentration of these ions increases, the
0
10
20
30
40
50
60
0 10 20 30 40 50 60
% R
EM
OV
AL
TEMPERATURE oC
Temperature
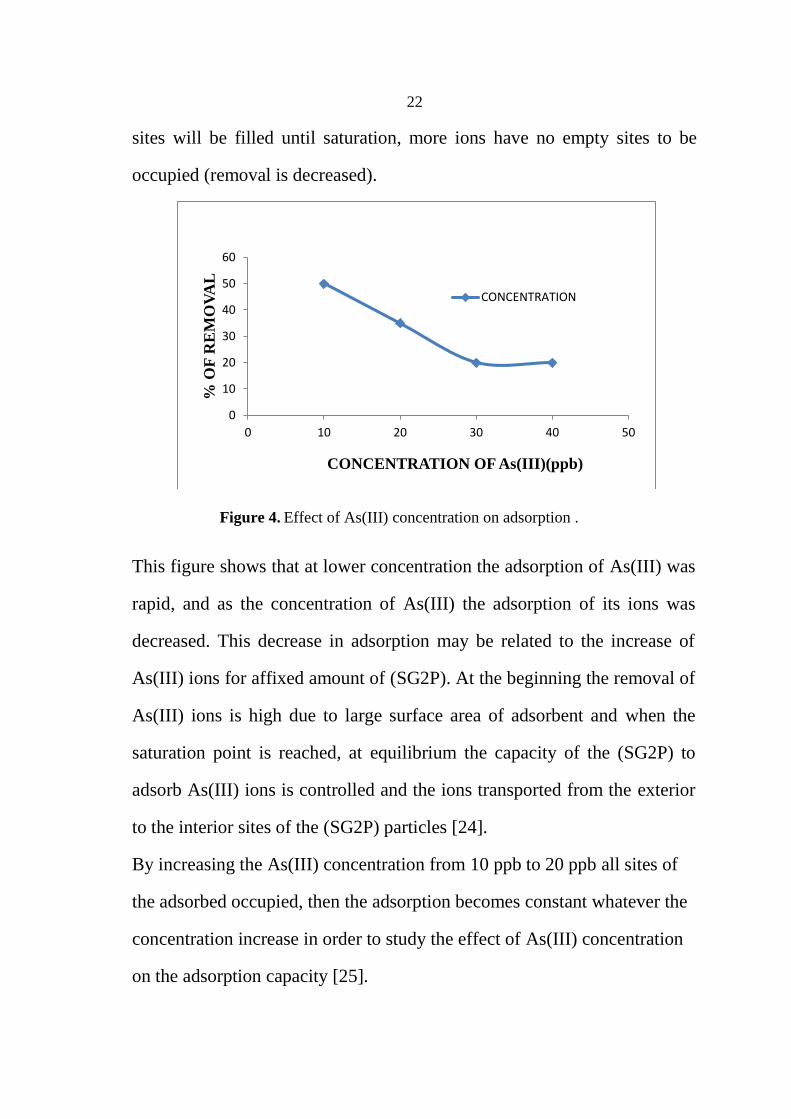
22
sites will be filled until saturation, more ions have no empty sites to be
occupied (removal is decreased).
Figure 4. Effect of As(III) concentration on adsorption .
This figure shows that at lower concentration the adsorption of As(III) was
rapid, and as the concentration of As(III) the adsorption of its ions was
decreased. This decrease in adsorption may be related to the increase of
As(III) ions for affixed amount of (SG2P). At the beginning the removal of
As(III) ions is high due to large surface area of adsorbent and when the
saturation point is reached, at equilibrium the capacity of the (SG2P) to
adsorb As(III) ions is controlled and the ions transported from the exterior
to the interior sites of the (SG2P) particles [24].
By increasing the As(III) concentration from 10 ppb to 20 ppb all sites of
the adsorbed occupied, then the adsorption becomes constant whatever the
concentration increase in order to study the effect of As(III) concentration
on the adsorption capacity [25].
0
10
20
30
40
50
60
0 10 20 30 40 50
% O
F R
EM
OV
AL
CONCENTRATION OF As(III)(ppb)
CONCENTRATION
23
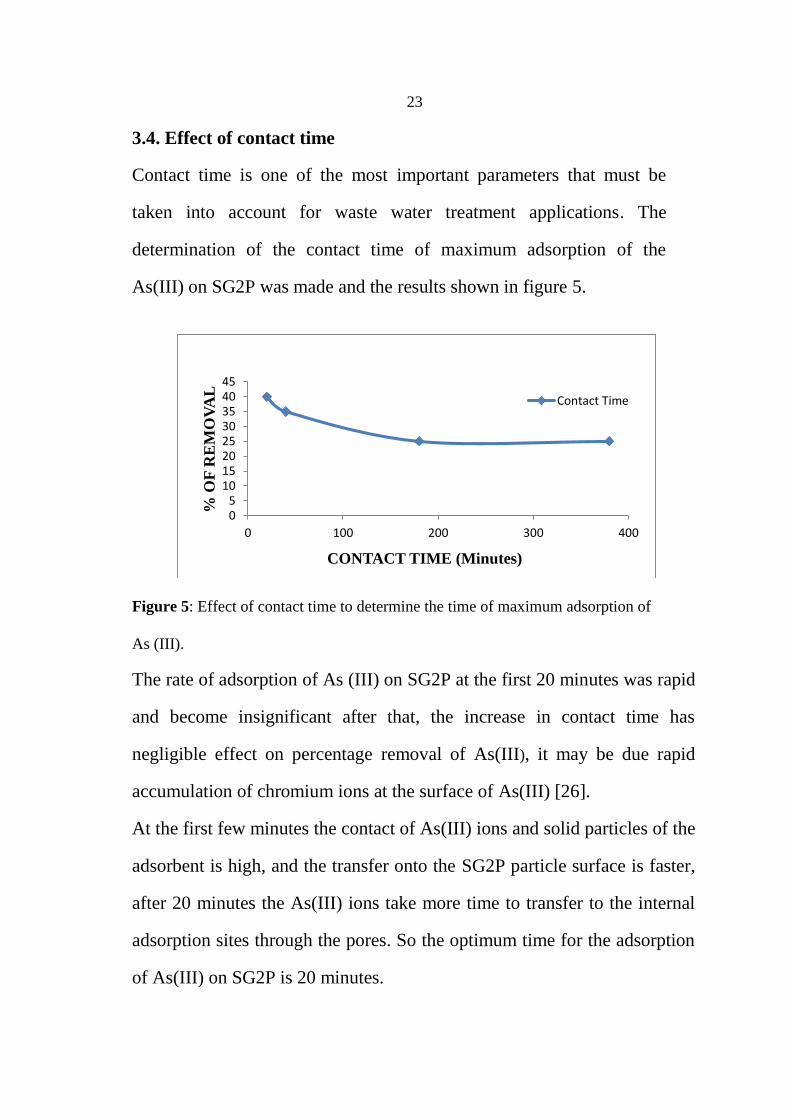
3.4. Effect of contact time
Contact time is one of the most important parameters that must be
taken into account for waste water treatment applications. The
determination of the contact time of maximum adsorption of the
As(III) on SG2P was made and the results shown in figure 5.
Figure 5: Effect of contact time to determine the time of maximum adsorption of
As (III).
The rate of adsorption of As (III) on SG2P at the first 20 minutes was rapid
and become insignificant after that, the increase in contact time has
negligible effect on percentage removal of As(III), it may be due rapid
accumulation of chromium ions at the surface of As(III) [26].
At the first few minutes the contact of As(III) ions and solid particles of the
adsorbent is high, and the transfer onto the SG2P particle surface is faster,
after 20 minutes the As(III) ions take more time to transfer to the internal
adsorption sites through the pores. So the optimum time for the adsorption
of As(III) on SG2P is 20 minutes.
05
1015202530354045
0 100 200 300 400
% O
F R
EM
OV
AL
CONTACT TIME (Minutes)
Contact Time
24
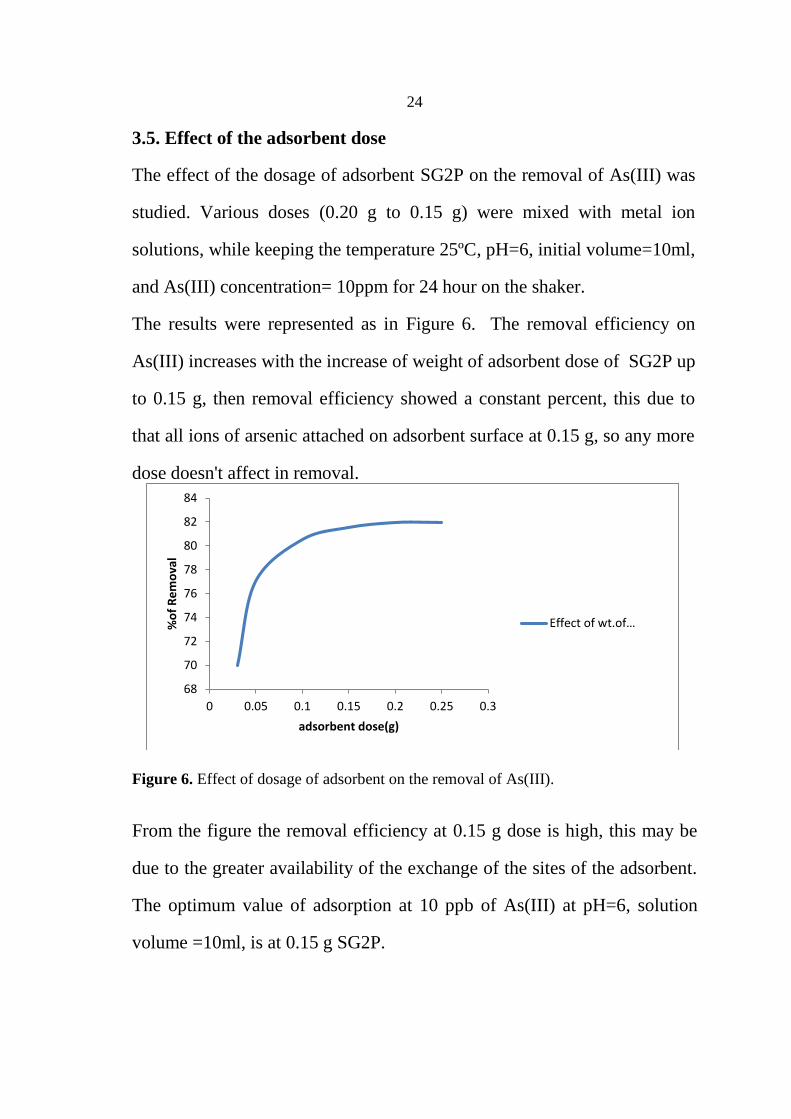
3.5. Effect of the adsorbent dose
The effect of the dosage of adsorbent SG2P on the removal of As(III) was
studied. Various doses (0.20 g to 0.15 g) were mixed with metal ion
solutions, while keeping the temperature 25ºC, pH=6, initial volume=10ml,
and As(III) concentration= 10ppm for 24 hour on the shaker.
The results were represented as in Figure 6. The removal efficiency on
As(III) increases with the increase of weight of adsorbent dose of SG2P up
to 0.15 g, then removal efficiency showed a constant percent, this due to
that all ions of arsenic attached on adsorbent surface at 0.15 g, so any more
dose doesn't affect in removal.
Figure 6. Effect of dosage of adsorbent on the removal of As(III).
From the figure the removal efficiency at 0.15 g dose is high, this may be
due to the greater availability of the exchange of the sites of the adsorbent.
The optimum value of adsorption at 10 ppb of As(III) at pH=6, solution
volume =10ml, is at 0.15 g SG2P.
68
70
72
74
76
78
80
82
84
0 0.05 0.1 0.15 0.2 0.25 0.3
%o
f R
em
ova
l
adsorbent dose(g)
Effect of wt.of…
25
3.6. Adsorption isotherm of As(III)
The process of removal of heavy metals from polluted aqueous solutions
using chemical adsobents is a physic-chemical process with uncontrolled
metabolic mechanism(s). Adsorption isotherms are used to explain the
equilibrium of metal ions that occurs between the solid phase of adsorbent
and the aqueous solution. These models might determine some kinetic and
thermodynamic parameters that can give a clearer image about the binding
mechanism. The more known non- linear models are Langmiur and
Freundlich isotherms.
Langmiur model suggests that the uptake of metal ion is monolayer
occurred on homogeneous surface with no different energies for all binding
sites and no interactions between adsorbed molecules [27].
In the other hand Freundlich model also suggests a monolayer uptake of
metal ion on a adsorbent. It differs from Langmiur in that it assumes that
the distribution of energy of the active binding sites the affinities of binding
sites of adsorbent to vary with these interactions; those with stronger
affinities are occupied first [28].
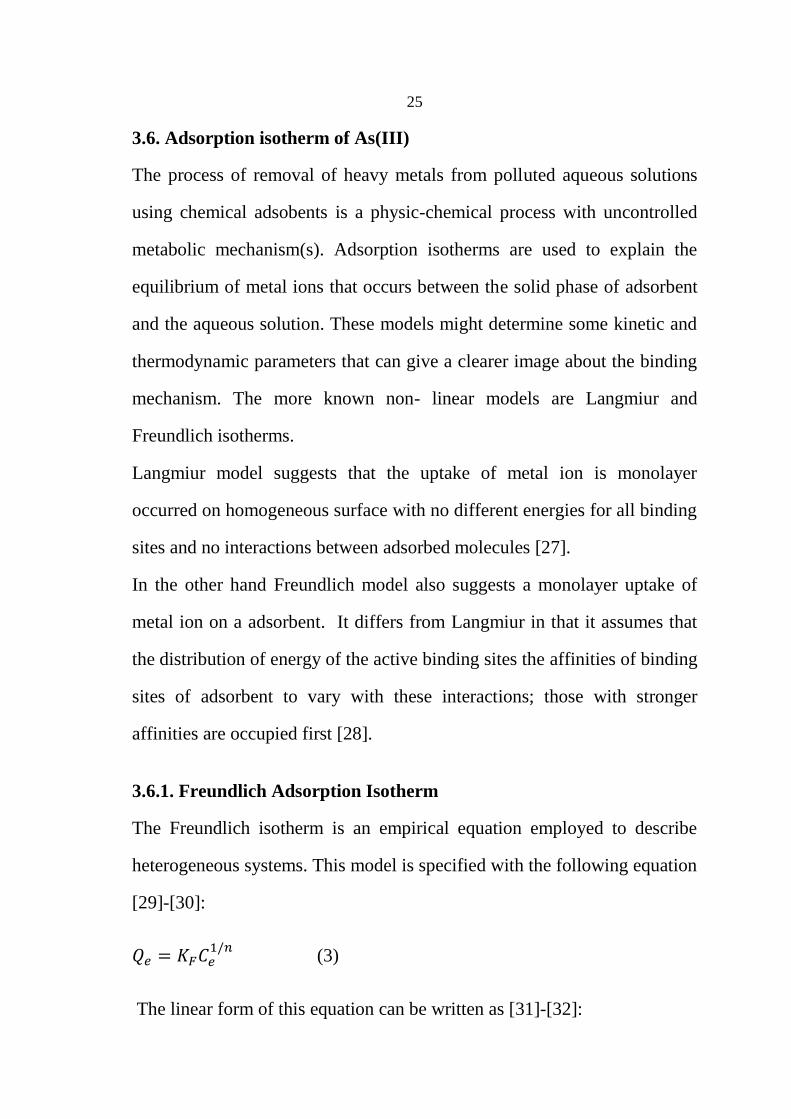
3.6.1. Freundlich Adsorption Isotherm
The Freundlich isotherm is an empirical equation employed to describe
heterogeneous systems. This model is specified with the following equation
[29]-[30]:
𝑄𝑒 = 𝐾𝐹𝐶𝑒1/𝑛
(3)
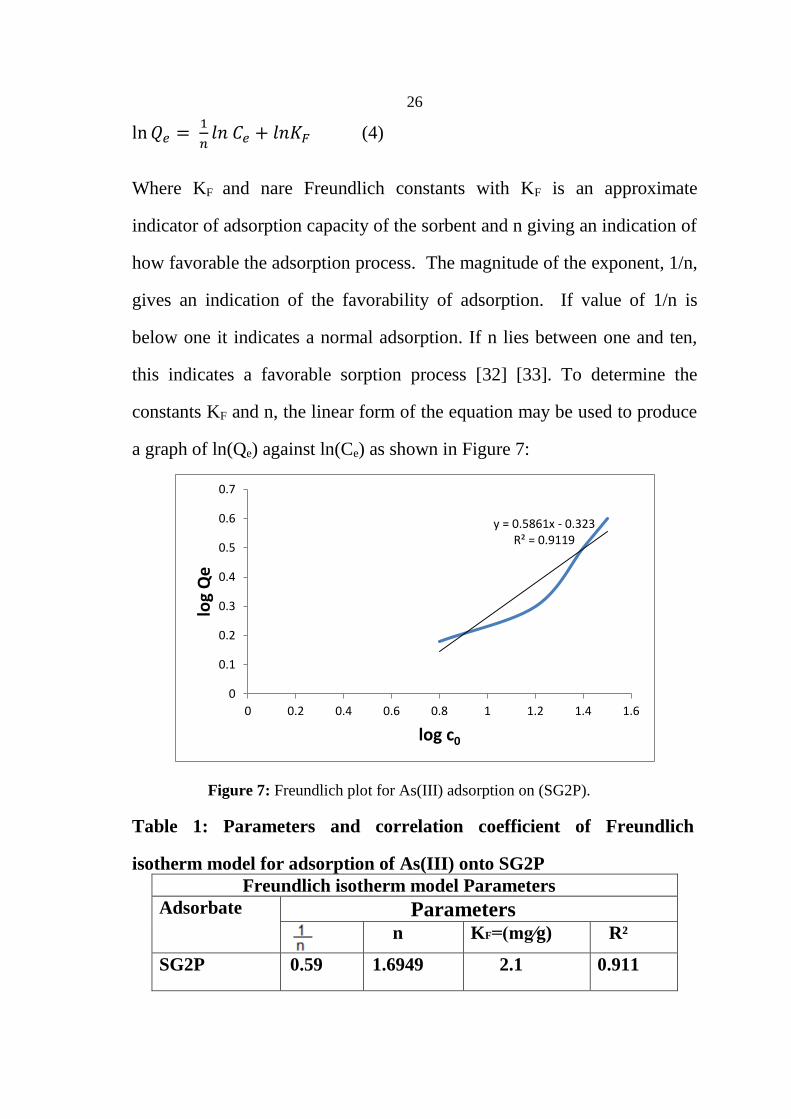
The linear form of this equation can be written as [31]-[32]:
26
ln 𝑄𝑒 = 1
𝑛𝑙𝑛 𝐶𝑒 + 𝑙𝑛𝐾𝐹 (4)
Where KF and nare Freundlich constants with KF is an approximate
indicator of adsorption capacity of the sorbent and n giving an indication of
how favorable the adsorption process. The magnitude of the exponent, 1/n,
gives an indication of the favorability of adsorption. If value of 1/n is
below one it indicates a normal adsorption. If n lies between one and ten,
this indicates a favorable sorption process [32] [33]. To determine the
constants KF and n, the linear form of the equation may be used to produce
a graph of ln(Qe) against ln(Ce) as shown in Figure 7:
Figure 7: Freundlich plot for As(III) adsorption on (SG2P).
Table 1: Parameters and correlation coefficient of Freundlich
isotherm model for adsorption of As(III) onto SG2P
Freundlich isotherm model Parameters
Adsorbate Parameters
n KF=(mg∕g) R²
SG2P 0.59 1.6949 2.1 0.911
y = 0.5861x - 0.323R² = 0.9119
0
0.1
0.2
0.3
0.4
0.5
0.6
0.7
0 0.2 0.4 0.6 0.8 1 1.2 1.4 1.6
log
Qe
log c0
27
From table 1 the values of n=1.6949 and 1 ∕ n=0.59 , as Freundlich
isotherm model these values indicate that, the sorption of As(III) on SG2P
is favorable and the R² value is 0.911.
3.6.2. Langmuir adsorption isotherm
This describes quantitatively the formation of a monolayer adsorbate on the
outer surface of the adsorbent, and after that no further adsorption takes
place. Thereby, the Langmuir represents the equilibrium distribution of MB
dye between the solid and liquid phases. The Langmuir isotherm is valid
for monolayer adsorption onto a surface containing a finite number of
identical sites. The model assumes uniform energies of adsorption onto the
surface and no transmigration of adsorbate in the plane of the surface.
Based upon these assumptions, Langmuir represented the following
equation [33]-[34]: 𝐶𝑒
𝑄𝑒=
1
𝑄𝑚𝐶𝑒 +
1
𝑄𝑚𝐾𝐿 (5)
Where:
Ce= the equilibrium concentration of adsorbate (mg/L)
Qe= the amount of As(III) adsorbed per gram of the adsorbent (mg/g)
Qm= maximum monolayer coverage capacity (mg/g)
KL= Langmuir isotherm constant (L/mg)
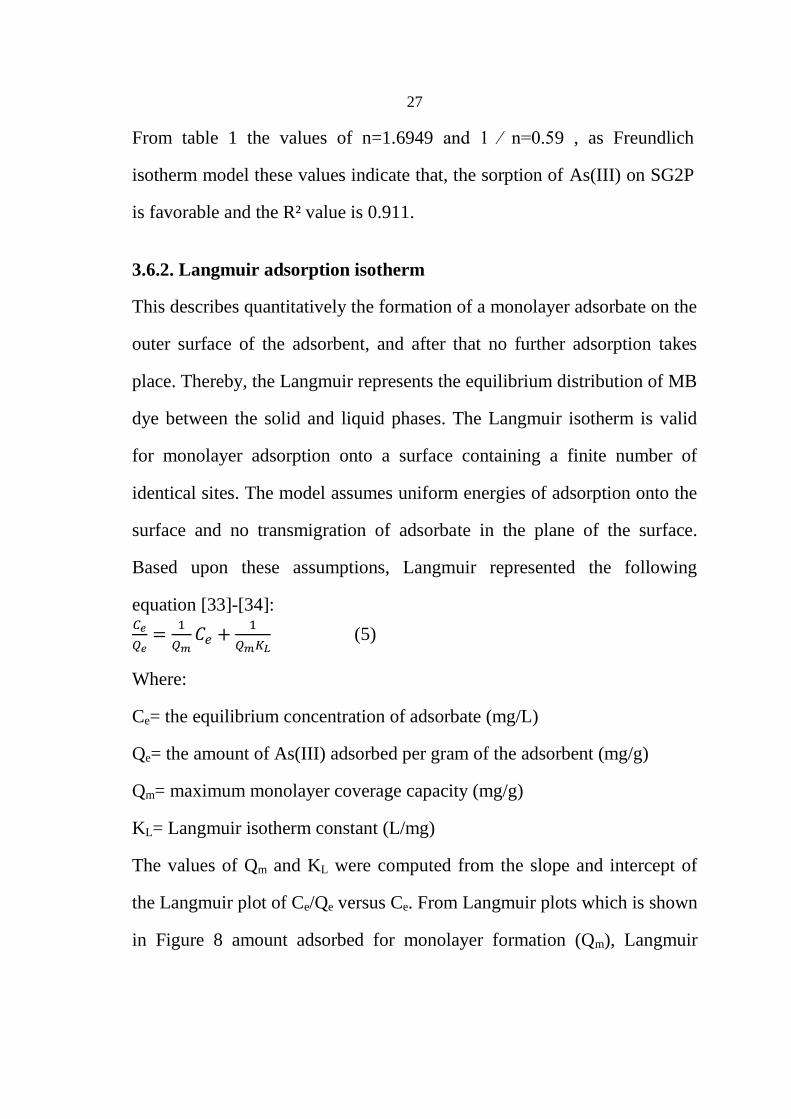
The values of Qm and KL were computed from the slope and intercept of
the Langmuir plot of Ce/Qe versus Ce. From Langmuir plots which is shown
in Figure 8 amount adsorbed for monolayer formation (Qm), Langmuir
28
adsorption-desorption equilibrium constant (KL) and regression constant
(R2) were determined and values are shown in Table
The adsorption capacity of SG2P was estimated by applying Langmuir
represented in the figure below:
Figure 8: Langmuir plot for As(III) adsorption on (SG2P).
Table 2: Parameters and correlation coefficient of Langmuir
isotherm model for adsorption of As(III) onto (SG2P)
Langmuir isotherm model parameters
Adsorbate Parameters
Qm(mg/g) KL=(L/mg) RL R²
SG2P 4.61 0.578 0.166 0.958
The essential characteristics of the Langmuir isotherm can be expressed in
terms of a dimensionless constant separation factor RL that is given by the
following equation [35]:
𝑅𝐿 =1
(1+𝐾𝐿𝐶𝑜) (6)
Where Co is the highest initial concentration of adsorbate (mg/L).
y = 0.22x + 1.73R² = 0.9584
0
0.5
1
1.5
2
2.5
3
3.5
4
0 2 4 6 8 10
C0
/Q
e(g
/L)
C0 (mg/l)
29
The value of RL indicates the shape of the isotherm to be either unfavorable
(RL> 1), linear (RL = 1), favorable (0 < RL< 1), or irreversible (RL = 0). The
RL values between 0 and 1 indicate favorable adsorption. The value of RL in
the present investigation was found to be 0.166 at 25 ◦C indicating that the
adsorption of As(III) dye on (SG2P) is favorable [35] [36].
3.7. Rate order of the adsorption process
Uptake of each metal ion from different initial concentrations of the metal
can be used to study the dependency of the rate of adsorption on the
concentration of metal ion left in solution. Thus, the reaction order of the
adsorption process can be determined.
Pseudo first- order equation was applied for evaluation the adsorption
kinetics for As(III) onto SG2P, the rate constant for the adsorption K1was
evaluated .
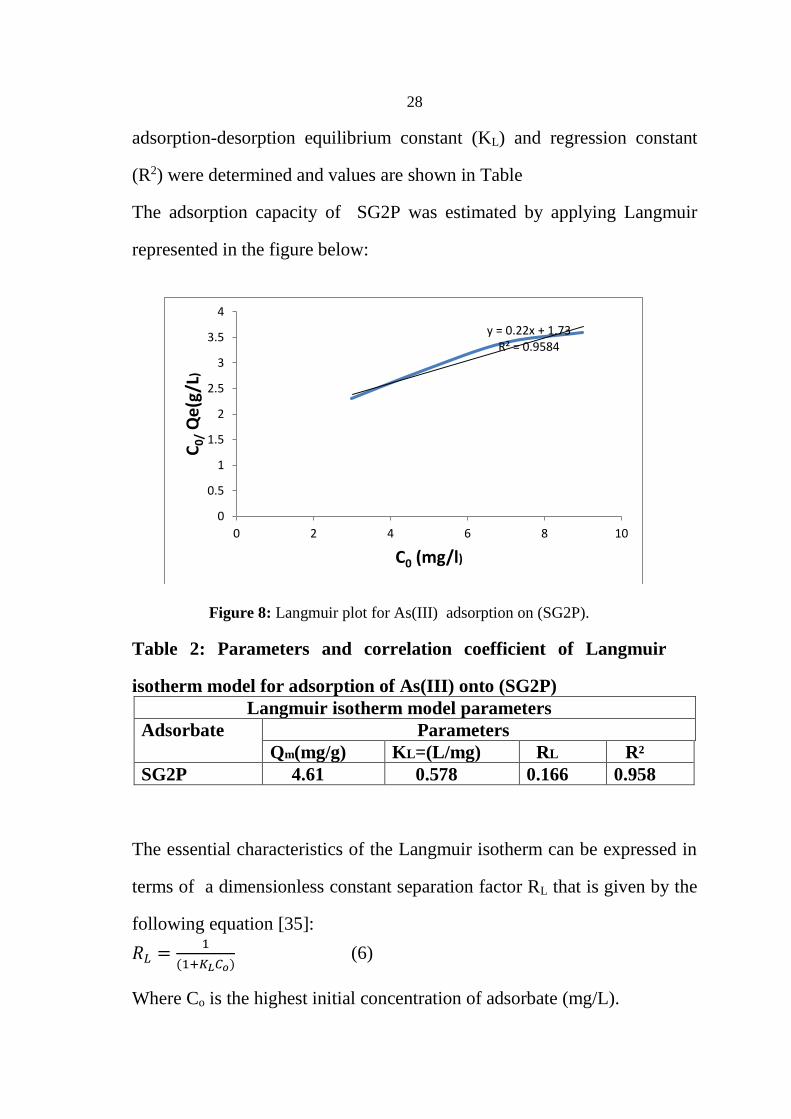
The pseudo first- order equation expressed as equation 4 :
log(𝑄𝑒 − 𝑄𝑡) = log 𝑄𝑒 − (𝐾1
2.303) 𝑡 ( 7)
Where Qe is the adsorption capacity of the SG2P at equilibrium (mg/g), Qt
is the amount of As(III) adsorbed at time t (mg/g) and K1 is the pseudo first
order rate constant (min−1).
A linear plot of log(Qe− Qt) against time allows to obtain the rate constant
(Figure: 9). If the plot was found to be linear with good correlation
coefficient, indicating that Lagergren’s equation is appropriate to As(III)
sorption on SG2P so the adsorption process is a pseudo first order process.
The Lagergren’s first order rate constant (K1) and Qe determined from the
30
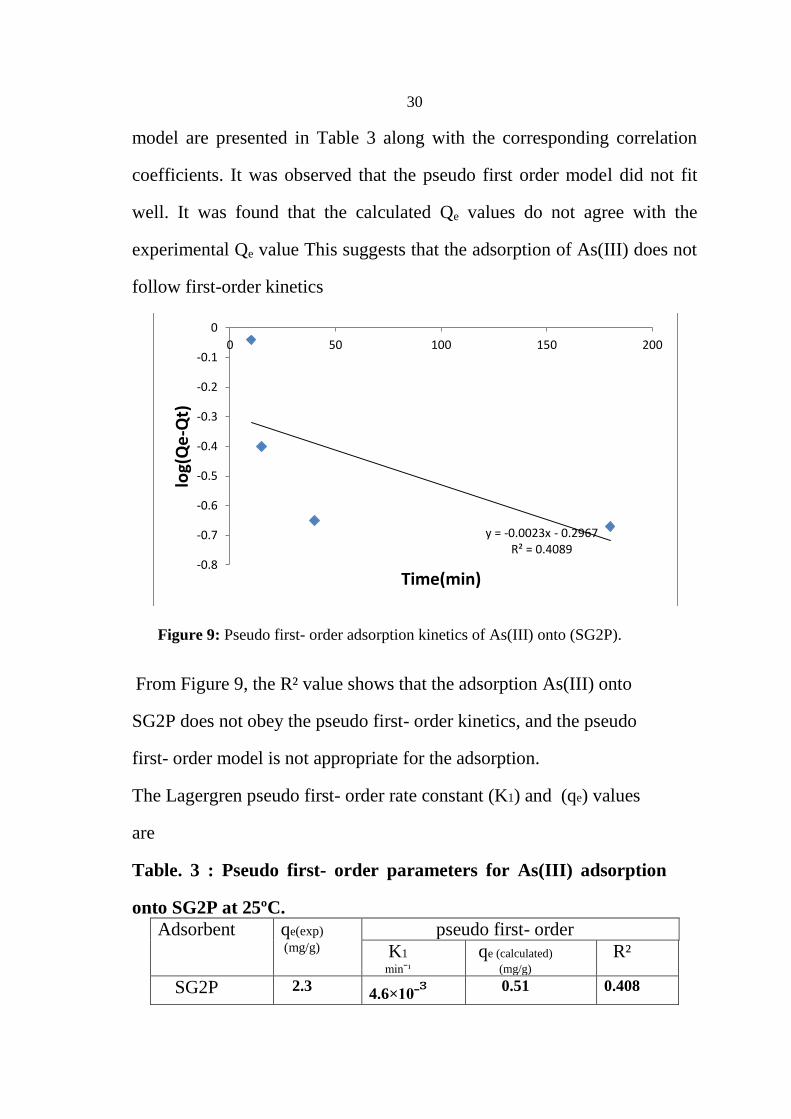
model are presented in Table 3 along with the corresponding correlation
coefficients. It was observed that the pseudo first order model did not fit
well. It was found that the calculated Qe values do not agree with the
experimental Qe value This suggests that the adsorption of As(III) does not
follow first-order kinetics
Figure 9: Pseudo first- order adsorption kinetics of As(III) onto (SG2P).
From Figure 9, the R² value shows that the adsorption As(III) onto
SG2P does not obey the pseudo first- order kinetics, and the pseudo
first- order model is not appropriate for the adsorption.
The Lagergren pseudo first- order rate constant (K1) and (qe) values
are
Table. 3 : Pseudo first- order parameters for As(III) adsorption
onto SG2P at 25ºC.
Adsorbent qe(exp)
(mg/g)
pseudo first- order
K1
minˉ¹ qe (calculated)
(mg/g) R²
SG2P 2.3 4.6×10ˉᶟ
0.51 0.408
y = -0.0023x - 0.2967R² = 0.4089
-0.8
-0.7
-0.6
-0.5
-0.4
-0.3
-0.2
-0.1
0
0 50 100 150 200
log(
Qe
-Qt)
Time(min)
31
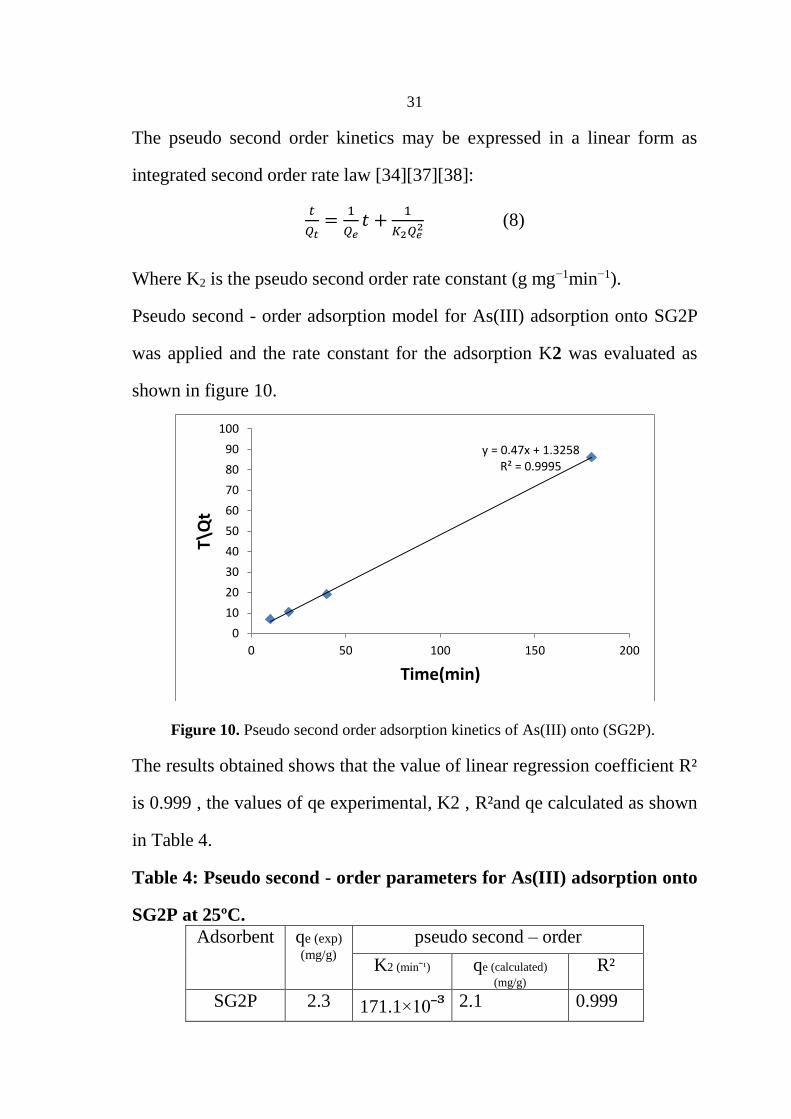
The pseudo second order kinetics may be expressed in a linear form as
integrated second order rate law [34][37][38]:
𝑡
𝑄𝑡=
1
𝑄𝑒𝑡 +
1
𝐾2𝑄𝑒2 (8)
Where K2 is the pseudo second order rate constant (g mg−1min−1).
Pseudo second - order adsorption model for As(III) adsorption onto SG2P
was applied and the rate constant for the adsorption K2 was evaluated as
shown in figure 10.
Figure 10. Pseudo second order adsorption kinetics of As(III) onto (SG2P).
The results obtained shows that the value of linear regression coefficient R²
is 0.999 , the values of qe experimental, K2 , R²and qe calculated as shown
in Table 4.
Table 4: Pseudo second - order parameters for As(III) adsorption onto
SG2P at 25ºC.
Adsorbent qe (exp)
(mg/g) pseudo second – order
K2 (minˉ¹) qe (calculated)
(mg/g) R²
SG2P 2.3 171.1×10ˉᶟ 2.1 0.999
y = 0.47x + 1.3258R² = 0.9995
0
10
20
30
40
50
60
70
80
90
100
0 50 100 150 200
T\Q
t
Time(min)
32
The results shows that the Pseudo second – order kinetic model perfect fit
with experimental data and the value of R²= 0.999, by comparing (qe)
experimental and (qe) calculated values from Table 4, there is agreement
between experimental and calculated values for pseudo second order
model, and K2 value greater than K1 value, so the pseudo second order
model is favorable model for As(III) adsorption onto SG2P.
3.8. Adsorption Thermodynamics:
Adsorption thermodynamics were determined using the thermodynamic
equilibrium coefficients obtained at different temperatures and
concentrations in order to verify possible adsorption mechanisms. The
adsorption characteristics of a material can be expressed in terms of
thermodynamic parameters such as ΔG (Gibbs free energy change), which
can be calculated by Equation[33][37]:
∆𝐺 = −𝑅𝑇𝑙𝑛𝐾𝑑 (9)
Where Kd is the thermodynamic equilibrium constant (L g-1).
According to thermodynamics, the Gibbs free energy is the difference
between the adsorption enthalpy (ΔH) and adsorption entropy (ΔS)
multiplied by the temperature. In this manner, by applying this concept to
Equation (9), the thermo chemical parameters ΔH and ΔS can be
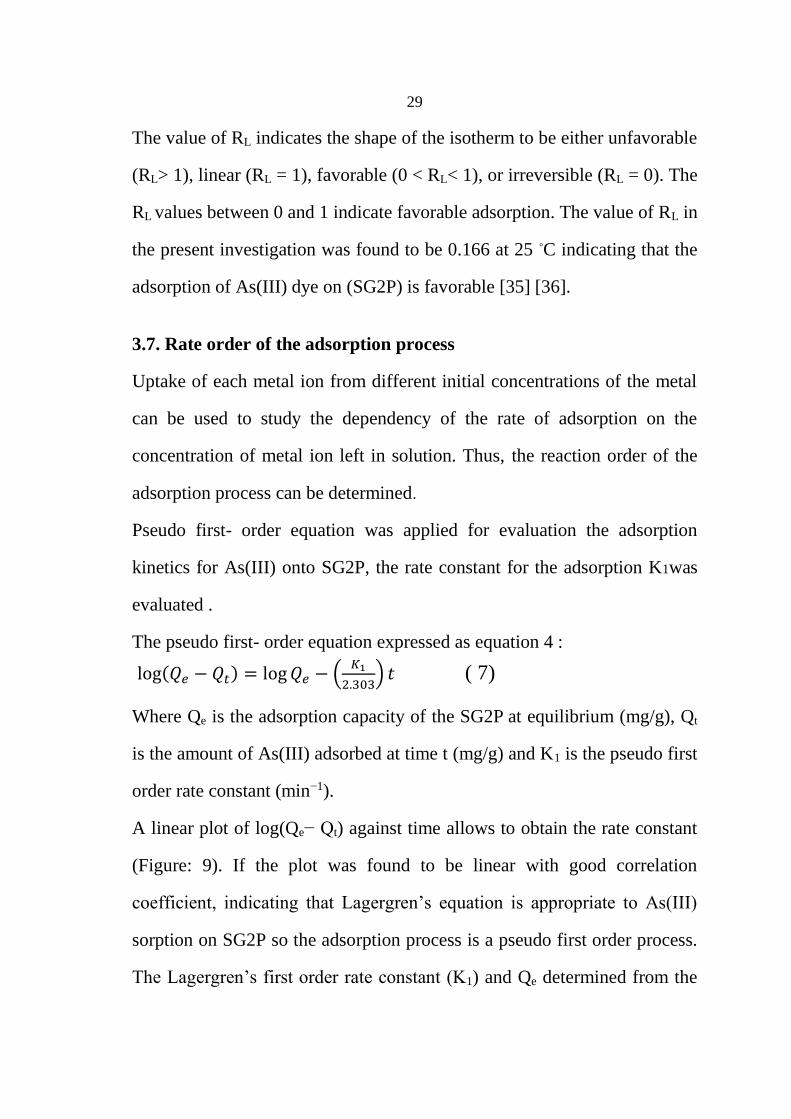
determined using Van’t Hoff’s plot (Figure 11) , according to Equation
(10)[39]:
𝑙𝑛𝐾𝑑 = −∆𝐻
𝑅𝑇+
∆𝑆
𝑅 (10)
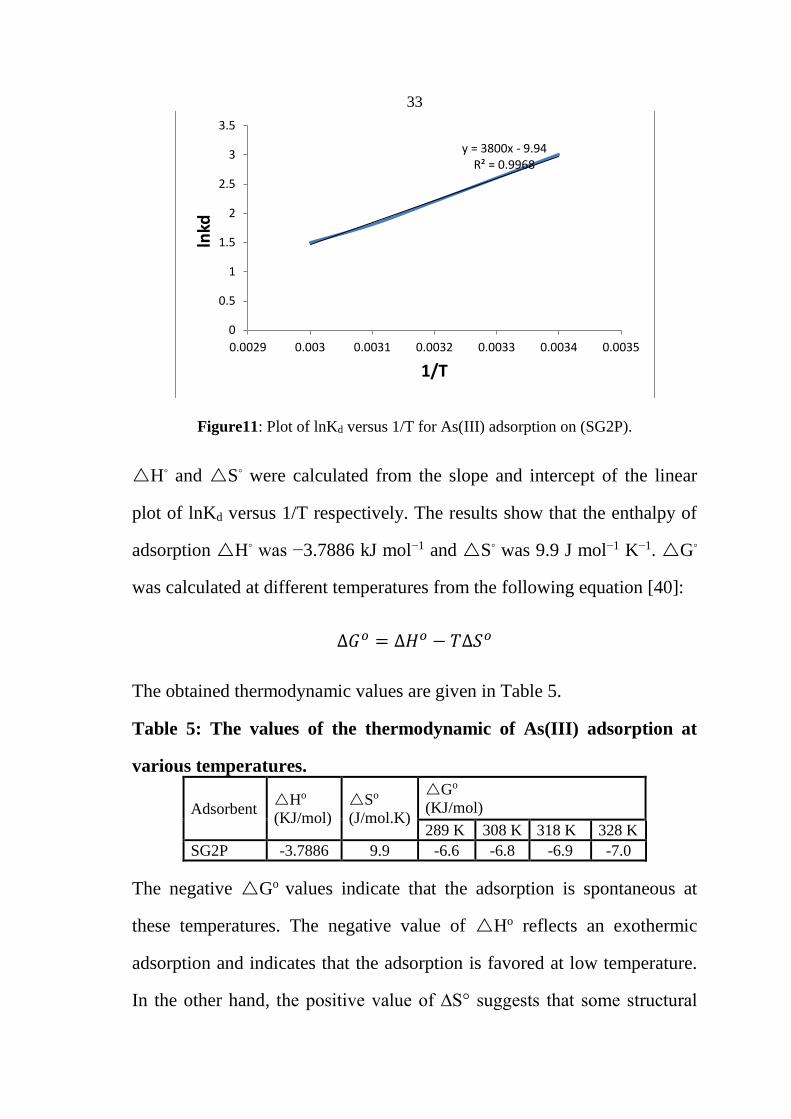
33
Figure11: Plot of lnKd versus 1/T for As(III) adsorption on (SG2P).
H◦ and S◦ were calculated from the slope and intercept of the linear
plot of lnKd versus 1/T respectively. The results show that the enthalpy of
adsorption H◦ was −3.7886 kJ mol−1 and S◦ was 9.9 J mol−1 K−1. G◦
was calculated at different temperatures from the following equation [40]:
∆𝐺𝑜 = ∆𝐻𝑜 − 𝑇∆𝑆𝑜
The obtained thermodynamic values are given in Table 5.
Table 5: The values of the thermodynamic of As(III) adsorption at
various temperatures.
Adsorbent Ho
(KJ/mol)
So
(J/mol.K)
Go
(KJ/mol)
289 K 308 K 318 K 328 K
SG2P -3.7886 9.9 -6.6 -6.8 -6.9 -7.0
The negative Go values indicate that the adsorption is spontaneous at
these temperatures. The negative value of Ho reflects an exothermic
adsorption and indicates that the adsorption is favored at low temperature.
In the other hand, the positive value of ∆S° suggests that some structural
y = 3800x - 9.94R² = 0.9968
0
0.5
1
1.5
2
2.5
3
3.5
0.0029 0.003 0.0031 0.0032 0.0033 0.0034 0.0035
lnkd
1/T
34
changes occur on the adsorbent and the randomness at the solid/liquid
interface in the adsorption system increases during the adsorption process.
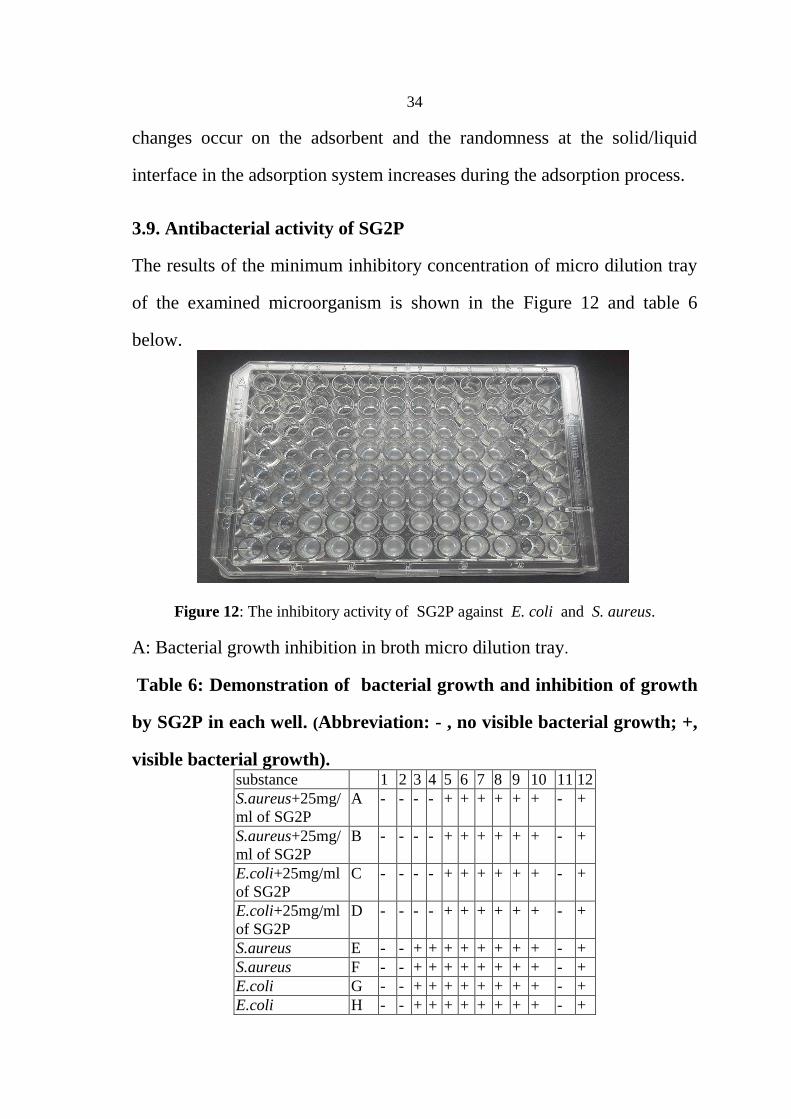
3.9. Antibacterial activity of SG2P
The results of the minimum inhibitory concentration of micro dilution tray
of the examined microorganism is shown in the Figure 12 and table 6
below.
Figure 12: The inhibitory activity of SG2P against E. coli and S. aureus.
A: Bacterial growth inhibition in broth micro dilution tray.
Table 6: Demonstration of bacterial growth and inhibition of growth
by SG2P in each well. (Abbreviation: - , no visible bacterial growth; +,
visible bacterial growth). substance 1 2 3 4 5 6 7 8 9 10 11 12
S.aureus+25mg/
ml of SG2P
A - - - - + + + + + + - +
S.aureus+25mg/
ml of SG2P
B - - - - + + + + + + - +
E.coli+25mg/ml
of SG2P
C - - - - + + + + + + - +
E.coli+25mg/ml
of SG2P
D - - - - + + + + + + - +
S.aureus E - - + + + + + + + + - +
S.aureus F - - + + + + + + + + - +
E.coli G - - + + + + + + + + - +
E.coli H - - + + + + + + + + - +
35
As shown in Figure 12, wells in column number 1, 2, 11 and part of 3 and 4
possessed clear broth indicating absence of bacterial growth (growth
inhibition) or inoculation (well 11). On the other hand, wells with turbid
broth indicated growth of bacteria du considered as to absence of inhibition
or SG2P as in positive control of bacterial growth (well 12).
To well number 1 in the first four rows (A, B, C, D), 100 µl of 25 mg/ml
adsorbent (SG2P) dissolved in 50% DMSO was add, thus this well
contained 12.5% of adsorbent (SG2P). This was further serially diluted as
described in materials and method section.
On the other hand, to the first well (number 1) in the remaining four rows
(E, F, G, H) 100 µl of 50% DMSO was added and a serial dilution of
DMSO was prepared to detect antibacterial activity of DMSO and to ensure
that the bacterial growth inhibition was due to SG2P and not DMSO.
The results shown in Figure 12, indicate that the inhibition of both of E.
coli and S. aureus growth occurred in the first four wells containing SG2P
concentrations of 12.5, 6.25, 3.125 and 1.5625 mg/ml), so the minimum
inhibition concentration of SG2P was 1.5625 mg/ml. On the other
hand, DMSO inhibited growth of E. coli and S. aureus in the first two wells
(25% and 12.5%) and did not show any antibacterial activity in wells
number 3 and 4 in which SG2P showed antibacterial activity. These results
indicated that SG2P possessed antibacterial activity against examined
bacteria.
36
Conclusions:
The adsorption of as (III) onto SG2P was successfully tested for removing
as (III) from the aqueous solution. SG2P is considered as a good
alternative in removal of heavy metals from contaminated solution, it is a
promising method for waste management and environmental treatment.
Studied adsorption parameters as pH, initial concentration of metal ions,
temperature and contact time have an effect on the removal of As(III) by
SG2P.
The percent removal of as (III) ions by SG2P could reach 60% at specific
conditions. The suitable conditions for adsorption were pH 3.0, initial
concentration of 10 µg/L, temperature of 45°C and contact time 20
minutes.
In the adsorption models that were applied Freundlich model parameters
value 1/n and n, also Langmuir models parameter both were showing that
the adsorption of As (III) onto SG2P is favorable.
In the other hand through studying kinetics models pseudo second order
and pseudo first order, the results showed fitting with pseudo second order
in adsorption process of arsenic by SG2P.
SG2P has a low antibacterial activity against both Staphylococcus aureus,
Escherichia coli.
This study is suggest to use silica gel compound in arsenic adsorption in
wastewater, more studies are needed to explain the adsorption of toxic
heavy metals onto silica gel compounds, also further studies of antibacterial
activity of this silica gel compound (SG2P) are needed.
37
References
[1] Sathiadas, M.G., Mubarak, F.N and Arulmoli, S.K, Clinical
manifestations and microbiology of Shigella diarrhoea in
children. 2016; 6 (2):94-100.
[2] Bradford, A., Pollution Facts & Types of Pollution, Live Science
Contributor, 2015; 1-12.
[3] Rashed, M., Low cost adsorbents for the removal of organic
pollutants from wastewater. Journal of Environmental
Management. 2012;113(5):170-183.
[4] Graeme, K., Pollack C. Heavy metal toxicity, Part I: Lead and metal
fume fever. Journal of Emergency Medicine. 1998; 16( 2): 171-177.
[5] Quansah R, Armah FA, Essumang DK, Luginaah I, Clarke E, Marfoh
K, et al. WHO media centre. Environ Health Perspect.
2015;123(5):412-21.
[6] Flanagan, SV., Johnston , RB., Zheng, Y., Bull World Health Organ.
2012; 90(3):839-846.
[7] Hu, J., Chen, C.L., Zhu, X.X., Wang, X.K.,. Removal of chromium
from aqueous solution by using oxidized multiwalled carbon
nanotubes. J. Hazard. Mater. 2009;162: 1542-1550.
[8] Gardea-Torresdey, L., Rosa, G., and Peralta, J. R., Use of
phytofiltration technologies in the removal of heavy metals: A
review". Pure Appl. Chem;2004 76(4): 801–813.
[9] Barakat, M., New trends in removing heavy metals from industrial
wastewater. science direct. 2011; 4(4): 361–377.
38
[10] Semerjian, L., Ayoub, G.M., Advances in Environmental Research,
2003; 7(2), 389-403.
[11] Lima, I.M., Wartelle, L.H., Marshall, W.E.,. Preprints of Extended
Abstracts presents at the ACS National Meeting, American
Chemical Society, Division of Environmental Chemistry, 2002;
42(2):112-116.
[12] Glossary of atmospheric chemistry terms. Pure and Applied
Chemistry. 1990; 62( 11): 2167-2219.
[13] Walter J. and Weber JR, Adsorption Processes, The University of
Michigan, College of Engineering, Ann Arbor, Michigan 48104,
USA. 1974; 37(3):375-392.
[14] Media centre. WHO. Antimicrobial resistance; 2016; available on:
http://www.who.int/mediacentre/factsheets/fs194/en/.
[15] James. H., Jorgensen, 1., Mary, J., clinical infectious decease, 2009;
49(11):1749-1755.
[16] Attinti, R., Sarkar, D., Barrett, K.R. et al. Int. J., Adsorption of
arsenic(V) from aqueous solutions by goethite/silica
nanocomposite, 2015, 12(12), 3905–3914.
[17] Robert G. Robins. Removal of Arsenic from Drinking Water by
Precipitation, Adsorption or Cementation, 1999; 47(4): 474-480.
[18] Tiwari, S., Pandey, v., Removal of arsenic from drinking water by
precipitation and adsorption or cementation: An environmental
prospective, 2013, 5(5): 88-91.
39
[19] Attinti, R., Sarkar, D., Barrett, K.R., Adsorption of arsenic(V) from
aqueous solutions by goethite/silica nanocomposite, 2015, 12(12),
3905–3914.
[20] Egger, S., Rainer, P., Lehmann, J., Martin, J., and Markus
Schuppler., Antimicrobial Properties of a Novel Silver-Silica
Nanocomposite Material, 2009 May; 75(9): 2973–2976.
[21] Nandi, B.K., Goswami, A., Purkait, M.K., "adsorption characteristics
of brilliant green dye on kaolin", Journal of Hazardous Materials,
2009; 161(1):387-395.
[22] Khan, T., Chaudhry, S., Ali, I.," Mercapto functionalized silica
entrapped polyacrylamide hydrogel: Arsenic adsorption behaviour
from aqueous solution". 2015; 45(6):241-5.
[23] Guo, S., Li, W., Zhang, L., Peng, J., Xia, H., Zhang, S. Kinetic and
equilibrium adsorption study of lead (II) onto the low cost
adsorbent-Eupatorium adenophorum spreng, Process Safety and
Environmental Protection, 2009; 87 (5): 343-351.
[24] Maher, FathiAqra, SafaShahin and AwniKhatib, Monitoring
chromium content in tannery waste water, The Journal of the
Argentine Chemical Society. 2009; 97 (2):77-87.
[25] Mulani, J., Daniels, S., Rajdeo, K., Tambe, S., Chava, N., Adsorption
of Chromium(VI) from Aqueous Solutions by Coffee Polyphenol-
Formaldehyde/Acetaldehyde Resins, 2010; 43(3):106-116.
[26] Kubilay¸ S., Gürkan, R., Savran, A,. Sahan, T., Removal of Cu(II),
Zn(II) and Co(II) ions from aqueous solutions by adsorption onto
natural bentonite, 2007; 13: 41–51.
40
[27] Yao, Shuhua; Liu, Ziru; Shi, Zhongliang. Arsenic removal from
aqueous solutions by adsorption onto iron oxide/activated carbon
magnetic composite, 2014, 12(58), 1-7.
[28] Amarah, J., Removal of Methylene Blue from Industrial Wastewater
in Palestine Using Polysiloxane Surface Modified with Bipyrazolic
Tripodal Receptor, An-Najah National University, Nablus Palestine.
2015; 1-103.
[29] Solomon, G., Anagho, F., Equilibrium, kinetic and thermodynamic
studies of phosphoric acidadsorption onto activated carbon, Pelagia
Research Library, Der Chemica Sinica, 2013, 4(3):58-68.
[30] Dada, A.O., Langmuir, Freundlich, Temkin and Dubinin–
Radushkevich Isotherms Studies of Equilibrium Sorption of Zn2+
Unto Phosphoric Acid Modified Rice Husk, IOSR Journal of
Applied Chemistry, 2012; 3(1) :38-45.
[31] Mehdi R., Mehdi V., Langmuir, Freundlich and Temkin Adsorption
Isotherms of Propranolol on Multi-Wall CarbonNanotube, Journal
of modern drug discovery and drug delivery research, 2014; 4(4):
933-937.
[32] Ghiaci M., Abbaspur A., Kia R., Seyedeyn-Azad F., Equilibrium
isotherm studies for the sorption of benzene, toluene, and phenol
onto organo-zeolites and as-synthesized MCM-41, Separation and
Purification Technology J., 2004; 40 (3): 217–229.
[33] Hameed, B., Equilibrium modeling and kinetic studies on the
adsorption of basic dye by a low-cost adsorbent: Coconut (Cocos
41
nucifera) bunch waste, Journal of Hazardous Materials 158
(2008) 65–72.
[34] Umoren, S., Adsorption of methylene blue from industrial effluent
using poly (vinyl alcohol), J. Mater. Environ. Sci. 4 (1) (2013) 75-86.
[35] Shahryari, Z., Experimental study of methylene blue adsorption from
aqueous solutions onto carbon nano tubes, International Journal
of Water Resources and Environmental Engineering, 2010; 2
(2):016-028.
[36] Patil,S., Removal of methylene blue, a basic dye from aqueous
solutions by adsorption using teak tree ( Tectona grandis) bark
powder, International Journal of Environmental Sciences, 2011;
1(5): 711-726.
[37] Abd El-Latif, M., Adsorption Equilibrium, kinetics and
thermodynamics of methylene blue from aqueous solutions using
biopolymer oak sawdust composite, Journal of American Science
2010; 6(6):267-283.
[38] Antony, J., Xavier, N., Equilibrium and kinetic studies of Methylene
blue onto activated carbon prepared form Crescentia cujete fruit
shell, Nature and Science J, 2013;11(4):53-58.
[39] Bolis, V., Busco, C., Ugliengo, P., Thermodynamic study of water
adsorption in high-silica zeolites. J. Phys. Chem. B. 2006; 110(30),
14849–14859.
42
[40] Abramian, L., El-Rassy, H., Adsorption kinetics and thermodynamics
of azo-dye Orange II onto highlyporous titania aerogel, Chemical
Engineering Journal, 2009; 403–410.

2016

ب
60325
101002
10
31520
45
ج
Escherichia coli (ATCC25922) and Staphylococcus aureus
(ATCC25932)
1.5625