Embed Size (px)
Citation preview

United States Department of Agriculture
www.ers.usda.gov
Electronic Outlook Report from the Economic Research Service
WRS-05-02
February 2005
NAFTA At 11The Growing Integration of North American Agriculture
Steven Zahniser, editor
Abstract
In the 11 years since implementation of the North American Free TradeAgreement (NAFTA), the agricultural sectors of Canada, Mexico, and theUnited States have become much more integrated. Agricultural trade amongthe NAFTA countries has grown dramatically, and Canadian and Mexicanindustries that rely on U.S. agricultural inputs have expanded. U.S. feed-stuffs have facilitated a marked increase in Mexican meat production andconsumption, and the importance of Canadian and Mexican produce to U.S.fruit and vegetable consumption is also growing. The farm policies of thethree countries exhibit some similarities. Foreign direct investment in theMexican processed food sector has increased, and sales by Canadian,Mexican, and U.S. multinational food companies throughout the NAFTAregion have risen, giving consumers access to a wider variety of products.Integration of North America’s dairy, poultry, and sugar and sweetenersectors, however, is lagging.
Keywords: North American Free Trade Agreement, NAFTA, Canada,Mexico, United States, trade, investment, transportation.
Acknowledgments
We gratefully acknowledge the comments of Mary Burfisher, Praveen Dixit,Joy Harwood, Demcey Johnson, Barry Krissoff, Daniel Pick, GregPompelli, Priscilla Smith, Leland Southard, and Thomas Vollrath (EconomicResearch Service—USDA/ERS); Lisa Anderson, Brenda Freeman, SuzanneHeinen, Hugh Maginnis, George Myles, Chris Patterson, and David J.Williams (Foreign Agricultural Service—USDA/FAS); and Carol Goodloe,David Stallings, and William Tierney (Office of the Chief Economist—USDA/OCE). Special thanks are extended to Linda Hatcher (USDA/ERS)for editorial assistance. Finally, some insights for this report were obtainedthrough activities funded by the Emerging Markets Program of USDA/FAS.

iiNAFTA at 11: The Growing Integration of North American Agriculture
Economic Research Service/USDA
Foreword
This is the fourth report on NAFTA’s effects on U.S. agriculture and therural economy to be submitted to the U.S. Congress in accordance with theNorth American Free Trade Agreement Implementation Act. The legislationrequires that the U.S. Department of Agriculture (USDA) submit a biennialreport on this subject, starting in 1997 and ending in 2011. This editioncovers economic and policy developments through 2004.
Contributors
Steven Zahniser (editor), Christine Bolling (processed food), WilliamChambers (grains, cotton, and oilseeds), Kitty Chan (fruits and vegetables),William Coyle (transportation), Mildred Haley (hogs and pork), WilliamHahn (animal products), Linwood Hoffman (grains, cotton, and oilseeds),Dale Leuck (cattle and beef), James Miller (dairy), Agnes Prentice (appendixtrade tables), Nydia Suárez (sugar and sweeteners), Fawzi Taha (poultry),John Wainio (Canadian farm programs), and Ed Young (U.S. farm programs).

The dream of an integrated agricultural market in North America is not new.Throughout the 20th century, policymakers explored ways to lower the tradeand investment barriers separating the U.S., Canadian, and Mexicanmarkets. An ambitious effort by Canada and the United States to pursue thisobjective almost a century ago met with complete failure. In 1911, thegovernments of Canadian Prime Minister Wilfrid Laurier and U.S. PresidentWilliam Howard Taft negotiated a reciprocal trade agreement between thetwo countries, only to see it become a campaign issue that ultimatelycontributed to Laurier’s electoral defeat (Cook, 1997: pp. 405-6). Lastingmemories of this agreement’s demise helped to undermine a similarproposal made in Canada during the late 1940s (Morton, 1997: p. 473).
A promising early attempt a quarter century ago to open the Mexicaneconomy to greater integration with the United States and other foreigncountries also was abandoned. In 1980, Mexican President José LópezPortillo opted to keep his country out of the General Agreement on Tariffsand Trade (GATT), even though substantial negotiations had already takenplace on the subject of accession (Weintraub, 1990: p. 89). This decision,made at a time when prices for Mexican crude oil were unusually high,came in the face of mounting evidence that the country’s inward-orientedeconomic strategy had exhausted itself by the late 1960s (see, for instance,Reynolds, 1978).
Mexico’s decision not to join the GATT proved to be short-lived, as thecountry finally agreed in 1986 to enter the organization. Moreover, the deci-sion in 1980 was followed by a sustained effort by the U.S. Government toengage its closest neighbors in free-trade negotiations. In 1985, CanadianPrime Minister Brian Mulroney accepted the invitation of President RonaldReagan to initiate negotiations towards a bilateral free-trade agreement, aneffort that culminated in the implementation of the Canada-U.S. Free TradeAgreement (CFTA) in 1989. Although Mexican President Miguel de laMadrid Hurtado declined a similar invitation from President Reagan, thenext Mexican president, Carlos Salinas de Gortari, formally proposed thatMexico and the United States forge a free-trade agreement of their own,following an earlier informal suggestion by President George H.W. Bush.Canada joined these negotiations, and the end result was the implementationof a successor agreement called the North American Free Trade Agreement(NAFTA) in 1994.
Now, on the 11th anniversary of NAFTA’s implementation, a number ofdevelopments provide insights into the extent to which market integrationhas taken hold in North American agriculture. Agricultural trade among theNAFTA countries has grown across a broad range of products, new cross-border investments have taken place in the region’s processed food industry,and supply chains and productive activities across international bordershave undergone restructuring. This edition of the NAFTA report takes stockof these and other developments and identifies the role that CFTA andNAFTA have played in their advancement.1
1NAFTA at 11: The Growing Integration of North American Agriculture
Economic Research Service/USDA
Introduction
1Several recent USDA publicationshave also visited this subject. Vollrath(2003) synthesizes information pre-sented at a 2-day symposium on thistopic. A special issue of the ForeignAgricultural Service’s magazine AgExporter contains two essays about thefuture of market integration in NorthAmerican agriculture: Vollrath (2004)and Knutson and Ochoa (2004). Haley(2004) explains how the U.S. andCanadian hog sectors have becomeclosely integrated, and Calvin,Avendaño, and Schwentesius (2004)examine the economics of food safetyin the integrated U.S.-Mexico greenonion industry.
Market integration is the extent to which one or more formerly separatedmarkets have combined to form a single market. Integration is visible inincreased flows of cross-border trade. This trade consists of not only finalconsumer products but also intermediate inputs and raw materials, as firmsreorganize their activities around regional markets for both inputs andoutputs, spurred in part by greater foreign direct investment (FDI). In addi-tion, decisionmakers in both the government and private sector pursue acourse of greater institutional and policy cooperation and coordination toencourage market integration.
Technological and institutional advancements in transportation and commu-nications clearly spur this process, as geographic areas that once seemedremote become easily accessible and ultimately integrated economically.But another activity that advances market integration is the elimination ofpolicies that frustrate international trade and investment. Prominent exam-ples of such barriers to integration include tariffs, quotas, import licensing,limits on the amount of foreign ownership in a particular firm or industry,and the differential treatment of foreign and domestic investors. All of thesepolicies were prominent aspects of the agricultural policies of one or morecountries in North America prior to CFTA and NAFTA.
The benefits of market integration are many. In general, market integrationenables agricultural producers and consumers throughout the newly inte-grated region to benefit more fully from their relative strengths and torespond more efficiently to changing economic conditions. For producers,market integration opens new territories for the sale of their output, possiblyallowing for the further exploitation of economies of scale. It givesproducers access to potentially cheaper suppliers of inputs and creates newopportunities for FDI, as firms restructure the vertical and horizontalarrangements of their enterprises. But market integration also opens thedoor to new competition from producers in formerly isolated locations. Forconsumers, market integration provides access to new varieties of foodproducts and off-season supplies of fresh fruits and vegetables and may leadto faster income growth. Greater competition is also likely to make foodmore affordable, thereby expanding consumer purchasing power.
2NAFTA at 11: The Growing Integration of North American Agriculture
Economic Research Service/USDA
What Is Market Integration?

NAFTA’s most obvious contribution to market integration is its dismantlingof an extensive set of trade barriers among Canada, Mexico, and the UnitedStates. This massive housecleaning did not occur instanteously, but insteadis taking place over a period of nearly 20 years. NAFTA is structured asthree bilateral agreements, one between Canada and the United States, asecond between Mexico and the United States, and a third between Canadaand Mexico. The first accord is CFTA, which took effect on January 1,1989, and is subsumed by NAFTA. The second and third agreements arefound in NAFTA itself, which took effect on January 1, 1994.
Today, most agricultural trade within the NAFTA region is already free oftariff and quota barriers. Tariff elimination for U.S.-Canada trade concludedon January 1, 1998, although the two countries retain the option to applytemporary safeguards on bilateral trade in selected fruits, vegetables, andflowers until 2008. The liberalization of U.S.-Mexico (and Canada-Mexico)agricultural trade also is at an advanced state. Numerous restrictions wereeliminated immediately upon NAFTA’s implementation, while others werephased out over periods of 4 or 9 years. A handful of agricultural commodi-ties, however, will not enjoy tariff and quota elimination until 2008. Exam-ples include Mexican exports to the United States of frozen concentratedorange juice, sugar, and peanuts and U.S. exports to Mexico of corn, driedbeans, and nonfat dry milk. Mexico and the United States also have theoption to apply temporary safeguards on bilateral trade in selected agricul-tural products until 2008.
Despite the sweeping nature of these reforms, NAFTA contains severalimportant exceptions to the process of agricultural trade liberalization.These exceptions all stem from CFTA: U.S. imports of Canadian dairyproducts, peanuts, peanut butter, cotton, sugar, and sugar-containing products and Canadian imports of U.S. dairy products, poultry, eggs, andmargarine. The quotas that once governed bilateral trade in these commodi-ties were redefined as tariff-rate quotas (TRQs)2 to comply with theUruguay Round Agreement on Agriculture (URAA), which took effect onJanuary 1, 1995.
Another major contribution of NAFTA is the establishment of key principlesregarding the treatment of foreign investors. These principles include a firmcommitment from each NAFTA country to treat foreign investors from theother NAFTA countries no less favorably than it treats its own domesticinvestors. In addition, NAFTA prohibits the application of certain perform-ance requirements on foreign investors, such as a minimum amount ofdomestic content in production. Although NAFTA specifies certain excep-tions to the agreement’s investment reforms, none of these exceptionsdirectly concern agriculture or food processing.
Like the URAA, NAFTA requires that sanitary and phytosanitary (SPS)measures be scientifically based, nondiscriminatory, and transparent, andthat these measures restrict trade in a minimal fashion, when possible. Theagreement also establishes the NAFTA Committee on Sanitary and
3NAFTA at 11: The Growing Integration of North American Agriculture
Economic Research Service/USDA
2A TRQ is a quota for a volume ofimports at a favorable tariff. After thequantitative limit is reached, a highertariff is applied on additional imports.
How Has NAFTA Contributed to Market Integration?

Phytosanitary Measures to facilitate technical cooperation between theNAFTA countries in the development, application, and enforcement of suchmeasures. To fulfill these responsibilities, the NAFTA governments haveengaged in a concerted effort throughout the NAFTA period to fine-tunetheir SPS measures in ways that facilitate trade.
NAFTA also created several formal mechanisms for the resolution ofdisputes concerning the agreement’s investment and services provisions, theapplication of national antidumping and countervailing duty laws, and thegeneral interpretation and application of the agreement. Moreover, theprivate sector has assumed an active role in defusing many trade tensionsbefore they take the form of a formal, full-blown dispute. These mecha-nisms, along with the agreement’s other investment provisions, provide astrong assurance that the NAFTA region is safe and secure for cross-bordereconomic activity. As a result, NAFTA’s implementation was followed by aburst in FDI in the food and beverage industries of each NAFTA country.
4NAFTA at 11: The Growing Integration of North American Agriculture
Economic Research Service/USDA

This report defines three levels of market integration—high, medium, andlow—and classifies the level of integration that currently exists across NorthAmerican agriculture, as follows:
• A high degree of market integration. Virtually all of the major barriersto trade and investment (tariffs, quotas, investment restrictions, etc.) havebeen removed. Any remaining requirements, such as SPS standards, gen-erally allow for substantial cross-border flows of trade and investment andare consistent with the country’s obligations under its international tradeagreements. Reaching a high degree of market integration in a particularsector comes with large flows of trade and investment, sometimes featur-ing intra-industry trade (trade in both directions within a particular indus-try). It also comes with structural changes in agricultural and food indus-tries necessary for accommodating these new economic arrangements.
• Amedium degree of market integration. One or more significant barri-ers to trade and/or investment linger. Examples include the remainingtransitional restrictions specified by NAFTA, such as the TRQs governingU.S.-Mexico orange juice trade, and transportation and logistical prob-lems in specific geographic areas. In a sector with a medium degree ofmarket integration, trade, production, or consumption often have alreadychanged substantially, but there is a perception that removing additionalbarriers will result in further economic change.
• A low degree of market integration. Markets are clearly prevented fromintegrating due to the presence of one or more significant barriers to tradeand/or investment. In some instances, these barriers may be viewed asappropriate. For example, science-based SPS standards that assure thehealth and safety of the public or protect farms and ranches from thespread of damaging animal and plant diseases may inhibit integration incertain cases. In other instances, the persistence of significant barriersmay represent an inability to address a lingering dispute for political,legal, or economic reasons. Two examples are the sugar and sweetenerdispute between Mexico and the United States and the U.S. appeals courtdecision of January 2003 (overturned by the Supreme Court in June 2004)that delayed U.S. implementation of NAFTA’s provisions for cross-bordertrucking. Geographical barriers and cross-country differences in the levelof economic development are among the nonpolicy factors that can con-tribute to a low degree of integration.
Table 1 presents an overview of the current status of market integration inNorth American agriculture and how it has changed over the past 11 years.The degree of market integration clearly varies across agriculture, andwithin a given agricultural sector, the level of integration often varies bytrading partner and the direction of trade between a particular pair of tradingpartners. For instance, the U.S. and Canadian poultry industries have experi-enced little integration due to the exclusion of U.S.-Canada poultry trade(and Canada-Mexico poultry trade) from trade liberalization under CFTA
5NAFTA at 11: The Growing Integration of North American Agriculture
Economic Research Service/USDA
Overview of North American Market Integration

6NAFTA at 11: The Growing Integration of North American Agriculture
Economic Research Service/USDA
Table 1—NAFTA has advanced the integration of many aspects of North American agriculture
Item General comments U.S.-Mexico U.S.-Canada
Agricultural policy Tendency for some aspects of Mexico's concerns about the In 2001, Canada started a each country’s policies to 2002 U.S. Farm Act, NAFTA, comprehensive overhaul of its move together: and the general state of agricultural policies.• Institutionalization of Mexican agriculture prompt Revamped savings program for
countercyclical programs. changes in Mexico’s producers is centerpiece of • Continued emphasis on agricultural policies. this effort.
decoupled support.
Grains and oilseeds Important cross-border Medium degree of integration. High degree of integration,investments in grain milling. NAFTA’s restrictions on U.S. except for wheat.Sizable increases in U.S. corn exports to Mexico Growing two-way trade includes exports to Mexico and scheduled to end in 2008. both bulk commodities and Canadian exports to U.S. Strong linkages between U.S. processed food products.
grain and oilseed sectors and Resolution of the fundamental Mexican hog and poultry incompatibility of certain producers. national policies would Mexican direct investment in facilitate further integration.U.S. baking industry.
Cotton, textiles, NAFTA fostered a continental High degree of integration. High degree of integration.and apparel market for final products as Division of labor in which U.S. U.S.-Canada trade in cotton,
well as the cross-border supplies cotton and Mexico textiles, and apparel is anothervertical integration of the North supplies cotton textiles aspect of the continental textile American textile and apparel and apparel. and apparel industryindustries. Some Mexican mills are Greater competition from geared for U.S. cotton.China is expected with the Mexican cotton production implementation of the World has declined.Trade Organization’s Agreement on Textiles and Clothing.
Livestock and meat Continued development of Medium degree of integration High degree of integration in integrated livestock and meat regarding U.S. producers and cattle, beef, hogs, and pork.industries on a continental the Mexican market, except Expanded Canadian hog basis. for beef (high). exports to U.S. include larger Coordinated response by U.S. exports to Mexico of beef, proportion of feeder animals NAFTA governments to pork, and poultry meat all have that are finished in U.S.discoveries of Bovine doubled in volume during the Growing two-way trade in cattle Spongiform Encephalopathy NAFTA period. and beef.(BSE) in Canada and U.S. Second- and third-largest Low degree of integration in illustrates integration of cattle chicken producers in Mexico dairy and poultry, due to the and beef industries. are affiliates of U.S. firms. exclusion of these sectors from With the removal of most Strong linkages have emerged trade liberalization under CFTA traditional barriers to trade between U.S. poultry industry and NAFTA.(i.e., tariffs and quotas), and Mexican sausage and progress in addressing the cold-cut producers.sanitary concerns of importing Low degree of integration countries becomes crucial to regarding Mexican producers further market integration. and the U.S. market, except for
feeder cattle (high).U.S. recognition of Mexican progress in controlling certain animal diseases may eventually lead to more substantial Mexican exports of hogs, poultry, and pork to the U.S.
See note at end of table. Continued—

and NAFTA. At the same time, sanitary concerns have shaped U.S.-Mexicopoultry trade so that it, so far, consists primarily of U.S. exports to Mexico.
Agricultural Policy
NAFTA generally preserves the autonomy of each member country to defineand implement its own domestic agricultural policies. Each member countryhas exercised this authority over the past several years by making substantialchanges to its farm programs. In the United States, the Farm Security andRural Investment Act of 2002 (2002 Farm Act) was signed into law on May13, 2002, providing the legal framework for U.S. farm programs through2007 crops. In Mexico, the Government issued two outlines of intendedpolicy actions, one commonly referred to as “Agri-food Armor” (2002) andthe other called the National Agreement for the Countryside (2003). And in
7NAFTA at 11: The Growing Integration of North American Agriculture
Economic Research Service/USDA
Table 1—NAFTA has advanced the integration of many aspects of North American agriculture—Continued
Item General comments U.S.-Mexico U.S.-Canada
Fruits and vegetables Trade expansion is related to High degree of integration High degree of integration.increased consumption of regarding Mexican producers Canadian consumers now have fresh produce, particularly in and the U.S. market. tariff- and quota-free access to Canada and the U.S., on both Mexico now trying to promote full range of U.S. produce.seasonal and aggregate levels. exports of nontraditional Canada has emerged as an Private sector negotiates produce. important supplier of tomatoes, reference-price agreements to Medium degree of integration cucumbers, and peppers to the secure suspensions of key regarding U.S. producers and U.S., in addition to fresh and antidumping cases. Examples the Mexican market. frozen potatoes.include Mexican tomato exports U.S. exporters should benefit to the United States and U.S. from close ties to supermarket apple exports to Mexico. chains in Mexico.
Sugar and sweeteners Trade is still highly limited by Low degree of integration. Low degree of integration.border restrictions and other U.S. and Mexico are locked in U.S. imports from Canada of measures. a dispute about how to sugar and sugar-containing
interpret NAFTA’s sugar and products were exempted from sweetener provisions. trade liberalization under CFTA.Mexico stifles high fructose TRQs now govern this trade, in corn syrup industry by accordance with the URAA.imposing 20-percent tax on beverages containing sweeteners other than sugar.
Processed foods Sales of Canadian and Medium degree of integration. High degree of integration.Mexican affiliates of U.S. Substantial U.S. direct Substantial U.S. and Canadian processed food companies investment in the Mexican food direct investment in each still exceed U.S. processed industry, with important other’s processed food food exports to those countries, Mexican investments in industries. Significant and even though processed food segments of the U.S. food growing intra-industry trade in trade within the NAFTA region industry. intermediate and final food is rising. Beer is Mexico’s leading products.
agricultural export to the U.S.
Transportation Increased security concerns Low level of integration. High level of integration.of U.S. present additional Implementation of NAFTA’s Canadian and U.S. trucks challenge to NAFTA trade. provisions for Mexican trucking present on each other’s
access to the U.S. may proceed roadways. Further integration following 2004 decision by U.S. and coordination among U.S.Supreme Court. and Canadian railways.
Source: USDA/ERS.

Canada, the Federal and Provincial governments have engaged in a compre-hensive effort since 2001 to reshape their country’s agricultural policy,within the context of the Agricultural Policy Framework (APF).
These reforms address different priorities, reflecting the unique structureand policy traditions of each country’s agricultural sector. Through the 2002Farm Act, the United States is retaining the extensive planting flexibilitythat the previous farm legislation offered farmers, while eliminating peanutquotas so that the commodity is treated similarly to other program crops. Inaddition, spending on conservation has expanded, with greater emphasisplaced on lands in production. Through the APF, Canada has crafted newapproaches to food safety and food quality, the environment, science’s rolein agriculture, and the overall reinvigoration of the agricultural sector.Mexico’s reforms are part of a continuing effort to implement agriculturalsupports similar to those found in the developed economies, while stilladdressing the needs and wants of smaller producers who are less commer-cially oriented. To these ends, the Mexican Government has implemented anew program of energy discounts for its agricultural producers, and it hasrevamped its activities in the area of agricultural finance.
Despite the many unique features of each country’s agricultural reforms,some aspects of the member countries’ farm policies have moved togetherduring the NAFTA period. Each NAFTA country now provides decoupledincome payments to its agricultural producers, and each country has institu-tionalized countercyclical programs that provide income support to farmerswhen commodity prices (or net farm revenue, in the case of Canada) fallbelow a certain level. This legislative innovation follows a period during thelate 1990s and early 2000s when Canada and the United States operated adhoc programs of this type in response to a downturn in commodity prices.The United States has created a new program of countercyclical paymentsfor 15 commodities based on historical areas and yields. Canada has incor-porated disaster assistance within a subsidized savings plan for producers,called the Canadian Agricultural Income Stabilization program. Mexico hasformulated the Subprogram of Direct Payments for Target Income for grainand oilseed producers. This subprogram provides countercyclical support ina manner somewhat akin to the U.S. marketing loan program.
Grains and Oilseeds
Over the short span of a decade, the grain and oilseed sectors of Mexico andthe United States have achieved a medium degree of integration that isstarting to approach the high degree of integration between Canada and theUnited States. Among all three countries, greater integration is clearlyapparent in the increased regional trade in grains, oilseeds, and related prod-ucts. In this broad category, U.S. exports to Mexico, Canadian exports to theUnited States, and U.S. exports to Canada have all more than doubled sinceNAFTA’s implementation (app. tables 1-4).
Increased feed demand has been a powerful driver of market integration. InMexico, poultry and hog producers heavily rely on feed imports from theUnited States as they seek to meet their country’s growing demand for meat.For instance, imports account for about half of the feedstuffs used by theMexican poultry industry (Juarez and Hernandez, 2003: p. 17). As a result,U.S. exports to Mexico of feed grains, oilseeds, and related products have
8NAFTA at 11: The Growing Integration of North American Agriculture
Economic Research Service/USDA

more than doubled during the NAFTA period, surpassing 16 million metrictons in 2003 (fig. 1). U.S. feedstuffs enable Mexican livestock producers toexpand output, lower production costs, and compete more effectively withmeat imports from the United States, Canada, and other countries. They alsohave made possible a marked increase in Mexican meat consumption.Between 1993 and 2003, Mexico’s per capita consumption of broiler meatrose 54 percent, while per capita pork consumption increased 32 percent.3
In Canada, expansion of the livestock sector also has had an importanteffect on grain trade. Increased hog and cattle production in Canada’sWestern Provinces has increased feed demand in those areas. This increasehas altered grain-use patterns in Canada and led to greater imports from theUnited States. Corn and soybean production has expanded outside of thetraditional U.S. Corn Belt, and some of this new production—particularly inthe Northern Great Plains—is produced for Canadian livestock.
The U.S. and Canadian grain and oilseed sectors are more highly integratedthan the U.S. and Mexican sectors. Not only do Canada and the UnitedStates trade a wide variety of bulk commodities, but they also engage in alarge amount of intra-industry trade in such processed products as mixes,dough, bread, cookies, and pastries (app. tables 1 and 2). Trade volumebetween Mexico and the United States in similar processed products is juststarting to become appreciable (app. tables 3 and 4). Important cross-borderinvestments have served to further integrate the grain milling and bakingindustries of the NAFTA countries. For example, the Canadian firm GeorgeWeston Ltd. is a prominent player in the U.S. baked goods industry, andMexico’s largest baking company, GIBSA (Grupo Bimbo), operates severalbread-baking enterprises in the United States.
9NAFTA at 11: The Growing Integration of North American Agriculture
Economic Research Service/USDA
3These calculations are made using consumption estimates fromUSDA/FAS (2005) and populationestimates from UN/FAO (2004).
Figure 1
U.S. feedstuffs are crucial to Mexican pork and poultry production
Exports, million metric tonsProduction, thousand
metric tons (carcass weight)
Mexican pork andpoultry production
U.S. exports to Mexicoof feed grains, oilseeds,
and related products
10
12
8
18
16
14
6
4
2
01990 92 94 96 98 2000 02
3,500
3,000
2,500
2,000
1,500
1,000
500
0
Sources: USDA/ERS (December 2004) (exports) and SAGARPA/SIAP (2005) (production).

In the coming decade, two commodities in the grains and oilseeds sector arelikely to be the focus of further efforts towards integration: corn in Mexicoand wheat in Canada. Corn is the only commodity among grains and oilseedsthat is still subject to transitional Mexican trade restrictions under NAFTA.Until 2008, Mexico is entitled to apply a TRQ to U.S. corn. But the MexicanGovernment has generally pursued a more liberal trade policy toward cornthan NAFTA requires so that the country can benefit more fully from theintegrated grain market. For 2003, Mexico authorized import permits for U.S.yellow corn totaling about 3.8 million metric tons, in addition to the roughly3.2 million metric tons associated with the NAFTA TRQ for corn in general(Juarez and Trejo, 2004: p. 20). The additional imports of yellow corn, usedprimarily as animal feed or to manufacture starch, were subject to an over-quota tariff of only 1 percent, rather than the prohibitive levy allowed byNAFTA. As these transitional restrictions draw to a close, the compositionof U.S. grain exports to Mexico is likely to shift more toward corn andaway from sorghum (USDA/OCE, 2004: p. 84).
Yellow corn continues to make up the bulk of U.S. corn exports to Mexico(fig. 2). Mexico is also a potentially attractive export market for white corn,which is used to produce tortillas and other corn-based foods in Mexico.However, the Mexican Government has fostered the domestic production ofwhite corn by providing marketing payments to certain commercialproducers of this commodity. In this context, U.S. white corn exports toMexico have steadily declined since 2000, according to U.S. grain inspec-tion data (Zahniser and Coyle, 2004). Moreover, the Mexican Congress has
10NAFTA at 11: The Growing Integration of North American Agriculture
Economic Research Service/USDA
Figure 2
U.S. corn exports to Mexico still consist primarily of yellow corn
Million metric tons
Notes: Yellow and mixed corn exports are calculated by subtracting white corn exports from total corn exports. Cracked corn (broken or ground kernels) is defined as a distinct commodity from corn. Like yellow corn, it is primarily used as animal feed.
Sources: USDA/ERS (December 2004) (total corn and cracked corn exports) and USDA/AMS (1991-2003) (white corn exports).
9
8
7
6
5
4
3
2
1
01991 93 95 97 99 2001 03
Yellow and mixed Cracked White

mandated that the Executive Branch apply the NAFTA over-quota tariff towhite corn. This tariff, 54.5 percent for 2005, is far higher than the 2 or 3percent that the Executive Branch has traditionally applied to white corn.
In addition to Mexico’s relatively small group of large-scale corn producers,a large number of small-scale farmers cultivate traditional and sometimescontemporary varieties of corn on rainfed lands. In many instances, theoutput of these producers is either consumed directly by the farm householdor sold in local markets that are not fully integrated with the internationalmarket. Largely due to producers of rainfed corn, total corn production inMexico has actually increased during the NAFTA period (Fiess andLederman, 2004).
Further integration of the U.S. and Canadian wheat markets will depend onthe resolution of the fundamental incompatibility of certain national policies,including the activities of the Canadian Wheat Board (CWB). For some time,the U.S. Government and the U.S. wheat industry have argued that the CWB“takes sales” from U.S. wheat producers through various noncommercialactivities, including the cross-subsidization of sales, the sale of wheat with ahigher protein content at the price of lower protein product, and the use of itsspecial privileges to generate a “financial cushion” to discount export prices.4
In 2004, a dispute settlement panel at the World Trade Organization (WTO)ruled that several aspects of Canada’s grain distribution system violate thenational treatment principles of the WTO. However, the panel also ruled thatthe CWB’s export regime does not violate Canada’s obligations under ArticleXVII of the General Agreement on Tariffs and Trade (GATT). This articlegoverns the behavior of the CWB and other state-trading enterprises. Thus,multilateral trade negotiations may offer the best venue for fully addressingU.S. concerns related to the CWB. In the meantime, the United States hasimposed an antidumping duty of 8.27 percent and a countervailing duty of 5.29percent on U.S. imports of hard red spring wheat from Canada. The CanadianGovernment has filed to contest these duties before a NAFTA arbitration panel.
Cotton, Textiles, and Apparel
With the implementation of the WTO’s Agreement on Textiles and Clothing(ATC), North America’s textile and apparel industry is experiencing intensecompetition from China and other countries outside NAFTA. This industrybecame highly integrated during NAFTA’s first decade, as a division oflabor emerged in which the United States supplies raw cotton to Mexicantextile and apparel producers and Mexico exports some of its textile andapparel output to the United States (fig. 3).
Since the turn of the century, however, this arrangement has come underduress. Gradual implementation of the ATC has dissolved the complextangle of quotas that formerly restricted international trade in textiles andapparel, giving countries outside NAFTA much broader access to the U.S.market. As a result, Mexico’s textile and apparel industry has struggled greatly,confronted with both heightened competition for the U.S. market and risingimports into Mexico. Between 2000 and 2003, Mexican textile and apparelexports to the United States fell from U.S. $9.7 billion to U.S. $7.9 billion(USDC/OTEXA, 2005), and employment in Mexico’s textile and apparelsector slipped by roughly 20 percent (Encuesta Industrial Anual, as cited by
11NAFTA at 11: The Growing Integration of North American Agriculture
Economic Research Service/USDA
4For details, see Goodloe (2004) andSchnepf (2004).

INEGI, 2004). U.S. textile and apparel employment also has continued todecline, from 1.2 million workers to about 1.0 million over the same period.With the recent economic upturn in the United States, Mexican textile andapparel exports to the United States for 2004 fell just short of their 2003level, but the question of how North America’s textile and apparel industryfits in a far more open international market is still a vital concern to theindustry’s participants, including U.S. cotton producers.
Livestock and Meat
The NAFTA period has witnessed the continuing integration of NorthAmerica’s livestock and meat industries, to the extent that one may increas-ingly think of these sectors as forming a continental animal productscomplex. Many trade barriers have been eliminated among the NAFTAcountries. Those that remain vary by trading partner and sector (i.e., cattleand beef, hogs and pork, poultry, dairy). Consequently, the degree of marketintegration also varies by trading partner and sector.
Sanitary regulations significantly influence integration by allowing livestockand meat imports from areas without dangerous animal diseases, even if thedisease in question is present in another part of the country. Both NAFTA andthe URAA require, when possible, the regionalization of sanitary andphytosanitary standards. Once an outbreak of a specified animal disease isidentified, sanitary restrictions are to be defined on a regional basis, wherepossible, so that international trade may continue. Regionalization allows
12NAFTA at 11: The Growing Integration of North American Agriculture
Economic Research Service/USDA
Figure 3
U.S. textile and apparel imports from Mexico have declined sharply in the face of heightened competition from China and other non-NAFTA countries
Imports from Mexico, million square meters
Exports to Mexico,million metric tons
450
400
350
50
100
150
200
250
300
0
Sources: USDC/OTEXA (2005) (textile and apparel imports) and USDA/ERS(December 2004) (cotton exports).
U.S. cottonexports to Mexico
U.S. textile and apparelimports from Mexico
5,000
4,500
1,000
1,500
2,000
2,500
3,000
3,500
4,000
0
500
1990 02200098969492

exports to flow from regions within a country that are free of dangerous animaldiseases, even when diseases are endemic in other regions within the country.
Regionalization of sanitary regulations has resulted in the removal of testingrequirements that were no longer deemed necessary for U.S.-Canada tradein feeder cattle and U.S. hog exports to Canada. As a result, U.S. feedercattle exports to Canada more than tripled between 1990 and 2003. WhenBovine Spongiform Encephalopathy (BSE) was discovered in Canada inMay 2003 and in the United States in December 2003, sanitary barrierswere erected to prevent cattle and beef trade between the two countries. Inthe case of hogs, Canada no longer requires that hogs from U.S. States thatare free of pseudorabies be tested for the disease. This regulatory innovationhas not yet led to increased U.S. hog exports to Canada, however.
Under normal conditions, the cattle and beef sectors of Canada and the UnitedStates are highly integrated, with production systems that cross internationalboundaries, important instances of FDI, and substantial two-way trade inboth cattle and beef. For the time being, however, the BSE discoveries of2003 have dampened this integration, particularly with respect to cattle. U.S.and Canadian cattle exports continue to be subject to stringent trade restric-tions, but the current regulations of the NAFTA countries allow for the impor-tation of U.S. and Canadian boneless beef from cattle less than 30 months ofage. Such animals are considered to have a minimal risk of transmitting BSE.
A high degree of integration continues to prevail among the cattle and beefindustries of Mexico and the United States. The United States is a netimporter of cattle from Mexico, primarily feeder calves. About one-fourth ofU.S. cattle imports enter at a single port in Santa Teresa, New Mexico(Skaggs, Acuña, Torell, and Southard, 2004). Texas or New Mexico is theinitial destination for most of the cattle that enter at Santa Teresa, but someanimals imported through this port are shipped as far as Washington, Iowa,and Mississippi. Mexico is also a major market for U.S. beef. In 2004, U.S.beef exports to Mexico approached 107,000 metric tons (U.S. $372million), compared with an annual average of 58,000 metric tons (U.S. $171million) during 1991-93, despite the interruption of this trade fromDecember 2003 to March 2004 due to the U.S. BSE discovery.
Hog production in Canada and the United States is highly integrated, withCanada exporting increasing numbers of animals to the United States forfinishing (the last stage of production) and slaughter. Canadian hog exportsto the United States began to increase after Canada eliminated its graintransportation subsidy in 1995. This reform provided a powerful incentiveto produce hogs in Western Canada, where much of the country’s grainproduction is located. Structural changes in the U.S. pork industry alsohelped set the stage for integration. Beginning in the 1980s, many of thesmaller, farrow-to-finish producers that traditionally populated the U.S.Corn Belt exited the industry in favor of larger operations that specialize infinishing. In addition, consolidation in packing and processing has led to theemergence of much larger operations that use slaughter capacity more inten-sively through second shifts and the slaughtering of animals on Saturday. Tofurther use capacity, U.S. packers have bid hog prices higher, effectivelydrawing Canadian slaughter hogs into the United States (Haley, 2004).
13NAFTA at 11: The Growing Integration of North American Agriculture
Economic Research Service/USDA

Gradual trade liberalization under NAFTA has facilitated a medium degreeof integration with respect to U.S. pork and poultry producers and theMexican market. For both the pork and poultry industries in Mexico, thisintegration has coincided with increased pressures to expand and consoli-date. Although Mexican pork production has increased by more than 30percent during the NAFTA period, imports are expected to account for about26 percent of Mexican pork consumption in 2004, compared with 6 percentin 1996. Mexico’s large, technically advanced hog producers are very effi-cient, but its small producers have high production costs, primarily becausethey buy commercial feed rather than manufacture it themselves.
Rising imports and the restructuring of Mexico’s hog industry have providedthe context for several allegations of dumping concerning U.S. exports toMexico. From early 1999 to May 2003, Mexico imposed antidumpingduties on U.S. hogs—an action that dramatically reduced U.S. hog exportsto Mexico. In May 2004, the Mexican Government initiated an antidumpinginvestigation about U.S. pork leg exports to Mexico, after rejecting anearlier petition filed by a Mexican producer group concerning a broad rangeof pork products.
The Mexican poultry industry also is undergoing significant internal changes.Three firms have captured the lion’s share of Mexican consumption growthin recent years and now account for about 60 percent of the industry’s output.The largest of these producers (Bachoco) is a Mexican firm, while the second-and third-largest (Pilgrim’s Pride and Tyson de México, respectively) areaffiliates of U.S. corporations. These firms appear to be in an excellent posi-tion to supply Mexico’s retail sector, which is expanding rapidly.
Compared with the Mexican hog industry, the Mexican poultry industry hasfaced less direct competition from the United States during the process of
trade liberalization, a situation thatmay change in the future. In 2003,about two-thirds of Mexicanpoultry imports from the UnitedStates (in terms of value)consisted of either turkey meat ormechanically deboned meat(MDM), which is a key ingredientin sausages and cold cuts (fig. 4).Neither turkey meat nor MDM isproduced in Mexico in large quan-tities. To give the Mexican poultryindustry additional time to adjustto trade liberalization, a temporarysafeguard TRQ is in effect untilJanuary 1, 2008, for U.S. exportsto Mexico of chicken leg quarters.
A low degree of integrationpersists regarding Mexican porkand poultry producers and theU.S. market. Although U.S. tariffson Mexican pork and poultry were
14NAFTA at 11: The Growing Integration of North American Agriculture
Economic Research Service/USDA
Figure 4
In 2003, about two-thirds of U.S.poultry meat exports to Mexico (in terms of value) consisted ofcommodities that Mexico does not produce in large quantities
MDM = Mechanically deboned meat.Source: Mexican Secretariat of Economy,
as reported by Global Trade Information Services, Inc. (2004).
Turkey cutsand edible
offal, exceptMDM45%
Turkey MDM4%
ChickenMDM15%
Chicken cutsand edible
offal, exceptMDM32%
Other products4%
eliminated upon NAFTA’s implementation, the United States imports verylittle Mexican pork and poultry due to sanitary regulations. Regionalizationand continued Mexican progress in controlling such animal diseases asClassical Swine Fever (CSF) and Exotic Newcastle Disease (END) areexpected to create additional opportunities for Mexico to export pork andpoultry meat to the United States. Mexico has already become an importantsupplier of pork to Japan.
Integration of the U.S. and Canadian dairy and poultry industries is limitedby the exclusion of these sectors from bilateral trade liberalization underCFTA and NAFTA. Despite this obstacle, U.S. dairy and poultry exports toCanada have managed to grow in some product categories. Canada has along history of offering supplemental import permits in addition to the duty-free amounts specified by the country’s tariff-rate quota for importedpoultry. This practice has enabled U.S. chicken exports to Canada to growmuch faster than Canadian production, particularly since 1995. In addition,U.S. exports to Canada of relatively minor dairy-based products, such asfood preparations for infant use, have recently risen, largely because theseproducts face no import quotas and now enjoy duty-free status in Canada(app. table 1).
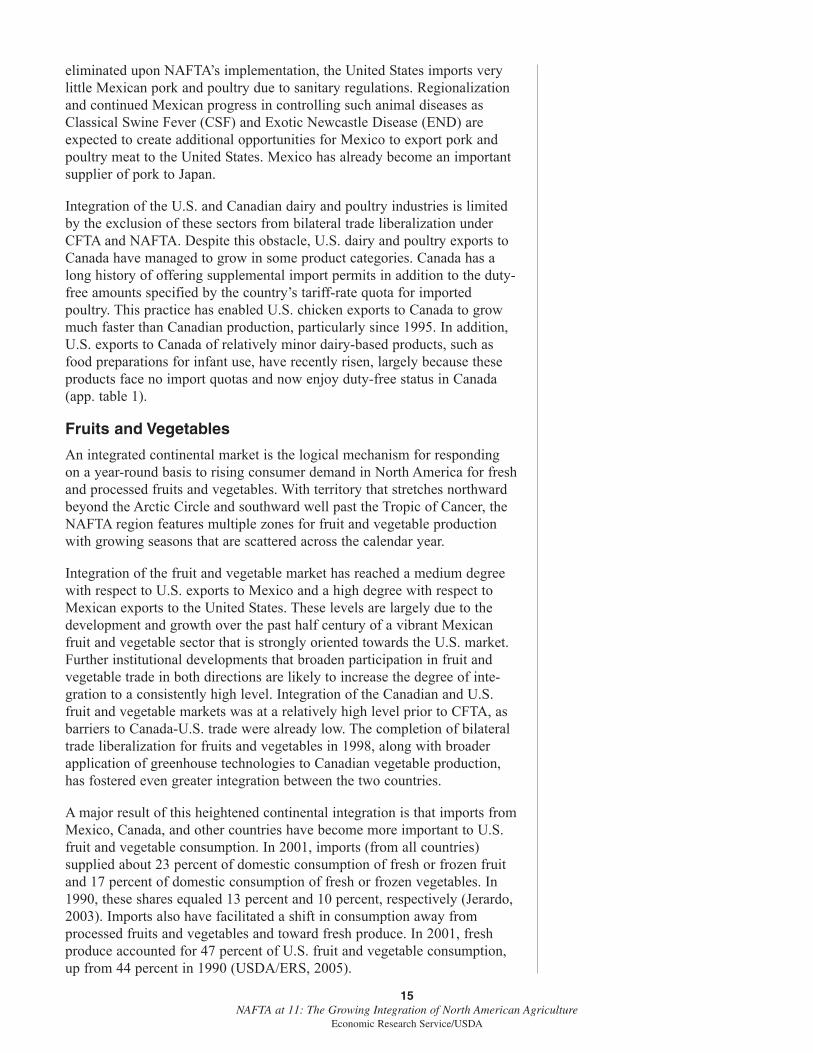
Fruits and Vegetables
An integrated continental market is the logical mechanism for respondingon a year-round basis to rising consumer demand in North America for freshand processed fruits and vegetables. With territory that stretches northwardbeyond the Arctic Circle and southward well past the Tropic of Cancer, theNAFTA region features multiple zones for fruit and vegetable productionwith growing seasons that are scattered across the calendar year.
Integration of the fruit and vegetable market has reached a medium degreewith respect to U.S. exports to Mexico and a high degree with respect toMexican exports to the United States. These levels are largely due to thedevelopment and growth over the past half century of a vibrant Mexicanfruit and vegetable sector that is strongly oriented towards the U.S. market.Further institutional developments that broaden participation in fruit andvegetable trade in both directions are likely to increase the degree of inte-gration to a consistently high level. Integration of the Canadian and U.S.fruit and vegetable markets was at a relatively high level prior to CFTA, asbarriers to Canada-U.S. trade were already low. The completion of bilateraltrade liberalization for fruits and vegetables in 1998, along with broaderapplication of greenhouse technologies to Canadian vegetable production,has fostered even greater integration between the two countries.
A major result of this heightened continental integration is that imports fromMexico, Canada, and other countries have become more important to U.S.fruit and vegetable consumption. In 2001, imports (from all countries)supplied about 23 percent of domestic consumption of fresh or frozen fruitand 17 percent of domestic consumption of fresh or frozen vegetables. In1990, these shares equaled 13 percent and 10 percent, respectively (Jerardo,2003). Imports also have facilitated a shift in consumption away fromprocessed fruits and vegetables and toward fresh produce. In 2001, freshproduce accounted for 47 percent of U.S. fruit and vegetable consumption,up from 44 percent in 1990 (USDA/ERS, 2005).
15NAFTA at 11: The Growing Integration of North American Agriculture
Economic Research Service/USDA

Net imports (i.e., imports minus exports) provide another indicator of theincreased reliance on imports to supply U.S. fruit and vegetable consump-tion (table 2). Prior to NAFTA, net imports (from all countries) alreadyexceeded 60 percent of U.S. consumption for fresh limes, fresh mangos, andfrozen broccoli and cauliflower. Since NAFTA’s implementation, freshpapayas have joined the group of commodities where net imports exceed 60percent of consumption. A number of commodities—including cantaloupe,fresh asparagus, cucumbers, eggplant, and tomatoes—have experienced anoteworthy increase in net imports’ share of consumption during theNAFTA period. Total U.S. imports of fruits and vegetables averaged aboutU.S. $10.1 billion during 2001-03. Mexico accounted for 30 percent ofthese imports, while Canada accounted for 17 percent. The United States isalso a major exporter of fruits and vegetables. During 2001-03, the annualvalue of these exports averaged about $7.5 billion, of which 36 percent wasdestined for Canada and 11 percent for Mexico.
Mexican growers have been major participants in the expansion of NorthAmerican fruit and vegetable trade. Since NAFTA’s implementation, Mexicanfruit and vegetable exports to the United States have more than doubled,reaching an annual average of nearly $3.0 billion during 2001-03. Mean-while, Canada has emerged as an important supplier to the United States offresh tomatoes (many of which are grown in greenhouses), peppers, andmushrooms, in addition to fresh and frozen potatoes (app. table 2). U.S.growers have been active participants in the Canadian market for sometime, with annual fruit and vegetable exports to Canada averaging $2.7billion during 2001-03. Eliminating the remaining tariffs on U.S.-Canada
16NAFTA at 11: The Growing Integration of North American Agriculture
Economic Research Service/USDA
Table 2—Net imports now account for a larger proportion of U.S. consumption of certain fruits and vegetables
Net imports divided Averageby consumption per capita use
Commodity 1991-93 2000-02 1991-93 2000-02
——-Percent——- —-Kilograms—-Selected fruits:
Fresh grapes1 15 18 3.4 3.5Fresh limes1 66 93 .4 .6Fresh mangos2 92 100 .4 .8Fresh papayas3 8 76 .1 .3Fresh strawberries3 -8 -4 1.6 2.1Cantaloupe 19 30 3.9 5.0Watermelon 1 5 6.3 6.6
Selected vegetables:Asparagus, fresh 12 45 .3 .4Bell peppers 5 16 2.5 3.0Broccoli and cauliflower, frozen 66 70 1.4 1.3Cucumbers 28 40 2.2 2.9Eggplant 19 29 .2 .4Onions, fresh -20 -3 7.4 8.2Tomatoes 9 26 7.1 8.11Information is reported for the 1990/91, 1991/92, and 1992/93 seasons instead of the
1991-93 calendar years and for the 1999/2000, 2000/01, and 2001/02 seasons instead of the2000-02 calendar years.
2Trade data for 1991-92 also include mangosteens and guavas.3Information is reported for 1999-2001 instead of 2000-02.Source: USDA/ERS.
trade has given Canadian consumers tariff-free access to the full range ofU.S. produce—facilitating the growth of U.S. exports of strawberries, cher-ries, pears, carrots, lettuce, and potatoes, among other commodities.
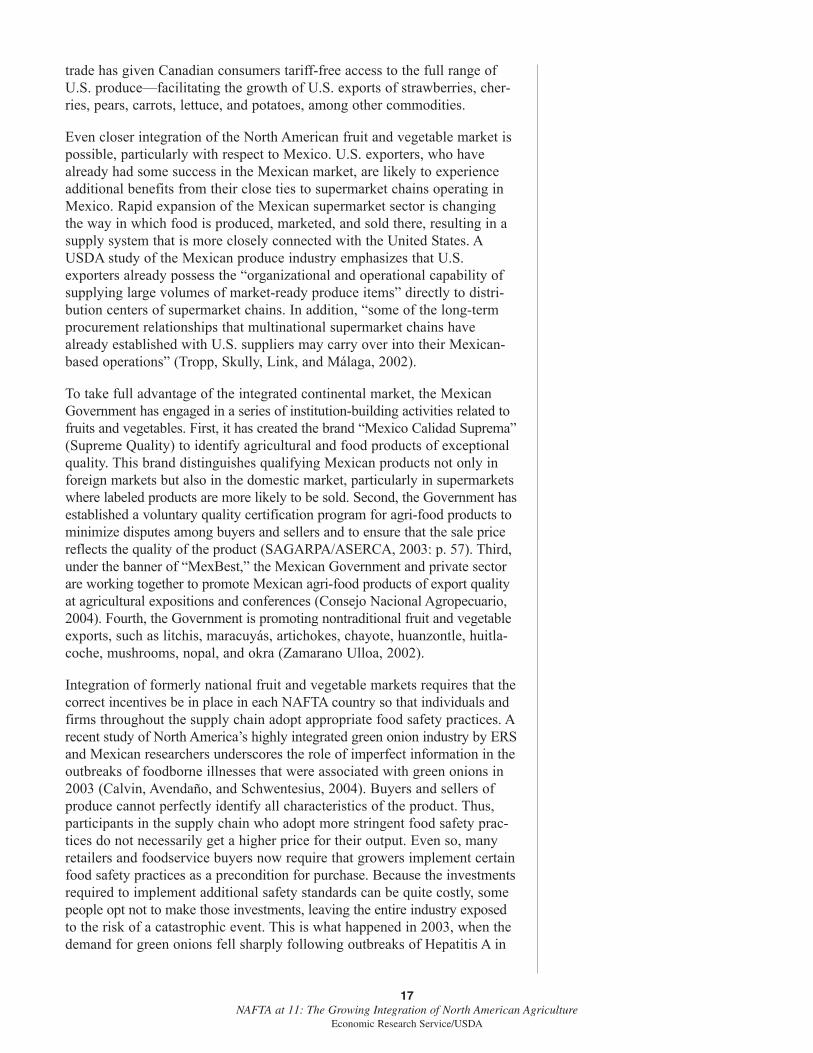
Even closer integration of the North American fruit and vegetable market ispossible, particularly with respect to Mexico. U.S. exporters, who havealready had some success in the Mexican market, are likely to experienceadditional benefits from their close ties to supermarket chains operating inMexico. Rapid expansion of the Mexican supermarket sector is changingthe way in which food is produced, marketed, and sold there, resulting in asupply system that is more closely connected with the United States. AUSDA study of the Mexican produce industry emphasizes that U.S.exporters already possess the “organizational and operational capability ofsupplying large volumes of market-ready produce items” directly to distri-bution centers of supermarket chains. In addition, “some of the long-termprocurement relationships that multinational supermarket chains havealready established with U.S. suppliers may carry over into their Mexican-based operations” (Tropp, Skully, Link, and Málaga, 2002).
To take full advantage of the integrated continental market, the MexicanGovernment has engaged in a series of institution-building activities related tofruits and vegetables. First, it has created the brand “Mexico Calidad Suprema”(Supreme Quality) to identify agricultural and food products of exceptionalquality. This brand distinguishes qualifying Mexican products not only inforeign markets but also in the domestic market, particularly in supermarketswhere labeled products are more likely to be sold. Second, the Government hasestablished a voluntary quality certification program for agri-food products tominimize disputes among buyers and sellers and to ensure that the sale pricereflects the quality of the product (SAGARPA/ASERCA, 2003: p. 57). Third,under the banner of “MexBest,” the Mexican Government and private sectorare working together to promote Mexican agri-food products of export qualityat agricultural expositions and conferences (Consejo Nacional Agropecuario,2004). Fourth, the Government is promoting nontraditional fruit and vegetableexports, such as litchis, maracuyás, artichokes, chayote, huanzontle, huitla-coche, mushrooms, nopal, and okra (Zamarano Ulloa, 2002).
Integration of formerly national fruit and vegetable markets requires that thecorrect incentives be in place in each NAFTA country so that individuals andfirms throughout the supply chain adopt appropriate food safety practices. Arecent study of North America’s highly integrated green onion industry by ERSand Mexican researchers underscores the role of imperfect information in theoutbreaks of foodborne illnesses that were associated with green onions in2003 (Calvin, Avendaño, and Schwentesius, 2004). Buyers and sellers ofproduce cannot perfectly identify all characteristics of the product. Thus,participants in the supply chain who adopt more stringent food safety prac-tices do not necessarily get a higher price for their output. Even so, manyretailers and foodservice buyers now require that growers implement certainfood safety practices as a precondition for purchase. Because the investmentsrequired to implement additional safety standards can be quite costly, somepeople opt not to make those investments, leaving the entire industry exposedto the risk of a catastrophic event. This is what happened in 2003, when thedemand for green onions fell sharply following outbreaks of Hepatitis A in
17NAFTA at 11: The Growing Integration of North American Agriculture
Economic Research Service/USDA
the United States, since it was not possible to identify precisely at whatpoint in the supply chain that the produce in question became contaminated.
Producer groups have played an important role in facilitating the integrationof the continental fruit and vegetable market. For example, produce compa-nies from each NAFTA country have joined together to form the Fruit andVegetable Dispute Resolution Corporation (DRC). The DRC is a private,nonprofit organization “dedicated to the provision of fair, efficient, andaffordable dispute resolution services” (DRC, 2004). One of the DRC’smain contributions to market integration is the institution of a multi-stepdispute resolution system that begins with preventative activities and coop-erative problem-solving and then proceeds gradually to more binding meas-ures. The DRC also maintains a public list of companies for whichmembership was suspended or terminated for not abiding by the organiza-tion’s rules and standards. The DRC was established in 1999 in response toArticle 707 of NAFTA, which called for an advisory committee on privatecommercial disputes regarding agricultural goods.
In addition, producer groups have successfully used negotiations as a way toaddress tensions among the NAFTA partners involving allegations of dumping.In cases involving U.S. apple exports to Mexico and Mexican tomato exportsto the United States, producer groups have agreed to the suspension of theantidumping investigation for long periods in exchange for a reference pricefor the commodity in question. Compared with the imposition of a prohibi-tive antidumping duty, such agreements are likely to facilitate highervolumes of trade at a lower price, thereby improving consumer welfare.
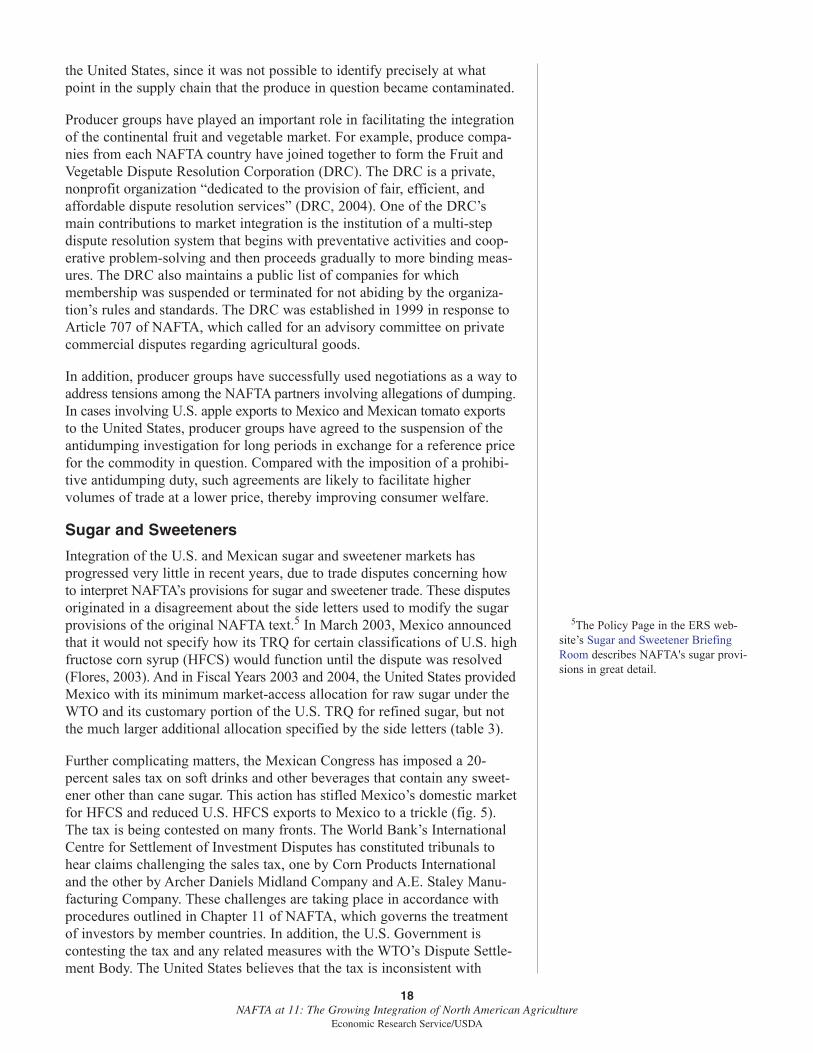
Sugar and Sweeteners
Integration of the U.S. and Mexican sugar and sweetener markets hasprogressed very little in recent years, due to trade disputes concerning howto interpret NAFTA’s provisions for sugar and sweetener trade. These disputesoriginated in a disagreement about the side letters used to modify the sugarprovisions of the original NAFTA text.5 In March 2003, Mexico announcedthat it would not specify how its TRQ for certain classifications of U.S. highfructose corn syrup (HFCS) would function until the dispute was resolved(Flores, 2003). And in Fiscal Years 2003 and 2004, the United States providedMexico with its minimum market-access allocation for raw sugar under theWTO and its customary portion of the U.S. TRQ for refined sugar, but notthe much larger additional allocation specified by the side letters (table 3).
Further complicating matters, the Mexican Congress has imposed a 20-percent sales tax on soft drinks and other beverages that contain any sweet-ener other than cane sugar. This action has stifled Mexico’s domestic marketfor HFCS and reduced U.S. HFCS exports to Mexico to a trickle (fig. 5).The tax is being contested on many fronts. The World Bank’s InternationalCentre for Settlement of Investment Disputes has constituted tribunals tohear claims challenging the sales tax, one by Corn Products Internationaland the other by Archer Daniels Midland Company and A.E. Staley Manu-facturing Company. These challenges are taking place in accordance withprocedures outlined in Chapter 11 of NAFTA, which governs the treatmentof investors by member countries. In addition, the U.S. Government iscontesting the tax and any related measures with the WTO’s Dispute Settle-ment Body. The United States believes that the tax is inconsistent with
18NAFTA at 11: The Growing Integration of North American Agriculture
Economic Research Service/USDA
5The Policy Page in the ERS web-site’s Sugar and Sweetener BriefingRoom describes NAFTA's sugar provi-sions in great detail.

Mexico’s obligations under Article II of the 1994 General Agreement onTrade and Tariffs. This article requires that taxes on comparable domesticand imported products be applied in a nondiscriminatory manner (WorldTrade Organization, 2004).
19NAFTA at 11: The Growing Integration of North American Agriculture
Economic Research Service/USDA
Table 3—U.S. sugar imports from Mexico under tariff-rate quota (TRQ), fiscal years 1996-2003
Item 1996 1997 1998 1999 2000 2001 2002 2003
Metric tons, raw value (MTRV)NAFTA TRQ:1
TRQ allocation — 25,000 25,000 25,000 25,000 105,788 137,788 0Actual imports — 23,892 25,000 23,715 25,000 98,653 130,1202 0
Raw sugar TRQ:TRQ allocation 7,258 — — — — 7,258 7,258 7,258Actual imports 6,973 — — — — 7,258 7,258 7,258
Refined sugar TRQ:(September allocation):TRQ allocation — — 2,954 2,954 2,954 2,954 2,954 2,954Actual imports — — 2,954 2,954 2,954 2,954 2,954 0
Total TRQ:TRQ allocations 7,258 25,000 27,954 27,954 27,954 116,000 148,000 10,212Actual imports 6,973 23,892 27,954 26,669 27,954 108,865 140,332 7,258
— = Not applicable.1Mexico's NAFTA allocation may be shipped either raw or refined.2This amount includes (a) 18,985 MTRV that arrived after the end of FY 2002 and were unavoidably delayed in transit and
(b) 2,900 MTRV that arrived on October 1, 2002, but were counted as having entered in FY 2002.Source: USDA/FAS, as cited by USDA/ERS (July 13, 2004), Tables 23a-23c.
Figure 5
Mexico’s sales tax on beverages containing sweeteners other than cane sugar has sharply curtailed U.S. exports to Mexico of high fructose corn syrup
Metric tons, commercial value
Source: Mexico, Secretariat of Economy, as cited by USDA/ERS (July 13, 2004), Table 35.
2001
25,000
5,000
10,000
15,000
20,000
0Jan Mar NovSeptJulMay
2001
2002
Jan Mar NovSeptJulMay
2003
Jan Mar NovSeptJulMay

Although sugar trade between Canada and the United States was formallyexempted from trade liberalization under CFTA and NAFTA, bilateral tradein sugar-containing products has expanded over the past decade. The UnitedStates exports large quantities of chocolates and other sugar-containingconfectionery, baked goods, and breakfast cereals to Canada. It also importslarge quantities of baked goods, confectionery products, and chewing gumfrom Canada (app. tables 1 and 2). Mexico and the United States trade asizable amount of sugar-containing products as well (app. tables 3 and 4).When trade with all countries is considered, the annual amount of sugar inU.S. imports of sugar-containing products has exceeded the sugar containedin corresponding exports since 1998, according to ERS estimates (Haley,2003). In 2002, sugar in imported products exceeded sugar in exportedproducts by some 79-86 percent.
Rising net imports in sugar-containing products may be linked to the recentdecline in U.S. sugar deliveries to industrial end users. Between 1999 and2003, these deliveries dropped from 5.6 million to 4.9 million short tons,refined value—a decline of 13 percent (USDA, National Agricultural Statis-tics Service and Farm Services Agency, as cited by USDA/ERS, September2004). One explanation of this phenomenon is that the U.S. sugar programtends to make sugar within the United States more expensive than sugarabroad. Empirical analysis suggests that imports of sugar-containing prod-ucts have negatively affected U.S. sugar deliveries to the confectioneryindustry and other segments of the processed food industry, but not tomanufacturers of baked goods and cereals (Haley, 2003).
Processed Foods6
The Canadian and U.S. processed food industries have reached a very highlevel of integration, while the Mexican and U.S. processed food industrieshave achieved a medium level. Canada and the United States have a substantialamount of FDI in each other’s processed food industry and large and growingflows of intra-industry trade in intermediate and final food products. TheUnited States has sizable investments in the Mexican processed food industry,and Mexico has important investments in certain segments of the U.S. industry,such as baked goods and Mexican-style foods. A processed item, beer, isMexico’s leading agricultural export to the United States. In 2003, Mexicanbeer exports to the United States exceeded U.S. $1 billion for the first time.
Given that Mexico is more than three times larger in population thanCanada, the investments linking the Canadian and U.S. processed foodindustries are much larger in relative terms than those connecting theMexican and U.S. processed food industries. For this reason, integration ofthe processed food industry between Mexico and the United States may beviewed as being at a medium level. Income is a major determinant ofprocessed food demand. Thus, further increases in per capita income inMexico, along with additional improvements in the country’s transportationand retail systems, are likely to advance the integration of the U.S. andMexican processed food markets to a high level.
U.S. firms undertake most of the FDI in the North American processed foodsector. In 2003, the stock of U.S. direct investment in the Canadian andMexican food industries equaled U.S. $4.3 billion and U.S. $1.7 billion,respectively (app. table 5). In contrast, the stock of Canadian and Mexican
20NAFTA at 11: The Growing Integration of North American Agriculture
Economic Research Service/USDA
6Parts of this section are drawn fromDoan, Goldstein, Zahniser, Vollrath,and Bolling (2004).
direct investment in the U.S. processed food industry was about U.S. $1.1billion for both countries.7 U.S. authorities do not routinely report similarstatistics for the beverage industry and production agriculture, mainly toprotect the confidentiality of individual companies. The stock of intra-NAFTA direct investment probably runs in the billions of U.S. dollars forthe beverage industry and the hundreds of millions of U.S. dollars for cropand livestock production.
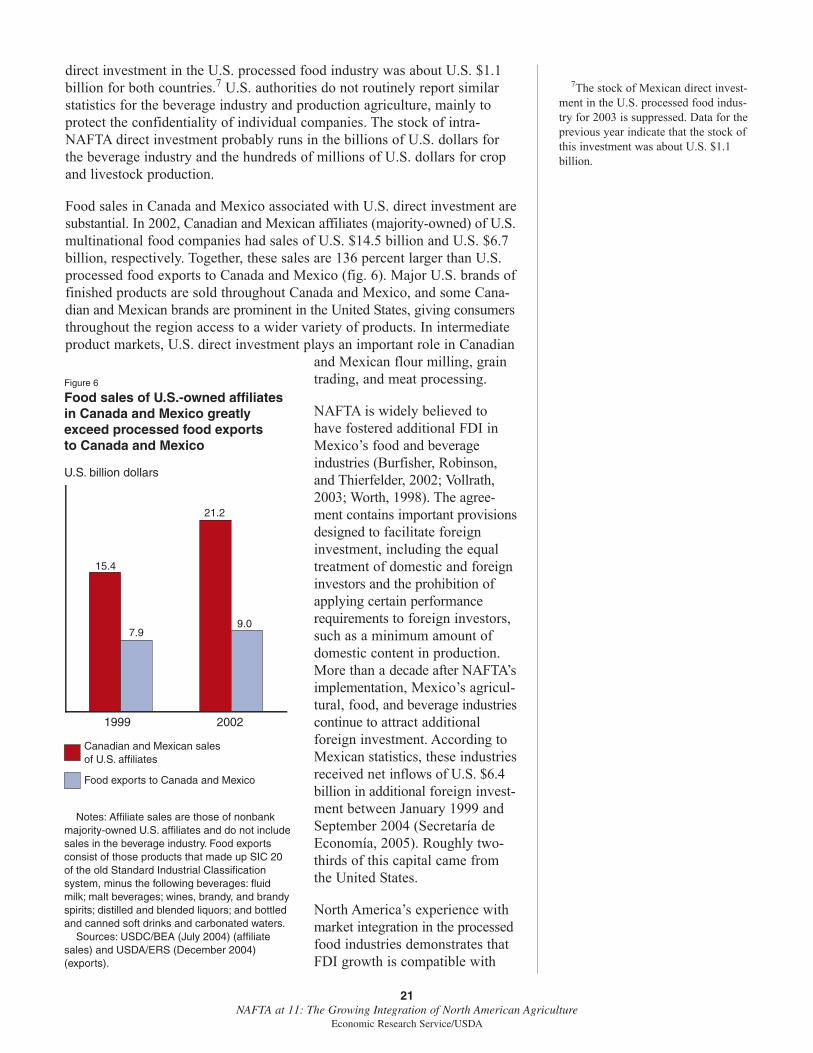
Food sales in Canada and Mexico associated with U.S. direct investment aresubstantial. In 2002, Canadian and Mexican affiliates (majority-owned) of U.S.multinational food companies had sales of U.S. $14.5 billion and U.S. $6.7billion, respectively. Together, these sales are 136 percent larger than U.S.processed food exports to Canada and Mexico (fig. 6). Major U.S. brands offinished products are sold throughout Canada and Mexico, and some Cana-dian and Mexican brands are prominent in the United States, giving consumersthroughout the region access to a wider variety of products. In intermediateproduct markets, U.S. direct investment plays an important role in Canadian
and Mexican flour milling, graintrading, and meat processing.
NAFTA is widely believed tohave fostered additional FDI inMexico’s food and beverageindustries (Burfisher, Robinson,and Thierfelder, 2002; Vollrath,2003; Worth, 1998). The agree-ment contains important provisionsdesigned to facilitate foreigninvestment, including the equaltreatment of domestic and foreigninvestors and the prohibition ofapplying certain performancerequirements to foreign investors,such as a minimum amount ofdomestic content in production.More than a decade after NAFTA’simplementation, Mexico’s agricul-tural, food, and beverage industriescontinue to attract additionalforeign investment. According toMexican statistics, these industriesreceived net inflows of U.S. $6.4billion in additional foreign invest-ment between January 1999 andSeptember 2004 (Secretaría deEconomía, 2005). Roughly two-thirds of this capital came fromthe United States.
North America’s experience withmarket integration in the processedfood industries demonstrates thatFDI growth is compatible with
21NAFTA at 11: The Growing Integration of North American Agriculture
Economic Research Service/USDA
7The stock of Mexican direct invest-ment in the U.S. processed food indus-try for 2003 is suppressed. Data for theprevious year indicate that the stock ofthis investment was about U.S. $1.1billion.
Figure 6
Food sales of U.S.-owned affiliates in Canada and Mexico greatly exceed processed food exports to Canada and Mexico
U.S. billion dollars
Notes: Affiliate sales are those of nonbankmajority-owned U.S. affiliates and do not include sales in the beverage industry. Food exports consist of those products that made up SIC 20 of the old Standard Industrial Classification system, minus the following beverages: fluid milk; malt beverages; wines, brandy, and brandyspirits; distilled and blended liquors; and bottled and canned soft drinks and carbonated waters.
Sources: USDC/BEA (July 2004) (affiliate sales) and USDA/ERS (December 2004)(exports).
20021999
15.4
7.9
21.2
9.0
Canadian and Mexican sales of U.S. affiliates
Food exports to Canada and Mexico

trade growth. U.S. direct investment is present in nearly every segment ofthe Canadian and Mexican processed food industries in which there aresubstantial U.S. exports to the NAFTA countries. There is a strong tendencyfor FDI and processed food exports to grow together because incomegrowth is a driving force of increasing processed food consumption ingeneral (Bolling and Jerardo, 2002).
Through direct investments in the other NAFTA countries, several largecompanies from Canada and Mexico have reinvented themselves as larger,stronger, and more viable firms. In some instances, the resulting operationsoutside the home country rival the operations in the home country in sizeand importance. Canada’s McCain Food, for example, has evolved from asmall producer of frozen French fries to the country’s largest processed foodcompany, supplying both retailers and foodservice providers. In the NAFTAregion alone, the firm operates 11 processing facilities in Canada, 8 in theUnited States, and 1 in Mexico. Another Canadian example is GeorgeWeston Limited, the food-producing segment of which, Weston Foods, isprominent in the U.S. baked goods industry. Weston Foods has roughly a 5-percent share of the U.S. bakery products market, and in 2003, the UnitedStates accounted for about 75 percent of Weston Foods’ sales.
Several Mexican food companies have similar histories. For example,Gruma has emerged as the world’s largest producer of corn flour andtortillas, as well as the largest such producer in the United States, due partlyto a joint venture with Archer Daniels Midland. For the last several years,Gruma’s U.S. operations have accounted for about half of its total corporatesales. In addition, Mexico’s largest baking company, GIBSA (GrupoBimbo), has purchased several bread-baking enterprises in the WesternUnited States. GIBSA is now the world’s third-largest baker, with roughly a5-percent share of the U.S. market for bakery products.
Transportation
Not only do Canadian and U.S. trucks share each other’s roadways, butintegration and coordination are greater among U.S. and Canadian railways,spurred partly by the merger of the Canadian National and Illinois Centralrailroads in 1999. Similar innovations have taken place in rail and maritimetransport linking Mexico and the United States. NAFTA’s motor carrierprovisions allow Mexican trucks to operate throughout the United States. InJune 2004, the U.S. Supreme Court unanimously overturned an earlier deci-sion by a U.S. appeals court that had further delayed the implementation ofthese provisions. This action is likely to lead to the implementation ofNAFTA’s trucking provisions.
22NAFTA at 11: The Growing Integration of North American Agriculture
Economic Research Service/USDA

Integration is enabling the formerly segmented national markets of Canada,Mexico, and the United States to function more efficiently, creating an envi-ronment that facilitates economic growth (Vollrath, 2003). For farmers,ranchers, and food processors, integration is allowing competitive marketforces to play a more dominant role in the allocation of resources, aseconomic agents more fully use their relative strengths. In this environment,U.S. feedstuffs are making possible an expansion of Mexican meat produc-tion, North America’s fruit and vegetable producers are refining their effortsto supply the broader continental market, and multinational food companiesare adapting and expanding their activities in each NAFTA country. Forconsumers, integration offers such benefits as lower food prices, greatervariety in food products, and year-round availability of fresh produce. Someof these benefits are apparent in the rising level of per capita meat consump-tion in Mexico and the growing importance of Canadian and Mexicanproduce to U.S. fruit and vegetable consumption.
Nevertheless, the empirical research on these effects is still far fromcomprehensive. Much is known about the changes in regional agriculturaltrade since NAFTA’s implementation and how these changes relate tosupply-side aspects of North American agriculture. Linking these changes tothe demand-side of agriculture has attracted far less attention, even thoughconsumers as an aggregated group are the greatest beneficiaries of integra-tion. This lack of attention may be partly attributable to the rising afford-ability of food. For U.S. consumers, food expenditures have accounted forabout 10 percent of disposable personal income throughout the NAFTAperiod (USDA/ERS, July 2004). For Mexican consumers, in contrast, theshare of household expenditures devoted to food, beverages, and tobaccohas fallen from 36 percent in 1992 to 31 percent in 2002 (Encuesta Nacionalde Ingresos y Gastos de Hogares, as cited by INEGI, 2003). Completing thecircle of analysis to encompass both the demand- and supply-side effects ofintegration thus should be a focus of future research, which is likely tobroaden the public’s understanding of integration.
23NAFTA at 11: The Growing Integration of North American Agriculture
Economic Research Service/USDA
Conclusion

Bolling, Chris, and Andy Jerardo. “Investment in Agriculture and FoodProcessing,” in Steven Zahniser and John Link (eds.), Effects of NorthAmerican Free Trade Agreement on Agriculture and the Rural Economy,Electronic Outlook Report WRS-02-1, USDA/ERS, July 2002, available at:http://www.ers.usda.gov/publications/wrs0201/
Burfisher, Mary E., Sherman Robinson, and Karen Thierfelder, 2002.“Developing Countries and the Gains from Regionalism: Links BetweenTrade and Farm Policy Reforms in Mexico,” American Journal of Agricul-tural Economics 84(3):736-48.
Calvin, Linda, Belem Avendaño, and Rita Schwentesius. The Economics ofFood Safety: The Case of Green Onions and Hepatitis A Outbreaks, Electronic Outlook Report VGS-305-01, USDA/ERS, December 2004,available at: http://www.ers.usda.gov/publications/vgs/nov04/VGS30501/
Consejo Nacional Agropecuario. MexBest website, 2004, available at:http://www.mexbest.com.mx
Cook, Ramsay. “The Triumphs and Trials of Materialism (1900-1945),” inCraig Brown (ed.), The Illustrated History of Canada, Toronto: Key PorterBooks, 1997, pp. 375-466.
Dispute Resolution Corporation (DRC). “Fruit and Vegetable Dispute Reso-lution Corporation” website, 2004, available at: http://www.fvdrc.com/en/main-e.htm
Doan, Darcie, Andrew Goldstein, Steven Zahniser, Thomas Vollrath, andChris Bolling. “North American Integration in Agriculture: A SurveyPaper,” paper presented at the 2004 Workshop of the North American Agri-food Market Integration Consortium, May 6-7, 2004, Cancún, QuintanaRoo, available at: http://naamic.tamu.edu/cancun/doan.pdf
Fiess, Norbert, and Daniel Lederman. Mexican Corn: The Effects ofNAFTA, World Bank Trade Note 18, September 24, 2004, available at:http://wbln0018.worldbank.org/LAC/LACInfoClient.nsf/d29684951174975c85256735007fef12/026efe204f018bc885256f40006d1901/$FILE/TradeNote18.pdf
Flores, Dulce. Import Criteria to Import HFCS into Mexico, Global Agricul-tural Information Network Report MX3034, USDA/FAS, March 25, 2003,available at: http://www.fas.usda.gov/gainfiles/200303/145885036.pdf
Global Trade Information Services, Inc. World Trade Atlas, Internet Edition,Columbia, SC, 2004.
Goodloe, Carol. “The Canadian Wheat Board: Government Guarantees andHidden Subsidies?” The Estey Centre Journal of International Law andTrade Policy 5(2)(2004):102-22, available at: http://www.esteycentre.ca/journal/
24NAFTA at 11: The Growing Integration of North American Agriculture
Economic Research Service/USDA
References

Haley, Mildred M. Market Integration in the North American Hog Industries,Electronic Outlook Report LDP-M-125-01, USDA/ERS, November 2004,available at: http://www.ers.usda.gov/publications/ldp/NOV04/ldpm12501/
Haley, Stephen. Measuring the Effect of Imports of Sugar-Containing Prod-ucts on U.S. Sugar Deliveries, Electronic Outlook Report SSS-237-01,USDA/ERS, September 2003, available at: http://usda.mannlib.cornell.edu/reports/erssor/specialty/sss-bb/2003/sss23701.pdf
Instituto Nacional de Estadística, Geografía, e Informática (INEGI). Banco deInformación Económica, Sector Manufacturero, Encuesta Industrial Anual,Empleo, 2004, available at: http://dgcnesyp.inegi.gob.mx/cgi-win/bdieintsi.exe
Instituto Nacional de Estadística, Geografía, e Informática (INEGI).“Distribución Porcentual del Gasto de los Hogares por Sexo del Jefe yGrandes Rubros del Gasto, 1992-2002,” last updated June 16, 2003, avail-able at: http://www.inegi.gob.mx/est/contenidos/espanol/tematicos/mediano/med.asp?t=ming06&c=3319
Jerardo, Andy. Import Share of U.S. Food Consumption Stable at 11Percent, Electronic Outlook Report FAU-79-01, USDA/ERS, July 2003,available at: http://www.ers.usda.gov/Publications/fau/july03/fau7901/
Juarez, Benjamin, and Gabriel Hernandez. Mexico Poultry and Products Semi-Annual 2003, Global Agriculture Information NetworkReport No. MX3006, USDA/FAS, January 27, 2003, available at:http://www.fas.usda.gov/gainfiles/200301/145785177.pdf
Juarez, Benjamin, and Sal Trejo. Mexico Grain and Feed Annual Report2004, Global Agriculture Information Network Report No. MX4033,USDA/FAS, March 5, 2004, available at: http://www.fas.usda.gov/gainfiles/200403/146105603.pdf
Knutson, Ronald D., and René Ochoa. “Achieving Market Integration,” AgExporter, USDA/FAS, January 2004, pp. 9-10, available at: http://www.fas.usda.gov/info/agexporter/agexport.html
Knutson, Ronald D., R.M.A. Loyns, and René F. Ochoa. “Policy Options forFacilitating Change and Maintaining Competition Under Conditions of FreeTrade Within NAFTA,” in R.M.A. Loyns, Karl Mielke, Ronald D. Knuston,and Antonio Yunez-Naude (eds.), Structural Change as a Source of TradeDisputes Under NAFTA: Proceedings of the Seventh Agricultural and FoodPolicy Systems Information Workshop, College Station, TX: Texas A&MUniversity, University of Guelph, and El Colegio de México, February 2002,pp. 342-406, available at: http://pdic.tamu.edu/teal.htm
Morton, Desmond. “Strains of Affluence (1945-1996),” in Craig Brown(ed.), The Illustrated History of Canada, Toronto: Key Porter Books, 1997,pp. 467-562.
Reynolds, Clark. “Why Mexico’s ‘Stabilizing Development’ Was ActuallyDestabilizing (With Some Implications for the Future),” World Development6(7/8)(July/August 1978):1005-18.
25NAFTA at 11: The Growing Integration of North American Agriculture
Economic Research Service/USDA

Schnepf, Randy. “U.S.-Canada Wheat Trade Dispute,” CongressionalResearch Service (CRS), The Library of Congress, CRS Report forCongress, Order Code RL32426, updated version, June 14, 2004, availableat: http://www.ncseonline.org/NLE/CRSreports/04Jun/RL32426.pdf
Secretaría de Economía. “Cuadro No. 5: País de Origen de la InversiónExtranjera Directa Materializada en Alimentos, y Bebidas y Tabaco,” downloaded February 17, 2005, available at: http://www.economia.gob.mx/pics/p/p1177/ALISEP04.xls
Secretaría de Agricultura, Ganadería, Desarrollo Rural, Alimentación, yPesca, Servicio de Información Agroalimentaria y Pesquera(SAGARPA/SIAP). “Resumen Nacional: Producción de Carne en Canal:1990-2002,” downloaded Feburary 17, 2005, available at: http://www.siap.sagarpa.gob.mx/ar_compec_serhis.html
Secretaría de Agricultura, Ganadería, Desarrollo Rural, Pesca, yAlimentación, Apoyos y Servicios a la Comercialización Agropecuaria(SAGARPA/ASERCA). “Inspección de Calidad Agropecuaria,” in Clari-dades Agropecuarias 113(January 2003):57, available at: http://www.infoaserca.gob.mx/claridades/revistas/113/ca113.pdf#page=57
Skaggs, Rhonda, René Acuña, L. Allen Torell, and Leland Southard. “LiveCattle Exports from Mexico into the United States: Where Do the CattleCome From and Where Do They Go?” Choices (1st Quarter 2004):25-29,available at: http://www.choicesmagazine.org/2004-1/2004-1-05.htm
Tropp, Debra, David Skully, John Link, and Jaime Málaga. Mexico’s ChangingMarketing System for Fresh Produce: Emerging Markets, Practices, Trends,and Issues, USDA/AMS, October 2002, available at: http://www.ers.usda.gov/Briefing/NAFTA/PDFFiles/mexfreshprod.pdf
United Nations, Food and Agricultural Organization (UN/FAO). FAOSTATDatabase, December 12, 2004, available at: http://faostat.fao.org
U.S. Department of Agriculture, Agricultural Marketing Service(USDA/AMS). Grain and Feed Weekly Summary and Statistics, variousissues, 1991-2003, issues since 1998 available at: http://www.ams.usda.gov/LSMNpubs/mnsearch.htm
U.S. Department of Agriculture, Economic Research Service (USDA/ERS).Food Consumption (Per Capita) Data System: Food Availability, InteractiveDatabase, last updated February 1, 2005, available at: http://www.ers.usda.gov/data/foodconsumption/FoodAvailQueriable.aspx#midForm
U.S. Department of Agriculture, Economic Research Service (USDA/ERS).“Food CPI, Prices, and Expenditures: Expenditures as a Share of DisposableIncome,” website, last updated July 23, 2004, available at: http://www.ers.usda.gov/Briefing/CPIFoodAndExpenditures/Data/table7.htm
U.S. Department of Agriculture, Economic Research Service (USDA/ERS).Foreign Agricultural Trade of the United States Database, last updatedDecember 2, 2004, available at: http://www.ers.usda.gov/Data/FATUS/
26NAFTA at 11: The Growing Integration of North American Agriculture
Economic Research Service/USDA

U.S. Department of Agriculture, Economic Research Service (USDA/ERS).Processed Food Trade Database, 2003.
U.S. Department of Agriculture, Economic Research Service (USDA/ERS).“Table 21—U.S. Sugar Deliveries: Industrial and Nonindustrial Uses byRegion,” Sugar and Sweetener Yearbook Tables: Excel (.xls) Spreadsheets,September 21, 2004. available at: http://www.ers.usda.gov/Briefing/Sugar/Data/Table21.xls
U.S. Department of Agriculture, Economic Research Service (USDA/ERS).Sugar and Sweetener Data Tables, July 13, 2004. available at:http://www.ers.usda.gov/Briefing/Sugar/Data/data.htm
U.S. Department of Agriculture, Foreign Agricultural Service (USDA/FAS).PSD Online, interactive database, February 10, 2005, available at:http://www.fas.usda.gov/psd/
U.S. Department of Agriculture, Office of the Chief Economist(USDA/OCE). USDA Agricultural Baseline Projections to 2013. StaffReport WAOB-2004-1, February 2004, available at: http://www.ers.usda.gov/publications/waob041/
U.S. Department of Commerce, Bureau of Economic Analysis(USDC/BEA). “Foreign Direct Investment in the U.S.: Balance of Paymentsand Direct Investment Position,” last updated December 16, 2004a, avail-able at: http://www.bea.gov/bea/di/di1fdibal.htm
U.S. Department of Commerce, Bureau of Economic Analysis(USDC/BEA). “Sales by Majority-Owned Nonbank Foreign Affiliates,Country by Industry,” last updated July 21, 2004, available at: http://www.bea.gov/bea/di/di1usdop.htm
U.S. Department of Commerce, Bureau of Economic Analysis(USDC/BEA). “U.S. Direct Investment Abroad: Balance of Payments andDirect Investment Position Data,” last updated December 16, 2004b, available at: http://www.bea.gov/bea/di/di1usdbal.htm
U.S. Department of Commerce, Office of Textiles and Apparel (USDC/OTEXA). “U.S. General Imports in U.S. Dollars,” downloaded February 13,2005, available at: http://otexa.ita.doc.gov/scripts/tqads1.exe/ctrypage
Vollrath, Thomas L. “Gauging NAFTA’s Successes and Confronting FutureChallenges,” Ag Exporter, USDA/FAS, January 2004, pp. 7-8. Available at:http://www.fas.usda.gov/info/agexporter/agexport.html
Vollrath, Thomas L. North American Agricultural Market Integration andIts Impact on the Food and Fiber System, Agriculture Information BulletinNo. 784, USDA/ERS, September 2003, Available at: http://www.ers.usda.gov/publications/aib784/
Weintraub, Sidney. A Marriage of Convenience: Relations Between Mexicoand the United States. New York: Oxford University Press, 1990.
27NAFTA at 11: The Growing Integration of North American Agriculture
Economic Research Service/USDA

World Trade Organization (WTO). Mexico—Tax Measures on Soft Drinksand Other Beverages: Request for Consultations by the United States,Document No. WT/DS308/1, G/L/674, March 18, 2004, available at:http://www.wto.org/english/tratop_e/dispu_e/dispu_subjects_index_e.htm#sweetener_tax
Worth, Thomas. “Regional Trade Agreements and Foreign Direct Investment,”in Mary E. Burfisher and Elizabeth Jones (eds.), Regional Trade Agreementsand U.S. Agriculture, Agricultural Economic Report No. 771, USDA/ERS,November 1998, pp. 77-83, available at: http://www.ers.usda.gov/publications/aer771/
Zahniser, Steven S., and William T. Coyle. U.S.-Mexico Corn Trade Duringthe NAFTA Era: New Twists to an Old Story, Electronic Outlook ReportFDS-04D-01, USDA/ERS, May 2004, available at: http://www.ers.usda.gov/publications/FDS/may04/fds04D01/fds04D01.pdf
Zamarano Ulloa, José. “Oportunidades Comerciales y de Exportación de losAgroproductos no Tradicionales,” presentation at the First Regional OutlookForum of the Agrifood and Fishing Sector, organized by Secretaría de Agri-cultura, Ganadería, Desarrollo Rural, Pesca, y Alimentación (SAGARPA),Mazatlán, Sinaloa, November 5-6, 2002, available at: http://www.siap.sagarpa.gob.mx/ar_comforos.html
28NAFTA at 11: The Growing Integration of North American Agriculture
Economic Research Service/USDA

29NAFTA at 11: The Growing Integration of North American Agriculture
Economic Research Service/USDA
Appendix table 1—Selected U.S. agricultural exports to Canada, 1991-93 versus 2001-03
Value Volume Unit value
Commodities 1991-93 2001-03 Change 1991-93 2001-03 Change 1991-93 2001-03 Change
U.S. million Thousand U.S. dollarsdollars Percent metric tons Percent per kilogram Percent
Total 4,941 8,698 76 — — — — — —
Animals and animal products 909 1,412 55 — — — — — —Beef and veal 363 294 -19 87 82 -6 4.19 3.59 -14Pork 29 169 477 9 65 592 3.12 2.60 -17Chickens, fresh or frozen 85 146 71 42 90 112 2.02 1.63 -19Poultry meats,
prepared or preserved 54 109 103 12 28 125 4.33 3.92 -9Cattle and calves1 36 78 117 71 167 136 506.51 465.61 -8Preparations for infant use,
retail sale 4 61 1,315 1 20 1,802 4.13 3.07 -26Other 338 555 64 — — — — — —
Grains and feeds 779 1,724 121 1,658 5,561 235 .47 .31 -34Corn 60 336 463 600 3,540 490 .10 .09 -5Dog or cat food, retail sale 146 246 69 142 246 74 1.03 1.00 -3Pastry, cake, bread,
and pudding 94 160 69 58 86 49 1.64 1.87 14Prepared food from swelling
or roasting of cereal or cereal products 36 124 249 19 68 267 1.91 1.81 -5
Mixes and doughs 31 85 171 27 77 181 1.14 1.10 -3Cookies, waffles, and wafers 48 84 74 25 42 68 1.93 2.00 4Pasta and noodles2 21 69 228 19 62 219 1.08 1.11 3Rice 56 67 20 142 175 23 .39 .38 -2Stuffed or canned pasta 30 55 84 14 28 96 2.11 1.99 -6Dextrins and other
modified starches3 31 50 63 67 77 15 .46 .65 42Other 227 449 98 546 1,160 113 .42 .39 -7
Fruits and preparations, excluding juice 708 900 27 872 1,052 21 .81 .86 5Grapes, fresh 117 116 -1 112 93 -17 1.05 1.25 20Strawberries, fresh 51 106 110 36 56 56 1.41 1.91 35Oranges, fresh or dried 80 89 11 154 167 8 .52 .53 3Apples, fresh 58 81 41 76 103 35 .76 .79 4Peaches, fresh 46 53 17 50 59 19 .92 .91 -2Other 357 454 27 444 576 30 .80 .79 -2
Fruit juices4 156 254 63 267 330 24 .59 .77 31Orange juice4 83 140 69 155 193 24 .53 .72 36Other 73 115 56 111 137 23 .66 .84 27
Wine4 41 89 119 32 48 50 1.28 1.87 46
Nuts and preparations 128 173 35 72 97 34 1.77 1.79 1
See notes at end of table. Continued—

30NAFTA at 11: The Growing Integration of North American Agriculture
Economic Research Service/USDA
Appendix table 1—Selected U.S. agricultural exports to Canada, 1991-93 versus 2001-03—Continued
Value Volume Unit value
Commodities 1991-93 2001-03 Change 1991-93 2001-03 Change 1991-93 2001-03 Change
U.S. million Thousand U.S. dollarsdollars Percent metric tons Percent per kilogram Percent
Vegetables and preparations 1,067 1,766 66 — — — — — —Lettuce, fresh 109 184 69 254 312 23 0.43 0.59 37Tomatoes, fresh 114 118 3 137 132 -4 .83 .89 8Potatoes, fresh5 62 86 38 179 253 41 .35 .34 -2Carrots, fresh 26 77 203 71 133 86 .36 .58 63Peppers, fresh 45 71 58 69 69 0 .65 1.03 57Tomato sauces, other
than ketchup 36 67 88 35 81 135 1.03 .82 -20Onions and shallots, fresh 42 60 42 103 146 41 .41 .41 0Broccoli, fresh 41 51 23 72 73 1 .57 .70 22Other 592 1,052 78 — — — — — —
Oilseeds and products 322 774 141 961 2,394 149 .33 .32 -3Soybean meal 151 217 43 625 1,042 67 .24 .21 -14Soybeans 37 142 282 154 638 316 .24 .22 -8Rapeseed 8 58 661 29 228 694 .26 .25 -4Other 125 357 185 154 486 216 .82 .74 -10
Cotton, excluding linters 60 95 57 37 61 64 1.61 1.54 -4
Essential oils 46 217 373 4 16 313 11.50 13.17 15Mixtures of odoriferous
substances for use in food and beverage industry 33 197 490 3 15 441 12.34 13.46 9
Other 12 20 61 1 2 43 9.72 10.92 12
Seeds, field and garden 67 116 74 39 92 140 1.73 1.25 -28
Sugar and tropical products 400 794 98 — — — — — —Coffee and coffee products 69 188 174 16 46 197 4.41 4.07 -8Chocolate and preparations 95 202 112 35 76 119 2.75 2.67 -3Confections, sweetmeats,
and other sugar confectionswithout cocoa 61 126 106 30 58 95 2.08 2.19 6
Cocoa 27 78 192 11 30 175 2.45 2.59 6Other 149 200 35 — — — — — —
Nursery and greenhouse products 109 139 27 — — — — — —
Beverages, excluding juices 111 177 60 — — — — — —and wine
Other 38 68 81 — — — — — —1Volume is measured in head, and unit value is measured in dollars per head.2Excludes canned pasta and stuffed pasta.3Excludes products derived from potato starch.4Volume is measured in millions of liters, and unit value is measured in dollars per liter.5Excludes seed potatoes.Source: USDA/ERS (December 2004).

31NAFTA at 11: The Growing Integration of North American Agriculture
Economic Research Service/USDA
Appendix table 2—Selected U.S. agricultural imports from Canada, 1991-93 versus 2001-03
Value Volume Unit value
Commodities 1991-93 2001-03 Change 1991-93 2001-03 Change 1991-93 2001-03 Change
U.S. million Thousand U.S. dollarsdollars Percent metric tons Percent per kilogram Percent
Total 4,046 10,166 151 — — — — — —
Animals and animal products 1,784 3,677 106 — — — — — —Beef and veal 283 1,020 260 121 334 176 2.34 3.06 31Cattle and calves1 802 865 8 1,127 1,168 4 711.50 740.16 4Pork 368 799 117 177 379 114 2.08 2.11 1Swine1 82 347 322 854 6,172 623 .10 .06 -42Bovine hides, whole 65 64 -2 — — — — — —Edible offal, tongues, or
livers of bovine animals 15 49 221 8 18 138 1.95 2.64 35Other 168 534 217 — — — — — —
Grains and feeds 762 1,997 162 — — — — — —Bread, pastry, cakes,
biscuits, and puddings 146 308 110 77 173 123 1.89 1.78 -6Wheat, excluding seed 154 214 39 1,268 1,559 23 .12 .14 13Sweet biscuits, waffles,
and wafers, not frozen 17 214 1126 8 100 1103 2.10 2.13 2Oats, unmilled 54 126 134 576 1,072 86 .09 .12 26Mixes and doughs for
preparation of bakers’wares 14 119 741 12 112 826 1.17 1.06 -9
Prepared food from swelling or roasting cereal flakes 48 114 138 27 81 199 1.76 1.40 -20or products
Dog or cat food, retail sale 46 105 128 67 119 80 .69 .88 27Pasta and noodles2 12 65 429 12 46 272 .99 1.40 42Wheat or meslin flour 13 55 330 46 177 287 .28 .31 11Other 258 679 164 — — — — — —
Fruits and preparations 68 193 185 98 173 76 .69 1.12 62
Vegetables and preparations 281 1,514 439 — — — — — —Potatoes, frozen 54 413 671 99 661 569 .54 .62 15Tomatoes, fresh 5 190 3379 4 112 2565 1.30 1.70 31Peppers, fresh 5 75 1328 3 41 1486 2.04 1.84 -10Potatoes, fresh3 33 66 100 189 264 39 .17 .25 44Soups, broths, and
preparations, not dried 4 54 1300 4 40 1023 1.09 1.36 25Mushrooms, fresh or chilled 3 52 1692 2 20 1042 1.66 2.60 57Other 177 664 275 — — — — — —
Sugar and related products 193 488 152 — — — — — —Confectionery products,
retail sale4 26 183 607 14 78 455 1.83 2.33 27Chewing gum 30 98 226 17 34 106 1.81 2.86 58Other 133 292 119 — — — — — —
Cocoa and cocoa products 148 562 281 78 274 250 1.88 2.05 9
Coffee and coffee products 33 111 235 6 26 349 5.76 4.29 -26
Tea 24 55 135 37 49 34 .64 1.12 76
See notes at end of table. Continued—
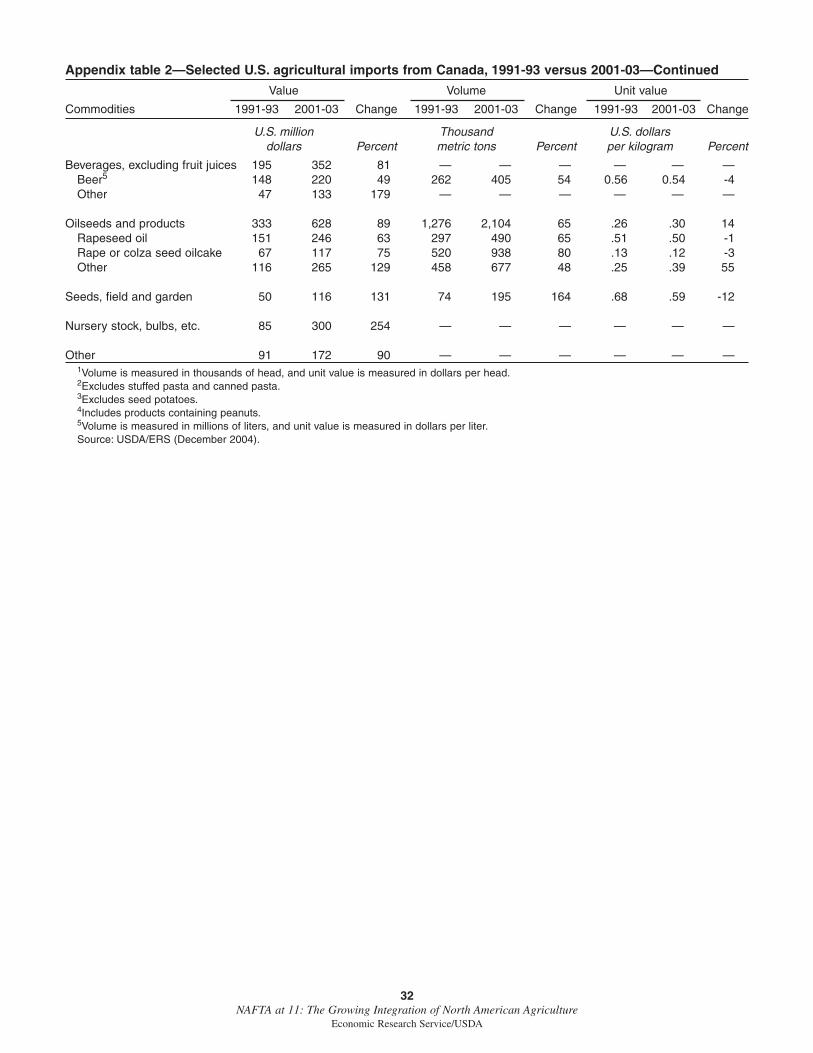
32NAFTA at 11: The Growing Integration of North American Agriculture
Economic Research Service/USDA
Appendix table 2—Selected U.S. agricultural imports from Canada, 1991-93 versus 2001-03—Continued
Value Volume Unit value
Commodities 1991-93 2001-03 Change 1991-93 2001-03 Change 1991-93 2001-03 Change
U.S. million Thousand U.S. dollarsdollars Percent metric tons Percent per kilogram Percent
Beverages, excluding fruit juices 195 352 81 — — — — — —Beer5 148 220 49 262 405 54 0.56 0.54 -4Other 47 133 179 — — — — — —
Oilseeds and products 333 628 89 1,276 2,104 65 .26 .30 14Rapeseed oil 151 246 63 297 490 65 .51 .50 -1Rape or colza seed oilcake 67 117 75 520 938 80 .13 .12 -3Other 116 265 129 458 677 48 .25 .39 55
Seeds, field and garden 50 116 131 74 195 164 .68 .59 -12
Nursery stock, bulbs, etc. 85 300 254 — — — — — —
Other 91 172 90 — — — — — —1Volume is measured in thousands of head, and unit value is measured in dollars per head.2Excludes stuffed pasta and canned pasta.3Excludes seed potatoes.4Includes products containing peanuts.5Volume is measured in millions of liters, and unit value is measured in dollars per liter.Source: USDA/ERS (December 2004).

33NAFTA at 11: The Growing Integration of North American Agriculture
Economic Research Service/USDA
Appendix table 3—Selected U.S. agricultural exports to Mexico, 1991-93 versus 2001-03
Value, Volume, Unit valueannual average annual average for period
Commodities 1991-93 2001-03 Change 1991-93 2001-03 Change 1991-93 2001-03 Change
U.S. million Thousand U.S. dollarsdollars Percent metric tons Percent per kilogram Percent
Total 3,476 7,516 116 — — — — — —
Animals and animal products 1,186 2,093 76 — — — — — —Beef and veal 171 583 241 58 192 232 2.95 3.03 3Beef variety meats 48 253 427 41 140 241 1.17 1.81 54Pork 68 197 189 32 119 272 2.13 1.65 -22Turkeys, fresh or frozen 66 108 64 46 93 103 1.43 1.16 -19Chickens, fresh or frozen 68 100 46 74 164 122 .92 .61 -34Nonfat dry milk 55 91 66 33 54 63 1.67 1.70 2Bovine hides, whole 110 76 -31 — — — — — —Tallow, inedible 41 76 86 113 216 91 .36 .35 -3Pork variety meats 46 72 57 62 86 38 .74 .84 13Cattle and calves1 115 67 -42 179 91 -49 642.46 735.01 14Other 398 470 18 — — — — — —
Grains and feeds 896 2,107 135 6,507 14,849 128 .14 .14 3Corn 104 600 477 914 5,499 502 .11 .11 -4Sorghum 427 417 -2 3,949 3,997 1 .11 .10 -3Wheat, unmilled 78 337 332 563 2,351 318 .14 .14 3Cracked corn 13 171 1,213 68 1,111 1,534 .19 .15 -20Dog or cat food,
for retail sale 5 119 2,275 6 143 2,285 .83 .83 0Rice 42 108 158 175 675 286 .24 .16 -33Other 227 356 57 832 1,073 29 .27 .33 22
Fruits and preparations, excluding juice 81 245 203 143 376 163 .57 .65 15Apples, fresh 34 91 168 68 157 131 .50 .58 16Other 47 154 228 75 219 192 .63 .70 12
Vegetables and preparations 150 586 291 — — — — — —Soups, broths, and
preparations thereof, dried 15 199 1,223 7 72 923 2.13 2.76 29Other 135 387 187 — — — — — —
Oilseeds and products 633 1,293 104 2,489 5,273 112 .25 .25 -4Soybeans 400 843 111 718 4,014 459 .56 .21 -62Soybean meal 68 95 40 313 451 44 .22 .21 -3Soybean oil 13 72 457 27 151 458 .48 .48 0Other 152 283 86 1,431 657 -54 .11 .43 305
Cotton, excluding linters 117 406 247 87 358 311 1.34 1.14 -16
Essential oils 21 47 126 2 5 125 10.39 10.43 0
Seeds, field and garden 109 226 107 181 379 109 .60 .60 -1
Sugar and tropical products 155 257 66 — — — — — —Chocolate and preparations 47 126 169 16 43 169 2.91 2.91 0Other 108 131 21 — — — — — —
See notes at end of table. Continued—
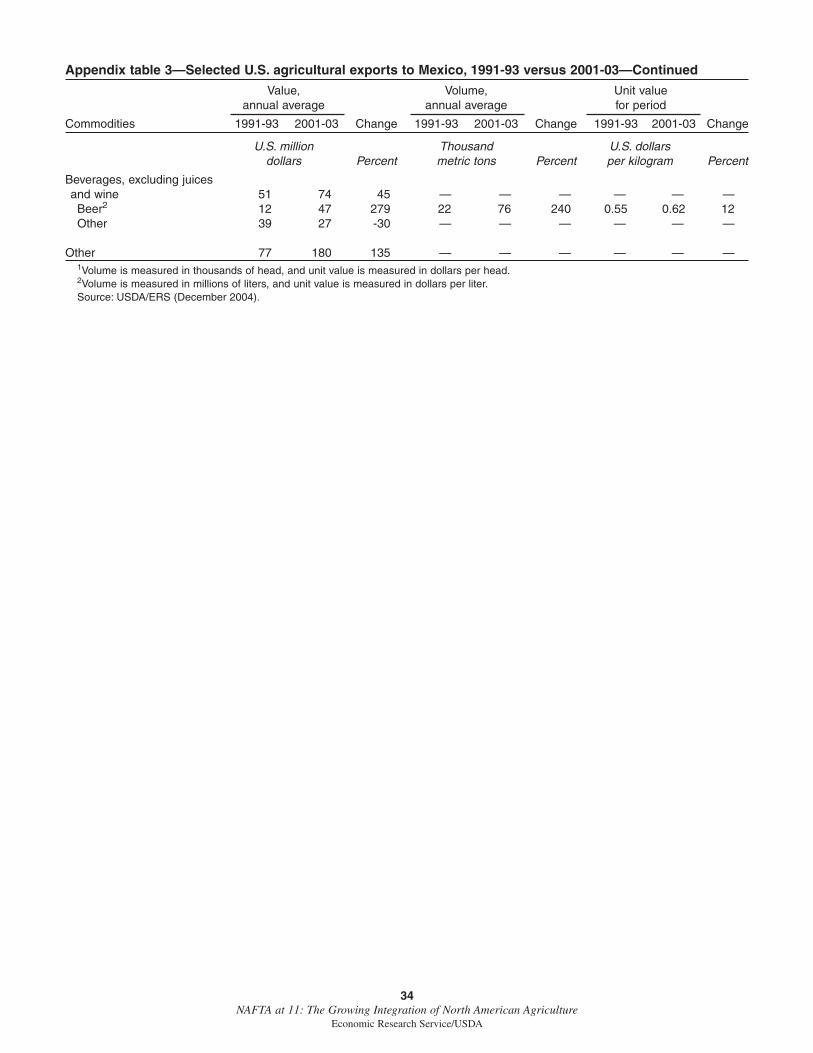
34NAFTA at 11: The Growing Integration of North American Agriculture
Economic Research Service/USDA
Appendix table 3—Selected U.S. agricultural exports to Mexico, 1991-93 versus 2001-03—Continued
Value, Volume, Unit valueannual average annual average for period
Commodities 1991-93 2001-03 Change 1991-93 2001-03 Change 1991-93 2001-03 Change
U.S. million Thousand U.S. dollarsdollars Percent metric tons Percent per kilogram Percent
Beverages, excluding juicesand wine 51 74 45 — — — — — —Beer2 12 47 279 22 76 240 0.55 0.62 12Other 39 27 -30 — — — — — —
Other 77 180 135 — — — — — —1Volume is measured in thousands of head, and unit value is measured in dollars per head.2Volume is measured in millions of liters, and unit value is measured in dollars per liter.Source: USDA/ERS (December 2004).

35NAFTA at 11: The Growing Integration of North American Agriculture
Economic Research Service/USDA
Appendix table 4—Selected U.S. agricultural imports from Mexico, 1991-93 versus 2001-03
Value, Volume, Unit valueannual average annual average for period
Commodities 1991-93 2001-03 Change 1991-93 2001-03 Change 1991-93 2001-03 Change
U.S. million Thousand U.S. dollarsdollars Percent metric tons Percent per kilogram Percent
Total 2,542 5,695 124 — — — — — —
Coffee and coffee products 279 173 -38 182 112 -38 1.53 1.55 1
Cocoa and cocoa products 20 59 196 14 39 179 1.43 1.52 6
Animals and animal products 408 480 18 — — — — — —Cattle and calves1 377 393 4 1,104 1,062 -4 341.49 370.19 8Other 31 87 182 — — — — — —
Grains and feeds 51 223 337 — — — — — —Biscuits and wafers2 16 109 588 11 65 503 1.46 1.66 14Other 35 115 225 — — — — — —
Fruits and preparations 322 816 153 586 1,150 96 .55 .71 29Grapes, fresh 59 202 243 40 244 509 1.48 .83 -44Mangoes, fresh3 63 91 44 80 165 106 .79 .55 -30Limes, fresh 20 67 230 87 206 138 .23 .32 39Watermelons, fresh 18 57 215 89 194 118 .20 .29 44Strawberries, fresh 15 51 243 12 37 209 1.25 1.39 11Avocados 1 36 3482 1 25 4366 1.81 1.45 -20Other 147 348 137 278 305 9 .53 1.14 117
Nuts and preparations 55 69 26 17 38 116 3.16 1.85 -42Pecans 53 58 9 14 26 84 3.78 2.24 -41Other 2 11 530 3 12 250 .54 .98 80
Vegetables and preparations 923 2,157 134 — — — — — —Tomatoes, fresh 229 599 162 312 729 134 .73 .82 12Peppers, fresh 120 341 184 124 319 157 .97 1.07 10Cucumbers, fresh 73 185 154 179 334 87 .41 .56 36Squash, fresh 60 158 164 83 183 121 .72 .86 20Onions, fresh 92 118 28 178 170 -5 .52 .70 35Broccoli, frozen 89 109 22 133 140 5 .67 .78 16Asparagus, fresh 29 68 135 21 37 76 1.38 1.84 34Other 231 579 150 — — — — — —
Sugar and related products 35 259 641 — — — — — —Confectionery products 23 173 654 15 120 700 1.53 1.44 -6Sugar, cane or beet 1 48 4706 3 115 3731 .33 .42 25Other 11 38 244 — — — — — —
Beverages, excluding fruit juices 170 1,160 582 — — — — — —Beer4 145 983 578 179 1,125 528 .81 .87 8Carbonated soft drinks4 15 94 527 19 161 746 .79 .59 -26Other 10 83 727 — — — — — —
Other 385 589 53 — — — — — —1Volume is measured in thousands of head, and unit value is measured in dollars per head.2Includes sweet biscuits, waffles, wafers, pastries, cake, and bread, among other products.3Data for 1991-92 also include guavas and mangosteens.4Volume is measured in millions of liters, and unit value is measured in dollars per liter.Source: USDA/ERS (December 2004).
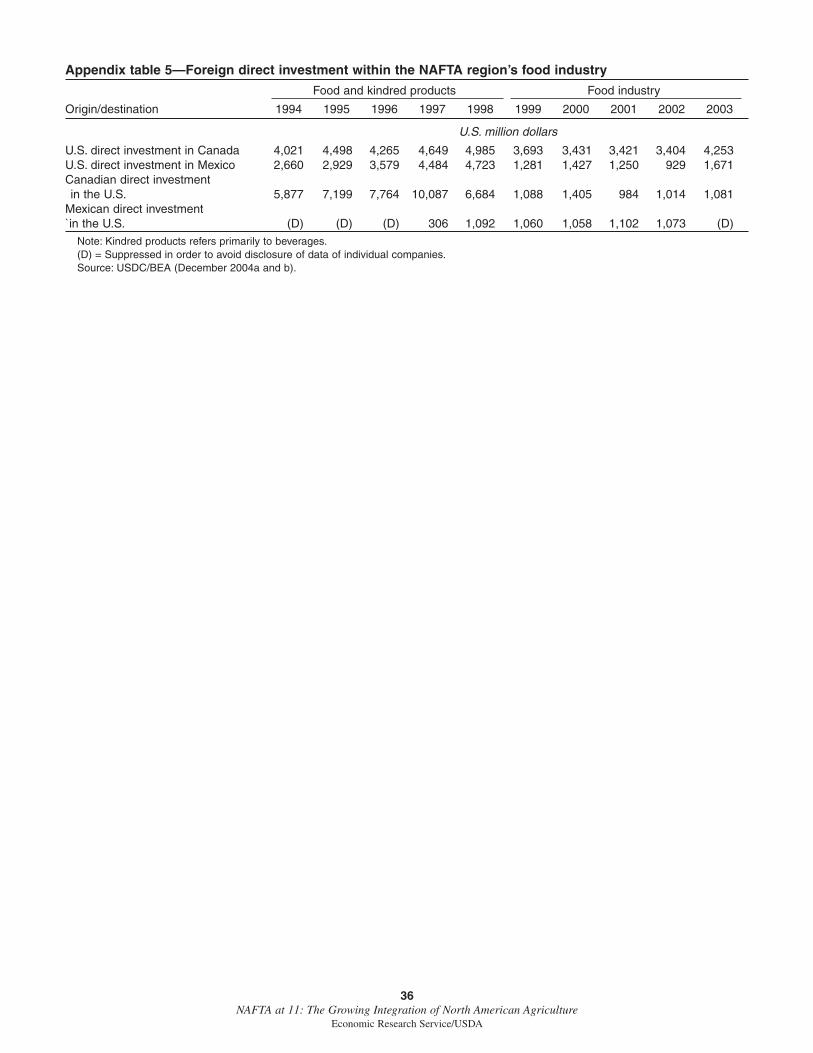
36NAFTA at 11: The Growing Integration of North American Agriculture
Economic Research Service/USDA
Appendix table 5—Foreign direct investment within the NAFTA region’s food industry
Food and kindred products Food industry
Origin/destination 1994 1995 1996 1997 1998 1999 2000 2001 2002 2003
U.S. million dollars
U.S. direct investment in Canada 4,021 4,498 4,265 4,649 4,985 3,693 3,431 3,421 3,404 4,253U.S. direct investment in Mexico 2,660 2,929 3,579 4,484 4,723 1,281 1,427 1,250 929 1,671Canadian direct investment in the U.S. 5,877 7,199 7,764 10,087 6,684 1,088 1,405 984 1,014 1,081
Mexican direct investment `in the U.S. (D) (D) (D) 306 1,092 1,060 1,058 1,102 1,073 (D)
Note: Kindred products refers primarily to beverages.(D) = Suppressed in order to avoid disclosure of data of individual companies.Source: USDC/BEA (December 2004a and b).