Embed Size (px)
Citation preview
ANNUAL REPORT 2014 Proven Steady Growth
Growing Agriculture
Keeyask Answered
The Winning Edge
TOROMONT
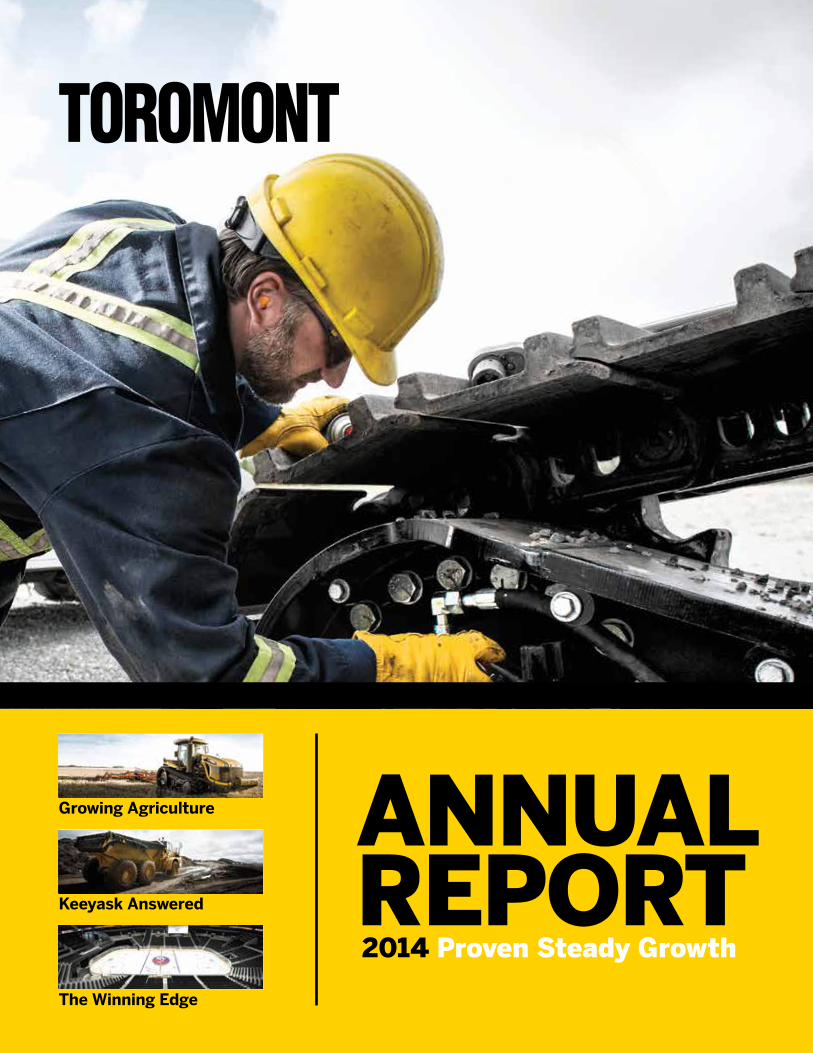
2014 2013 2012 2011
Revenues$ millions
1,660 1,593 1,507 1,382
TABLE OF CONTENTS
Letter to Shareholders
Deep resources and unifying strength of
purpose served Toromont well in 2014.
02 Keeyask Answered
Equipping Manitoba’s massive
hydro project takes a steady stream
of resources.
06
Growing Agriculture
Through acquisitions, we have fortified
our place in Manitoba’s largest industry.
10 More Lives to Live
Toromont Reman keeps customers
on the move with remanufactured
components.
12
Flower Power
Cogeneration feeds flourishing
relationship with North America’s
largest gerbera farm.
18 The Winning Edge
The NHL scores with assists from
CIMCO Refrigeration in the United
States and Canada.
20 Sustainability Report
Toromont Cat celebrates a year
without lost-time injury.
24
Data Driven
Smart machine technology fuels next
generation of product support.
14
Corporate Governance
Board of Directors
Executive Operating Team
Management’s Discussion and Analysis
Management’s and Independent Auditors’ Reports
Financial Statements
Corporate Information
28
29
30
31
56
58
94
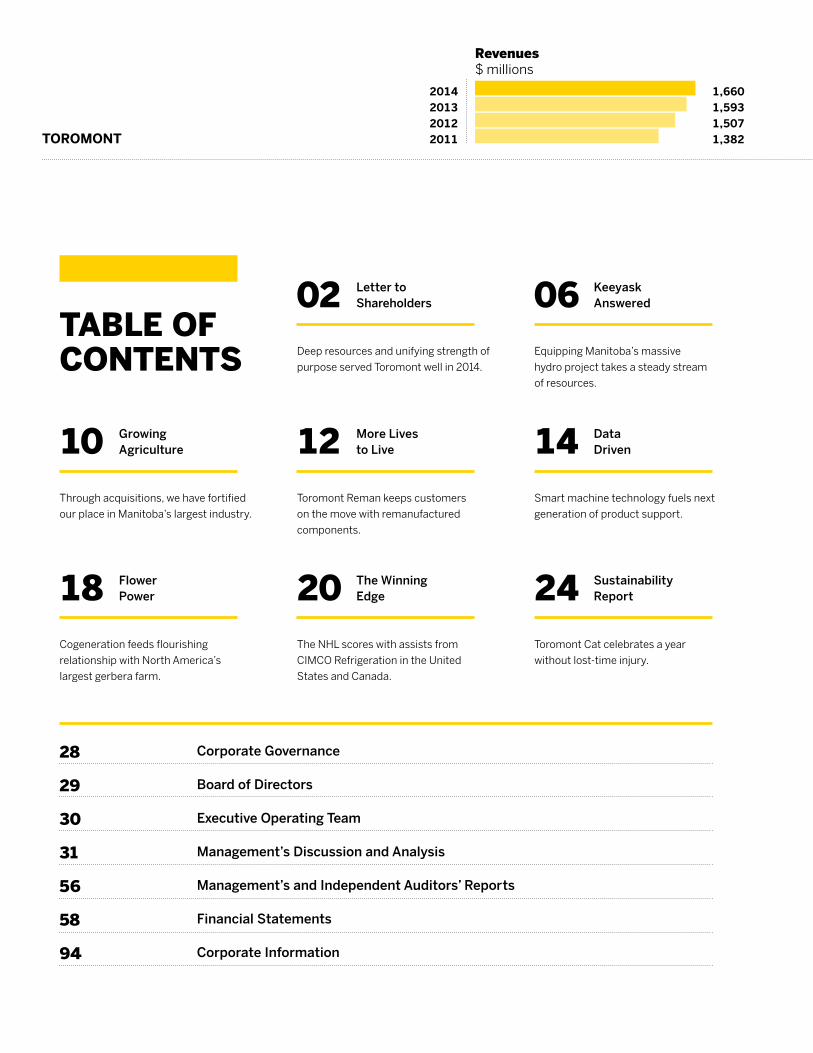
Toromont Industries Ltd. and our dedicated team of more than 3,350 deliver specialized equipment and much more from over 100 locations in Canada and the United States. Our common shares are listed on the Toronto Stock Exchange (symbol tih).
133 123 119 103
Net Earnings – Continuing Operations$ millions
CIMCOWe are a market leader in the design, engineering, fabrication
and installation of industrial and recreational refrigeration systems
with operations in Canada and the United States. We also offer
comprehensive product support capabilities.
Equipment GroupWe are a market leader in the supply of specialized mobile
equipment and industrial engines. We provide sales and rental
solutions as well as comprehensive product support through
Toromont Cat, Battlefield – The Cat Rental Store and SITECH
Mid-Canada Ltd. in Ontario, Newfoundland, Manitoba and
most of Labrador and Nunavut, and Ag West Equipment Ltd.
in Manitoba.
Proven Steady Growth in thousands, except per share amounts and ratios
2014 2013 2012
Revenues $1,660,390 $1,593,431 $1,507,173
Net earnings 133,196 123,031 119,473
Earnings per share – basic 1.73 1.61 1.56
Dividends per share 0.60 0.52 0.48
Closing share price (TSX) 28.51 26.65 21.10
Total debt, net of cash, to total capitalization 6% 10% 25%
2014 2013 2012 2011
TOROMONT
2
Toromont’s deep resources and unifying strength of purpose served us well in 2014 as we met customer demand across many industries, delivered record financial performance and identified opportunities for future advancement.
of cash, to total capitalization was 6%
at year end, giving us the means to seize
opportunities for accretive growth and
defend the leadership positions we have
achieved in chosen markets.
In many respects, 2014 was a typical
year. Activity levels across the industries we
serve varied. Competition was tough. While
maintaining financial strength, we employed
our standard “expand markets, strengthen
product support, broaden product offerings
and invest in resources” strategies in new
and rewarding ways. We allocated capital
with the same investment goal of 18%
return on equity over a business cycle and
delivered return on opening shareholders’
While 2013 proved to be a tough comparator,
2014 revenues stood at a record level of
$1.7 billion with product support and rental
leading the way. Operating income was
up 6%. Net earnings were also a record,
up 8% to $1.73 per share.
For the 25th consecutive year, strong
earnings funded a dividend increase in
2014 and our Board extended that track
record to 26 years at their meeting in
February 2015. Even though Toromont paid
$45 million in aggregate to shareholders
and invested $116 million to bolster
our capabilities organically and through
acquisition, we maintained a strong
financial foundation. Total debt, net
Scott J. MedhurstPresident and Chief Executive Officer
Robert M. OgilvieChairman of the Board
FELLOWSHAREHOL DERS,
ANNUAL REPORT 2014
3
equity of 23% for a 10-year average
of 21.5%. Most important, we remained
resolute in our desire to use our considerable
resources – financial and human – to
create customer value. This is our unifying
purpose and the foundation for rewarding
shareholders, employees and business
partners. We are proud to say that these
resources are deeper than at any time in
our history.
As a market leader, Toromont commands
one of the largest product support networks
in our territories with over 1,300 technicians
and 100 locations, including those that we
share with customers at their remote sites.
Our front-line efforts are backstopped by
another 2,000 Toromont skilled employees
who give us an edge in everything from
technology development and analytics –
areas of growing importance across our
businesses – to product and parts sales.
As a whole, our employees are experienced
(62% have served Toromont for more than
five years), engaged and motivated (54%
are shareholders).
Deploying resources for maximum benefit
is the responsibility of our empowered
business unit leaders who operate with
defined deliverables for customer satisfaction,
safety and financial performance, including
return on capital employed. These individuals
did an excellent job in 2014 against their
deliverables – overseeing, in particular,
ongoing safety improvements – although
it is the collective efforts of Toromont
employees that once again made
the difference.
Using Our Resources In 2014, we used our resources in many
different ways.
Toromont Cat and Battlefield – The
Cat Rental Store met the construction
equipment needs of the Keeyask
hydroelectric project in northern Manitoba.
This was the year’s largest order, valued
at over $55 million, and it made good use
of various skill sets, including logistics,
equipment customization and preparation,
both in-branch and onsite, some 725 km
northeast of Winnipeg.
We set a new record for product support
revenues, including a new record for mining
parts sales and equipment remanufacturing.
While 2014 was a down year for new
mining equipment purchases due to the
commodities’ cycle, the steady expansion
of our installed base of under- and above-
ground units over the past decade proved
to be instrumental – and illustrative of the
value of servicing everything we sell.
Battlefield’s growing market presence
and rigorous management of its rental fleet
produced great results in 2014. In addition
to increasing same-store sales, Battlefield
also expanded its footprint with a new store
in Happy Valley–Goose Bay, Labrador, where
the Muskrat Falls hydroelectric project is
driving considerable economic output.
Toromont Cat’s Power Systems
division engaged in a variety of projects
on the way to improved performance,
including re-equipping Rosa Flora, a
long-time cogeneration customer; renting
16 megawatts of generation equipment
to Newfoundland and Labrador Hydro’s
Holyrood Power Plant to bridge the power
supply needs of the City of St. John’s;
and serving data centres that rely on high
quality, uninterrupted power for banking
and telecommunications.
To better serve the billion-dollar mobile
equipment needs of Manitoba’s agriculture
industry, we acquired two AGCO equipment
dealers for a combined purchase price
of $13 million including assumed debt. The additions of Ag West Equipment in
September and Canpro Gator Centre in
December broadened our product offering,
expanded our branch network and
deepened our product support resources,
thereby creating new sales synergies we
can use to grow. On an annualized basis,
agriculture is now nearly a $100 million
market for Toromont including the revenue
contributions of these businesses.
21.5
FELLOWSHAREHOL DERS,
10-year average return on shareholders’ equity
%
TOROMONT
4
Canada Inc., Walmart Canada and Unilever
USA on their construction projects.
CIMCO’s status as the long-time
preferred ice rink equipment supplier
to the NHL and its deep engineering
resources helped it secure several new
projects, including work at Rogers Place,
the future home of the Edmonton Oilers.
Recent innovations in the use of CO2 for
recreational applications also led to
the award of more ECO2 CHILL® and
ECO CHILL® package sales in a relatively
quiet year for municipal investment in
community ice rinks.
CIMCO ended 2014 with higher backlog
than a year ago.
Promoting from Within At year end, we noted a planned changing
of the guard at CIMCO. After serving CIMCO
since 1971, including the past 29 years
as President, Steve McLeod retired. With
Steve’s expert guidance, CIMCO became
the market leader in Canada and a growing
force in the United States. We sincerely
Sometimes we use our resources to
improve how we do business. Such was
the case in 2014 within our Heavy Rent
operations, where we focused on operational
and process efficiencies as a prerequisite
to continued growth. With these changes
in place, we look to increase investment
in 2015.
Rounding out our Equipment Group,
SITECH Mid-Canada Ltd. enhanced
coverage of Cat AccuGrade® control
systems and Trimble Connected Site
Solutions by adding field-service staff
and creating a mining and special projects
group. It too recorded new customer wins.
CIMCO partly offset the impact of softer
project activity with record product support
revenue in both Canadian and U.S. markets.
This follows investments in field-service and
further development of capabilities such as
vibration analysis, water treatment, plant
audits and risk assessments.
In industrial markets, our resources were
used by leaders such as Maple Leaf Foods,
Cameco, Dr. Oetker, Cadbury, Parmalat
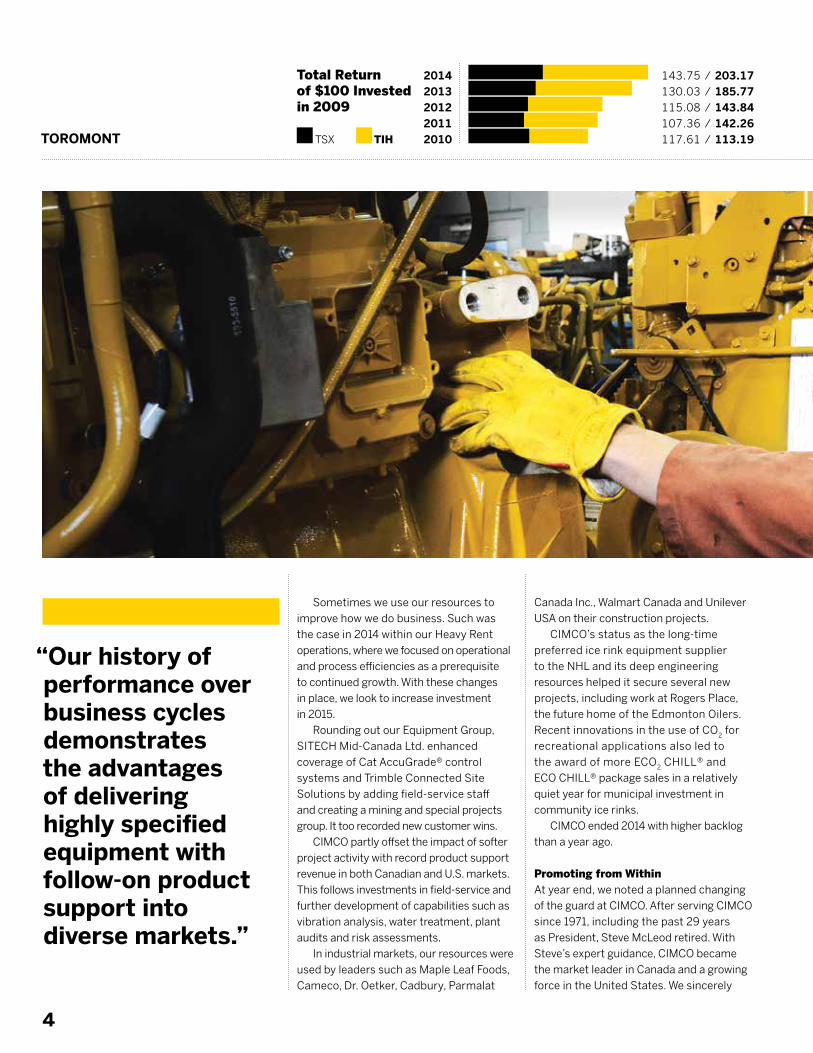
TSX TIH
“Our history of performance over business cycles demonstrates the advantages of delivering highly specified equipment with follow-on product support into diverse markets.”
2014 2013 2012 2011 2010
143.75 / 203.17 130.03 / 185.77 115.08 / 143.84 107.36 / 142.26 117.61 / 113.19
Total Return of $100 Invested in 2009
ANNUAL REPORT 2014
5
thank Steve for his dedication and for his
work in grooming the next generation of
CIMCO leaders. In that regard, we were
pleased to appoint David Malinauskas as
President of CIMCO effective January 1,
2015. A professional engineer, Dave has
served CIMCO for 16 years, most recently
as Director of Engineering.
The ability to promote talented people
into positions of leadership is one sign of
a deeply resourced organization. While
Toromont’s workforce is relatively youthful
with an average age of 42, continued focus
on human resource development for
leadership succession is crucial to retention
and our long-term business success.
Looking Forward Our challenge is to continue to use our
existing resources to the fullest extent
possible and to invest in new resources
that best address emerging customer needs
and our requirements for value creation.
Meeting these challenges is never easy,
nor guaranteed, but we do believe that
Toromont has the right plans in place.
For 2015, these plans build on strategies
that have served us well over many years
and focus on familiar themes. One is the
advancement of technology, which has the
potential of helping us to build closer ties
with customers wherever and whenever
they do business. During 2014, we worked
closely with Caterpillar to introduce a suite
of equipment monitoring solutions that
leverages telematics to enable better asset
management and tracking of machine
productivity. This effort adds another
dimension to Toromont’s traditional product
support role and, as more customers
subscribe to these services, enhances
our ability to predict service needs and
plan resources to deliver maintenance
more effectively.
Another familiar theme is market
expansion; growth in Manitoba’s agriculture
industry being a recent example. Our history
of performance over business cycles
demonstrates the advantages of delivering
highly specified equipment with follow-on
product support into diverse markets.
We will continue on this path in 2015.
Special Note We regretfully report the passing of former
Board member Andrew “Drew” Gilmour
McCaughey in May 2014. Drew served on
the Board with distinction from 1984 –
1998, key formative years for the Toromont
you see today, and retired upon attaining
our mandatory retirement age for directors.
He was a great friend, a respected business
executive and will be missed.
Conclusion In closing, it takes many resources to
grow steadily and profitably across diverse
markets and geographically dispersed
territories. It also demands a clear sense
of purpose. Your Company is fortunate to
have both.
We sincerely thank all of our customers,
shareholders, employees, Directors and
business partners for your ongoing support
and contributions in a challenging but
rewarding year.
Yours sincerely,
Robert M. Ogilvie Chairman of the Board
Scott J. Medhurst President and Chief Executive Officer
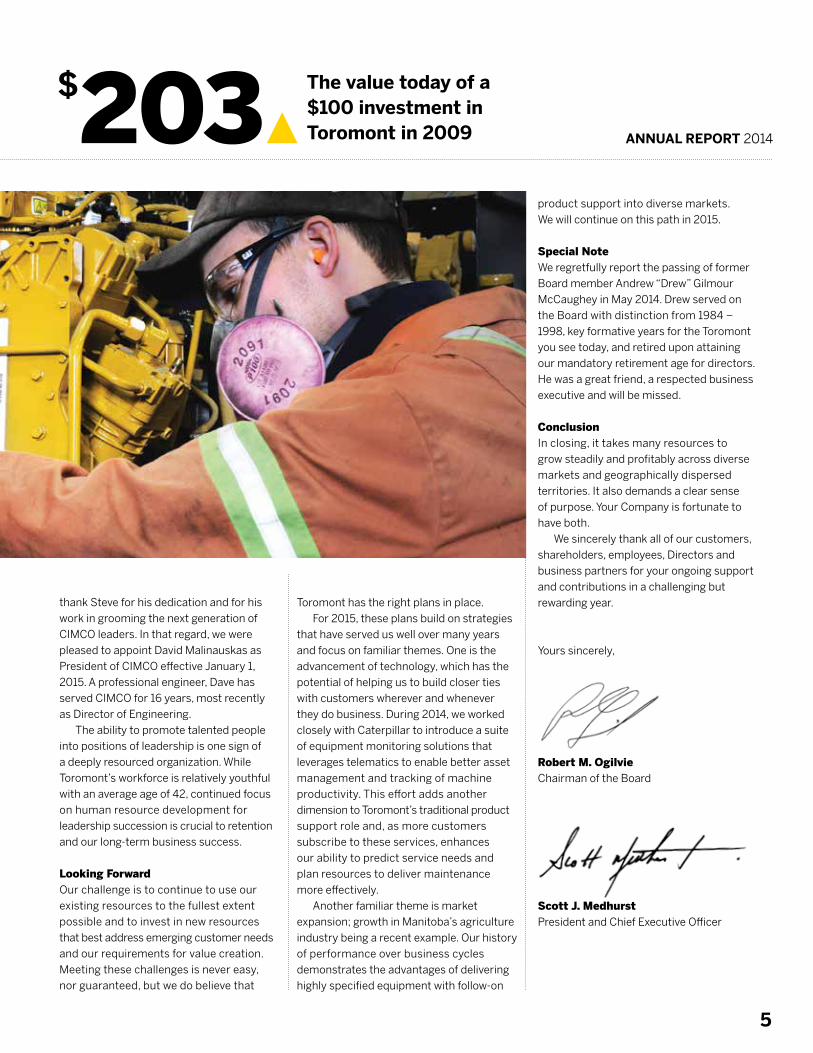
The value today of a $100 investment in Toromont in 2009
$203143.75 / 203.17 130.03 / 185.77 115.08 / 143.84 107.36 / 142.26 117.61 / 113.19
6
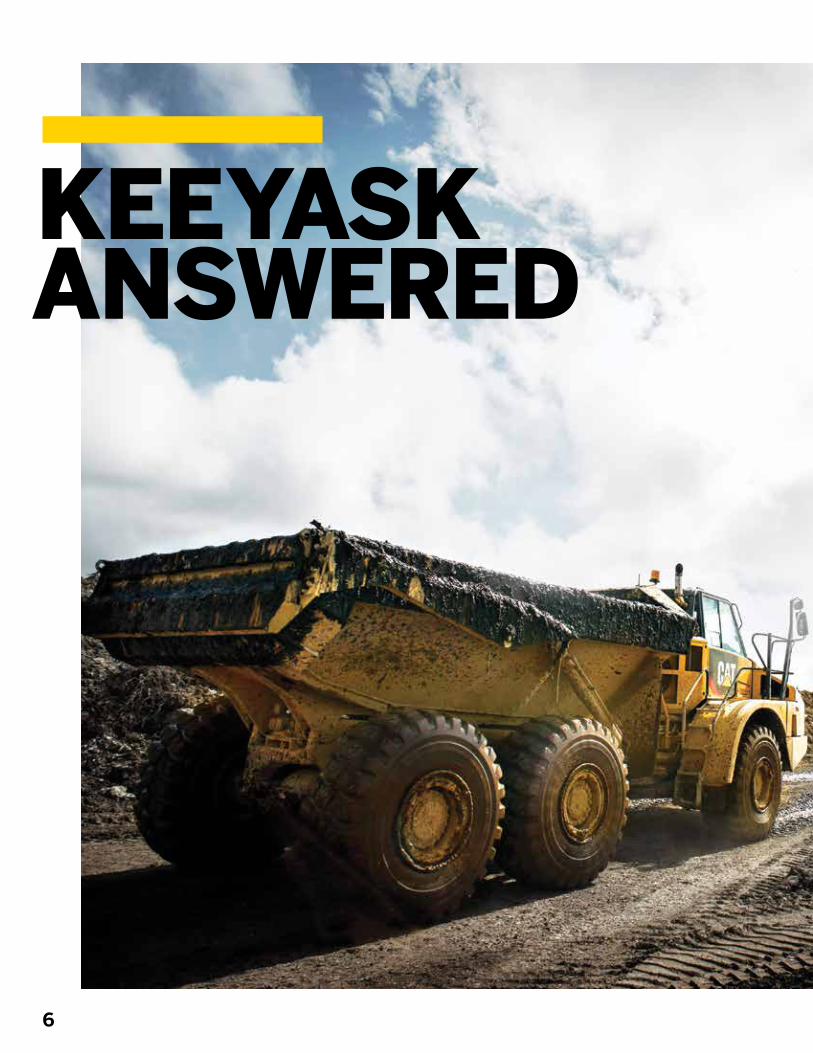
KEEYASK ANSWERED
7
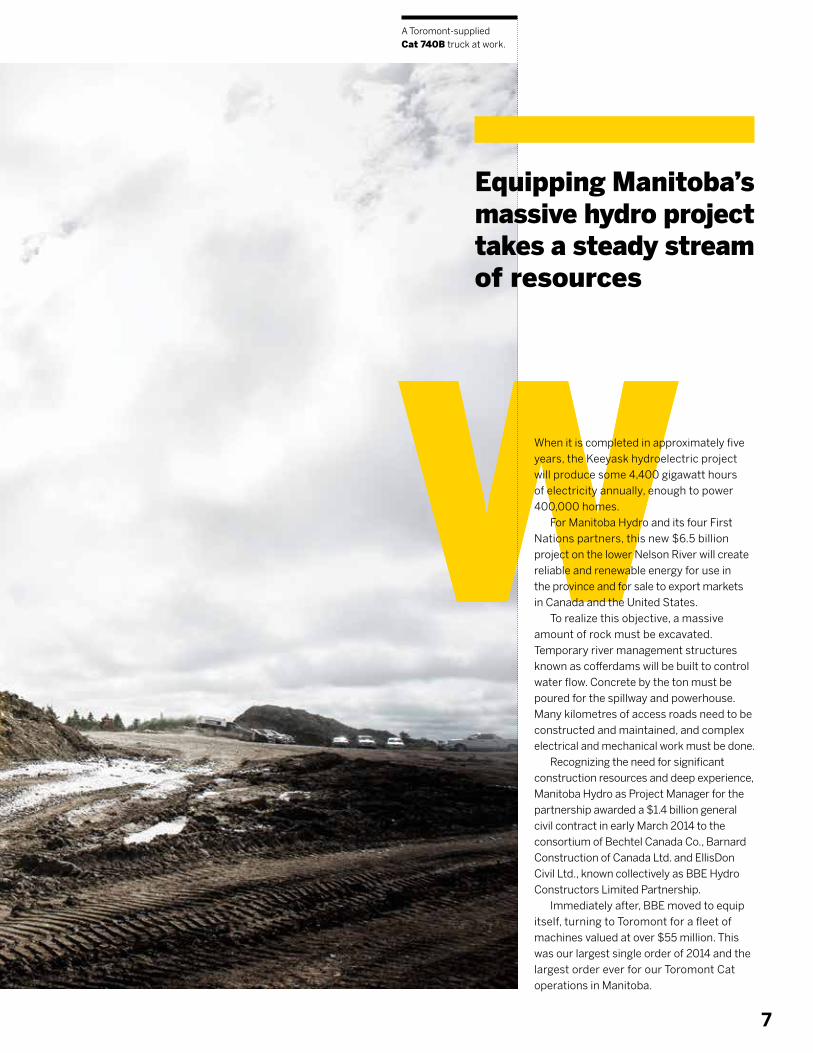
WWEquipping Manitoba’s massive hydro project takes a steady stream of resources
A Toromont-supplied Cat 740B truck at work.
When it is completed in approximately five
years, the Keeyask hydroelectric project
will produce some 4,400 gigawatt hours
of electricity annually, enough to power
400,000 homes.
For Manitoba Hydro and its four First
Nations partners, this new $6.5 billion
project on the lower Nelson River will create
reliable and renewable energy for use in
the province and for sale to export markets
in Canada and the United States.
To realize this objective, a massive
amount of rock must be excavated.
Temporary river management structures
known as cofferdams will be built to control
water flow. Concrete by the ton must be
poured for the spillway and powerhouse.
Many kilometres of access roads need to be
constructed and maintained, and complex electrical and mechanical work must be done.
Recognizing the need for significant
construction resources and deep experience,
Manitoba Hydro as Project Manager for the
partnership awarded a $1.4 billion general
civil contract in early March 2014 to the
consortium of Bechtel Canada Co., Barnard
Construction of Canada Ltd. and EllisDon
Civil Ltd., known collectively as BBE Hydro
Constructors Limited Partnership.
Immediately after, BBE moved to equip
itself, turning to Toromont for a fleet of
machines valued at over $55 million. This
was our largest single order of 2014 and the
largest order ever for our Toromont Cat
operations in Manitoba.
TOROMONT
8
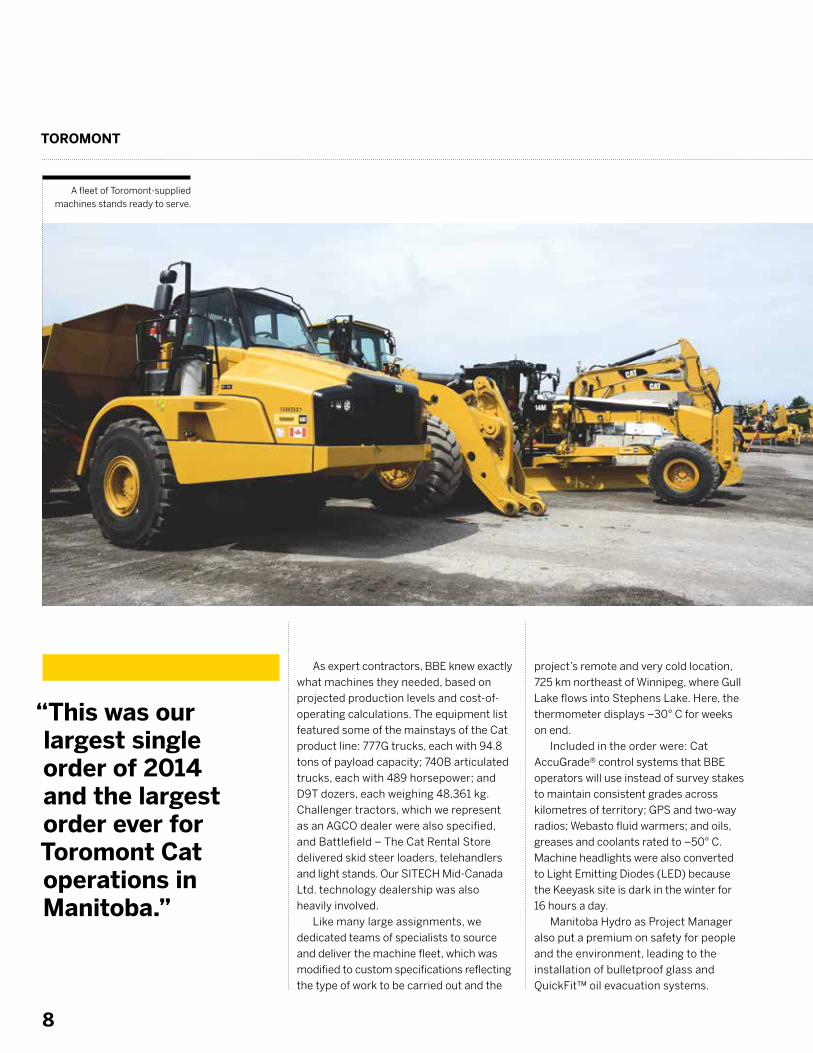
As expert contractors, BBE knew exactly
what machines they needed, based on
projected production levels and cost-of-
operating calculations. The equipment list
featured some of the mainstays of the Cat
product line: 777G trucks, each with 94.8
tons of payload capacity; 740B articulated
trucks, each with 489 horsepower; and
D9T dozers, each weighing 48,361 kg.
Challenger tractors, which we represent
as an AGCO dealer were also specified,
and Battlefield – The Cat Rental Store
delivered skid steer loaders, telehandlers
and light stands. Our SITECH Mid-Canada
Ltd. technology dealership was also
heavily involved.
Like many large assignments, we
dedicated teams of specialists to source
and deliver the machine fleet, which was
modified to custom specifications reflecting
the type of work to be carried out and the
project’s remote and very cold location,
725 km northeast of Winnipeg, where Gull
Lake flows into Stephens Lake. Here, the
thermometer displays –30° C for weeks
on end.
Included in the order were: Cat
AccuGrade® control systems that BBE
operators will use instead of survey stakes
to maintain consistent grades across
kilometres of territory; GPS and two-way
radios; Webasto fluid warmers; and oils,
greases and coolants rated to –50° C.
Machine headlights were also converted
to Light Emitting Diodes (LED) because
the Keeyask site is dark in the winter for
16 hours a day.
Manitoba Hydro as Project Manager
also put a premium on safety for people
and the environment, leading to the
installation of bulletproof glass and
QuickFit™ oil evacuation systems.
“This was our largest single order of 2014 and the largest order ever for Toromont Cat operations in Manitoba.”
A fleet of Toromont-supplied machines stands ready to serve.
ANNUAL REPORT 2014
9
Cat service technicians, along with product
support supervisors and a service controller,
worked with partners from SITECH to outfit
the machines in assembly-line conditions.
“A total of 60 machines came through
our Hamilton branch and we assigned
multiple technicians to complete all
services, including customization and
pre-delivery inspections (PDIs) within a
very short window of time,” said Dan Dent,
Product Support Sales Manager, Southwest
Region. “Orchestrating the on-time arrival
of parts and components from various
sources proved to be formidable, but the
project management approach we learned
from doing other large projects helped to
get us over the finish line.”
When the equipment is destined for a
remote location, no detail can be missed
because even minor problems can turn
major. BBE’s equipment, complete with
supplies for the parts depot, was delivered
on flatbeds travelling north on Provincial
Road 280. Many machines were fully
assembled, but the largest arrived in pieces,
creating the need for onsite assembly.
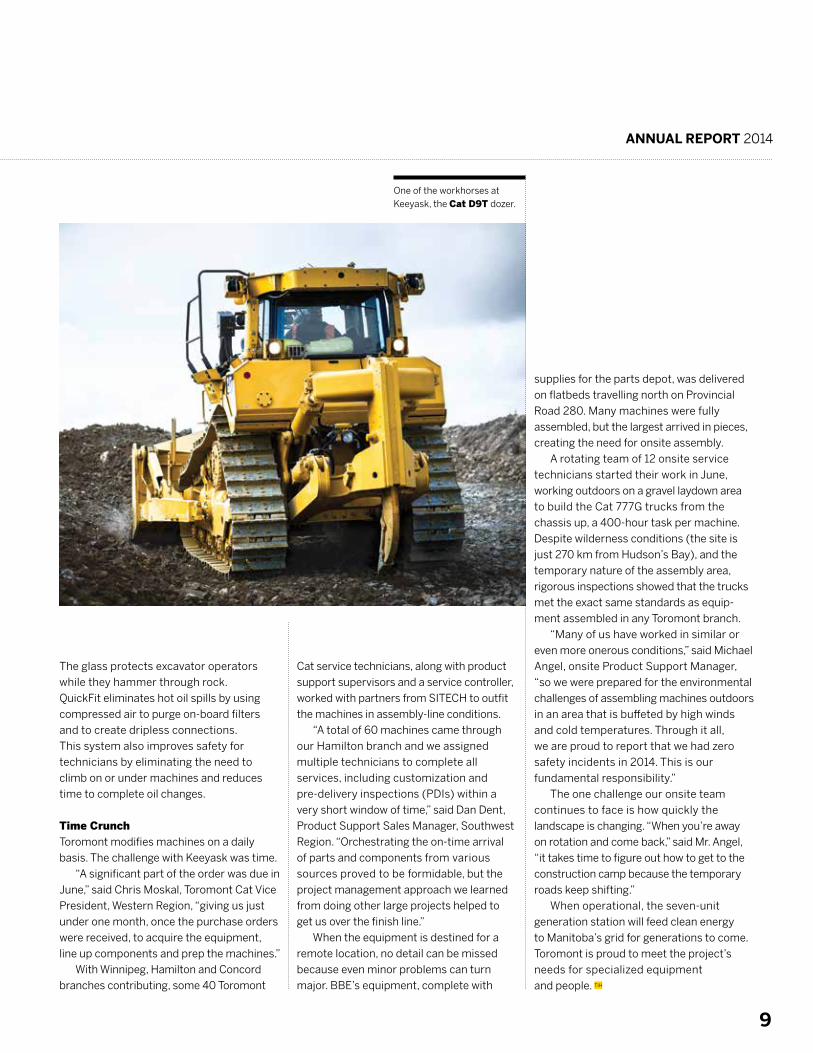
A rotating team of 12 onsite service
technicians started their work in June,
working outdoors on a gravel laydown area
to build the Cat 777G trucks from the
chassis up, a 400-hour task per machine.
Despite wilderness conditions (the site is
just 270 km from Hudson’s Bay), and the
temporary nature of the assembly area,
rigorous inspections showed that the trucks
met the exact same standards as equip-
ment assembled in any Toromont branch.
“Many of us have worked in similar or
even more onerous conditions,” said Michael
Angel, onsite Product Support Manager,
“so we were prepared for the environmental
challenges of assembling machines outdoors
in an area that is buffeted by high winds
and cold temperatures. Through it all,
we are proud to report that we had zero
safety incidents in 2014. This is our
fundamental responsibility.”
The one challenge our onsite team
continues to face is how quickly the
landscape is changing. “When you’re away
on rotation and come back,” said Mr. Angel,
“it takes time to figure out how to get to the
construction camp because the temporary
roads keep shifting.”
When operational, the seven-unit
generation station will feed clean energy
to Manitoba’s grid for generations to come.
Toromont is proud to meet the project’s
needs for specialized equipment
and people. TIH
The glass protects excavator operators
while they hammer through rock.
QuickFit eliminates hot oil spills by using
compressed air to purge on-board filters
and to create dripless connections.
This system also improves safety for
technicians by eliminating the need to
climb on or under machines and reduces
time to complete oil changes.
Time Crunch Toromont modifies machines on a daily
basis. The challenge with Keeyask was time.
“A significant part of the order was due in
June,” said Chris Moskal, Toromont Cat Vice
President, Western Region, “giving us just
under one month, once the purchase orders
were received, to acquire the equipment,
line up components and prep the machines.” With Winnipeg, Hamilton and Concord
branches contributing, some 40 Toromont
One of the workhorses at Keeyask, the Cat D9T dozer.
TOROMONT
10
agriculture industry, such as skid steer
and backhoe loaders, we are better able
to serve the estimated 19,000 field-crop
and livestock farms in the province as a
one-stop source for specialized combine
harvesters; removable headers; tractors;
seeding, tillage, hay and forage equipment
as well as sprayers and spreaders.
Like customers in other industries,
farm operators expect the highest
productivity and the lowest cost of
ownership. This is where AGCO and CLAAS
differentiate themselves. AGCO directs all
of its investments to the agriculture
industry and has been on the leading edge
of developments such as hybrid combines
and telemetry-based machine tracking.
Similarly, CLAAS is a pure-play agriculture
company with world-leading positions in
both combine and self-propelled forage
harvesters, and is known for its Efficient
Agriculture Systems.
Product Support While machine capability is vital and is well
addressed through our partners, so too is
machine maintenance and repair, which are
itself was enhanced during the year with
the opening of a new Toromont Cat facility
in Brandon.
We also gained access to AGCO brands
we did not previously represent, including
Fendt, which is known worldwide for
agriculture innovation; Massey Ferguson,
an iconic name in Canadian farming with a
history dating back to 1847; and RoGator,
TerraGator and Willmar application
equipment.
These products complement the AGCO
Challenger and CLAAS Lexion brands that
we have represented since 2001. Challenger
was originally part of the Caterpillar family
and traces its corporate lineage to Benjamin
Holt, an entrepreneur who invented the first
track-type tractor for plowing soft ground
in 1904 and nicknamed it the Caterpillar.
CLAAS is one of the world’s leading
manufacturers of agricultural engineering
equipment, with home operations in
Harsewinkel, Germany, and a successful
history dating back to 1913.
By combining CLAAS and our now-
broader AGCO offerings with Cat construc-
tion products that are popular in the
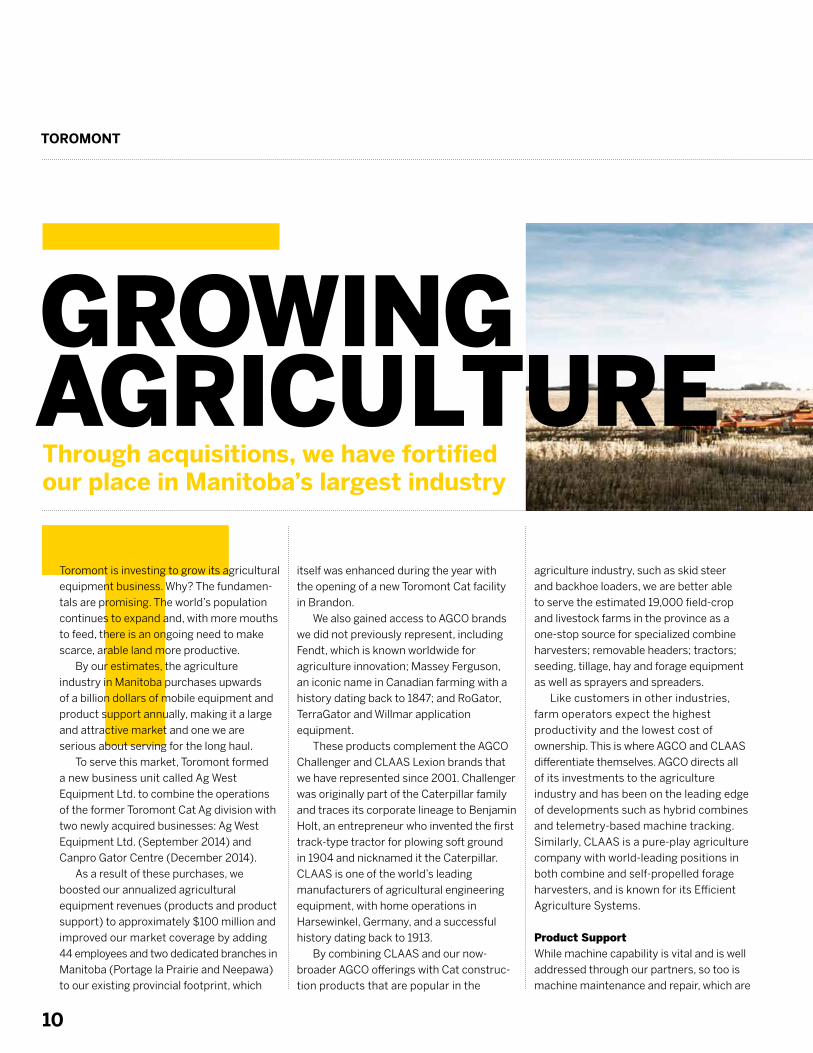
TThrough acquisitions, we have fortified our place in Manitoba’s largest industry
GROWING AGRICULTURE
TToromont is investing to grow its agricultural
equipment business. Why? The fundamen-
tals are promising. The world’s population
continues to expand and, with more mouths
to feed, there is an ongoing need to make
scarce, arable land more productive.
By our estimates, the agriculture
industry in Manitoba purchases upwards
of a billion dollars of mobile equipment and
product support annually, making it a large
and attractive market and one we are
serious about serving for the long haul.
To serve this market, Toromont formed
a new business unit called Ag West
Equipment Ltd. to combine the operations
of the former Toromont Cat Ag division with
two newly acquired businesses: Ag West
Equipment Ltd. (September 2014) and
Canpro Gator Centre (December 2014).
As a result of these purchases, we
boosted our annualized agricultural
equipment revenues (products and product
support) to approximately $100 million and
improved our market coverage by adding
44 employees and two dedicated branches in
Manitoba (Portage la Prairie and Neepawa)
to our existing provincial footprint, which
ANNUAL REPORT 2014
11
provided by Toromont. During harvest time,
customers cannot accept even a few hours
of delay due to equipment malfunction.
Our experience shows that only when
the farm operator is satisfied that product
support is readily available – no more than
30 minutes away – will a supplier be
awarded a capital purchase. This is why
market coverage and field-service resource
increases are so important to Toromont.
With these acquisitions and organic growth
during the year, we nearly tripled our Ag
service technician workforce.
In Manitoba’s agriculture industry,
we take pride in helping customers in their
place of business: be it field or shop. For
example, when a customer in Meadows,
Manitoba reported an electrical fault with
their Lexion 780TT combine this past
September, David Goodwill, a technician
from our Elie branch, was quick on the
scene. Due to the sporadic nature of the
problem, the machine’s owner suggested
we wait to do a full diagnosis until the
machine was idle the next day. Instead,
we grabbed data while the harvest continued
by plugging into the machine’s interface.
The information was then relayed to a
support team at CLAAS for analysis.
Later that evening, a potential solution was
identified, the technician returned to the
farm just before midnight to apply the fix
and the problem, caused by a misplaced
O-ring on the cam speed sensor, was solved.
Other times our product support takes
the form of machine substitution. When
harvesting flax, a specialty crop, Wingham
Farms Ltd. in Elm Creek, Manitoba, ran into
some unique and challenging conditions
caused by high plant-fibre content. Their
existing machine was unable to process the
crop because the plants bound themselves
to internal components, which created a fire
hazard. To get the job done, we provided
the customer with a Lexion 670 combine
that uses what is known as a straw walker.
The harvest was completed stress-free.Parts supply is equally important. In 2014,
we grew our parts team, continued to offer
extended hours during peak seasons with
24/7 on-call availability, and employed
systems to track demand history that ensure
we stock the right parts at the right time. As
a result, we improved over-the-counter fill
rates for customers by 2% over 2013 while
achieving strong parts sales volumes and
inventory turns.
Growth Trends As a result of these acquisitions, Toromont
is also better positioned for two other
fundamental trends. One is growth in farm
acreage as a result of consolidations, which
increases the need for faster and larger
capacity machines such as those we
represent. The other is the increased use of
information technologies that allow farmers
to gather field data during operations for
more effective use of equipment, including
more precise applications of fertilizers and
pesticides. The brands we represent are all
leaders in on-board technologies.
“We are dedicated to Manitoba’s
farming community and see the additions
of Ag West and Canpro as tangible expres-
sions of our commitment,” said Larry
Moffatt, Vice President, Ag West. “Our plan
is to grow and we are enticed to compete
because we know that, in Manitoba, the
Ag market is larger than the construction
market, and the underlying trends affecting
the opportunity play to our strengths. As a
result of our increased scale and capabili-
ties, the province’s agriculture industry
is now a more important contributor to
meeting our goal of proven, steady growth.”
With more great brand names,
improved territorial coverage, growing
product support resources and significant
experience, Toromont plans to be farm
strong in Manitoba for years to come. TIH
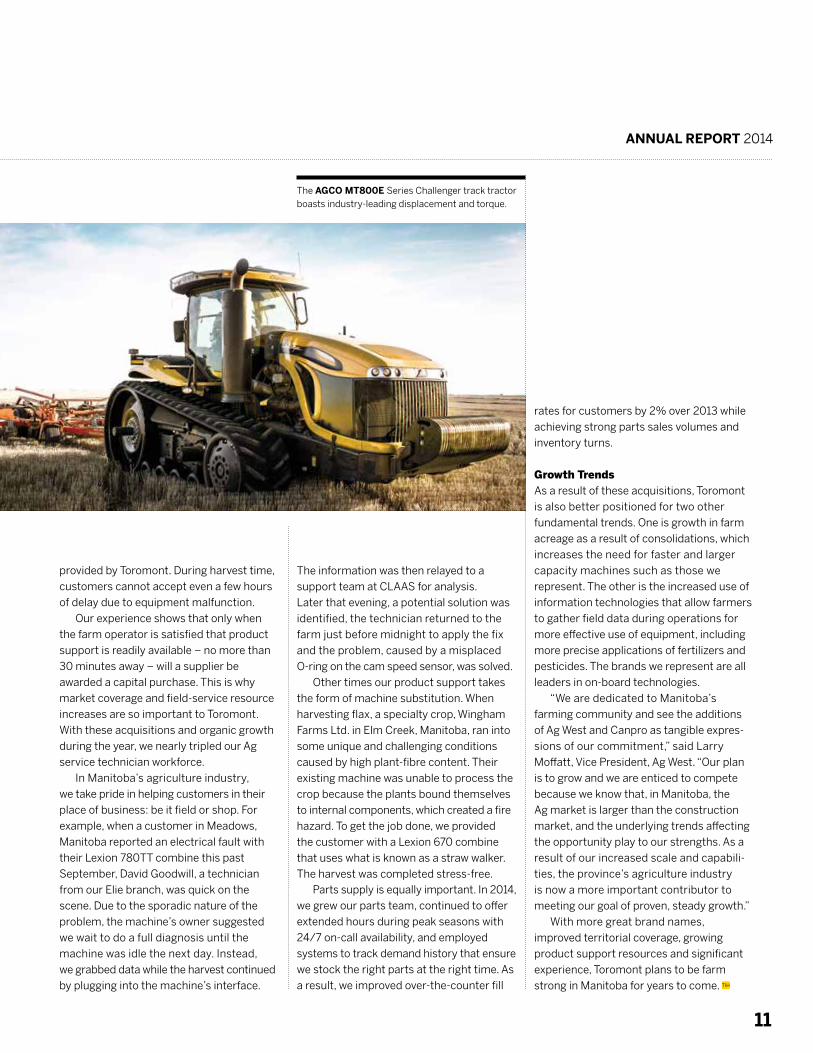
The AGCO MT800E Series Challenger track tractor boasts industry-leading displacement and torque.
TOROMONT
12
sells (and buys) used equipment, is another
important source, as is trading with other
Cat dealers and participating in equipment
auctions. Toromont has been known to go
as far afield as Australia to acquire a core.
While having a sufficient supply of cores
is important, so too is determining where
to focus remanufacturing efforts to ensure
quick inventory turns. To avoid having too
much of one product in inventory and not
enough of another, analysts track the
machine population in our territories and
predict when equipment is likely to arrive at
Toromont for remanufacturing. This is not
an exact science, although equipment
monitoring has improved our line of sight
and the Toromont Cat branch network
provides an early warning system. As a
result, Toromont offers over-the-counter
availability on hundreds of reconditioned
parts and keeps inventory moving quickly.
Tools of the Trade Toromont goes to great lengths to ensure
quality. Our ISO 9001 certified Reman
facilities are capable of remanufacturing
and testing all major components used in
accounting for about 60% of rebuild
activity, following the significant increase
in Toromont’s installed mining equipment
base in recent years.
Running an effective Reman operation
takes a number of capabilities, including
component sourcing. “Most customer
requests are hot turnarounds,” says Joel
Couture, General Manager of Toromont
Reman, “meaning they are required within
hours not weeks. If we do not have the rebuilt
component in inventory, the customer could
be forced to look elsewhere rather than wait
due to the cost of machine downtime in
critical applications. To meet customer
demands, we use a number of strategies
all aimed at ensuring an appropriate
supply of cores.”
Cores are any machine component
that comes in to be remanufactured.
The primary source of cores is customers.
Remaining needs are met in a variety of
ways. One is to seed a customer’s program
by buying a new spare component from
Cat so that there is always a guaranteed
supply when an exchange takes place.
The Toromont Cat branch network, which
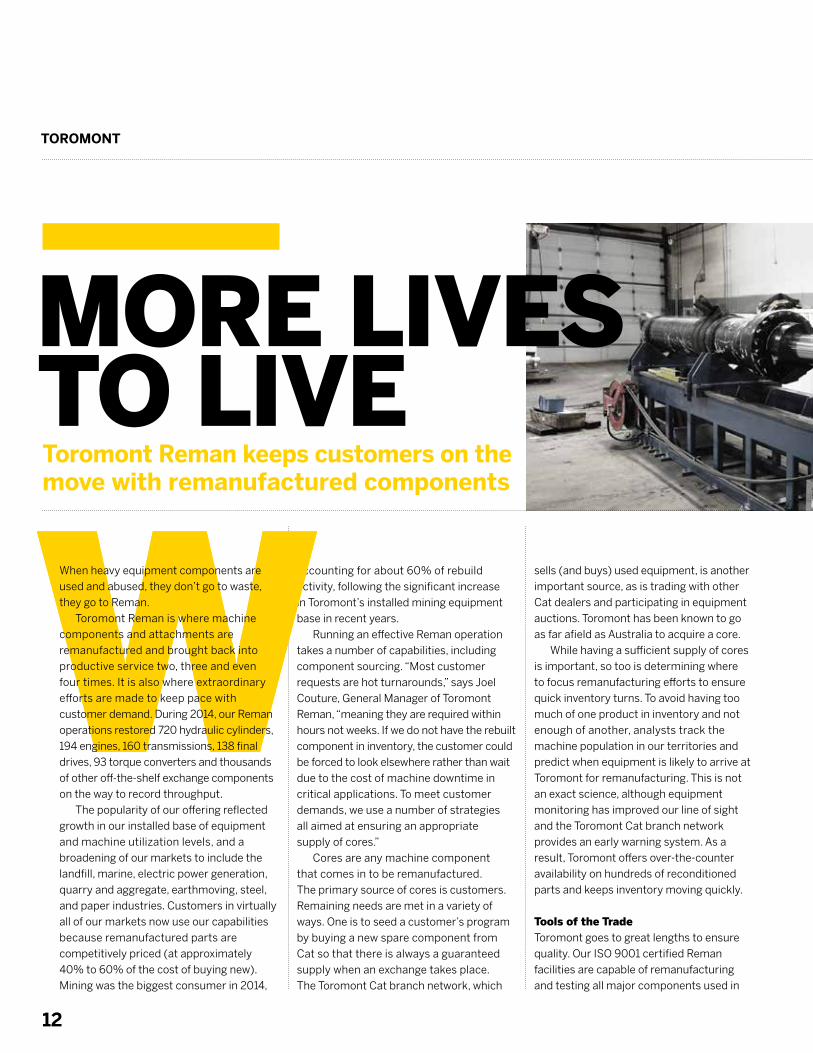
WToromont Reman keeps customers on the move with remanufactured components
MORE LIVES TO LIVE
WWhen heavy equipment components are
used and abused, they don’t go to waste,
they go to Reman.
Toromont Reman is where machine
components and attachments are
remanufactured and brought back into
productive service two, three and even
four times. It is also where extraordinary
efforts are made to keep pace with
customer demand. During 2014, our Reman
operations restored 720 hydraulic cylinders,
194 engines, 160 transmissions, 138 final
drives, 93 torque converters and thousands
of other off-the-shelf exchange components
on the way to record throughput.
The popularity of our offering reflected
growth in our installed base of equipment
and machine utilization levels, and a
broadening of our markets to include the
landfill, marine, electric power generation,
quarry and aggregate, earthmoving, steel,
and paper industries. Customers in virtually
all of our markets now use our capabilities
because remanufactured parts are
competitively priced (at approximately
40% to 60% of the cost of buying new).
Mining was the biggest consumer in 2014,
ANNUAL REPORT 2014
13
even the largest equipment Caterpillar
produces today. In 2014, we became only
the second Cat dealer in the world to be
certified to remanufacture Cat’s single
largest cylinder, the HydraCrowd™, which
operates the behemoth earth mover known
as the Cat 7495 electric rope shovel.
Preparing components for their second
life starts with a molten salt bath where
ultrasonic cleaners remove paint, carbon,
oil and soil. Next, we apply advanced tools
and techniques to evaluate components: dynamometers test engines and powertrains,
magnetic particle inspectors test for hairline
fractures, and a dedicated fluid analysis lab
examines oils and coolants for microscopic
contamination. The lab serves Toromont
Reman and all of our branches and, on an
average day, tests 500 samples.
More than 90 technicians are responsible
for following the precise processes that lead
to quality rebuilds. On a transmission alone,
they use a 60-step procedure. Their work is
top notch and our process quality group is
relentless in its quest to root out any defects.
Deep Integration Toromont Reman is deeply integrated with
our branch network and the two sides of
our product support business collaborate
extensively. For example, to better address
mining demand, we added a remanu-
facturing centre at Toromont Cat’s Thunder
Bay branch in 2012, bringing our total
Reman capacity to 120,000 square feet
across four facilities.
A good example of collaboration is a
2014 rebuild for Holcim (Canada) Inc., one
of the country’s largest vertically integrated
building materials and construction
companies. When the customer decided
they wanted a Cat Certified Rebuild (CCR)
on their 992G wheel loader, they chose our
Peterborough branch, which is close to the
machine’s home base, the Ogden Point
limestone quarry.
Peterborough branch managed the
project and performed a variety of tasks,
including stripping the machine, recon-
ditioning the cab and ensuring that all
critical engineering updates from Cat were
incorporated. Toromont Reman rebuilt the
engine, transmission, torque converter and
axles, which were then returned to the
branch for reassembly. In all, about 7,000
parts were replaced or rebuilt and all work
was subject to strict audit. An audit is
required because a machine seeking
CCR status receives a brand new Vehicle
Identification Number, meaning it is not just
“as good as new,” in many cases, it is new.
While in the Peterborough branch, the wheel
loader underwent more than 350 tests and
inspections before earning CCR status.
As a result of this collaborative approach,
Peterborough’s Product Support Manager
Margie Dingwall said, “Holcim got the
machine it needed at a fraction of the cost
of buying new and Toromont was able to
best the average time required to rebuild
similar machines by 300 person-hours,
allowing us to deliver ahead of the
customer’s deadline.”
While we work on different brands of
equipment, Caterpillar machines are the
ones that customers buy specifically
because original manufacturing processes,
such as heat-treating gears, means there
is enough metal to allow for parts to have
two, three and even four lives. This is an
advantage for customers who plan to
operate their equipment for the long haul.
Toromont Reman is an important part
of our product support business that keeps
our customers moving. When a Toromont
rebuilt Cat product goes back into service,
customers know we stand behind it 100%. TIH
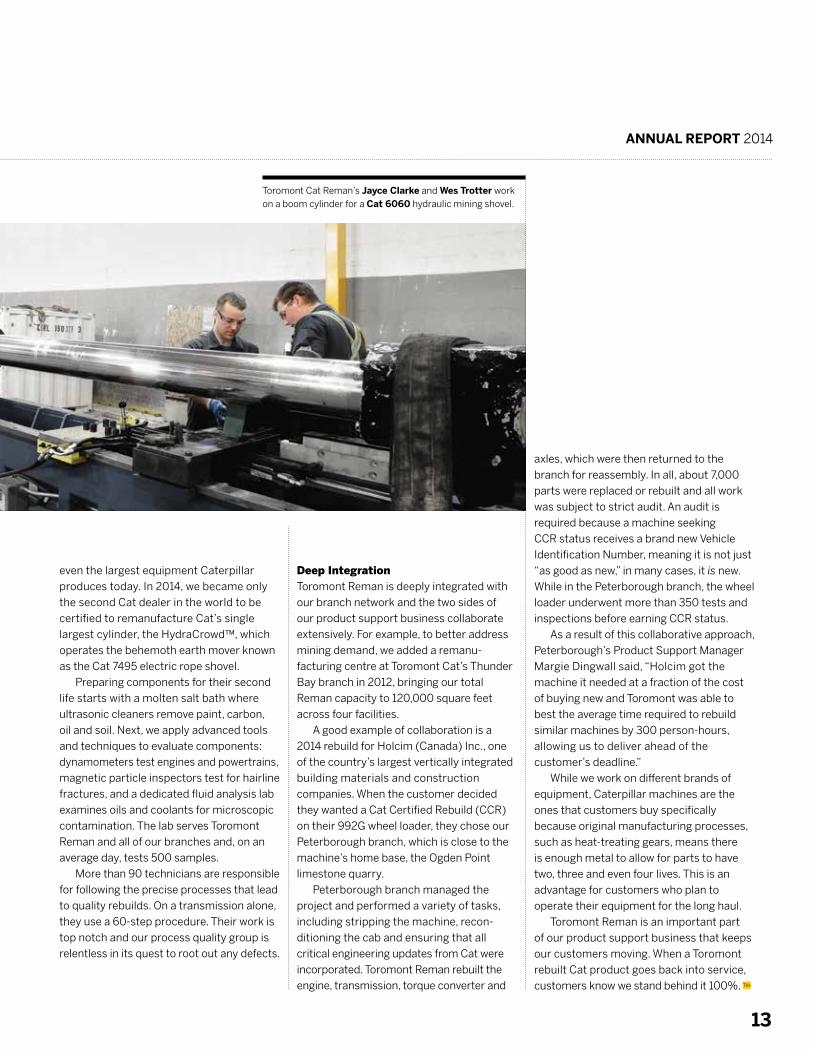
Toromont Cat Reman’s Jayce Clarke and Wes Trotter work on a boom cylinder for a Cat 6060 hydraulic mining shovel.
14
DATA DRIVEN
15
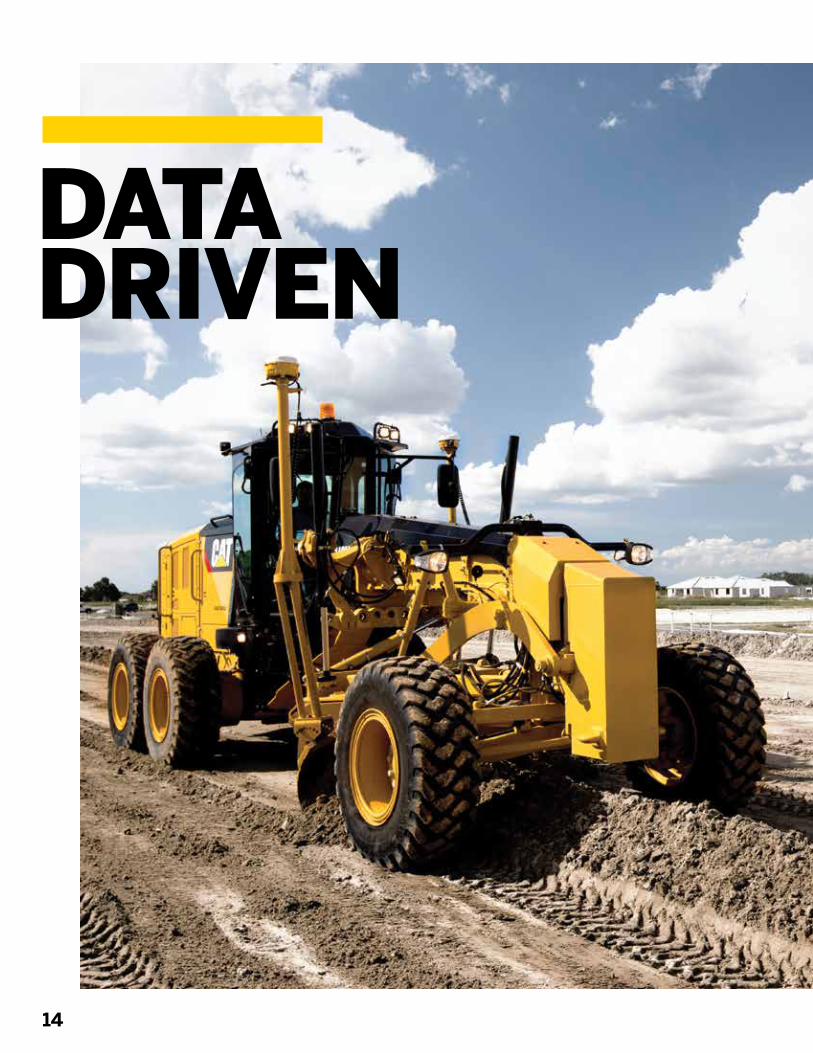
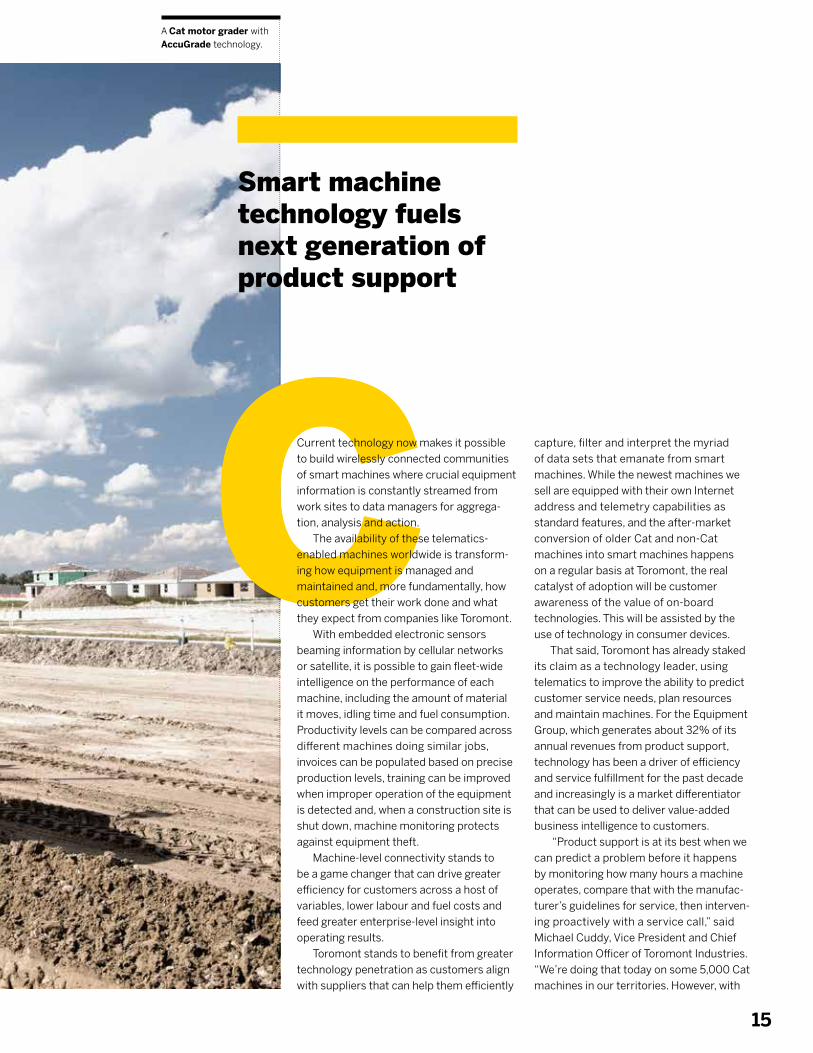
A Cat motor grader with AccuGrade technology.
Smart machine technology fuels next generation of product support
DATA DRIVEN
C capture, filter and interpret the myriad
of data sets that emanate from smart
machines. While the newest machines we
sell are equipped with their own Internet
address and telemetry capabilities as
standard features, and the after-market
conversion of older Cat and non-Cat
machines into smart machines happens
on a regular basis at Toromont, the real
catalyst of adoption will be customer
awareness of the value of on-board
technologies. This will be assisted by the
use of technology in consumer devices.
That said, Toromont has already staked
its claim as a technology leader, using
telematics to improve the ability to predict
customer service needs, plan resources
and maintain machines. For the Equipment
Group, which generates about 32% of its
annual revenues from product support,
technology has been a driver of efficiency
and service fulfillment for the past decade
and increasingly is a market differentiator
that can be used to deliver value-added
business intelligence to customers.
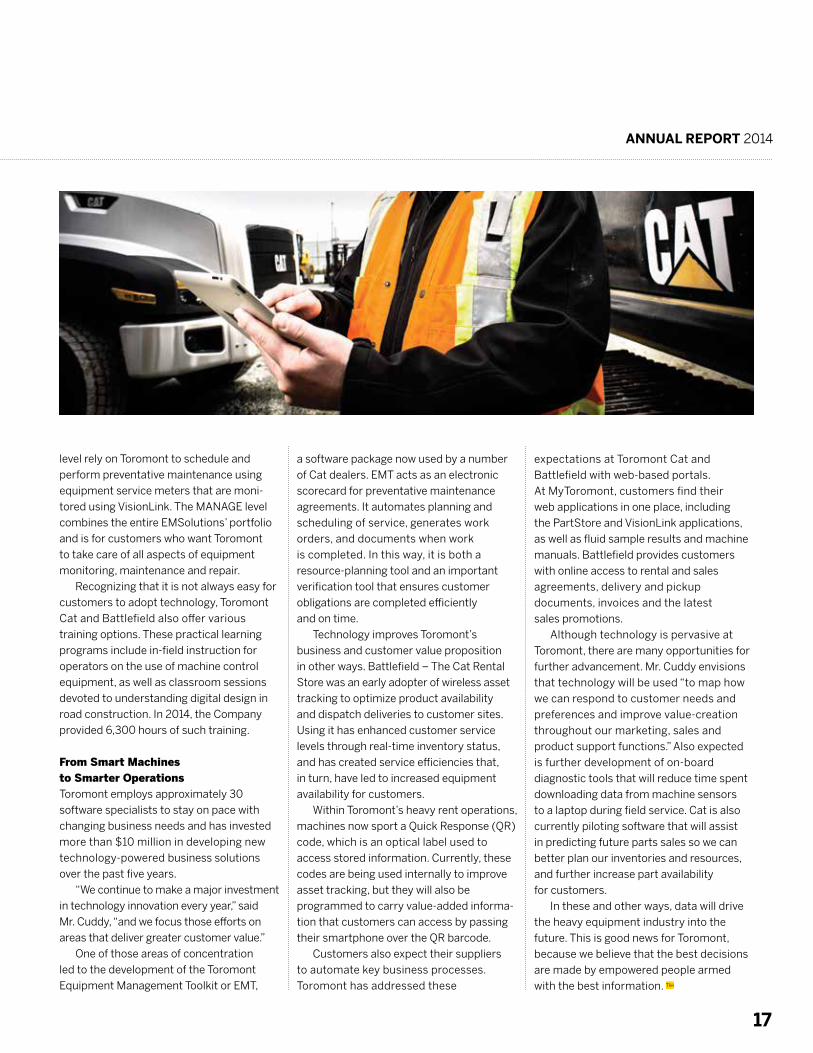
“Product support is at its best when we
can predict a problem before it happens
by monitoring how many hours a machine
operates, compare that with the manufac-
turer’s guidelines for service, then interven-
ing proactively with a service call,” said
Michael Cuddy, Vice President and Chief
Information Officer of Toromont Industries.
“We’re doing that today on some 5,000 Cat
machines in our territories. However, with
CCurrent technology now makes it possible
to build wirelessly connected communities
of smart machines where crucial equipment
information is constantly streamed from
work sites to data managers for aggrega-
tion, analysis and action.
The availability of these telematics-
enabled machines worldwide is transform-
ing how equipment is managed and
maintained and, more fundamentally, how
customers get their work done and what
they expect from companies like Toromont.
With embedded electronic sensors
beaming information by cellular networks
or satellite, it is possible to gain fleet-wide
intelligence on the performance of each
machine, including the amount of material
it moves, idling time and fuel consumption.
Productivity levels can be compared across
different machines doing similar jobs,
invoices can be populated based on precise
production levels, training can be improved
when improper operation of the equipment
is detected and, when a construction site is
shut down, machine monitoring protects
against equipment theft.
Machine-level connectivity stands to
be a game changer that can drive greater
efficiency for customers across a host of
variables, lower labour and fuel costs and
feed greater enterprise-level insight into
operating results.
Toromont stands to benefit from greater
technology penetration as customers align
with suppliers that can help them efficiently
TOROMONT
16
greater use of technology, we see the
opportunity to become more effective
purveyors of timely advice and information
that is useful to customers as they manage
their projects and plot their future equip-
ment needs.”
EMSolutions To lead the equipment industry of the
future, Toromont is working closely with
Caterpillar to make better use of embedded
technologies for the benefit of its customers
and the Company’s value proposition.
In 2014, Toromont introduced Cat
Equipment Management Solutions (Cat
EMSolutions), an initiative that organizes
and harmonizes its suite of customer-facing
technology services with those of Cat
dealers around the world. As customers
become more globalized, Cat’s vision – one
Toromont shares – is that EMSolutions will
allow multinationals in every industry to
experience a consistent level of technolo-
gy-enabled equipment monitoring and
product support, no matter where they
are located.
EMSolutions gives customers a choice
of five different levels of service, each
enabled by Cat Product Link™ hardware
connected to the VisionLink® web interface.
The ACCESS level provides near-real-time
remote access to equipment hours,
location, health and fuel information; sets
up electronic alerts for upcoming mainte-
nance; and identifies the exact parts needed
to complete a scheduled repair so these
can be easily ordered through Caterpillar’s
online PartStore. The INFORM level builds
on these capabilities by adding an auto-
mated monthly benchmarking report from
Toromont that allows customer subscribers
to compare the health and utilization trends
of their fleets. Customers using the ADVISE
package take advantage of the diagnostic
services of a Toromont advisor who
suggests proactive maintenance based on
an analysis and interpretation of multiple
data sets. Customers using the SUPPORT
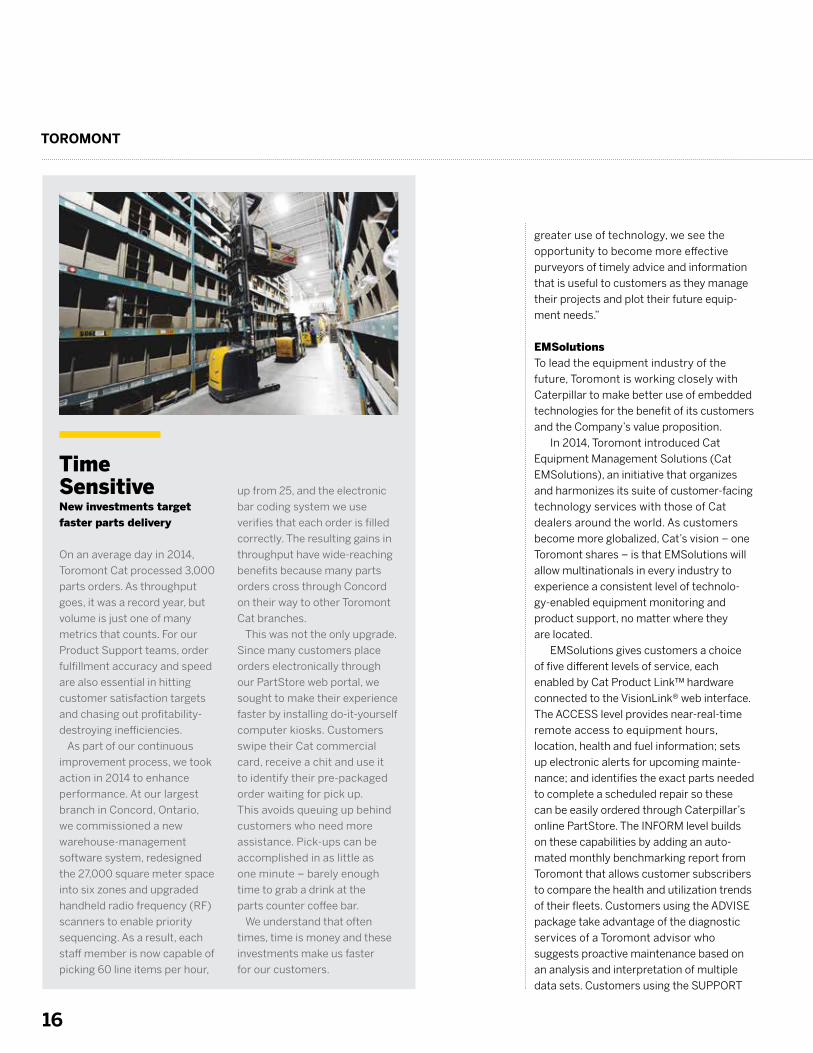
New investments target
faster parts delivery
On an average day in 2014,
Toromont Cat processed 3,000
parts orders. As throughput
goes, it was a record year, but
volume is just one of many
metrics that counts. For our
Product Support teams, order
fulfillment accuracy and speed
are also essential in hitting
customer satisfaction targets
and chasing out profitability-
destroying inefficiencies.
As part of our continuous
improvement process, we took
action in 2014 to enhance
performance. At our largest
branch in Concord, Ontario,
we commissioned a new
warehouse-management
software system, redesigned
the 27,000 square meter space
into six zones and upgraded
handheld radio frequency (RF)
scanners to enable priority
sequencing. As a result, each
staff member is now capable of
picking 60 line items per hour,
up from 25, and the electronic
bar coding system we use
verifies that each order is filled
correctly. The resulting gains in
throughput have wide-reaching
benefits because many parts
orders cross through Concord
on their way to other Toromont
Cat branches.
This was not the only upgrade.
Since many customers place
orders electronically through
our PartStore web portal, we
sought to make their experience
faster by installing do-it-yourself
computer kiosks. Customers
swipe their Cat commercial
card, receive a chit and use it
to identify their pre-packaged
order waiting for pick up.
This avoids queuing up behind
customers who need more
assistance. Pick-ups can be
accomplished in as little as
one minute – barely enough
time to grab a drink at the
parts counter coffee bar.
We understand that often
times, time is money and these
investments make us faster
for our customers.
Time Sensitive
ANNUAL REPORT 2014
17
level rely on Toromont to schedule and
perform preventative maintenance using
equipment service meters that are moni-
tored using VisionLink. The MANAGE level
combines the entire EMSolutions’ portfolio
and is for customers who want Toromont
to take care of all aspects of equipment
monitoring, maintenance and repair.
Recognizing that it is not always easy for
customers to adopt technology, Toromont
Cat and Battlefield also offer various
training options. These practical learning
programs include in-field instruction for
operators on the use of machine control
equipment, as well as classroom sessions
devoted to understanding digital design in
road construction. In 2014, the Company
provided 6,300 hours of such training.
From Smart Machines to Smarter Operations
Toromont employs approximately 30
software specialists to stay on pace with
changing business needs and has invested
more than $10 million in developing new
technology-powered business solutions
over the past five years.
“We continue to make a major investment
in technology innovation every year,” said
Mr. Cuddy, “and we focus those efforts on
areas that deliver greater customer value.”
One of those areas of concentration
led to the development of the Toromont
Equipment Management Toolkit or EMT,
a software package now used by a number
of Cat dealers. EMT acts as an electronic
scorecard for preventative maintenance
agreements. It automates planning and
scheduling of service, generates work
orders, and documents when work
is completed. In this way, it is both a
resource-planning tool and an important
verification tool that ensures customer
obligations are completed efficiently
and on time.
Technology improves Toromont’s
business and customer value proposition
in other ways. Battlefield – The Cat Rental
Store was an early adopter of wireless asset
tracking to optimize product availability
and dispatch deliveries to customer sites.
Using it has enhanced customer service
levels through real-time inventory status,
and has created service efficiencies that,
in turn, have led to increased equipment
availability for customers.
Within Toromont’s heavy rent operations,
machines now sport a Quick Response (QR)
code, which is an optical label used to
access stored information. Currently, these
codes are being used internally to improve
asset tracking, but they will also be
programmed to carry value-added informa-
tion that customers can access by passing
their smartphone over the QR barcode.
Customers also expect their suppliers
to automate key business processes.
Toromont has addressed these
expectations at Toromont Cat and
Battlefield with web-based portals.
At MyToromont, customers find their
web applications in one place, including
the PartStore and VisionLink applications,
as well as fluid sample results and machine
manuals. Battlefield provides customers
with online access to rental and sales
agreements, delivery and pickup
documents, invoices and the latest
sales promotions.
Although technology is pervasive at
Toromont, there are many opportunities for
further advancement. Mr. Cuddy envisions
that technology will be used “to map how
we can respond to customer needs and
preferences and improve value-creation
throughout our marketing, sales and
product support functions.” Also expected
is further development of on-board
diagnostic tools that will reduce time spent
downloading data from machine sensors
to a laptop during field service. Cat is also
currently piloting software that will assist
in predicting future parts sales so we can
better plan our inventories and resources,
and further increase part availability
for customers.
In these and other ways, data will drive
the heavy equipment industry into the
future. This is good news for Toromont,
because we believe that the best decisions
are made by empowered people armed
with the best information. TIH
TOROMONT
18
power. This marked a new beginning for our
customer and our relationship.
What makes CHP an attractive power
source for Rosa Flora is that our packages
not only provide a flexible supply of electrical
power for lighting, they also capture engine
heat, which is then recycled and used as an
economical source for heating water. Warm
water is a key resource in Rosa Flora’s
greenhouses, where it is used to feed over
100 different varieties of gerberas. By simulta-
neously generating both thermal energy (heat)
and electricity for greenhouse lighting, fuel
efficiency soars to 96.5%. Higher efficiency
means substantially reduced energy bills.
In the latest assignment for Rosa Flora,
Toromont Cat Power Systems supplied the
the facility’s energy output to 5.6 MWs.
In early 2014, just as we finished commis-
sioning another two CHP packages, disaster
struck. Overnight on March 6, a devastating
fire destroyed six hectares of farm property,
including greenhouses, delivery trucks and
office space. While the fire did not start near
the CHP equipment, Sampson and Brutus
melted due to the intensity of a blaze that
took 80 firefighters almost 12 hours to control.
While the loss was significant, Mr. DeBoer
made a quick decision. Rosa Flora would rebuild
and do so with the same commitment to
green energy, CHP and Toromont. This winter,
our Power Systems division delivered another
two new Cat G3520 generator sets capable of
generating an additional 4MWs of green
Toromont Powers the Seat of Power in Toronto
Toronto City Hall has served as
the home of Canada’s largest
municipal government for over
50 years. So when fire broke out
in an underground electrical
vault on September 25, 2014,
forcing an evacuation, the city’s
business came to an abrupt halt
– but not for long.
That evening, Toromont
received a request to deliver
10 MW of emergency power.
Supplying this much power on
an expedited basis is not unusual
for Toromont Cat Power Systems,
which operates on a 24/7 basis.
However, as Nancy Ambtman,
Power Systems Rental Manager
said, “There was one catch. This
specific site runs on a 416-volt
system, whereas the majority of
the city is powered on a 600-volt
system. That meant sourcing
even more specialized
equipment than usual.”
By leveraging Toromont’s
resources and those of the Cat
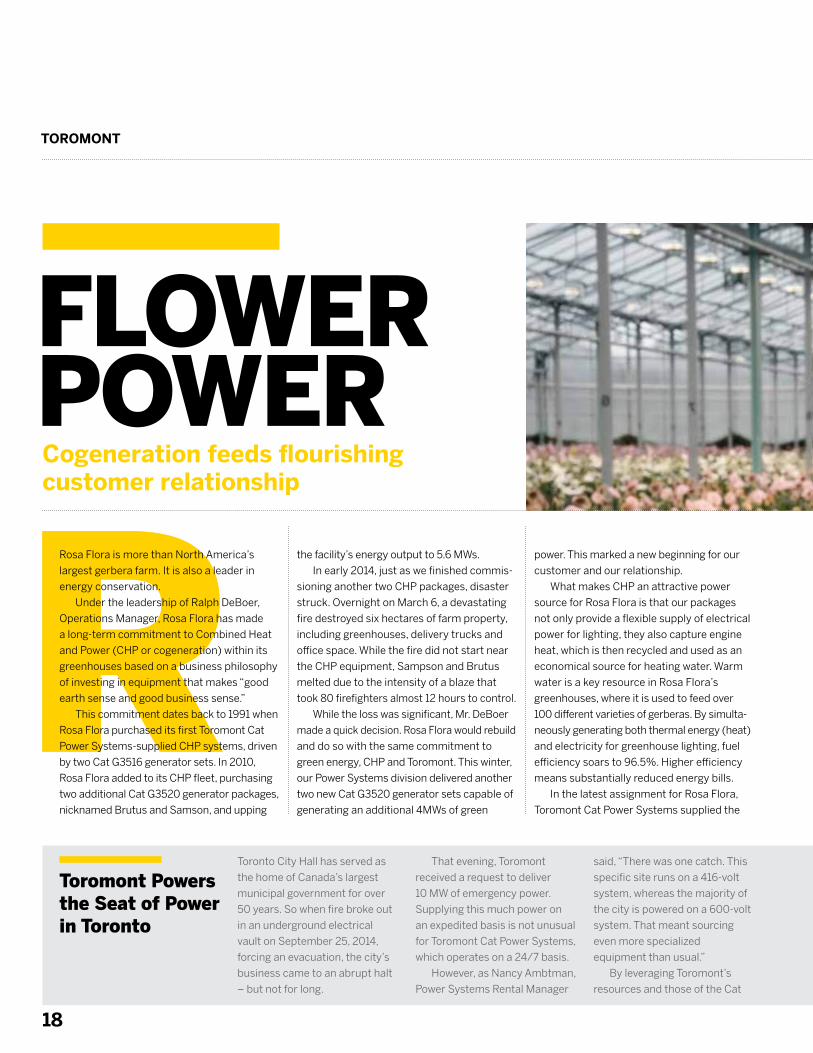
RFLOWER POWERCogeneration feeds flourishing customer relationship
RRosa Flora is more than North America’s
largest gerbera farm. It is also a leader in
energy conservation.
Under the leadership of Ralph DeBoer,
Operations Manager, Rosa Flora has made
a long-term commitment to Combined Heat
and Power (CHP or cogeneration) within its
greenhouses based on a business philosophy
of investing in equipment that makes “good
earth sense and good business sense.”
This commitment dates back to 1991 when
Rosa Flora purchased its first Toromont Cat
Power Systems-supplied CHP systems, driven
by two Cat G3516 generator sets. In 2010,
Rosa Flora added to its CHP fleet, purchasing
two additional Cat G3520 generator packages,
nicknamed Brutus and Samson, and upping
ANNUAL REPORT 2014
19
generator sets as well as specialized controls
and switchgear – the technology that enables
the various systems to operate safely and
in unison. Permissive circuits are used to
automatically engage each unit as required
for maximum efficiency depending on green-
house temperature and ambient conditions.
As a long-time subscriber to CHP technolo-
gies, and a company that is self-reliant,
Rosa Flora is a highly educated green-energy
consumer. The farm’s leadership in green
energy technologies, including a wind turbine
and biomass-fueled boilers, has reduced
the company’s reliance on fossil fuels and
resulted in the firm’s recognition as an
Industrial Energy Innovator by The Canadian
Industry Program for Energy Conservation.
Choosing Toromont repeatedly to assist
with their energy needs is a reflection of
Mr. DeBoer’s analysis of our value proposition
of providing specialized equipment and
reliable product support, including 24/7
parts and service supply.
“The relationship between Toromont Cat
Power Systems and Rosa Flora spans more
than two decades, four separate CHP projects
and now one fire,” said Mr. DeBoer. “This
long-term partnership has resulted in Rosa
Flora being able to reduce our overall energy
bill and therefore create a competitive
advantage in the floral marketplace.”
Rosa Flora is not alone in its commitment
to sustainable energy. Ontario Power Authority
(OPA) recently reported that it was managing
contracts for 434 MW of capacity from 10
CHP plants. To encourage the development
of CHP facilities of up to 20 MW in size,
with specific focus on agriculture and
district energy projects, OPA introduced its
Combined Heat and Power Standard Offer
Program 2.0 in late summer 2014.
With the soaring cost of electricity,
the attractive economics of natural gas,
the environmental benefits of cogeneration,
and the potential to qualify for OPA incen-
tives, many leading organizations, including
hospitals, colleges and municipalities, have
started to study CHP technology.
Toromont Cat Power Systems is ready to
help these other power users flourish just as we’ve
done with Rosa Flora for over two decades. TIH
network, our team identified five
XQ 2000 units that would get the
job done. Working through the
night, Power Systems moved
these diesel-powered units, each
housed in a 12-metre trailer, to
City Hall where teams began the
task of connecting them to five
separate electrical panels within
the building. As part of the order,
Power Systems also supplied over
6,000 metres of electrical cable.
By Saturday morning at
10 AM, less than two days after
the fire, the business of City Hall
resumed with full emergency
electrical power provided by
Toromont. This is not the end
of the story. Over the following
three-week period, until a new
transformer could be installed,
Toromont never left the site.
One technician was there at all
times to ensure the equipment
functioned properly and to
coordinate the thrice-daily
diesel fuel drops.
Bringing power to the
people is an important job,
not only for staff at City Hall,
but for Toromont in Toronto
and throughout our operations.
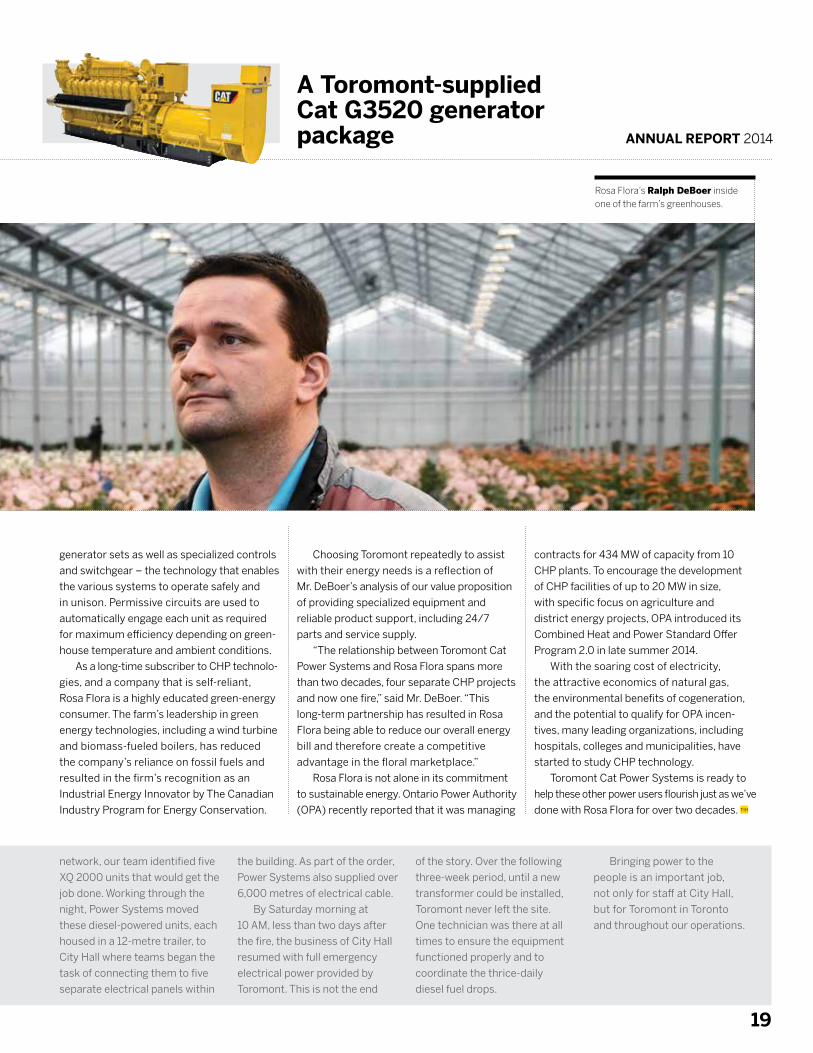
A Toromont-supplied Cat G3520 generator package
Rosa Flora’s Ralph DeBoer inside one of the farm’s greenhouses.
TOROMONT
20
Fice was to adjust the brine or floor tempera-
ture to a level that operators estimated
would produce the required ice solidity and
thickness (all NHL ice surfaces are 3.81
centimetres thick). Since many factors can
alter ice surface temperature, and these
factors affect the ice long before the brine
temperature changes, this approach was
wholly inadequate for NHL-sized buildings
and often resulted in the stoppage of play as
referees knelt down to patch a hole.
To counteract this problem, CIMCO
engineers worked with technology suppliers
to integrate infra-red sensor technology with
CIMCO has been on the leading edge of
many developments that substantially
improve playing and viewing conditions.
In fact, working in conjunction with Stadium
Consultants International, Inc., we helped
the NHL set its performance guidelines for
refrigeration, a set of technical specifica-
tions shared by all team owners and facility
managers league-wide for the better part
of the last two decades.
These specifications ensure that every
NHL facility has the appropriate number
of compressors, chillers, brine pumps,
dehumidifiers and other materials to meet
load requirements, which are understand-
ably significant. Every centimetre of an NHL
ice surface must maintain –6.1°Celsius,
even though the ambient temperature of
arenas rise markedly as thousands of fans
stream in and crews power up their
powerful television lights. As arenas have become larger and more
bowl-shaped, the demands on the ice-mak-
ing equipment have only increased. To cope,
CIMCO-powered NHL arenas use many
innovative features, including comprehensive
temperature control systems. In old-time
hockey, the traditional method of managing
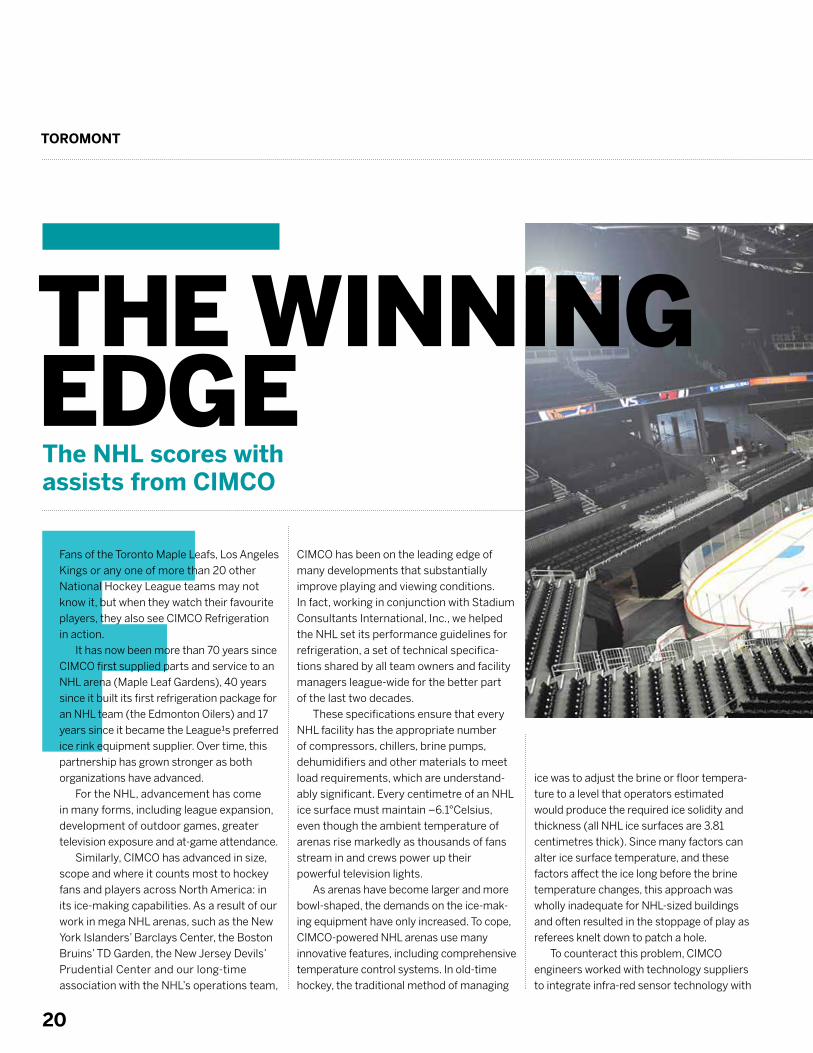
THE WINNING EDGE
FThe NHL scores with assists from CIMCO
Fans of the Toronto Maple Leafs, Los Angeles
Kings or any one of more than 20 other
National Hockey League teams may not
know it, but when they watch their favourite
players, they also see CIMCO Refrigeration
in action.
It has now been more than 70 years since
CIMCO first supplied parts and service to an
NHL arena (Maple Leaf Gardens), 40 years
since it built its first refrigeration package for
an NHL team (the Edmonton Oilers) and 17
years since it became the League¹s preferred
ice rink equipment supplier. Over time, this
partnership has grown stronger as both
organizations have advanced.
For the NHL, advancement has come
in many forms, including league expansion,
development of outdoor games, greater
television exposure and at-game attendance.
Similarly, CIMCO has advanced in size,
scope and where it counts most to hockey
fans and players across North America: in
its ice-making capabilities. As a result of our
work in mega NHL arenas, such as the New
York Islanders’ Barclays Center, the Boston
Bruins’ TD Garden, the New Jersey Devils’
Prudential Center and our long-time
association with the NHL’s operations team,
ANNUAL REPORT 2014
21
our control systems. Today, discrete CIMCO
cameras, mounted above NHL rinks, take
precise temperature readings across the ice
surface. Hundreds of times every minute,
information from these cameras and a
sensor in the concrete slab below the ice
feed information to a CIMCO microproces-
sor. When the infra-red signals received from
the ice surface indicate a variance of as little
as 1/20 of 1 degree Celsius, the refrigeration
system is automatically adjusted to maintain
the optimal temperature.
Of course, it is not enough to simply
monitor the temperature; having the right
refrigeration capacity is critical. This is
why NHL specifications call for high-horse-
power screw compressors with built-in
equipment redundancy. In old-style NHL
arenas, reciprocating compressors were
sometimes used with less than desirable
outcomes, particularly in the southern U.S.
Another important advancement is
the use of desiccant dehumidification.
A desiccant is a substance that prompts
and then sustains a state of dryness within
its vicinity and is commonly used to keep
vegetables crispy. While regular dehumidifi-
ers work well in warm, moist environments,
only desiccant dehumidifiers are suited to
the cool climes of an NHL arena and are part
of the NHL’s rink specifications. By employ-
ing this equipment, the days when fog
would envelop ice rink surfaces (think of
the Phillies-Sabres playoff game at the old
Buffalo Memorial Auditorium) are long gone.
It has now been close to two decades
since NHL arena specifications were
developed, and still CIMCO innovates on
behalf of the League. A recent example is
the portable package we designed as the
sole source of refrigeration for the League’s
immensely popular outdoor games.
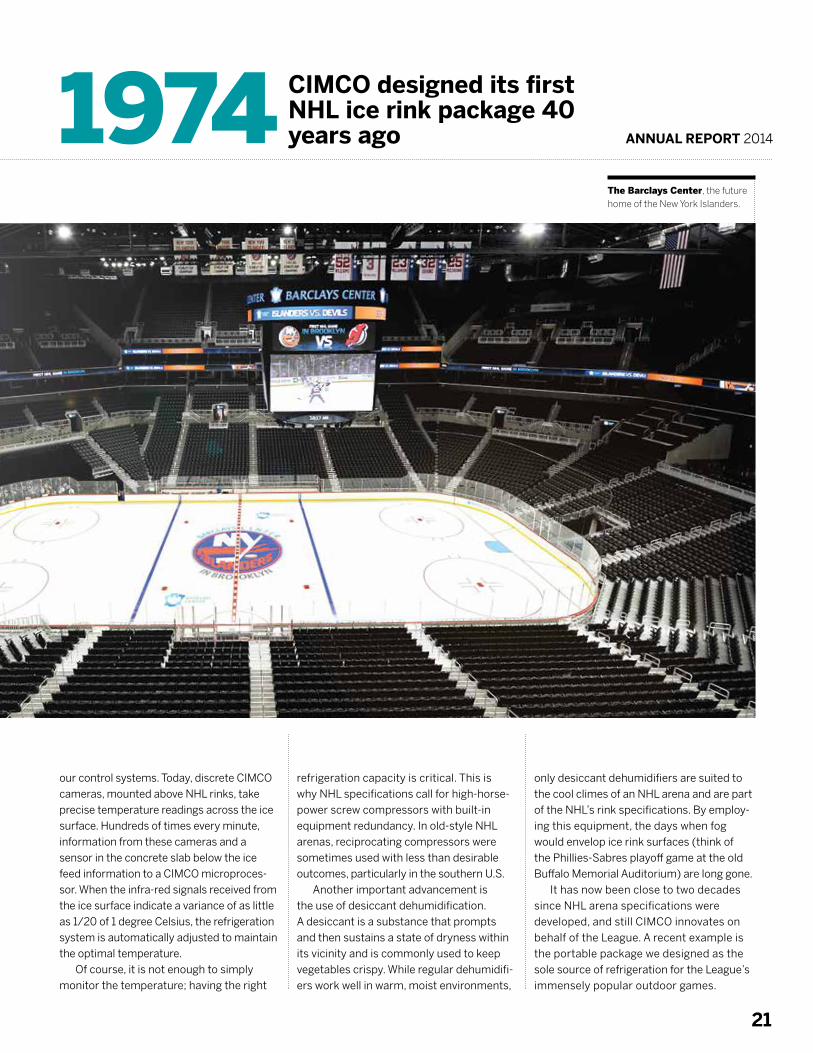
1974 CIMCO designed its first NHL ice rink package 40 years ago
The Barclays Center, the future home of the New York Islanders.
TOROMONT
22
the Vancouver Canucks (a rebuild of the
Rogers Arena) and the Edmonton Oilers
(a package for the new $480 million
Rogers Place) attest.
“Preferred supplier status does
convey an important advantage for CIMCO
inside and outside the NHL,” says Dave
Malinauskas, President of CIMCO. “As a
result of the expertise developed to outfit
large arenas, we have been awarded
assignments for many state-of-the art
NHL practice facilities and facilities for
NHL affiliates over the years.”
For example, CIMCO supplied the
refrigeration equipment for the four-pad
MasterCard Centre in Etobicoke, Ontario,
which has been used by the Toronto Maple
Leafs and Toronto Marlies of the AHL since
2009. More recently, our NHL experience
proved to be instrumental when we bid on
the new twin-pad Haborcenter in Buffalo, NY
that opened in the fall of 2014 as the home
of Canisius College’s NCAA Division I
hockey team and the Buffalo Junior Sabres
youth hockey organization. This past year
also saw CIMCO upgrade refrigeration
equipment at FirstOntario Centre, home
of the Hamilton Bulldogs, the Montreal
Canadiens’ AHL affiliate.
“Whether it’s in Canada or the U.S., our
NHL work is well recognized and valued
when we bid on community projects,” says
Steve Shutt, CIMCO’s Manager, Business
Development, Hockey. “Many times we hear
community rink owners ask, can you build
me an NHL-calibre ice rink, and the truthful
answer is yes.”
Mr. Shutt has served CIMCO for 17 years,
and as a former Montreal Canadien with five
Stanley Cup Championship rings to his
credit, he knows more than a little about ice
and is proud to serve with a company that
serves the best hockey league in the world.
Since his time as a professional
hockey player and NHL assistant coach,
Mr. Shutt said that ice quality has improved
dramatically, and a big reason is the NHL’s
insistence on the highest performance
standards and the efforts of the League’s
Senior Director of Facilities Operations,
Dan Craig. Mr. Craig is also a fan of CIMCO.
“I’ve been in the arena industry for four
decades, first in community facilities, later
with the Edmonton Oilers and, since the
late 1990s, with the NHL,” said Mr. Craig.
“I’ve worked with CIMCO at every level,
leaned on them many times for assistance
and, whether we’re playing in the U.S. or
Canada, at indoor or outdoor games, and
even at the 2010 Winter Olympics, they
have always proved to be a great resource.
Their technicians are absolutely first-rate
and they gel well with every team.”
As the NHL continues to score with fans
and sponsors alike, CIMCO is ready to assist
the League’s teams in maintaining their
winning edge with leading technology,
know-how and a deep passion for our
national pastime. TIH
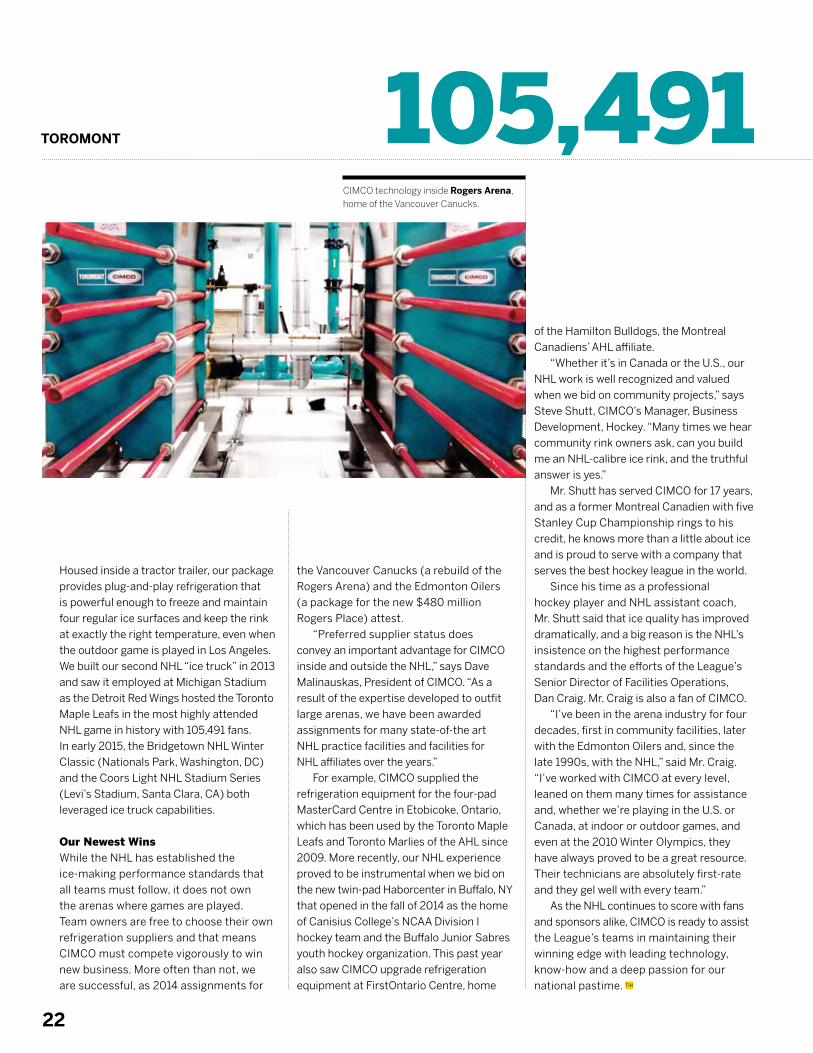
Housed inside a tractor trailer, our package
provides plug-and-play refrigeration that
is powerful enough to freeze and maintain
four regular ice surfaces and keep the rink
at exactly the right temperature, even when
the outdoor game is played in Los Angeles.
We built our second NHL “ice truck” in 2013
and saw it employed at Michigan Stadium
as the Detroit Red Wings hosted the Toronto
Maple Leafs in the most highly attended
NHL game in history with 105,491 fans.
In early 2015, the Bridgetown NHL Winter
Classic (Nationals Park, Washington, DC)
and the Coors Light NHL Stadium Series
(Levi’s Stadium, Santa Clara, CA) both
leveraged ice truck capabilities.
Our Newest Wins While the NHL has established the
ice-making performance standards that
all teams must follow, it does not own
the arenas where games are played.
Team owners are free to choose their own
refrigeration suppliers and that means
CIMCO must compete vigorously to win
new business. More often than not, we
are successful, as 2014 assignments for
105,491 CIMCO technology inside Rogers Arena, home of the Vancouver Canucks.
ANNUAL REPORT 2014
23
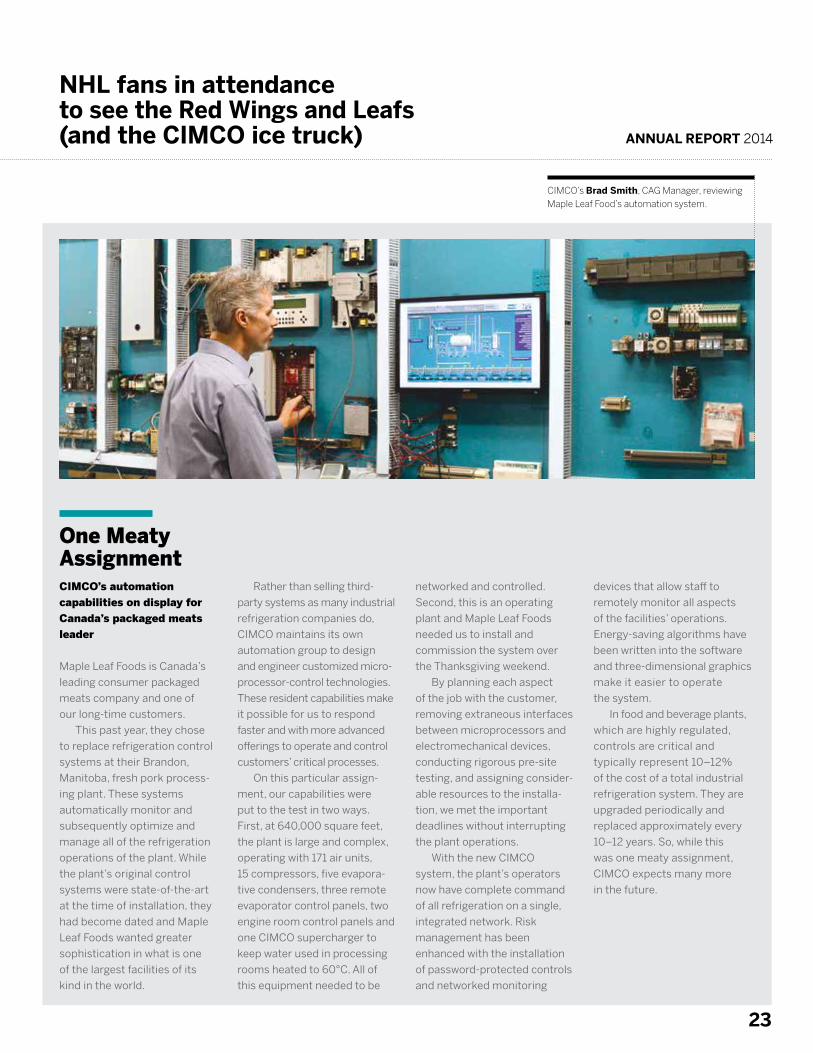
One Meaty Assignment
Rather than selling third-
party systems as many industrial
refrigeration companies do,
CIMCO maintains its own
automation group to design
and engineer customized micro-
processor-control technologies.
These resident capabilities make
it possible for us to respond
faster and with more advanced
offerings to operate and control
customers’ critical processes.
On this particular assign-
ment, our capabilities were
put to the test in two ways.
First, at 640,000 square feet,
the plant is large and complex,
operating with 171 air units,
15 compressors, five evapora-
tive condensers, three remote
evaporator control panels, two
engine room control panels and
one CIMCO supercharger to
keep water used in processing
rooms heated to 60°C. All of
this equipment needed to be
CIMCO’s automation
capabilities on display for
Canada’s packaged meats
leader
Maple Leaf Foods is Canada’s
leading consumer packaged
meats company and one of
our long-time customers.
This past year, they chose
to replace refrigeration control
systems at their Brandon,
Manitoba, fresh pork process-
ing plant. These systems
automatically monitor and
subsequently optimize and
manage all of the refrigeration
operations of the plant. While
the plant’s original control
systems were state-of-the-art
at the time of installation, they
had become dated and Maple
Leaf Foods wanted greater
sophistication in what is one
of the largest facilities of its
kind in the world.
networked and controlled.
Second, this is an operating
plant and Maple Leaf Foods
needed us to install and
commission the system over
the Thanksgiving weekend.
By planning each aspect
of the job with the customer,
removing extraneous interfaces
between microprocessors and
electromechanical devices,
conducting rigorous pre-site
testing, and assigning consider-
able resources to the installa-
tion, we met the important
deadlines without interrupting
the plant operations.
With the new CIMCO
system, the plant’s operators
now have complete command
of all refrigeration on a single,
integrated network. Risk
management has been
enhanced with the installation
of password-protected controls
and networked monitoring
devices that allow staff to
remotely monitor all aspects
of the facilities’ operations.
Energy-saving algorithms have
been written into the software
and three-dimensional graphics
make it easier to operate
the system.
In food and beverage plants,
which are highly regulated,
controls are critical and
typically represent 10–12%
of the cost of a total industrial
refrigeration system. They are
upgraded periodically and
replaced approximately every
10–12 years. So, while this
was one meaty assignment,
CIMCO expects many more
in the future.
NHL fans in attendance to see the Red Wings and Leafs (and the CIMCO ice truck)
CIMCO’s Brad Smith, CAG Manager, reviewing Maple Leaf Food’s automation system.
24
SS In several areas, we also set more-am-
bitious targets, including the number of
safety-practice evaluations our Toromont
Cat supervisors are expected to perform.
Reasoning that underlying causes should
not go unaddressed for any length of time,
we established a five-day limit on incident
investigations. We also asked employees
to increase their focus on reporting
hazardous situations, which improves
our opportunity to fix root causes, share
findings and thus prevent future issues.
This resulted in proactive changes in
protocols including, for example, safe
blocking and storage.
Battlefield’s current safety program was
launched in 2003 with progressive changes
and results along the way.
Each of our businesses applies safety
strategies that are relevant to their type
of work. At Toromont Cat, we began our
current safety journey five years ago.
In that time, our team has collectively
attended more than 70,000 safety training
courses, completed more than one million
pre-job hazard assessments and received
some 1,800 daily safety talks that bring
awareness to the right behaviours. Each
of our locations has undergone dozens of
health and safety audits to track results
against leading safety indicators. On an
annual basis, one branch rises above
the rest in a competition that measures
safety performance across 14 categories.
In 2014, that branch was Detour Lake and
it received our Safety Bucket Award.
SUSTAINABILIT Y REPORT
Toromont Recognized at Caterpillar People Conference
In 2014, Toromont took top
honours at Caterpillar’s
annual People Conference
in two categories: Cultural
Assessment/Cultural Change
and Service Management
Development. The first
award recognized the develop-
ment of our health and safety
culture. The second recognized
improved delivery in our service
operations. The competition
included 65 dealers from
the Americas.
Safety Our first job is to protect our employees
wherever and whenever they do business,
as well as everyone who steps foot in
the more than 100 locations with our
marques. This is a responsibility that
we take seriously.
Our desired outcome is an accident-
free workplace where all employees
know how to identify, avoid and correct
hazards before they turn into injuries.
To achieve it, we work to create a safety-first
culture where every employee under-
stands that a job is only well done when it
is done safely. Our expectations are high:
zero tolerance for non-conformance to
safety protocols; recognition for best-in-
class performance.

25
In addition to branch safety audits, we
provide load retention seminars and
practical training to our drivers, with driver
abstracts completed monthly. Customer
safety is equally important. Battlefield’s
five field trainers provide many hours
of customer support to ensure safe use
of rental equipment every year and we
continue to install defibrillators in all stores.
CIMCO’s safety program is also well
established and constantly advancing. In
2014, we developed a new working-with-
ammonia safety program, implemented a
Safety Scorecard Audit for all 29 CIMCO
branches and, reflecting the growth of our
field-service workforce in the U.S., stepped
up safety training there.
Safety is not just a bottom-up endeav-
our. We challenge our senior leaders to
engage more deeply and frequently in
safety conversations. Part of the variable
compensation for our managers is based
on safety scores. Our Board is an active
overseer of environmental, health and
safety results through its Human Resources
and Compensation Committee and
discussion at each regular Board meeting.
Due to the geographic dispersion of our
operations, technology plays a role in our
safety regimen. Since 2013, Toromont Cat
has curated all incident reporting online.
More recently, we moved our Material
Safety Data Sheets (MSDS) into an
online application, allowing employees
to instantly access handling, storage and
first aid treatment information on every
chemical we use. A new smartphone
application was added to our Toromont
Cat Working in Isolation program. If an
employee alone in the field or in a branch
after hours fails to report in every two
hours, a third-party monitoring service
pinpoints their location and dispatches
emergency personnel if necessary.
Sharing best practices with newly
acquired businesses is also important.
Sometimes this means investing in new
safety tools, as our newest team members
at Ag West found this fall when we
delivered Toromont-standard Personal
Protection Equipment that included,
in their case, Arctic cold-rated coats.
For several years, we have required
that all suppliers attend Toromont safety
orientations to ensure they are qualified
to our standards.
We have noted improved results from
these activities. Total recordable injury
frequency rates declined 64% between
2010 and 2014 while lost-time injuries
were down 79% in the same period.
Despite positive trends, we are not
yet injury-free. While we believe we have
the right programs in place to reach our
goal, it will only be achieved with even
more effort and greater attention to
the right behaviours.
Workforce Development and Diversity We apply various strategies to recruit,
train, motivate and retain the best people,
knowing that our success depends on it.
To improve talent management,
Toromont Cat recently introduced
a web-based performance appraisal
tool called MYPERFORMANCE. It was
designed to improve the quality and
consistency of employee reviews and
reduce administrative time. In parallel,
we launched MYFUTURE, a web-based
tool to help employees identify their
own professional objectives and match
their needs with the skills development
opportunities that we make available.
We also use our intranet for skills
development. In 2014, six leadership
modules were delivered to 106 employees
2014 was the safest year on record at Toromont Cat
SUSTAINABILIT Y REPORT
Samantha McGillion, a junior technician, works toward becoming a certified heavy-duty mechanic at our Concord branch.
TOROMONT
26
and developed strategies that we can use
to grow and improve our business.
These activities have a decided impact
on employee effectiveness and loyalty.
Our voluntary turnover rates are consis-
tently below industry averages and we
benefit from having a large resource pool
to draw from when choosing new leaders.
Effective recruitment is also important.
We continue to use various techniques,
including high school, college and univer-
sity campus outreach. In 2014, we added
Thunder Bay’s Confederation College to,
bring to nine, the number of educational
institutions we support. Support includes
participation on each institution’s aca-
demic advisory board and, in some cases,
donations of equipment components.
In 2014, we supplied 15 Cat engines to
our partner colleges so that students have
modern equipment to explore. Students
are also given full access to the latest Cat
ET Diagnostic Software. In exchange, we
share our ideas for improved curriculum,
meet students, promote technical careers
and interview promising future employees.
This approach helped us to meet our 2014
target of recruiting 40 of the brightest
people into the Toromont Cat apprentice-
ship program that now has 150 members.
We also bestowed seven THINK BIG
scholarships to help students pay for
tuition at a sponsored college.
Recruiting in the north continues to be
a priority and in 2014 included outreach to
forge closer ties in the Kivalliq, Kitikmeot,
and Qikiqtaaluk regions of Nunavut and
with the Nunatsiavut Government in
Labrador. Toromont also participated in
Taykwa Tagamou Nation and Apitisawin
job fairs, among others. Building trusting
relationships has paid off as we continued
to hire and develop employees from our
partner First Nations and Inuit
from CIMCO, Battlefield and Toromont Cat.
Over 283 sales representatives benefitted
from Four Pillars Sales Professional
training. Another 245 employees partici-
pated in Customer Engagement Training
to increase the consistency and quality
of service delivery.
For high-potential leaders, there is
the Toromont Cat Management Trainee
Program. Launched 30 years ago and
formalized in 1998 with the introduction
of an administrator, this program has
prepared 57 employees to take on
management roles. Our President and
CEO, the President of our Construction
Industries Division, the Vice President of
our Central Region, our General Manager
in Newfoundland, our Timmins branch
manager, the manager of our Heavy Rent
fleet, and several product support and
parts managers are all past graduates.
Our current trainees attended the
Toromont 2014 Leadership Conference
where they learned from senior leaders
“Building trusting relationships has paid off as we continued to hire and develop employees from our partner First Nations and Inuit communities.”
Toromont Cat Technician Barry Cordner attends to a Cat D6T.
ANNUAL REPORT 2014
27
communities who now work at various
sites, including branches in Goose Bay,
Labrador; St. John’s, Newfoundland; and
at two mine sites in northern Ontario,
Detour Lake and Victor.
Our industry remains male-dominated.
However, we are working to change that,
in part through participation in the Women
in Trades Network (WiTN), which hosts
annual forums where women are given
hands-on learning experiences. Within our
own business, we are pleased to note that
more women are serving in leadership
roles both on the corporate side and in
our operations, including Ginnie Howe.
In 2014, she became Toromont Cat’s first
female branch manager.
In the Community Our employees support important causes
with encouragement from Toromont.
For the 11th straight year, Toromont’s
official charity was the United Way, an
organization we favour because of its
broad community reach and the opportu-
nities it makes available for our employees
across multiple provinces to volunteer
together. In addition to a two-week United
Way campaign, Toromont Cat employees
organized a softball challenge featuring
14 teams slugging it out for fun and
fundraising, and participated, along with
a team from CIMCO, in the annual York
Region Dragon Boat Race. Total United
Way fundraising amounted to $178,217
in 2014. Beyond monetary donations,
over half of Toromont Cat’s branches
participated in a Day of Caring® where
employees volunteered their time and
expertise to help organizations such as
Toronto’s Yonge Street Mission and the
Blue Door Shelter in East Gwillimbury,
Ontario, deliver social services.
Environment Toromont does not have a heavy environ-
mental footprint. At the same time, we
are not indifferent to responsible environ-
mental practices. On the contrary, we
maintain anti-idling and minimum fuel-
efficiency guidelines for Company vehicles,
use high-efficiency air compressors in
our service shops, light our facilities with
energy-efficient bulbs, and are avid recy-
clers. Over the past six years, we diverted
55,961 kilograms of waste from landfill and
recovered 43,384 litres of liquid, including
oil, by recycling the absorbent pads used
by our technicians when cleaning machines.
In 2014, Battlefield’s Ajax store and Toromont
Cat’s branches in Timmins, Brampton and
Orillia became the latest in a growing number
of facilities to install water-recycling wash
bays. As a means of monitoring environmen-
tal progress, Toromont Cat tracks its water
consumption and the contributors to its CO2
footprint, including natural gas, gasoline,
diesel and electricity.
We also continue to help our customers
with their sustainability efforts. Across
industrial and recreational markets,
CIMCO’s ECO CHILL and ECO2 CHILL
installed base has offset 445,000 tonnes
of greenhouse gas emissions (GHG)
compared to traditional refrigeration
(the equivalent of taking 98,000 cars off
the road) and saved 53 million kilowatt
hours of electricity by recycling heat.
We also offer customers industry-leading
Tier 4 final engine packages from Cat that
meet emission regulations requiring the
use of ultra-low-sulfur diesel fuel.
We are proud of progress made
in 2014, but when it comes to sustaining
and building Toromont – whether it is
through safety, employee development or
environmental conservation – we know
one thing: the job is never done. TIH
Toromont donated engines to partner colleges in 2014
2014 was the safest year on
record at Toromont Cat. Not a
single lost-time injury (LTI) was
recorded, continuing a trend
that began in August 2013.
This LTI-free status across
33 locations was achieved even
though total exposure hours
reached to 3.8 million during
the year and 5.5 million since
our last LTI. Exposure hour is a
commonly used measure of the
amount of time a workforce is
exposed to on-the-job hazards.
We are very pleased with this
performance and with the fact
that Toromont Cat has reduced
lost workdays by 98% over the
past five years.
Toromont Cat Celebrates LTI-Free Year
15
TOROMONT
28
A strong and effective corporate govern-
ance program continues to be a principal
priority for Toromont. The Nominating
and Corporate Governance Committee,
on behalf of the Board, establishes and
monitors the governance program and its
effectiveness. The Company’s corporate
governance structure and procedures are
founded on our Code of Business Conduct
that applies to all Directors, officers and
employees. Our governance program
includes the activities of the Board of
Directors, who are elected by and are
accountable to the shareholders, and
the activities of management, who are
appointed by the Board and are charged
with the day-to-day management of
the Company.
Toromont regularly reviews and enhances
its governance practices in response to
evolving regulatory developments and
other applicable legislation.
The Company’s corporate governance
program is in compliance with National
Policy 58-201 – Corporate Governance
Guidelines and Multilateral Instrument
52-110 – Audit Committees.
Board of Directors The role of the Board of Directors, its
activities and responsibilities are docu-
mented and are assessed at least annually,
as are the terms of reference for each of
the committees of the Board, the Chairs of
the committees, the Lead Director and the
Chairman, inclusive of scope and limits of
authority of management. The Board acts
in a supervisory role and any responsibilities
not delegated to management remain with
the Board. The Board’s supervisory role
includes such matters as strategic planning,
identification and management of risks,
succession planning, communication
policy, internal controls and governance.
The Lead Director is an independent
Director, appointed annually by the inde-
pendent Directors of the Board to facilitate
the Board’s functioning autonomously from
management. The Lead Director serves as
a non-partisan contact for other Directors
on matters not deemed appropriate to be
discussed initially with the Chairman or in
situations where the Chairman is not avail-
able. The Lead Director is available to
counsel the Chairman on matters appro-
priate for review in advance of discussion
with the full Board of Directors.
Committee Structure and Mandates
Committees of the Board are an integral part
of the Company’s governance structure.
Three committees have been established
with a view toward allocating expertise and
resources to particular areas, and to enhance
the quality of discussion at Board meetings.
The committees facilitate Board decision-
making by providing recommendations
to the Board on matters within their
respective responsibilities. All committees
are comprised solely of Directors who
are independent of management.
A summary of the responsibilities of
the committees follows.
The Nominating and Corporate Governance Committee: Principal responsibilities are reviewing and
making recommendations as to all matters
relating to effective corporate governance.
The committee is responsible for assessing
effectiveness of the Board, its size and
composition, its committees, Director
compensation, the Board’s relationship
to management, and individual
performance and contribution of its
Directors. The committee is responsible
for identification and recruitment of new
Directors and new Director orientation.
CORPORATE GOVERNANCE

ANNUAL REPORT 2014
29
Robert M. Ogilvie Director since 1986
Mr. Ogilvie is Chairman of the Board. Mr. Ogilvie joined Toromont in 1985 and has been Chairman since 1987. He was also the Company’s CEO from 1987 to 2012, excluding the period from 2002 to 2006.
Katherine A. Rethy Director since 2013
Ms. Rethy is President of KAR Development Corporation, a leadership development and consulting company. Ms. Rethy is also a Director of SBM Offshore N.V. (Netherlands) and Equitable Bank.
L to RRobert M. Franklin, Scott J. Medhurst, John S. McCallum, Robert M. Ogilvie, Cathryn E. Cranston, Jeffrey S. Chisholm, David A. Galloway, Katherine A. Rethy, Wayne S. Hill
Nominating and Corporate Governance Committee
Audit Committee
Human Resources and
Compensation Committee
Jeffrey S. Chisholm Director since 2011
Mr. Chisholm is a business and finance consultant to the financial services industry. He is also a Director of Amex Bank of Canada.
Cathryn E. Cranston Director since 2013
Ms. Cranston is Senior Vice President and Treasurer, BMO Financial Group. Ms. Cranston has served on non-profit and internal boards of directors.
Robert M. Franklin Director since 1994
Chairman, Human Resources and Compensation Committee Mr. Franklin is President of Signalta Capital Corporation, a private investment company. Mr. Franklin has served on a number of public company boards of directors.
David A. Galloway Director since 2002
Chairman, Nominating and Corporate Governance CommitteeMr. Galloway is past Chairman of the Board of Directors of Bank of Montreal. He also serves on the Board of Directors of Harris Bank and E.W. Scripps Company.
Wayne S. Hill Director since 1988
Mr. Hill is a former Executive Vice President of the Company. Mr. Hill joined Toromont in 1985 as Vice President, Finance and Chief Financial Officer and became Executive Vice President in 2002. He retired from the Company in May 2008. He is also a Director of Enerflex Ltd.
John S. McCallum Director since 1985
Lead Director and Chairman, Audit CommitteeMr. McCallum is a Professor of Finance in the I.H. Asper School of Business at the University of Manitoba. He is also a Director of IGM Financial Inc., Wawanesa Mutual Insurance Company, Wawanesa General Insurance Company, and Wawanesa Life Insurance Company.
Scott J. Medhurst Director since 2012 Mr. Medhurst is President and CEO of Toromont Industries Ltd.
The Audit Committee: Principal duties include oversight respon-
sibility for financial statements and related
disclosures, reports to shareholders and
other related communications, establish-
ment of appropriate financial policies,
the integrity of accounting systems and
internal controls, legal compliance on ethics
programs established by management,
the approval of all audit and non-audit
services provided by the independent
auditors and consultation with the auditors
independent of management and overseeing
the work of the auditors and the Internal
Audit department.
Board of Directors
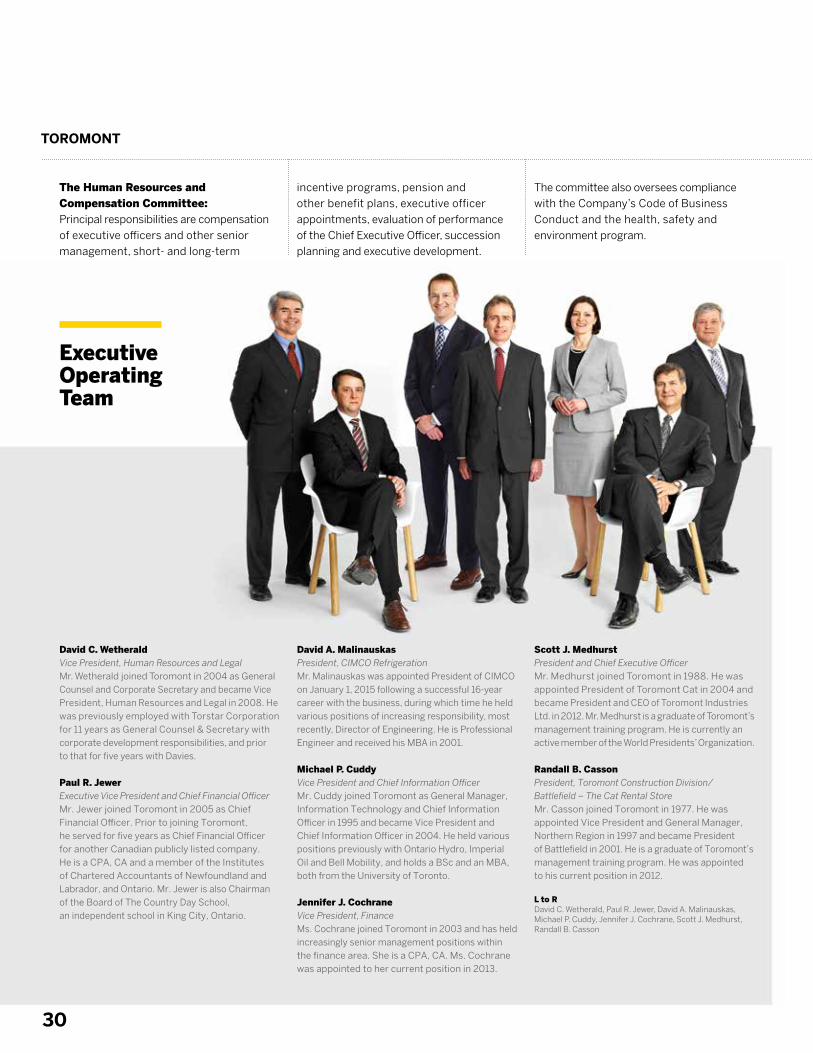
TOROMONT
30
Scott J. MedhurstPresident and Chief Executive Officer Mr. Medhurst joined Toromont in 1988. He was appointed President of Toromont Cat in 2004 and became President and CEO of Toromont Industries Ltd. in 2012. Mr. Medhurst is a graduate of Toromont’s management training program. He is currently an active member of the World Presidents’ Organization.
Randall B. CassonPresident, Toromont Construction Division/ Battlefield – The Cat Rental StoreMr. Casson joined Toromont in 1977. He was appointed Vice President and General Manager, Northern Region in 1997 and became President of Battlefield in 2001. He is a graduate of Toromont’s management training program. He was appointed to his current position in 2012.
L to RDavid C. Wetherald, Paul R. Jewer, David A. Malinauskas, Michael P. Cuddy, Jennifer J. Cochrane, Scott J. Medhurst, Randall B. Casson
David C. WetheraldVice President, Human Resources and LegalMr. Wetherald joined Toromont in 2004 as General Counsel and Corporate Secretary and became Vice President, Human Resources and Legal in 2008. He was previously employed with Torstar Corporation for 11 years as General Counsel & Secretary with corporate development responsibilities, and prior to that for five years with Davies.
Paul R. Jewer Executive Vice President and Chief Financial OfficerMr. Jewer joined Toromont in 2005 as Chief Financial Officer. Prior to joining Toromont, he served for five years as Chief Financial Officer for another Canadian publicly listed company. He is a CPA, CA and a member of the Institutes of Chartered Accountants of Newfoundland and Labrador, and Ontario. Mr. Jewer is also Chairman of the Board of The Country Day School, an independent school in King City, Ontario.
David A. Malinauskas President, CIMCO RefrigerationMr. Malinauskas was appointed President of CIMCO on January 1, 2015 following a successful 16-year career with the business, during which time he held various positions of increasing responsibility, most recently, Director of Engineering. He is Professional Engineer and received his MBA in 2001.
Michael P. CuddyVice President and Chief Information OfficerMr. Cuddy joined Toromont as General Manager, Information Technology and Chief Information Officer in 1995 and became Vice President and Chief Information Officer in 2004. He held various positions previously with Ontario Hydro, Imperial Oil and Bell Mobility, and holds a BSc and an MBA, both from the University of Toronto.
Jennifer J. CochraneVice President, FinanceMs. Cochrane joined Toromont in 2003 and has held increasingly senior management positions within the finance area. She is a CPA, CA. Ms. Cochrane was appointed to her current position in 2013.
The Human Resources and Compensation Committee: Principal responsibilities are compensation
of executive officers and other senior
management, short- and long-term
incentive programs, pension and
other benefit plans, executive officer
appointments, evaluation of performance
of the Chief Executive Officer, succession
planning and executive development.
The committee also oversees compliance
with the Company’s Code of Business
Conduct and the health, safety and
environment program.
Executive Operating Team
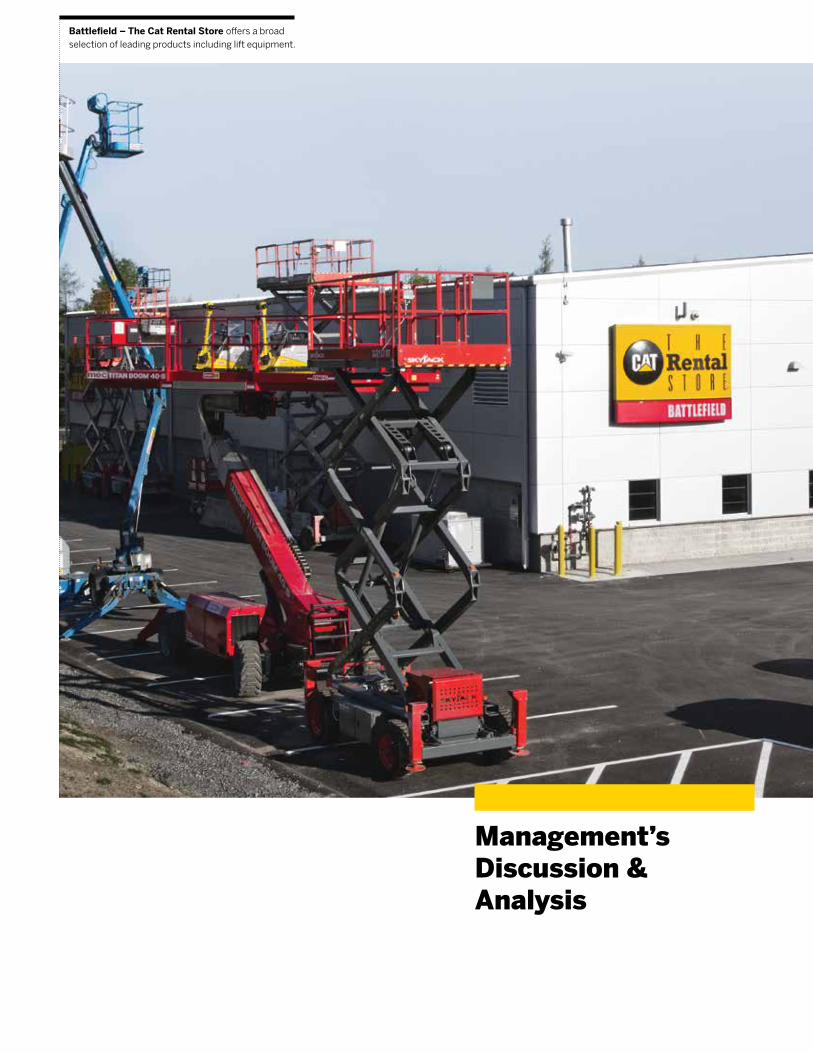
ANNUAL REPORT 2014
Battlefield – The Cat Rental Store offers a broad selection of leading products including lift equipment.
Management’s Discussion & Analysis
TOROMONT
32
Advisory
Information in this MD&A and Annual
Report that is not a historical fact is
“forward-looking information”. Words such
as “plans”, “intends”, “outlook”, “expects”,
“anticipates”, “estimates”, “believes”, “likely”,
“should”, “could”, “will”, “may” and similar
expressions are intended to identify
statements containing forward-looking
information. Forward-looking information in
this MD&A and Annual Report is based on
current objectives, strategies, expectations
and assumptions which management
considers appropriate and reasonable at the
time including, but not limited to, general
economic and industry growth rates,
commodity prices, currency exchange and
interest rates, competitive intensity and
shareholder and regulatory approvals.
By its nature, forward-looking informa-
tion is subject to risks and uncertainties
which may be beyond the ability of
Toromont to control or predict. The actual
results, performance or achievements of
Toromont could differ materially from those
expressed or implied by forward-looking
This Management’s Discussion and Analysis (“MD&A”) comments on the operations, performance and financial condition of Toromont
Industries Ltd. (“Toromont” or the “Company”) as at and for the year ended December 31, 2014, compared to the preceding year.
This MD&A should be read in conjunction with the attached audited consolidated financial statements and related notes for the year
ended December 31, 2014.
The consolidated financial statements reported herein have been prepared in accordance with International Financial Reporting
Standards (“IFRS”) and are reported in Canadian dollars. The information in this MD&A is current to February 5, 2015.
Additional information is contained in the Company’s filings with Canadian securities regulators, including the Company’s 2014 Annual
Report and 2015 Annual Information Form. These filings are available on SEDAR at www.sedar.com and on the Company’s website at
www.toromont.com.
information. Factors that could cause
actual results, performance, achievements
or events to differ from current expectations
include, among others, risks and uncertain-
ties related to: business cycles, including
general economic conditions in the
countries in which Toromont operates;
commodity price changes, including
changes in the price of precious and base
metals; changes in foreign exchange rates,
including the Cdn$/US$ exchange rate; the
termination of distribution or original
equipment manufacturer agreements;
equipment product acceptance and
availability of supply; increased competi-
tion; credit of third parties; additional costs
associated with warranties and mainte-
nance contracts; changes in interest rates;
the availability of financing; and environ-
mental regulation.
Any of the above-mentioned risks and
uncertainties could cause or contribute to
actual results that are materially different
from those expressed or implied in the
forward-looking information and state-
ments included in this MD&A and Annual
Report. For a further description of certain
risks and uncertainties and other factors
that could cause or contribute to actual
results that are materially different, see the
risks and uncertainties set out in the “Risks
and Risk Management” and “Outlook”
sections of this MD&A. Other factors, risks
and uncertainties not presently known
to Toromont or that Toromont currently
believes are not material could also cause
actual results or events to differ materially
from those expressed or implied by
statements containing forward-looking
information.
Readers are cautioned not to place
undue reliance on statements containing
forward-looking information that are
included in this MD&A and Annual Report,
which are made as of the date of this MD&A,
and not to use such information for
anything other than its intended purpose.
Toromont disclaims any obligation or
intention to update or revise any for-
ward-looking information, whether as a
result of new information, future events
or otherwise, except as required by
applicable securities legislation.
Management’s Discussion and Analysis
ANNUAL REPORT 2014
33
As at December 31, 2014, Toromont
employed over 3,350 people in more than
100 locations across Canada and the United
States. Toromont is listed on the Toronto
Stock Exchange under the symbol TIH.
Toromont has two reportable operating
segments: the Equipment Group and CIMCO.
The Equipment Group is comprised of
Toromont CAT, one of the world’s larger
Caterpillar dealerships, Battlefield – The
CAT Rental Store, an industry-leading rental
operation, and Ag West, an agricultural
equipment and solutions dealer represent-
ing AGCO, CLAAS and other manufacturers’
products. Performance in the Equipment
Group is driven by activity in several
During the year, the Company completed
two acquisitions of agricultural equipment
dealers. In September 2014, Ag West Equipment Ltd. was acquired for $6.7 million,
including assumed debt. In December 2014,
substantially all of the assets of Canpro
Gator Centre were acquired for $6.4 million.
Both based in Manitoba, these companies
industries: road building and other
infrastructure-related activities; mining;
residential and commercial construction;
power generation; aggregates; waste
management; steel; forestry; and agricul-
ture. Significant activities include
the sale, rental and service of mobile
equipment for Caterpillar and other
manufacturers; sale, rental and service of
engines used in a variety of applications
including industrial, commercial, marine,
on-highway trucks and power generation;
and sale of complementary and related
products, parts and service. Territories
include Ontario, Manitoba, Newfoundland
and most of Labrador and Nunavut.
specialize in the sale and service of
agricultural equipment as authorized
dealers of AGCO and other products.
These acquisitions provide broader market
coverage, an expanded product portfolio
and services, as well as additional
cross-selling opportunities. Together
with our existing agricultural equipment
CIMCO is a market leader in the design,
engineering, fabrication, installation and
after-sale support of refrigeration systems
in industrial and recreational markets.
Results of CIMCO are influenced by
conditions in the primary market segments
served: beverage and food processing; cold
storage; food distribution; mining; and
recreational ice surfaces. CIMCO offers
systems designed to optimize energy usage
through proprietary products such as ECO
CHILL®. CIMCO has manufacturing facilities
in Canada and the United States and sells
its solutions globally.
business in Manitoba, the combined
company will continue as Ag West
Equipment Ltd., headquartered in Elie,
Manitoba, with four store locations.
For further information on the account-
ing for the acquisition, refer to note 25 of
the notes to the consolidated financial
statements.
Corporate Profile and Business Segmentation
Corporate Developments
TOROMONT
34
The primary objective of the Company is to
build shareholder value through sustainable
and profitable growth, supported by a
strong financial foundation. To guide its
activities in pursuit of this objective,
Toromont works toward specific, long-term
financial goals (see section heading “Key
Performance Measures” in this MD&A) and
each of its operating groups consistently
employs the following broad strategies:
Expand Markets Toromont serves diverse markets that offer
significant long-term potential for profitable
expansion. Each operating group strives to
achieve or maintain leading positions in
markets served. Incremental revenues are
derived from improved coverage, market
share gains and geographic expansion.
Expansion of the installed base of equip-
ment provides the foundation for product
support growth and leverages the fixed
costs associated with the Company’s
infrastructure.
Strengthen Product Support Toromont’s parts and service business is a
significant contributor to overall profitability
and serves to stabilize results through
economic downturns. Product support
activities also represent opportunities to
develop closer relationships with customers
and differentiate the Company’s product and
service offering. The ability to consistently
meet or exceed customers’ expectations for
service efficiency and quality is critical, as
after-market support is an integral part of
the customer’s decision-making process
when purchasing equipment.
Broaden Product Offerings Toromont delivers specialized capital
equipment to a diverse range of customers
and industries. Collectively, hundreds of
thousands of different parts are offered
through the Company’s distribution
channels. The Company expands its
customer base through selectively extend-
ing product lines and capabilities.
In support of this strategy, Toromont
represents product lines that are consid-
ered leading and generally best-in-class
from suppliers and business partners
who continually expand and develop their
offerings. Strong relationships with
suppliers and business partners are
critical in achieving growth objectives.
Invest in Resources The combined knowledge and experience
of Toromont’s people is a key competitive
advantage. Growth is dependent on
attracting, retaining and developing
employees with values that are consistent
with Toromont’s. A highly principled
culture, share ownership and profitability-
based incentive programs result in a close
alignment of employee and shareholder
interests. By investing in employee training
and development, the capabilities and
productivity of employees continually
improve to better serve shareholders,
customers and business partners.
Toromont’s information technology
represents another competitive differentiator
in the marketplace. The Company’s selective
investments in technology, inclusive of
e-commerce initiatives, strengthen customer
service capabilities, generate new opportuni-
ties for growth, drive efficiency and increase
returns to shareholders.
Maintain a Strong Financial Position A strong, well-capitalized balance sheet
creates stability and financial flexibility,
and has contributed to the Company’s
long-term track record of profitable growth.
It is also fundamental to the Company’s
future success.
Primary Objective and Major Strategies
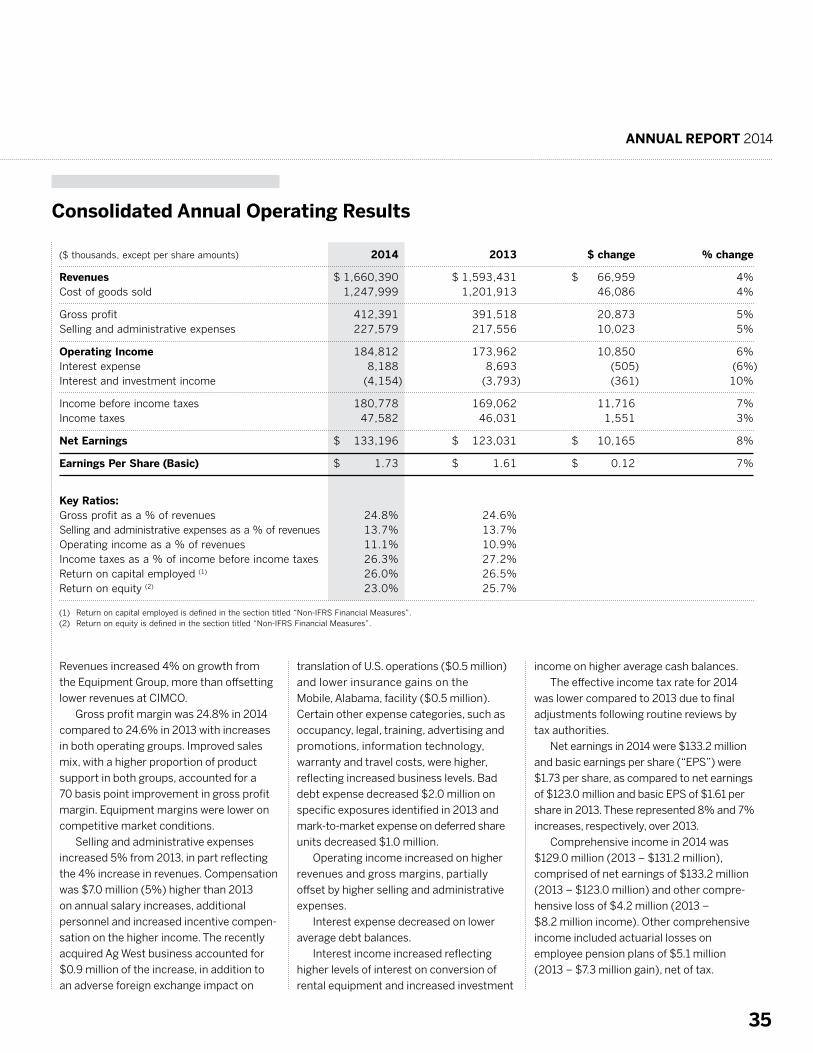
ANNUAL REPORT 2014
35
Revenues increased 4% on growth from
the Equipment Group, more than offsetting
lower revenues at CIMCO.
Gross profit margin was 24.8% in 2014
compared to 24.6% in 2013 with increases
in both operating groups. Improved sales
mix, with a higher proportion of product
support in both groups, accounted for a
70 basis point improvement in gross profit
margin. Equipment margins were lower on
competitive market conditions.
Selling and administrative expenses
increased 5% from 2013, in part reflecting
the 4% increase in revenues. Compensation
was $7.0 million (5%) higher than 2013
on annual salary increases, additional
personnel and increased incentive compen-
sation on the higher income. The recently
acquired Ag West business accounted for
$0.9 million of the increase, in addition to
an adverse foreign exchange impact on
translation of U.S. operations ($0.5 million)
and lower insurance gains on the
Mobile, Alabama, facility ($0.5 million).
Certain other expense categories, such as
occupancy, legal, training, advertising and
promotions, information technology,
warranty and travel costs, were higher,
reflecting increased business levels. Bad
debt expense decreased $2.0 million on
specific exposures identified in 2013 and
mark-to-market expense on deferred share
units decreased $1.0 million.
Operating income increased on higher
revenues and gross margins, partially
offset by higher selling and administrative
expenses.
Interest expense decreased on lower
average debt balances.
Interest income increased reflecting
higher levels of interest on conversion of
rental equipment and increased investment
income on higher average cash balances.
The effective income tax rate for 2014
was lower compared to 2013 due to final
adjustments following routine reviews by
tax authorities.
Net earnings in 2014 were $133.2 million
and basic earnings per share (“EPS”) were
$1.73 per share, as compared to net earnings
of $123.0 million and basic EPS of $1.61 per
share in 2013. These represented 8% and 7%
increases, respectively, over 2013.
Comprehensive income in 2014 was
$129.0 million (2013 – $131.2 million),
comprised of net earnings of $133.2 million
(2013 – $123.0 million) and other compre-
hensive loss of $4.2 million (2013 –
$8.2 million income). Other comprehensive
income included actuarial losses on
employee pension plans of $5.1 million
(2013 – $7.3 million gain), net of tax.
($ thousands, except per share amounts) 2014 2013 $ change % change
Revenues $ 1,660,390 $ 1,593,431 $ 66,959 4% Cost of goods sold 1,247,999 1,201,913 46,086 4%
Gross profit 412,391 391,518 20,873 5% Selling and administrative expenses 227,579 217,556 10,023 5%
Operating Income 184,812 173,962 10,850 6% Interest expense 8,188 8,693 (505) (6%) Interest and investment income (4,154) (3,793) (361) 10%
Income before income taxes 180,778 169,062 11,716 7% Income taxes 47,582 46,031 1,551 3%
Net Earnings $ 133,196 $ 123,031 $ 10,165 8%
Earnings Per Share (Basic) $ 1.73 $ 1.61 $ 0.12 7%
Key Ratios: Gross profit as a % of revenues 24.8% 24.6% Selling and administrative expenses as a % of revenues 13.7% 13.7% Operating income as a % of revenues 11.1% 10.9% Income taxes as a % of income before income taxes 26.3% 27.2% Return on capital employed (1) 26.0% 26.5% Return on equity (2) 23.0% 25.7%
(1) Return on capital employed is defined in the section titled “Non-IFRS Financial Measures”.(2) Return on equity is defined in the section titled “Non-IFRS Financial Measures”.
Consolidated Annual Operating Results
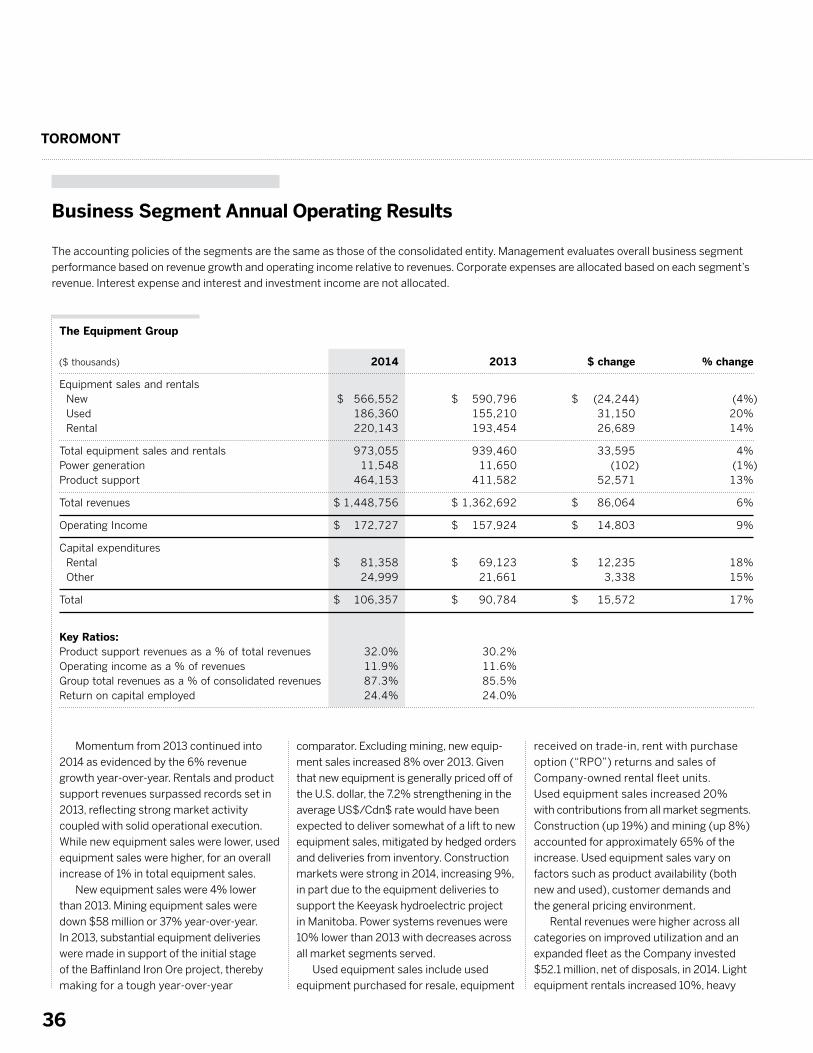
TOROMONT
36
The Equipment Group
($ thousands) 2014 2013 $ change % change
Equipment sales and rentals New $ 566,552 $ 590,796 $ (24,244) (4%) Used 186,360 155,210 31,150 20% Rental 220,143 193,454 26,689 14%
Total equipment sales and rentals 973,055 939,460 33,595 4% Power generation 11,548 11,650 (102) (1%) Product support 464,153 411,582 52,571 13%
Total revenues $ 1,448,756 $ 1,362,692 $ 86,064 6%
Operating Income $ 172,727 $ 157,924 $ 14,803 9%
Capital expenditures Rental $ 81,358 $ 69,123 $ 12,235 18% Other 24,999 21,661 3,338 15%
Total $ 106,357 $ 90,784 $ 15,572 17%
Key Ratios: Product support revenues as a % of total revenues 32.0% 30.2% Operating income as a % of revenues 11.9% 11.6% Group total revenues as a % of consolidated revenues 87.3% 85.5% Return on capital employed 24.4% 24.0%
Business Segment Annual Operating Results
The accounting policies of the segments are the same as those of the consolidated entity. Management evaluates overall business segment
performance based on revenue growth and operating income relative to revenues. Corporate expenses are allocated based on each segment’s
revenue. Interest expense and interest and investment income are not allocated.
Momentum from 2013 continued into
2014 as evidenced by the 6% revenue
growth year-over-year. Rentals and product
support revenues surpassed records set in
2013, reflecting strong market activity
coupled with solid operational execution.
While new equipment sales were lower, used
equipment sales were higher, for an overall
increase of 1% in total equipment sales.
New equipment sales were 4% lower
than 2013. Mining equipment sales were
down $58 million or 37% year-over-year.
In 2013, substantial equipment deliveries
were made in support of the initial stage
of the Baffinland Iron Ore project, thereby
making for a tough year-over-year
comparator. Excluding mining, new equip-
ment sales increased 8% over 2013. Given
that new equipment is generally priced off of
the U.S. dollar, the 7.2% strengthening in the
average US$/Cdn$ rate would have been
expected to deliver somewhat of a lift to new equipment sales, mitigated by hedged orders
and deliveries from inventory. Construction
markets were strong in 2014, increasing 9%,
in part due to the equipment deliveries to
support the Keeyask hydroelectric project
in Manitoba. Power systems revenues were
10% lower than 2013 with decreases across
all market segments served.
Used equipment sales include used
equipment purchased for resale, equipment
received on trade-in, rent with purchase
option (“RPO”) returns and sales of
Company-owned rental fleet units.
Used equipment sales increased 20%
with contributions from all market segments.
Construction (up 19%) and mining (up 8%)
accounted for approximately 65% of the
increase. Used equipment sales vary on
factors such as product availability (both
new and used), customer demands and
the general pricing environment.
Rental revenues were higher across all
categories on improved utilization and an
expanded fleet as the Company invested $52.1 million, net of disposals, in 2014. Light
equipment rentals increased 10%, heavy
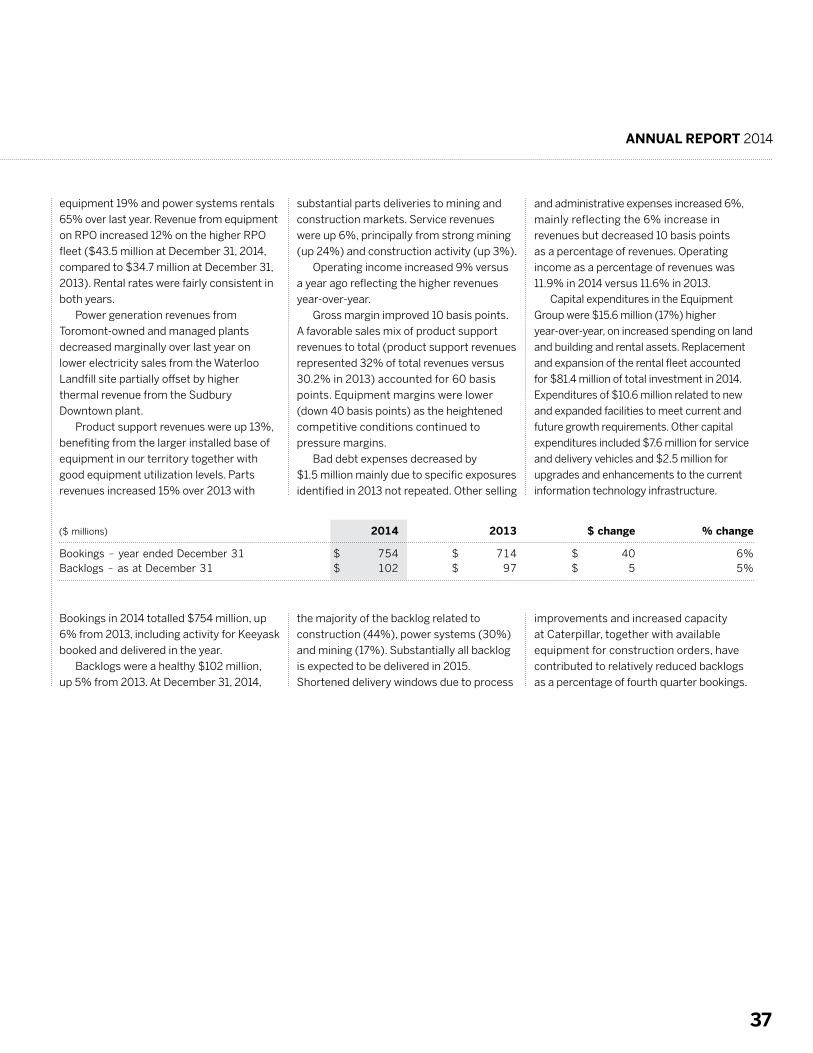
ANNUAL REPORT 2014
37
equipment 19% and power systems rentals
65% over last year. Revenue from equipment
on RPO increased 12% on the higher RPO
fleet ($43.5 million at December 31, 2014,
compared to $34.7 million at December 31,
2013). Rental rates were fairly consistent in
both years.
Power generation revenues from
Toromont-owned and managed plants
decreased marginally over last year on
lower electricity sales from the Waterloo
Landfill site partially offset by higher
thermal revenue from the Sudbury
Downtown plant.
Product support revenues were up 13%,
benefiting from the larger installed base of
equipment in our territory together with
good equipment utilization levels. Parts
revenues increased 15% over 2013 with
substantial parts deliveries to mining and
construction markets. Service revenues
were up 6%, principally from strong mining
(up 24%) and construction activity (up 3%).
Operating income increased 9% versus
a year ago reflecting the higher revenues
year-over-year.
Gross margin improved 10 basis points.
A favorable sales mix of product support
revenues to total (product support revenues
represented 32% of total revenues versus
30.2% in 2013) accounted for 60 basis
points. Equipment margins were lower
(down 40 basis points) as the heightened
competitive conditions continued to
pressure margins.
Bad debt expenses decreased by
$1.5 million mainly due to specific exposures
identified in 2013 not repeated. Other selling
and administrative expenses increased 6%,
mainly reflecting the 6% increase in
revenues but decreased 10 basis points
as a percentage of revenues. Operating
income as a percentage of revenues was
11.9% in 2014 versus 11.6% in 2013.Capital expenditures in the Equipment
Group were $15.6 million (17%) higher
year-over-year, on increased spending on land
and building and rental assets. Replacement
and expansion of the rental fleet accounted
for $81.4 million of total investment in 2014.
Expenditures of $10.6 million related to new
and expanded facilities to meet current and
future growth requirements. Other capital
expenditures included $7.6 million for service
and delivery vehicles and $2.5 million for
upgrades and enhancements to the current
information technology infrastructure.
Bookings in 2014 totalled $754 million, up
6% from 2013, including activity for Keeyask
booked and delivered in the year.
Backlogs were a healthy $102 million,
up 5% from 2013. At December 31, 2014,
the majority of the backlog related to
construction (44%), power systems (30%)
and mining (17%). Substantially all backlog
is expected to be delivered in 2015.
Shortened delivery windows due to process
improvements and increased capacity
at Caterpillar, together with available
equipment for construction orders, have
contributed to relatively reduced backlogs
as a percentage of fourth quarter bookings.
($ millions) 2014 2013 $ change % change
Bookings – year ended December 31 $ 754 $ 714 $ 40 6% Backlogs – as at December 31 $ 102 $ 97 $ 5 5%
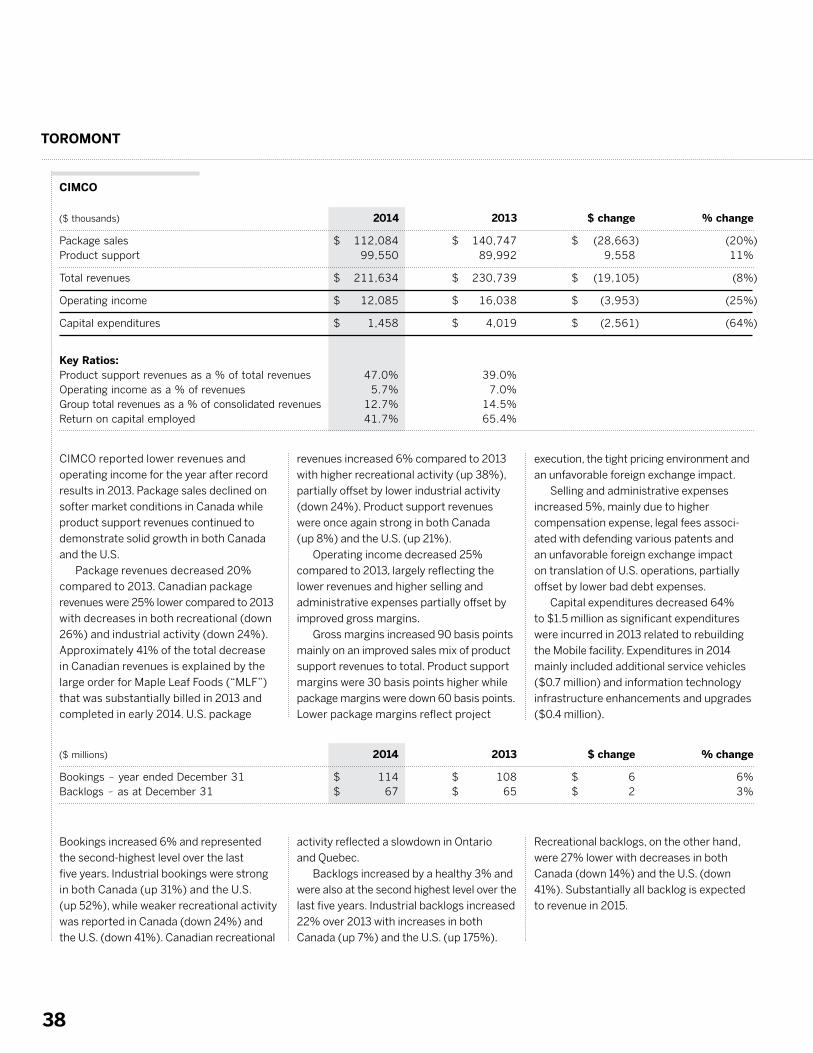
TOROMONT
38
Bookings increased 6% and represented
the second-highest level over the last
five years. Industrial bookings were strong
in both Canada (up 31%) and the U.S.
(up 52%), while weaker recreational activity
was reported in Canada (down 24%) and
the U.S. (down 41%). Canadian recreational
activity reflected a slowdown in Ontario
and Quebec.
Backlogs increased by a healthy 3% and
were also at the second highest level over the
last five years. Industrial backlogs increased
22% over 2013 with increases in both
Canada (up 7%) and the U.S. (up 175%).
Recreational backlogs, on the other hand,
were 27% lower with decreases in both
Canada (down 14%) and the U.S. (down
41%). Substantially all backlog is expected
to revenue in 2015.
($ millions) 2014 2013 $ change % change
Bookings – year ended December 31 $ 114 $ 108 $ 6 6% Backlogs – as at December 31 $ 67 $ 65 $ 2 3%
CIMCO reported lower revenues and
operating income for the year after record
results in 2013. Package sales declined on
softer market conditions in Canada while
product support revenues continued to
demonstrate solid growth in both Canada
and the U.S.
Package revenues decreased 20%
compared to 2013. Canadian package
revenues were 25% lower compared to 2013
with decreases in both recreational (down
26%) and industrial activity (down 24%).
Approximately 41% of the total decrease
in Canadian revenues is explained by the
large order for Maple Leaf Foods (“MLF”)
that was substantially billed in 2013 and
completed in early 2014. U.S. package
revenues increased 6% compared to 2013
with higher recreational activity (up 38%),
partially offset by lower industrial activity
(down 24%). Product support revenues
were once again strong in both Canada
(up 8%) and the U.S. (up 21%).
Operating income decreased 25%
compared to 2013, largely reflecting the
lower revenues and higher selling and
administrative expenses partially offset by
improved gross margins.
Gross margins increased 90 basis points
mainly on an improved sales mix of product
support revenues to total. Product support
margins were 30 basis points higher while
package margins were down 60 basis points.
Lower package margins reflect project
execution, the tight pricing environment and
an unfavorable foreign exchange impact.
Selling and administrative expenses
increased 5%, mainly due to higher
compensation expense, legal fees associ-
ated with defending various patents and
an unfavorable foreign exchange impact
on translation of U.S. operations, partially
offset by lower bad debt expenses.
Capital expenditures decreased 64%
to $1.5 million as significant expenditures
were incurred in 2013 related to rebuilding
the Mobile facility. Expenditures in 2014
mainly included additional service vehicles
($0.7 million) and information technology
infrastructure enhancements and upgrades
($0.4 million).
CIMCO
($ thousands) 2014 2013 $ change % change
Package sales $ 112,084 $ 140,747 $ (28,663) (20%) Product support 99,550 89,992 9,558 11%
Total revenues $ 211,634 $ 230,739 $ (19,105) (8%)
Operating income $ 12,085 $ 16,038 $ (3,953) (25%)
Capital expenditures $ 1,458 $ 4,019 $ (2,561) (64%)
Key Ratios: Product support revenues as a % of total revenues 47.0% 39.0% Operating income as a % of revenues 5.7% 7.0% Group total revenues as a % of consolidated revenues 12.7% 14.5% Return on capital employed 41.7% 65.4%
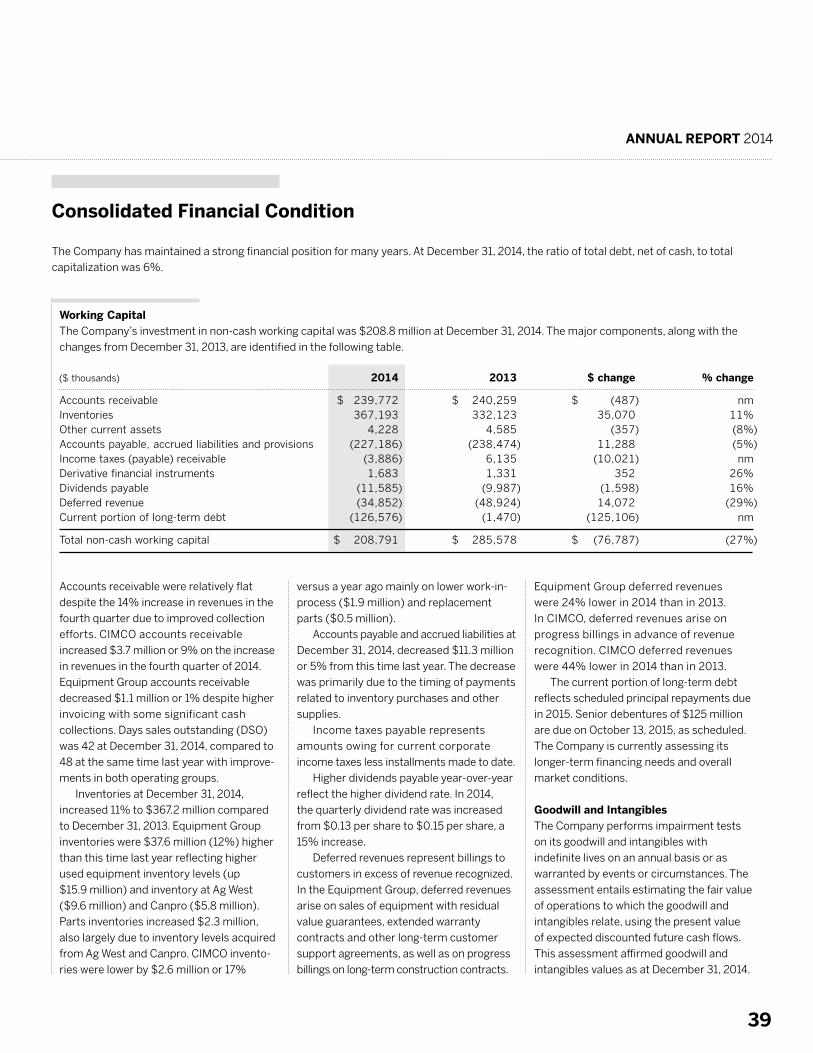
ANNUAL REPORT 2014
39
Accounts receivable were relatively flat
despite the 14% increase in revenues in the
fourth quarter due to improved collection
efforts. CIMCO accounts receivable
increased $3.7 million or 9% on the increase
in revenues in the fourth quarter of 2014.
Equipment Group accounts receivable
decreased $1.1 million or 1% despite higher
invoicing with some significant cash
collections. Days sales outstanding (DSO)
was 42 at December 31, 2014, compared to
48 at the same time last year with improve-
ments in both operating groups.
Inventories at December 31, 2014,
increased 11% to $367.2 million compared
to December 31, 2013. Equipment Group
inventories were $37.6 million (12%) higher
than this time last year reflecting higher
used equipment inventory levels (up
$15.9 million) and inventory at Ag West
($9.6 million) and Canpro ($5.8 million).
Parts inventories increased $2.3 million,
also largely due to inventory levels acquired
from Ag West and Canpro. CIMCO invento-
ries were lower by $2.6 million or 17%
versus a year ago mainly on lower work-in-
process ($1.9 million) and replacement
parts ($0.5 million). Accounts payable and accrued liabilities at
December 31, 2014, decreased $11.3 million
or 5% from this time last year. The decrease
was primarily due to the timing of payments
related to inventory purchases and other
supplies.
Income taxes payable represents
amounts owing for current corporate
income taxes less installments made to date.
Higher dividends payable year-over-year
reflect the higher dividend rate. In 2014,
the quarterly dividend rate was increased
from $0.13 per share to $0.15 per share, a
15% increase.
Deferred revenues represent billings to
customers in excess of revenue recognized.
In the Equipment Group, deferred revenues
arise on sales of equipment with residual
value guarantees, extended warranty
contracts and other long-term customer
support agreements, as well as on progress
billings on long-term construction contracts.
Equipment Group deferred revenues
were 24% lower in 2014 than in 2013.
In CIMCO, deferred revenues arise on
progress billings in advance of revenue
recognition. CIMCO deferred revenues
were 44% lower in 2014 than in 2013.
The current portion of long-term debt reflects scheduled principal repayments due
in 2015. Senior debentures of $125 million
are due on October 13, 2015, as scheduled.
The Company is currently assessing its
longer-term financing needs and overall
market conditions.
Goodwill and IntangiblesThe Company performs impairment tests
on its goodwill and intangibles with
indefinite lives on an annual basis or as
warranted by events or circumstances. The
assessment entails estimating the fair value
of operations to which the goodwill and
intangibles relate, using the present value
of expected discounted future cash flows.
This assessment affirmed goodwill and
intangibles values as at December 31, 2014.
The Company has maintained a strong financial position for many years. At December 31, 2014, the ratio of total debt, net of cash, to total
capitalization was 6%.
Working CapitalThe Company’s investment in non-cash working capital was $208.8 million at December 31, 2014. The major components, along with the
changes from December 31, 2013, are identified in the following table.
($ thousands) 2014 2013 $ change % change
Accounts receivable $ 239,772 $ 240,259 $ (487) nm Inventories 367,193 332,123 35,070 11% Other current assets 4,228 4,585 (357) (8%) Accounts payable, accrued liabilities and provisions (227,186) (238,474) 11,288 (5%) Income taxes (payable) receivable (3,886) 6,135 (10,021) nm Derivative financial instruments 1,683 1,331 352 26% Dividends payable (11,585) (9,987) (1,598) 16% Deferred revenue (34,852) (48,924) 14,072 (29%) Current portion of long-term debt (126,576) (1,470) (125,106) nm
Total non-cash working capital $ 208,791 $ 285,578 $ (76,787) (27%)
Consolidated Financial Condition
TOROMONT
40
Employee Share Ownership The Company employs a variety of stock-
based compensation plans to align
employees’ interests with corporate
objectives.
The Company maintains an Executive
Stock Option Plan for its senior employees.
Effective 2013, non-employee directors no
longer receive grants under this plan.
Stock options vest 20% per year on each
anniversary date of the grant and are
exercisable at the designated common
share price, which is fixed at prevailing
market prices of the common shares at the
date the option is granted. Effective 2013,
stock options granted have a ten-year term,
while those granted prior to 2013 have a
seven-year term. At December 31, 2014,
2.7 million options to purchase common
shares were outstanding, of which 1.1 million
were exercisable.
The Company offers an Employee Share
Ownership Plan whereby employees can
purchase shares by way of payroll deduc-
tions. Under the terms of this plan, eligible
employees may purchase common shares
of the Company in the open market at the
then-current market price. The Company
pays a portion of the purchase price,
matching contributions at a rate of $1 for
every $3 dollars contributed, to a maximum
of $1,000 per annum per employee.
Company contributions vest to the
employee immediately. Company contribu-
tions amounting to $1.0 million in 2014
(2013 – $0.9 million) were charged to
selling and administrative expense when
paid. Approximately 50% (2013 – 48%)
of employees participate in this plan.
The Company also offers a deferred
share unit (DSU) plan for certain executives
and non-employee directors, whereby they
may elect, on an annual basis, to receive all
or a portion of their performance incentive
bonus or fees, respectively, in DSUs.
Non-employee directors also receive DSUs
as part of their compensation, aligning
at-risk and cash compensation compo-
nents. A DSU is a notional unit that reflects
the market value of a single Toromont
common share and generally vests
immediately. DSUs will be redeemed on
cessation of employment or directorship.
DSUs have dividend equivalent rights,
which are expensed as earned. The Company
records the cost of the DSU Plan as
compensation expense in selling and
administrative expenses. As at December 31, 2014, 334,709 DSUs
were outstanding with a total value of
$9.5 million (2013 – 288,920 units at a value
of $7.7 million). The liability for DSUs is
included in accounts payable, accrued
liabilities and provisions on the consolidated
statement of financial position.
Employee Future Benefits Defined Contribution Plans
The Company sponsors pension arrange-
ments for substantially all of its employees,
primarily through defined contribution
plans in Canada and a 401(k) matched
savings plan in the United States. Certain
unionized employees do not participate in
Company-sponsored plans, and contribu-
tions are made to these retirement
programs in accordance with the respective
collective bargaining agreements. In the
case of defined contribution plans, regular
contributions are made to the individual
employee accounts, which are administered
by a plan trustee in accordance with the
plan documents.
Defined Benefit Plans
The Company sponsors three defined
benefit plans (Powell Plan, Executive Plan
and Toromont Plan) for approximately
109 qualifying employees. These defined
benefit plans are administered by a
separate Fund that is legally separated
from the Company and are described
fully in note 19 to the consolidated
financial statements.
The funded status of these plans
changed by $7.7 million (an increase in the
accrued pension liability) as at December
31, 2014. The change largely reflects a net
actuarial loss of $9.6 million (2013 – net
actuarial gain of $3.5 million), on the change
in the discount rate (3.8% in 2014 vs. 4.6%
in 2013).
The Executive Plan is a supplemental
plan, whose members are largely retirees
with only one active member remaining, and
is solely the obligation of the Company. The
Company is not obligated to fund the plan
but is obligated to pay benefits under the
terms of the plan as they come due. The
Company has posted letters of credit to
secure the obligations under this plan,
which were $18.3 million as at December 31,
2014. As there are only nominal plan assets,
the impact of volatility in financial markets
on pension expense and contributions for
this plan are insignificant.
The Company expects pension expense
and cash pension contributions for 2015 to
be similar to 2014 levels.
A key assumption in pension accounting
is the discount rate. This rate is set with
regard to the yield on high-quality corporate
bonds of similar average duration to the
cash flow liabilities of the Plans. Yields are
volatile and can deviate significantly from
period to period.
Off-Balance Sheet Arrangements The Company does not have any off-bal-
ance sheet arrangements that have, or are
reasonably likely to have, a current or future
effect on its results of operations or
financial condition.
Legal and Other Contingencies Due to the size, complexity and nature of
the Company’s operations, various legal
matters are pending. Exposure to these
claims is mitigated through levels of
insurance coverage considered appropriate
by management and by active management
of these matters. In the opinion of manage-
ment, none of these matters will have a
material effect on the Company’s consoli-
dated financial position or results of
operations.
Normal Course Issuer Bid Toromont believes that, from time to time,
the purchase of its common shares at
prevailing market prices may be a worth-
while investment and in the best interests
of both Toromont and its shareholders.
ANNUAL REPORT 2014
41
As such, the normal course issuer bid with
the TSX was renewed in 2014. This issuer
bid allows the Company to purchase up to
approximately 5.7 million of its common
shares, representing 10% of common
shares in the public float, in the year ending
August 30, 2015. The actual number of
shares purchased and the timing of any
such purchases will be determined by
Toromont. All shares purchased under
the bid will be cancelled.
No shares were purchased in the years
ended December 31, 2014 and 2013.
Outstanding Share Data As at the date of this MD&A, the Company
had 77,381,896 common shares and
2,593,375 share options outstanding.
Dividends Toromont pays a quarterly dividend on its
outstanding common shares and has
historically targeted a dividend rate that
approximates 30 – 40% of trailing earnings
from continuing operations.
During 2014, the Company declared
dividends of $0.60 per common share,
$0.15 per quarter (2013 – $0.52 per
common share or $0.13 per quarter).
Considering the Company’s solid
financial position, cash flows and balances,
and positive long-term outlook, the Board
of Directors announced it is increasing
the quarterly dividend to $0.17 per share
effective with the dividend payable on
April 1, 2015. This represents a 13% increase
in Toromont’s regular quarterly cash
dividend. The Company has paid dividends
every year since going public in 1968 and
this represents the 26th consecutive year
of increases.
Sources of Liquidity Toromont’s liquidity requirements can be
met through a variety of sources, including
cash generated from operations, long- and
short-term borrowings and the issuance of
common shares. Borrowings are obtained
through a variety of senior debentures,
notes payable and committed long-term
credit facilities.
The Company maintains a $200 million
committed credit facility. The facility
matures in September 2017. Debt incurred
under the facility is unsecured and ranks on
par with debt outstanding under Toromont’s
existing debentures. Interest is based on a
floating rate, primarily bankers’ acceptances
and prime, plus applicable margins and fees
based on the terms of the credit facility. As at December 31, 2014, no amounts
were drawn on the facility (2013 – $nil).
Letters of credit utilized $22.6 million
(2013 – $26.6 million) of the facility.
Cash at December 31, 2014, was
$86.0 million, compared to $70.8 million
at December 31, 2013.
The Company expects that continued
cash flows from operations in 2015 and
currently available credit facilities will be
more than sufficient to fund requirements
for the senior debenture maturity in 2015
as well as investments in working capital
and capital assets.
Liquidity and Capital Resources
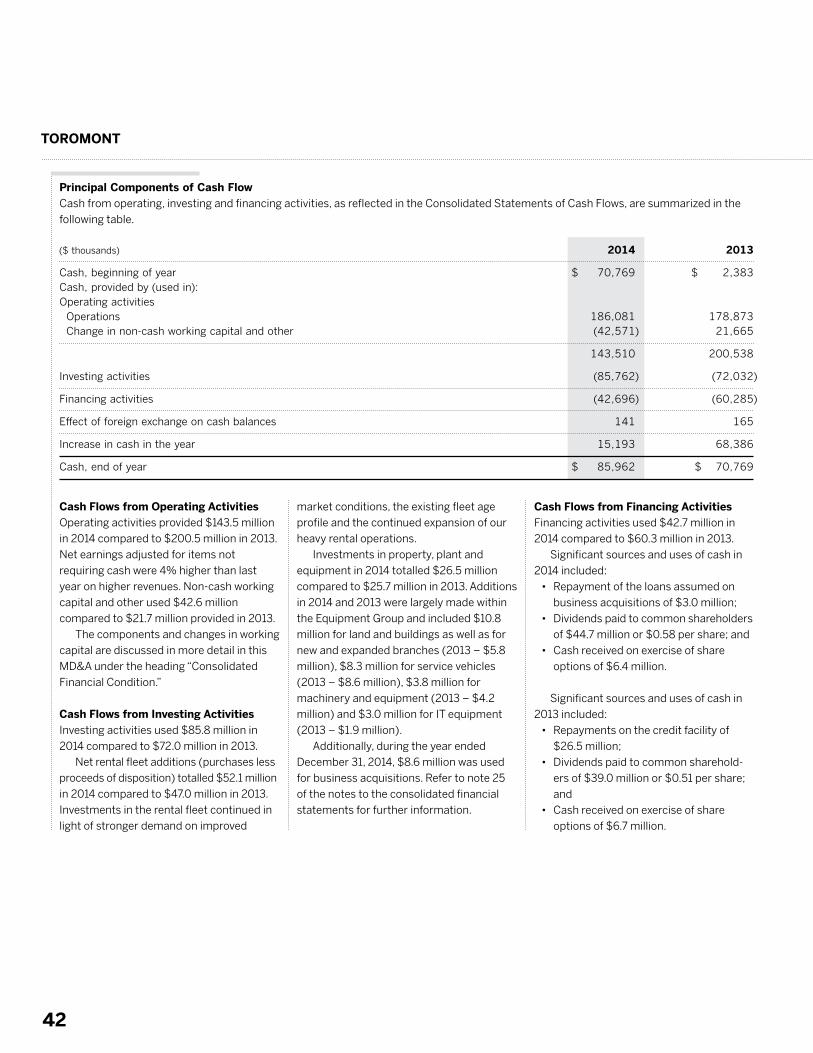
TOROMONT
42
Principal Components of Cash FlowCash from operating, investing and financing activities, as reflected in the Consolidated Statements of Cash Flows, are summarized in the
following table.
($ thousands) 2014 2013
Cash, beginning of year $ 70,769 $ 2,383 Cash, provided by (used in): Operating activities Operations 186,081 178,873 Change in non-cash working capital and other (42,571) 21,665
143,510 200,538
Investing activities (85,762) (72,032)
Financing activities (42,696) (60,285)
Effect of foreign exchange on cash balances 141 165
Increase in cash in the year 15,193 68,386
Cash, end of year $ 85,962 $ 70,769
Cash Flows from Operating Activities
Operating activities provided $143.5 million
in 2014 compared to $200.5 million in 2013.
Net earnings adjusted for items not
requiring cash were 4% higher than last
year on higher revenues. Non-cash working
capital and other used $42.6 million
compared to $21.7 million provided in 2013.
The components and changes in working
capital are discussed in more detail in this
MD&A under the heading “Consolidated
Financial Condition.”
Cash Flows from Investing Activities Investing activities used $85.8 million in
2014 compared to $72.0 million in 2013. Net rental fleet additions (purchases less
proceeds of disposition) totalled $52.1 million
in 2014 compared to $47.0 million in 2013.
Investments in the rental fleet continued in
light of stronger demand on improved
market conditions, the existing fleet age
profile and the continued expansion of our
heavy rental operations.
Investments in property, plant and
equipment in 2014 totalled $26.5 million
compared to $25.7 million in 2013. Additions
in 2014 and 2013 were largely made within
the Equipment Group and included $10.8
million for land and buildings as well as for
new and expanded branches (2013 – $5.8
million), $8.3 million for service vehicles
(2013 – $8.6 million), $3.8 million for
machinery and equipment (2013 – $4.2
million) and $3.0 million for IT equipment
(2013 – $1.9 million).
Additionally, during the year ended
December 31, 2014, $8.6 million was used
for business acquisitions. Refer to note 25
of the notes to the consolidated financial
statements for further information.
Cash Flows from Financing Activities Financing activities used $42.7 million in
2014 compared to $60.3 million in 2013.
Significant sources and uses of cash in
2014 included:
• Repayment of the loans assumed on
business acquisitions of $3.0 million;
• Dividends paid to common shareholders
of $44.7 million or $0.58 per share; and
• Cash received on exercise of share
options of $6.4 million.
Significant sources and uses of cash in
2013 included:
• Repayments on the credit facility of
$26.5 million;
• Dividends paid to common sharehold-
ers of $39.0 million or $0.51 per share;
and
• Cash received on exercise of share
options of $6.7 million.
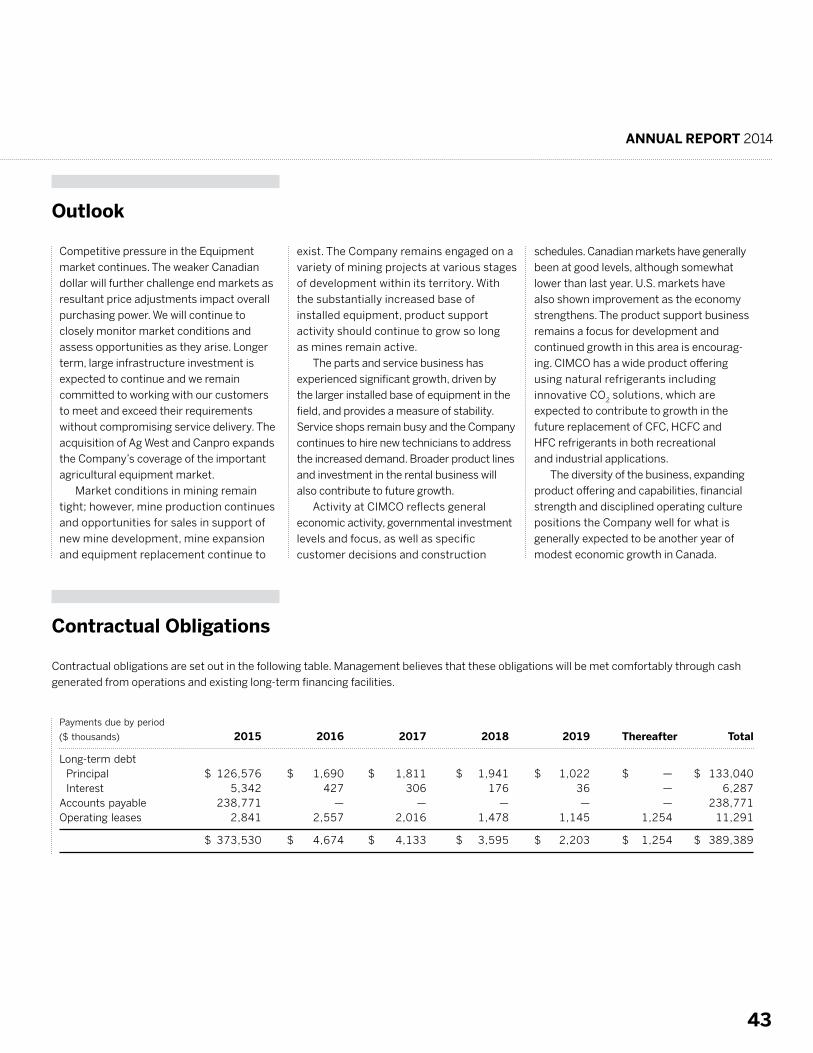
ANNUAL REPORT 2014
43
Competitive pressure in the Equipment
market continues. The weaker Canadian
dollar will further challenge end markets as
resultant price adjustments impact overall
purchasing power. We will continue to
closely monitor market conditions and
assess opportunities as they arise. Longer
term, large infrastructure investment is
expected to continue and we remain
committed to working with our customers
to meet and exceed their requirements
without compromising service delivery. The
acquisition of Ag West and Canpro expands
the Company’s coverage of the important
agricultural equipment market.
Market conditions in mining remain
tight; however, mine production continues
and opportunities for sales in support of
new mine development, mine expansion
and equipment replacement continue to
exist. The Company remains engaged on a
variety of mining projects at various stages
of development within its territory. With
the substantially increased base of
installed equipment, product support
activity should continue to grow so long
as mines remain active.
The parts and service business has
experienced significant growth, driven by
the larger installed base of equipment in the
field, and provides a measure of stability.
Service shops remain busy and the Company
continues to hire new technicians to address
the increased demand. Broader product lines
and investment in the rental business will
also contribute to future growth.
Activity at CIMCO reflects general
economic activity, governmental investment
levels and focus, as well as specific
customer decisions and construction
schedules. Canadian markets have generally
been at good levels, although somewhat
lower than last year. U.S. markets have
also shown improvement as the economy
strengthens. The product support business
remains a focus for development and
continued growth in this area is encourag-
ing. CIMCO has a wide product offering
using natural refrigerants including
innovative CO2 solutions, which are
expected to contribute to growth in the
future replacement of CFC, HCFC and
HFC refrigerants in both recreational
and industrial applications.
The diversity of the business, expanding
product offering and capabilities, financial
strength and disciplined operating culture
positions the Company well for what is
generally expected to be another year of
modest economic growth in Canada.
Outlook
Payments due by period
($ thousands) 2015 2016 2017 2018 2019 Thereafter Total
Long-term debt Principal $ 126,576 $ 1,690 $ 1,811 $ 1,941 $ 1,022 $ — $ 133,040 Interest 5,342 427 306 176 36 — 6,287 Accounts payable 238,771 — — — — — 238,771 Operating leases 2,841 2,557 2,016 1,478 1,145 1,254 11,291
$ 373,530 $ 4,674 $ 4,133 $ 3,595 $ 2,203 $ 1,254 $ 389,389
Contractual obligations are set out in the following table. Management believes that these obligations will be met comfortably through cash
generated from operations and existing long-term financing facilities.
Contractual Obligations
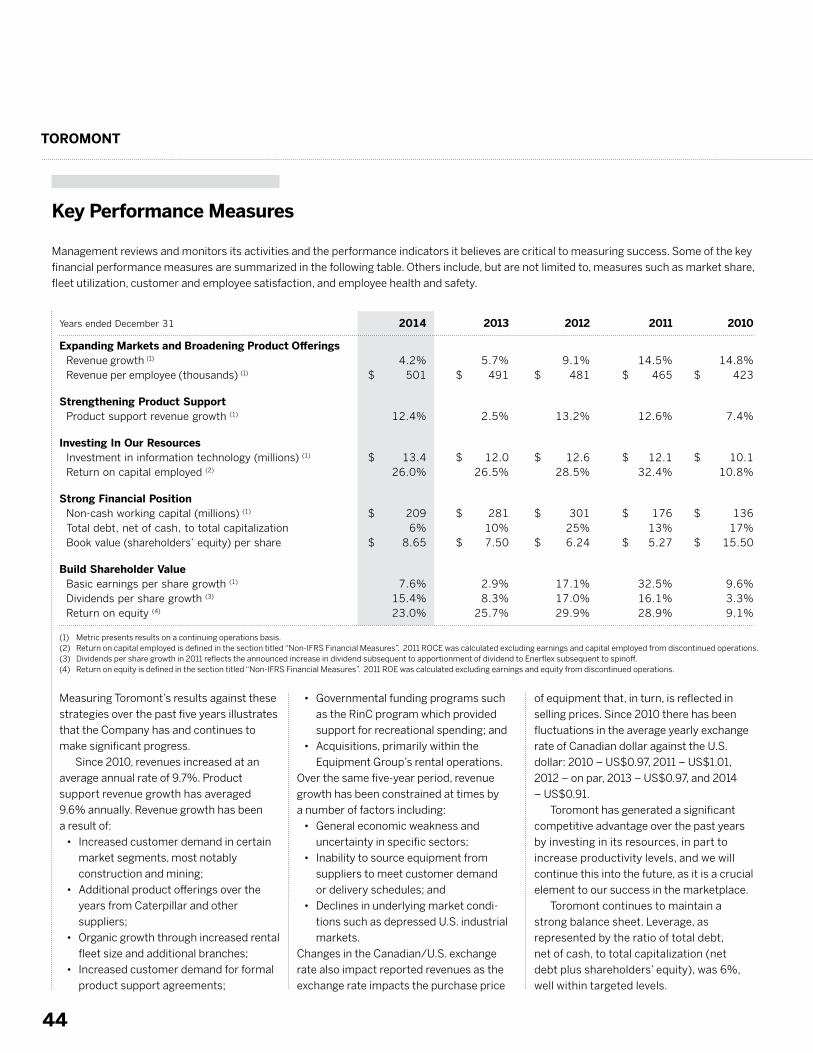
TOROMONT
44
Years ended December 31 2014 2013 2012 2011 2010
Expanding Markets and Broadening Product Offerings Revenue growth (1) 4.2% 5.7% 9.1% 14.5% 14.8% Revenue per employee (thousands) (1) $ 501 $ 491 $ 481 $ 465 $ 423 Strengthening Product Support Product support revenue growth (1) 12.4% 2.5% 13.2% 12.6% 7.4% Investing In Our Resources Investment in information technology (millions) (1) $ 13.4 $ 12.0 $ 12.6 $ 12.1 $ 10.1 Return on capital employed (2) 26.0% 26.5% 28.5% 32.4% 10.8% Strong Financial Position Non-cash working capital (millions) (1) $ 209 $ 281 $ 301 $ 176 $ 136 Total debt, net of cash, to total capitalization 6% 10% 25% 13% 17% Book value (shareholders’ equity) per share $ 8.65 $ 7.50 $ 6.24 $ 5.27 $ 15.50 Build Shareholder Value Basic earnings per share growth (1) 7.6% 2.9% 17.1% 32.5% 9.6% Dividends per share growth (3) 15.4% 8.3% 17.0% 16.1% 3.3% Return on equity (4) 23.0% 25.7% 29.9% 28.9% 9.1%
(1) Metric presents results on a continuing operations basis.(2) Return on capital employed is defined in the section titled “Non-IFRS Financial Measures”. 2011 ROCE was calculated excluding earnings and capital employed from discontinued operations.(3) Dividends per share growth in 2011 reflects the announced increase in dividend subsequent to apportionment of dividend to Enerflex subsequent to spinoff.(4) Return on equity is defined in the section titled “Non-IFRS Financial Measures”. 2011 ROE was calculated excluding earnings and equity from discontinued operations.
Measuring Toromont’s results against these
strategies over the past five years illustrates
that the Company has and continues to
make significant progress.
Since 2010, revenues increased at an
average annual rate of 9.7%. Product
support revenue growth has averaged
9.6% annually. Revenue growth has been
a result of:
• Increased customer demand in certain
market segments, most notably
construction and mining;
• Additional product offerings over the
years from Caterpillar and other
suppliers;
• Organic growth through increased rental
fleet size and additional branches;
• Increased customer demand for formal
product support agreements;
• Governmental funding programs such
as the RinC program which provided
support for recreational spending; and
• Acquisitions, primarily within the
Equipment Group’s rental operations.
Over the same five-year period, revenue
growth has been constrained at times by
a number of factors including:
• General economic weakness and
uncertainty in specific sectors;
• Inability to source equipment from
suppliers to meet customer demand
or delivery schedules; and
• Declines in underlying market condi-
tions such as depressed U.S. industrial
markets.
Changes in the Canadian/U.S. exchange
rate also impact reported revenues as the
exchange rate impacts the purchase price
of equipment that, in turn, is reflected in
selling prices. Since 2010 there has been
fluctuations in the average yearly exchange
rate of Canadian dollar against the U.S.
dollar: 2010 – US$0.97, 2011 – US$1.01,
2012 – on par, 2013 – US$0.97, and 2014
– US$0.91.
Toromont has generated a significant
competitive advantage over the past years
by investing in its resources, in part to
increase productivity levels, and we will
continue this into the future, as it is a crucial
element to our success in the marketplace.
Toromont continues to maintain a
strong balance sheet. Leverage, as
represented by the ratio of total debt,
net of cash, to total capitalization (net
debt plus shareholders’ equity), was 6%,
well within targeted levels.
Key Performance Measures
Management reviews and monitors its activities and the performance indicators it believes are critical to measuring success. Some of the key
financial performance measures are summarized in the following table. Others include, but are not limited to, measures such as market share,
fleet utilization, customer and employee satisfaction, and employee health and safety.
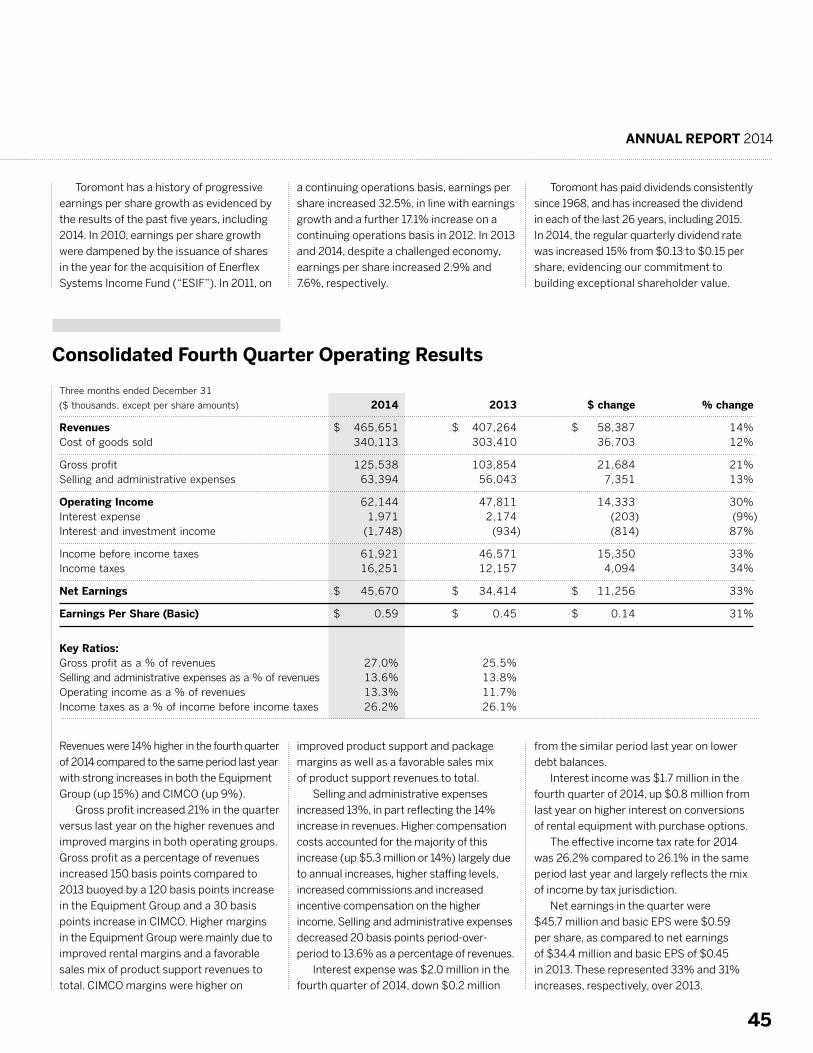
ANNUAL REPORT 2014
45
Toromont has a history of progressive
earnings per share growth as evidenced by
the results of the past five years, including
2014. In 2010, earnings per share growth
were dampened by the issuance of shares
in the year for the acquisition of Enerflex
Systems Income Fund (“ESIF”). In 2011, on
a continuing operations basis, earnings per
share increased 32.5%, in line with earnings
growth and a further 17.1% increase on a
continuing operations basis in 2012. In 2013
and 2014, despite a challenged economy,
earnings per share increased 2.9% and
7.6%, respectively.
Toromont has paid dividends consistently
since 1968, and has increased the dividend
in each of the last 26 years, including 2015.
In 2014, the regular quarterly dividend rate
was increased 15% from $0.13 to $0.15 per
share, evidencing our commitment to
building exceptional shareholder value.
Consolidated Fourth Quarter Operating Results
Three months ended December 31
($ thousands, except per share amounts) 2014 2013 $ change % change
Revenues $ 465,651 $ 407,264 $ 58,387 14% Cost of goods sold 340,113 303,410 36,703 12%
Gross profit 125,538 103,854 21,684 21% Selling and administrative expenses 63,394 56,043 7,351 13%
Operating Income 62,144 47,811 14,333 30% Interest expense 1,971 2,174 (203) (9%) Interest and investment income (1,748) (934) (814) 87%
Income before income taxes 61,921 46,571 15,350 33% Income taxes 16,251 12,157 4,094 34%
Net Earnings $ 45,670 $ 34,414 $ 11,256 33%
Earnings Per Share (Basic) $ 0.59 $ 0.45 $ 0.14 31%
Key Ratios: Gross profit as a % of revenues 27.0% 25.5% Selling and administrative expenses as a % of revenues 13.6% 13.8% Operating income as a % of revenues 13.3% 11.7% Income taxes as a % of income before income taxes 26.2% 26.1%
Revenues were 14% higher in the fourth quarter
of 2014 compared to the same period last year
with strong increases in both the Equipment
Group (up 15%) and CIMCO (up 9%).
Gross profit increased 21% in the quarter
versus last year on the higher revenues and
improved margins in both operating groups.
Gross profit as a percentage of revenues
increased 150 basis points compared to
2013 buoyed by a 120 basis points increase
in the Equipment Group and a 30 basis
points increase in CIMCO. Higher margins
in the Equipment Group were mainly due to
improved rental margins and a favorable
sales mix of product support revenues to
total. CIMCO margins were higher on
improved product support and package
margins as well as a favorable sales mix
of product support revenues to total.
Selling and administrative expenses
increased 13%, in part reflecting the 14%
increase in revenues. Higher compensation
costs accounted for the majority of this
increase (up $5.3 million or 14%) largely due
to annual increases, higher staffing levels,
increased commissions and increased
incentive compensation on the higher
income. Selling and administrative expenses
decreased 20 basis points period-over-
period to 13.6% as a percentage of revenues.
Interest expense was $2.0 million in the
fourth quarter of 2014, down $0.2 million
from the similar period last year on lower
debt balances.
Interest income was $1.7 million in the
fourth quarter of 2014, up $0.8 million from
last year on higher interest on conversions
of rental equipment with purchase options.
The effective income tax rate for 2014
was 26.2% compared to 26.1% in the same
period last year and largely reflects the mix
of income by tax jurisdiction.
Net earnings in the quarter were
$45.7 million and basic EPS were $0.59
per share, as compared to net earnings
of $34.4 million and basic EPS of $0.45
in 2013. These represented 33% and 31%
increases, respectively, over 2013.
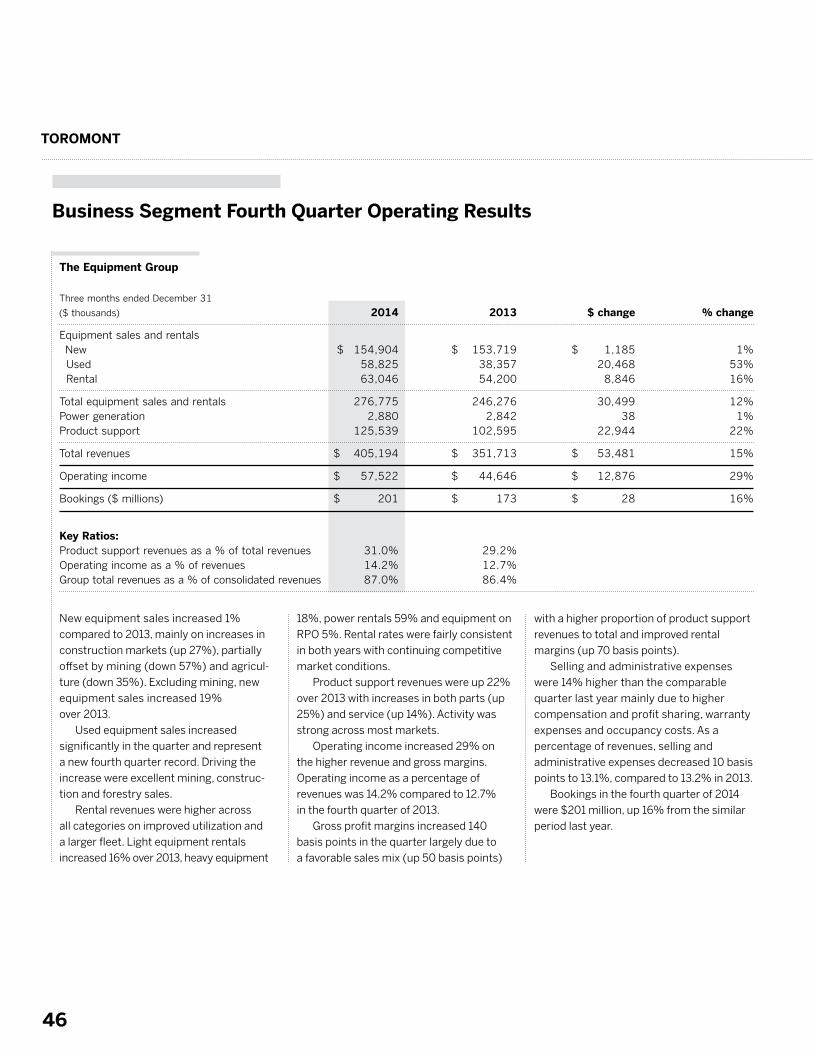
TOROMONT
46
New equipment sales increased 1%
compared to 2013, mainly on increases in
construction markets (up 27%), partially
offset by mining (down 57%) and agricul-
ture (down 35%). Excluding mining, new
equipment sales increased 19%
over 2013.
Used equipment sales increased
significantly in the quarter and represent
a new fourth quarter record. Driving the
increase were excellent mining, construc-
tion and forestry sales.
Rental revenues were higher across
all categories on improved utilization and
a larger fleet. Light equipment rentals
increased 16% over 2013, heavy equipment
18%, power rentals 59% and equipment on
RPO 5%. Rental rates were fairly consistent
in both years with continuing competitive
market conditions.
Product support revenues were up 22%
over 2013 with increases in both parts (up
25%) and service (up 14%). Activity was
strong across most markets.
Operating income increased 29% on
the higher revenue and gross margins.
Operating income as a percentage of
revenues was 14.2% compared to 12.7%
in the fourth quarter of 2013.
Gross profit margins increased 140
basis points in the quarter largely due to
a favorable sales mix (up 50 basis points)
with a higher proportion of product support
revenues to total and improved rental
margins (up 70 basis points).
Selling and administrative expenses
were 14% higher than the comparable
quarter last year mainly due to higher
compensation and profit sharing, warranty
expenses and occupancy costs. As a
percentage of revenues, selling and
administrative expenses decreased 10 basis
points to 13.1%, compared to 13.2% in 2013.
Bookings in the fourth quarter of 2014
were $201 million, up 16% from the similar
period last year.
The Equipment Group
Three months ended December 31
($ thousands) 2014 2013 $ change % change
Equipment sales and rentals New $ 154,904 $ 153,719 $ 1,185 1% Used 58,825 38,357 20,468 53% Rental 63,046 54,200 8,846 16%
Total equipment sales and rentals 276,775 246,276 30,499 12% Power generation 2,880 2,842 38 1% Product support 125,539 102,595 22,944 22%
Total revenues $ 405,194 $ 351,713 $ 53,481 15%
Operating income $ 57,522 $ 44,646 $ 12,876 29%
Bookings ($ millions) $ 201 $ 173 $ 28 16%
Key Ratios: Product support revenues as a % of total revenues 31.0% 29.2% Operating income as a % of revenues 14.2% 12.7% Group total revenues as a % of consolidated revenues 87.0% 86.4%
Business Segment Fourth Quarter Operating Results
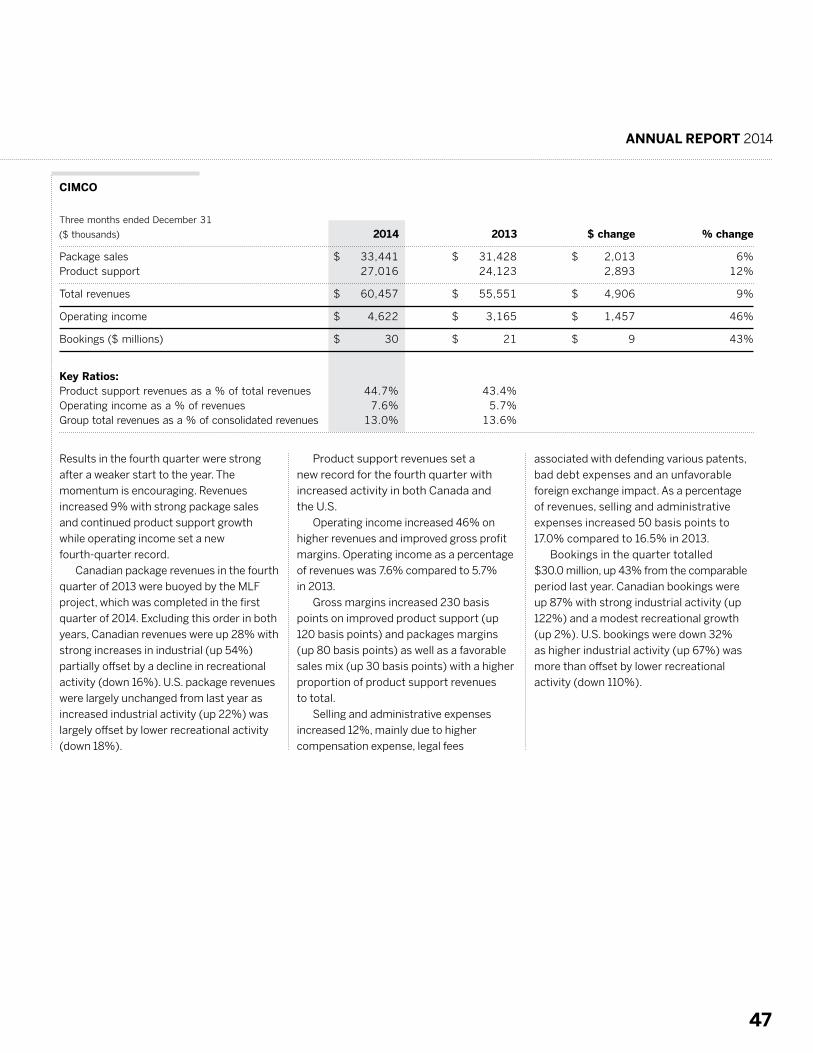
ANNUAL REPORT 2014
47
Results in the fourth quarter were strong
after a weaker start to the year. The
momentum is encouraging. Revenues
increased 9% with strong package sales
and continued product support growth
while operating income set a new
fourth-quarter record.
Canadian package revenues in the fourth
quarter of 2013 were buoyed by the MLF
project, which was completed in the first
quarter of 2014. Excluding this order in both
years, Canadian revenues were up 28% with
strong increases in industrial (up 54%)
partially offset by a decline in recreational
activity (down 16%). U.S. package revenues
were largely unchanged from last year as
increased industrial activity (up 22%) was
largely offset by lower recreational activity
(down 18%).
Product support revenues set a
new record for the fourth quarter with
increased activity in both Canada and
the U.S.
Operating income increased 46% on
higher revenues and improved gross profit
margins. Operating income as a percentage
of revenues was 7.6% compared to 5.7%
in 2013.
Gross margins increased 230 basis
points on improved product support (up
120 basis points) and packages margins
(up 80 basis points) as well as a favorable
sales mix (up 30 basis points) with a higher
proportion of product support revenues
to total.
Selling and administrative expenses
increased 12%, mainly due to higher
compensation expense, legal fees
associated with defending various patents,
bad debt expenses and an unfavorable
foreign exchange impact. As a percentage
of revenues, selling and administrative
expenses increased 50 basis points to
17.0% compared to 16.5% in 2013.
Bookings in the quarter totalled
$30.0 million, up 43% from the comparable
period last year. Canadian bookings were
up 87% with strong industrial activity (up
122%) and a modest recreational growth
(up 2%). U.S. bookings were down 32%
as higher industrial activity (up 67%) was
more than offset by lower recreational
activity (down 110%).
CIMCO
Three months ended December 31
($ thousands) 2014 2013 $ change % change
Package sales $ 33,441 $ 31,428 $ 2,013 6% Product support 27,016 24,123 2,893 12%
Total revenues $ 60,457 $ 55,551 $ 4,906 9%
Operating income $ 4,622 $ 3,165 $ 1,457 46%
Bookings ($ millions) $ 30 $ 21 $ 9 43%
Key Ratios: Product support revenues as a % of total revenues 44.7% 43.4% Operating income as a % of revenues 7.6% 5.7% Group total revenues as a % of consolidated revenues 13.0% 13.6%
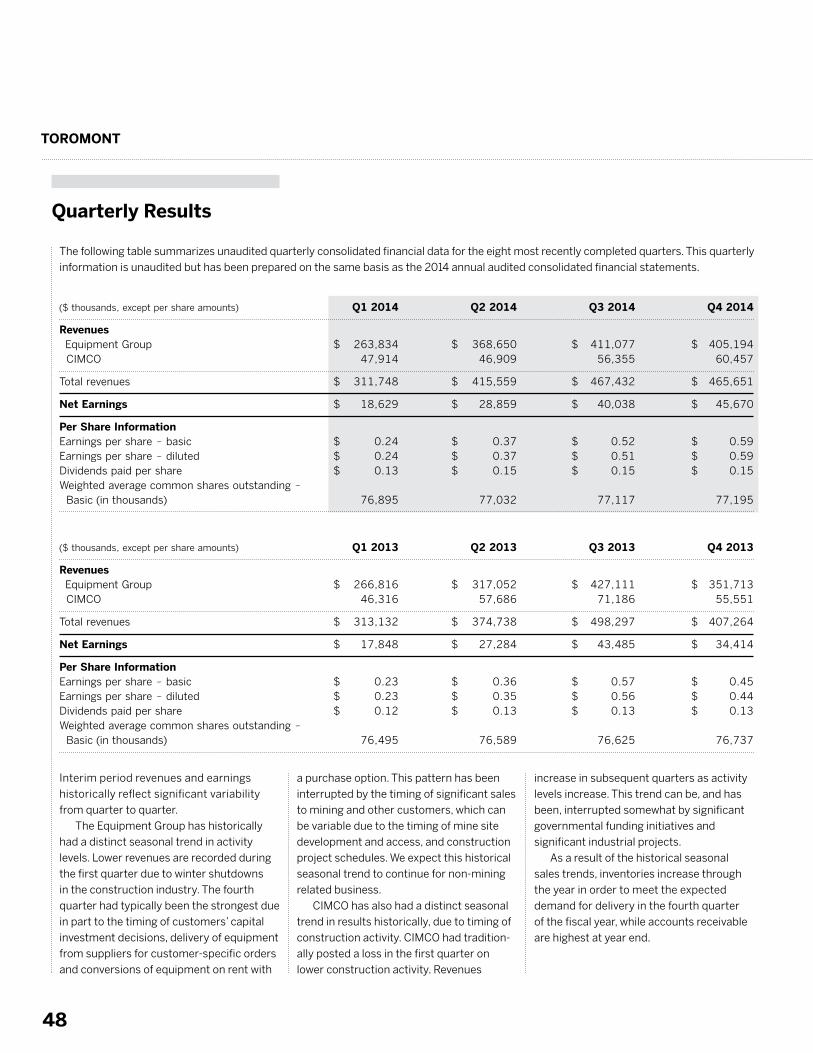
TOROMONT
48
The following table summarizes unaudited quarterly consolidated financial data for the eight most recently completed quarters. This quarterly
information is unaudited but has been prepared on the same basis as the 2014 annual audited consolidated financial statements.
($ thousands, except per share amounts) Q1 2014 Q2 2014 Q3 2014 Q4 2014
Revenues Equipment Group $ 263,834 $ 368,650 $ 411,077 $ 405,194 CIMCO 47,914 46,909 56,355 60,457
Total revenues $ 311,748 $ 415,559 $ 467,432 $ 465,651
Net Earnings $ 18,629 $ 28,859 $ 40,038 $ 45,670
Per Share Information Earnings per share – basic $ 0.24 $ 0.37 $ 0.52 $ 0.59 Earnings per share – diluted $ 0.24 $ 0.37 $ 0.51 $ 0.59 Dividends paid per share $ 0.13 $ 0.15 $ 0.15 $ 0.15 Weighted average common shares outstanding – Basic (in thousands) 76,895 77,032 77,117 77,195
($ thousands, except per share amounts) Q1 2013 Q2 2013 Q3 2013 Q4 2013
Revenues Equipment Group $ 266,816 $ 317,052 $ 427,111 $ 351,713 CIMCO 46,316 57,686 71,186 55,551
Total revenues $ 313,132 $ 374,738 $ 498,297 $ 407,264
Net Earnings $ 17,848 $ 27,284 $ 43,485 $ 34,414
Per Share Information Earnings per share – basic $ 0.23 $ 0.36 $ 0.57 $ 0.45 Earnings per share – diluted $ 0.23 $ 0.35 $ 0.56 $ 0.44 Dividends paid per share $ 0.12 $ 0.13 $ 0.13 $ 0.13 Weighted average common shares outstanding – Basic (in thousands) 76,495 76,589 76,625 76,737
Quarterly Results
Interim period revenues and earnings
historically reflect significant variability
from quarter to quarter.
The Equipment Group has historically
had a distinct seasonal trend in activity
levels. Lower revenues are recorded during
the first quarter due to winter shutdowns
in the construction industry. The fourth
quarter had typically been the strongest due
in part to the timing of customers’ capital
investment decisions, delivery of equipment
from suppliers for customer-specific orders
and conversions of equipment on rent with
a purchase option. This pattern has been
interrupted by the timing of significant sales
to mining and other customers, which can
be variable due to the timing of mine site
development and access, and construction
project schedules. We expect this historical
seasonal trend to continue for non-mining
related business.
CIMCO has also had a distinct seasonal
trend in results historically, due to timing of
construction activity. CIMCO had tradition-
ally posted a loss in the first quarter on
lower construction activity. Revenues
increase in subsequent quarters as activity
levels increase. This trend can be, and has
been, interrupted somewhat by significant
governmental funding initiatives and
significant industrial projects.
As a result of the historical seasonal
sales trends, inventories increase through
the year in order to meet the expected
demand for delivery in the fourth quarter
of the fiscal year, while accounts receivable
are highest at year end.
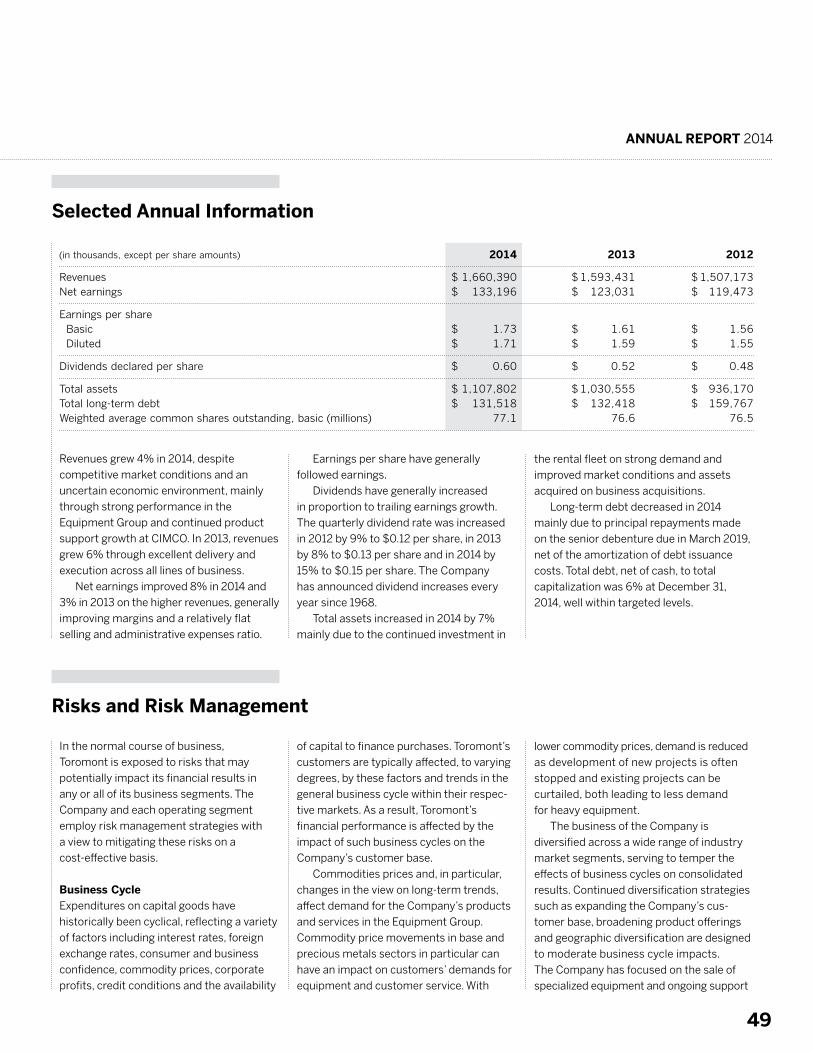
ANNUAL REPORT 2014
49
(in thousands, except per share amounts) 2014 2013 2012
Revenues $ 1,660,390 $ 1,593,431 $ 1,507,173 Net earnings $ 133,196 $ 123,031 $ 119,473
Earnings per share Basic $ 1.73 $ 1.61 $ 1.56 Diluted $ 1.71 $ 1.59 $ 1.55
Dividends declared per share $ 0.60 $ 0.52 $ 0.48
Total assets $ 1,107,802 $ 1,030,555 $ 936,170 Total long-term debt $ 131,518 $ 132,418 $ 159,767 Weighted average common shares outstanding, basic (millions) 77.1 76.6 76.5
Selected Annual Information
Revenues grew 4% in 2014, despite
competitive market conditions and an
uncertain economic environment, mainly
through strong performance in the
Equipment Group and continued product
support growth at CIMCO. In 2013, revenues
grew 6% through excellent delivery and
execution across all lines of business.
Net earnings improved 8% in 2014 and
3% in 2013 on the higher revenues, generally
improving margins and a relatively flat
selling and administrative expenses ratio.
In the normal course of business,
Toromont is exposed to risks that may
potentially impact its financial results in
any or all of its business segments. The
Company and each operating segment
employ risk management strategies with
a view to mitigating these risks on a
cost-effective basis.
Business CycleExpenditures on capital goods have
historically been cyclical, reflecting a variety
of factors including interest rates, foreign
exchange rates, consumer and business
confidence, commodity prices, corporate
profits, credit conditions and the availability
Earnings per share have generally
followed earnings.
Dividends have generally increased
in proportion to trailing earnings growth.
The quarterly dividend rate was increased
in 2012 by 9% to $0.12 per share, in 2013
by 8% to $0.13 per share and in 2014 by
15% to $0.15 per share. The Company
has announced dividend increases every
year since 1968.
Total assets increased in 2014 by 7%
mainly due to the continued investment in
of capital to finance purchases. Toromont’s
customers are typically affected, to varying
degrees, by these factors and trends in the
general business cycle within their respec-
tive markets. As a result, Toromont’s
financial performance is affected by the
impact of such business cycles on the
Company’s customer base.
Commodities prices and, in particular,
changes in the view on long-term trends,
affect demand for the Company’s products
and services in the Equipment Group.
Commodity price movements in base and
precious metals sectors in particular can
have an impact on customers’ demands for
equipment and customer service. With
the rental fleet on strong demand and
improved market conditions and assets
acquired on business acquisitions.
Long-term debt decreased in 2014
mainly due to principal repayments made
on the senior debenture due in March 2019,
net of the amortization of debt issuance
costs. Total debt, net of cash, to total
capitalization was 6% at December 31,
2014, well within targeted levels.
lower commodity prices, demand is reduced
as development of new projects is often
stopped and existing projects can be
curtailed, both leading to less demand
for heavy equipment.
The business of the Company is
diversified across a wide range of industry
market segments, serving to temper the
effects of business cycles on consolidated
results. Continued diversification strategies
such as expanding the Company’s cus-
tomer base, broadening product offerings
and geographic diversification are designed
to moderate business cycle impacts.
The Company has focused on the sale of
specialized equipment and ongoing support
Risks and Risk Management
TOROMONT
50
through parts distribution and skilled
service. Product support growth has been,
and will continue to be, fundamental to the
mitigation of downturns in the business
cycle. The product support business
contributes significantly higher profit
margins and is typically subject to less
volatility than equipment supply activities.
Product and SupplyThe Equipment Group purchases most of
its equipment inventories and parts from
Caterpillar under a dealership agreement
that dates back to 1993. As is customary in
distribution arrangements of this type, the
agreement with Caterpillar can be termi-
nated by either party upon 90 days’ notice.
In the event Caterpillar terminates, it must
repurchase substantially all inventories of
new equipment and parts at cost. Toromont
has maintained an excellent relationship
with Caterpillar for 22 years and manage-
ment expects this will continue going
forward.
Toromont is dependent on the continued
market acceptance of Caterpillar’s prod-
ucts. It is believed that Caterpillar has a
solid reputation as a high-quality manufac-
turer, with excellent brand recognition and
customer support as well as leading market
shares in many of the markets it serves.
However, there can be no assurance that
Caterpillar will be able to maintain its
reputation and market position in the future.
Any resulting decrease in the demand for
Caterpillar products could have a material
adverse impact on the Company’s business,
results of operations and future prospects.
Toromont is also dependent on
Caterpillar for timely supply of equipment
and parts. From time to time during periods
of intense demand, Caterpillar may find it
necessary to allocate its supply of particular
products among its dealers. Such alloca-
tions of supply have not, in the past, proven
to be a significant impediment in the
conduct of business. However, there can be
no assurance that Caterpillar will continue
to supply its products in the quantities and
timeframes required by customers.
CompetitionThe Company competes with a large
number of international, national, regional
and local suppliers in each of its markets.
Although price competition can be strong,
there are a number of factors that have
enhanced the Company’s ability to compete
throughout its market areas including:
range and quality of products and services;
ability to meet sophisticated customer
requirements; distribution capabilities,
including number and proximity of loca-
tions; financing offered by Caterpillar
Finance; e-commerce solutions; reputation;
and financial strength.
Increased competitive pressures or the
inability of the Company to maintain the
factors that have enhanced its competitive
position to date could adversely affect the
Company’s business, results of operations
or financial condition.
The Company relies on the skills and
availability of trained and experienced
tradesmen and technicians in order to
provide efficient and appropriate services
to customers. Hiring and retaining such
individuals is critical to the success of
these businesses. Demographic trends are
reducing the number of individuals entering
the trades, making access to skilled
individuals more difficult. The Company
has several remote locations which make
attracting and retaining skilled individuals
more difficult.
Credit RiskFinancial instruments that potentially
subject the Company to concentrations of
credit risk consist of cash equivalents,
accounts receivable and derivative financial
instruments. The carrying amount of assets
included on the balance sheet represents
the maximum credit exposure.
When the Company has cash on hand it
may be invested in short-term instruments,
such as money market deposits. The
Company manages its credit exposure
associated with cash equivalents by
ensuring there is no significant concentra-
tion of credit risk with a single counterparty,
and by dealing only with highly rated
financial institutions as counterparties.
The Company has accounts receivable
from a large diversified customer base,
and is not dependent on any single
customer or industry. The Company has
accounts receivable from customers
engaged in various industries including
construction, mining, food and beverage,
and governmental agencies. Management
does not believe that any single industry
represents significant credit risk. These
customers are based predominately
in Canada.
The credit risk associated with derivative
financial instruments arises from the
possibility that the counterparties may
default on their obligations. In order to
minimize this risk, the Company enters into
derivative transactions only with highly
rated financial institutions.
Warranties and Maintenance ContractsWarranties are provided for most of the
equipment sold, typically for a one-year
period following sale. The warranty claim risk
is generally shared jointly with the equipment
manufacturer. Accordingly, liability is
generally limited to the service component of
the warranty claim, while the manufacturer is
responsible for providing the required parts.
The Company also enters into long-term
maintenance and repair contracts, whereby
it is obligated to maintain equipment for its
customers. The length of these contracts
varies generally from two to five years. The
contracts are typically fixed price on either
machine hours or cost per hour, with
provisions for inflationary and exchange
adjustments. Due to the long-term nature of
these contracts, there is a risk that mainte-
nance costs may exceed the estimate,
thereby resulting in a loss on the contract.
These contracts are closely monitored for
early warning signs of cost overruns. In
addition, the manufacturer may, in certain
circumstances, share in the cost overruns if
profitability falls below a certain threshold.
ANNUAL REPORT 2014
51
Foreign ExchangeThe Company transacts business in
multiple currencies, the most significant of
which are the Canadian dollar and the U.S.
dollar. As a result, the Company has foreign
currency exposure with respect to items
denominated in foreign currencies.
The rate of exchange between the
Canadian and U.S. dollar has an impact on
revenue trends. The Canadian dollar averaged
US$0.91 in 2014 compared to US$0.97 in
2013, a 6% decrease. As substantially all of
the equipment and parts sold in the
Equipment Group are sourced in U.S. dollars,
and Canadian dollar sales prices generally
reflect changes in the rate of exchange, a
stronger Canadian dollar can adversely affect
revenues. The impact is not readily estimable
as it is largely dependent on when customers
order the equipment versus when it was sold.
Bookings in a given period would more
closely follow period-over-period changes in
exchange rates. Sales of parts come from
inventories maintained to service customer
requirements. As a result, constant parts
replenishment means that there is a lagging
impact of changes in exchange rates. In
CIMCO, sales are largely affected by the same
factors. In addition, revenues from CIMCO’s
U.S. subsidiary reflect changes in exchange
rates on the translation of results, although
this is not significant.
In addition, pricing to customers is
customarily adjusted to reflect changes in
the Canadian dollar landed cost of imported
goods. Foreign exchange contracts reduce
volatility by fixing landed costs related to
specific customer orders and establishing a
level of price stability for high-volume goods
such as spare parts.
The Company does not enter into foreign
exchange forward contracts for speculative
purposes. The gains and losses on the
foreign exchange forward contracts
designated as cash flow hedges are
intended to offset the translation losses
and gains on the hedged foreign currency
transactions when they occur.
As a result, the foreign exchange impact
on earnings with respect to transactional
activity is not significant.
Interest RateThe Company minimizes its interest rate
risk by managing its portfolio of floating and
fixed rate debt, as well as managing the
term to maturity.
At December 31, 2014, 100% of the
Company’s debt portfolio was comprised
of fixed rate debt (2013 – 100%), maturing
between 2015 and 2019. Fixed rate debt
exposes the Company to future interest rate
movements upon refinancing the debt
at maturity.
Floating rate debt exposes the Company
to fluctuations in short-term interest rates
by causing related interest payments and
finance expense to vary.
Further, the fair value of the Company’s
fixed rate debt obligations may be nega-
tively affected by declines in interest rates,
thereby exposing the Company to potential
losses on early settlements or refinancing.
The Company does not intend to settle or
refinance any existing debt before maturity.
Financing ArrangementsThe Company requires capital to finance
its growth and to refinance its outstanding
debt obligations as they come due for
repayment. If the cash generated from the
Company’s business, together with the
credit available under existing bank
facilities, is not sufficient to fund future
capital requirements, the Company will
require additional debt or equity financing in
the capital markets. The Company’s ability
to access capital markets, on terms that are
acceptable, will be dependent upon
prevailing market conditions, as well as
the Company’s future financial condition.
Further, the Company’s ability to increase
its debt financing may be limited by its
financial covenants or its credit rating
objectives. The Company maintains a
conservative leverage structure and
although it does not anticipate difficulties,
there can be no assurance that capital will
be available on suitable terms and condi-
tions, or that borrowing costs and credit
ratings will not be adversely affected.
Environmental RegulationToromont’s customers are subject to
significant and ever-increasing environmen-
tal legislation and regulation. This legislation
can impact Toromont in two ways. First, it
may increase the technical difficulty in
meeting environmental requirements in
product design, which could increase the
cost of these businesses’ products. Second,
it may result in a reduction in activity by
Toromont’s customers in environmentally
sensitive areas, in turn reducing the sales
opportunities available to Toromont.
Toromont is also subject to a broad
range of environmental laws and regula-
tions. These may, in certain circumstances,
impose strict liability for environmental
contamination, which may render Toromont
liable for remediation costs, natural
resource damages and other damages as a
result of conduct that was lawful at the time
it occurred or the conduct of, or conditions
caused by, prior owners, operators or other
third parties. In addition, where contamina-
tion may be present, it is not uncommon for
neighbouring land owners and other third
parties to file claims for personal injury,
property damage and recovery of response
costs. Remediation costs and other
damages arising as a result of environmen-
tal laws and regulations, and costs associ-
ated with new information, changes in
existing environmental laws and regulations
or the adoption of new environmental laws
and regulations could be substantial and
could negatively impact Toromont’s
business, results of operations or
financial condition.
Spinoff Transaction RiskAlthough the spinoff of Enerflex in 2011
as a separate, publicly traded company is
complete, the transaction exposes
Toromont to certain ongoing risks. The
spinoff was structured to comply with all
the requirements of the public company
“butterfly rules” in the Income Tax Act.
However, there are certain requirements of
these rules that depend on events occurring
after completion of the spinoff or that may
not be within the control of Toromont and/
TOROMONT
52
or Enerflex. If these requirements are not
met, Toromont could be exposed to
significant tax liabilities which could have a
material effect on the financial position of
Toromont. In addition, Toromont has agreed
to indemnify Enerflex for certain liabilities
and obligations related to its business at the
time of the spinoff. These indemnification
obligations could be significant. These risks
are more fully described in the Management
Information Circular relating to the Plan of
Arrangement dated April 11, 2011, which is
available at www.sedar.com.
The Company’s significant accounting
policies are described in note 1 to the
consolidated financial statements.
The preparation of the Company’s
consolidated financial statements in
conformity with IFRS requires management
to make judgments, estimates and assump-
tions that affect the reported amounts of
revenues, expenses, assets and liabilities,
and the disclosure of contingent liabilities,
at the end of the reporting period. However,
uncertainty about these assumptions and
estimates could result in outcomes that
require a material adjustment to the
carrying amount of the asset or liability
affected in future periods.
In making estimates and judgments,
management relies on external information
and observable conditions where possible,
supplemented by internal analysis as
required. Management reviews its estimates
and judgments on an ongoing basis.
In the process of applying the Company’s
accounting policies, management has made
the following judgments, estimates and
assumptions which have the most signifi-
cant effect on the amounts recognized in
the consolidated financial statements.
The critical accounting policies and
estimates described below affect the
operating segments similarly, and therefore
are not discussed on a segmented basis.
AcquisitionsManagement applied judgement relating
to acquisitions with respect to whether the
acquisitions were a business combination
or an asset acquisition. Management applied
a three-element process to determine
whether a business or an asset was
purchased, considering inputs, processes
and outputs of the respective acquisitions
in order to reach a conclusion.
Property, Plant and Equipment Fixed assets are stated at cost less accumu-
lated depreciation, including asset impair-
ment losses. Depreciation is calculated
using the straight-line method over the
estimated useful lives of the assets. The
estimated useful lives of fixed assets are
reviewed on an annual basis. Assessing the
reasonableness of the estimated useful lives
of fixed assets requires judgment and is
based on currently available information.
Fixed assets are also reviewed for
potential impairment on a regular basis
or whenever events or changes in circum-
stances indicate that the carrying amount
may not be recoverable. In cases where the
undiscounted expected future cash flows
are less than the carrying amount, an
impairment loss is recognized. Impairment
losses on long-lived assets are measured as
the amount by which the carrying value of
an asset or asset group exceeds its fair
value, as determined by the discounted
future cash flows of the asset or asset
group. In estimating future cash flows, the
Company uses its best estimates based on
internal plans that incorporate manage-
ment’s judgments as to the remaining
service potential of the fixed assets.
Changes in circumstances, such as
technological advances and changes to
business strategy, can result in actual
useful lives and future cash flows differing
significantly from estimates. The assump-
tions used, including rates and methodolo-
gies, are reviewed on an ongoing basis to
ensure they continue to be appropriate.
Revisions to the estimated useful lives of
fixed assets or future cash flows constitute
a change in accounting estimate and are
applied prospectively.
Income Taxes Income tax rules and regulations in the
countries in which the Company operates
and income tax treaties between these
countries are subject to interpretation and
require estimates and assumptions in
determining the Company’s consolidated
income tax provision that may be chal-
lenged by the taxation authorities.
Estimates and judgments are made for
uncertainties which exist with respect to the
interpretation of complex tax regulations,
changes in tax laws and the amount and
timing of future taxable income. Changes or
differences in these estimates or assump-
tions may result in changes to the current or
deferred tax balances on the consolidated
statement of financial position, a charge or
credit to income tax expense in the income
statement and may result in cash payments
or receipts.
Impairment of Non-Financial AssetsImpairment exists when the carrying value
of an asset or cash generating unit exceeds
its recoverable amount, which is the higher
of its fair value less costs to sell and its value
in use. The fair value less costs to sell
calculation is based on available data from
binding sales transactions in an arm’s
length transaction of similar assets or
observable market prices less incremental
costs for disposing of the asset. The value in
use calculation is based on a discounted
Critical Accounting Policies and Estimates
ANNUAL REPORT 2014
53
cash flow model. The cash flows are derived
from the budget for the next three years and
do not include restructuring activities that
the Company is not yet committed to or
significant future investments that will
enhance the asset’s performance of the
cash generating unit being tested. The
recoverable amount is most sensitive to the
discount rate used for the discounted cash
flow model as well as the expected future
cash inflows and the growth rate used for
extrapolation purposes.
Revenue Recognition The Company generates revenue from the
assembly and manufacture of equipment
using the percentage-of-completion
method. This method requires management
to make a number of estimates and
assumptions surrounding: the expected
profitability of the contract; the estimated
degree of completion based on cost
progression; and other detailed factors.
Although these factors are routinely
reviewed as part of the project management
process, changes in these estimates or
assumptions could lead to changes in the
revenues recognized in a given period.
The Company also generates revenue
from long-term maintenance and repair
contracts whereby it is obligated to
maintain equipment for its customers. The
contracts are typically fixed price on either
machine hours or cost per hour, with
provisions for inflationary and exchange
adjustments. Revenue is recognized using
the percentage-of-completion method
based on work completed. This method
requires management to make a number
of estimates and assumptions surround-
ing: machine usage; machine perfor-
mance; future parts and labour pricing;
manufacturers’ warranty coverage; and
other detailed factors. These factors are
routinely reviewed as part of the contract
management process; however, changes
in these estimates or assumptions could
lead to changes in the revenues and
cost of goods sold recognized in a
given period.
InventoriesManagement is required to make an assess-
ment of the net realizable value of inventory at
each reporting period. Management incorpo-
rates estimates and judgments that take into
account current market prices, current
economic trends and past experiences in
the measurement of net realizable value.
Employee Future Benefits ExpenseThe net obligations associated with the
defined benefit pension plans are actuarially
valued using: the projected unit credit
method; the current market discount rate,
salary escalation, life expectancy and future
pension increases. All assumptions are
reviewed at each reporting date.
Share-based Compensation Estimating the fair value for share-based
payment transactions requires determining
the most appropriate inputs to the valuation
model including: the expected life of the
share option; expected stock price volatility;
and expected dividend yield.
A number of new standards and amendments
to standards have been issued but are not
yet effective for the financial year ending
December 31, 2014, and accordingly, have
not been applied in preparing the consoli-
dated financial statements.
Revenue Recognition – In May 2014, the
IASB issued IFRS 15 – Revenue from Contracts
with Customers, which establishes a single
comprehensive model for entities to use in
accounting for revenue arising from contracts
with customers. Under IFRS 15, revenue is
recognized at an amount that reflects the
consideration to which an entity expects to be
entitled in exchange for transferring goods or
services to a customer. The principles in IFRS
15 provide a more structured approach to
measuring and recognizing revenue.
The new revenue standard is applicable
to all entities and will supersede all current
revenue recognition requirements under
IFRS. Either a full or modified retrospective
application is required for annual periods
beginning on or after January 1, 2017, with
early adoption permitted.
Financial Instruments – In July 2014, the
IASB issued the final version of IFRS 9
– Financial Instruments, which replaces all
phases of the financial instruments project,
IAS 39 – Financial Instruments: Recognition
and Measurement and all previous versions
of IFRS 9. The standard introduces new
requirements for classification and
measurement, impairment, and hedge
accounting. The new standard is effective
for annual periods beginning on or after
January 1, 2018, with early adoption
permitted.
Employee Benefits – The amendments to
IAS 19 – Employee Benefits, require an entity
to consider contributions from employees
or third parties when accounting for defined
benefit plans. Where the contributions are
linked to service, they should be attributed to
periods of service as a negative benefit. These
amendments clarify that, if the amount of the
contributions is independent of the number
of years of service, an entity is permitted to
recognize such contributions as a reduction
in the service cost in the period in which the
service is rendered, instead of allocating the
contributions to the periods of service. This
amendment is effective for annual periods
beginning on or after July 1, 2014.
Future Accounting Standards
The Company is currently assessing the impact of these new standards and amendments on its financial statements.
TOROMONT
54
Management is responsible for the
information disclosed in this MD&A and the
accompanying consolidated financial
statements, and has in place appropriate
information systems, procedures and
controls to ensure that information used
internally by management and disclosed
externally is materially complete and
reliable. In addition, the Company’s Audit
Committee, on behalf of the Board of
Directors, provides an oversight role with
respect to all public financial disclosures
made by the Company, and has reviewed
and approved this MD&A and the
accompanying consolidated financial
statements. The Audit Committee is also
responsible for determining that manage-
ment fulfills its responsibilities in the
financial control of operations, including
disclosure controls and procedures and
internal control over financial reporting.
Responsibility of Management and the Board of Directors
The Chief Executive Officer and the Chief
Financial Officer, together with other
members of management, have evaluated
the effectiveness of the Company’s
disclosure controls and procedures and
internal controls over financial reporting as
at December 31, 2014, using the internal
control integrated framework issued by the
Committee of Sponsoring Organizations of
the Treadway Commission (“COSO”) in
2013. Based on that evaluation, they have
concluded that the design and operation of
the Company’s disclosure controls and
procedures were adequate and effective as
at December 31, 2014, to provide reasonable
assurance that a) material information
relating to the Company and its
consolidated subsidiaries would have been
known to them and by others within those
entities, and b) information required to be
disclosed is recorded, processed, summa-
rized and reported within required time
periods. They have also concluded that the
design and operation of internal controls
over financial reporting were adequate and
effective as at December 31, 2014, to
provide reasonable assurance regarding the
reliability of financial reporting and the
preparation of financial reporting in
accordance with IFRS.
There have been no changes in the
design of the Company’s internal controls
over financial reporting during 2014 that
would materially affect, or are reasonably
likely to materially affect, the Company’s
internal controls over financial reporting.
While the Officers of the Company have
evaluated the effectiveness of disclosure
controls and procedures and internal
control over financial reporting as at
December 31, 2014, and have concluded
that these controls and procedures are
being maintained as designed, they expect
that the disclosure controls and procedures
and internal controls over financial report-
ing may not prevent all errors and fraud.
A control system, no matter how well-
conceived or operated, can only provide
reasonable, not absolute, assurance that the
objectives of the control system are met.
Disclosure Controls and Procedures and Internal Control Over Financial Reporting
ANNUAL REPORT 2014
55
The success of the Company and business
unit strategies is measured using a number
of key performance indicators, which are
outlined below. These measures are also
used by management in its assessment
of relative investments in operations.
These key performance indicators are not
measurements in accordance with IFRS.
It is possible that these measures will
not be comparable to similar measures
prescribed by other companies.
They should not be considered as an
alternative to net income or any other
measure of performance under IFRS.
Operating Income and Operating Margin Each business segment assumes responsi-
bility for its operating results as measured
by, amongst other factors, operating
income, which is defined as income before
income taxes, interest income and interest
expense. Financing and related interest
charges cannot be attributed to business
segments on a meaningful basis that is
comparable to other companies. Business
segments and income tax jurisdictions are
not synonymous, and it is believed that the
allocation of income taxes distorts the
historical comparability of the performance
of the business segments. Consolidated and
segmented operating income is reconciled
to net earnings in tables where used in
this MD&A.
Operating income margin is calculated
by dividing operating income by total
revenue.
Return on Equity and Return on Capital Employed Return on equity (“ROE”) is monitored to
assess the profitability of the consolidated
Company. ROE is calculated by dividing net
earnings by opening shareholders’ equity
(adjusted for shares issued and redeemed
during the year).
Return on capital employed (“ROCE”)
is a key performance indicator that is
utilized to assess both current operating
performance and prospective investments.
The numerator used for the calculation is
income before income taxes, interest
expense and interest income (excluding
interest on rental conversions). The
denominator in the calculation is the
monthly average capital employed, which
is defined as net debt plus shareholders’
equity.
Working Capital and Non-Cash Working Capital Working capital is defined as current assets
less current liabilities. Non-cash working
capital is defined as working capital less
cash and cash equivalents.
Net Debt to Total CapitalizationNet debt is defined as total long-term
debt less cash and cash equivalents. Total
capitalization is defined as net debt plus
shareholders’ equity. The ratio of net debt
to total capitalization is determined by
dividing net debt by total capitalization.
Free Cash FlowFree cash flow is defined as cash provided
by operating activities (as per the
Consolidated Statement of Cash Flows),
less cash used in investing activities,
other than business acquisitions.
Non-IFRS Financial Measures
TOROMONT
56
The preparation and presentation of
the Company’s consolidated financial
statements is the responsibility of manage-
ment. The financial statements have been
prepared in accordance with International
Financial Reporting Standards as issued by
the International Accounting Standards
Board and necessarily include estimates.
The financial statements reflect amounts
which must, of necessity, be based on the
best estimates and judgment of manage-
ment. Information contained elsewhere in
the Annual Report is consistent, where
applicable, with that contained in the
financial statements.
Management maintains appropriate
systems of internal control. Policies and
procedures are designed to give reasonable
Scott J. MedhurstPresident and
Chief Executive Officer
Paul R. Jewer Executive Vice President and
Chief Financial Officer
February 5, 2015
Toronto, Canada
assurance that transactions are appropri-
ately authorized, assets are safeguarded
from loss or unauthorized use and financial
records are properly maintained to provide
reliable information for preparation of
financial statements.
Ernst & Young LLP, an independent firm
of Chartered Professional Accountants, were
appointed by the shareholders as external
auditors to examine the consolidated financial
statements in accordance with generally
accepted auditing standards in Canada and
provide an independent professional opinion.
Their report is presented with the consoli-
dated financial statements.
The Board of Directors, acting through
an Audit Committee comprised solely of
independent directors, is responsible for
determining that management fulfills its
responsibilities in the preparation of the
consolidated financial statements and the
financial control of operations. The Audit
Committee recommends the independent
auditors for appointment by the sharehold-
ers. It meets regularly with financial
management and the internal and external
auditors to discuss internal controls,
auditing matters and financial reporting
issues. The independent auditors have
unrestricted access to the Audit Committee.
The consolidated financial statements and
Management’s Discussion and Analysis
have been approved by the Board of
Directors for inclusion in this Annual Report,
based on the review and recommendation
of the Audit Committee.
Management’s Report
ANNUAL REPORT 2014
57
To the Shareholders of Toromont
Industries Ltd.
We have audited the accompanying
consolidated financial statements of
Toromont Industries Ltd., which comprise
the consolidated statements of financial
position as at December 31, 2014 and 2013,
and the consolidated income statements,
consolidated statements of comprehensive
income, consolidated statements of cash
flows and consolidated statements of
changes in equity for the years ended
December 31, 2014 and 2013, and a
summary of significant accounting policies
and other explanatory information.
Management’s Responsibility for the Consolidated Financial StatementsManagement is responsible for the
preparation and fair presentation of these
consolidated financial statements in
accordance with International Financial
Reporting Standards, and for such internal
control as management determines is
necessary to enable the preparation of
February 5, 2015
Toronto, Canada
consolidated financial statements that are
free from material misstatement, whether
due to fraud or error.
Auditors’ ResponsibilityOur responsibility is to express an opinion on
these consolidated financial statements based
on our audits. We conducted our audits in
accordance with Canadian generally accepted
auditing standards. Those standards require
that we comply with ethical requirements
and plan and perform the audit to obtain
reasonable assurance about whether the
consolidated financial statements are free
from material misstatement.
An audit involves performing procedures
to obtain audit evidence about the amounts
and disclosures in the consolidated financial
statements. The procedures selected
depend on the auditors’ judgment, including
the assessment of the risks of material
misstatement of the consolidated financial
statements, whether due to fraud or error.
In making those risk assessments, the
auditors consider internal control relevant
to the entity’s preparation and fair
presentation of the consolidated financial
statements in order to design audit
procedures that are appropriate in the
circumstances, but not for the purpose of
expressing an opinion on the effectiveness
of the entity’s internal control. An audit also
includes evaluating the appropriateness of
accounting policies used and the reason-
ableness of accounting estimates made by
management, as well as evaluating the
overall presentation of the consolidated
financial statements.
We believe that the audit evidence we
have obtained in our audits is sufficient
and appropriate to provide a basis for our
audit opinion.
OpinionIn our opinion, the consolidated financial
statements present fairly, in all material
respects, the financial position of Toromont
Industries Ltd. as at December 31, 2014 and
2013, and its financial performance and its
cash flows for the years ended December
31, 2014 and 2013 in accordance with
International Financial Reporting Standards.
Independent Auditors’ Report
Ernst & Young LLP Chartered Professional Accountants
Licensed Public Accountants
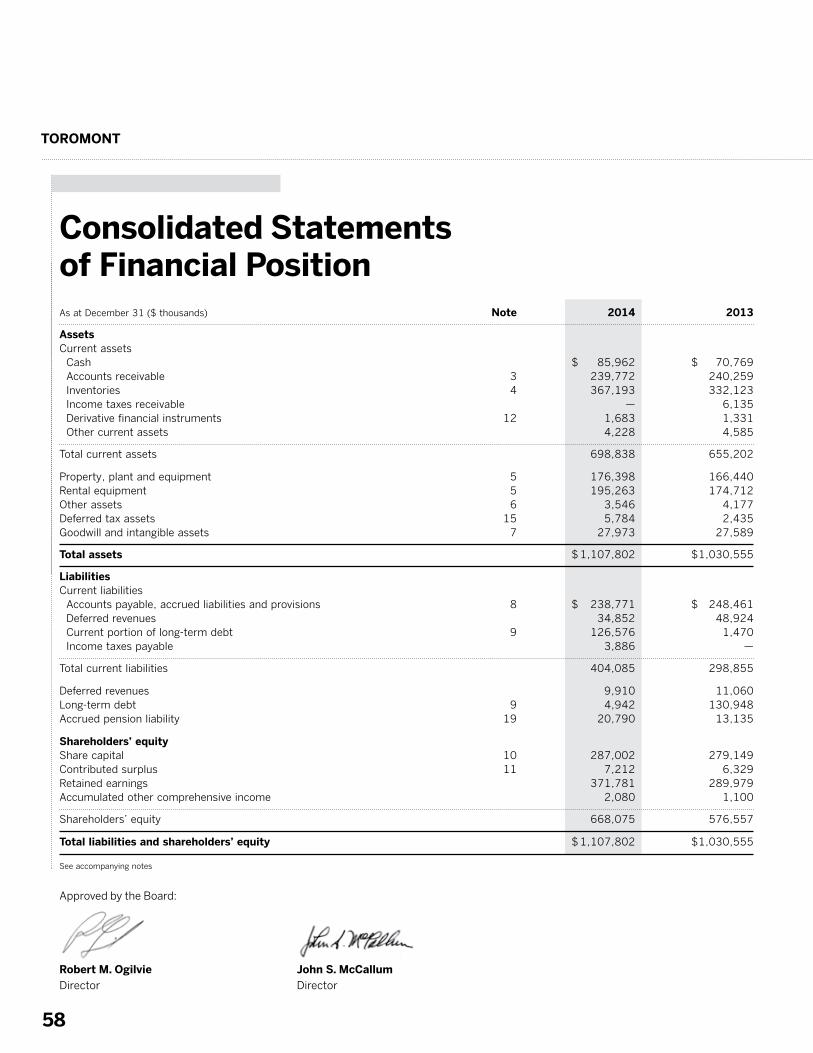
TOROMONT
58
As at December 31 ($ thousands) Note 2014 2013
Assets Current assets Cash $ 85,962 $ 70,769 Accounts receivable 3 239,772 240,259 Inventories 4 367,193 332,123 Income taxes receivable — 6,135 Derivative financial instruments 12 1,683 1,331 Other current assets 4,228 4,585
Total current assets 698,838 655,202 Property, plant and equipment 5 176,398 166,440 Rental equipment 5 195,263 174,712 Other assets 6 3,546 4,177 Deferred tax assets 15 5,784 2,435 Goodwill and intangible assets 7 27,973 27,589
Total assets $ 1,107,802 $ 1,030,555
Liabilities Current liabilities Accounts payable, accrued liabilities and provisions 8 $ 238,771 $ 248,461 Deferred revenues 34,852 48,924 Current portion of long-term debt 9 126,576 1,470 Income taxes payable 3,886 —
Total current liabilities 404,085 298,855 Deferred revenues 9,910 11,060 Long-term debt 9 4,942 130,948 Accrued pension liability 19 20,790 13,135 Shareholders’ equity Share capital 10 287,002 279,149 Contributed surplus 11 7,212 6,329 Retained earnings 371,781 289,979 Accumulated other comprehensive income 2,080 1,100
Shareholders’ equity 668,075 576,557
Total liabilities and shareholders’ equity $ 1,107,802 $ 1,030,555
See accompanying notes
Robert M. OgilvieDirector
Approved by the Board:
John S. McCallum Director
Consolidated Statements of Financial Position
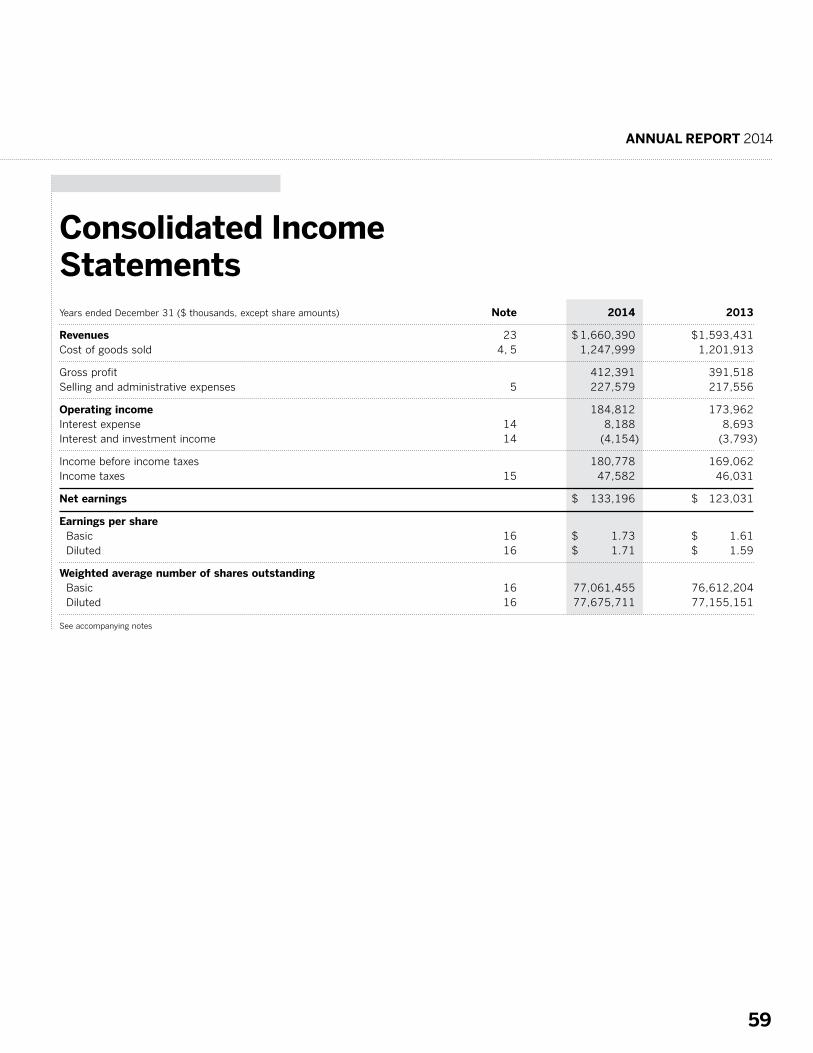
ANNUAL REPORT 2014
59
Years ended December 31 ($ thousands, except share amounts) Note 2014 2013
Revenues 23 $ 1,660,390 $ 1,593,431 Cost of goods sold 4, 5 1,247,999 1,201,913
Gross profit 412,391 391,518 Selling and administrative expenses 5 227,579 217,556
Operating income 184,812 173,962 Interest expense 14 8,188 8,693 Interest and investment income 14 (4,154) (3,793)
Income before income taxes 180,778 169,062 Income taxes 15 47,582 46,031
Net earnings $ 133,196 $ 123,031
Earnings per share Basic 16 $ 1.73 $ 1.61 Diluted 16 $ 1.71 $ 1.59
Weighted average number of shares outstanding Basic 16 77,061,455 76,612,204 Diluted 16 77,675,711 77,155,151
See accompanying notes
Consolidated IncomeStatements

TOROMONT
60
Years ended December 31 ($ thousands) 2014 2013
Net earnings $ 133,196 $ 123,031 Other comprehensive (loss) income:
Items that may be reclassified subsequently to net earnings: Unrealized gain on translation of financial statements of foreign operations 602 407 Change in fair value of derivatives designated as cash flow hedges, net of income tax expense (2014 – $938; 2013 – $1,084) 2,663 3,089 (Gain) on derivatives designated as cash flow hedges transferred to net earnings, net of income tax expense (2014 – $803; 2013 – $925) (2,285) (2,628)
Items that will not be reclassified subsequently to net earnings: Actuarial (losses) gains on pension plans, net of income tax (recovery) expense (2014 – ($1,849); 2013 – $2,637) (5,127) 7,316
Other comprehensive (loss) income (4,147) 8,184
Comprehensive income $ 129,049 $ 131,215
See accompanying notes
Consolidated Statements of Comprehensive Income
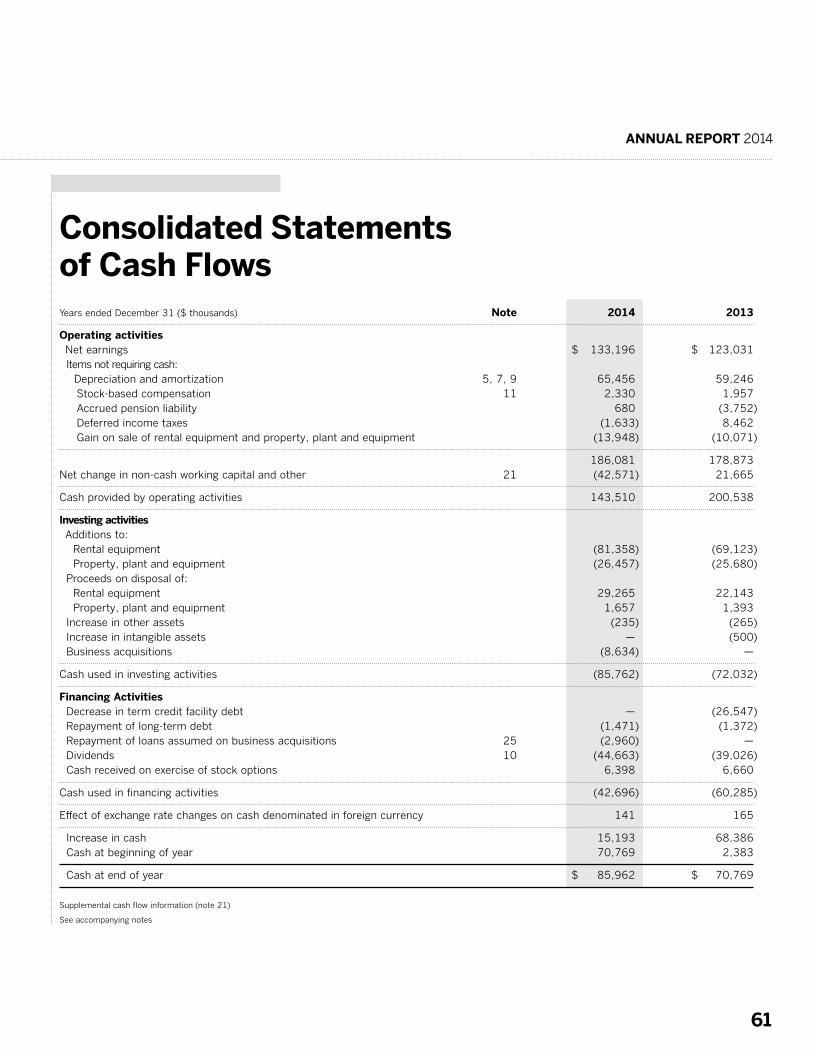
ANNUAL REPORT 2014
61
Years ended December 31 ($ thousands) Note 2014 2013
Operating activities Net earnings $ 133,196 $ 123,031 Items not requiring cash: Depreciation and amortization 5, 7, 9 65,456 59,246 Stock-based compensation 11 2,330 1,957 Accrued pension liability 680 (3,752) Deferred income taxes (1,633) 8,462 Gain on sale of rental equipment and property, plant and equipment (13,948) (10,071)
186,081 178,873 Net change in non-cash working capital and other 21 (42,571) 21,665
Cash provided by operating activities 143,510 200,538
Investing activities Additions to: Rental equipment (81,358) (69,123) Property, plant and equipment (26,457) (25,680) Proceeds on disposal of: Rental equipment 29,265 22,143 Property, plant and equipment 1,657 1,393 Increase in other assets (235) (265) Increase in intangible assets — (500) Business acquisitions (8,634) —
Cash used in investing activities (85,762) (72,032)
Financing Activities Decrease in term credit facility debt — (26,547) Repayment of long-term debt (1,471) (1,372) Repayment of loans assumed on business acquisitions 25 (2,960) — Dividends 10 (44,663) (39,026) Cash received on exercise of stock options 6,398 6,660
Cash used in financing activities (42,696) (60,285)
Effect of exchange rate changes on cash denominated in foreign currency 141 165
Increase in cash 15,193 68,386 Cash at beginning of year 70,769 2,383
Cash at end of year $ 85,962 $ 70,769
Supplemental cash flow information (note 21)
See accompanying notes
Consolidated Statementsof Cash Flows
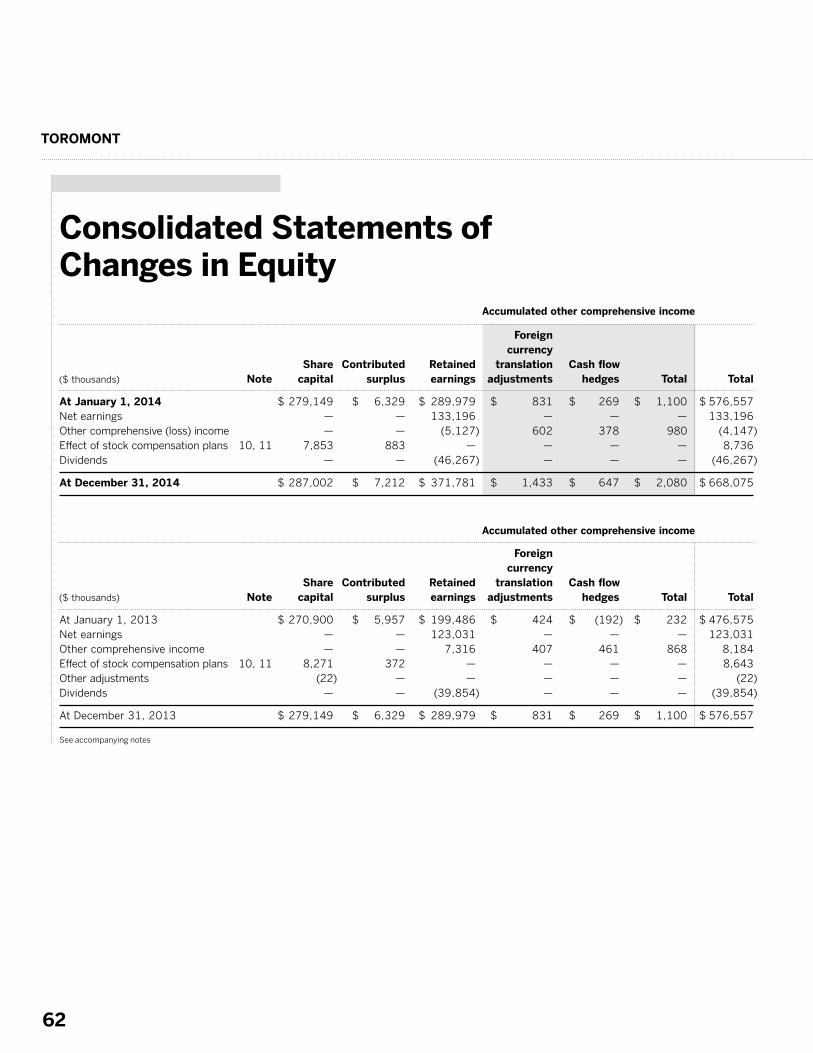
TOROMONT
62
Foreign
currency
Share Contributed Retained translation Cash flow ($ thousands) Note capital surplus earnings adjustments hedges Total Total
At January 1, 2014 $ 279,149 $ 6,329 $ 289,979 $ 831 $ 269 $ 1,100 $ 576,557 Net earnings — — 133,196 — — — 133,196 Other comprehensive (loss) income — — (5,127) 602 378 980 (4,147) Effect of stock compensation plans 10, 11 7,853 883 — — — — 8,736 Dividends — — (46,267) — — — (46,267)
At December 31, 2014 $ 287,002 $ 7,212 $ 371,781 $ 1,433 $ 647 $ 2,080 $ 668,075
Foreign
currency
Share Contributed Retained translation Cash flow ($ thousands) Note capital surplus earnings adjustments hedges Total Total
At January 1, 2013 $ 270,900 $ 5,957 $ 199,486 $ 424 $ (192) $ 232 $ 476,575 Net earnings — — 123,031 — — — 123,031 Other comprehensive income — — 7,316 407 461 868 8,184 Effect of stock compensation plans 10, 11 8,271 372 — — — — 8,643 Other adjustments (22) — — — — — (22) Dividends — — (39,854) — — — (39,854)
At December 31, 2013 $ 279,149 $ 6,329 $ 289,979 $ 831 $ 269 $ 1,100 $ 576,557
See accompanying notes
Consolidated Statements of Changes in Equity
Accumulated other comprehensive income
Accumulated other comprehensive income
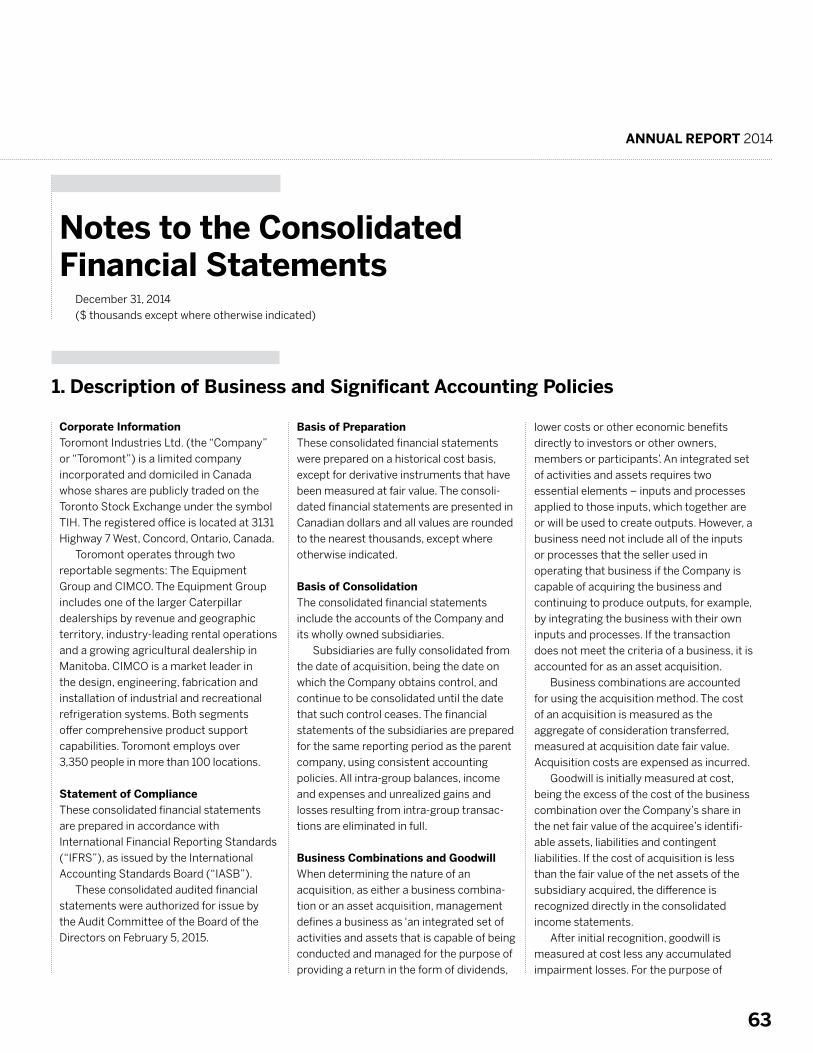
ANNUAL REPORT 2014
63
Notes to the Consolidated Financial Statements
Corporate InformationToromont Industries Ltd. (the “Company”
or “Toromont”) is a limited company
incorporated and domiciled in Canada
whose shares are publicly traded on the
Toronto Stock Exchange under the symbol
TIH. The registered office is located at 3131
Highway 7 West, Concord, Ontario, Canada.
Toromont operates through two
reportable segments: The Equipment
Group and CIMCO. The Equipment Group
includes one of the larger Caterpillar
dealerships by revenue and geographic
territory, industry-leading rental operations
and a growing agricultural dealership in
Manitoba. CIMCO is a market leader in
the design, engineering, fabrication and
installation of industrial and recreational
refrigeration systems. Both segments
offer comprehensive product support
capabilities. Toromont employs over
3,350 people in more than 100 locations.
Statement of ComplianceThese consolidated financial statements
are prepared in accordance with
International Financial Reporting Standards
(“IFRS”), as issued by the International
Accounting Standards Board (“IASB”).
These consolidated audited financial
statements were authorized for issue by
the Audit Committee of the Board of the
Directors on February 5, 2015.
December 31, 2014
($ thousands except where otherwise indicated)
Basis of PreparationThese consolidated financial statements
were prepared on a historical cost basis,
except for derivative instruments that have
been measured at fair value. The consoli-
dated financial statements are presented in
Canadian dollars and all values are rounded
to the nearest thousands, except where
otherwise indicated.
Basis of ConsolidationThe consolidated financial statements
include the accounts of the Company and
its wholly owned subsidiaries.
Subsidiaries are fully consolidated from
the date of acquisition, being the date on
which the Company obtains control, and
continue to be consolidated until the date
that such control ceases. The financial
statements of the subsidiaries are prepared
for the same reporting period as the parent
company, using consistent accounting
policies. All intra-group balances, income
and expenses and unrealized gains and
losses resulting from intra-group transac-
tions are eliminated in full.
Business Combinations and GoodwillWhen determining the nature of an
acquisition, as either a business combina-
tion or an asset acquisition, management
defines a business as ‘an integrated set of
activities and assets that is capable of being
conducted and managed for the purpose of
providing a return in the form of dividends,
lower costs or other economic benefits
directly to investors or other owners,
members or participants’. An integrated set
of activities and assets requires two
essential elements – inputs and processes
applied to those inputs, which together are
or will be used to create outputs. However, a
business need not include all of the inputs
or processes that the seller used in
operating that business if the Company is
capable of acquiring the business and
continuing to produce outputs, for example,
by integrating the business with their own
inputs and processes. If the transaction
does not meet the criteria of a business, it is
accounted for as an asset acquisition.
Business combinations are accounted
for using the acquisition method. The cost
of an acquisition is measured as the
aggregate of consideration transferred,
measured at acquisition date fair value.
Acquisition costs are expensed as incurred.
Goodwill is initially measured at cost,
being the excess of the cost of the business
combination over the Company’s share in
the net fair value of the acquiree’s identifi-
able assets, liabilities and contingent
liabilities. If the cost of acquisition is less
than the fair value of the net assets of the
subsidiary acquired, the difference is
recognized directly in the consolidated
income statements.
After initial recognition, goodwill is
measured at cost less any accumulated
impairment losses. For the purpose of
1. Description of Business and Significant Accounting Policies
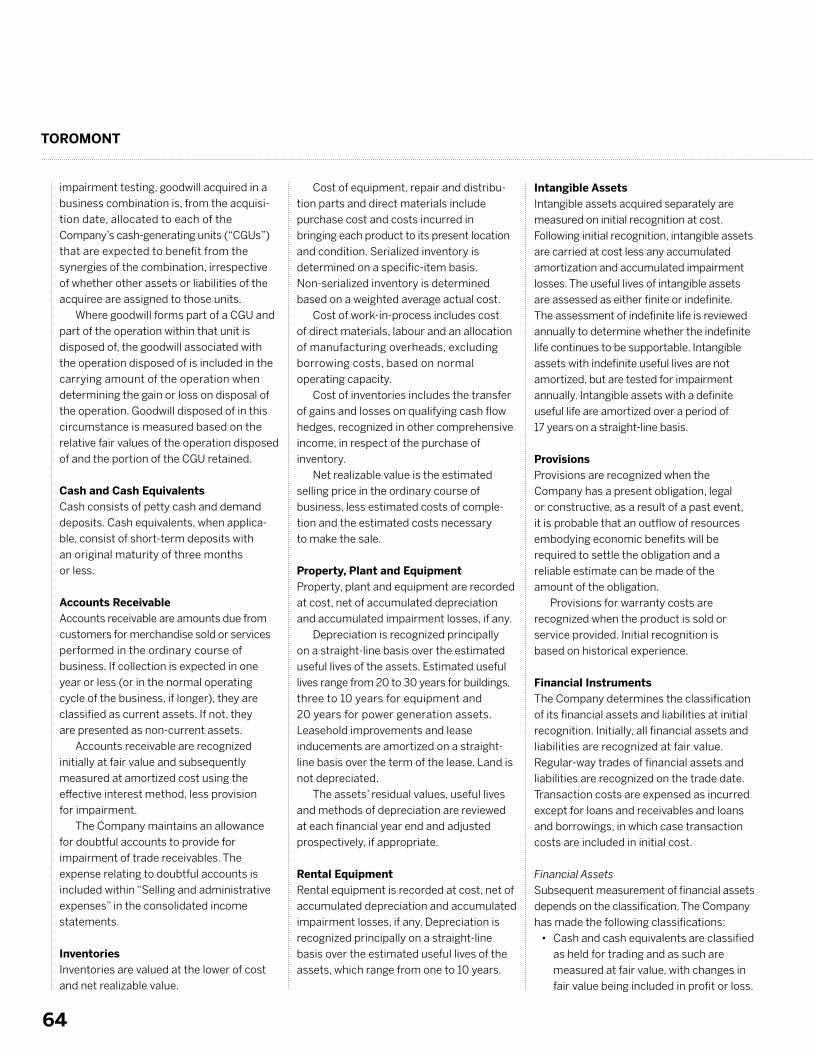
TOROMONT
64
impairment testing, goodwill acquired in a
business combination is, from the acquisi-
tion date, allocated to each of the
Company’s cash-generating units (“CGUs”)
that are expected to benefit from the
synergies of the combination, irrespective
of whether other assets or liabilities of the
acquiree are assigned to those units.
Where goodwill forms part of a CGU and
part of the operation within that unit is
disposed of, the goodwill associated with
the operation disposed of is included in the
carrying amount of the operation when
determining the gain or loss on disposal of
the operation. Goodwill disposed of in this
circumstance is measured based on the
relative fair values of the operation disposed
of and the portion of the CGU retained.
Cash and Cash EquivalentsCash consists of petty cash and demand
deposits. Cash equivalents, when applica-
ble, consist of short-term deposits with
an original maturity of three months
or less.
Accounts ReceivableAccounts receivable are amounts due from
customers for merchandise sold or services
performed in the ordinary course of
business. If collection is expected in one
year or less (or in the normal operating
cycle of the business, if longer), they are
classified as current assets. If not, they
are presented as non-current assets.
Accounts receivable are recognized
initially at fair value and subsequently
measured at amortized cost using the
effective interest method, less provision
for impairment.
The Company maintains an allowance
for doubtful accounts to provide for
impairment of trade receivables. The
expense relating to doubtful accounts is
included within “Selling and administrative
expenses” in the consolidated income
statements.
InventoriesInventories are valued at the lower of cost
and net realizable value.
Cost of equipment, repair and distribu-
tion parts and direct materials include
purchase cost and costs incurred in
bringing each product to its present location
and condition. Serialized inventory is
determined on a specific-item basis.
Non-serialized inventory is determined
based on a weighted average actual cost.
Cost of work-in-process includes cost
of direct materials, labour and an allocation
of manufacturing overheads, excluding
borrowing costs, based on normal
operating capacity.
Cost of inventories includes the transfer
of gains and losses on qualifying cash flow
hedges, recognized in other comprehensive
income, in respect of the purchase of
inventory.
Net realizable value is the estimated
selling price in the ordinary course of
business, less estimated costs of comple-
tion and the estimated costs necessary
to make the sale.
Property, Plant and EquipmentProperty, plant and equipment are recorded
at cost, net of accumulated depreciation
and accumulated impairment losses, if any.
Depreciation is recognized principally
on a straight-line basis over the estimated
useful lives of the assets. Estimated useful
lives range from 20 to 30 years for buildings,
three to 10 years for equipment and
20 years for power generation assets.
Leasehold improvements and lease
inducements are amortized on a straight-
line basis over the term of the lease. Land is
not depreciated.
The assets’ residual values, useful lives
and methods of depreciation are reviewed
at each financial year end and adjusted
prospectively, if appropriate.
Rental EquipmentRental equipment is recorded at cost, net of
accumulated depreciation and accumulated
impairment losses, if any. Depreciation is
recognized principally on a straight-line
basis over the estimated useful lives of the
assets, which range from one to 10 years.
Intangible AssetsIntangible assets acquired separately are
measured on initial recognition at cost.
Following initial recognition, intangible assets
are carried at cost less any accumulated
amortization and accumulated impairment
losses. The useful lives of intangible assets
are assessed as either finite or indefinite.
The assessment of indefinite life is reviewed
annually to determine whether the indefinite
life continues to be supportable. Intangible
assets with indefinite useful lives are not
amortized, but are tested for impairment
annually. Intangible assets with a definite
useful life are amortized over a period of
17 years on a straight-line basis.
ProvisionsProvisions are recognized when the
Company has a present obligation, legal
or constructive, as a result of a past event,
it is probable that an outflow of resources
embodying economic benefits will be
required to settle the obligation and a
reliable estimate can be made of the
amount of the obligation.
Provisions for warranty costs are
recognized when the product is sold or
service provided. Initial recognition is
based on historical experience.
Financial InstrumentsThe Company determines the classification
of its financial assets and liabilities at initial
recognition. Initially, all financial assets and
liabilities are recognized at fair value.
Regular-way trades of financial assets and
liabilities are recognized on the trade date.
Transaction costs are expensed as incurred
except for loans and receivables and loans
and borrowings, in which case transaction
costs are included in initial cost.
Financial Assets
Subsequent measurement of financial assets
depends on the classification. The Company
has made the following classifications:
• Cash and cash equivalents are classified
as held for trading and as such are
measured at fair value, with changes in
fair value being included in profit or loss.

ANNUAL REPORT 2014
65
• Accounts receivable are classified as
loans and receivables and are recorded
at amortized cost using the effective
interest rate method, less provisions for
doubtful accounts.
• Derivatives are classified as held for
trading and are measured at fair value
with changes in fair value being included
in profit or loss, unless they are desig-
nated as hedging instruments, in which
case changes in fair value are included in
other comprehensive income.
The Company assesses at each statement
of financial position date, whether there is
any objective evidence that a financial asset
or a group of financial assets is impaired.
Financial Liabilities
Subsequent measurement of financial
liabilities depends on the classification.
The Company has made the following
classifications:
• Accounts payable and accrued liabilities
are classified as financial liabilities held
for trading and as such are measured at
fair value, with changes in fair value
being included in profit or loss.
• Long-term debt is classified as loans
and borrowings and as such is subse-
quently measured at amortized cost
using the effective interest rate method.
Discounts, premiums and fees on
acquisition are taken into account
in determining amortized cost.
• Derivatives are classified as held
for trading and are measured at fair
value with changes in fair value being
included in profit or loss, unless they
are designated as effective hedging
instruments, in which case changes
in fair value are included in other
comprehensive income.
Fair Value of Financial Instruments
The Company uses the following hierarchy
for determining and disclosing the fair value
of financial instruments by valuation
technique:
• Level 1 – unadjusted quoted prices
in active markets for identical assets
or liabilities.
• Level 2 – other techniques for which all
inputs that have a significant effect on
the recorded fair value are observable,
either directly or indirectly.
• Level 3 – techniques that use inputs
that have a significant effect on the
recorded fair value that are not based
on observable market data.
Derivative Financial Instruments and Hedge AccountingDerivative financial arrangements are used
to hedge exposure to fluctuations in
exchange rates. Such derivative financial
instruments are initially recognized at fair
value on the date on which a derivative
contract is entered into and are subse-
quently measured at fair value. Derivatives
are carried as financial assets when the fair
value is positive and as financial liabilities
when the fair value is negative.
Any gains or losses arising from changes
in the fair value of derivatives are taken
directly to the income statement, except for
the effective portion of cash flow hedges,
which is recognized in other comprehensive
income.
At inception, the Company designates
and documents the hedge relationship
including identification of the transaction
and the risk management objectives and
strategy for undertaking the hedge. The
Company also documents its assessment,
both at hedge inception and on an ongoing
basis, of whether the derivatives that are
used in hedging transactions are highly
effective in offsetting changes in fair values
or cash flows of hedged items.
The Company has designated certain
derivatives as cash flow hedges. These are
hedges of firm commitments and highly
probable forecast transactions. The
effective portion of changes in the fair value
of derivatives that are designated as a cash
flow hedge is recognized in other compre-
hensive income. The gain or loss relating
to the ineffective portion is recognized
immediately in the income statement.
Additionally:
• If a hedge of a forecast transaction
subsequently results in the recognition
of a non-financial asset, the associated
gains or losses that were recognized in
other comprehensive income are
included in the initial cost or other
carrying amount of the asset;
• For cash flow hedges other than those
identified above, amounts accumulated
in other comprehensive income are
recycled to the income statement in the
period when the hedged item will affect
earnings (for instance, when the
forecast sale that is hedged takes
place);
• When a hedging instrument expires or
is sold, or when a hedge no longer
meets the criteria for hedge accounting,
any cumulative gain or loss in other
comprehensive income remains in other
comprehensive income and is recog-
nized when the forecast transaction is
ultimately recognized in the income
statement; and
• When a forecast transaction is no longer
expected to occur, the cumulative gain
or loss that was reported in other
comprehensive income is immediately
recognized in the income statement.
Impairment of Non-financial AssetsThe Company assesses at each reporting
date whether there is an indication that an
asset may be impaired. If any indication
exists, or when annual impairment testing
for an asset is required, the Company
estimates the asset’s recoverable amount.
The recoverable amount is the higher of an
asset’s fair value less costs to sell and its
value in use. For the purpose of assessing
impairment, assets are grouped at the
lowest levels for which there are separately
identifiable cash flows (CGUs). In determin-
ing fair value less costs to sell, recent
market transactions are taken into account,
if available. In assessing value in use, the
estimated future cash flows are discounted
to their present value using a pre-tax
discount rate that reflects current market
assessments of the time value of money
and the risks specific to the asset. An
impairment loss is recognized for the
amount by which the asset’s carrying
TOROMONT
66
amount exceeds its recoverable amount.
Impairment losses are recognized in the
income statement.
The Company bases its impairment
calculation on detailed budgets which are
prepared for each of the CGUs and generally
cover a period of three years. For longer
periods, a long-term growth rate is calcu-
lated and applied to project future cash
flows after the third year.
For assets other than goodwill, an
assessment is made at each reporting
date whether there is any indication that
previously recognized impairment losses
may no longer exist or may have
decreased. If such indication exists, the
Company estimates the asset’s recover-
able amount. A previously recognized
impairment loss is reversed only if there
has been a change in the assumptions
used to determine the asset’s recoverable
amount since the last impairment loss
was recognized. The reversal is limited so
that the carrying amount of the asset
does not exceed its recoverable amount,
nor exceed the carrying amount that
would have been determined, net of
depreciation, had no impairment loss
been recognized for the asset in prior
years. Such reversal is recognized in the
income statement.
Goodwill is tested for impairment
annually during the fourth quarter of the
year and when circumstances indicate that
the carrying value may be impaired.
Revenue RecognitionRevenue is recognized to the extent that it
is probable that the economic benefits will
flow to the Company and the revenue can
be reliably measured. Revenue is measured
at the fair value of the consideration
received, excluding discounts, rebates,
sales taxes and duty. The following specific
recognition criteria must also be met
before revenue is recognized:
• Revenues from the sale of equipment
are recognized when the significant risks
and rewards of ownership of the goods
have passed to the buyer, usually on
shipment of the goods and/or invoicing.
• The sale of equipment for which the
Company has provided a guarantee to
repurchase the equipment at predeter-
mined residual values and dates are
accounted for as operating leases.
Revenues are recognized over the
period extending to the date of the
residual value guarantee.
• Revenues from the sale of equipment
systems involving design, manufacture,
installation and start-up are recorded
using the percentage-of-completion
method. Percentage-of-completion is
normally measured by reference to
costs incurred to date as a percentage
of total estimated cost for each
contract. Any foreseeable losses on
such projects are recognized immedi-
ately in profit or loss as identified.
• Revenues from equipment rentals are
recognized in accordance with the
terms of the relevant agreement with
the customer, generally on a straight-
line basis over the term of the
agreement.
• Product support services include sales
of parts and servicing of equipment. For
the sale of parts, revenues are recog-
nized when the part is shipped to the
customer. For servicing of equipment,
revenues are recognized on completion
of the service work.
• Revenues from long-term maintenance
contracts and separately priced
extended warranty contracts are
recognized on a percentage-of-comple-
tion basis proportionate to the service
work that has been performed based on
the parts and labour service provided.
Any losses estimated during the term
of the contract are recognized when
identified. At the completion of the
contract, any remaining profit on the
contract is recognized as revenue.
• Interest income is recognized using
the effective interest method.
Foreign Currency TranslationThe functional and presentation currency of
the Company is the Canadian dollar. Each of
the Company’s subsidiaries determines its
functional currency and items included in
the financial statements of each subsidiary
are measured using that functional
currency.
Transactions in foreign currencies are
initially recorded at the functional currency
rate prevailing at the date of the transaction
or at the average rate for the period when
this is a reasonable approximation.
Monetary assets and liabilities denominated
in foreign currencies are retranslated at the
functional currency spot rate of exchange
as at the reporting date. All differences are
taken directly to profit or loss. Non-
monetary items that are measured in terms
of historical cost in a foreign currency are
translated using the exchange rates as at
the dates of the initial transactions.
The assets and liabilities of foreign
operations (having a functional currency
other than the Canadian dollar) are
translated into Canadian dollars at the rate
of exchange prevailing at the statement of
financial position date and the income
statement are translated at the average
exchange rate for the period. The exchange
differences arising on translation are
recognized in accumulated other compre-
hensive income in shareholders’ equity. On
disposal of a foreign operation, the deferred
cumulative amount recognized in equity is
recognized in the income statement.
Share-based Payment TransactionsThe Company operates both equity-settled
and cash-settled share-based compensa-
tion plans under which the Company
receives services from employees, including
senior executives and directors, as consid-
eration for equity instruments of the
Company.
For equity-settled plans, which are no
longer available to non-employee directors,
expense is based on the fair value of the
awards granted determined using the
Black-Scholes option pricing model and the
best estimate of the number of equity
instruments that will ultimately vest. For
awards with graded vesting, each tranche is
considered to be a separate grant based on
its respective vesting period. The fair value
ANNUAL REPORT 2014
67
of each tranche is determined separately
on the date of grant and is recognized as
stock-based compensation expense, net
of forfeiture estimate, over the term of its
respective vesting period.
For cash-settled plans, the expense is
determined based on the fair value of the
liability incurred at each award date and at
each subsequent statement of financial
position date until the award is settled.
The fair value of the liability is measured
by applying quoted market prices. Changes
in fair value are recognized in the income
statement in selling and administrative
expenses.
Employee Future BenefitsFor defined contribution plans, the pension
expense recorded in the income statement
is the amount of the contributions the
Company is required to pay in accordance
with the terms of the plans.
For defined benefit plans, the pension
expense is determined separately for each
plan using the following policies:
• The cost of pensions earned by
employees is actuarially determined
using the projected unit credit method
pro-rated on length of service and
management’s best estimate assump-
tions to value its pensions using a
measurement date of December 31;
• Net interest is calculated by applying
the discount rate to the net defined
benefit liability or asset;
• Past service costs from plan amend-
ments are recognized immediately in
net earnings to the extent that the
benefits have vested; otherwise, they
are amortized on a straight-line basis
over the vesting period; and
• Actuarial gains and losses arising from
experience adjustments and changes in
actuarial assumptions are recognized in
retained earnings and included in the
statement of comprehensive income in
the period in which they occur.
Income TaxesCurrent income tax assets and liabilities are
measured at the amount expected to be
recovered from or paid to the taxation
authorities.
Deferred taxes are provided using the
liability method on temporary differences
between the tax bases of assets and
liabilities and their carrying amounts for
financial reporting purposes at the reporting
date. Deferred tax assets and liabilities are
measured using enacted or substantively
enacted income tax rates expected to apply
to taxable income in the years in which those
temporary differences are expected to be
recovered or settled. The effect on deferred
tax assets and liabilities of a change in
income tax rates is recognized in the income
statement in the period that includes
the date of substantive enactment. The
Company assesses recoverability of deferred
tax assets based on the Company’s
estimates and assumptions. Deferred tax
assets are recorded at an amount that the
Company considers probable to be realized.
Current and deferred income taxes
relating to items recognized directly in
shareholders’ equity are also recognized
directly in shareholders’ equity.
LeasesThe determination of whether an arrange-
ment is, or contains, a lease is based on the
substance of the arrangement at inception
date. Leases which transfer substantially
all of the benefits and risks of ownership
of the property to the lessee are classified
as finance leases; all other leases are
classified as operating leases. Classification
is re-assessed if the terms of the lease
are changed.
Toromont as Lessee
Operating lease payments are recognized
as an operating expense in the income
statement on a straight-line basis over the
lease term. Benefits received and receiv-
able as an incentive to enter into an
operating lease are deferred and amortized
on a straight-line basis over the term of
the lease.
Toromont as Lessor
Rental income from operating leases is
recognized on a straight-line basis over the
term of the relevant lease. Initial direct costs
incurred in negotiating and arranging an
operating lease are added to the carrying
amount of the leased asset and recognized
on a straight-line basis over the lease term.
Borrowing CostsBorrowing costs directly attributable to
the acquisition, construction or production
of an asset that necessarily takes a
substantial period of time to get ready for
its intended use or sale are capitalized as
part of the cost of the respective asset.
All other borrowing costs are expensed
in the period they occur.
Standards Adopted in 2014Certain amendments to standards and a
new interpretation that were adopted on
January 1, 2014 are noted below.
a. IAS 36 – Impairment of Assets
The amendment reverses the unintended
requirement in IFRS 13 – Fair Value
Measurement, to disclose the recoverable
amount of each CGU to which significant
goodwill or indefinite-lived intangible assets
have been allocated. Under the amendment,
recoverable amount is required to be
disclosed only when an impairment loss has
been recognized or reversed. The amend-
ment affects presentation only and had no
impact on the Company’s financial position
or performance.
b. IAS 32 – Financial Instruments:
Presentation
These amendments clarify the require-
ments relating to the offset of financial
assets and financial liabilities. Specifically,
the amendments clarify the meaning of
‘currently has a legally enforceable right to
set-off’ and ‘simultaneous realization and
settlement’. These amendments had no
impact on the Company’s financial position
or performance.
TOROMONT
68
c. International Financial Reporting
Interpretations Committee (“IFRIC”)
21 – Levies
IFRIC 21 provides guidance on when to
recognize a liability to pay a levy imposed
by the government that is accounted for
in accordance with IAS 37 – Provisions,
Contingent Liabilities and Contingent
Assets. The application of IFRIC 21 had
no impact on the Company’s financial
position or performance.
Standards Issued But Not Yet EffectiveA number of new standards and amend-
ments to standards have been issued but are
not yet effective for the financial year ended
December 31, 2014, and accordingly, have
not been applied in preparing these consoli-
dated financial statements.
a. Revenue Recognition
In May 2014, the IASB issued IFRS 15 –
Revenue from Contracts with Customers,
which establishes a single comprehensive
model for entities to use in accounting for
revenue arising from contracts with
customers. Under IFRS 15 revenue is
recognized at an amount that reflects the
consideration to which an entity expects
to be entitled in exchange for transferring
goods or services to a customer. The
principles in IFRS 15 provide a more
structured approach to measuring and
recognizing revenue.
The new revenue standard is applicable
to all entities and will supersede all current
revenue recognition requirements under
IFRS. Either a full or modified retrospective
application is required for annual periods
beginning on or after January 1, 2017, with
early adoption permitted. The Company is
currently assessing the impact of adopting
this interpretation on its consolidated
financial statements.
b. Financial Instruments
In July 2014, the IASB issued the final
version of IFRS 9 – Financial Instruments,
which replaces all phases of the financial
instruments project, IAS 39 – Financial
Instruments: Recognition and Measurement
and all previous versions of IFRS 9. The
standard introduces new requirements for
classification and measurement, impair-
ment, and hedge accounting.
The new standard is effective for annual
periods beginning on or after January 1,
2018, with early adoption permitted. The
Company is currently assessing the impact
of adopting this interpretation on its
consolidated financial statements.
c. Employee Benefits
The amendments to IAS 19 – Employee
Benefits, require an entity to consider
contributions from employees or third
parties when accounting for defined benefit
plans. Where the contributions are linked to
service, they should be attributed to periods
of service as a negative benefit. These
amendments clarify that, if the amount
of the contributions is independent of the
number of years of service, an entity is
permitted to recognize such contributions
as a reduction in the service cost in the
period in which the service is rendered,
instead of allocating the contributions
to the periods of service.
This amendment is effective for annual
periods beginning on or after July 1, 2014.
The Company is currently assessing the
impact of these amendments on its
consolidated financial statements.
The preparation of the Company’s consoli-
dated financial statements in conformity
with IFRS requires management to make
judgments, estimates and assumptions that
affect the reported amounts of revenues,
expenses, assets and liabilities, and the
disclosure of contingent liabilities at the end
of the reporting period. However, uncer-
tainty about these assumptions and
estimates could result in outcomes that
require a material adjustment to the
carrying amount of the asset or liability
affected in future periods.
In making estimates and judgments,
management relies on external informa-
tion and observable conditions where
possible, supplemented by internal
analysis as required. Management reviews
its estimates and judgments on an
ongoing basis.
In the process of applying the
Company’s accounting policies, manage-
ment has made the following judgments,
estimates and assumptions which have the
most significant effect on the amounts
recognized in the consolidated financial
statements.
Acquisitions
Management applied judgment relating to
its acquisitions with respect to whether the
acquisitions were a business combination
or an asset acquisition. Management
applied a three-element process to
determine whether a business or an asset
was purchased, considering inputs,
processes and outputs of the respective
acquisitions in order to reach a conclusion.
Property, Plant and Equipment and Rental EquipmentDepreciation is calculated based on the
estimated useful lives of the assets and
estimated residual values.
Impairment of Non-financial AssetsImpairment exists when the carrying value
of an asset or CGU exceeds its recoverable
amount, which is the higher of its fair value
less costs of disposal and its value in use.
The fair value less costs of disposal
2. Significant Accounting Estimates and Assumptions
ANNUAL REPORT 2014
69
calculation is based on available data from
binding sales transactions, conducted at
arm’s length, for similar assets or observ-
able market prices less incremental costs
for disposing of the asset. The value in use
calculation is based on a discounted cash
flow (“DCF”) model. The cash flows are
derived from the budget for the next three
years and do not include restructuring
activities that the Company is not yet
committed to or significant future invest-
ments that will enhance the asset’s
performance of the CGU being tested.
The recoverable amount is sensitive to the
discount rate used for the DCF model as
well as the expected future cash-inflows
and the growth rate used for extrapolation
purposes. The key assumptions used to
determine the recoverable amount for the
different CGUs, including a sensitivity
analysis, are disclosed and further
explained in note 7.
Changes in circumstances, such as
technological advances and changes to
business strategy, can result in actual
useful lives, residual values and future cash
flows differing significantly from estimates.
The assumptions used are reviewed on an
ongoing basis to ensure they continue to
be appropriate.
Income TaxesEstimates and judgments are made for
uncertainties which exist with respect to
the interpretation of complex tax regula-
tions, changes in tax laws, and the amount
and timing of future taxable income.
Revenue Recognition
The Company generates revenue from the
assembly and manufacture of equipment
using the percentage-of-completion
method. This method requires manage-
ment to make a number of estimates and
assumptions surrounding: the expected
profitability of the contract; the estimated
degree of completion based on cost
progression; and other detailed factors.
Although these factors are routinely
reviewed as part of the project manage-
ment process, changes in these estimates
or assumptions could lead to changes in
revenues recognized in a given period.
The Company also generates revenue
from long-term maintenance and repair
contracts whereby it is obligated to
maintain equipment for its customers. The
contracts are typically fixed price on either
machine hours or cost per hour, with
provisions for inflationary and exchange
adjustments. Revenue is recognized using
the percentage-of-completion method
based on work completed. This method
requires management to make a number of
estimates and assumptions surrounding:
machine usage, machine performance,
future parts and labour pricing, manufac-
turers’ warranty coverage and other
detailed factors. These factors are routinely
reviewed as part of the contract manage-
ment process; however, changes in these
estimates or assumptions could lead to
changes in the revenues and cost of goods
sold recognized in a given period.
InventoriesManagement is required to make an
assessment of the net realizable value
of inventory at each reporting period.
Management incorporates estimates and
judgments that take into account current
market prices, current economic trends
and past experience in the measurement
of net realizable value.
Employee Future Benefits ExpenseThe net obligations associated with the
defined benefit pension plans are actuarially
valued using: the projected unit credit
method; the current market discount rate,
salary escalation, life expectancy and future
pension increases. All assumptions are
reviewed at each reporting date.
Share-based CompensationEstimating the fair value for share-based
payment transactions requires determin-
ing the most appropriate inputs to the
valuation model including: the expected
life of the share option; volatility; and
dividend yield.
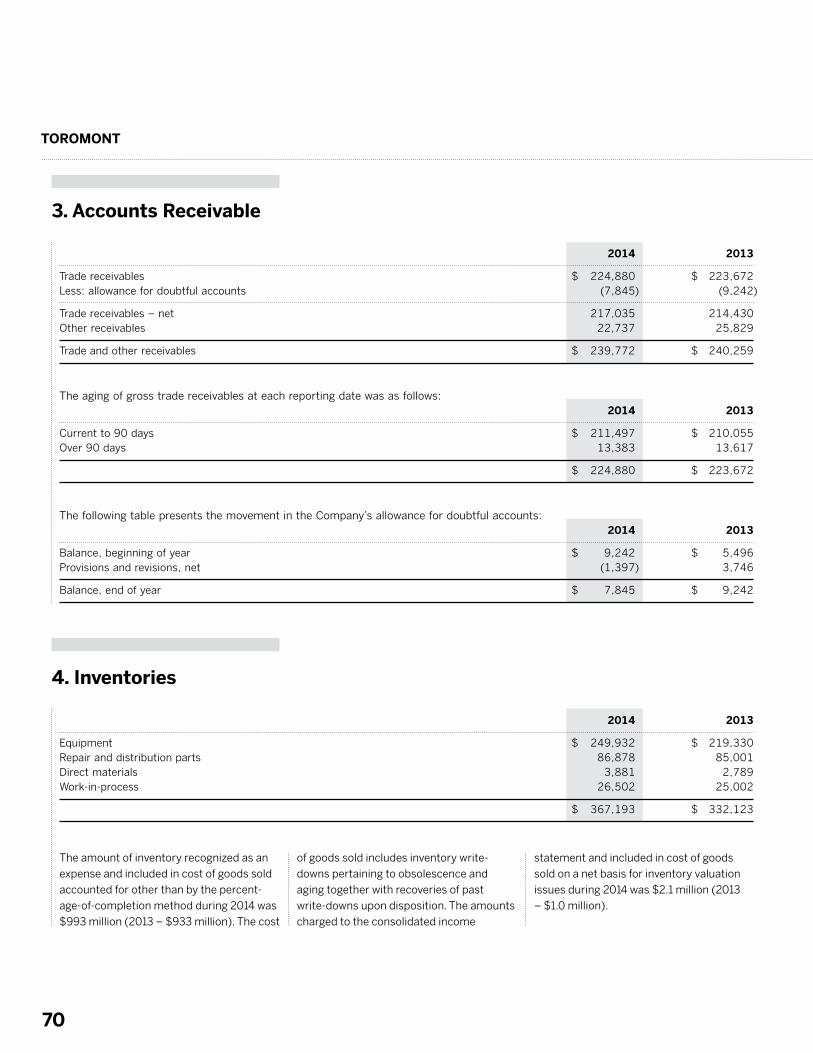
TOROMONT
70
2014 2013
Trade receivables $ 224,880 $ 223,672 Less: allowance for doubtful accounts (7,845) (9,242)
Trade receivables – net 217,035 214,430 Other receivables 22,737 25,829
Trade and other receivables $ 239,772 $ 240,259
The aging of gross trade receivables at each reporting date was as follows: 2014 2013
Current to 90 days $ 211,497 $ 210,055 Over 90 days 13,383 13,617
$ 224,880 $ 223,672
The following table presents the movement in the Company’s allowance for doubtful accounts: 2014 2013
Balance, beginning of year $ 9,242 $ 5,496 Provisions and revisions, net (1,397) 3,746
Balance, end of year $ 7,845 $ 9,242
2014 2013
Equipment $ 249,932 $ 219,330 Repair and distribution parts 86,878 85,001 Direct materials 3,881 2,789 Work-in-process 26,502 25,002
$ 367,193 $ 332,123
3. Accounts Receivable
4. Inventories
The amount of inventory recognized as an
expense and included in cost of goods sold
accounted for other than by the percent-
age-of-completion method during 2014 was
$993 million (2013 – $933 million). The cost
of goods sold includes inventory write-
downs pertaining to obsolescence and
aging together with recoveries of past
write-downs upon disposition. The amounts
charged to the consolidated income
statement and included in cost of goods
sold on a net basis for inventory valuation
issues during 2014 was $2.1 million (2013
– $1.0 million).
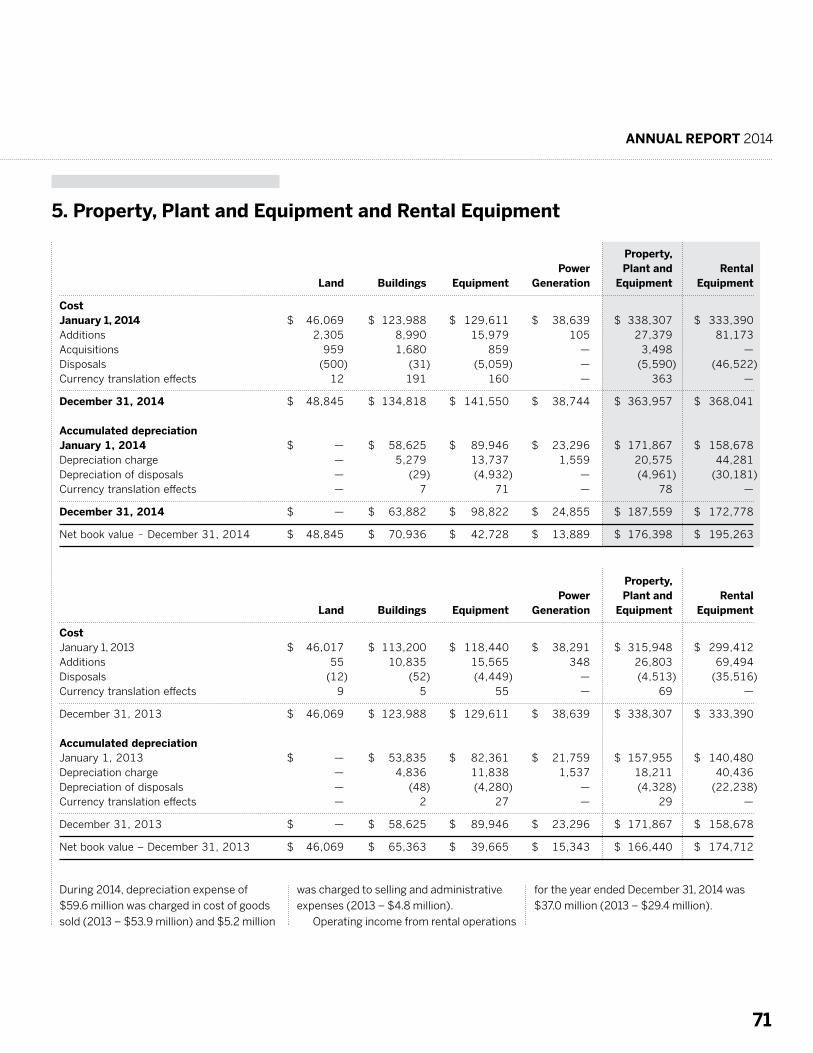
ANNUAL REPORT 2014
71
5. Property, Plant and Equipment and Rental Equipment
During 2014, depreciation expense of
$59.6 million was charged in cost of goods
sold (2013 – $53.9 million) and $5.2 million
was charged to selling and administrative
expenses (2013 – $4.8 million).
Operating income from rental operations
for the year ended December 31, 2014 was
$37.0 million (2013 – $29.4 million).
Property, Power Plant and Rental Land Buildings Equipment Generation Equipment Equipment
Cost January 1, 2014 $ 46,069 $ 123,988 $ 129,611 $ 38,639 $ 338,307 $ 333,390 Additions 2,305 8,990 15,979 105 27,379 81,173 Acquisitions 959 1,680 859 — 3,498 — Disposals (500) (31) (5,059) — (5,590) (46,522) Currency translation effects 12 191 160 — 363 —
December 31, 2014 $ 48,845 $ 134,818 $ 141,550 $ 38,744 $ 363,957 $ 368,041 Accumulated depreciation January 1, 2014 $ — $ 58,625 $ 89,946 $ 23,296 $ 171,867 $ 158,678 Depreciation charge — 5,279 13,737 1,559 20,575 44,281 Depreciation of disposals — (29) (4,932) — (4,961) (30,181) Currency translation effects — 7 71 — 78 —
December 31, 2014 $ — $ 63,882 $ 98,822 $ 24,855 $ 187,559 $ 172,778
Net book value – December 31, 2014 $ 48,845 $ 70,936 $ 42,728 $ 13,889 $ 176,398 $ 195,263
Property, Power Plant and Rental Land Buildings Equipment Generation Equipment Equipment
Cost January 1, 2013 $ 46,017 $ 113,200 $ 118,440 $ 38,291 $ 315,948 $ 299,412 Additions 55 10,835 15,565 348 26,803 69,494 Disposals (12) (52) (4,449) — (4,513) (35,516) Currency translation effects 9 5 55 — 69 —
December 31, 2013 $ 46,069 $ 123,988 $ 129,611 $ 38,639 $ 338,307 $ 333,390 Accumulated depreciation January 1, 2013 $ — $ 53,835 $ 82,361 $ 21,759 $ 157,955 $ 140,480 Depreciation charge — 4,836 11,838 1,537 18,211 40,436 Depreciation of disposals — (48) (4,280) — (4,328) (22,238) Currency translation effects — 2 27 — 29 —
December 31, 2013 $ — $ 58,625 $ 89,946 $ 23,296 $ 171,867 $ 158,678
Net book value – December 31, 2013 $ 46,069 $ 65,363 $ 39,665 $ 15,343 $ 166,440 $ 174,712
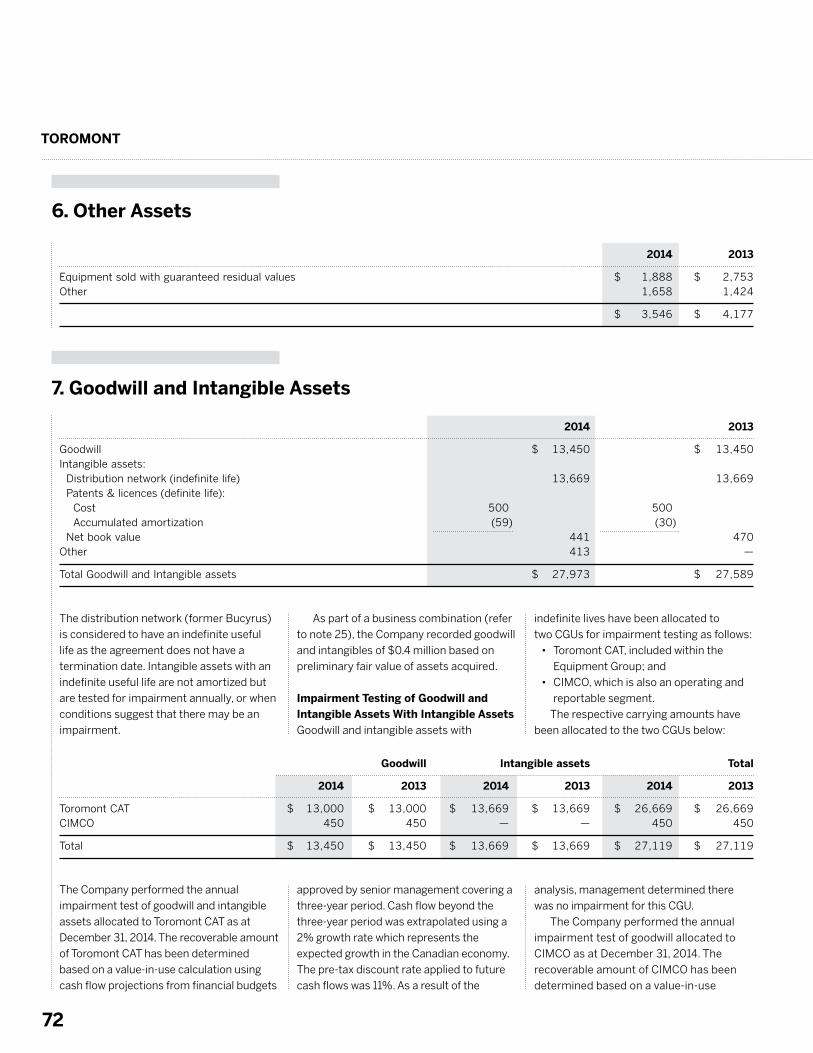
TOROMONT
72
6. Other Assets
7. Goodwill and Intangible Assets
2014 2013
Equipment sold with guaranteed residual values $ 1,888 $ 2,753 Other 1,658 1,424
$ 3,546 $ 4,177
Goodwill Intangible assets Total
2014 2013 2014 2013 2014 2013
Toromont CAT $ 13,000 $ 13,000 $ 13,669 $ 13,669 $ 26,669 $ 26,669 CIMCO 450 450 — — 450 450
Total $ 13,450 $ 13,450 $ 13,669 $ 13,669 $ 27,119 $ 27,119
2014 2013
Goodwill $ 13,450 $ 13,450 Intangible assets: Distribution network (indefinite life) 13,669 13,669 Patents & licences (definite life): Cost 500 500 Accumulated amortization (59) (30) Net book value 441 470 Other 413 —
Total Goodwill and Intangible assets $ 27,973 $ 27,589
The distribution network (former Bucyrus)
is considered to have an indefinite useful
life as the agreement does not have a
termination date. Intangible assets with an
indefinite useful life are not amortized but
are tested for impairment annually, or when
conditions suggest that there may be an
impairment.
The Company performed the annual
impairment test of goodwill and intangible
assets allocated to Toromont CAT as at
December 31, 2014. The recoverable amount
of Toromont CAT has been determined
based on a value-in-use calculation using
cash flow projections from financial budgets
As part of a business combination (refer
to note 25), the Company recorded goodwill
and intangibles of $0.4 million based on
preliminary fair value of assets acquired.
Impairment Testing of Goodwill and Intangible Assets With Intangible AssetsGoodwill and intangible assets with
approved by senior management covering a
three-year period. Cash flow beyond the
three-year period was extrapolated using a
2% growth rate which represents the
expected growth in the Canadian economy.
The pre-tax discount rate applied to future
cash flows was 11%. As a result of the
indefinite lives have been allocated to
two CGUs for impairment testing as follows:
• Toromont CAT, included within the
Equipment Group; and
• CIMCO, which is also an operating and
reportable segment.
The respective carrying amounts have
been allocated to the two CGUs below:
analysis, management determined there
was no impairment for this CGU.
The Company performed the annual
impairment test of goodwill allocated to
CIMCO as at December 31, 2014. The
recoverable amount of CIMCO has been
determined based on a value-in-use
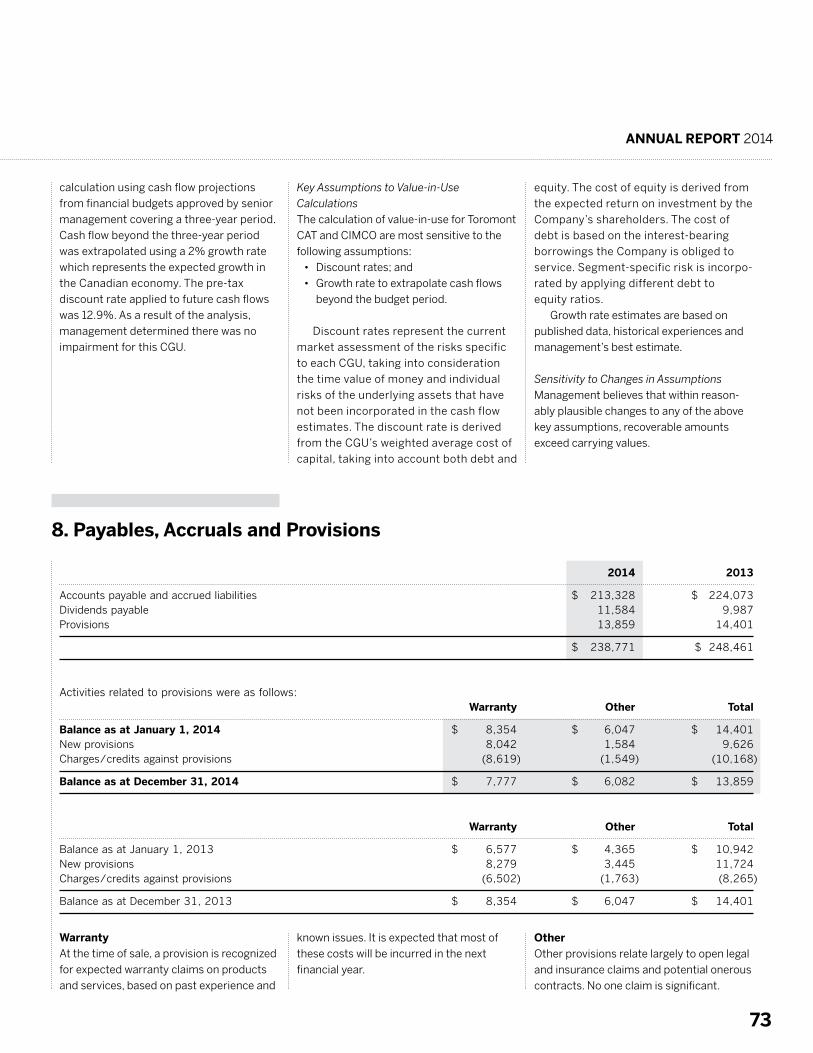
ANNUAL REPORT 2014
73
calculation using cash flow projections
from financial budgets approved by senior
management covering a three-year period.
Cash flow beyond the three-year period
was extrapolated using a 2% growth rate
which represents the expected growth in
the Canadian economy. The pre-tax
discount rate applied to future cash flows
was 12.9%. As a result of the analysis,
management determined there was no
impairment for this CGU.
WarrantyAt the time of sale, a provision is recognized
for expected warranty claims on products
and services, based on past experience and
Key Assumptions to Value-in-Use
Calculations
The calculation of value-in-use for Toromont
CAT and CIMCO are most sensitive to the
following assumptions:
• Discount rates; and
• Growth rate to extrapolate cash flows
beyond the budget period.
Discount rates represent the current
market assessment of the risks specific
to each CGU, taking into consideration
the time value of money and individual
risks of the underlying assets that have
not been incorporated in the cash flow
estimates. The discount rate is derived
from the CGU’s weighted average cost of
capital, taking into account both debt and
known issues. It is expected that most of
these costs will be incurred in the next
financial year.
equity. The cost of equity is derived from
the expected return on investment by the
Company’s shareholders. The cost of
debt is based on the interest-bearing
borrowings the Company is obliged to
service. Segment-specific risk is incorpo-
rated by applying different debt to
equity ratios.
Growth rate estimates are based on
published data, historical experiences and
management’s best estimate.
Sensitivity to Changes in Assumptions
Management believes that within reason-
ably plausible changes to any of the above
key assumptions, recoverable amounts
exceed carrying values.
OtherOther provisions relate largely to open legal
and insurance claims and potential onerous
contracts. No one claim is significant.
8. Payables, Accruals and Provisions
2014 2013
Accounts payable and accrued liabilities $ 213,328 $ 224,073 Dividends payable 11,584 9,987 Provisions 13,859 14,401
$ 238,771 $ 248,461
Activities related to provisions were as follows: Warranty Other Total
Balance as at January 1, 2014 $ 8,354 $ 6,047 $ 14,401 New provisions 8,042 1,584 9,626 Charges/credits against provisions (8,619) (1,549) (10,168)
Balance as at December 31, 2014 $ 7,777 $ 6,082 $ 13,859
Warranty Other Total
Balance as at January 1, 2013 $ 6,577 $ 4,365 $ 10,942 New provisions 8,279 3,445 11,724 Charges/credits against provisions (6,502) (1,763) (8,265)
Balance as at December 31, 2013 $ 8,354 $ 6,047 $ 14,401
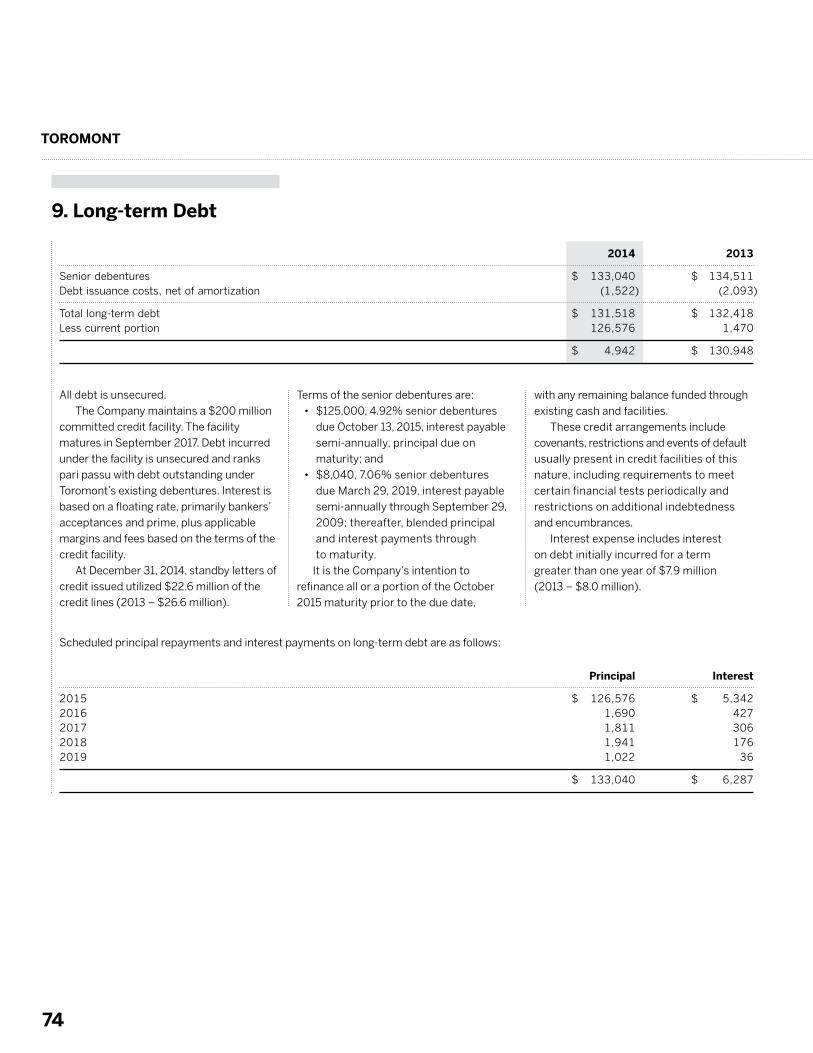
TOROMONT
74
2014 2013
Senior debentures $ 133,040 $ 134,511 Debt issuance costs, net of amortization (1,522) (2,093)
Total long-term debt $ 131,518 $ 132,418 Less current portion 126,576 1,470
$ 4,942 $ 130,948
Principal Interest
2015 $ 126,576 $ 5,342 2016 1,690 427 2017 1,811 306 2018 1,941 176 2019 1,022 36
$ 133,040 $ 6,287
9. Long-term Debt
All debt is unsecured.
The Company maintains a $200 million
committed credit facility. The facility
matures in September 2017. Debt incurred
under the facility is unsecured and ranks
pari passu with debt outstanding under
Toromont’s existing debentures. Interest is
based on a floating rate, primarily bankers’
acceptances and prime, plus applicable
margins and fees based on the terms of the
credit facility.
At December 31, 2014, standby letters of
credit issued utilized $22.6 million of the
credit lines (2013 – $26.6 million).
Scheduled principal repayments and interest payments on long-term debt are as follows:
Terms of the senior debentures are:
• $125,000, 4.92% senior debentures
due October 13, 2015, interest payable
semi-annually, principal due on
maturity; and
• $8,040, 7.06% senior debentures
due March 29, 2019, interest payable
semi-annually through September 29,
2009; thereafter, blended principal
and interest payments through
to maturity.
It is the Company’s intention to
refinance all or a portion of the October
2015 maturity prior to the due date,
with any remaining balance funded through
existing cash and facilities.
These credit arrangements include
covenants, restrictions and events of default
usually present in credit facilities of this
nature, including requirements to meet
certain financial tests periodically and
restrictions on additional indebtedness
and encumbrances.
Interest expense includes interest
on debt initially incurred for a term
greater than one year of $7.9 million
(2013 – $8.0 million).
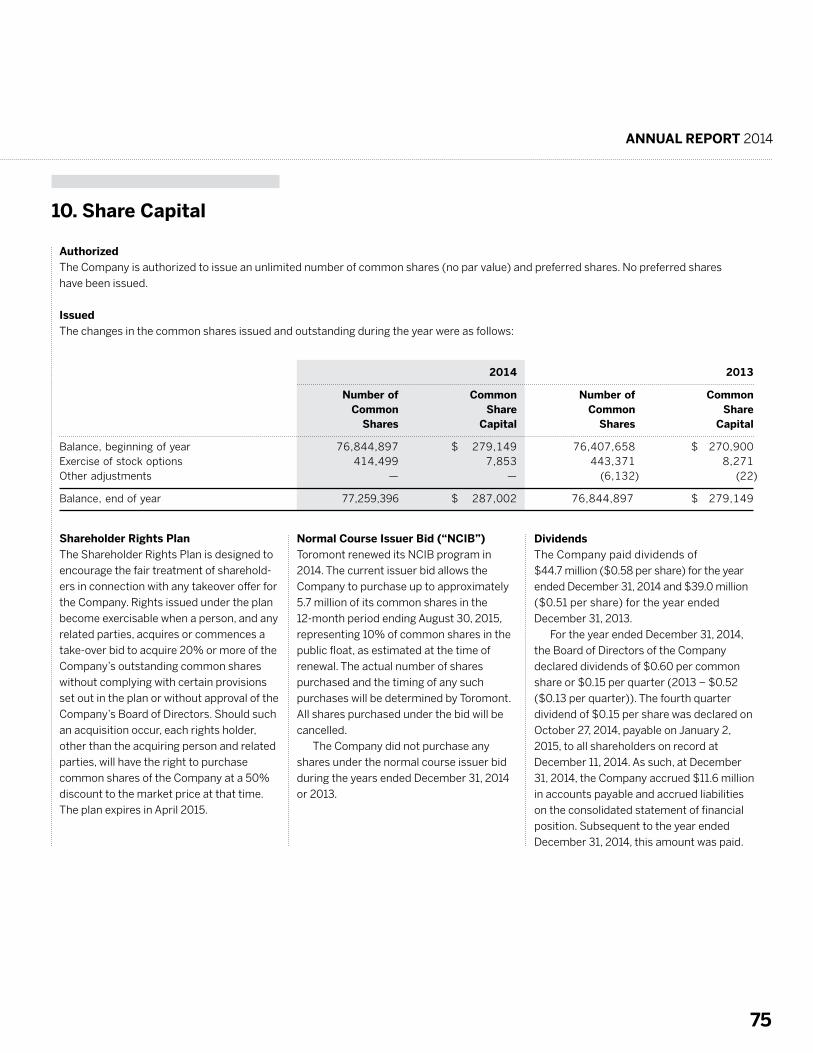
ANNUAL REPORT 2014
75
2014 2013
Number of Common Number of Common
Common Share Common Share
Shares Capital Shares Capital
Balance, beginning of year 76,844,897 $ 279,149 76,407,658 $ 270,900 Exercise of stock options 414,499 7,853 443,371 8,271 Other adjustments — — (6,132) (22)
Balance, end of year 77,259,396 $ 287,002 76,844,897 $ 279,149
10. Share Capital
Shareholder Rights PlanThe Shareholder Rights Plan is designed to
encourage the fair treatment of sharehold-
ers in connection with any takeover offer for
the Company. Rights issued under the plan
become exercisable when a person, and any
related parties, acquires or commences a
take-over bid to acquire 20% or more of the
Company’s outstanding common shares
without complying with certain provisions
set out in the plan or without approval of the
Company’s Board of Directors. Should such
an acquisition occur, each rights holder,
other than the acquiring person and related
parties, will have the right to purchase
common shares of the Company at a 50%
discount to the market price at that time.
The plan expires in April 2015.
AuthorizedThe Company is authorized to issue an unlimited number of common shares (no par value) and preferred shares. No preferred shares
have been issued.
IssuedThe changes in the common shares issued and outstanding during the year were as follows:
Normal Course Issuer Bid (“NCIB”) Toromont renewed its NCIB program in
2014. The current issuer bid allows the
Company to purchase up to approximately
5.7 million of its common shares in the
12-month period ending August 30, 2015,
representing 10% of common shares in the
public float, as estimated at the time of
renewal. The actual number of shares
purchased and the timing of any such
purchases will be determined by Toromont.
All shares purchased under the bid will be
cancelled.
The Company did not purchase any
shares under the normal course issuer bid
during the years ended December 31, 2014
or 2013.
DividendsThe Company paid dividends of
$44.7 million ($0.58 per share) for the year
ended December 31, 2014 and $39.0 million
($0.51 per share) for the year ended
December 31, 2013.
For the year ended December 31, 2014,
the Board of Directors of the Company
declared dividends of $0.60 per common
share or $0.15 per quarter (2013 – $0.52
($0.13 per quarter)). The fourth quarter
dividend of $0.15 per share was declared on
October 27, 2014, payable on January 2,
2015, to all shareholders on record at
December 11, 2014. As such, at December
31, 2014, the Company accrued $11.6 million
in accounts payable and accrued liabilities
on the consolidated statement of financial
position. Subsequent to the year ended
December 31, 2014, this amount was paid.
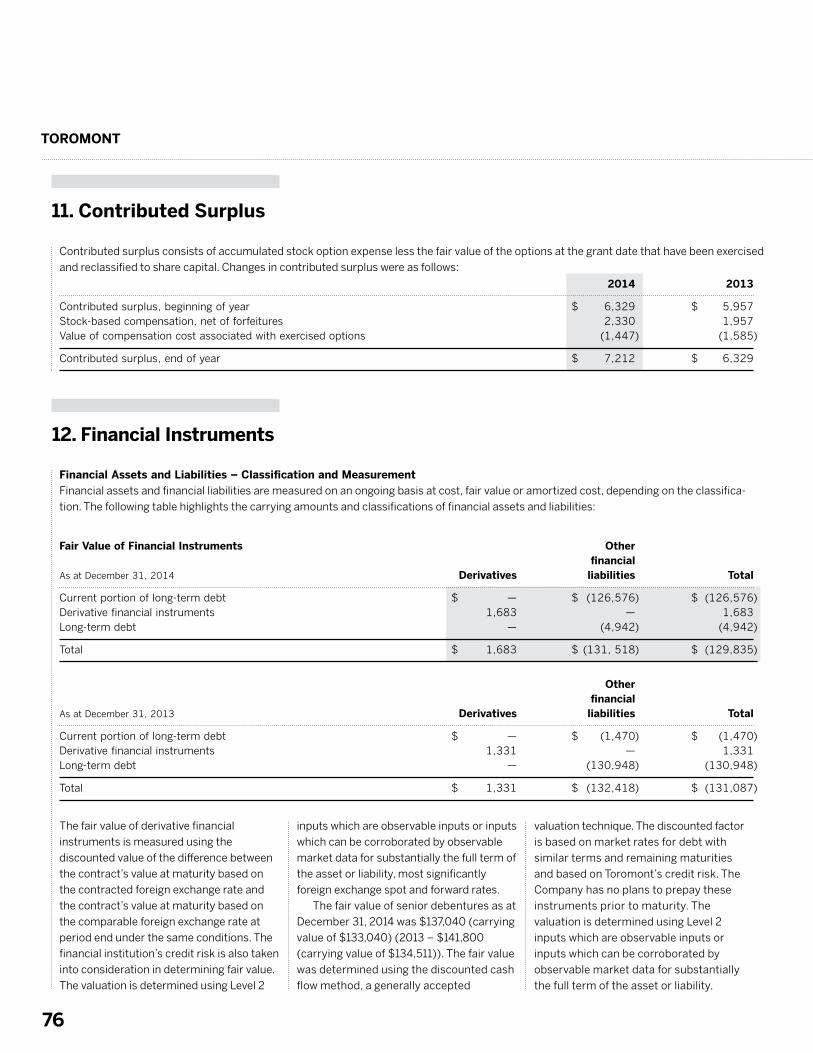
TOROMONT
76
2014 2013
Contributed surplus, beginning of year $ 6,329 $ 5,957 Stock-based compensation, net of forfeitures 2,330 1,957 Value of compensation cost associated with exercised options (1,447) (1,585)
Contributed surplus, end of year $ 7,212 $ 6,329
11. Contributed Surplus
12. Financial Instruments
Contributed surplus consists of accumulated stock option expense less the fair value of the options at the grant date that have been exercised
and reclassified to share capital. Changes in contributed surplus were as follows:
Financial Assets and Liabilities – Classification and MeasurementFinancial assets and financial liabilities are measured on an ongoing basis at cost, fair value or amortized cost, depending on the classifica-
tion. The following table highlights the carrying amounts and classifications of financial assets and liabilities:
Fair Value of Financial Instruments Other
financial
As at December 31, 2014 Derivatives liabilities Total
Current portion of long-term debt $ — $ (126,576) $ (126,576) Derivative financial instruments 1,683 — 1,683 Long-term debt — (4,942) (4,942)
Total $ 1,683 $ (131, 518) $ (129,835)
Other
financial
As at December 31, 2013 Derivatives liabilities Total
Current portion of long-term debt $ — $ (1,470) $ (1,470) Derivative financial instruments 1,331 — 1,331 Long-term debt — (130,948) (130,948)
Total $ 1,331 $ (132,418) $ (131,087)
The fair value of derivative financial
instruments is measured using the
discounted value of the difference between
the contract’s value at maturity based on
the contracted foreign exchange rate and
the contract’s value at maturity based on
the comparable foreign exchange rate at
period end under the same conditions. The
financial institution’s credit risk is also taken
into consideration in determining fair value.
The valuation is determined using Level 2
inputs which are observable inputs or inputs
which can be corroborated by observable
market data for substantially the full term of
the asset or liability, most significantly
foreign exchange spot and forward rates.
The fair value of senior debentures as at
December 31, 2014 was $137,040 (carrying
value of $133,040) (2013 – $141,800
(carrying value of $134,511)). The fair value
was determined using the discounted cash
flow method, a generally accepted
valuation technique. The discounted factor
is based on market rates for debt with
similar terms and remaining maturities
and based on Toromont’s credit risk. The
Company has no plans to prepay these
instruments prior to maturity. The
valuation is determined using Level 2
inputs which are observable inputs or
inputs which can be corroborated by
observable market data for substantially
the full term of the asset or liability.
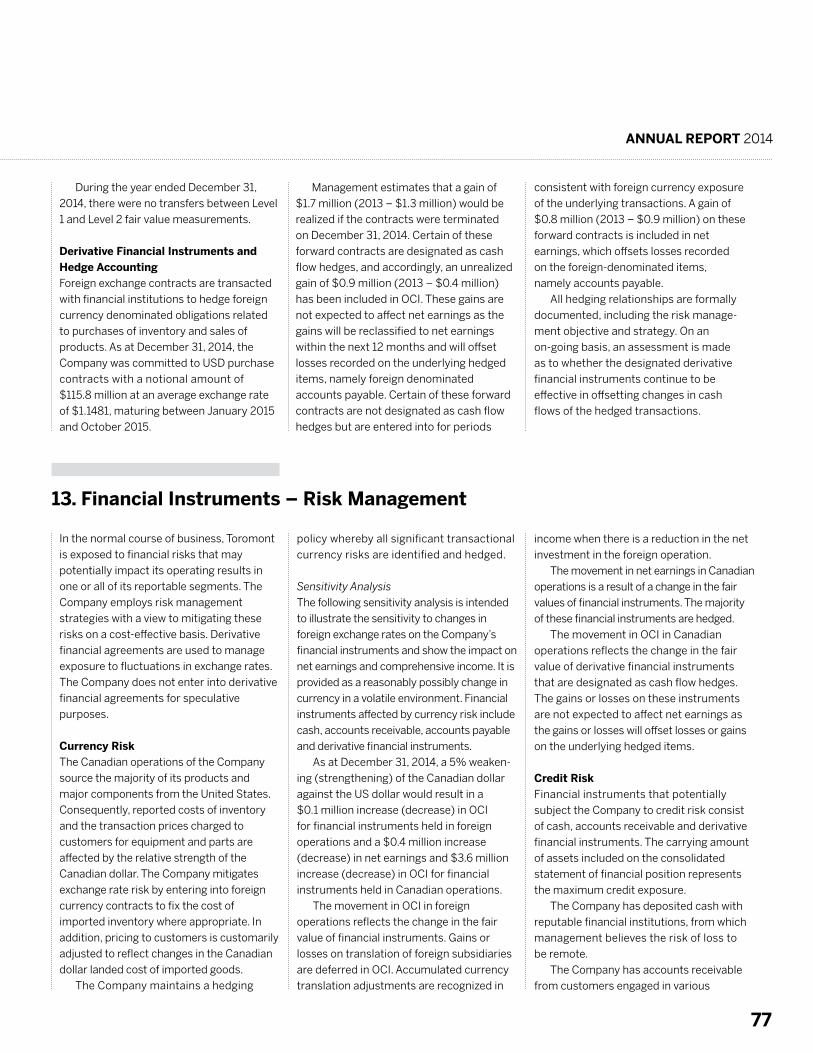
ANNUAL REPORT 2014
77
During the year ended December 31,
2014, there were no transfers between Level
1 and Level 2 fair value measurements.
Derivative Financial Instruments and Hedge AccountingForeign exchange contracts are transacted
with financial institutions to hedge foreign
currency denominated obligations related
to purchases of inventory and sales of
products. As at December 31, 2014, the
Company was committed to USD purchase
contracts with a notional amount of
$115.8 million at an average exchange rate
of $1.1481, maturing between January 2015
and October 2015.
Management estimates that a gain of
$1.7 million (2013 – $1.3 million) would be realized if the contracts were terminated on December 31, 2014. Certain of these forward contracts are designated as cash flow hedges, and accordingly, an unrealized gain of $0.9 million (2013 – $0.4 million) has been included in OCI. These gains are not expected to affect net earnings as the gains will be reclassified to net earnings within the next 12 months and will offset losses recorded on the underlying hedged items, namely foreign denominated accounts payable. Certain of these forward contracts are not designated as cash flow hedges but are entered into for periods
consistent with foreign currency exposure
of the underlying transactions. A gain of
$0.8 million (2013 – $0.9 million) on these
forward contracts is included in net
earnings, which offsets losses recorded
on the foreign-denominated items,
namely accounts payable.
All hedging relationships are formally
documented, including the risk manage-
ment objective and strategy. On an
on-going basis, an assessment is made
as to whether the designated derivative
financial instruments continue to be
effective in offsetting changes in cash
flows of the hedged transactions.
In the normal course of business, Toromont
is exposed to financial risks that may
potentially impact its operating results in
one or all of its reportable segments. The
Company employs risk management
strategies with a view to mitigating these
risks on a cost-effective basis. Derivative
financial agreements are used to manage
exposure to fluctuations in exchange rates.
The Company does not enter into derivative
financial agreements for speculative
purposes.
Currency RiskThe Canadian operations of the Company
source the majority of its products and
major components from the United States.
Consequently, reported costs of inventory
and the transaction prices charged to
customers for equipment and parts are
affected by the relative strength of the
Canadian dollar. The Company mitigates
exchange rate risk by entering into foreign
currency contracts to fix the cost of
imported inventory where appropriate. In
addition, pricing to customers is customarily
adjusted to reflect changes in the Canadian
dollar landed cost of imported goods.
The Company maintains a hedging
policy whereby all significant transactional
currency risks are identified and hedged.
Sensitivity Analysis The following sensitivity analysis is intended
to illustrate the sensitivity to changes in
foreign exchange rates on the Company’s
financial instruments and show the impact on
net earnings and comprehensive income. It is
provided as a reasonably possibly change in
currency in a volatile environment. Financial
instruments affected by currency risk include
cash, accounts receivable, accounts payable
and derivative financial instruments.
As at December 31, 2014, a 5% weaken-
ing (strengthening) of the Canadian dollar
against the US dollar would result in a
$0.1 million increase (decrease) in OCI
for financial instruments held in foreign
operations and a $0.4 million increase
(decrease) in net earnings and $3.6 million
increase (decrease) in OCI for financial
instruments held in Canadian operations.
The movement in OCI in foreign
operations reflects the change in the fair
value of financial instruments. Gains or
losses on translation of foreign subsidiaries
are deferred in OCI. Accumulated currency
translation adjustments are recognized in
income when there is a reduction in the net
investment in the foreign operation.
The movement in net earnings in Canadian
operations is a result of a change in the fair
values of financial instruments. The majority
of these financial instruments are hedged.
The movement in OCI in Canadian
operations reflects the change in the fair
value of derivative financial instruments
that are designated as cash flow hedges.
The gains or losses on these instruments
are not expected to affect net earnings as
the gains or losses will offset losses or gains
on the underlying hedged items.
Credit RiskFinancial instruments that potentially
subject the Company to credit risk consist
of cash, accounts receivable and derivative
financial instruments. The carrying amount
of assets included on the consolidated
statement of financial position represents
the maximum credit exposure.
The Company has deposited cash with
reputable financial institutions, from which
management believes the risk of loss to
be remote.
The Company has accounts receivable
from customers engaged in various
13. Financial Instruments – Risk Management
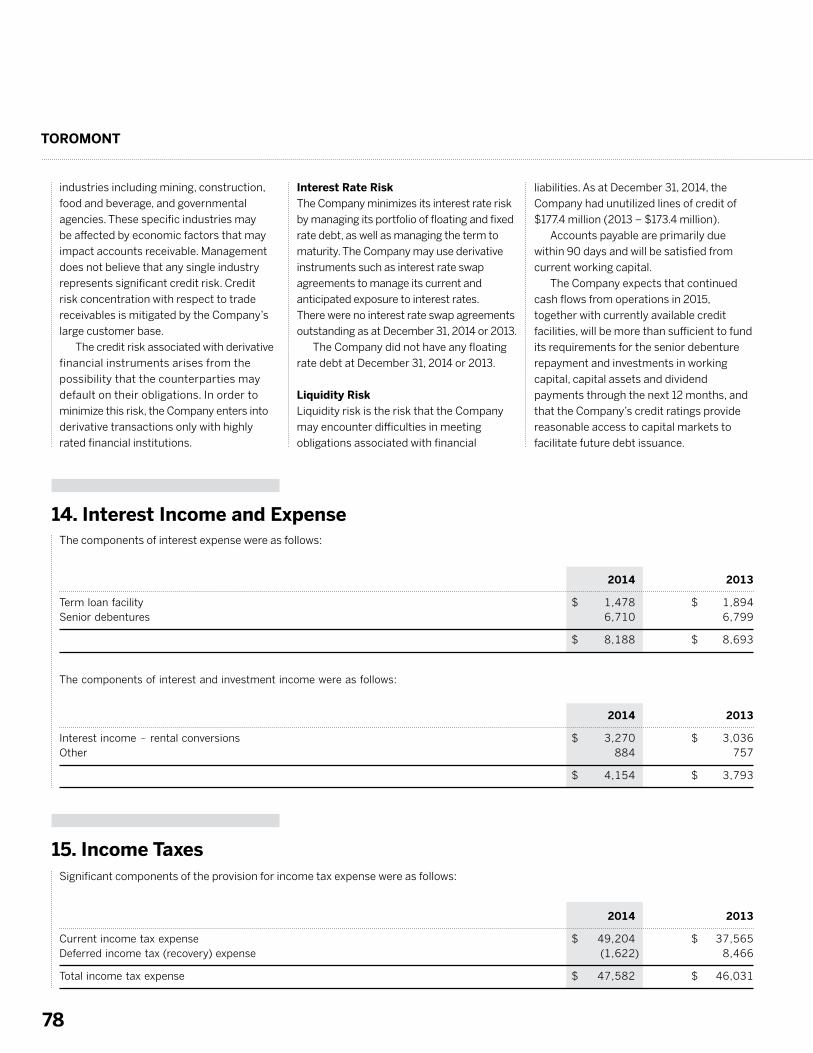
TOROMONT
78
industries including mining, construction,
food and beverage, and governmental
agencies. These specific industries may
be affected by economic factors that may
impact accounts receivable. Management
does not believe that any single industry
represents significant credit risk. Credit
risk concentration with respect to trade
receivables is mitigated by the Company’s
large customer base.
The credit risk associated with derivative
financial instruments arises from the
possibility that the counterparties may
default on their obligations. In order to
minimize this risk, the Company enters into
derivative transactions only with highly
rated financial institutions.
The components of interest expense were as follows:
Significant components of the provision for income tax expense were as follows:
Interest Rate RiskThe Company minimizes its interest rate risk
by managing its portfolio of floating and fixed
rate debt, as well as managing the term to
maturity. The Company may use derivative
instruments such as interest rate swap
agreements to manage its current and
anticipated exposure to interest rates.
There were no interest rate swap agreements
outstanding as at December 31, 2014 or 2013.
The Company did not have any floating
rate debt at December 31, 2014 or 2013.
Liquidity RiskLiquidity risk is the risk that the Company
may encounter difficulties in meeting
obligations associated with financial
liabilities. As at December 31, 2014, the
Company had unutilized lines of credit of
$177.4 million (2013 – $173.4 million).
Accounts payable are primarily due
within 90 days and will be satisfied from
current working capital.
The Company expects that continued
cash flows from operations in 2015,
together with currently available credit
facilities, will be more than sufficient to fund
its requirements for the senior debenture
repayment and investments in working
capital, capital assets and dividend
payments through the next 12 months, and
that the Company’s credit ratings provide
reasonable access to capital markets to
facilitate future debt issuance.
2014 2013
Term loan facility $ 1,478 $ 1,894 Senior debentures 6,710 6,799
$ 8,188 $ 8,693
The components of interest and investment income were as follows:
2014 2013
Interest income – rental conversions $ 3,270 $ 3,036 Other 884 757
$ 4,154 $ 3,793
2014 2013
Current income tax expense $ 49,204 $ 37,565 Deferred income tax (recovery) expense (1,622) 8,466
Total income tax expense $ 47,582 $ 46,031
14. Interest Income and Expense
15. Income Taxes
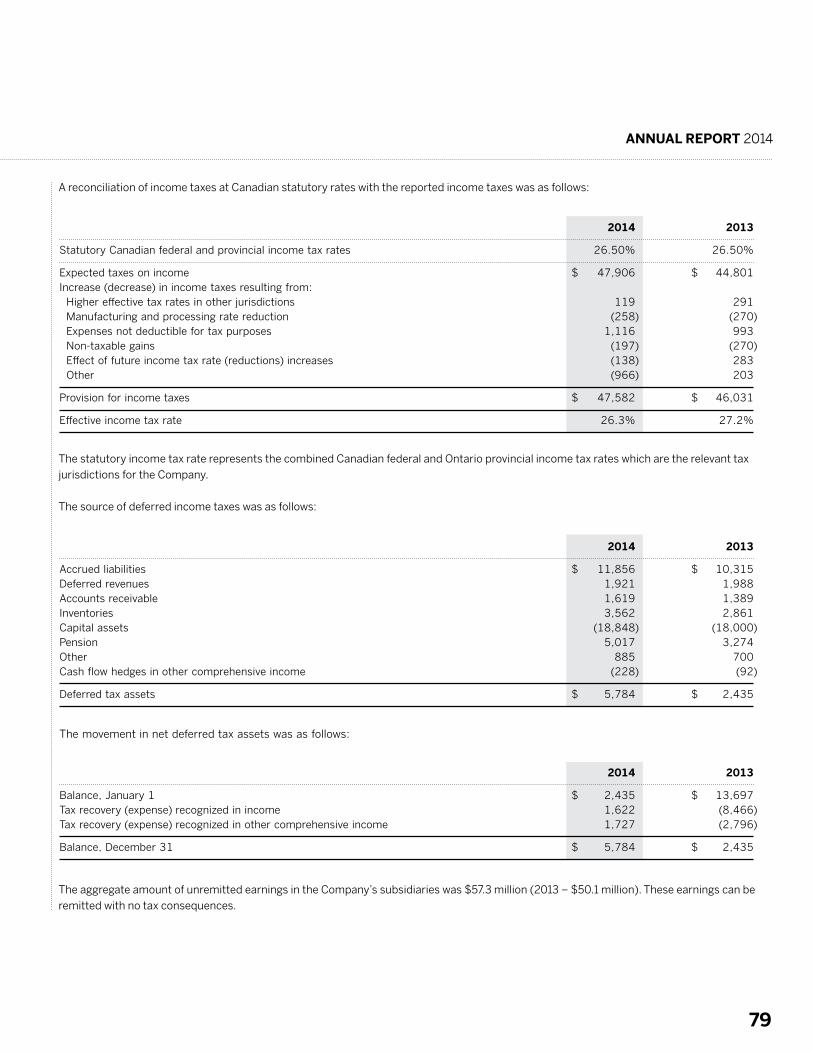
ANNUAL REPORT 2014
79
A reconciliation of income taxes at Canadian statutory rates with the reported income taxes was as follows:
The statutory income tax rate represents the combined Canadian federal and Ontario provincial income tax rates which are the relevant tax
jurisdictions for the Company.
The source of deferred income taxes was as follows:
The aggregate amount of unremitted earnings in the Company’s subsidiaries was $57.3 million (2013 – $50.1 million). These earnings can be
remitted with no tax consequences.
2014 2013
Statutory Canadian federal and provincial income tax rates 26.50% 26.50%
Expected taxes on income $ 47,906 $ 44,801 Increase (decrease) in income taxes resulting from: Higher effective tax rates in other jurisdictions 119 291 Manufacturing and processing rate reduction (258) (270) Expenses not deductible for tax purposes 1,116 993 Non-taxable gains (197) (270) Effect of future income tax rate (reductions) increases (138) 283 Other (966) 203
Provision for income taxes $ 47,582 $ 46,031
Effective income tax rate 26.3% 27.2%
2014 2013
Accrued liabilities $ 11,856 $ 10,315 Deferred revenues 1,921 1,988 Accounts receivable 1,619 1,389 Inventories 3,562 2,861 Capital assets (18,848) (18,000) Pension 5,017 3,274 Other 885 700 Cash flow hedges in other comprehensive income (228) (92)
Deferred tax assets $ 5,784 $ 2,435
The movement in net deferred tax assets was as follows:
2014 2013
Balance, January 1 $ 2,435 $ 13,697 Tax recovery (expense) recognized in income 1,622 (8,466) Tax recovery (expense) recognized in other comprehensive income 1,727 (2,796)
Balance, December 31 $ 5,784 $ 2,435
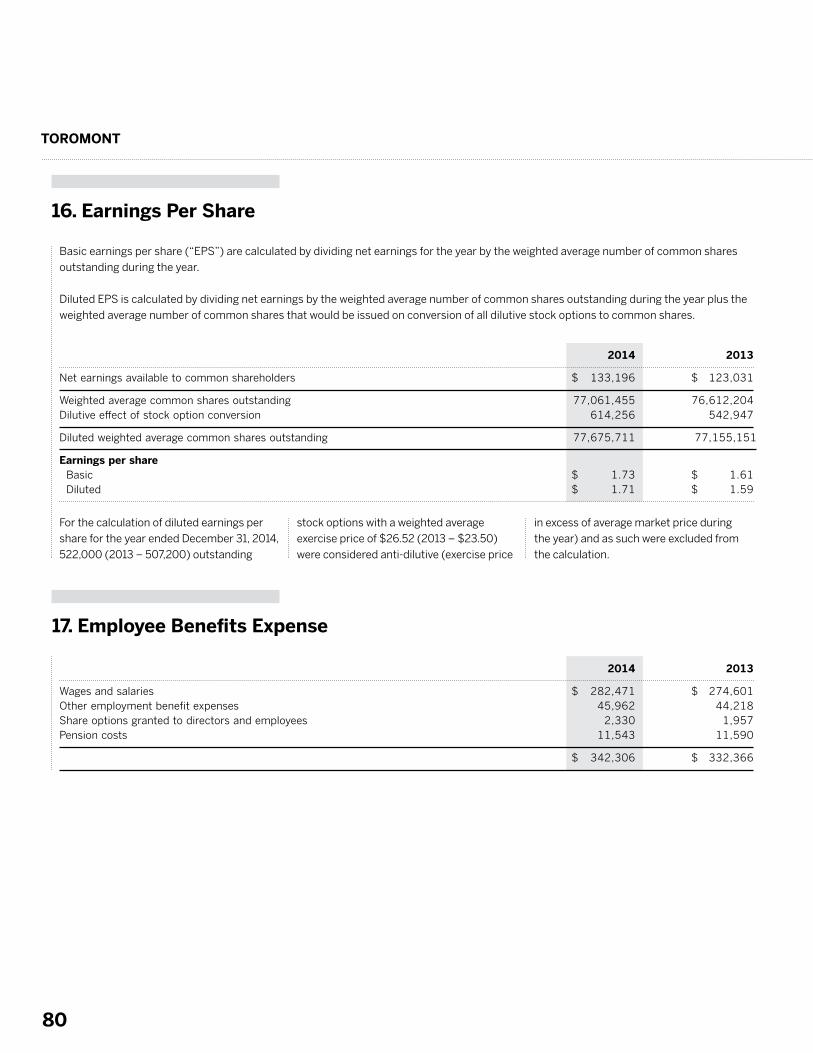
TOROMONT
80
2014 2013
Net earnings available to common shareholders $ 133,196 $ 123,031
Weighted average common shares outstanding 77,061,455 76,612,204 Dilutive effect of stock option conversion 614,256 542,947
Diluted weighted average common shares outstanding 77,675,711 77,155,151
Earnings per share Basic $ 1.73 $ 1.61 Diluted $ 1.71 $ 1.59
16. Earnings Per Share
Basic earnings per share (“EPS”) are calculated by dividing net earnings for the year by the weighted average number of common shares
outstanding during the year.
Diluted EPS is calculated by dividing net earnings by the weighted average number of common shares outstanding during the year plus the
weighted average number of common shares that would be issued on conversion of all dilutive stock options to common shares.
2014 2013
Wages and salaries $ 282,471 $ 274,601 Other employment benefit expenses 45,962 44,218 Share options granted to directors and employees 2,330 1,957 Pension costs 11,543 11,590
$ 342,306 $ 332,366
17. Employee Benefits Expense
For the calculation of diluted earnings per
share for the year ended December 31, 2014,
522,000 (2013 – 507,200) outstanding
stock options with a weighted average
exercise price of $26.52 (2013 – $23.50)
were considered anti-dilutive (exercise price
in excess of average market price during
the year) and as such were excluded from
the calculation.
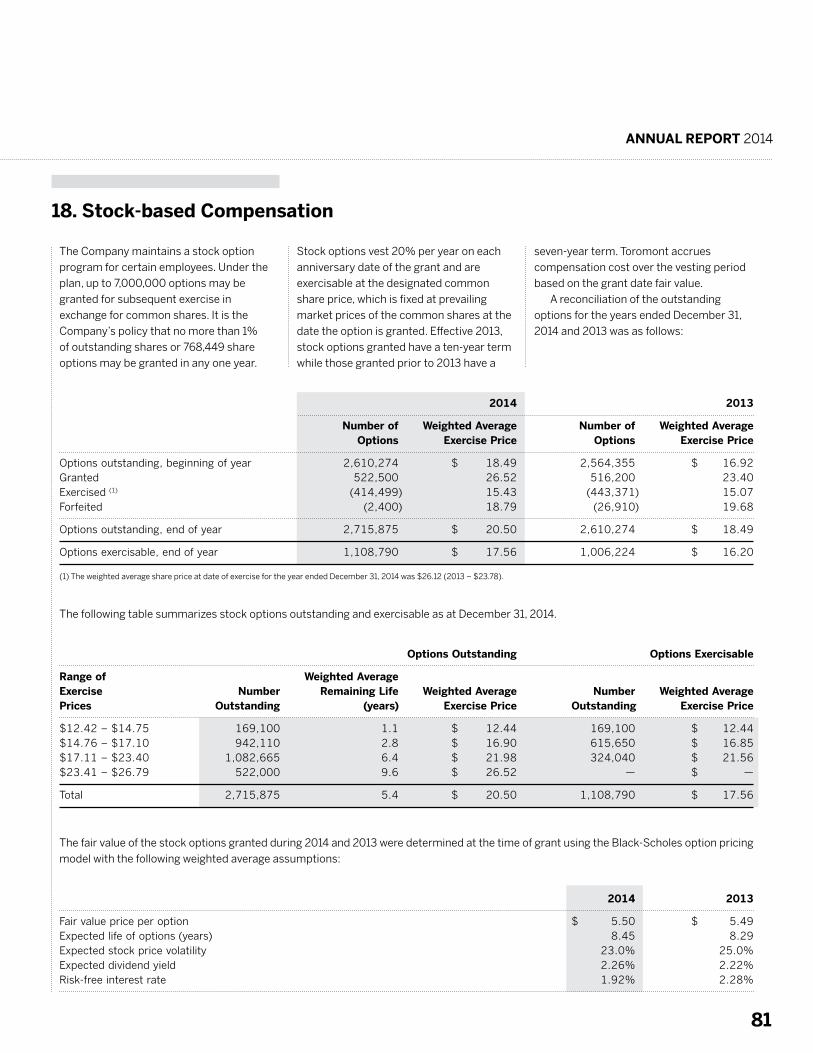
ANNUAL REPORT 2014
81
2014 2013
Number of Weighted Average Number of Weighted Average
Options Exercise Price Options Exercise Price
Options outstanding, beginning of year 2,610,274 $ 18.49 2,564,355 $ 16.92 Granted 522,500 26.52 516,200 23.40 Exercised (1) (414,499) 15.43 (443,371) 15.07 Forfeited (2,400) 18.79 (26,910) 19.68
Options outstanding, end of year 2,715,875 $ 20.50 2,610,274 $ 18.49
Options exercisable, end of year 1,108,790 $ 17.56 1,006,224 $ 16.20
(1) The weighted average share price at date of exercise for the year ended December 31, 2014 was $26.12 (2013 – $23.78).
The following table summarizes stock options outstanding and exercisable as at December 31, 2014.
Options Outstanding Options Exercisable
Range of Weighted Average Exercise Number Remaining Life Weighted Average Number Weighted Average Prices Outstanding (years) Exercise Price Outstanding Exercise Price
$12.42 – $14.75 169,100 1.1 $ 12.44 169,100 $ 12.44 $14.76 – $17.10 942,110 2.8 $ 16.90 615,650 $ 16.85 $17.11 – $23.40 1,082,665 6.4 $ 21.98 324,040 $ 21.56 $23.41 – $26.79 522,000 9.6 $ 26.52 — $ —
Total 2,715,875 5.4 $ 20.50 1,108,790 $ 17.56
The fair value of the stock options granted during 2014 and 2013 were determined at the time of grant using the Black-Scholes option pricing
model with the following weighted average assumptions:
2014 2013
Fair value price per option $ 5.50 $ 5.49 Expected life of options (years) 8.45 8.29 Expected stock price volatility 23.0% 25.0% Expected dividend yield 2.26% 2.22% Risk-free interest rate 1.92% 2.28%
18. Stock-based Compensation
The Company maintains a stock option
program for certain employees. Under the
plan, up to 7,000,000 options may be
granted for subsequent exercise in
exchange for common shares. It is the
Company’s policy that no more than 1%
of outstanding shares or 768,449 share
options may be granted in any one year.
Stock options vest 20% per year on each
anniversary date of the grant and are
exercisable at the designated common
share price, which is fixed at prevailing
market prices of the common shares at the
date the option is granted. Effective 2013,
stock options granted have a ten-year term
while those granted prior to 2013 have a
seven-year term. Toromont accrues
compensation cost over the vesting period
based on the grant date fair value.
A reconciliation of the outstanding
options for the years ended December 31,
2014 and 2013 was as follows:
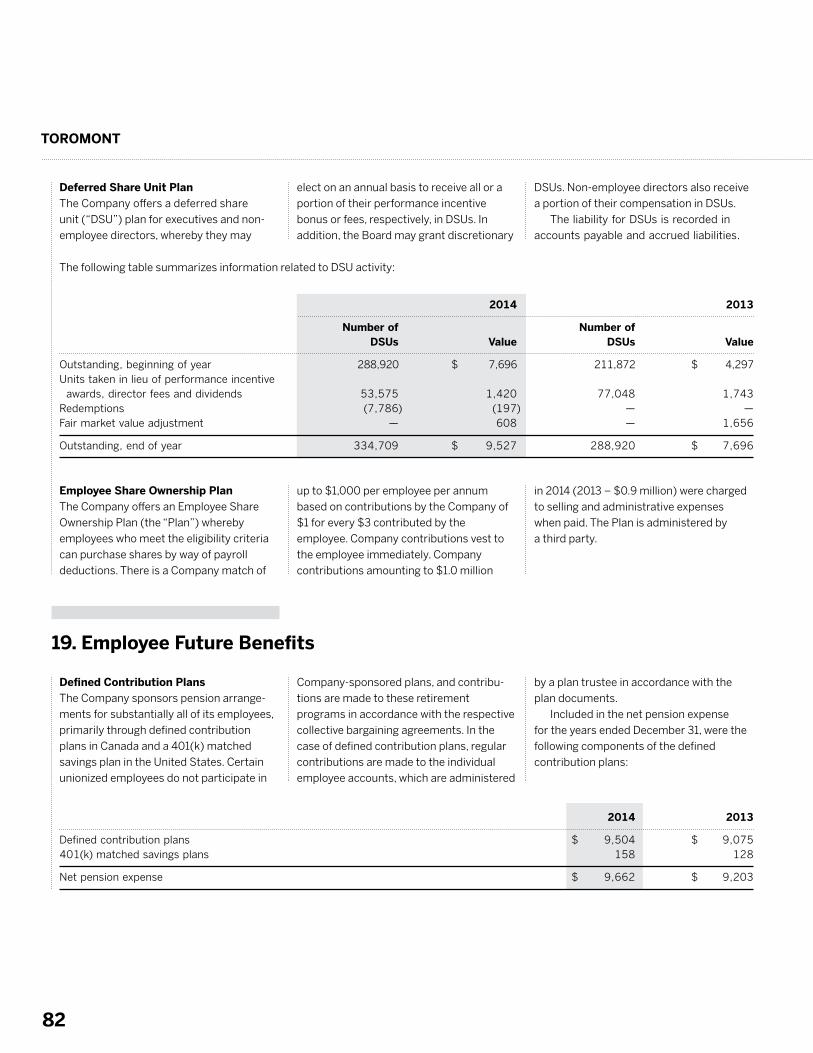
TOROMONT
82
The following table summarizes information related to DSU activity:
2014 2013
Number of Number of DSUs Value DSUs Value
Outstanding, beginning of year 288,920 $ 7,696 211,872 $ 4,297 Units taken in lieu of performance incentive awards, director fees and dividends 53,575 1,420 77,048 1,743 Redemptions (7,786) (197) — — Fair market value adjustment — 608 — 1,656
Outstanding, end of year 334,709 $ 9,527 288,920 $ 7,696
19. Employee Future Benefits
Employee Share Ownership PlanThe Company offers an Employee Share
Ownership Plan (the “Plan”) whereby
employees who meet the eligibility criteria
can purchase shares by way of payroll
deductions. There is a Company match of
Defined Contribution PlansThe Company sponsors pension arrange-
ments for substantially all of its employees,
primarily through defined contribution
plans in Canada and a 401(k) matched
savings plan in the United States. Certain
unionized employees do not participate in
up to $1,000 per employee per annum
based on contributions by the Company of
$1 for every $3 contributed by the
employee. Company contributions vest to
the employee immediately. Company
contributions amounting to $1.0 million
Company-sponsored plans, and contribu-
tions are made to these retirement
programs in accordance with the respective
collective bargaining agreements. In the
case of defined contribution plans, regular
contributions are made to the individual
employee accounts, which are administered
in 2014 (2013 – $0.9 million) were charged
to selling and administrative expenses
when paid. The Plan is administered by
a third party.
by a plan trustee in accordance with the
plan documents.
Included in the net pension expense
for the years ended December 31, were the
following components of the defined
contribution plans:
Deferred Share Unit PlanThe Company offers a deferred share
unit (“DSU”) plan for executives and non-
employee directors, whereby they may
elect on an annual basis to receive all or a
portion of their performance incentive
bonus or fees, respectively, in DSUs. In
addition, the Board may grant discretionary
DSUs. Non-employee directors also receive
a portion of their compensation in DSUs.
The liability for DSUs is recorded in
accounts payable and accrued liabilities.
2014 2013
Defined contribution plans $ 9,504 $ 9,075 401(k) matched savings plans 158 128
Net pension expense $ 9,662 $ 9,203
ANNUAL REPORT 2014
83
Defined Benefit PlansThe Company sponsors funded defined
benefit plans for approximately 109
qualifying employees. The defined benefit
plans are administered by a separate Fund
that is legally separated from the Company.
Outlined below is a summary of the
plans in effect at December 31, 2014
and 2013:
a) Powell Plan – This is a legacy plan whose
members were employees of Powell
Equipment when it was acquired by
Toromont in 2001. The plan is a contribu-
tory plan that provides pension benefits
based on length of service and career
average earnings. The plan is adminis-
tered by the Toromont Pension
Management Committee with assets
held in a pension fund that is legally
separate from the Company and cannot
be used for any purpose other than
payment of pension benefits and related
administrative fees. The plan is registered
with the province of Manitoba. Manitoba’s
minimum funding regulations require
special payments for Toromont to
amortize any shortfalls of plan assets
relative to the cost of settling all accrued
benefit entitlements through the
purchase of annuities or payments of an
equivalent lump sum value (solvency
funding basis). Security in the form of
letters of credit is permitted in lieu of
some or all of these solvency special
payments. If the fair value of defined
benefit assets were to exceed 105% of
this solvency funding target, the excess
can be applied to the cost of the defined
benefits and defined contributions in
future periods. The most recent actuarial
valuation was completed as at December
31, 2013, with the next valuation sched-
uled for December 31, 2016.
b) Executive Plan – This is a non-contribu-
tory pension arrangement for certain
senior executives that provides for a
supplementary retirement payout
in excess of amounts provided for under
the registered plan. The plan is a
supplemental pension plan and is solely
the obligation of the Company. The
Company is not obligated to fund the
plan but pay benefits under the terms of
the plan as they come due. At December
31, 2014, the Company has posted letters
of credit in the amount of $18.3 million to
secure the obligations under this plan.
The most recent actuarial valuation was
completed as at December 31, 2014, with
the next valuation scheduled for
December 31, 2015.
c) Other plan assets and obligations –
This provides for certain retirees and
terminated vested employees of busi-
nesses previously acquired by the
Company as well as for retired partici-
pants of the defined contribution plan
that, in accordance with the plan
provisions, have elected to receive a
pension directly from the plan. The most
recent actuarial valuation was completed
on January 1, 2014, with the next
valuation scheduled for January 1, 2017.
Risks
The plans typically expose the Company
to actuarial risks such as: investment risk,
interest rate risk, longevity risk and
salary risk.
Investment risk
The present value of the defined benefit
plan liability is calculated using a discount
rate determined by reference to high quality
corporate bond yields; if the return on plan
asset is below this rate, it will create a plan
deficit. Currently, the plan has a relatively
balanced investment in equity securities,
debt instruments and real estates. The
Toromont Pension Management Committee
reviews the asset mix and performance of
the plan assets on a quarterly basis with the
balanced investment strategy intention.
Interest risk
A decrease in the bond interest rates will
increase the plan liability; however, this will
be partially offset by an increase in the
plan’s holdings in debt instruments.
Longevity risk
The present value of the defined benefit
plan liability is calculated by reference to
the best estimate of the mortality of plan
participants both during and after their
employment. An increase in the life
expectancy of the plan participants will
increase the plan’s liability.
Salary risk
The present value of the defined benefit
plan liability is calculated by reference to
the future salaries of plan participants.
As such, an increase in the salary of
the plan participants will increase the
plan’s liability.
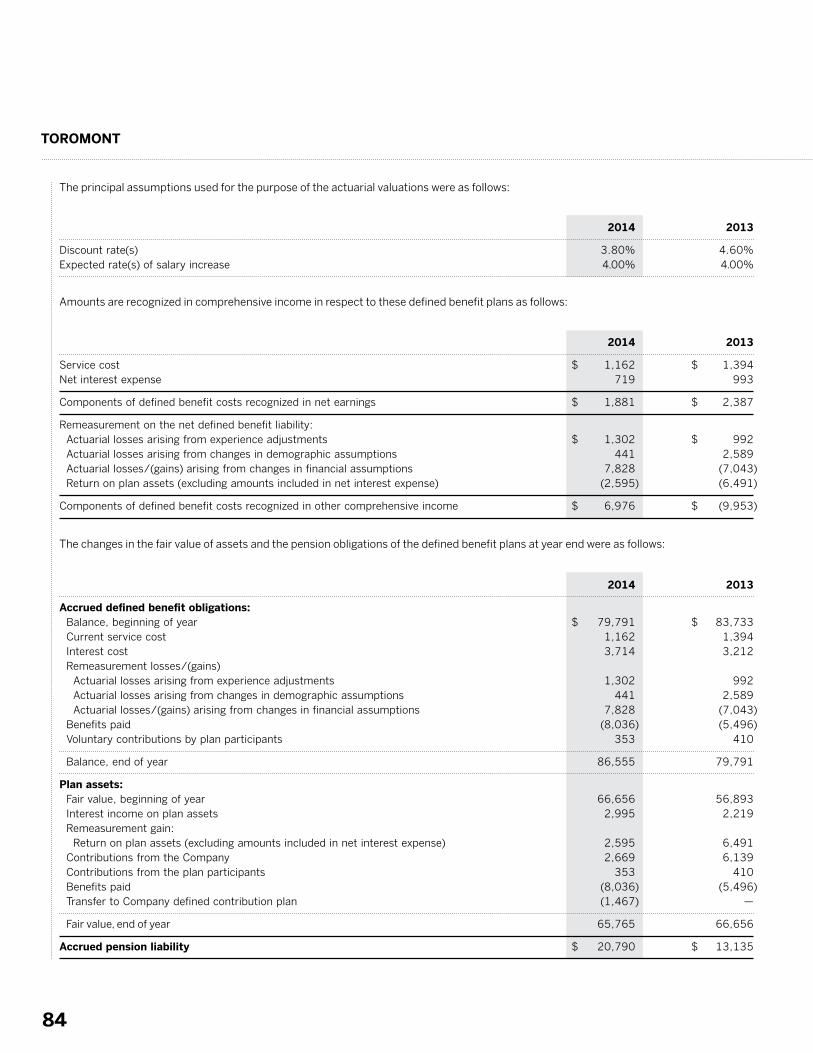
TOROMONT
84
The principal assumptions used for the purpose of the actuarial valuations were as follows:
Amounts are recognized in comprehensive income in respect to these defined benefit plans as follows:
The changes in the fair value of assets and the pension obligations of the defined benefit plans at year end were as follows:
2014 2013
Discount rate(s) 3.80% 4.60% Expected rate(s) of salary increase 4.00% 4.00%
2014 2013
Service cost $ 1,162 $ 1,394 Net interest expense 719 993
Components of defined benefit costs recognized in net earnings $ 1,881 $ 2,387
Remeasurement on the net defined benefit liability: Actuarial losses arising from experience adjustments $ 1,302 $ 992 Actuarial losses arising from changes in demographic assumptions 441 2,589 Actuarial losses/(gains) arising from changes in financial assumptions 7,828 (7,043) Return on plan assets (excluding amounts included in net interest expense) (2,595) (6,491)
Components of defined benefit costs recognized in other comprehensive income $ 6,976 $ (9,953)
2014 2013
Accrued defined benefit obligations: Balance, beginning of year $ 79,791 $ 83,733 Current service cost 1,162 1,394 Interest cost 3,714 3,212 Remeasurement losses/(gains) Actuarial losses arising from experience adjustments 1,302 992 Actuarial losses arising from changes in demographic assumptions 441 2,589 Actuarial losses/(gains) arising from changes in financial assumptions 7,828 (7,043) Benefits paid (8,036) (5,496) Voluntary contributions by plan participants 353 410
Balance, end of year 86,555 79,791
Plan assets: Fair value, beginning of year 66,656 56,893 Interest income on plan assets 2,995 2,219 Remeasurement gain: Return on plan assets (excluding amounts included in net interest expense) 2,595 6,491 Contributions from the Company 2,669 6,139 Contributions from the plan participants 353 410 Benefits paid (8,036) (5,496) Transfer to Company defined contribution plan (1,467) —
Fair value, end of year 65,765 66,656
Accrued pension liability $ 20,790 $ 13,135
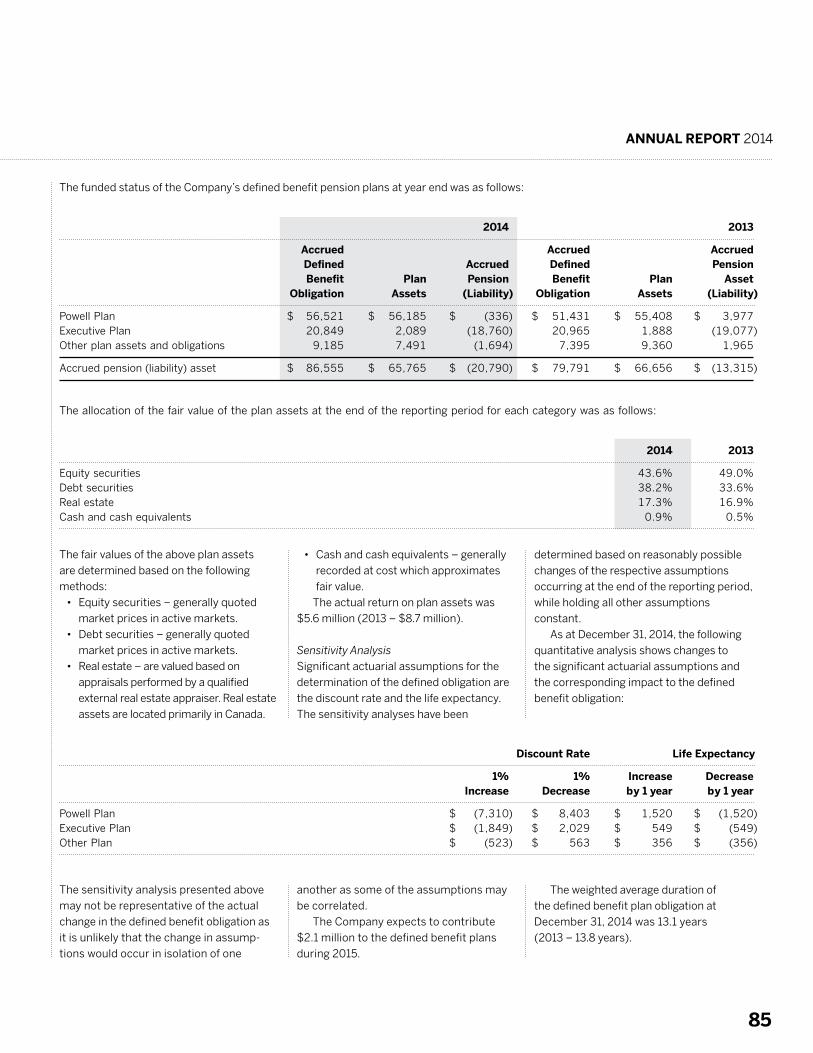
ANNUAL REPORT 2014
85
The funded status of the Company’s defined benefit pension plans at year end was as follows:
2014 2013
Accrued Accrued Accrued Defined Accrued Defined Pension Benefit Plan Pension Benefit Plan Asset Obligation Assets (Liability) Obligation Assets (Liability)
Powell Plan $ 56,521 $ 56,185 $ (336) $ 51,431 $ 55,408 $ 3,977 Executive Plan 20,849 2,089 (18,760) 20,965 1,888 (19,077) Other plan assets and obligations 9,185 7,491 (1,694) 7,395 9,360 1,965
Accrued pension (liability) asset $ 86,555 $ 65,765 $ (20,790) $ 79,791 $ 66,656 $ (13,315)
The allocation of the fair value of the plan assets at the end of the reporting period for each category was as follows:
2014 2013
Equity securities 43.6% 49.0% Debt securities 38.2% 33.6% Real estate 17.3% 16.9% Cash and cash equivalents 0.9% 0.5%
Discount Rate Life Expectancy
1% 1% Increase Decrease Increase Decrease by 1 year by 1 year
Powell Plan $ (7,310) $ 8,403 $ 1,520 $ (1,520) Executive Plan $ (1,849) $ 2,029 $ 549 $ (549) Other Plan $ (523) $ 563 $ 356 $ (356)
The fair values of the above plan assets
are determined based on the following
methods:
• Equity securities – generally quoted
market prices in active markets.
• Debt securities – generally quoted
market prices in active markets.
• Real estate – are valued based on
appraisals performed by a qualified
external real estate appraiser. Real estate
assets are located primarily in Canada.
The sensitivity analysis presented above
may not be representative of the actual
change in the defined benefit obligation as
it is unlikely that the change in assump-
tions would occur in isolation of one
• Cash and cash equivalents – generally
recorded at cost which approximates
fair value.
The actual return on plan assets was
$5.6 million (2013 – $8.7 million).
Sensitivity Analysis
Significant actuarial assumptions for the
determination of the defined obligation are
the discount rate and the life expectancy.
The sensitivity analyses have been
another as some of the assumptions may
be correlated.
The Company expects to contribute
$2.1 million to the defined benefit plans
during 2015.
determined based on reasonably possible
changes of the respective assumptions
occurring at the end of the reporting period,
while holding all other assumptions
constant.
As at December 31, 2014, the following
quantitative analysis shows changes to
the significant actuarial assumptions and
the corresponding impact to the defined
benefit obligation:
The weighted average duration of
the defined benefit plan obligation at
December 31, 2014 was 13.1 years
(2013 – 13.8 years).
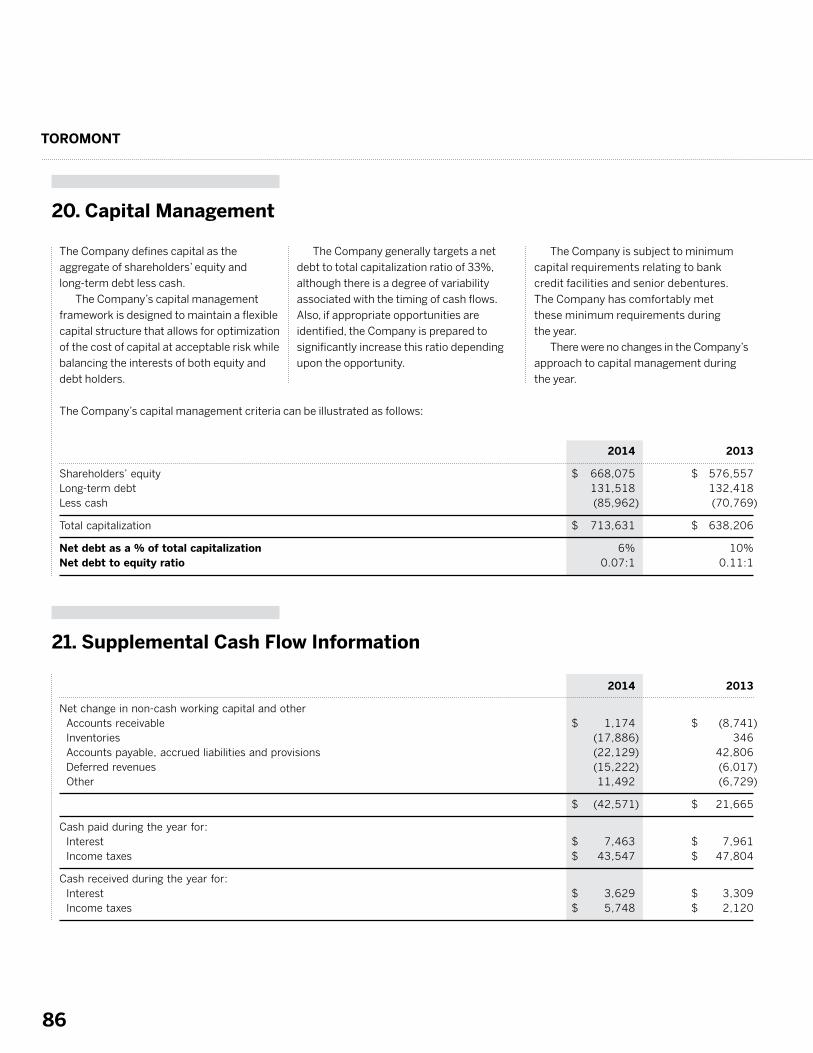
TOROMONT
86
The Company’s capital management criteria can be illustrated as follows:
2014 2013
Shareholders’ equity $ 668,075 $ 576,557 Long-term debt 131,518 132,418 Less cash (85,962) (70,769)
Total capitalization $ 713,631 $ 638,206
Net debt as a % of total capitalization 6% 10% Net debt to equity ratio 0.07:1 0.11:1
20. Capital Management
21. Supplemental Cash Flow Information
The Company defines capital as the
aggregate of shareholders’ equity and
long-term debt less cash.
The Company’s capital management
framework is designed to maintain a flexible
capital structure that allows for optimization
of the cost of capital at acceptable risk while
balancing the interests of both equity and
debt holders.
The Company generally targets a net
debt to total capitalization ratio of 33%,
although there is a degree of variability
associated with the timing of cash flows.
Also, if appropriate opportunities are
identified, the Company is prepared to
significantly increase this ratio depending
upon the opportunity.
The Company is subject to minimum
capital requirements relating to bank
credit facilities and senior debentures.
The Company has comfortably met
these minimum requirements during
the year.
There were no changes in the Company’s
approach to capital management during
the year.
2014 2013
Net change in non-cash working capital and other Accounts receivable $ 1,174 $ (8,741) Inventories (17,886) 346 Accounts payable, accrued liabilities and provisions (22,129) 42,806 Deferred revenues (15,222) (6,017) Other 11,492 (6,729)
$ (42,571) $ 21,665
Cash paid during the year for: Interest $ 7,463 $ 7,961 Income taxes $ 43,547 $ 47,804
Cash received during the year for: Interest $ 3,629 $ 3,309 Income taxes $ 5,748 $ 2,120
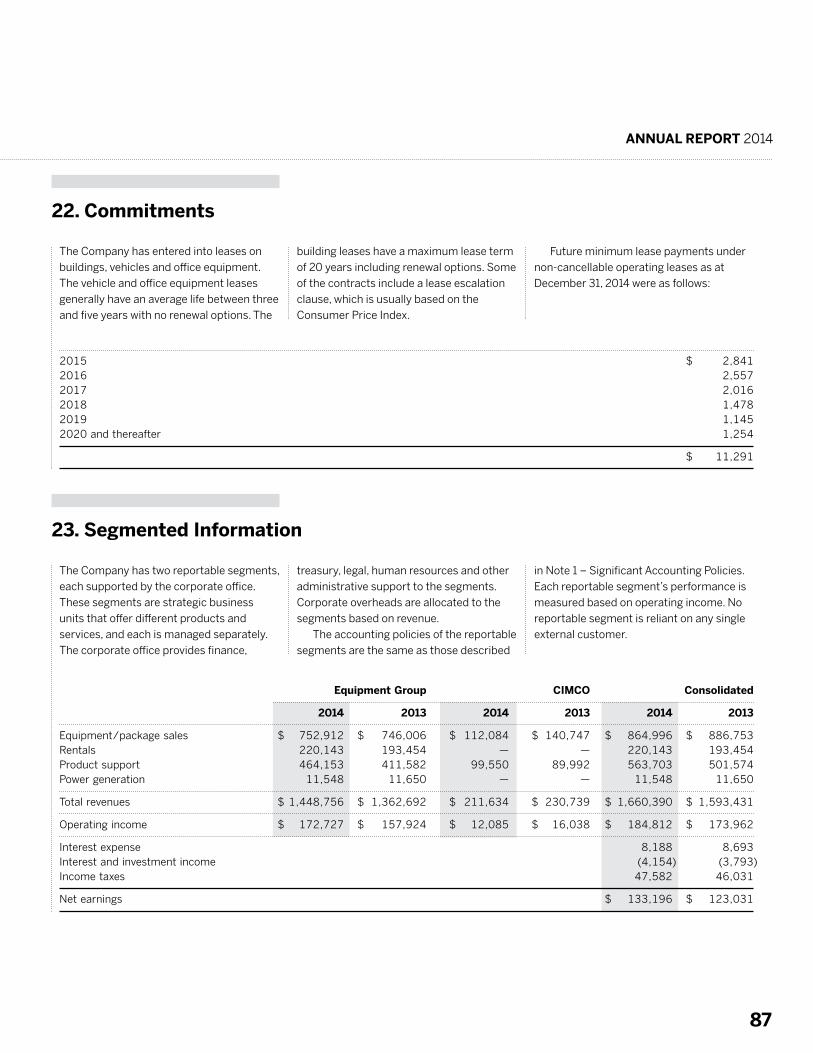
ANNUAL REPORT 2014
87
Equipment Group CIMCO Consolidated
2014 2013 2014 2013 2014 2013
Equipment/package sales $ 752,912 $ 746,006 $ 112,084 $ 140,747 $ 864,996 $ 886,753 Rentals 220,143 193,454 — — 220,143 193,454 Product support 464,153 411,582 99,550 89,992 563,703 501,574 Power generation 11,548 11,650 — — 11,548 11,650
Total revenues $ 1,448,756 $ 1,362,692 $ 211,634 $ 230,739 $ 1,660,390 $ 1,593,431
Operating income $ 172,727 $ 157,924 $ 12,085 $ 16,038 $ 184,812 $ 173,962
Interest expense 8,188 8,693 Interest and investment income (4,154) (3,793) Income taxes 47,582 46,031
Net earnings $ 133,196 $ 123,031
2015 $ 2,841 2016 2,557 2017 2,016 2018 1,478 2019 1,145 2020 and thereafter 1,254
$ 11,291
22. Commitments
23. Segmented Information
The Company has entered into leases on
buildings, vehicles and office equipment.
The vehicle and office equipment leases
generally have an average life between three
and five years with no renewal options. The
The Company has two reportable segments,
each supported by the corporate office.
These segments are strategic business
units that offer different products and
services, and each is managed separately.
The corporate office provides finance,
building leases have a maximum lease term
of 20 years including renewal options. Some
of the contracts include a lease escalation
clause, which is usually based on the
Consumer Price Index.
treasury, legal, human resources and other
administrative support to the segments.
Corporate overheads are allocated to the
segments based on revenue.
The accounting policies of the reportable
segments are the same as those described
Future minimum lease payments under
non-cancellable operating leases as at
December 31, 2014 were as follows:
in Note 1 – Significant Accounting Policies.
Each reportable segment’s performance is
measured based on operating income. No
reportable segment is reliant on any single
external customer.
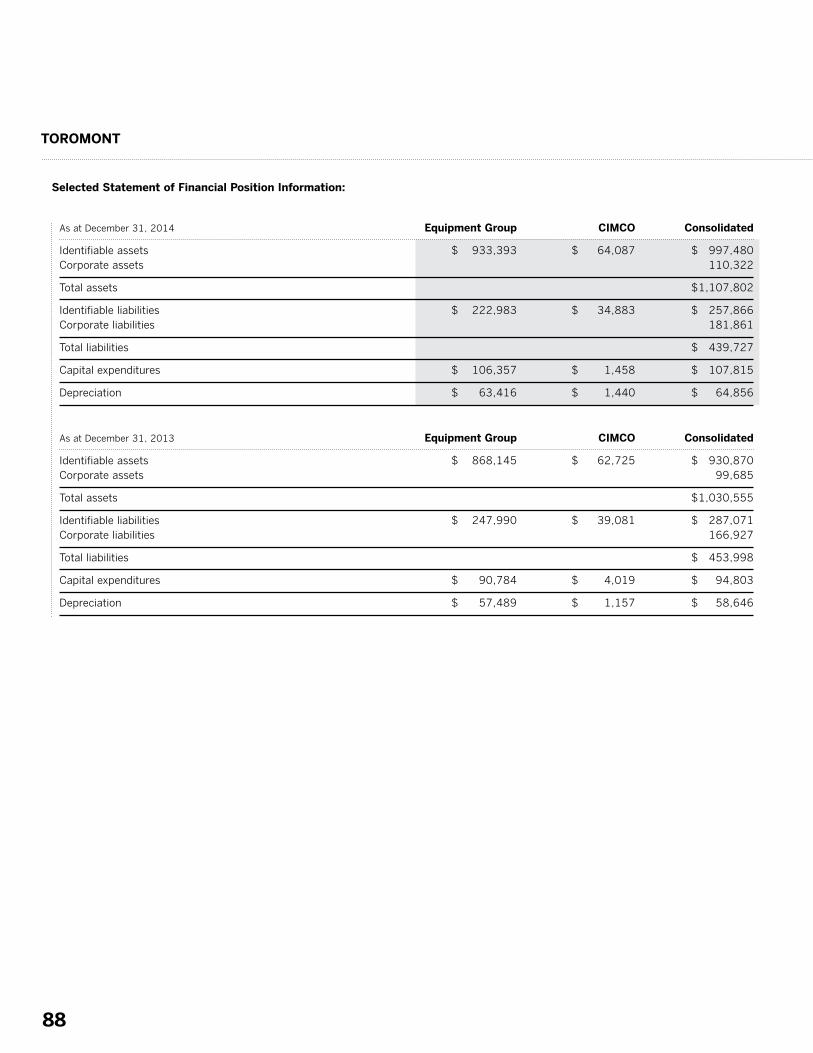
TOROMONT
88
As at December 31, 2014 Equipment Group CIMCO Consolidated
Identifiable assets $ 933,393 $ 64,087 $ 997,480 Corporate assets 110,322
Total assets $ 1,107,802
Identifiable liabilities $ 222,983 $ 34,883 $ 257,866 Corporate liabilities 181,861
Total liabilities $ 439,727
Capital expenditures $ 106,357 $ 1,458 $ 107,815
Depreciation $ 63,416 $ 1,440 $ 64,856
As at December 31, 2013 Equipment Group CIMCO Consolidated
Identifiable assets $ 868,145 $ 62,725 $ 930,870 Corporate assets 99,685
Total assets $ 1,030,555
Identifiable liabilities $ 247,990 $ 39,081 $ 287,071 Corporate liabilities 166,927
Total liabilities $ 453,998
Capital expenditures $ 90,784 $ 4,019 $ 94,803
Depreciation $ 57,489 $ 1,157 $ 58,646
Selected Statement of Financial Position Information:
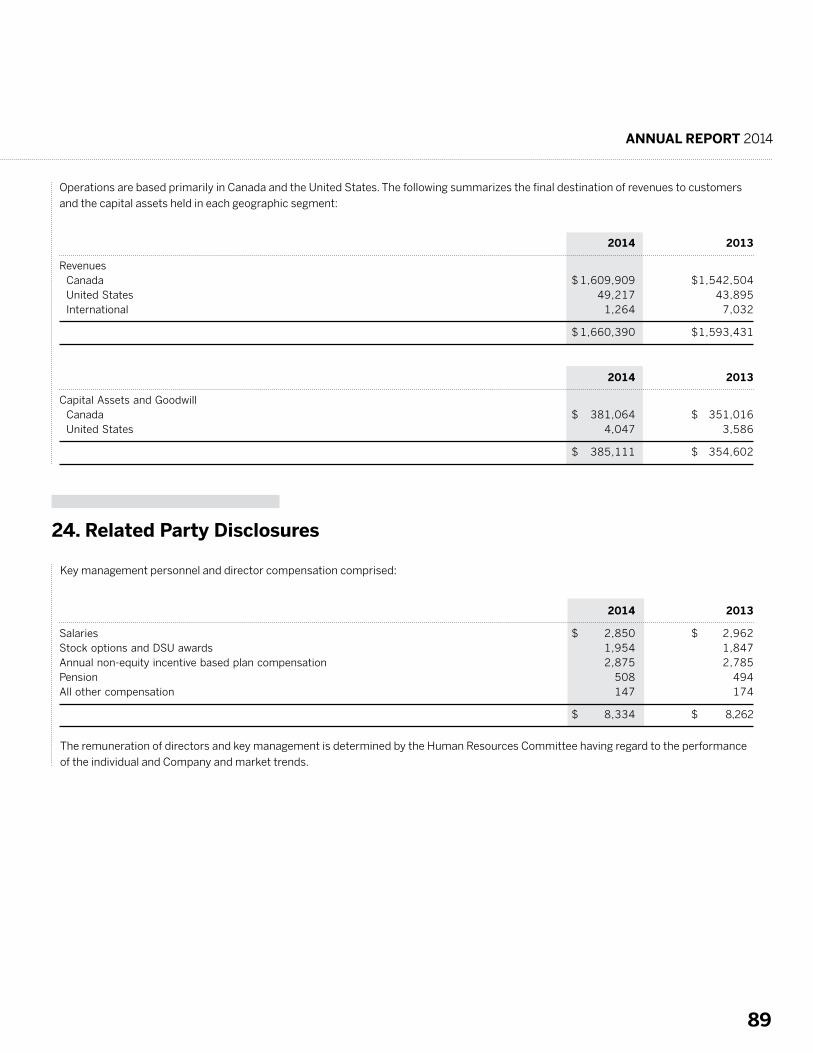
ANNUAL REPORT 2014
89
2014 2013
Salaries $ 2,850 $ 2,962 Stock options and DSU awards 1,954 1,847 Annual non-equity incentive based plan compensation 2,875 2,785 Pension 508 494 All other compensation 147 174
$ 8,334 $ 8,262
24. Related Party Disclosures
The remuneration of directors and key management is determined by the Human Resources Committee having regard to the performance
of the individual and Company and market trends.
Key management personnel and director compensation comprised:
Operations are based primarily in Canada and the United States. The following summarizes the final destination of revenues to customers
and the capital assets held in each geographic segment:
2014 2013
Revenues Canada $ 1,609,909 $ 1,542,504 United States 49,217 43,895 International 1,264 7,032
$ 1,660,390 $ 1,593,431
2014 2013
Capital Assets and Goodwill Canada $ 381,064 $ 351,016 United States 4,047 3,586
$ 385,111 $ 354,602
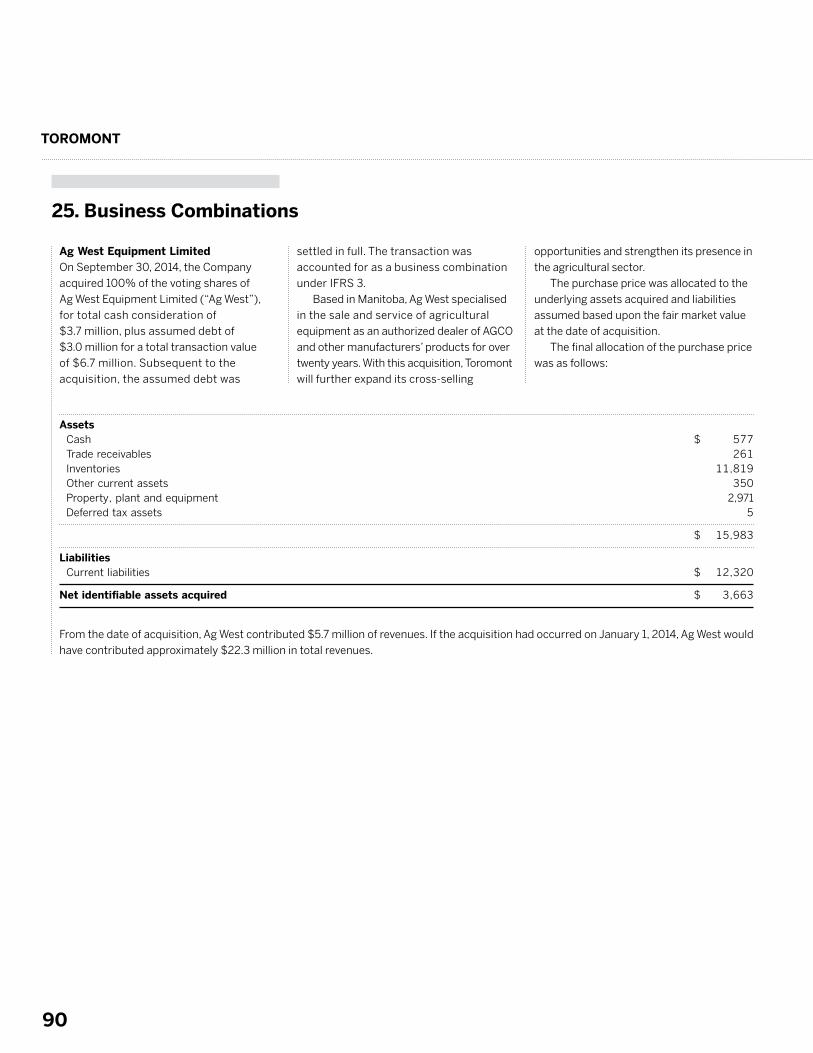
TOROMONT
90
25. Business Combinations
From the date of acquisition, Ag West contributed $5.7 million of revenues. If the acquisition had occurred on January 1, 2014, Ag West would
have contributed approximately $22.3 million in total revenues.
Assets Cash $ 577 Trade receivables 261 Inventories 11,819 Other current assets 350 Property, plant and equipment 2,971 Deferred tax assets 5
$ 15,983
Liabilities Current liabilities $ 12,320
Net identifiable assets acquired $ 3,663
Ag West Equipment LimitedOn September 30, 2014, the Company
acquired 100% of the voting shares of
Ag West Equipment Limited (“Ag West”),
for total cash consideration of
$3.7 million, plus assumed debt of
$3.0 million for a total transaction value
of $6.7 million. Subsequent to the
acquisition, the assumed debt was
settled in full. The transaction was
accounted for as a business combination
under IFRS 3.
Based in Manitoba, Ag West specialised
in the sale and service of agricultural
equipment as an authorized dealer of AGCO
and other manufacturers’ products for over
twenty years. With this acquisition, Toromont
will further expand its cross-selling
opportunities and strengthen its presence in
the agricultural sector.
The purchase price was allocated to the
underlying assets acquired and liabilities
assumed based upon the fair market value
at the date of acquisition.
The final allocation of the purchase price
was as follows:
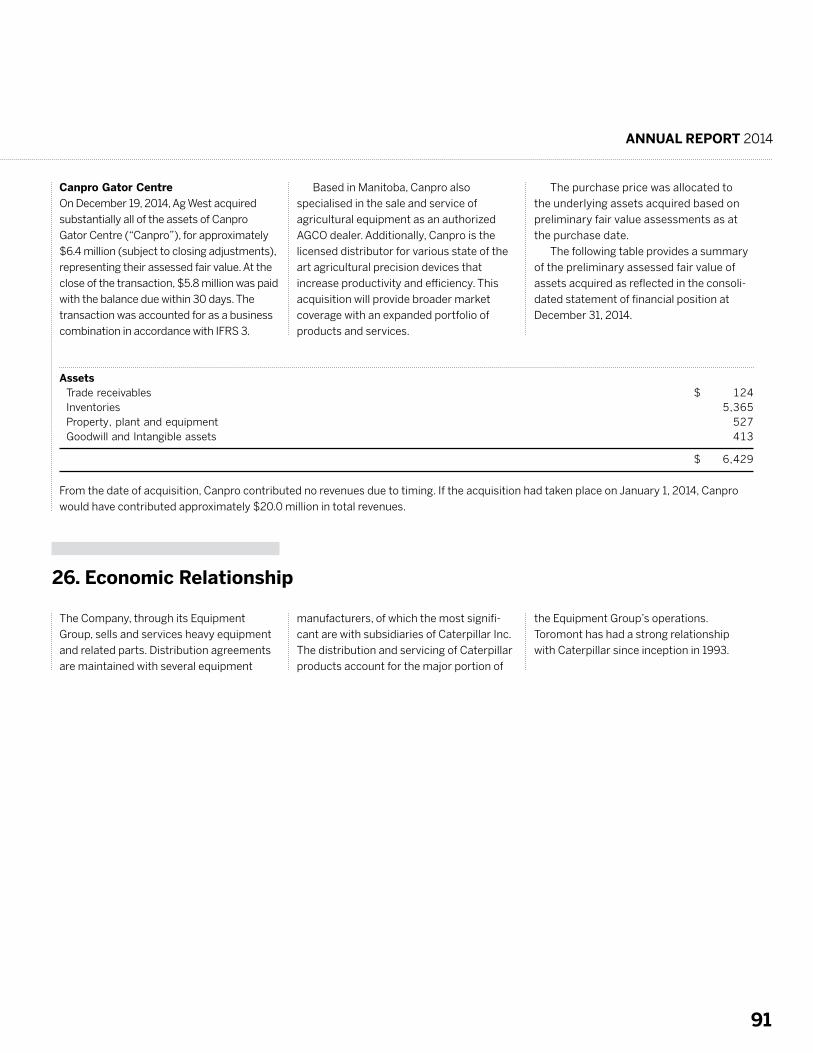
ANNUAL REPORT 2014
91
From the date of acquisition, Canpro contributed no revenues due to timing. If the acquisition had taken place on January 1, 2014, Canpro
would have contributed approximately $20.0 million in total revenues.
Assets Trade receivables $ 124 Inventories 5,365 Property, plant and equipment 527 Goodwill and Intangible assets 413
$ 6,429
Canpro Gator CentreOn December 19, 2014, Ag West acquired
substantially all of the assets of Canpro
Gator Centre (“Canpro”), for approximately
$6.4 million (subject to closing adjustments),
representing their assessed fair value. At the
close of the transaction, $5.8 million was paid
with the balance due within 30 days. The
transaction was accounted for as a business
combination in accordance with IFRS 3.
Based in Manitoba, Canpro also
specialised in the sale and service of
agricultural equipment as an authorized
AGCO dealer. Additionally, Canpro is the
licensed distributor for various state of the
art agricultural precision devices that
increase productivity and efficiency. This
acquisition will provide broader market
coverage with an expanded portfolio of
products and services.
The purchase price was allocated to
the underlying assets acquired based on
preliminary fair value assessments as at
the purchase date.
The following table provides a summary
of the preliminary assessed fair value of
assets acquired as reflected in the consoli-
dated statement of financial position at
December 31, 2014.
26. Economic Relationship
The Company, through its Equipment
Group, sells and services heavy equipment
and related parts. Distribution agreements
are maintained with several equipment
manufacturers, of which the most signifi-
cant are with subsidiaries of Caterpillar Inc.
The distribution and servicing of Caterpillar
products account for the major portion of
the Equipment Group’s operations.
Toromont has had a strong relationship
with Caterpillar since inception in 1993.
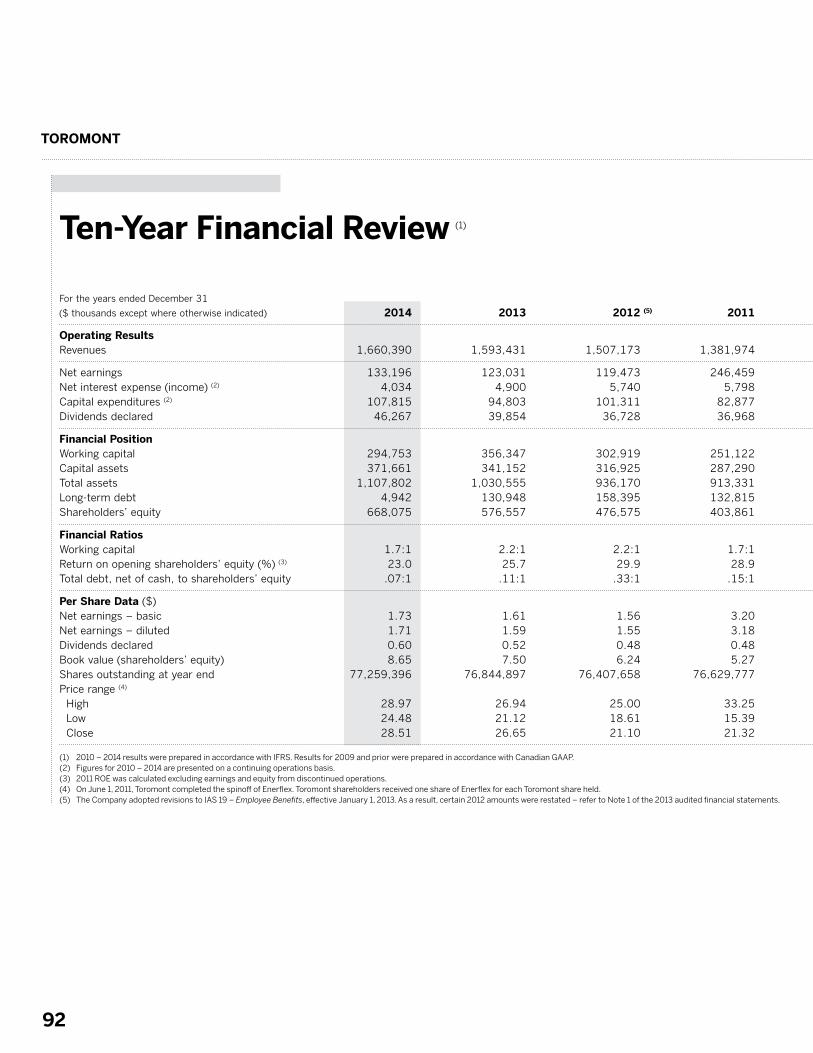
TOROMONT
92
For the years ended December 31
($ thousands except where otherwise indicated) 2014 2013 2012 (5) 2011 2010 2009 2008 2007 2006 2005
Operating Results Revenues 1,660,390 1,593,431 1,507,173 1,381,974 1,207,028 1,824,592 2,121,209 1,886,761 1,746,162 1,584,911
Net earnings 133,196 123,031 119,473 246,459 103,912 120,516 140,524 122,280 99,421 78,962 Net interest expense (income) (2) 4,034 4,900 5,740 5,798 8,826 2,460 (3,246) 9,331 11,110 10,192 Capital expenditures (2) 107,815 94,803 101,311 82,877 71,143 61,041 96,475 97,108 102,444 72,813 Dividends declared 46,267 39,854 36,728 36,968 47,716 38,848 36,391 31,061 25,594 20,280
Financial Position Working capital 294,753 356,347 302,919 251,122 478,289 539,264 509,276 466,859 469,638 410,990 Capital assets 371,661 341,152 316,925 287,290 556,991 369,666 402,647 341,159 323,504 283,407 Total assets 1,107,802 1,030,555 936,170 913,331 2,271,763 1,364,667 1,533,450 1,356,861 1,299,992 1,143,972 Long-term debt 4,942 130,948 158,395 132,815 413,040 144,051 158,112 203,425 238,468 241,265 Shareholders’ equity 668,075 576,557 476,575 403,861 1,196,838 854,063 779,103 654,730 565,556 481,812
Financial Ratios Working capital 1.7:1 2.2:1 2.2:1 1.7:1 1.8:1 2.6:1 1.9:1 2.0:1 2.1:1 2.1:1 Return on opening shareholders’ equity (%) (3) 23.0 25.7 29.9 28.9 9.1 15.5 21.5 21.6 20.6 18.9 Total debt, net of cash, to shareholders’ equity .07:1 .11:1 .33:1 .15:1 .21:1 (.06):1 .05:1 .2:1 .4:1 .4:1
Per Share Data ($) Net earnings – basic 1.73 1.61 1.56 3.20 1.36 1.86 2.16 1.89 1.56 1.25 Net earnings – diluted 1.71 1.59 1.55 3.18 1.35 1.86 2.15 1.88 1.54 1.23 Dividends declared 0.60 0.52 0.48 0.48 0.62 0.60 0.56 0.48 0.40 0.32 Book value (shareholders’ equity) 8.65 7.50 6.24 5.27 15.50 13.17 12.06 10.08 8.79 7.57 Shares outstanding at year end 77,259,396 76,844,897 76,407,658 76,629,777 77,149,626 64,867,467 64,620,677 64,943,497 64,310,377 63,624,936 Price range (4) High 28.97 26.94 25.00 33.25 32.40 27.80 32.90 30.00 27.15 25.68 Low 24.48 21.12 18.61 15.39 22.86 19.26 19.03 22.30 20.08 20.05 Close 28.51 26.65 21.10 21.32 30.76 27.79 22.99 28.26 24.50 25.40
(1) 2010 – 2014 results were prepared in accordance with IFRS. Results for 2009 and prior were prepared in accordance with Canadian GAAP.(2) Figures for 2010 – 2014 are presented on a continuing operations basis.(3) 2011 ROE was calculated excluding earnings and equity from discontinued operations.(4) On June 1, 2011, Toromont completed the spinoff of Enerflex. Toromont shareholders received one share of Enerflex for each Toromont share held.(5) The Company adopted revisions to IAS 19 – Employee Benefits, effective January 1, 2013. As a result, certain 2012 amounts were restated – refer to Note 1 of the 2013 audited financial statements.
Ten-Year Financial Review (1)
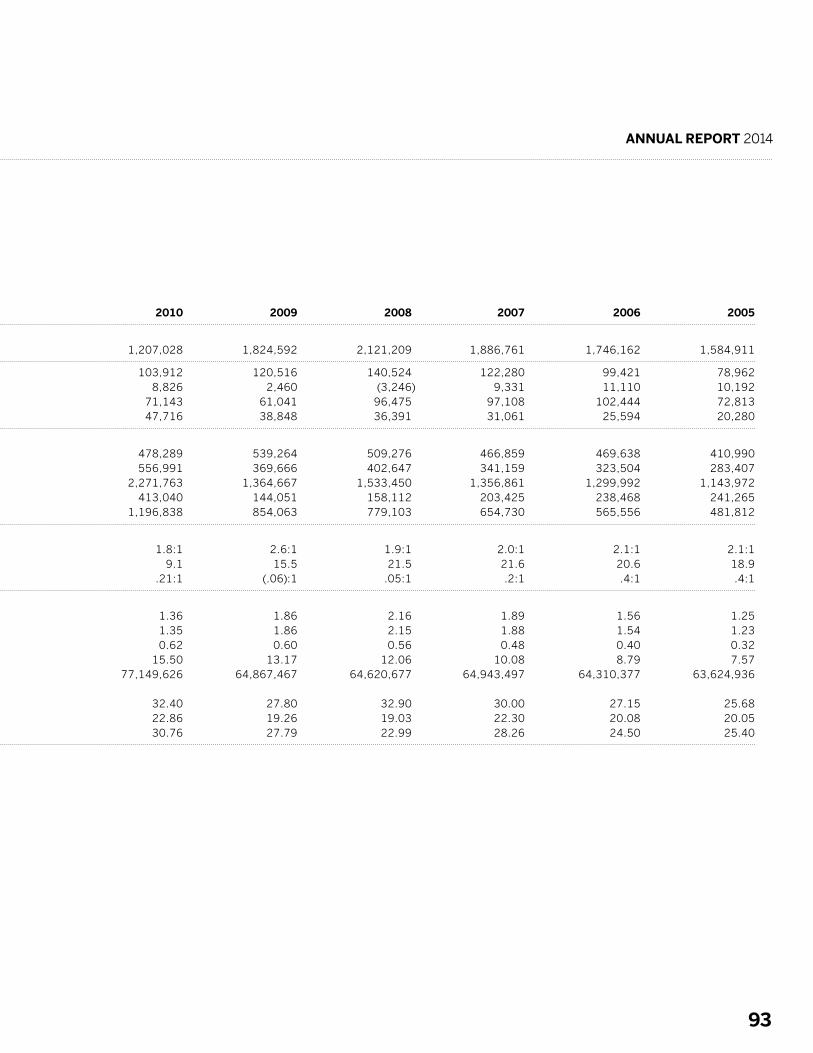
ANNUAL REPORT 2014
93
For the years ended December 31
($ thousands except where otherwise indicated) 2014 2013 2012 (5) 2011 2010 2009 2008 2007 2006 2005
Operating Results Revenues 1,660,390 1,593,431 1,507,173 1,381,974 1,207,028 1,824,592 2,121,209 1,886,761 1,746,162 1,584,911
Net earnings 133,196 123,031 119,473 246,459 103,912 120,516 140,524 122,280 99,421 78,962 Net interest expense (income) (2) 4,034 4,900 5,740 5,798 8,826 2,460 (3,246) 9,331 11,110 10,192 Capital expenditures (2) 107,815 94,803 101,311 82,877 71,143 61,041 96,475 97,108 102,444 72,813 Dividends declared 46,267 39,854 36,728 36,968 47,716 38,848 36,391 31,061 25,594 20,280
Financial Position Working capital 294,753 356,347 302,919 251,122 478,289 539,264 509,276 466,859 469,638 410,990 Capital assets 371,661 341,152 316,925 287,290 556,991 369,666 402,647 341,159 323,504 283,407 Total assets 1,107,802 1,030,555 936,170 913,331 2,271,763 1,364,667 1,533,450 1,356,861 1,299,992 1,143,972 Long-term debt 4,942 130,948 158,395 132,815 413,040 144,051 158,112 203,425 238,468 241,265 Shareholders’ equity 668,075 576,557 476,575 403,861 1,196,838 854,063 779,103 654,730 565,556 481,812
Financial Ratios Working capital 1.7:1 2.2:1 2.2:1 1.7:1 1.8:1 2.6:1 1.9:1 2.0:1 2.1:1 2.1:1 Return on opening shareholders’ equity (%) (3) 23.0 25.7 29.9 28.9 9.1 15.5 21.5 21.6 20.6 18.9 Total debt, net of cash, to shareholders’ equity .07:1 .11:1 .33:1 .15:1 .21:1 (.06):1 .05:1 .2:1 .4:1 .4:1
Per Share Data ($) Net earnings – basic 1.73 1.61 1.56 3.20 1.36 1.86 2.16 1.89 1.56 1.25 Net earnings – diluted 1.71 1.59 1.55 3.18 1.35 1.86 2.15 1.88 1.54 1.23 Dividends declared 0.60 0.52 0.48 0.48 0.62 0.60 0.56 0.48 0.40 0.32 Book value (shareholders’ equity) 8.65 7.50 6.24 5.27 15.50 13.17 12.06 10.08 8.79 7.57 Shares outstanding at year end 77,259,396 76,844,897 76,407,658 76,629,777 77,149,626 64,867,467 64,620,677 64,943,497 64,310,377 63,624,936 Price range (4) High 28.97 26.94 25.00 33.25 32.40 27.80 32.90 30.00 27.15 25.68 Low 24.48 21.12 18.61 15.39 22.86 19.26 19.03 22.30 20.08 20.05 Close 28.51 26.65 21.10 21.32 30.76 27.79 22.99 28.26 24.50 25.40
(1) 2010 – 2014 results were prepared in accordance with IFRS. Results for 2009 and prior were prepared in accordance with Canadian GAAP.(2) Figures for 2010 – 2014 are presented on a continuing operations basis.(3) 2011 ROE was calculated excluding earnings and equity from discontinued operations.(4) On June 1, 2011, Toromont completed the spinoff of Enerflex. Toromont shareholders received one share of Enerflex for each Toromont share held.(5) The Company adopted revisions to IAS 19 – Employee Benefits, effective January 1, 2013. As a result, certain 2012 amounts were restated – refer to Note 1 of the 2013 audited financial statements.
TOROMONT
94
Corporate Information
Annual and Special Meeting
The Annual and Special Meeting of the Shareholders of Toromont
Industries Ltd. will be held at 10:00 am on Thursday, April 23, 2015
at the Hilton Garden Inn (Vaughan), 3201 Highway 7, Vaughan,
Ontario L4K 5Z7.
Toromont Cat Officers
CIMCO Refrigeration
Battlefield – The Cat Rental Store
Ag West Equipment Limited
3131 Highway 7 West
P.O. Box 5511
Concord, Ontario L4K 1B7
T: 416.667.5511
F: 416.667.5555
www.toromontcat.com
Scott J. Medhurst, President and Chief Executive Officer
Paul R. Jewer, Executive Vice President and Chief Financial Officer
Randall B. Casson, President, Construction Industries Division/
Battlefield – The Cat Rental Store
Michael P. Cuddy, Vice President and Chief Information Officer
David C. Wetherald, Vice President, Human Resources and Legal
Jennifer J. Cochrane, Vice President, Finance
65 Villiers Street
Toronto, Ontario M5A 3S1
T: 416.465.7581
F: 416.465.8815
www.cimcorefrigeration.ca
888 South Service Road
Stoney Creek, Ontario L8H 7S8
T: 905.577.7777
F: 905.643.6008
www.battlefieldequipment.ca
Highway #1 West
P.O. Box 432
Elie, Manitoba R0H 0H0
T: 204.353.3850
F: 877.353.4343
www.agwest.com
How to Get in Touch With Us
Investors are encouraged to contact CST Trust Company
for information regarding their security holdings.
CST Trust Company
P.O. Box 700
Station B
Montreal, Quebec
H3B 3K3
Toll-Free North America: 1.800.387.0825
Local: 416.682.3860
E-mail: [email protected]
www.canstockta.com
Listed on the Toronto Stock Exchange
Stock Symbol – TIH
Design and Coordination: Ove Design & Communications www.ovedesign.com Editorial: Fundamental Creative Inc.
This annual report was printed in Canada
on stock manufactured chlorine-free with
10% post-consumer fibre.
Tel: 416.667.5511
Fax: 416.667.5555
E-mail: [email protected]
www.toromont.com
How to Reach Our Transfer Agent and Registrar
Common Shares
Toromont Industries Ltd.Corporate Office3131 Highway 7 WestP.O. Box 5511Concord ON L4K 1B7Tel: 416 667 5511www.toromont.com