Embed Size (px)
Citation preview
N87- 16046
ANALYSIS AND SIMULATION OF THE MAST (COFS-I FLIGHT HARDWARE)
Lucas G. Horta, Joanne L. Walsh, Garnett C. Horner
NASA Langley Research Center
and
James P. Bailey
PRC - Kentron
Hampton, Virginia
First NASA/DOD CSI Technology Conference
November 18-21, 1986
515
https://ntrs.nasa.gov/search.jsp?R=19870006613 2018-09-02T04:08:40+00:00Z
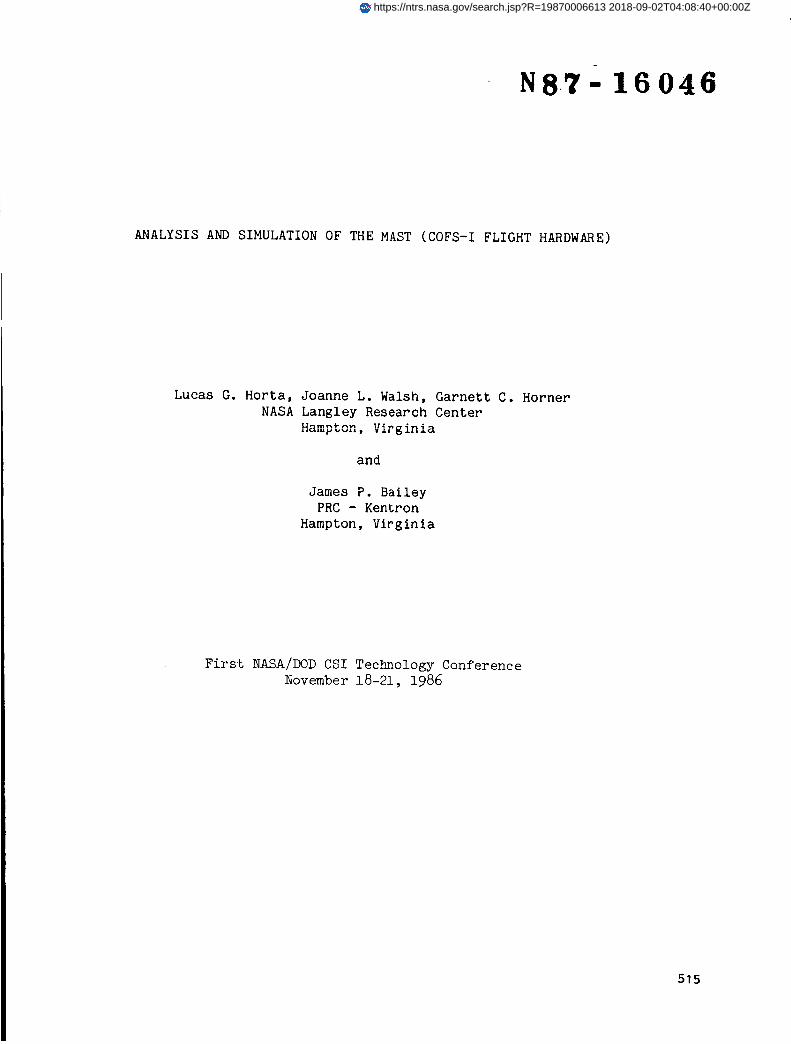
The Cont ro l of F l e x i b l e S t r u c t u r e s (COFS) program involves ground and f l i g h t t e s t s of l a r g e f l e x i b l e space s t r u c t u r e s such as t h e one shown i n f i g u r e 1 . The MAST (COFS-I) f l i g h t experiment is the i n i t i a l phase of t h i s program. An overview of t h e program i s presented i n re ferences 1 and 2. The program includes t h e design and f a b r i c a t i o n of 60 meter deployable t r u s s with sensors and ac tua to r s a t tached a t pre-selected loca t ions . The s t r u c t u r e w i l l be used i n a mul t i - f l i gh t experimental program t o understand t h e dynamic behavior of joint-dominated structures, t o supply a test bed f o r t h e implementation of modern c o n t r o l a lgor i thm f o r v i b r a t i o n suppress ion , and t o perform on/off l i n e system i d e n t i f i c a t i o n .
This paper p re sen t s some o f t he in-house a n a l y s i s work performed t o eva lua te the proposed des ign conf igu ra t ion , c o n t r o l l e r des ign as well as ac tua to r dynamic modeling, and MAST/actuator dynamic s imula t ion f o r e x c i t a t i o n and damping. The MAST is modeled us ing t h e Engineering Analysis Language (EAL, ref. 3 ) f i n i t e element a n a l y s i s program. An op t imiza t ion procedure which minimizes weight w h i l e t r y i n g t o main ta in modal coupl ing is d iscussed . This op t imiza t ion procedure f a c i l i t a t e s i nco rpora t ion of a d d i t i o n a l c o n s t r a i n t s no t considered i n t h e MAST b a s e l i n e design. Mode shapes from EAL are used t o c o n s t r u c t a reduced o rde r model of t h e MAST f o r closed-loop s imulat ion. Details on t h e proposed a c t u a t o r l o c a t i o n , number, and c h a r a c t e r i s t i c s are d iscussed as well as some of the a l t e r n a t e ways t o use them. Simple ra te feedback laws are implemented t o show t h e v i a b i l i t y of the proposed experiment. Complete s imula t ion inc ludes e x c i t a t i o n and damping us ing t h e same se t of a c t u a t o r s .
Figure 1
51 6
MAST FINITE ELEMENT MODEL
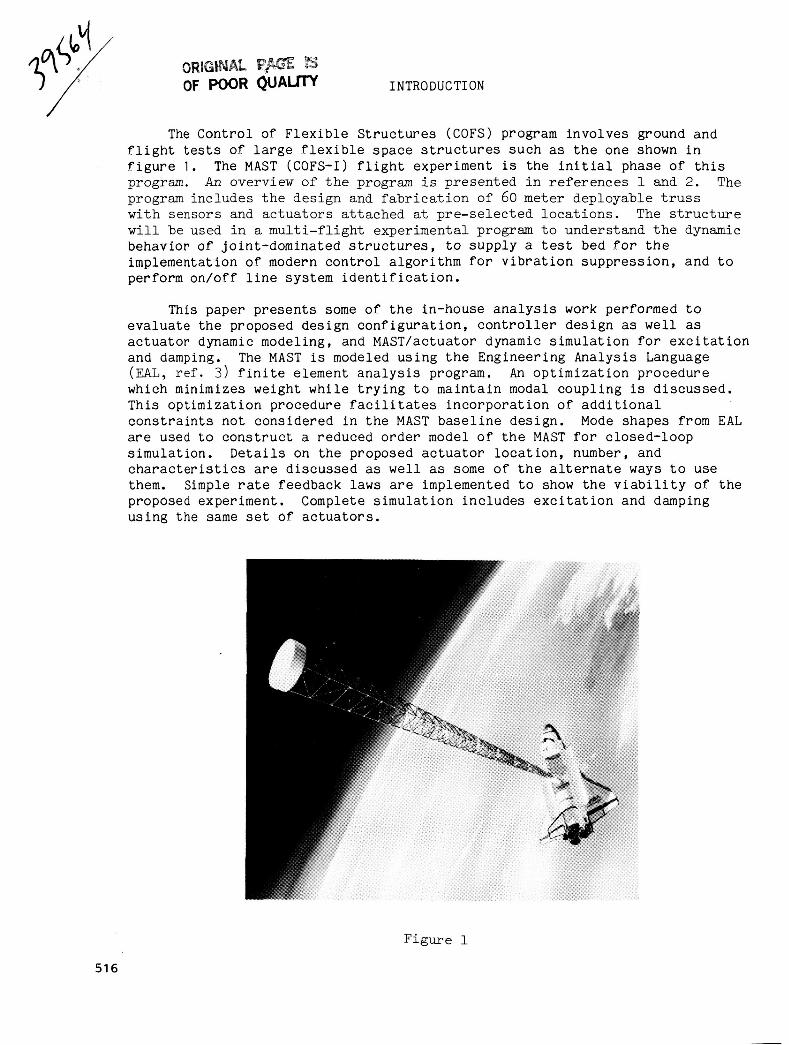
The finite element model (FEM) of the MAST is shown in figure 2. The
truss beam is 60 meters long and consists of 54 bays of single-laced latticed
beams. The longerons which form the vertices of the triangular cross-sections
have unequal areas resulting in one strong and two weak longerons. The strong
longeron is aligned with the centerline of the Shuttle axis. The longerons
and diagonals are modeled using tube elements. The model includes the
deployer retractor assembly, Shuttle inertia properties (modeled with beam
elements), rigid platforms for sensors and actuators allocation, and a
parameter modification package. There are three secondary actuator locations
distributed along the beam (bays 12, 30, and 44) and one primary at the tip.
Each of the secondary actuator stations contains two actuators acting in the
same plane. The primary station has four actuators to impart torques as well
as in-plane forces. Also included are two sensor measurement stations (bays
24 and 48) for the implementation of non-collocated control laws. At the beam
tip, in addition to the actuators, a parameter modification package composed
of four masses constrained to move along a track are used to vary the
structure center of mass. These four masses can be independently operated to
achieve high modal coupling. The FEM also contains lumped masses at each
joint location and cable mass for the electronic components distributed along
the beam.
BAY
Figure 2
517
MAST BEAM DESCRIPTION
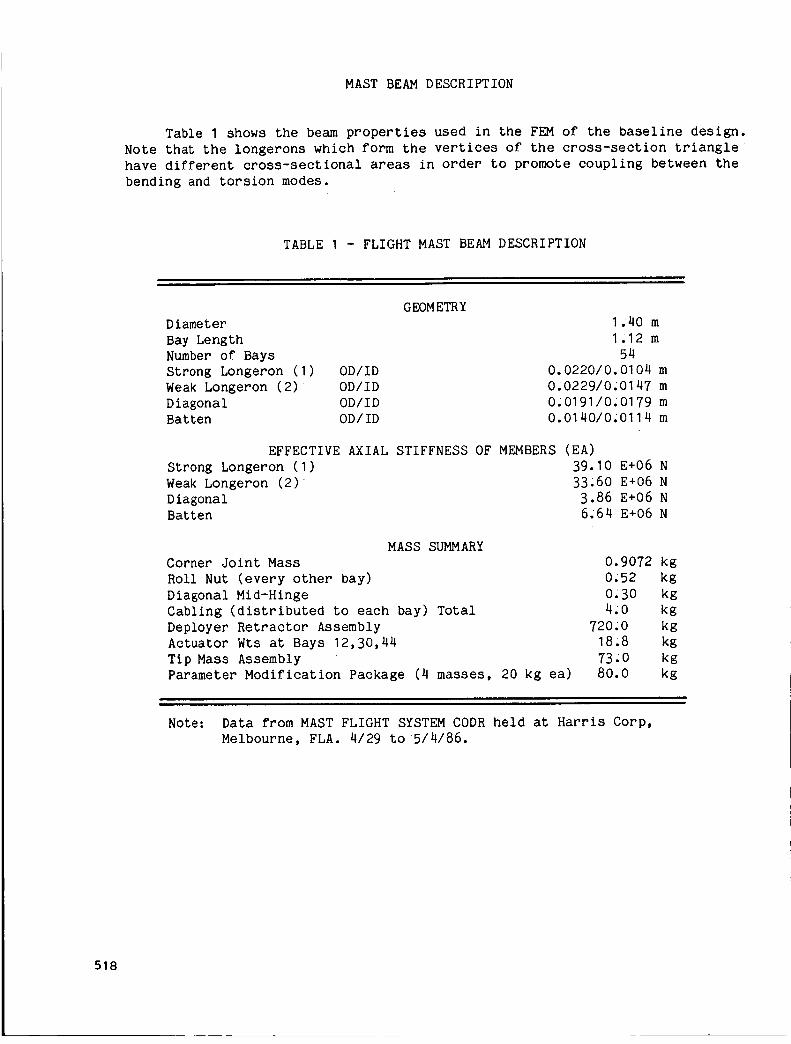
Table I shows the beam properties used in the FEM of the baseline design.
Note that the longerons which form the vertices of the cross-section triangle
have different cross-sectional areas in order to promote coupling between the
bending and torsion modes.
TABLE I - FLIGHT MAST BEAM DESCRIPTION
G EOM ETR Y
Diameter
Bay Length
Number of Bays
Strong Longeron (I) OD/ID
Weak Longeron (2) OD/ID
Diagonal OD/ID
Batten OD/ID
1.40 m
I.12 m
54
0.0220/0.0104 m
0.0229/0.0147 m
0.0191/0.0179 m
0.0140/0.0114 m
EFFECTIVE AXIAL STIFFNESS OF MEMBERS (EA)
Strong Longeron (I) 39.10 E÷06 N
Weak Longeron (2) 33_60 E+06 N
Diagonal 3.86 E+06 N
Batten 6J64 E+06 N
MASS SUMMARY
Corner Joint Mass
Roll Nut (every other bay)
Diagonal Mid-Hinge
Cabling (distributed to each bay) Total
Deployer Retractor Assembly
Actuator Wts at Bays 12,30,44
Tip Mass Assembly
Parameter Modification Package (4 masses, 20 kg ea)
0.9072 kg
0.52 kg
0_30 kg
4.0 kg
720_0 kg
18.8 kg
73.0 kg
80.0 kg
Note: Data from MAST FLIGHT SYSTEM CODR held at Harris Corp,
Melbourne, FLA. 4/29 to 5/4/86.
518
EIGENVALUES AND MODE SHAPES OF MAST FINITE ELEMENT MODEL
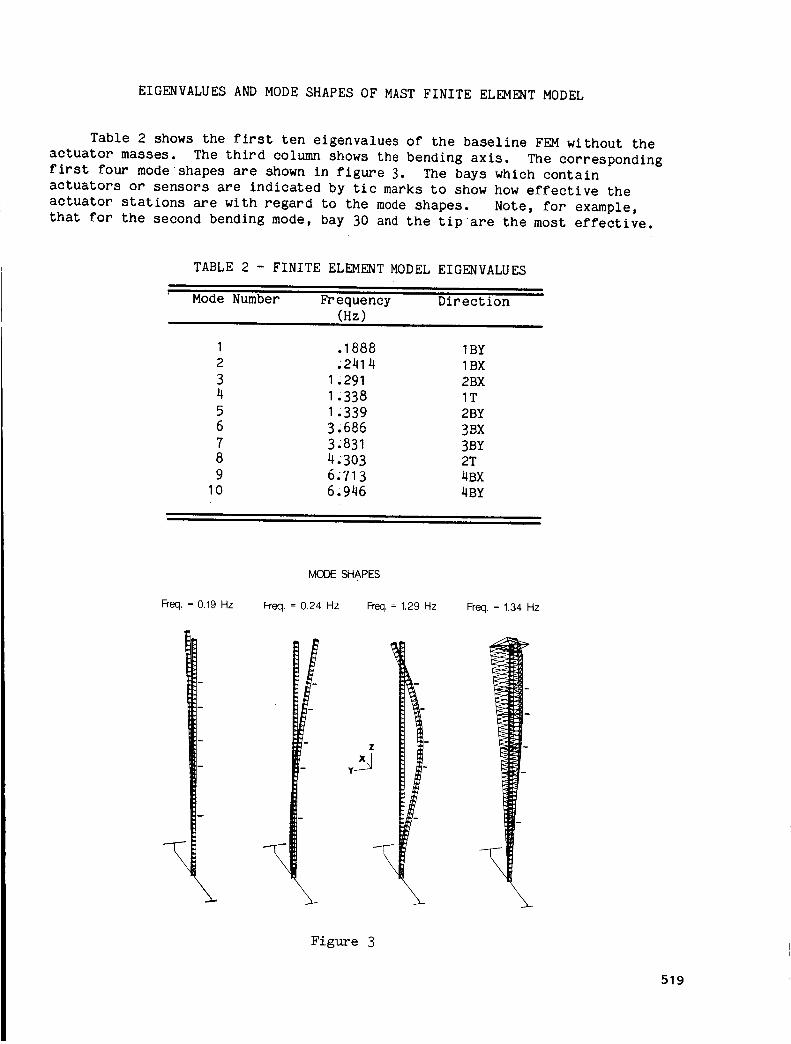
Table 2 shows the first ten eigenvalues of the baseline FEM without the
actuator masses. The third column shows the bending axis. The corresponding
first four modeshapes are shown in figure 3. The bays which contain
actuators or sensors are indicated by tic marks to show how effective the
actuator stations are with regard to the mode shapes. Note, for example,
that for the second bending mode, bay 30 and the tipare the most effective.
TABLE 2 - FINITE ELEMENT MODEL EIGENVALUES
Mode Number Frequency Direction
(Hz)
I .1888 IBY
2 ;241 4 IBX
3 I ,291 2BX
4 I ,338 IT
5 1,339 2BY
6 3,686 _X
7 3;831 3BY
8 4,303 2T
9 6;713 4BX
10 6;946 4BY
MODESHAPES
Freq. = 0.19 Hz Freq. = 0.24 Hz Freq.= 1.29 Hz
\
Z
Freq. = 1.34 Hz
Figure 3
519
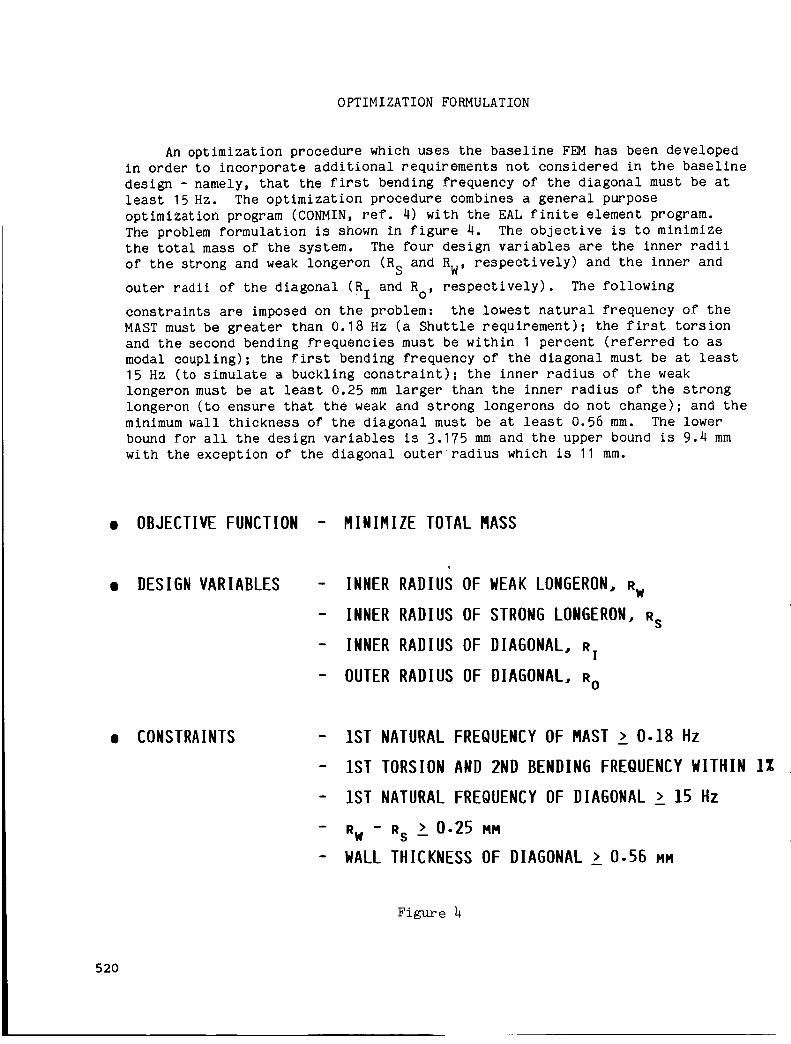
OPTIMIZATION FORMULATION
An optimization procedure which uses the baseline FEM has been developed
in order to incorporate additional requirements not considered in the baseline
design - namely, that the first bending frequency of the diagonal must be at
least 15 Hz. The optimization procedure combines a general purpose
optimization program (CONMIN, ref. 4) with the EAL finite element program.
The problem formulation is shown in figure 4. The objective is to minimiZe
the total mass of the system. The four design variables are the inner radii
of the strong and weak longeron (RS and RW, respectively) and the inner and
outer radii of the diagonal (RI and Ro, respectively). The following
constraints are imposed on the problem: the lowest natural frequency of the
MAST must be greater than 0.18 Hz (a Shuttle requirement); the first torsion
and the second bending frequencies must be within I percent (referred to as
modal coupling); the first bending frequency of the diagonal must be at least
15 Hz (to simulate a buckling constraint); the inner radius of the weak
longeron must be at least 0.25 mm larger than the inner radius of the strong
longeron (to ensure that the weak and strong longerons do not change); and the
minimum wall thickness of the diagonal must be at least 0.56 mm. The lower
bound for all the design variables is 3.175 mm and the upper bound is 9.4 mm
with the exception of the diagonal outer radius which is 11 mm.
• OBJECTIVE FUNCTION - MINIMIZE TOTAL I=IASS
• DESIGN VARIABLES - INNER RADIUS OF WEAK LONGERON, RN
- INNER RADIUS OF STRONGLONGERON, Rs
- INNER RADIUS OF DIAGONAL, e!
- OUTER RADIUS OF DIAGONAL, eo
• CONSTRAINTS - 1ST NATURAL FREQUENCYOF mAST > 0.18 Hz
- 1ST TORSION AND 2ND BENDING FREQUENCYWITHIN lZ
- 1ST NATURAL FREQUENCYOF DIAGONAL > 15 Hz
- Rw - Rs _ 0.25 ee
- gALL THICKNESS OF DIAGONAL > 0.56 NM
Figure
520
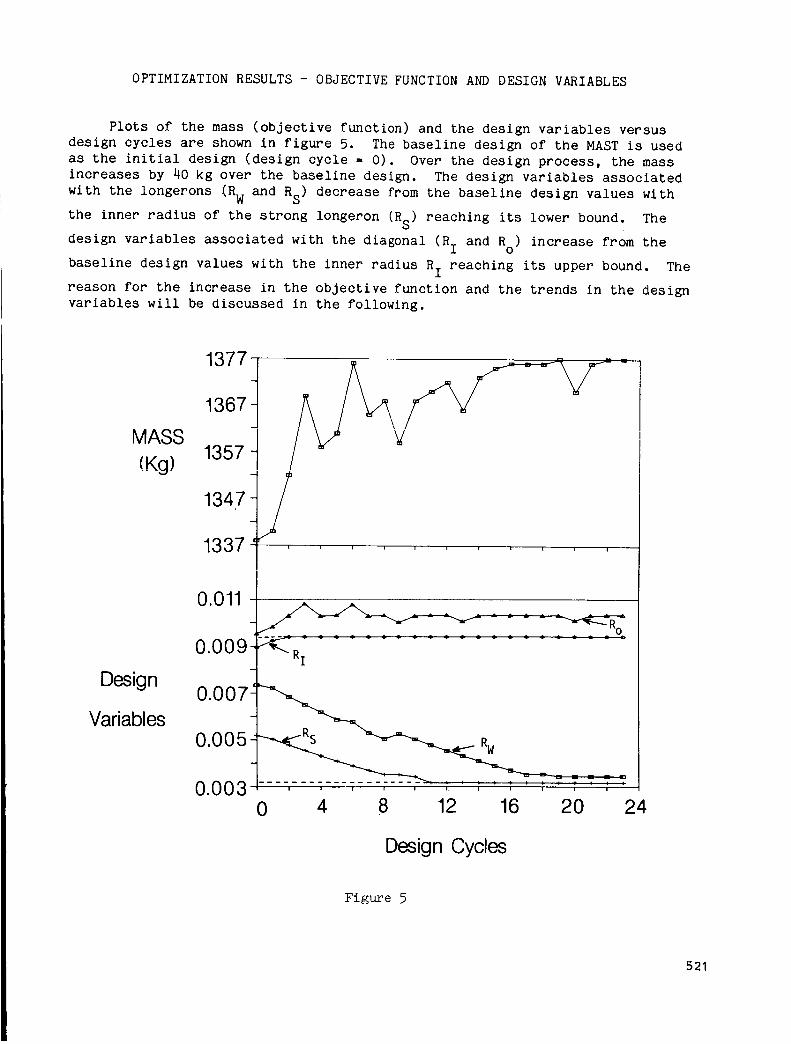
OPTIMIZATION RESULTS - OBJECTIVE FUNCTION AND DESIGN VARIABLES
Plots of the mass (objective function) and the design variables versus
design cycles are shown in figure 5. The baseline design of the MAST is used
as the initial design (design cycle = 0). Over the design process, the mass
increases by 40 kg over the baseline design. The design variables associated
with the longerons (RW and RS) decrease from the baseline design values with
the inner radius of the strong longeron (Rs) reaching its lower bound. The
design variables associated with the diagonal (RI and Ro) increase from the
baseline design values with the inner radius R I reaching its upper bound. The
reason for the increase in the objective function and the trends in the design
variables will be discussed in the following.
1377
AMASS
Design
Variables
1347
1337
0.011
/i i i i i i _ I i i
0.009_
0 4 8 12 16 20 24
Design Cycles
Figure 5
521
OPTIMIZATION RESULTS- CONSTRAINTS
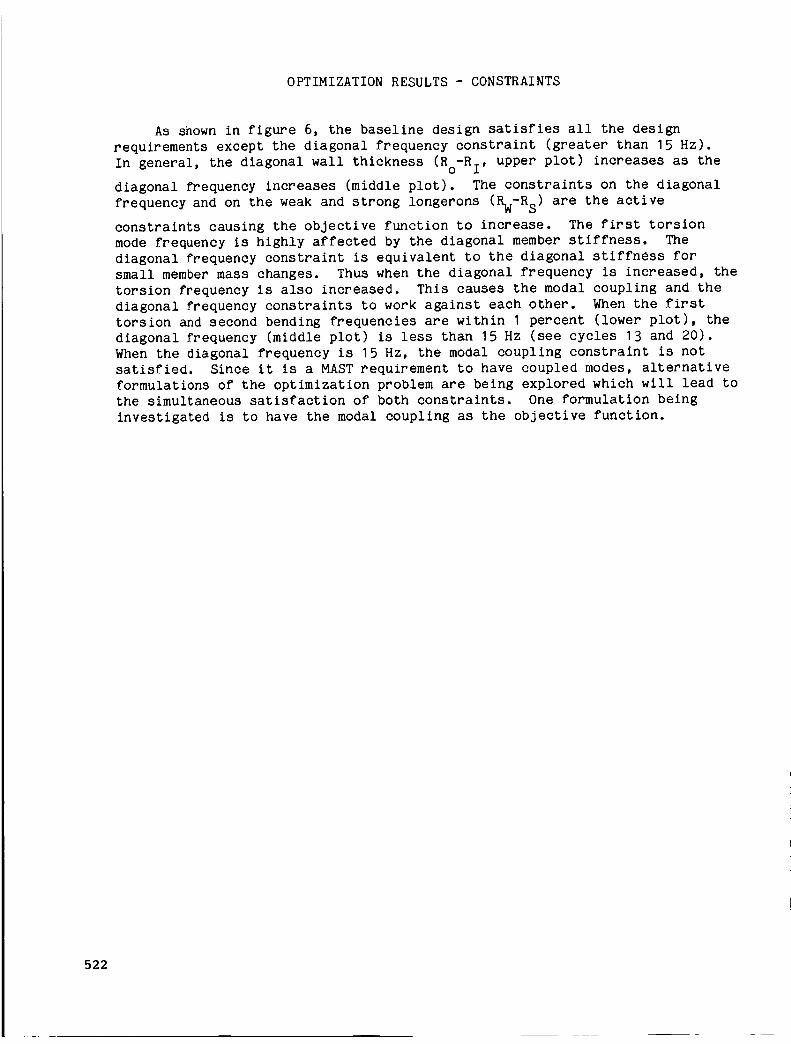
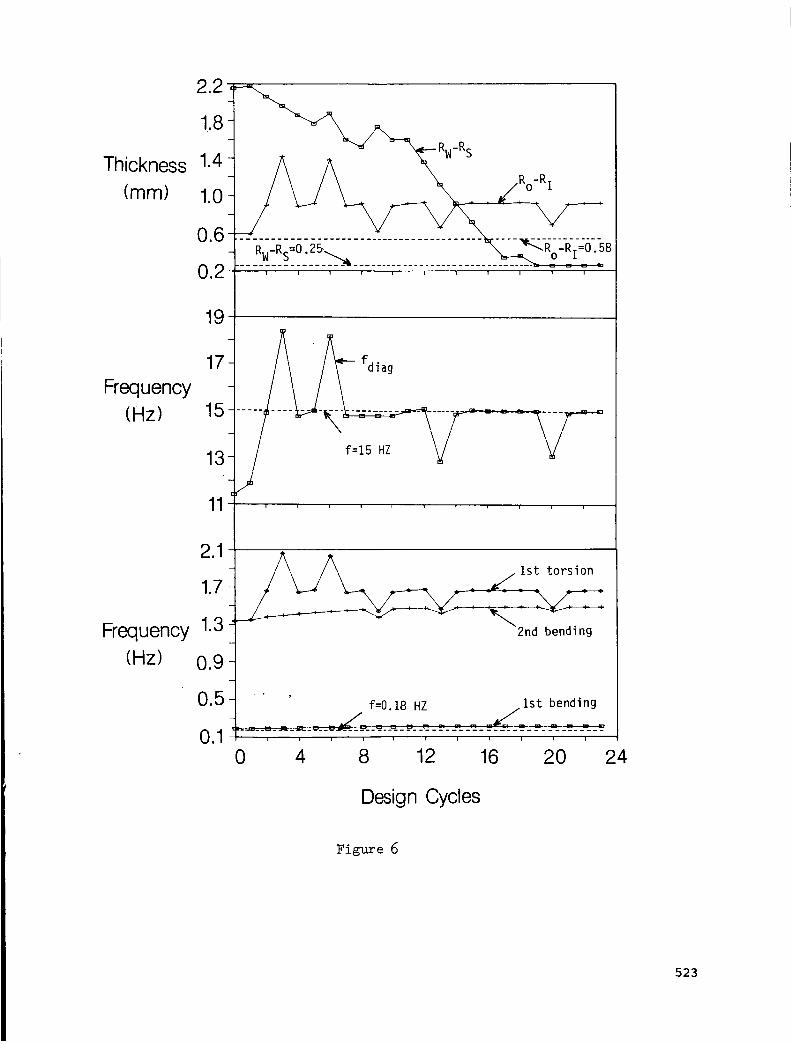
As shown in figure 6, the baseline design satisfies all the design
requirements except the diagonal frequency constraint (greater than 15 Hz).
In general, the diagonal wall thickness (Ro-R I, upper plot) increases as the
diagonal frequency increases (middle plot). The constraints on the diagonal
frequency and on the weak and strong longerons (Rw-R S) are the active
constraints causing the objective function to increase. The first torsion
mode frequency is highly affected by the diagonal member stiffness. The
diagonal frequency constraint is equivalent to the diagonal stiffness for
small member mass changes. Thus when the diagonal frequency is increased, the
torsion frequency is also increased. This causes the modal coupling and the
diagonal frequency constraints to work against each other. When the first
torsion and second bending frequencies are within I percent (lower plot), the
diagonal frequency (middle plot) is less than 15 Hz (see cycles 13 and 20).
When the diagonal frequency is 15 Hz, the modal coupling constraint is not
satisfied. Since it is a MAST requirement to have coupled modes, alternative
formulations of the optimization problem are being explored which will lead to
the simultaneous satisfaction of both constraints. One formulation being
investigated is to have the modal coupling as the objective function.
522
Thickness
(mm)
Frequency
(Hz)
Frequency(Hz)
19
15 ....
131/t
11
2.1
1.7
1.3
0.9
0.5
0.1
e- fdiag
_=15Hz I/ V
.1st torsion
2nd bending
' " ' f:0.18 HZ 1st bending
_.:=___-__=_. _=___=__=___=__=__=_____/_. __-_=__i , i , , i J i i i
0 4 8 12 16 20 24
Design Cycles
Figure 6
523
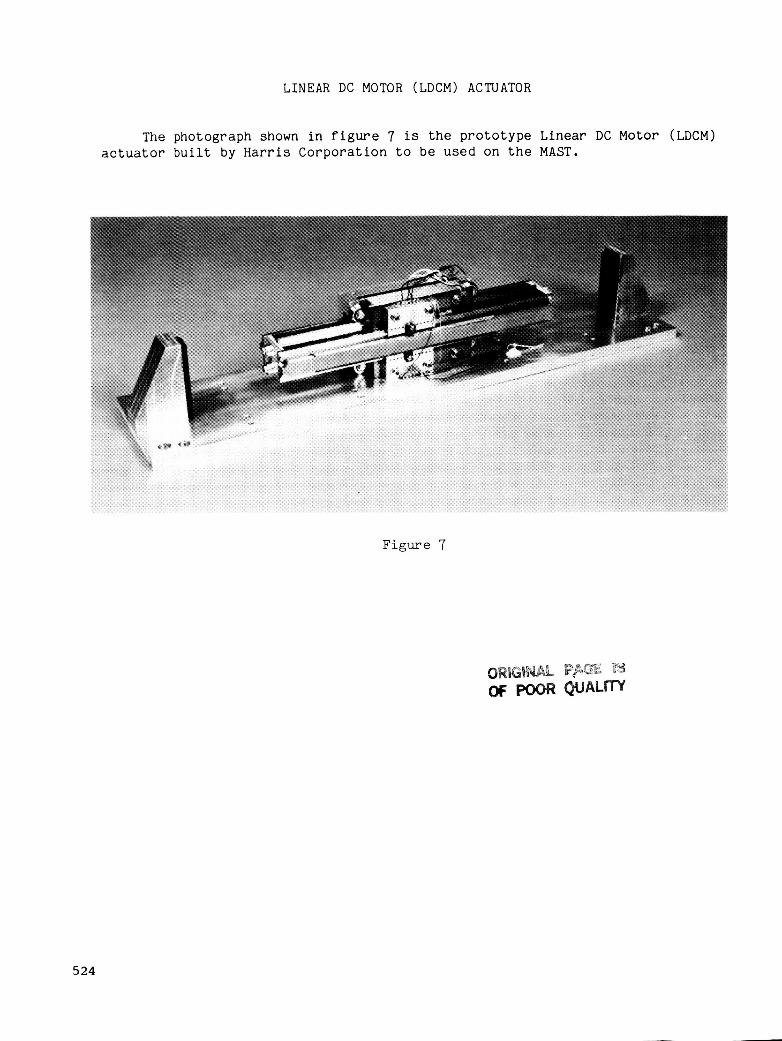
LINEAR DC MOTOR (LDCM) ACTUATOR
The photograph shown i n f i g u r e 7 is t h e p ro to type Linear DC Motor (LDCM) actuator b u i l t by Harris Corpora t ion t o be used on t h e MAST.
Figure 7
524
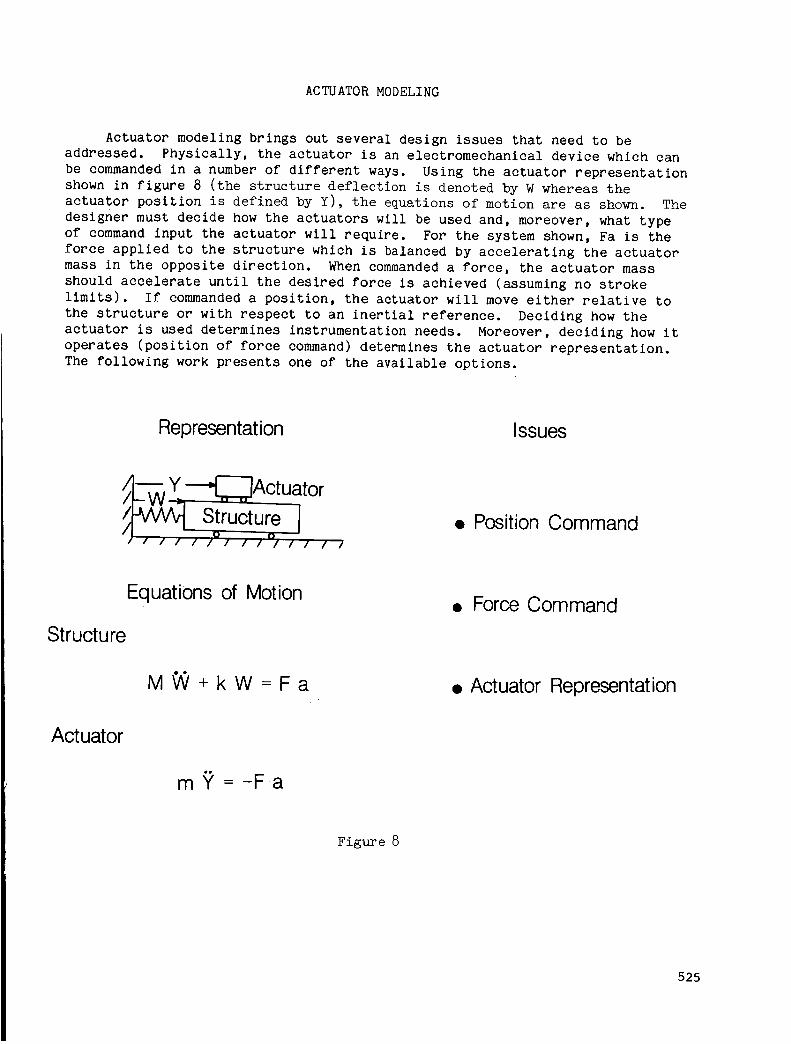
ACTUATORMODELING
Actuator modeling brings out several design issues that need to beaddressed. Physically, the actuator is an electromechanical device which canbe commandedin a numberof different ways. Using the actuator representationshownin figure 8 (the structure deflection is denoted by Wwhereas theactuator position is defined by Y), the equations of motion are as sho_-n. Thedesigner must decide how the actuators will be used and, moreover, what typeof commandinput the actuator will require. For the system shown, Fa is theforce applied to the structure which is balanced by accelerating the actuatormass in the opposite direction. Whencommandeda force, the actuator massshould accelerate until the desired force is achieved (assuming no strokelimits). If commandeda position, the actuator will moveeither relative tothe structure or with respect to an inertial reference. Deciding how theactuator is used determines instrumentation needs. Moreover, deciding how itoperates (position of force command)determines the actuator representation.The following work presents one of the available options.
Representation Issues
_L_--wY --'{_Actuator
Structure ]"_ , ,, ,, ,, /v zz511 z
• Position Command
EquatiOns of Motion
Structure
• Force Command
M_+kW=Fa • Actuator Representation
Actuator
mg=-Fa
Figure 8
525
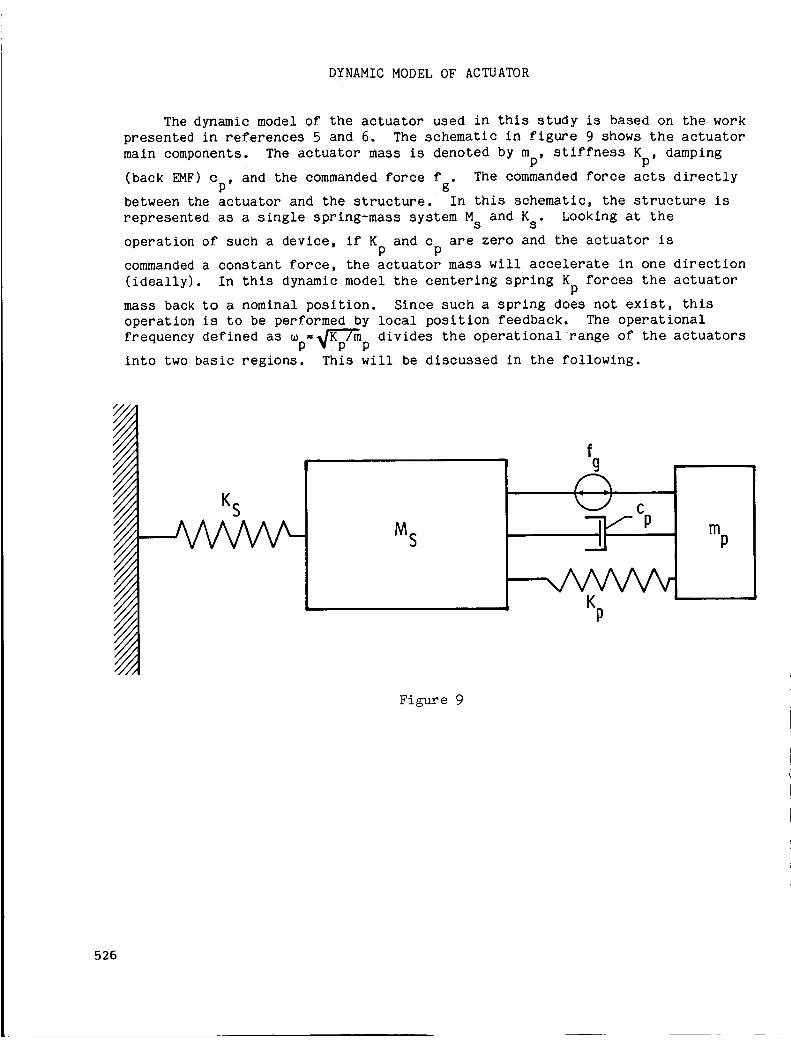
DYNAMIC MODEL OF ACTUATOR
The dynamic model of the actuator used in this study is based on the work
presented in references 5 and 6. The schematic in figure 9 shows the actuator
main components. The actuator mass is denoted by mp, stiffness Kp, damping
(back EMF) Cp, and the commanded force fg. The commanded force acts directly
between the actuator and the structure. In this schematic, the structure is
represented as a single spring-mass system Ms and Ks . Looking at the
operation of such a device, if K and c are zero and the actuator isP P
commanded a constant force, the actuator mass will accelerate in one direction
(ideally). In this dynamic model the centering spring Kp forces the actuator
mass back to a nominal position. Since such a spring does not exist, this
operation is to be performed by local position feedback. The operational
frequency defined as Up P divides the operationalrange of the actuators
into two basic regions. This will be discussed in the following.
M S
Figure 9
fg
#-hc
mP
526
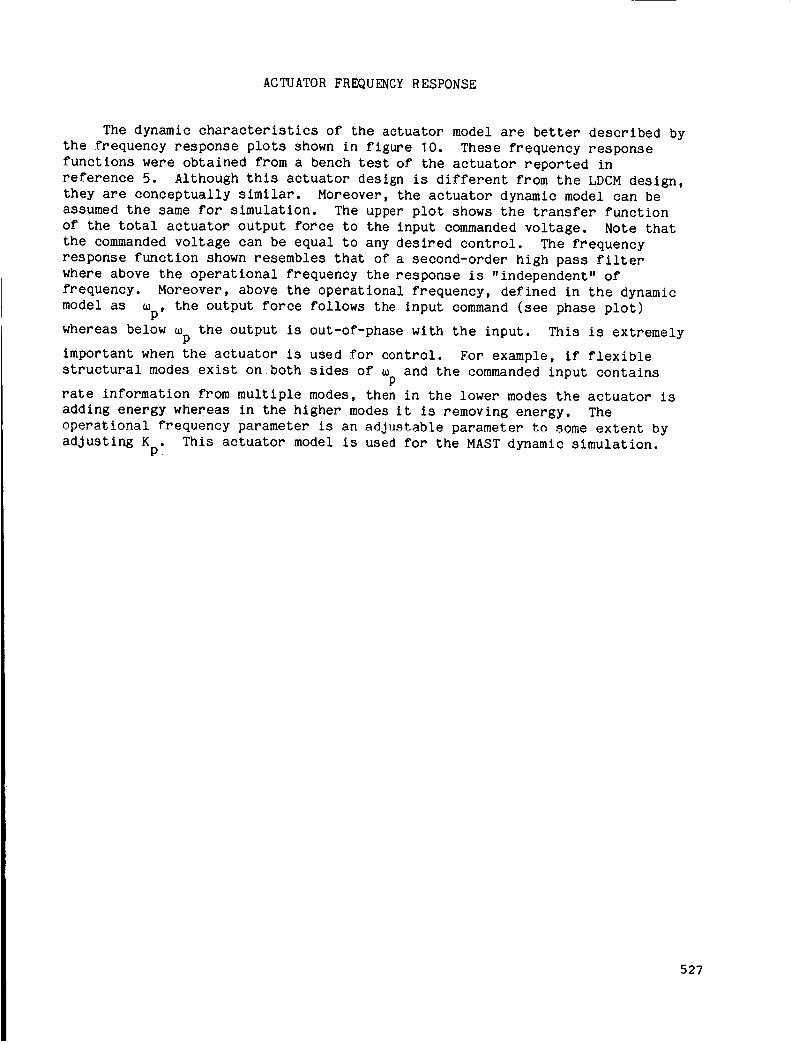
ACTUATORFREQUENCYRESPONSE
The dynamic characteristics of the actuator model are better described bythe frequency response plots shownin figure 10. These frequency responsefunctions were obtained from a bench test of the actuator reported inreference 5. Although this actuator design is different from the LDCMdesign,they are conceptually similar. Moreover, the actuator dynamic model can beassumedthe samefor simulation. The upper plot shows the transfer functionof the total actuator output force to the input commandedvoltage. Note thatthe commandedvoltage can be equal to any desired control. The frequencyresponse function shownresembles that of a second-order high pass filterwhere above the operational frequency the response is "independent" offrequency. Moreover, above the operational frequency, defined in the dynamicmodel as mp, the output force follows the input command(see phase plot)
whereas below mpthe output is out-of-phase with the input. This is extremelyimportant when the actuator is used for control. For example, if flexiblestructural modesexist on both sides of m and the commandedinput containsPrate information from multiple modes, then in the lower modesthe actuator isadding energy whereas in the higher modesit is removing energy. Theoperational frequency parameter is an adjustable parameter to someextent byadjusting Kp. This actuator model is used for the MASTdynamic simulation.
527
ACTUATOR FREQUENCY RESPONSE--MAGNITUDE
-8O
-6O
A
(:13
-40E
¢o
\
-2O \
IllliIIII
_11II]_
0.1
/t"
rtIIIIIIIII/
1.0
P .L_II1(IIIIIIIIII1IIIIIIIIII
0 wp 10. 0
Frequency (Hz)
ACTUATOR FREQUENCY RESPONSE--PHASE
180,
9O
oiO3
(-.
O-
-90
-180-
I
I
IiI
I.!
I/
V
//'
i iI I
i
I
I
i :
i!i
I
!
0.1
Frequency (Hz)
v_
1.0 CUp 10.0
Figure I0
528
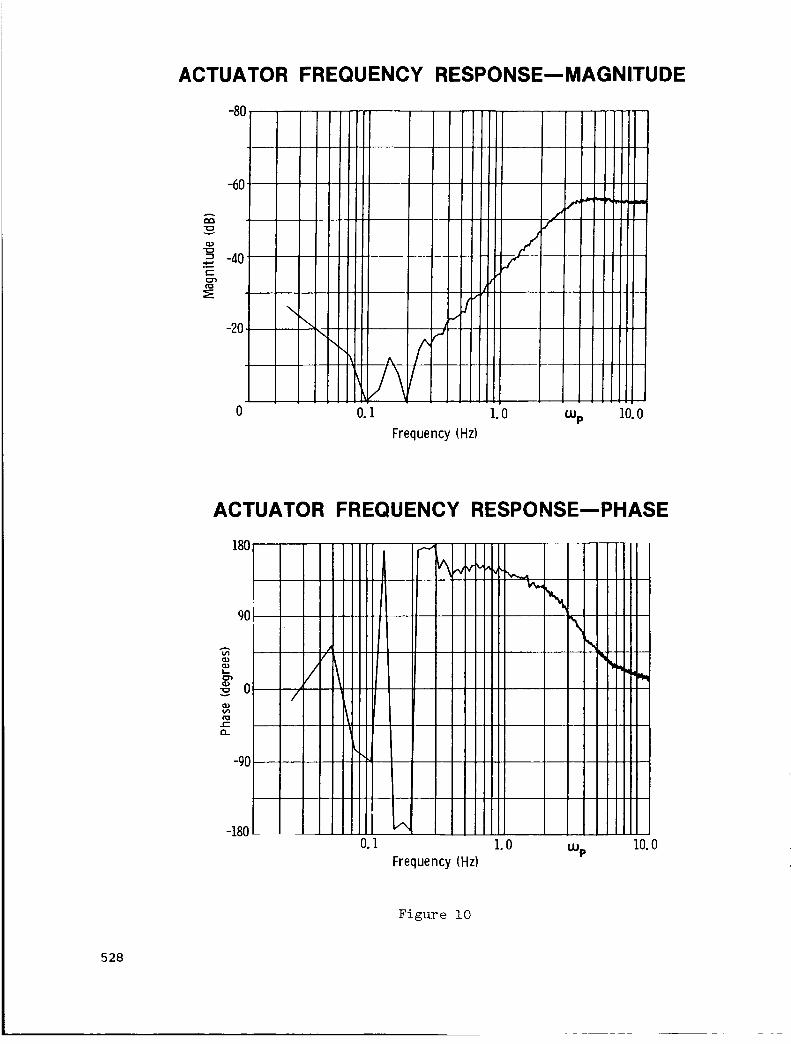
MASTDYNAMICSIMULATION
The dynamic model of the actuator is incorporated into a reduced ordermodel of the MAST. This model contains 6 rigid body modesand 10 flexiblemodes• A total of ten actuators are present but only the tip aCtuators areused in this simulation• The proposed MASTflight experiment as envisionedinvolves three phases - excitation, free vibration (dwelling), and control(damping)• A test sequence is simulated where the sameset of actuators isused for excitation and damping of the beam. For excitation the commandedforce to the actuator is f = sin _t. The frequency is that of the first
gbending mode0.19 Hz. For control the commandedforce is proportional to the
beamrate fg= C W. The proportionality constant C is obtain by pole placementof the first two bending modesto achieve 5 percent modal damping. Theactuator operational frequency is set to 0.1Hz. The simulated tip responseis shown in the upper plot of figure 11 andthecorresponding actuator strokeoutput in the lower plot. A complete sequence (excitation, dwell, anddamping) is presented. The excitation f is turned-off after a beam
gdeflection of 10 cm is reached (t=60.4 sec). The beamis allowed to vibrate•r_j for 20 Secondsand the control is ...... _-^ for *_^ last _n seconds _,^°jv
the simulation.
TIP DEFLECTION
(M)
ACTUATOR
STROKE
(M)
0.12
0.08
0.04
0.00
-0.04
-0.08
-0.12
0.30
Excitation ----_Dwell-,{-Damp
°'°AA A AAAAA
-0.30/0 20 40 60 80 100
TIME (SEC)
Figure Ii
529
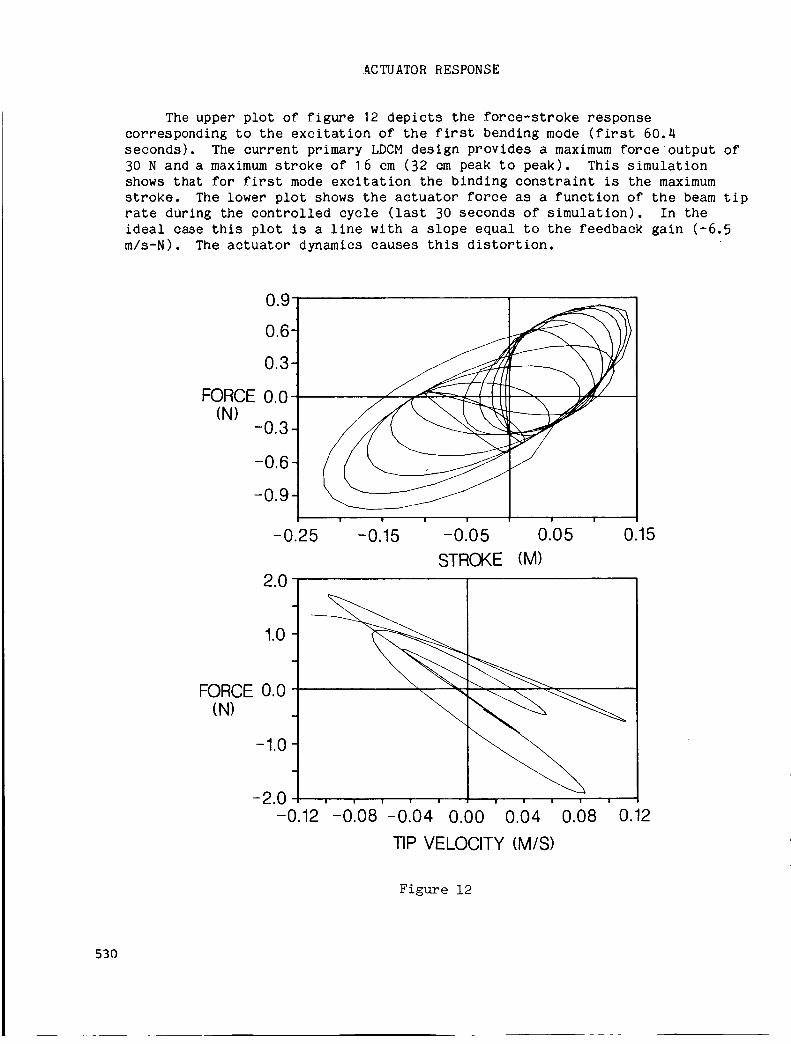
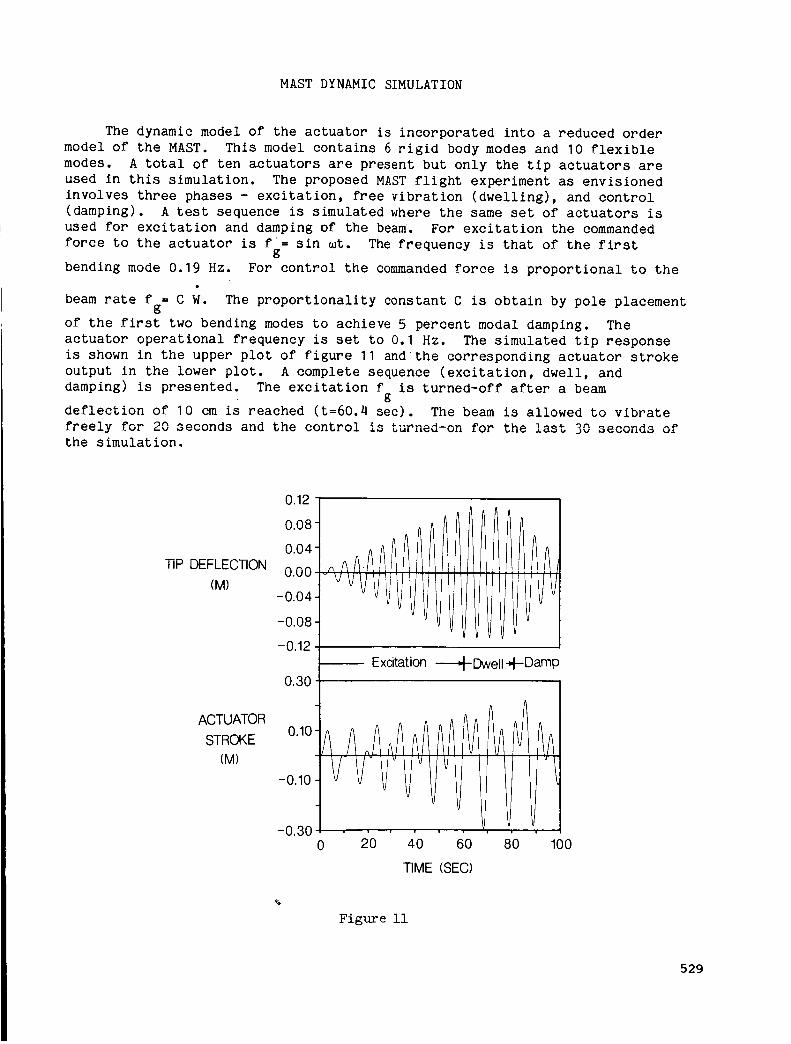
ACTUATORRESPONSE
The upper plot of figure 12 depicts the force-stroke responsecorresponding to the excitation of the first bending mode (first 60.4seconds). The current primary LDCMdesign provides a maximumforce output of30 N and a maximumstroke of 16 cm (32 cm peak to peak). This simulationshows that for first modeexcitation the binding constraint is the maximumstroke. The lower plot shows the actuator force as a function of the beamtiprate dUring the controlled cycle (last 30 seconds of simulation). In theideal case this plot is a line with a slope equal to the feedback gain (-6.5m/s-N). The actuator dynamics causes this distortion.
03
FORCE 0.0{N)
-0.3
-0.6
-0.9
-0.25
2.0
I ! I I | I
-0.15 -0.05 0.05
STROKE (M)
FORCE 0.0(N)
-1.0
-2.0 ..........-0.12 -0.08 -0.04
0.15
0.00 0.04 0.08 0.12
TIP VELOCITY (M/S)
Figure 12
530
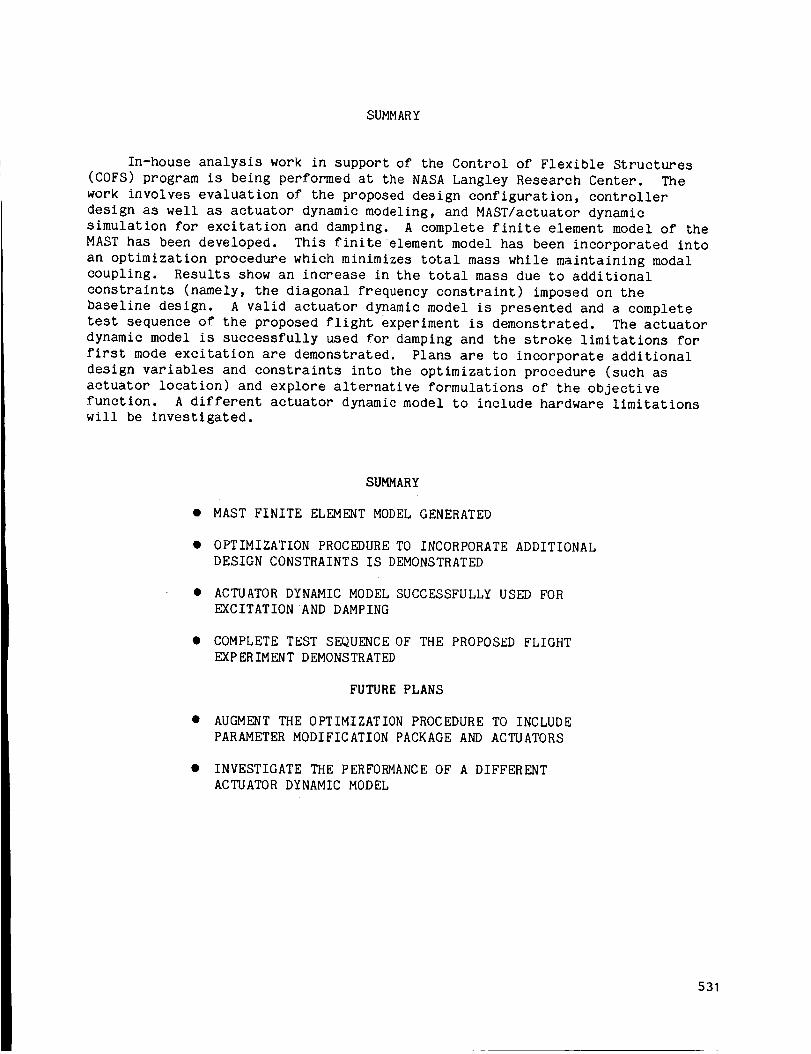
SUMMARY
In-house analysis work in support of the Control of Flexible Structures(COFS)program is being performed at the NASALangley Research Center. Thework involves evaluation of the proposed design configuration, controllerdesign as well as actuator dynamic modeling, and MAST/actuator dynamicsimulation for excitation and damping. A complete finite element model of theMASThas been developed. This finiteelement model has been incorporated intoan optimization procedure which minimizes total masswhile maintaining modalcoupling. Results showan increase in the total massdue to additionalconstraints (namely, the diagonal frequency constraint) imposedon thebaseline design. A valid actuator dynamic model is presented and a completetest sequence of the proposed flight experiment is demonstrated. The actuatordynamic model is successfully used for damping and the stroke limitations forfirst modeexcitation are demonstrated. Plans are to incorporate additionaldesign variables and constraints into the optimization procedure (such asactuator location) and explore alternative formulations of the objectivefunction. A different actuator dynamicmodel to include hardware limitationswill be Investigated.
SUMMARY
• MAST FINITE ELEMENT MODEL GENERATED
• OPTIMIZATION PROCEDURE TO INCORPORATE ADDITIONAL
DESIGN CONSTRAINTS IS DEMONSTRATED
• ACTUATOR DYNAMIC MODEL SUCCESSFULLY USED FOR
EXCITATIONAND DAMPING
• COMPLETE TEST SEQUENCE OF THE PROPOSED FLIGHT
EXPERIMENT DEMONSTRATED
FUTURE PLANS
• AUGMENT THE OPTIMIZATION PROCEDURE TO INCLUDE
PARAMETER MODIFICATION PACKAGE AND ACTUATORS
• INVESTIGATE THE PERFORMANCE OF A DIFFERENT
ACTUATOR DYNAMIC MODEL
531
R EFER ENC ES
I •
.
o
•
o
.
Hanks, B.R.: "Control of Flexible Structures (COFS) Flight Experiment
Background and Description," Large Space Antenna Systems Technology
1984. NASA CP-2368, Part 2, December 1984, pp. 893-902.
Horner, G. C.: "COFS-I Program Overview," To be presented at the
First NASA/DOD CSI Technology Conference, Norfolk, Virginia,
November 18-21, 1986.
Whetstone, W. D.: EISI-EAL Engineering Analysis Language Reference
Manual - EISI-EAL System Level 2091. Engineering Information
Systems, Inc., July 1983•
Vanderplaats, Garret N.: CONMIN A FORTRAN Program for Constrained
Function Minimization - User's Manual. NASA TM X-62282, 1973.
Zimmerman, D.C.: "Dynamic Characterization and Microprocessor
Control of the NASA/UVA Proof Mass Actuator," M.S. Thesis,
University of Buffalo, June 1984.
Zimmerman, D. C.; Inman, D.J.; and Horner, G. C.: "Dynamic
Characterization and Microprocessor Control of the NASA/UVA/UB Proof
Mass Actuator," Proceedings of the 25th AIAA/ASME/ASCE/AHS
Structure, Structural Dynamics and Materials Conference.
Palm Springs, Ca. May 1984, Paper No. 84-1077•
532