Embed Size (px)
Citation preview

Climatic Change (2012) 110:755–782DOI 10.1007/s10584-011-0094-9
N2O emissions of India: an assessment of temporal,regional and sector trends
Amit Garg · P. R. Shukla · Jigeesha Upadhyay
Received: 6 July 2010 / Accepted: 16 April 2011 / Published online: 12 May 2011© Springer Science+Business Media B.V. 2011
Abstract This paper estimates the national level trend of India’s N2O emissions from1985–2005 and detailed sub-regional (594 districts) level and sector emissions for theyear 2005. N2O emissions are estimated using the latest methodologies (IPCC 2006),disaggregated activity data and indigenized emission factors. The estimates show thatIndia’s N2O emissions have grown from 144 Gg in 1985 to 267 Gg in 2005 exhibitinga compounded annual growth rate of 3.1%, which has been gradually declining from4.7% over 1985–1990 to 2.4% over 2000–2005. N-fertilizer application contributedmost to N2O emissions, a 49% share in 2005 compared to 40% in 1985. Sub-regional(district-level) distribution of N2O emissions showed rising mean and spread overthe years, with average emissions per districts increasing from 305 ton N2O per yearin 1990 to 450 tons in 2005. The main reason being increased use of N-fertilizer.However crop selection plays an important role in N2O emissions and there arecrops providing high economic returns but low N-fertilizer requirements. Agriculturesector could contribute considerably to GDP even with very low N2O emissions.Indian agriculture practices vary widely in input applications and crop yields acrossstates. The gradual transition from traditional to modern agriculture over past twodecades has enhanced the intensity of inputs like N-fertilizer. A simple correlation
A. Garg (B)Indian Institute of Management, W16B, Indian Institute of Management Ahmedabad,Vastrapur, Ahmedabad, 380015, Indiae-mail: [email protected]
P. R. ShuklaIndian Institute of Management, W3G, Indian Institute of Management Ahmedabad,Vastrapur, Ahmedabad, 380015, India
J. UpadhyayIndian Institute of Management, W1A, Indian Institute of Management Ahmedabad,Vastrapur, Ahmedabad, 380015, India

756 Climatic Change (2012) 110:755–782
based on 1985–2005 trends shows that, ceteris paribus, a 10% increase in total cropproduction is accompanied with a 12.4% increase in N-fertilizer application and a9.7% increase in total N2O emissions from India.
1 Introduction
Nitrous oxide (N2O) is one of the six Kyoto greenhouse gases (GHG) contributingaround 5% of the global GHG emissions (IPCC 2007a). Much concern is shownabout it due to several reasons: (1) longer atmospheric lifetime and high global warm-ing potential—310 times greater than carbon dioxide over a 100 year period (IPCC2001), (2) important role in the photochemical formation of NOx, a component ofacid rain (Sharma et al. 2008), (3) high influence on stratospheric ozone destruction.N2O emissions from emerging economies are attracting global attention due to thehigh growth trend and high cost of mitigation (Garg et al. 2004; IPCC 2007a).
USA, China and India are the three largest contributors of N2O emissions globally(Fig. 1). Agriculture sector activities (mainly nitrogen (N) fertilizer use) are the maincontributor of global anthropogenic N2O emissions (58%), with a much higher sharein emerging economies like India (75%) and China (89%) (IPCC 2007b; ICTSD2010). During 2005, 93 Tg of N-fertilizer was consumed globally, which has increasedat a rate of 1.77% per year since 1995, out of which China (30 Tg) consumed thehighest amount followed by India (13 Tg) and USA (11 Tg) (IFA 2008). The demandfor N-fertilizer is expected to rise in the wake of rising global food demand (Ladhaet al. 2005) and therefore understanding N2O emission dynamics from India assumescontextual relevance.
Though Indian agriculture is second largest consumer of N-fertilizer in the world,its contribution to the global N2O emissions is only 2.7% (Sharma et al. 2008).India is a predominantly agrarian country with over 650 million persons dependingon agriculture related activities for their livelihoods. These represent over 60% oftotal Indian population and 70% of lowest income groups in Indian economic order(NSSO 2008). Therefore democratic governments (federal and state) are obliged tomake facilitative policies for their welfare through appropriate interventions in the
Fig. 1 N2O emissions fromlarge emitter countries during2005. UNFCCC (2008), Ecofys(2007), HDR (2007) and ourestimates
0
2
4
6
0.0
0.5
1.0
1.5
2.0
2.5
USA
Can
ada
Aus
tral
ia
Ger
man
y
Ital
y
Spai
n
UK
Chi
na
Japa
n
Indi
a
N2O
em
issi
ons
(kg
pers
on-1
)
N2O
emis
sion
s (T
g)
Total emissions Per capita emissions

Climatic Change (2012) 110:755–782 757
agriculture sector, such as through targeted subsidy on N-fertilizer and electricityto farmers. These could however have adverse implications for N2O emissions, asthis paper would analyze. Integrated strategies are therefore needed so as to ensureclimate friendly food security.
This paper estimates the national level trend of India’s N2O emissions from1985–2005. Detailed sub-regional (594 districts) and sector emission estimates arealso presented for the year 2005. The 594 districts reasonably capture the diversityof Indian emission patterns due to diverse resource endowments and agriculturepractices. Above 80% of districts are smaller than 1 × 1 degree resolution and60% are even smaller than 1/2 × 1/2 degree. District level emissions thus representvery finely gridded inventory information by international standards. Moreover,districts in India have well established governance structures which are well suited forimplementing and monitoring mitigation measures. Our estimates also incorporatethe most recent scientific estimation methodologies (IPCC 2006), indigenized emis-sion factor estimates (Mitra et al. 2004) and best available district and sector leveldata sources for India. Our emission estimates are different from other inventoryestimates such as INCCA (2010) mainly due to different years of estimation, bottom-up activity data coverage and application of the latest IPCC (2006) methodology.
2 Emission sources
N2O emissions have been estimated from energy sector (fossil fuel and biomassburning), industrial processes (nitric acid production), agricultural activities (direct,indirect emissions, agriculture residue burning), and waste (municipal waste manage-ment). Direct N2O emissions from soil mainly occur during microbial nitrificationand denitrification processes, during which N2O leaks into the soil as a gaseousintermediate and a by product, and ultimately adds to the atmosphere. IndirectN2O emissions from managed soil occur through two pathways. The first involvesvolatilization with subsequent deposition of N onto soils and waters, while the secondincludes leaching and runoff of N from anthropogenic input into groundwater,riparian areas, wetlands, rivers, and eventually the coastal ocean. Such excess ofinorganic N present in soil and water gets transformed into N2O through combinednitrification and denitrification processes.
Over a fourth of the total primary energy requirement for India and two thirdof rural Indian energy requirement are met by biomass energy (Ravindranath et al.2007). It is interesting to note that, biomass burning is considered as carbon-neutralin case of CO2 emissions (IPCC 2006), where as the same source contributes a majorportion of N2O emissions, even higher than fossil based emissions (Garg et al. 2006).
3 Methodology, activity data and emission factors
3.1 Activity data
Emission inventory estimation has three building blocks—methodology, activity dataand emission factor. The activity data is captured at quite sufficient disaggregatedlevel (sub-regional and sector) for India. These are mostly based on published

758 Climatic Change (2012) 110:755–782
Tab
le1
Allo
cati
onin
dex
for
disa
ggre
gate
dda
ta
Act
ivit
yda
taY
ear
ofL
evel
(and
sour
ce)
Allo
cati
on/e
stim
atio
nin
dex
avai
labl
eN
eed
Met
hodo
logy
data
Hum
anpo
pula
tion
2001
Dis
tric
t(C
oI20
01)
2005
data
1991
–200
1C
AG
Ra
Dis
tric
tGD
P20
06D
istr
ict(
Indi
cus
2005
data
2001
–200
6di
stri
ctle
velG
DP
grow
thra
teda
taba
seA
naly
tics
2006
–200
7)(I
ndic
usA
naly
tics
)L
ives
tock
popu
lati
on20
03D
istr
ict(
DA
HD
F20
08)
2005
data
1997
–200
3C
AG
RC
harc
oalc
onsu
mpt
ion
2005
Stat
e(N
SSO
2007
)D
istr
ictl
evel
data
Allo
cate
dto
rura
lpop
ulat
ion
usin
g20
05ur
ban–
rura
lpo
pula
tion
rati
oF
uelw
ood
cons
umpt
ion
2005
Stat
e(I
ndia
Stat
2008
)D
istr
ictl
evel
data
Sect
oral
loca
tion
tobr
ick
indu
stry
(Pac
haur
i200
6)an
dre
side
ntia
lsec
tor
(Rav
indr
anat
het
al.2
007)
.D
istr
ictl
evel
allo
cati
onto
rura
lpop
ulat
ion
usin
gur
ban–
rura
lpop
ulat
ion
rati
oD
ung
cake
prod
ucti
onD
istr
ictl
evel
data
Dun
gge
nera
tion
rate
(Mit
raet
al.2
004)
,dis
tric
tlev
elfo
r20
05liv
esto
ckpo
pula
tion
and
Rav
indr
anat
het
al.(
2007
)B
ioga
sge
nera
tion
Dis
tric
tlev
elda
ta%
ofdu
ngus
edfo
rbi
ogas
plan
t(R
avin
dran
ath
for
2005
etal
.200
7),b
ioga
sge
nera
tion
fact
or(M
NR
E20
08)
Fos
silf
uelc
ombu
stio
nG
asol
ine,
dies
elan
dfu
eloi
l20
05N
atio
nal(
CM
IE20
07)
Dis
tric
tlev
elda
taSt
ate
leve
lallo
cati
onus
ing
1995
fuel
cons
umpt
ion
(Gar
gan
dSh
ukla
2002
).D
istr
ictl
evel
usin
gto
tal
popu
lati
on

Climatic Change (2012) 110:755–782 759
Coa
l(ra
iltr
ansp
ort)
2005
Zon
alle
veld
ata
Dis
tric
tlev
elda
taA
lloca
ted
usin
gdi
stri
ctle
velt
rack
kmfo
r(I
R20
06;C
MIE
2007
)co
al-u
sing
trac
tion
rout
eson
lyC
oalu
se(r
esid
enti
al)
2005
Nat
iona
l(C
MIE
2007
)D
istr
ictl
evel
data
Num
ber
ofho
useh
old
Die
sel(
rail
tran
spor
t);
2005
Nat
iona
l(C
MIE
2007
)D
istr
ictl
evel
data
Tot
alpo
pula
tion
avia
tion
turb
ine
fuel
;di
esel
and
fuel
oil
(nav
igat
ion
and
othe
rtr
ansp
ort)
Nat
ural
gas
&liq
uefi
ed20
05N
atio
nal(
CM
IE20
07)
Dis
tric
tlev
elda
taU
rban
popu
lati
onpe
trol
eum
gas
(res
iden
tial
);co
al(c
omm
erci
al)
Nit
ric
acid
prod
ucti
on20
05N
atio
nal(
Mit
raet
al.2
004)
Dis
tric
tlev
elda
taP
lant
loca
tion
and
capa
city
(CM
IE20
08a)
Mun
icip
also
lidw
aste
2005
Nat
iona
lD
istr
ictl
evel
data
Per
capi
taM
SWge
nera
tion
(CP
CB
2007
),ur
ban
gene
rati
onpo
pula
tion
and
UM
P(1
999)
Dat
aso
urce
sfo
rca
tego
ries
whe
reno
allo
cati
onw
asne
eded
sinc
e20
05di
stri
ctle
veld
ata
was
avai
labl
e—cr
oppr
oduc
tion
and
area
sow
n(C
MIE
2008
b),s
ynth
etic
fert
ilize
rus
ed(F
AI
2006
),en
ergy
indu
stri
es(C
EA
2006
;Ind
iast
at20
07;M
oPN
G20
08),
larg
epo
ints
ourc
eda
tafr
omse
ctor
alre
port
s(S
AIL
2004
;Ess
ar20
05,2
006;
JSW
2005
;CM
A20
06;F
AI
2006
;CR
ISIN
FA
C20
07a,
b;P
acha
uri2
006;
Das
and
Kan
dpal
1998
;CM
IE20
07,2
008a
,b;I
ndia
stat
2007
,200
8)a In
dia
cond
ucts
deca
dalp
opul
atio
nce
nsus
.The
last
one
was
cond
ucte
din
2001

760 Climatic Change (2012) 110:755–782
Tab
le2
Met
hodo
logy
used
for
esti
mat
ion
ofN
2Oem
issi
ons
(IP
CC
2006
)
Em
issi
onso
urce
IPC
C(2
006)
met
hodo
logy
Tie
raE
quat
ion
no.
Em
issi
onfa
ctor
sus
edfo
rth
isst
udy
Dir
ectN
2Oem
issi
ons
Vol
.4(A
FO
LU
)C
h.11
211
.1Sy
nthe
tic
fert
ilize
rus
edV
ol.4
(AF
OL
U)
Ch.
112
11.2
Tab
le3
Org
anic
nitr
ogen
appl
ied
toth
eso
ilV
ol.4
(AF
OL
U)
Ch.
10,1
12
11.2
to11
.4,1
0.34
Tab
le4
Nit
roge
nfr
omcr
opre
sidu
ele
ftV
ol.4
(AF
OL
U)
Ch.
112
11.6
Tab
le5
Indi
rect
N2O
emis
sion
Vol
.4(A
FO
LU
)C
h.11
211
.9,1
1.10
Tab
le6
Agr
icul
ture
resi
due
burn
ing
(ons
ite)
Vol
.4(A
FO
LU
)C
h.2,
112
2.27
Tab
le7
Bio
mas
sbu
rnin
g(o
ffsi
te)
Vol
.2(E
NE
RG
Y)
Ch.
21
2.1
Tab
le8
(fue
l-w
ood,
char
coal
,du
ng-c
ake
and
biog
as)
Fos
silf
uelc
ombu
stio
nV
ol.2
(EN
ER
GY
)C
h.2
1,2/
3b2.
1T
able
8In
dust
rial
proc
esse
sV
ol.3
(IP
PU
)C
h.3
2,3
3.5
Tab
le8
Was
tem
anag
emen
tV
ol.5
(WA
STE
)C
h.4,
61,
24.
2,6.
7,6.
8T
able
s8
and
9a T
ier
repr
esen
tsth
ele
velo
fm
etho
dolo
gica
lcom
plex
ity.
Tie
r1
isth
eba
sic
met
hod,
tier
2in
term
edia
tean
dti
er3
mos
tde
taile
din
term
sof
com
plex
ity,
accu
racy
and
data
requ
irem
ents
bT
rans
port
and
resi
dent
iala
ttie
r1
leve
l,w
hile
indu
stry
and
pow
eres
tim
atio
nsat
tier
2/3
leve
ls

Climatic Change (2012) 110:755–782 761
Table 3 Direct N2O emission
Emission factor kg N2O_N/kg N input
EF1 0.0065
INCCA (2010), Bhatia et al. (2010), Mitra et al. (2004), Pathak (1999)
sources of the Government of India, industry associations and international orga-nizations. The activity data used is at sub-regional (district) level, generally termedbottom-up data. In a few instances, where district level data was not available, ahigher aggregated data was allocated to districts based on a suitable allocation indexlike district population, area, road density etc for 2005 (Table 1). All activity data arecollected for the years 2004–2005 and 2005–2006.1 Most activity data for stationaryemission sources are collected at large point source (LPS) level, based on publishedcentral and state government sources, plant level reports, latest statistical and annualreports of various ministries, industries, and paid statistical databases. We have triedto cross-verify activity data from two independent sources for most LPS, to the extentavailable.
Activity data sources used for preparation of national N2O emission inventoriesfor 1985–2005 are those sources which had all these year’s activity data at one placeso as to minimize source based data errors. These data are at national level and aregenerally termed as top–down data. Top–down data may not exactly match withbottom-up district level data due to aggregation errors. Some minor error is alsointroduced due to different data sources, especially for biomass production.
3.2 Methodology and emission factors
Main source categories and the respective detailed IPCC (2006) methodology usedfor emissions estimation have been summarized in Table 2, however detailed equa-tions and explanation of methodology is not given in this paper to avoid repetitionof already published IPCC methodological guidelines (2006). For the emissionfactors, we have used published emission factors for India that are based on actualmeasurements conducted in field trials to estimate India specific actual emissions.These measurements have been conducted by Indian scientists at many nationallaboratories involving N2O emissions measurements from diverse source categoriessuch as synthetic fertilizer application to rice and wheat cropping systems, biomasscombustion, livestock activities, and nitric acid production. These are documentedin Mitra et al. (2004), the seminal work on Indian emission measurements till date,which we have used extensively for emission estimation. We have used the IPCCdefault emission factors only where India specific measured emission factors werenot available.2 Emission factors used for each source category have been presentedseparately in Tables 3, 4, 5, 6, 7, 8 and 9.
1Indian financial year 2005–2006 is 1st April 2005 until 31st March 2006. The calendar year 2005 datais estimated as sum of 75% of 2005–2006 year data and 25% of 2004–2005 year data.2The lead author has also been fortunate enough to be a Coordinating Lead Author of IPCC (2006)GHG inventory guidelines (Energy volume) and a member of the Editorial Board of IPCC EmissionFactor Database (EFDB), the premier UN body on GHG emission measurement repository.

762 Climatic Change (2012) 110:755–782
Table 4 Organic nitrogen (FON) applied to the soil
Livestock N excretion rate Live-weight % N lost during % N managed inspecies Nex(T) (kg N (kg)b manure management manure management
animal−1 year−1)a FracLossMSc system MSd
Dairy cattle 41.17 240 28 0.5Other cattle 29.78 240 50 0.5Buffalo 33.29 285 15 0.5Sheep 11.53 27 15 0.5Goats 12.50 25 15 0.5Swine 7.30 40 25 0.5Poultry 1.50 5 50 0.5All others 3.36 20 15 0.5aEstimated using IPCC (2006) default N excretion rate and live-weightsbMitra et al. (2004)cIPCC (2006)dDiscussion with sectoral expertsNex(T) annual average N excretion per animal of species/category T, FracLossMS amount ofmanaged manure nitrogen for livestock category that is lost in the manure management system,MS fraction of total annual nitrogen excretion for each livestock species/category T that is managedin manure management system
To give an example of the rigor in our estimates, direct N2O emission estimatesfrom managed soil uses tier 2 methodology for human induced N input to thesoil including application of synthetic fertilizer (nitrogenous), organic N (livestockmanure) applied as fertilizer, and N from crop residues left on ground rather thanburnt of all species (including N-fixing crops). The equation used for estimation ofdirect N2O from managed soils is as under:
N2 ODirect = (FSN + FON + FCR) · EF1 · (44/28)
where
FSN Annual amount of synthetic fertilizer N applied to soils, kg N year−1
FON Annual amount of animal manure applied to soils, kg N year−1
FCR Annual amount of N in crop residues (above-ground and below-ground),including N-fixing crops, and from forage/pasture renewal, returned to soils,kg N year−1
EF1 Emission factor for N2O emissions from N inputs, kg N2O–N (kg N input)−1
India specific value of EF1 (0.0065) is taken for the estimation including rice andwheat cropping systems (Mitra et al. 2004). District level consumption of syntheticnitrogenous fertilizer (FSN) for the year 2005–2006 is taken (FAI 2006).
Other components of direct emissions are calculated as per IPCC (2006) method-ology by using IPCC default as well as India specific factors (Tables 3 and 4) for thedifferent species of livestock (FON) including dairy cattle, other cattle, buffalo, sheep,goats, swine, poultry, and others (DAHDF 2008); and crops (FCR) including rice,wheat, maize, other cereals, pulses, groundnut, sugarcane, rapeseed and mustard,cotton, other seeds, coconut and other crops (CMIE 2008b).
Topography and geology have been taken into consideration while estimatingthe indirect N2O emissions by potential leaching and runoff in respective regionsof India. N2O emissions from leaching and runoff are taken as 25% in Himachal

Climatic Change (2012) 110:755–782 763
Tab
le5
Nit
roge
nfr
omcr
opre
sidu
ele
ft(F
CR
)
Cro
pna
me
Slop
eIn
terc
ept
Rat
ioof
belo
wgr
ound
and
Nco
nten
tofa
bove
-gro
und
resi
dues
Nco
nten
tofb
elow
-gro
und
resi
dues
abov
egr
ound
biom
ass
RB
G_B
IOfo
rcr
opT
(kg
Nkg
d.m
.−1 )
N(A
G)
for
crop
T(k
gN
kgd.
m.−
1 )N
(BG
)
Ric
e0.
952.
460.
160.
007
0.00
9W
heat
1.51
0.52
0.24
0.00
60.
009
Mai
ze1.
030.
610.
220.
006
0.00
7A
llot
her
grai
ns1.
090.
880.
220.
006
0.00
9So
yabe
ans
0.93
1.35
0.19
0.00
80.
008
Pul
ses
1.13
0.85
0.19
0.00
80.
008
Gro
undn
uts
1.07
1.54
0.20
0.01
60.
014
Suga
rca
ne0.
180.
000.
540.
150
0.01
2R
apes
eed
&M
usta
rd1.
130.
850.
190.
008
0.00
8A
llot
hers
0.30
0.00
0.22
0.01
50.
012
IPC
C(2
006)
kgd.
m.k
ilogr
amof
dry
mat
ter

764 Climatic Change (2012) 110:755–782
Table 6 Indirect N2O emission factors
Factor Value
EF a4 (Kg N N2O (kg NH3_N + NOx_N volatized)−1) 0.005
EF b5 (kg N2O-N (kg N leached and runoff)−1) 0.0075
Frac aGASF (Kg N volatized (kg N applied)−1) 0.15
Frac bGASM (Kg N volatized (kg N applied or deposited)−1) 0.2
Frac bLEACH-(H) (Kg N (kg of N additions)−1) 0.3
aBhatia et al. (2004)bIPCC (2006), Mitra et al. (2004)
Table 7 Field burning of agriculture residue
Factor Value
Frac aRemove(T)
0.8Combustion factor (Cf)
b 0.9 (wheat), 0.8 (all others)Emission factor (Gef)
b 0.07aDiscussion with sectoral expertsbIPCC (2006)
Table 8 N2O emission factor for fossil fuel consumption, biomass burning, industrial process andmunicipal solid waste management
Source category N2O emission coefficient
Crude oil and oil productsa 0.6Natural gas and liquefied petroleum gasa 0.1Jet fuel (aviation turbine fuel)a 2Coal productsa 1.5Charcoal consumptionb 4Wood or wood waste and dung-cakea 4Biogas burninga 0.1Nitric acid production (kg N2O Ton−1)c 8.43Biological treatment of municipal solid waste
(composting) (g N2O (kg waste treated)−1)a 0.3aIPCC (2006)bIPCC (1996)cMitra et al. (2004)
Table 9 Domestic waste water treatment
Factor Value
EFEFFLUENT (emission factor, kg N2O-N (kg N)−1)a 0.005Annual per capita protein consumption (kg person−1)b 18.25FNPR (fraction of nitrogen in protein, kg N (kg protein)−1)a 0.16FNON-CON (non-consumed protein added to the waste water)a 1.2FIND-COM (industrial and commercial co-discharged protein into sewer system)a 1.25aIPCC (2006)bGrigg (1995)

Climatic Change (2012) 110:755–782 765
Pradesh, Maharashtra, Orissa, Andhra Pradesh, Karnataka, Kerala, Tamil Nadu,Dadra and Nagar Haveli, Daman and Diu, Pondicherry and states of NE region;where as 50% for the remaining states and union territories (Sharma et al. 2008).
Dung-cake production was taken differently in HP, J&K, Kerala, Goa, Sikkim,Arunachal Pradesh, Nagaland, Manipur, Mizoram, Tripura, Meghalaya, Assam as10% of the total dung generation where dung-cake is not used as a chief source ofcooking fuel, 30% in Delhi, and 90% for all other areas (Mitra et al. 2004).
4 Emission trends
4.1 National emission trends over 1985–2005
The absolute N2O emissions from India during the years 1985, 1990, 1995, 2000 and2005 are estimated as 144, 181, 215, 238 and 267 Gg respectively (Table 10). Theseemission estimates are an improvement over our own previous estimates (Garg et al.2006). The major changes in present emission estimates are mainly due to inclusion ofsome new source categories that were missed in our previous estimates for the sameyear 2005 (such as 16.8 Gg added due to N from crop residue left, 11.5 Gg addeddue to Organic N applied to the soil); new emission factors (0.0065 kg N2O–N perkg synthetic fertilizer applied instead of earlier 0.01), coal combustion, agriculturecrop residue burning, indirect emissions volatilization, Nitric acid production); newmethodology (full sectoral coverage of indirect N2O emissions added 34.4 Gg); andchanged activity data for 2005 (actual numbers available now against estimates inprevious inventory).
Total national N2O emissions have exhibited a compounded annual growth rateof 3.1% during 1985–2005, which has been gradually declining from 4.7% over 1985–1990 to 2.4% over 2000–2005. The source level emissions have also been growingslowly over the years. For instance, N2O emissions from synthetic N fertilizer use
Table 10 N2O emissions from various source categories, 1985–2005
Source category Emissions (Gg) % CAGR,1985–2005
1985 1990 1995 2000 2005
Direct N2O emissions 78 104 124 139 159 3.6%Synthetic fertilizer usea 58 82 101 112 131 4.1%N from crop residue lefta 10 12 14 16 17 2.6%Organic N applied to the soila 10 9 9 11 12 0.8%Indirect N2O emissions 17 22 27 30 34 3.7%Field burning of agriculture residue 4 5 7 8 8 3.2%Biomass burning 21 22 24 26 26 1.1%Coal consumption 6 8 10 12 13 4.1%Petroleum fuels consumption 1 1 2 3 3 4.7%Gas consumption 0.01 0.04 0.05 0.08 0.09 9.6%Industrial processes 8 8 11 9 9 1.1%Waste 9 9 11 12 14 2.0%Total N2O Emissions 144 181 215 238 267 3.1%aThese three are sub-source categories of direct N2O emissions as per IPCC (2006) categorization
766 Climatic Change (2012) 110:755–782
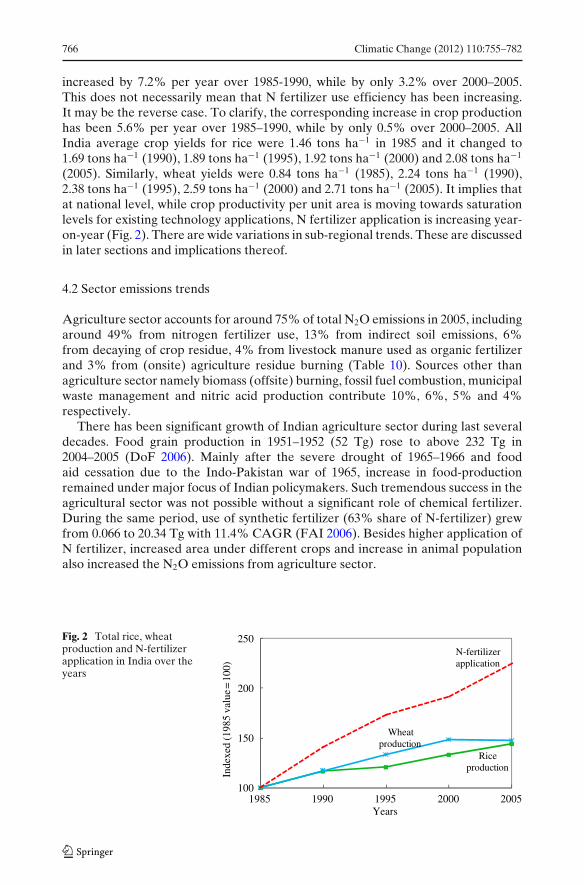
increased by 7.2% per year over 1985-1990, while by only 3.2% over 2000–2005.This does not necessarily mean that N fertilizer use efficiency has been increasing.It may be the reverse case. To clarify, the corresponding increase in crop productionhas been 5.6% per year over 1985–1990, while by only 0.5% over 2000–2005. AllIndia average crop yields for rice were 1.46 tons ha−1 in 1985 and it changed to1.69 tons ha−1 (1990), 1.89 tons ha−1 (1995), 1.92 tons ha−1 (2000) and 2.08 tons ha−1
(2005). Similarly, wheat yields were 0.84 tons ha−1 (1985), 2.24 tons ha−1 (1990),2.38 tons ha−1 (1995), 2.59 tons ha−1 (2000) and 2.71 tons ha−1 (2005). It implies thatat national level, while crop productivity per unit area is moving towards saturationlevels for existing technology applications, N fertilizer application is increasing year-on-year (Fig. 2). There are wide variations in sub-regional trends. These are discussedin later sections and implications thereof.
4.2 Sector emissions trends
Agriculture sector accounts for around 75% of total N2O emissions in 2005, includingaround 49% from nitrogen fertilizer use, 13% from indirect soil emissions, 6%from decaying of crop residue, 4% from livestock manure used as organic fertilizerand 3% from (onsite) agriculture residue burning (Table 10). Sources other thanagriculture sector namely biomass (offsite) burning, fossil fuel combustion, municipalwaste management and nitric acid production contribute 10%, 6%, 5% and 4%respectively.
There has been significant growth of Indian agriculture sector during last severaldecades. Food grain production in 1951–1952 (52 Tg) rose to above 232 Tg in2004–2005 (DoF 2006). Mainly after the severe drought of 1965–1966 and foodaid cessation due to the Indo-Pakistan war of 1965, increase in food-productionremained under major focus of Indian policymakers. Such tremendous success in theagricultural sector was not possible without a significant role of chemical fertilizer.During the same period, use of synthetic fertilizer (63% share of N-fertilizer) grewfrom 0.066 to 20.34 Tg with 11.4% CAGR (FAI 2006). Besides higher application ofN fertilizer, increased area under different crops and increase in animal populationalso increased the N2O emissions from agriculture sector.
Fig. 2 Total rice, wheatproduction and N-fertilizerapplication in India over theyears
Riceproduction
Wheatproduction
N-fertilizerapplication
100
150
200
250
1985 1990 1995 2000 2005
Inde
xed
(198
5 v
alue
= 1
00)
Years

Climatic Change (2012) 110:755–782 767
(a) (b)
Fig. 3 a State level N2O emissions from India, 2005 b District level N2O emissions from India, 2005
5 Regional emission analysis
Figure 3(a, b) illustrate state and district level N2O emission in 2005. Out of total 35states and union territories in India, twelve states contributed more than 10 Gg eachin 2005 accounting for 90% of total Indian N2O emissions, with Uttar Pradesh (UP)being the largest contributor at 52 Gg, followed by Maharashtra, Andhra Pradesh
(b)(a)
Fig. 4 a N2O emissions from Agriculture activities in India, 2005 b Nitrogenous fertilizer applicationin India, 2005

768 Climatic Change (2012) 110:755–782
Tab
le11
Foo
dgr
ain
prod
ucti
onan
dus
eof
nitr
ogen
ous
fert
ilize
rin
2005
Stat
esN
-fer
tiliz
erap
plie
dF
ood
grai
npr
oduc
tion
Ann
ualf
ood
grai
npr
oduc
tion
/C
ompo
siti
onan
dsh
are
(kg
km−2
year
−1)
(kg
km−2
year
−1)
nitr
ogen
appl
ied
(kg
kg−1
)of
food
grai
npr
oduc
ed
Pun
jab
1555
039
8636
25.6
4R
ice
(40%
),w
heat
(58%
)H
arya
na13
190
3044
9123
.08
Ric
e(2
5%),
whe
at(6
8%)
Wes
tBen
gal
6500
2422
9137
.28
Ric
e(9
3%)
And
hra
Pra
desh
1216
023
6491
19.4
5R
ice
(69%
),M
aize
(18%
)P
ondi
cher
ry57
150
2179
583.
81R
ice
(97%
)U
ttar
Pra
desh
9910
2057
4520
.76
Ric
e(2
8%),
whe
at(6
0%)
Guj
arat
7530
1551
3020
.60
Ric
e(2
1%),
whe
at(4
0%),
Baj
ra(1
7%)
Bih
ar88
2013
1128
14.8
7R
ice
(41%
),w
heat
(38%
)IN
DIA
6665
1715
8925
.74
Ric
e(4
4%),
whe
at(3
3%)
Est
imat
edus
ing
FA
I(2
006)
,CM
IE(2
008b
)

Climatic Change (2012) 110:755–782 769
(AP) and Punjab contributing 30, 26 and 20 Gg respectively. The 50 largest N2Oemitting districts (including 12 from UP, 10 from Punjab, nine from AP, and fiveeach from Gujarat and West Bengal and four from Maharashtra) contributed morethan one fourth of the Indian national emissions in 2005. UP is the most populousstate in India, almost equal to combined population of France, Germany and Spain.Its N2O emissions were however only one-ninth of combined N2O emissions fromthese three countries in 2005 (UNFCCC 2008).
Around 70% of the synthetic N-fertilizer is used for food grain production inIndia followed by oilseeds (8%) and remaining for other crops (FAI 2006). Thisis the main reason why higher grain producing states like Uttar Pradesh, Punjaband Andhra Pradesh are top N-fertilizer consumers and in-turn top N2O emitters(Fig. 4a, b). Synthetic N-fertilizer use efficiency (food grains produced per unit offertilizer applied) varies across districts based on crop-mix, agriculture practices andother agricultural inputs. On an average, 25.7 kg food grains were produced per kgof N-fertilizer applied in India in 2005 (Table 11). West Bengal had a high averageof 37.3, while large grain producers such as Punjab, Haryana and Uttar Pradesh hadit in the range 20–25 kg grains per kg fertilizer. West Bengal mainly produces ricepaddy which consumes lower nitrogen fertilizer as compared to wheat. West Bengalis also high in other agriculture inputs such as organic fertilizer and water, off-settingneed for N fertilizer to some extent.
N-fertilizer applied per unit cropped area and crop yield have wide differencesacross the Indian states and districts (Fig. 5). Such differences and high fertilizeruse in several regions are found mainly due to unsustainable practices such asexcessive use of water along with imbalanced use of chemical fertilizers, decreaseduse of organic fertilizer, decreasing carbon/organic matter content, deficiency ofmicro nutrient etc. Such effect is found very strongly in the ‘green revolution’areas of northern and northwestern parts of India, where fertilizer consumption iscomparatively high, and the response ratio of grain output to fertilizer input hasdeclined over recent years.
The district level distribution has also undergone a substantial change over 1990–2005. Efficiency of fertilizer application vis-à-vis grain production has gone downin many districts during 1990–2005. This resulted in an increase in N2O emissionsper unit area without corresponding gain in food grain yield per hectare, indicating
Fig. 5 Fertilizer use efficiencyof Indian districts, 2005
0
1000
2000
3000
4000
5000
6000
0 100 200 300
Food
grai
n pr
oduc
tion
(kg
hect
are-
1 )
N Fertilizer application (kg hectare-1)

770 Climatic Change (2012) 110:755–782
Tab
le12
Sect
orN
2Oem
issi
ons
and
som
edr
ivin
gpa
ram
eter
sof
high
este
mit
ter
stat
esin
Indi
a,20
05
Stat
e%
shar
eof
conc
erne
dst
ate’
sN
2Oem
issi
ons
All
Indi
a%
shar
eof
N-f
erti
lizer
Org
anic
NIn
dire
ctO
ther
sT
otal
N2O
Liv
esto
ckN
-Fer
tiliz
erR
ice
grow
nW
heat
grow
nus
edap
plie
dto
soil
emis
sion
spo
pula
tion
used
Utt
arP
rade
sh49
%3%
17%
31%
19%
13%
19%
12%
35%
Mah
aras
htra
37%
3%5%
55%
11%
8%8%
3%2%
And
hra
Pra
desh
61%
4%8%
27%
10%
12%
12%
13%
–P
unja
b66
%2%
20%
13%
7%2%
10%
11%
21%
Guj
arat
48%
3%16
%33
%7%
5%7%
1%4%
Kar
nata
ka51
%4%
7%38
%6%
5%6%
6%0.
3%W
estB
enga
l44
%6%
15%
35%
5%9%
5%16
%1%
Har
yana
62%
2%20
%16
%5%
2%7%
3%13
%T
amil
Nad
u43
%5%
6%45
%5%
5%4%
6%–
Bih
ar54
%5%
18%
23%
5%5%
5%–
5%In
dia
(Tg)
0.13
10.
012
0.03
50.
090
0.26
747
0.5a
12.7
291
.79
69.3
5a M
illio
nnu
mbe
r
Climatic Change (2012) 110:755–782 771
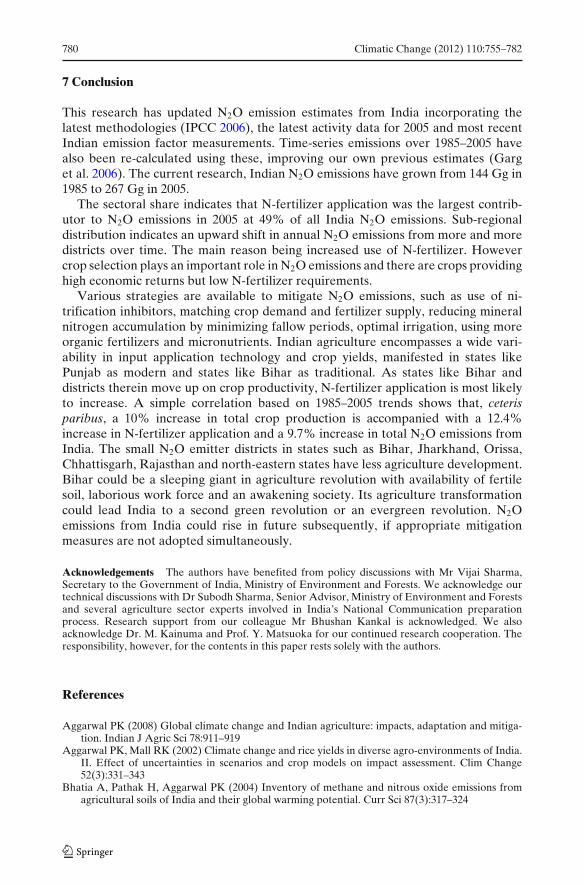
Table 13 Distribution of N2Oemissions from Indian districts
No. of largest emitter districts % of total emissions
1995 2005
1 to 5 5.0 6.41 to 15 13.8 12.71 to 25 21.3 17.81 to 47 34.2 27.71 to 233 86.1 77.01 to 350 91.3Total (1–594) 100 100
a possible over application of synthetic fertilizers. Subsidized fertilizer prices couldbe one reason for this trend as well as lack of proper and sufficient knowledge withfarmers in optimizing the integrated use of fertilizers and other farm inputs for highercrop yields.
Table 12 provides sector N2O emissions and some driving parameters of highestemitter states. N-fertilizer application is the main source of emissions. Wheat–ricecultivation, in that order, appears to drive this. Though the food grain production ofPunjab is higher than Andhra Pradesh, it’s N2O emissions are lower. This is becauseof higher N-fertilizer use efficiency of Punjab (25.6 kg kg−1) than that of AndhraPradesh (19.5 kg kg−1) as well as higher population of livestock in Andhra Pradesh(12%). Other food-grain producing states with high N-fertilizer use efficiency areOrissa (48.3 kg kg−1), Madhya Pradesh (40.8 kg kg−1), West Bengal (37.3 kg kg−1),Rajasthan (31.3 kg kg−1) and Karnataka (30.1 kg kg−1), thus having lower N2Oemissions.
The district level N2O emission range analysis indicates decline in percentageshare of largest emitter districts over 1995–2005 (Table 13). Thane (Maharashtra),Firozpur (Punjab), West Godavari and Guntur (Andhra Pradesh) and Amritsar(Punjab) are the highest emitting five districts across India and contribute about6.4% of national N2O emissions. 85% of all India nitric acid production happensin Thane contributing about 3% of the national N2O emissions.
0.000
0.002
0.004
0.006
0.008
0.011
0.0 0.6 1.2 1.8 2.4 3.0
Absolute N2O emissions (Gg district-1)
FirozpurNewDelhi
MumbaiSuburban
Prakasam
0.000
0.005
0.010
0.015
0.020
0.025
0 25 50 75 100 125 150Nitrogenous fertilizer applied (Gg district-1)
Prakasam
New Delhi,MumbaiSuburban
Firozpur
1990
1995
2005
1990
1995
2005
µ1990 0.36 0.391995 0.42 0.462005 0.45 0.54
µ σσ1990 12.90 16.541995 15.34 19.062005 21.46 24.69
(a) (b)
Fig. 6 a District level absolute N2O emissions during 1990, 1995 and 2005 b District levelnitrogenous fertilizer applied during 1990, 1995 and 2005

772 Climatic Change (2012) 110:755–782
The standard deviation of district level N2O emissions during 2005 has increased38% with respect to that in 1990 and 17% from 1995 (Fig. 6a). This indicates anupward shift in annual N2O emissions from more and more districts with time. Themain reason for such growth pattern can be noticed from Fig. 6(b) showing almosta similar change in N-fertilizer use across districts. The small emitter districts lie instates such as Bihar, Jharkhand, Orissa, Chhattisgarh, Rajasthan and north-easternstates. These districts have less agriculture development and had mostly missed thefirst green revolution wave. Bihar could be a sleeping giant in agriculture revolutionwith availability of fertile soil, laborious work force and an awakening society. Itsagriculture transformation could lead India to a second green revolution or anevergreen revolution. Major barriers include regular floods and draughts, slow landreform implementation, low adoption of new farming technologies, and low resourceutilization.
In view of per unit area emission, New Delhi is the largest with 45 times higher perarea emissions than Indian average, mainly due to its smaller size but considerablecoal and gas consumption. For a per capita emission analysis, Indian N2O emissionswere 0.26 kg capita−1 year−1 in 2005, which converts to 0.08 tCO2e capita−1 year−1.It has increased annually by 1.5% over 1995–2005 (Fig. 7). Muktasar (1.38 kgN2O capita−1 year−1), Mansa and Firozpur from Punjab, Karnal and Faridkot fromHaryana are the five highest emitter districts on per capita basis. However only afew Indian districts reach anywhere near the average Chinese per capita emissions(0.88 kg N2O capita−1 year−1), while they are far away than the per capita USAemissions (4.96 kg N2O capita−1 year−1).
Table 14 represents India’s hot spot emitter districts in each source category in2005. Absolute as well as per capita N2O emissions from state capital district can beseen in Fig. 8. Raipur and Pondicherry are the highest in terms of absolute and percapita N2O emissions respectively; both are having highest contribution of emissionsfrom N fertilizer use.
0.0
0.5
1.0
1.5
2.0
2.5
0.0 0.5 1.0 1.5 2.0 2.5 3.0 3.5 4.0 4.5 5.0
N2O emissions (kg person-1)
0.26
India
1995
1990
2005
2.12
UK
2.58
Germany
3.78
Australia
4.38
Canada
4.96
USA
0.88
China
Fig. 7 Per capita N2O emission distributions (kg person−1 year−1) of India during 1990, 1995 and2005 as compared to some other countries in 2005

Climatic Change (2012) 110:755–782 773
Tab
le14
N2O
emit
ter
hots
potd
istr
icts
for
diff
eren
tsou
rce
cate
gori
es,2
005
Sour
ceC
ateg
orie
sL
arge
stSe
cond
Thi
rdF
ourt
hF
ifth
Synt
heti
cfe
rtili
zer
use
Fir
ozpu
rW
estG
odav
ari
Gun
tur
Sang
rur
Am
rits
arN
from
crop
resi
due
left
Utt
arK
anna
daV
ilupp
uram
Ero
deA
llaha
bad
Aza
mga
rhO
rgan
icN
appl
ied
toth
eso
ilC
oim
bato
reC
udda
pah
Bar
ddha
man
Mur
shid
abad
Sout
hT
wen
tyF
our
Par
gana
sIn
dire
ctN
2Oem
issi
ons
Fir
ozpu
rSa
ngru
rA
mri
tsar
Pat
iala
Kar
nal
Agr
icul
ture
resi
due
burn
ing
Utt
arK
anna
daV
ilupp
uram
Wes
tGod
avar
iA
llaha
bad
Ero
deC
oalc
ombu
stio
nSo
nbha
dra
Anu
gul
Kor
baB
okar
oE
astG
odav
ari
Oil
com
bust
ion
Mum
bai
Jam
naga
rM
umba
i(Su
burb
an)
Vad
odar
aT
hane
Nit
ric
acid
prod
ucti
onT
hane
Bha
ruch
Hyd
erab
adE
rnak
ulam
Kup
war
aA
llIn
dia
Tha
neF
iroz
pur
Gun
tur
Wes
tGod
avar
iA
mri
tsar

774 Climatic Change (2012) 110:755–782
Fig. 8 N2O emissions fromstate capital districts, 2005
0.0
0.1
0.2
0.3
0.4
0.5
0.0
0.2
0.4
0.6
0.8
1.0
N2O
em
issi
ons
(kg
pers
on-1
)
N2O
em
issi
ons
(Gg)
Total emissions Per capita emissions
6 Emission efficiency
6.1 N2O emissions and economic value addition
Agriculture sector’s contribution to India’s GDP has been declining over the years,from 23% in 1985 to 18.5% in 2005 (Economic survey 2006–2007). Figure 9 plotsdistrict level N2O emissions as a function of agriculture gross value added (GVA)from the corresponding district in 2005. Analyzing the correlation of N2O intensityand agriculture GVA offers some interesting insights. About 42% of total N2Oemission variation is explained by district level agriculture GVA. This improves to47% if some outlier districts are excluded. If we take only agriculture related N2Oemissions versus agriculture sector GVA, this improves to 59%. The outlier districtsare way below the regression line, with less than 10,000 tons N fertilizer used per yearand annual agriculture GVA of more than US$ 300 million. These are districts thathave considerable tea plantations and spice cultivation, such as Darrang, Dibrugarh,Sibsagar districts (all in Assam); and Idukki, Wayanand and Malappuram districts(all in Kerala). These crops do not contribute much N2O emissions due to lowerneed for N fertilizers, continuous nature of crops, and cultivation practices such as
Fig. 9 Relationship betweentotal N2O emissions andagriculture GVA y = -0.001x2 + 2.6657x
R2 = 0.590
0.0
0.4
0.8
1.2
1.6
2.0
2.4
0 300 600 900 1200
Tot
al N
2O e
mis
sion
s(G
g)
Agriculture GVA (Million US$)

Climatic Change (2012) 110:755–782 775
minimal crop residue burning etc. (Saseendran et al. 2000). On the other hand (abovethe regression line) we have districts in grain dominant states such as Punjab andAndhra Pradesh that consume over 100,000 tons N fertilizer per annum along withannual agriculture GVA of more than US$ 300 million. These include Firozepur,Sangrur, Amritsar, Ludhiana and Amritsar districts (all in Punjab); and Guntur, Eastand West Godavari, Karimnagar and Krishna districts (all in Andhra Pradesh). Thesedistricts produce almost 10-times more N2O per unit cropped area than the formerset of outliers, even though the share of economic value addition by agriculture sectorto concerned district’s gross annual product is almost the same for both groups. Cropselection therefore plays an important role in N2O emissions. Figure 10 providesN2O emission efficiency of net state domestic products (NSDP) for some states in2005 (in kg N2O per million US$). The insight drawn is that agriculture sector couldcontribute considerably to GDP even with very low N2O emissions.
6.2 N2O emissions and agriculture sector productivity
The second insight correlates agriculture sector productivity with N-fertilizer appli-cation. Indian districts can be classified into modern, transitional and traditionalin agriculture technology based on tilling practices, fertilizer (NPK) application,irrigation availability, seed quality, soil quality management, and other scientific cropmanagement practices (Moulik et al. 1991). Resultant crop yields per hectare wouldbe different for the three categories. Let us consider two main staple crops in India—rice and wheat. Table 15 provides N-fertilizer application per unit of cropped areaand corresponding average rice-wheat productivity for all the Indian districts lying inspecific fertilizer application range. It may be noted that the national average hidesthe state level variability in distribution for each category. Table 16 provides the
0 500 1000 1500 2000 2500
Kerala
Assam
Maharashtra
Tamil Nadu
Gujarat
Bihar
Andhra Pradesh
Uttar Pradesh
Punjab
Haryana
kg AgricultureN2O/MillionUS$Agriculture GVA
kgN2O/MillionUS$ NSDP
3.5%of national GDP, 5.2% of national N2O emissions
3.6% GDP, 7.4% N2O
9.4% GDP, 19 .3%N2O
8.2% GDP, 9.7% N2O
2.8% GDP, 4.9% N2O
7.3% GDP, 6.7% N2O
7.6% GDP, 5.0% N2O
15.0%GDP, 11.2% N2O
2.0% GDP, 0.9% N2O
4.0% GDP, 0.8% N 2O
Fig. 10 N2O emission efficiency of net state domestic products (NSDP) for some states in 2005 (inkg N2O per million US$)

776 Climatic Change (2012) 110:755–782
Tab
le15
N-f
erti
lizer
use,
rice
and
whe
atpr
oduc
tivi
ty
Avg
N-f
erti
lizer
Num
ber
Ave
rage
rice
Ave
rage
whe
atSt
ates
whe
reth
ese
(kg
ha−1
)of
dist
rict
spr
oduc
tivi
ty(t
onha
−1)
prod
ucti
vity
(ton
ha−1
)di
stri
cts
are
loca
ted
(wit
hnu
mbe
rof
dist
rict
s)
>30
03
Tri
pura
(2),
Pon
dich
erry
(1)
200–
300
163.
313.
20H
arya
na(5
),T
N(3
)15
0–20
037
3.99
3.27
Pun
jab
(12)
,UP
(9),
AP
(5),
Bih
ar(1
)10
0–15
078
2.88
3.39
UP
(24)
,Bih
ar(1
5),T
N(9
),A
P(5
),H
arya
na(5
),P
unja
b(5
)75
–100
592.
942.
88U
P(1
9),M
ah(7
),B
ihar
(6),
Raj
(6),
Kar
(5)
50–7
568
2.69
2.14
Mah
(8),
Raj
(8),
6ea
ch–
AP
,Bih
ar,G
ujar
at,K
ar,M
P,T
Nan
dU
P25
–50
943.
012.
51M
P(2
0),M
ah(1
2),H
P(9
),K
ar(8
),O
riss
a(8
),B
ihar
(4)
10–2
573
2.68
2.20
Ori
ssa
(16)
,MP
(13)
,Raj
(9),
Bih
ar(4
)<
1016
62.
322.
36N
agal
and,
Utt
aran
chal
,Sik
kim
,Aru
nach
alP
rade
sh,M
anip
ur,
Ass
am,W
B,J
hark
hand
,Pon
dich
erry
,And
aman
&N
icob
arIs
land
s
AP
And
hra
Pra
desh
,HP
Him
acha
lP
rade
sh,K
arK
arna
taka
,Mah
Mah
aras
htra
,MP
Mad
hya
Pra
desh
,TN
Tam
ilN
adu,
UP
Utt
arP
rade
sh,R
ajR
ajas
than
,WB
Wes
tBen
gal

Climatic Change (2012) 110:755–782 777
Tab
le16
Ric
epr
oduc
tivi
tyan
dN
-fer
tiliz
erus
e,20
05
Ric
epr
oduc
tivi
tyA
rea
cult
ivat
edA
vera
gepr
oduc
tivi
tyA
vgN
-fer
tiliz
er/t
otal
Num
ber
ofM
ain
stat
esan
d%
ofth
eir
dist
rict
sin
the
rang
e(t
onha
−1)a
(Mill
ion
ha)
(ton
ha−1
)fo
odgr
ain
prod
ucti
ondi
stri
cts
spec
ific
rang
e(k
gto
n−1 )b
>2.
512
.06
4.40
6823
1P
unja
b(1
5/17
dist
rict
s,i.e
.88%
),A
P(8
3%),
WB
(72%
),T
N(6
7%),
Mah
(63%
),K
ar(5
9%),
Har
yana
(58%
),M
P(5
6%),
UP
(42%
),>
2−2.
57.
772.
2273
51T
ripu
ra(5
0%)
>1.
5−2
7.54
1.75
4386
Nag
alan
d(8
8%),
Ori
ssa
(53%
)1−
1.5
11.5
81.
2848
90C
hhat
tisg
arh
(69%
),B
ihar
(46%
),A
ssam
(43%
)<
15.
930.
5554
68H
P(5
0%)
AP
And
hra
Pra
desh
,HP
Him
acha
lPra
desh
,Kar
Kar
nata
ka,M
ahM
ahar
asht
ra,M
PM
adhy
aP
rade
sh,T
NT
amil
Nad
u,U
PU
ttar
Pra
desh
,WB
Wes
tBen
gal
Thi
sta
ble
capt
ures
dist
rict
sfo
rw
hich
rice
cult
ivat
ion
area
data
was
avai
labl
efo
rth
eye
ar20
05.I
nfa
ctth
ere
are
ato
talo
f552
dist
rict
sin
Indi
aw
here
rice
isgr
own
a Ada
pted
for
2005
base
don
1999
–200
1da
tafr
omD
irec
tora
teof
Ric
eD
evel
opm
ent,
Min
istr
yof
Agr
icul
ture
,G
over
nmen
tof
Indi
a(h
ttp:
//dac
net.n
ic.in
/Ric
e/P
rodu
ctiv
ity%
20A
naly
sis%
20-%
2001
.htm
)b
Tot
alN
-fer
tiliz
erap
plie
dan
dto
talf
ood
grai
npr
oduc
tion
(≥20
0kg
ton−
1ta
ken
asou
tlie
rs)

778 Climatic Change (2012) 110:755–782
rice productivity groups while Table 17 provides wheat production zones in India.Punjab has one of the highest rice and wheat production per hectare at 3.7 and4.1 tons ha−1 respectively for 2005. Haryana is also in the same range. In contrast,Bihar is a state with low rice and wheat productivity in 2005, which stood at 1.8and 1.7 tons ha−1 respectively. Districts from Bihar are generally at lower end ofproductivity distribution in each category in Table 15. As Indian districts moveup to higher crop yields, N-fertilizer application, and therefore N2O emissions, areexpected to increase (Aggarwal and Mall 2002). Cropping intensity could be anothersurrogate indicator for agriculture technology. Its value for Punjab was 186.9% forthe year 2003–2004, the highest in India (FAI 2006). Bihar stood at 138%, higherthan a few other states of reasonable size and total crop production. If we considerpercentage of net irrigated area to net cultivated area, Punjab is again the highestat 95.4% while Bihar is much lower at 60.1%. Of course there are many stateswith lower irrigation coverage. In terms of N-fertilizer application, Punjab applied156 kg N-fertilizer ha−1 year−1 while Bihar applied 88 kg N-fertilizer ha−1 year−1 in2005, implying that the relationship between crop yields and fertilizer applicationsare non-linear (Fig. 5). Bihar could therefore be classified as traditional and Punjabas modern as far as agriculture technology is concerned. Other large Indian statesmostly lie somewhere in between these two states, indicating a transition fromtraditional to modern agriculture.
6.3 N2O intensity of crop production
The third insight is based on a related parameter—N2O intensity of crop production.It is the amount of N2O emitted for one ton crop produced. N-fertilizer application isthe main source of N2O emissions from crops, and fertilizers are applied in differentquantities for different types of crops. Crop level fertilizer application data wasnot available at district level. The average N-fertilizer applied per unit of cropproduced in Tables 16 and 17 therefore reflect total fertilizer applied and totalcrop produced per district. Farmers tend to develop an individual tendency to usefertilizers to a certain extent which could be different for different crops but wouldalso reflect a general trend in their community behavior. Modern technology districtsuse around 50–70 kg N-fertilizer ton−1 total food grain produced, while traditional
Table 17 Wheat productivity and N-fertilizer use, 2005
Productivity groups Area Average Average N-fertilizer/ Number ofcultivated productivity total food grain districts(Million ha) (ton ha−1) production (kg ton−1)a
Northern hill zone 0.8 1.77 19 31North west plains zone 9.5 4.17 69 66North east plains zone 9.5 1.58 46 168Central zone 4.5 2.86 63 89Peninsular zone 1.5 2.32 82 69Southern hill zone 0.2 1.00 105 19
This table captures districts for which wheat cultivation area data was available for the year 2005. Infact there are a total of 423 districts in India where wheat is grownaTotal N-fertilizer applied and total food grain production (≥200 kg ton−1 taken as outliers)

Climatic Change (2012) 110:755–782 779
districts use around 25–40 kg. Therefore as these traditional districts move up on cropproductivity closer to modern districts, total N-fertilizer application is most likely toincrease in India. This is a reasonable possibility. For instance, for wheat productionthe soil conditions in north east plains and north west plains are quite similar, spreadover the Indo-Gangetic plains (Singh and Sontakke 2002; Aggarwal 2008). Waterand labor availability are also similar. New technology adoption and land reformimplementation could be different currently, which could change in future. It maybe noted here that there are also some traditional technology districts that have highN-fertilizer application per ton of food grain production since their crop yield (tonha−1) is much lower. These districts may not increase their fertilizer application perunit area, but would need to enhance other agriculture inputs to increase crop yields.
6.4 Elasticity
A simple correlation based on 1985–2005 trends shows that, ceteris paribus, a 10%increase in total crop production is accompanied with a 12.4% increase in N-fertilizer application and a 9.7% increase in total N2O emissions from India. Thecorresponding arc elasticity’s are shown in Table 18. It indicates that N-fertilizerapplication has been rising over the years without a proportionate increase in cropproduction (Fig. 2). May be, on an average, the Indian agriculture is reaching aplateau as far as effectiveness of fertilizer inputs are concerned. There are still manydistricts with deficient fertilizer application where more application could lead tomuch enhanced crop yields, such as districts following traditional and transitionalagriculture technologies. However there are also many districts, those practicingmodern agriculture, where use of more fertilizer would not result in enhanced cropyields. A high elasticity of N-fertilizer application vis-à-vis total crop production dur-ing 2000–2005 shows that may be Indian agriculture is reaching a sort of an efficiencyfrontier and it needs to expand the input frontiers beyond existing considerationsto enter a second green-revolution. This could also mean that the policymakersand agriculture scientific community have to send a signal to the farmers thatexcessive fertilizer application alone may not always result in enhanced crop yield—everywhere and every year (Aggarwal 2008). This could be done through awarenessgeneration, extension services or also through a market signal, such as reducing thefertilizer subsidy.
Table 18 Some elasticity related to N2O emissions in India
Time period Elasticity of total Elasticity of total Elasticity of totalN2O emissions with N-fertilizer application N-fertilizer applicationregard to total crop with regard to total with regard to combinedproduction crop production rice and wheat production
1985–1990 0.84 1.27 2.221990–1995 0.85 1.01 2.671995–2000 0.72 0.72 0.992000–2005 4.50 6.10 3.841985–2005 0.97 1.24 2.08
780 Climatic Change (2012) 110:755–782
7 Conclusion
This research has updated N2O emission estimates from India incorporating thelatest methodologies (IPCC 2006), the latest activity data for 2005 and most recentIndian emission factor measurements. Time-series emissions over 1985–2005 havealso been re-calculated using these, improving our own previous estimates (Garget al. 2006). The current research, Indian N2O emissions have grown from 144 Gg in1985 to 267 Gg in 2005.
The sectoral share indicates that N-fertilizer application was the largest contrib-utor to N2O emissions in 2005 at 49% of all India N2O emissions. Sub-regionaldistribution indicates an upward shift in annual N2O emissions from more and moredistricts over time. The main reason being increased use of N-fertilizer. Howevercrop selection plays an important role in N2O emissions and there are crops providinghigh economic returns but low N-fertilizer requirements.
Various strategies are available to mitigate N2O emissions, such as use of ni-trification inhibitors, matching crop demand and fertilizer supply, reducing mineralnitrogen accumulation by minimizing fallow periods, optimal irrigation, using moreorganic fertilizers and micronutrients. Indian agriculture encompasses a wide vari-ability in input application technology and crop yields, manifested in states likePunjab as modern and states like Bihar as traditional. As states like Bihar anddistricts therein move up on crop productivity, N-fertilizer application is most likelyto increase. A simple correlation based on 1985–2005 trends shows that, ceterisparibus, a 10% increase in total crop production is accompanied with a 12.4%increase in N-fertilizer application and a 9.7% increase in total N2O emissions fromIndia. The small N2O emitter districts in states such as Bihar, Jharkhand, Orissa,Chhattisgarh, Rajasthan and north-eastern states have less agriculture development.Bihar could be a sleeping giant in agriculture revolution with availability of fertilesoil, laborious work force and an awakening society. Its agriculture transformationcould lead India to a second green revolution or an evergreen revolution. N2Oemissions from India could rise in future subsequently, if appropriate mitigationmeasures are not adopted simultaneously.
Acknowledgements The authors have benefited from policy discussions with Mr Vijai Sharma,Secretary to the Government of India, Ministry of Environment and Forests. We acknowledge ourtechnical discussions with Dr Subodh Sharma, Senior Advisor, Ministry of Environment and Forestsand several agriculture sector experts involved in India’s National Communication preparationprocess. Research support from our colleague Mr Bhushan Kankal is acknowledged. We alsoacknowledge Dr. M. Kainuma and Prof. Y. Matsuoka for our continued research cooperation. Theresponsibility, however, for the contents in this paper rests solely with the authors.
References
Aggarwal PK (2008) Global climate change and Indian agriculture: impacts, adaptation and mitiga-tion. Indian J Agric Sci 78:911–919
Aggarwal PK, Mall RK (2002) Climate change and rice yields in diverse agro-environments of India.II. Effect of uncertainties in scenarios and crop models on impact assessment. Clim Change52(3):331–343
Bhatia A, Pathak H, Aggarwal PK (2004) Inventory of methane and nitrous oxide emissions fromagricultural soils of India and their global warming potential. Curr Sci 87(3):317–324

Climatic Change (2012) 110:755–782 781
Bhatia A, Pathak H, Aggarwal PK, Jain N (2010) Trade-off between productivity enhancement andglobal warming potential of rice and wheat in India. Nutr Cycl Agroecosyst 86:413–424
CEA (2006) Central electricity authority, ministry of power, Government of India. http://www.cea.nic.in/. Accessed 29 January 2007
CMA (2006) Cement statistics 2006. Cement Manufacturers Association, NoidaCMIE (2007) India’s energy sector. Center for Monitoring Indian Economy, MumbaiCMIE (2008a) Prowess. Center for Monitoring Indian Economy, MumbaiCMIE (2008b) India harvest. Center for Monitoring Indian Economy, MumbaiCoI (2001) General population tables: part 1, state and districts at the 2001 census showing the 1991
area and population according to territorial jurisdiction in 1991, change in population of 1991adjusted to jurisdiction of 2001, Census of India, Government of India, pp 141–170
CPCB (2007) Municipal solid waste generation (total and per capita per day) in cities (2004/05).Central pollution control board, Government of India. http://www.cpcb.nic.in/pcpdiv_plan4.htm.Accessed 29 January 2007
CRIS INFAC (2007a) State of the industry, September 2005. Crisifac-business intelligence serviceCRIS INFAC (2007b) Industry statistics, September 2005. Crisifac-business intelligence serviceDACNET (2008) Agricultural statistics at a glance 2006. http://dacnet.nic.in/eands/agStat06-07.htm.
Accessed 26 March 2008DAHDF (2008) 17th Indian livestock census 2003 - district wise. Department of Animal Husbandry,
Dairying and Fisheries, Government of India. http://dms.nic.in/ami/home.htm. Accessed 14 June2008
Das A, Kandpal TC (1998) Indian fertilizer industry: assessment of potential energy demand andCO2 emissions. Int J Energy Res 22:383–397
DoF (2006) Annual report 2005–2006. Ministry of Chemicals and Fertilizers, Department ofFertilizer, Government of India. http://fert.nic.in/annualreport/annual-report-0506-english.pdf.Accessed 7 March 2007
Ecofys (2007) Factors underpinning future action 2007 update, Ecofys GmbH, Cologne, Germany.http://www.fiacc.net/data/fufa2.pdf. Accessed 30 Sep 2008
Economic survey (2006–2007) Union Budget and Economic Survey. Ministry of Finance,Government of India
Essar (2005) Annual Report 2005–2006. Essar Steel Ltd. http://www.essarsteel.com/steel/downloads/ESTL_AR_05_06.pdf. Accessed July 2007
Essar (2006) Steel scenario year book 2006. Essar Steel LtdFAI (2006) Fertilizer statistics 2005–2006. The Fertilizer Association of India, New DelhiGarg A, Shukla PR (2002) Emissions inventory of India. McGraw-Hill, New DelhiGarg A, Shukla PR, Kapshe M, Menon D (2004) Indian methane and nitrous oxide emissions and
mitigation flexibility. Atmos Environ 38:1965–1977Garg A, Shukla PR, Kapshe M (2006) The sectoral trends of multigas emissions inventory of India.
Atmos Environ 40:4608–4620Grigg D (1995) The pattern of world protein consumption. Geoforum 26(1):1–17HDR (2007) Human development report 2007/2008. The United Nations Development Programme,
New YorkICTSD (2010) Climate change and China’s agriculture sector: an overview of impacts, adaptation
and mitigation. International Centre for Trade and Sustainable Development, GenevaIFA (2008) The International Fertilizer Industry Association. http://www.fertilizer.org/ifa/ifadata/
search. Accessed 30 July, 2008INCCA (2010) India: greenhouse gas emissions 2007. Indian Network for Climate Change Assess-
ment, Ministry of Environment and Forest, Government of IndiaIndiastat (2007, 2008) A paid database at Indian Institute of Management, Ahmedabad. http://www.
indiastat.com/default.aspIndicus Analytics District GDP of India (2006–2007) Indicus Analytics database softwareIPCC (1996) Revised 1996 IPCC guidelines for national greenhouse gas inventories: reference
manual. Intergovernmental Panel on Climate Change, Cambridge University Press, New YorkIPCC (2001) The scientific basis. Contribution of working group I to the third assessment report of
the IPCC. Climate change 2001 (TAR), Intergovernmental Panel on Climate ChangeIPCC (2006) IPCC guidelines for national greenhouse gas inventories. Intergovernmental Panel on
Climate ChangeIPCC (2007a) The physical science basis. Contribution of working group I to the fourth assessment
report of the IPCC. Climate change 2007, Intergovernmental Panel on Climate Change

782 Climatic Change (2012) 110:755–782
IPCC (2007b) Mitigation of climate change. Contribution of working group I to the fourth assessmentreport of the IPCC. Climate change 2007, Intergovernmental Panel on Climate Change
IR (2006) Indian railway annual statistical statement, 2005–2006. Indian railways, Annual reports,Ministry of Railways
JSW (2005) Annual report 2005–2006. JSW steel Ltd 2007. http://www.jsw.in/investor_zone/pdf/Annual_Results/2006.pdf. Accessed 7 March 2007
Ladha JK, Pathak H, Krupnik TJ, Six J, Kessel C (2005) Efficiency of fertilizer nitrogen in cerealproduction: retrospect and prospects. Adv Agron 87:85–156
Mitra AP, Sharma S, Bhattacharya S, Garg A, Devotta S, Sen K (eds) (2004) Climate change andIndia: uncertainty reduction in GHG inventories. Universities Press (India) Pvt Ltd, Hyderabad
MNRE (2008) Biogas. Ministry of Non-conventional Energy Sources, Government of India, NewDelhi, India. http://mnes.nic.in/booklets/Book1-e.pdf. Accessed 23 May 2008
MoPNG (2008) Petroleum statistics 2006–2007. Ministry of Petroleum and Natural Gas. Governmentof India, New Delhi. http://petroleum.nic.in/petstat.pdf. Accessed 28 March 2008
Moulik TK, Dholakia BH, Shukla PR (1991) Energy demand for agriculture in India—in the year2000. Oxford & IBH Publishers, New Delhi
NSSO (2007) Household consumption of various goods and services in India 2004–2005, 1. NationalSample Survey Organization, Ministry of Statistics and Programme Implementation, Govern-ment of India, Report no 509(61/1.0/2), pp A-145
NSSO (2008) Employment and unemployment situation in India 2005–2006. National Sample SurveyOrganization, Ministry of Statistics and Programme Implementation, Government of India,Report no 522(62/10/1)
Pachauri RK (2006) Energy and the built environment. The Energy Research Institute; A presen-tation living with climate change vulnerability and change: understanding the uncertainties andmanaging the risks, Finland
Pathak H (1999) Emissions of nitrous oxide from soil. Curr Sci 77:359–369Ravindranath NH, Deepak P, Najeem S (2007) Biomass for energy; Resource assessment in India.
A report of Indian Institute of Science, BangaloreSAIL (2004) Statistics for iron & steel industry in India 2004. Steel Authority of India Limited, New
DelhiSaseendran SA, Singh KK, Rathore LS, Singh SV, Sinha SK (2000) Effects of climate change on rice
production in the tropical humid climate of Kerala, India. Clim Change 44:495–514Sharma C, Pathak H, Tiwari MK (2008) Estimates of emission and deposition of reactive nitrogenous
species for India. Curr Sci 94(11):1439–1446Singh N, Sontakke NA (2002) On climatic fluctuations and environmental changes of the Indo-
Gangetic plains, India. Clim Change 52:287–313UMP (1999) Urban Management Program. Solid waste disposal in Asian cities. http://www.serd.ait.
ac.th/ump/newsletter%20summer%2099.pdf. Accessed 15 July 2008UNFCCC (2008) United Nations Framework Convention on Climate Change. Bonn, Germany.
http://unfccc.int/ghg_data/ghg_data_unfccc/items/4146.php. Accessed 4 July 2008