Embed Size (px)
Citation preview

N. Kumar, Asst. Professor of Marketing
Database Marketing
Factor Analysis

N. Kumar, Asst. Professor of Marketing
Web Advertising
Objective: Identify the profile of customers who visit your website
Important information for advertisers who may wish to use your advertising services

N. Kumar, Asst. Professor of Marketing
Repositioning your Web Site
You may wish to learn of features that consumers value when browsing thro’ websitesAnalysis of consumer data may help uncover different facets (dimensions) of customers’ preferencesCan make a perceptual map to help form the basis of your strategy
N. Kumar, Asst. Professor of Marketing
How can Factor Analysis Help?
Often Factor Analysis can help summarize the information in many variables into a few underlying constructs/dimensions
Reduces the number of variables that you have to deal with little loss of information
N. Kumar, Asst. Professor of Marketing
Why Reduce Data?
Census Bureau – each zip code has more than 200 pieces of information
Typical customer survey on attitudes, lifestyles, opinions will probably have responses to more than 100 questions
N. Kumar, Asst. Professor of Marketing
Why Reduce Data … contd.
Too much data can be hard to absorb and comprehend
Difficult to work with too much data
Even if you can get it to work results will be distorted (multicollinearity problem) – regression example

N. Kumar, Asst. Professor of Marketing
What is Factor Analysis?
What is Factor Analysis?Factor analysis is a MV technique which analyzes the structure of the interrelationships among a large number of variables
Can identify the separate dimensions of the structure and can also determine the extent to which each variable is explained by each dimension

N. Kumar, Asst. Professor of Marketing
Factor Analysis: Intuitive Description
Factor Analysis summarizes information in Data by reducing original set of “items”/attributes to a smaller set of “factors”/“dimensions”/“constructs”
A Factor can be viewed as an “Index”:
Dow Jones Index -- summarizes the movement of stock market
Consumer Price Index -- reflects prices of consumer products and indicator of inflation
How to create such an “index” that appropriately summarizes the data with the minimum loss of information?

N. Kumar, Asst. Professor of Marketing
Factor Analysis: Intuitive Description (cont.)How does Factor Analysis work?
Factor Analysis “constructs” factors/axes by including original attributes with different weights
If the responses are rated almost identically for an attribute, Factor Analysis gives much lower weight
If two attributes, say attributes #3 and #4, are highly correlated i.e. stores which rate highly on attribute #3 are also rated high on #4, Factor Analysis treats #3 and #4 as measurements of the same underlying construct

N. Kumar, Asst. Professor of Marketing
Factor Analysis: e-admission
Data: Students’ scores on different subjects – say Physics, Chemistry, Math, History, English and French
Task at hand: to make an assessment about the student’s ability to succeed in school given these scores
Do we need to look at the scores on all subjects or can we use a simplified heuristic?
N. Kumar, Asst. Professor of Marketing
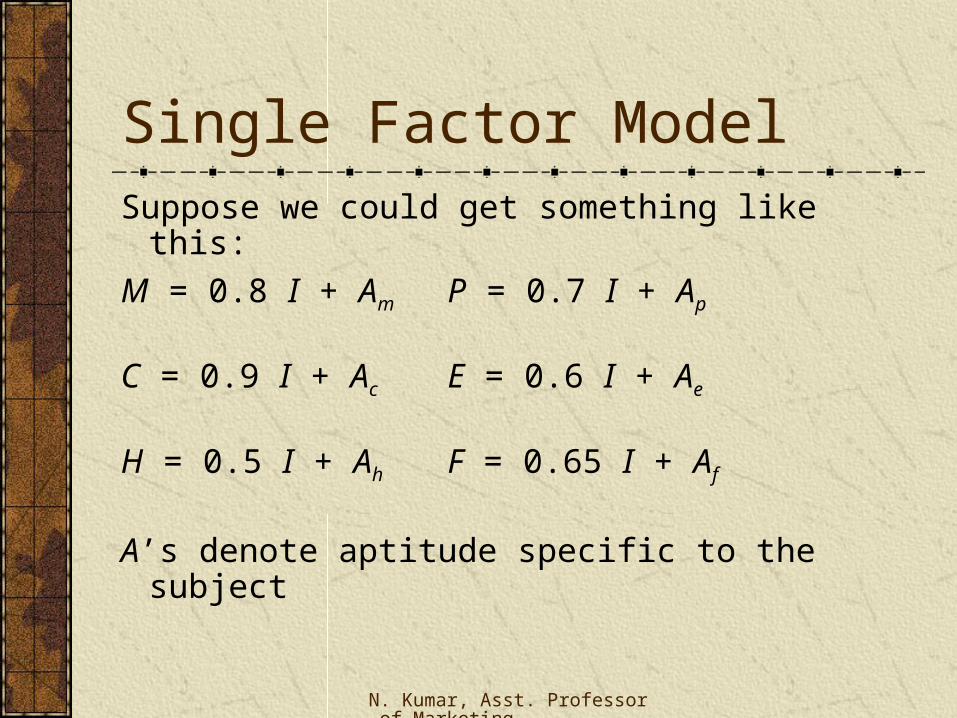
Single Factor Model
Suppose we could get something like this:
M = 0.8 I + Am P = 0.7 I + Ap
C = 0.9 I + Ac E = 0.6 I + Ae
H = 0.5 I + Ah F = 0.65 I + Af
A’s denote aptitude specific to the subject
N. Kumar, Asst. Professor of Marketing
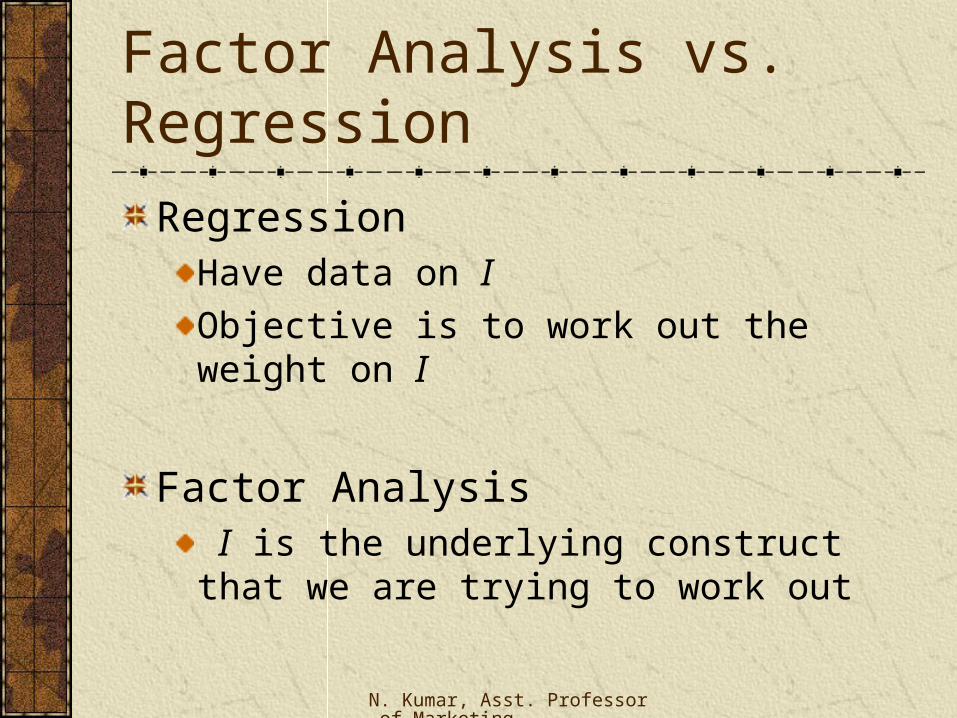
Factor Analysis vs. Regression
RegressionHave data on I
Objective is to work out the weight on I
Factor Analysis I is the underlying construct that we are trying to work out

N. Kumar, Asst. Professor of Marketing
Some Terminology
Communality – that which is common with the variable and the underlying factor.
Formally, the square of the pattern loading
Unique/Specific Variance – that which is unexplained by the factor(s)
N. Kumar, Asst. Professor of Marketing
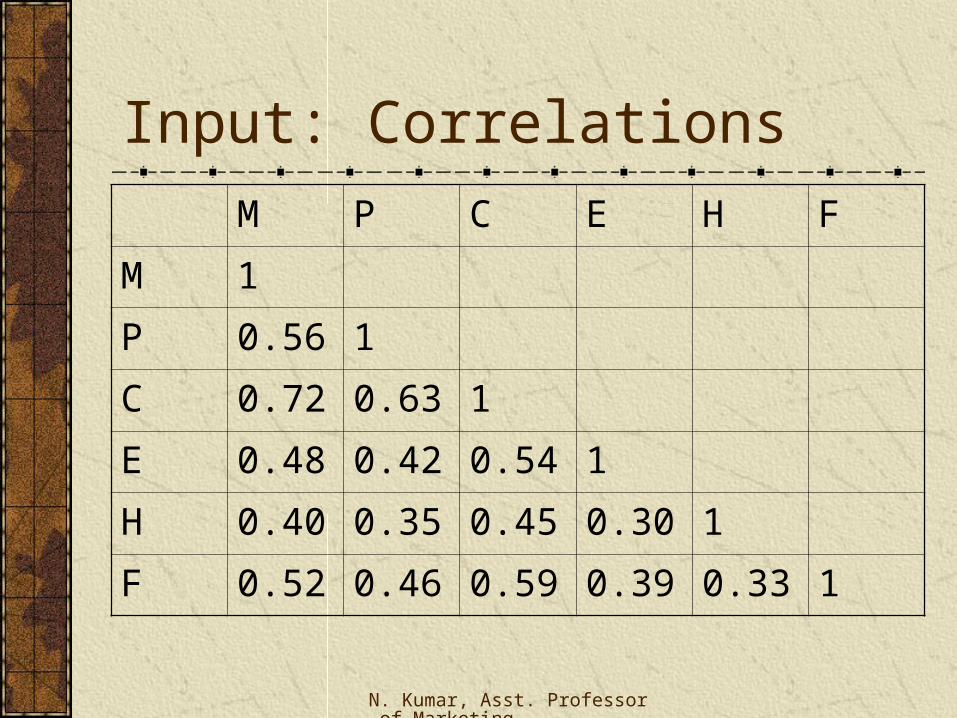
Input: Correlations
M P C E H F
M 1
P 0.56 1
C 0.72 0.63 1
E 0.48 0.42 0.54 1
H 0.40 0.35 0.45 0.30 1
F 0.52 0.46 0.59 0.39 0.33 1

N. Kumar, Asst. Professor of Marketing
Results
Variable Communality Unique Variance
Pattern Loading
M 0.640 0.360 0.8
P 0.490 0.510 0.7
C 0.810 0.190 0.9
E 0.360 0.640 0.6
H 0.250 0.750 0.5
F 0.423 0.577 0.65
Total 2.973 3.027
N. Kumar, Asst. Professor of Marketing
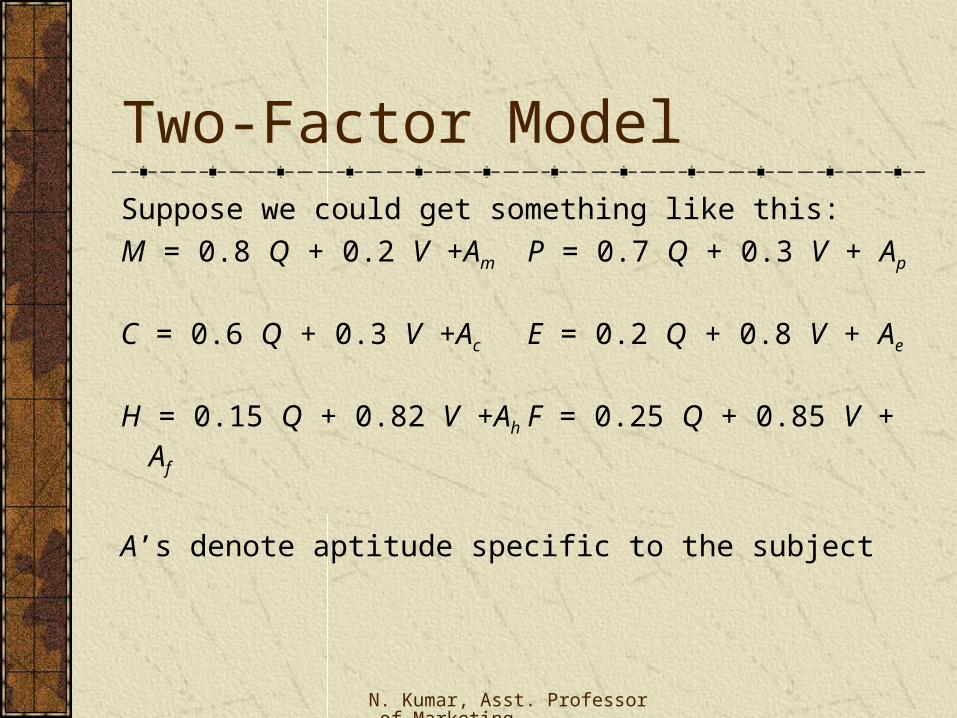
Two-Factor Model
Suppose we could get something like this:
M = 0.8 Q + 0.2 V +Am P = 0.7 Q + 0.3 V + Ap
C = 0.6 Q + 0.3 V +Ac E = 0.2 Q + 0.8 V + Ae
H = 0.15 Q + 0.82 V +Ah F = 0.25 Q + 0.85 V + Af
A’s denote aptitude specific to the subject

N. Kumar, Asst. Professor of Marketing
Results:
Variable Q V Unique
Variance
Q V
M 0.640 0.040 0.321 0.800 0.200
P 0.490 0.090 0.420 0.700 0.300
C 0.360 0.090 0.551 0.600 0.300
E 0.040 0.640 0.321 0.200 0.800
H 0.023 0.672 0.304 0.150 0.820
F 0.063 0.723 0.215 0.250 0.850
Total 1.616 2.255 2.132

N. Kumar, Asst. Professor of Marketing
Results: 2
Variable Q V Unique
Variance
Q V
M 0.445 0.234 0.321 0.667 -0.484
P 0.462 0.118 0.420 0.680 -0.343
C 0.378 0.071 0.551 0.615 -0.267
E 0.549 0.130 0.321 0.741 0.361
H 0.526 0.170 0.304 0.725 0.412
F 0.659 0.126 0.215 0.812 0.355
Total 3.019 0.849 2.132
N. Kumar, Asst. Professor of Marketing
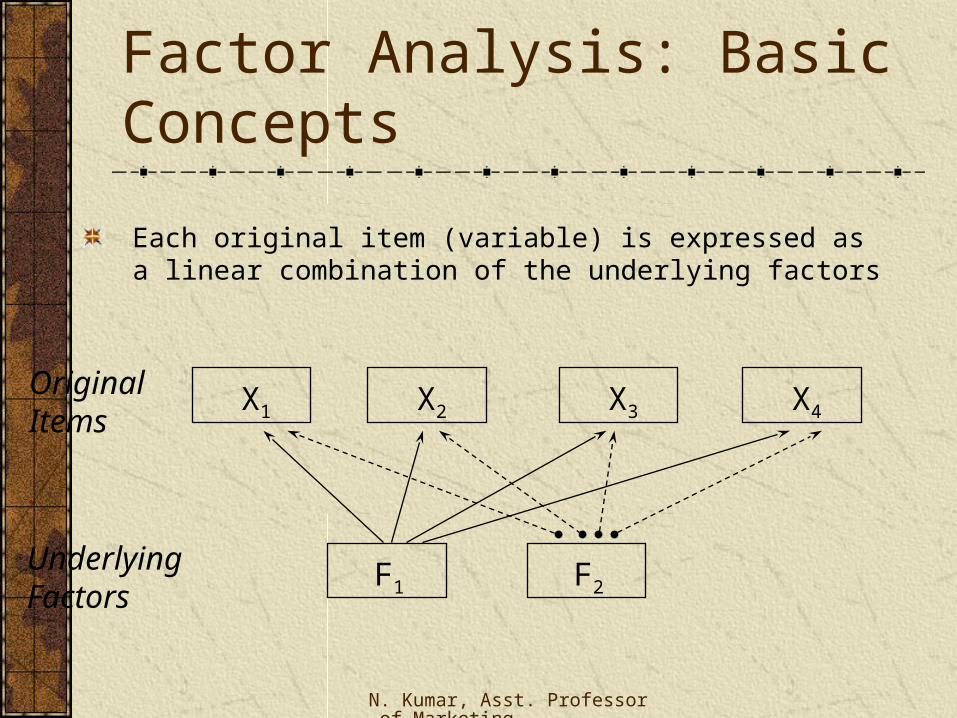
Factor Analysis: Basic Concepts
Each original item (variable) is expressed as a linear combination of the underlying factors
X1 X4X2 X3OriginalItems
F1 F2UnderlyingFactors
N. Kumar, Asst. Professor of Marketing
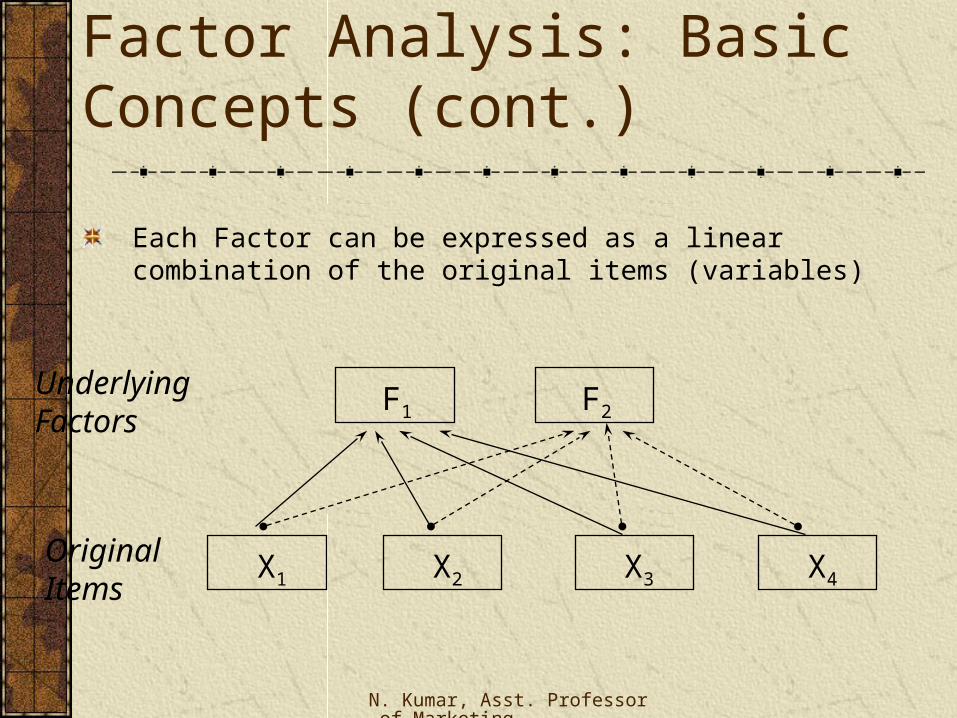
Factor Analysis: Basic Concepts (cont.)
Each Factor can be expressed as a linear combination of the original items (variables)
X1 X4X2 X3OriginalItems
F1 F2UnderlyingFactors
N. Kumar, Asst. Professor of Marketing
Factor Analysis: Basic Concepts (cont.)
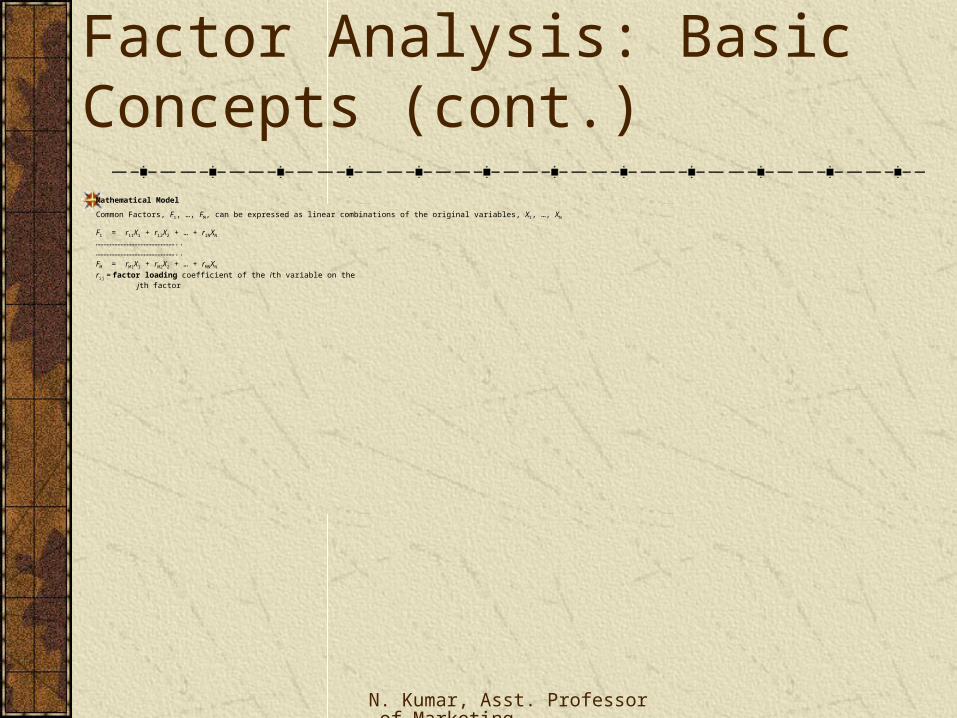
Mathematical Model
Common Factors, F1, …, FM, can be expressed as linear combinations of the original variables, X1, …, XN
F1 = r11X1 + r12X2 + … + r1NXN
…………………………………………….. …………………………………………….. FM = rM1X1 + rM2X2 + … + rMNXN
rij = factor loading coefficient of the ith variable on the jth factor

N. Kumar, Asst. Professor of Marketing
Key Words
Factor Loading: Correlation of a factor with the original variable.
Communality: Variance of a variable summarized by the underlying factors
Eigenvalue (latent root): Sum of squares of loadings of each factor – just a measure of variance
e.g. the eigenvalue of factor 1, 1,
1 = r112 + r12
2 + … + r1M2
Factor Analysis: Basic Concepts (cont.)

N. Kumar, Asst. Professor of Marketing
Factor Analysis: Basic Concepts (cont.)
What does a Factor Analysis program do?
finds the factor loadings, ri1, ri2, … , riN, for each of the underlying factors , F1, …, FM, to “best explain” the pattern of interdependence among the original variables, X1, …, XN
How are Factor Loadings determined?
select the factor loadings, r11, r12, … , r1N, for the first factor so that Factor 1 “explains” the largest portion of the total variance
select the factor loadings, r21, r22, … , r2N, for the second factor so that Factor 2 “explains” the largest portion of the “residual” variance, subject to Factor 2 being orthogonal to Factor 1
so on ...
N. Kumar, Asst. Professor of Marketing
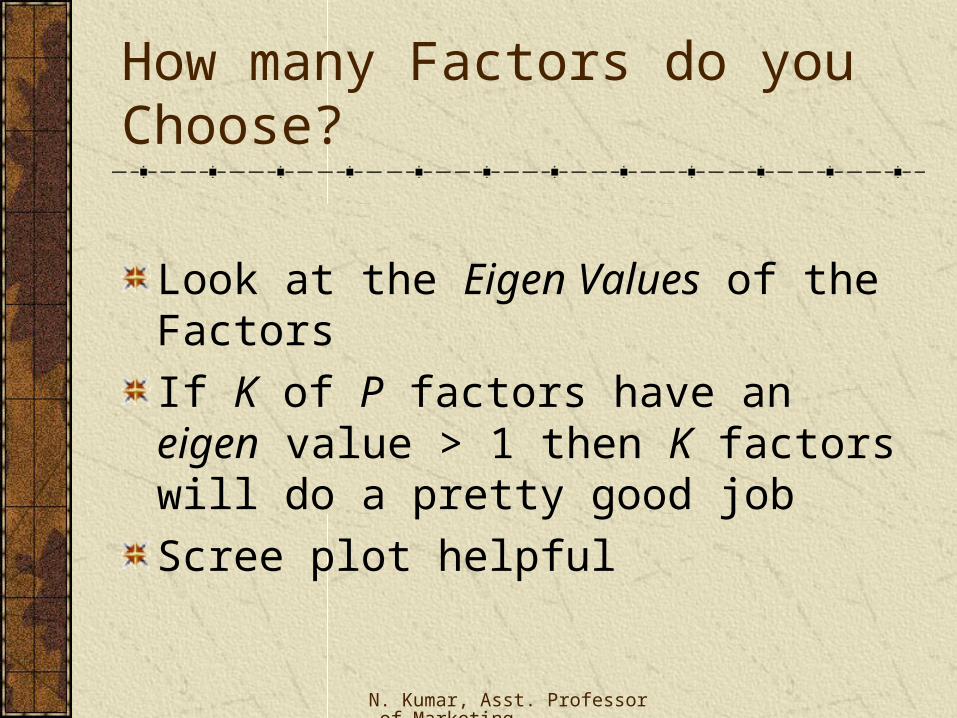
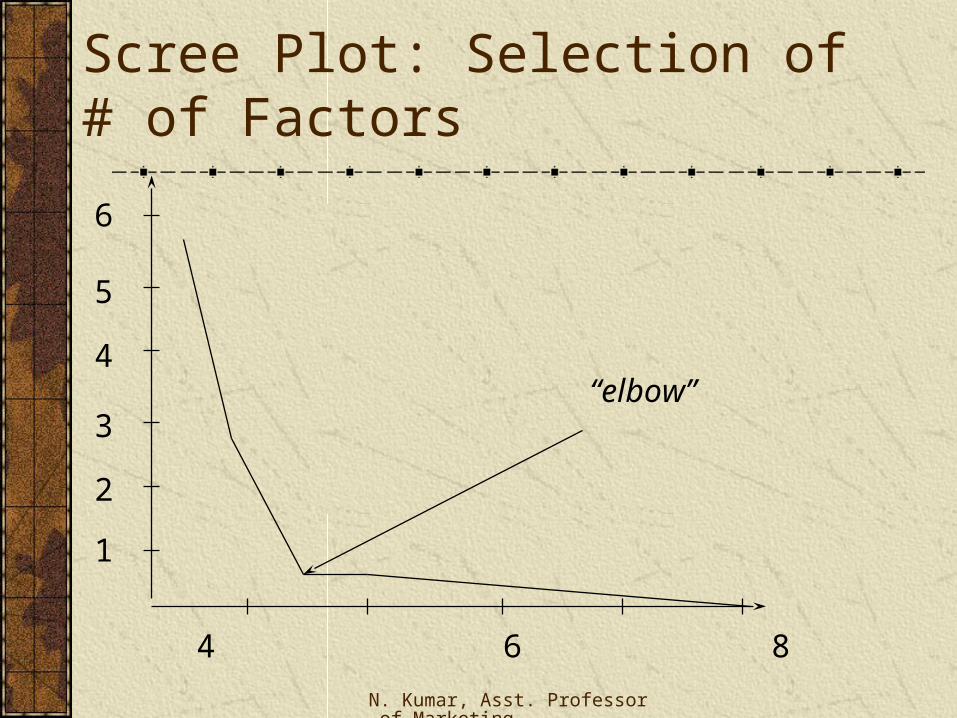
How many Factors do you Choose?
Look at the Eigen Values of the Factors
If K of P factors have an eigen value > 1 then K factors will do a pretty good job
Scree plot helpful

N. Kumar, Asst. Professor of Marketing
Scree Plot: Selection of # of Factors
6
5
4
3
2
1
2 4 6 8 10
“elbow”

N. Kumar, Asst. Professor of Marketing
Factor Analysis:Geometric Interpretation
ErrorF1
F2
x1
N. Kumar, Asst. Professor of Marketing
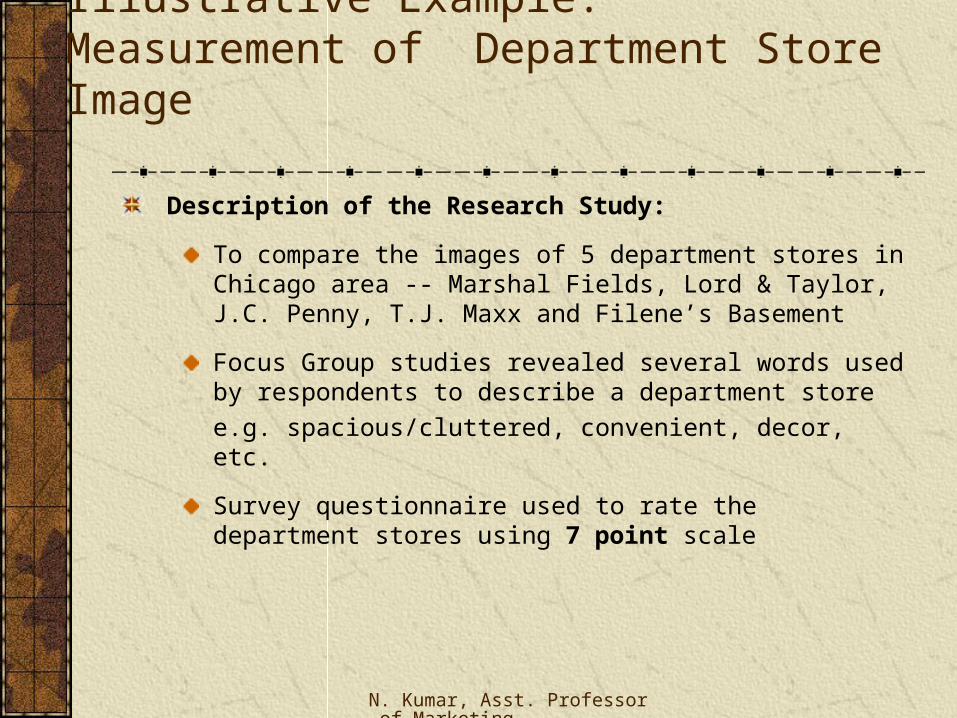
Illustrative Example: Measurement of Department Store Image
Description of the Research Study:
To compare the images of 5 department stores in Chicago area -- Marshal Fields, Lord & Taylor, J.C. Penny, T.J. Maxx and Filene’s Basement
Focus Group studies revealed several words used by respondents to describe a department store
e.g. spacious/cluttered, convenient, decor, etc.
Survey questionnaire used to rate the department stores using 7 point scale
N. Kumar, Asst. Professor of Marketing
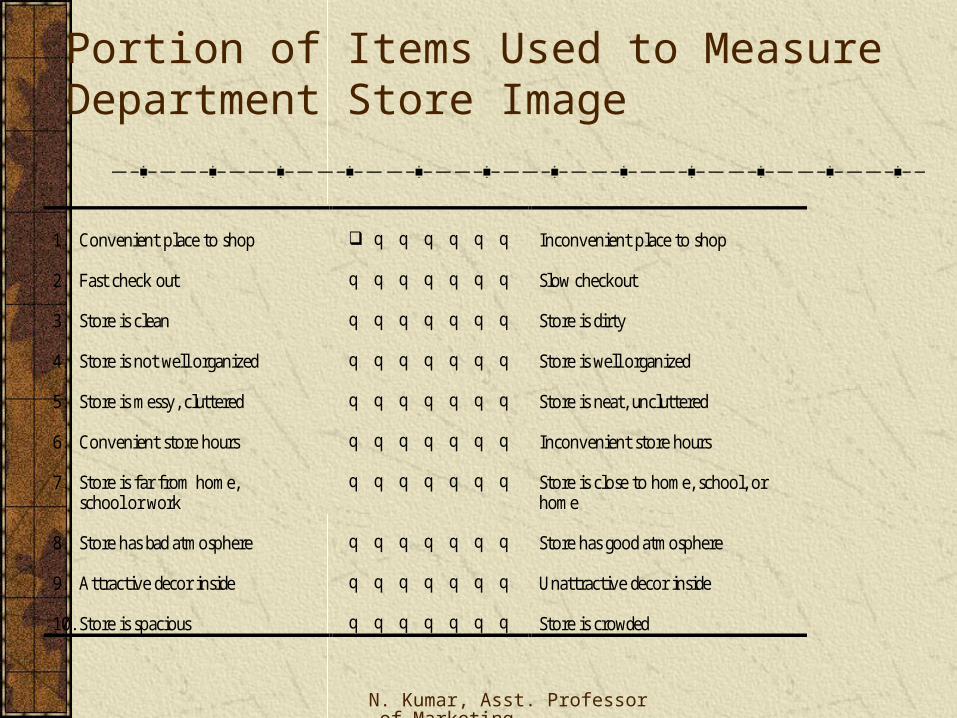
Portion of Items Used to Measure Department Store Image
1. Convenient place to shop q q q q q q Inconvenient place to shop
2. Fast check out q q q q q q q Slow checkout
3. Store is clean q q q q q q q Store is dirty
4. Store is not well organized q q q q q q q Store is well organized
5. Store is messy, cluttered q q q q q q q Store is neat, uncluttered
6. Convenient store hours q q q q q q q Inconvenient store hours
7. Store is far from home, school or work
q q q q q q q Store is close to home, school, orhome
8. Store has bad atmosphere q q q q q q q Store has good atmosphere
9. Attractive decor inside q q q q q q q Unattractive decor inside
10. Store is spacious q q q q q q q Store is crowded
N. Kumar, Asst. Professor of Marketing
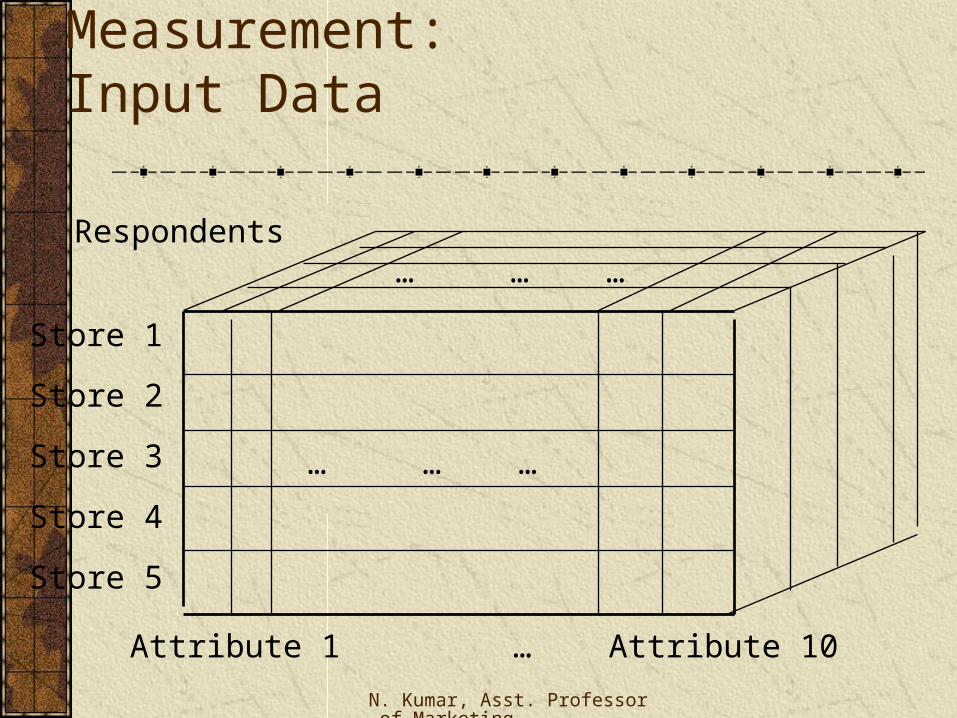
Department Store Image Measurement:Input Data
Store 1
Store 2
Store 3
Store 4
Store 5
Attribute 1 … Attribute 10
Respondents
… … …
… … …
N. Kumar, Asst. Professor of Marketing
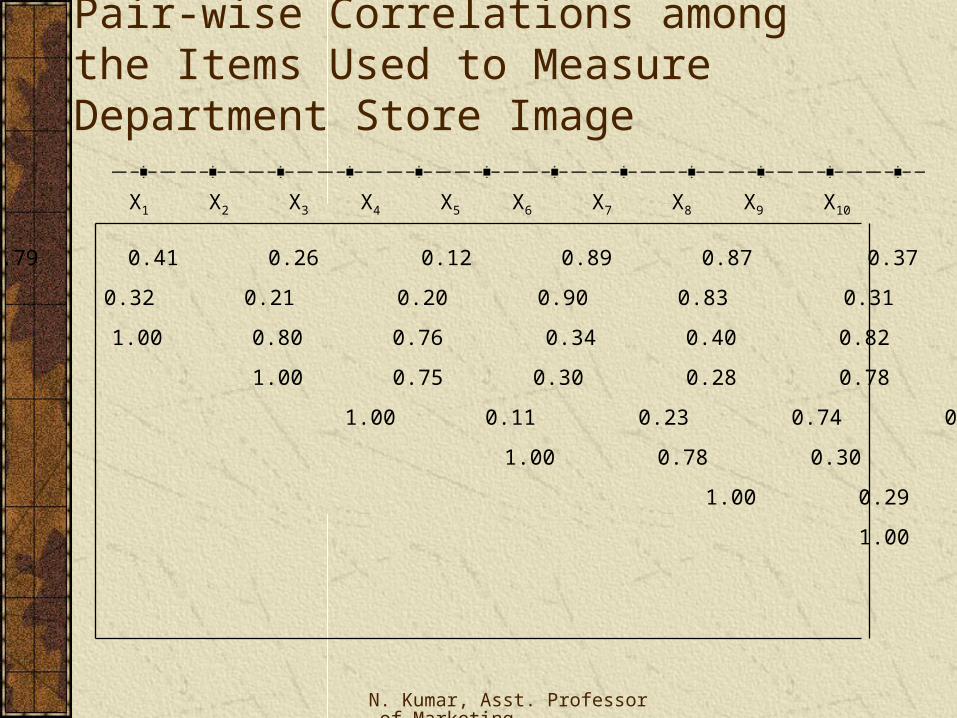
Pair-wise Correlations among the Items Used to Measure Department Store Image
X1 X2 X3 X4 X5 X6 X7 X8 X9 X10
X1 1.00 0.79 0.41 0.26 0.12 0.89 0.87 0.37 0.32 0.18
X2 1.00 0.32 0.21 0.20 0.90 0.83 0.31 0.35 0.23
X3 1.00 0.80 0.76 0.34 0.40 0.82 0.78 0.72
X4 1.00 0.75 0.30 0.28 0.78 0.81 0.80
X5 1.00 0.11 0.23 0.74 0.77 0.83
X6 1.00 0.78 0.30 0.39 0.16
X7 1.00 0.29 0.26 0.17
X8 1.00 0.82 0.78
X9 1.00 0.77
X10 1.00
N. Kumar, Asst. Professor of Marketing
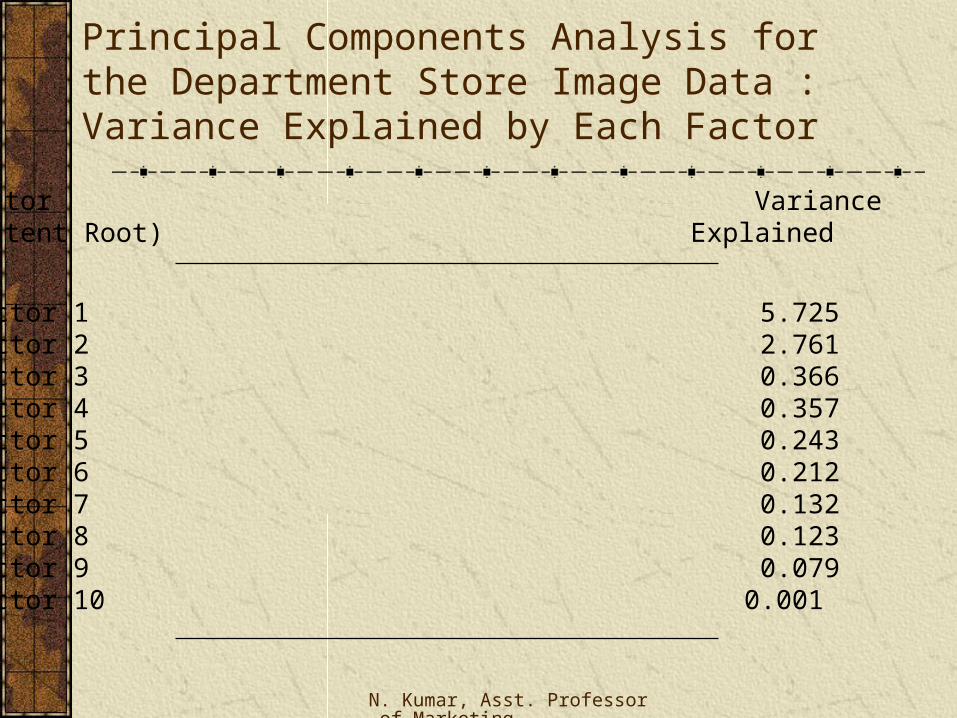
Principal Components Analysis for the Department Store Image Data : Variance Explained by Each Factor
Factor Variance(Latent Root) Explained
Factor 1 5.725Factor 2 2.761 Factor 3 0.366Factor 4 0.357Factor 5 0.243Factor 6 0.212Factor 7 0.132Factor 8 0.123Factor 9 0.079Factor 10 0.001
N. Kumar, Asst. Professor of Marketing
Scree Plot: Selection of # of Factors
6
5
4
3
2
1
2 4 6 8 10
“elbow”
N. Kumar, Asst. Professor of Marketing
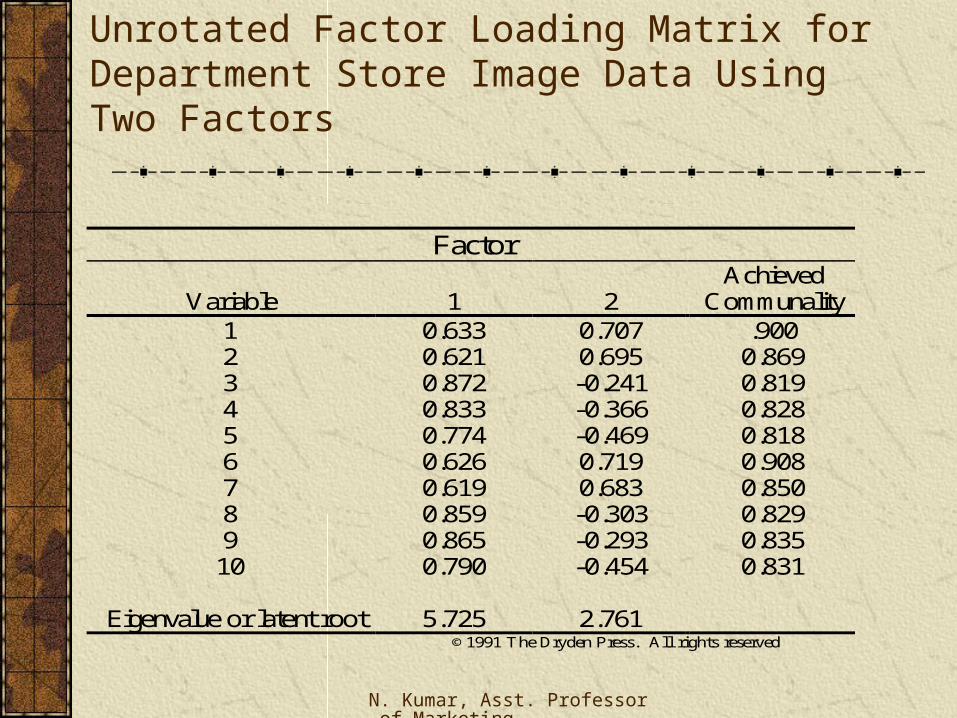
Unrotated Factor Loading Matrix for Department Store Image Data Using Two Factors
Factor
Variable 1 2Achieved
Communality123456789
10
0.6330.6210.8720.8330.7740.6260.6190.8590.8650.790
0.7070.695-0.241-0.366-0.4690.7190.683-0.303-0.293-0.454
.9000.8690.8190.8280.8180.9080.8500.8290.8350.831
Eigenvalue or latent root 5.725 2.761©1991 The Dryden Press. All rights reserved
N. Kumar, Asst. Professor of Marketing
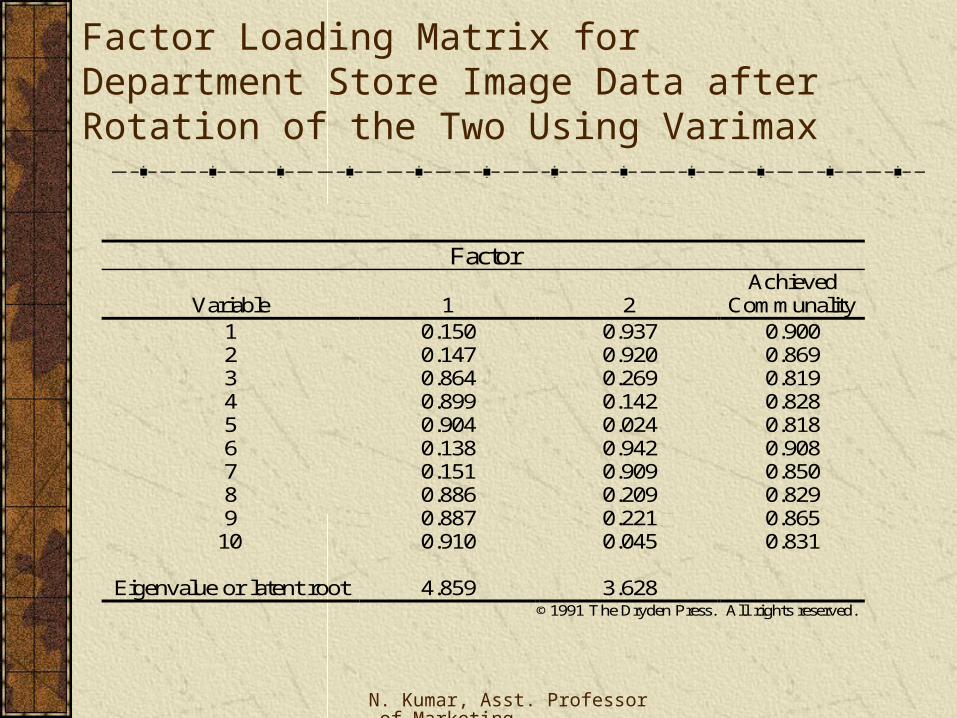
Factor Loading Matrix for Department Store Image Data after Rotation of the Two Using Varimax
Factor
Variable 1 2Achieved
Communality123456789
10
0.1500.1470.8640.8990.9040.1380.1510.8860.8870.910
0.9370.9200.2690.1420.0240.9420.9090.2090.2210.045
0.9000.8690.8190.8280.8180.9080.8500.8290.8650.831
Eigenvalue or latent root 4.859 3.628©1991 The Dryden Press. All rights reserved.
N. Kumar, Asst. Professor of Marketing
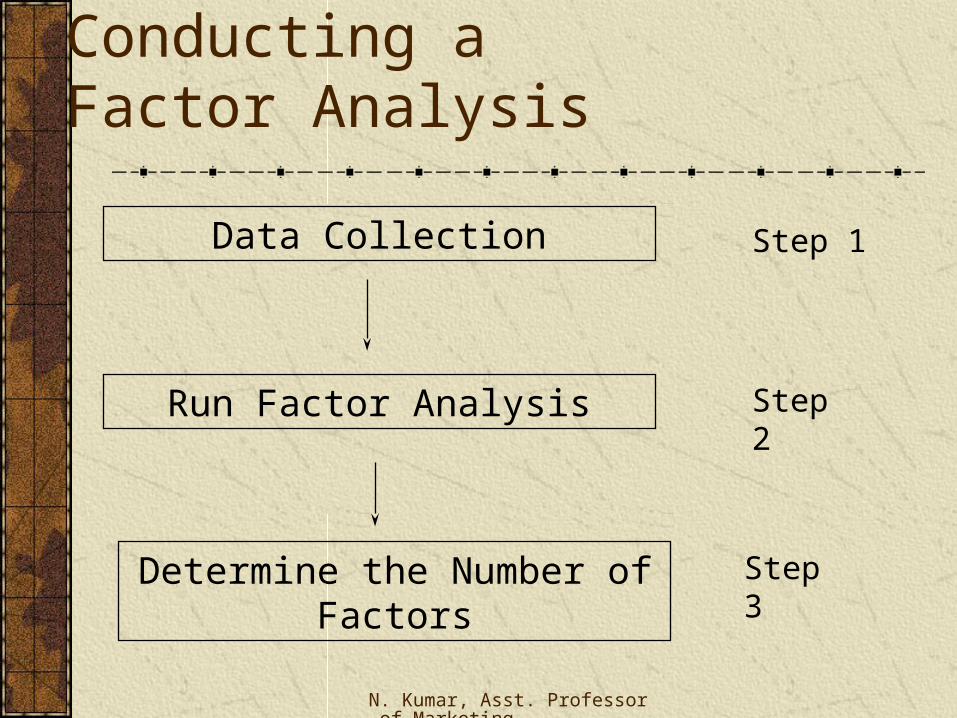
Procedure for Conducting a Factor Analysis
Data Collection Step 1
Run Factor Analysis Step 2
Determine the Number of Factors Step 3
N. Kumar, Asst. Professor of Marketing
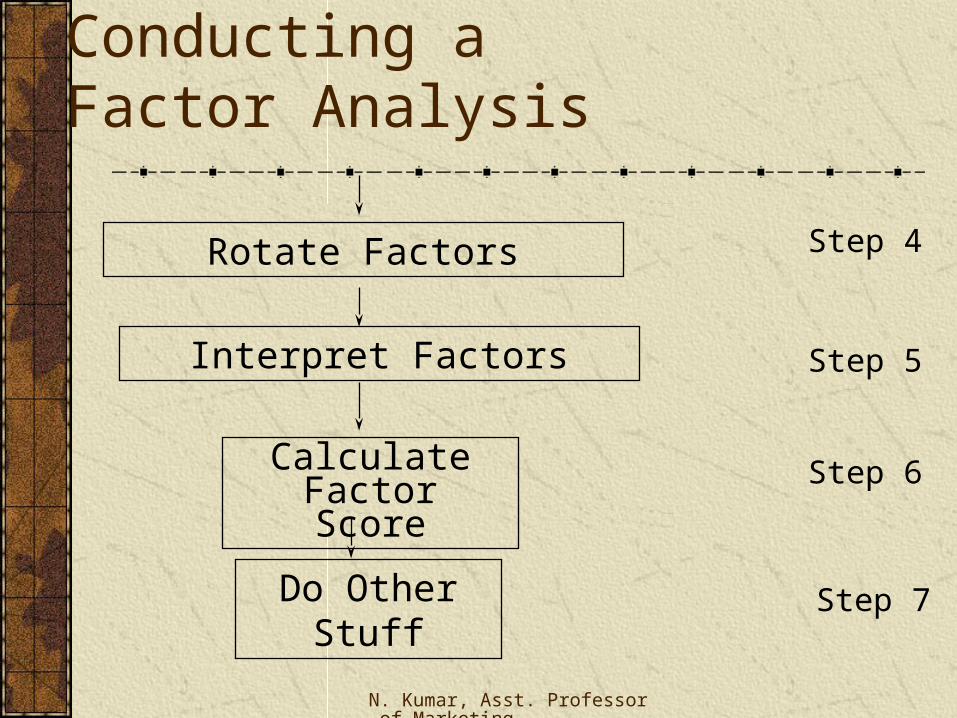
Rotate Factors Step 4
Interpret Factors Step 5
Calculate FactorScore Step 6
Do Other Stuff
Procedure for Conducting a Factor Analysis
Step 7
N. Kumar, Asst. Professor of Marketing
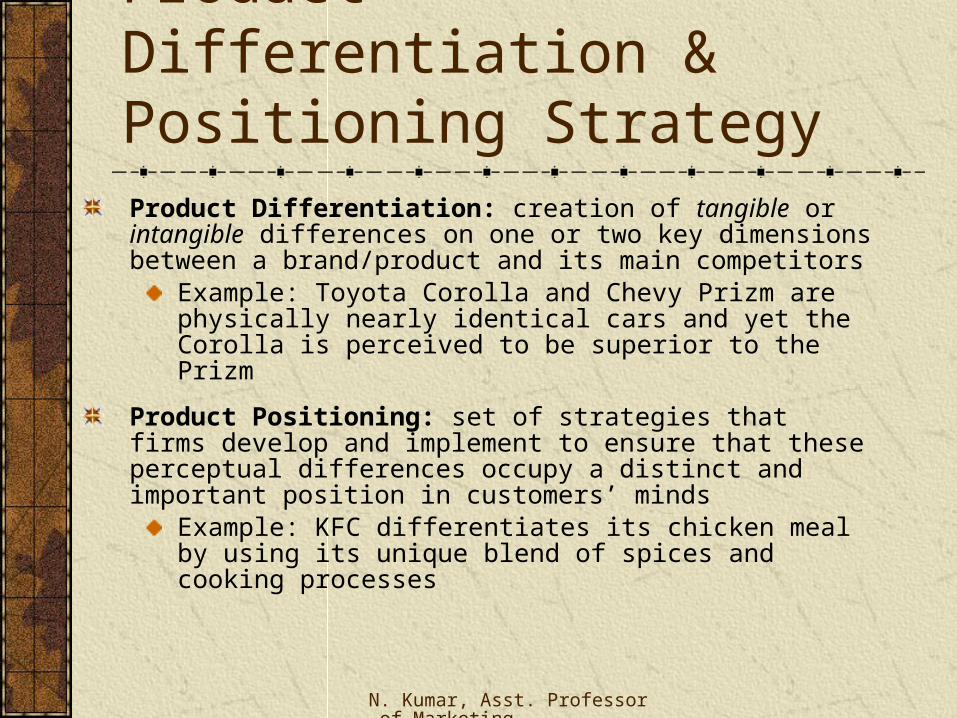
Product Differentiation & Positioning Strategy
Product Differentiation: creation of tangible or intangible differences on one or two key dimensions between a brand/product and its main competitors
Example: Toyota Corolla and Chevy Prizm are physically nearly identical cars and yet the Corolla is perceived to be superior to the Prizm
Product Positioning: set of strategies that firms develop and implement to ensure that these perceptual differences occupy a distinct and important position in customers’ minds
Example: KFC differentiates its chicken meal by using its unique blend of spices and cooking processes
N. Kumar, Asst. Professor of Marketing
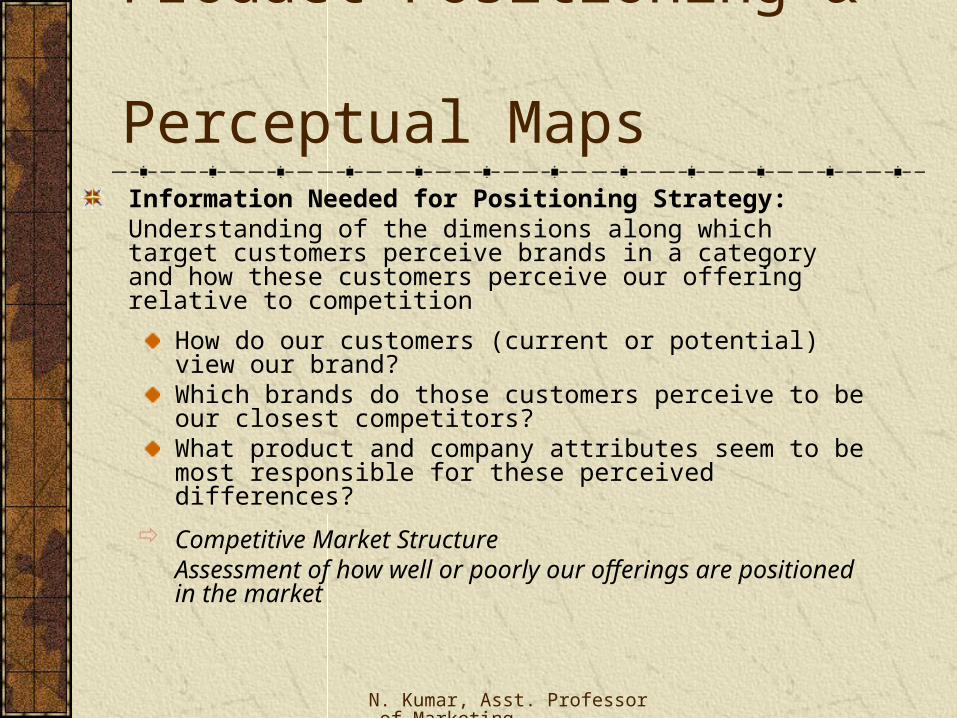
Product Positioning & Perceptual Maps
Information Needed for Positioning Strategy: Understanding of the dimensions along which target customers
perceive brands in a category and how these customers perceive our offering relative to competition
How do our customers (current or potential) view our brand?Which brands do those customers perceive to be our closest competitors?What product and company attributes seem to be most responsible for these perceived differences?
Competitive Market Structure Assessment of how well or poorly our offerings are
positioned in the market

N. Kumar, Asst. Professor of Marketing
Product Positioning & Perceptual Maps (cont.)
Managerial Decisions & Action: Critical elements of a differential strategy/action plan
What should we do to get our target customer segment(s) to perceive our offering as different?Based on customer perceptions, which target segment(s) are most attractive?How should we position our new product with respect to our existing products?What product name is most closely associated with attributes our target segment perceives to be desirable
Perceptual Map facilitate differentiation & positioning decisions
N. Kumar, Asst. Professor of Marketing
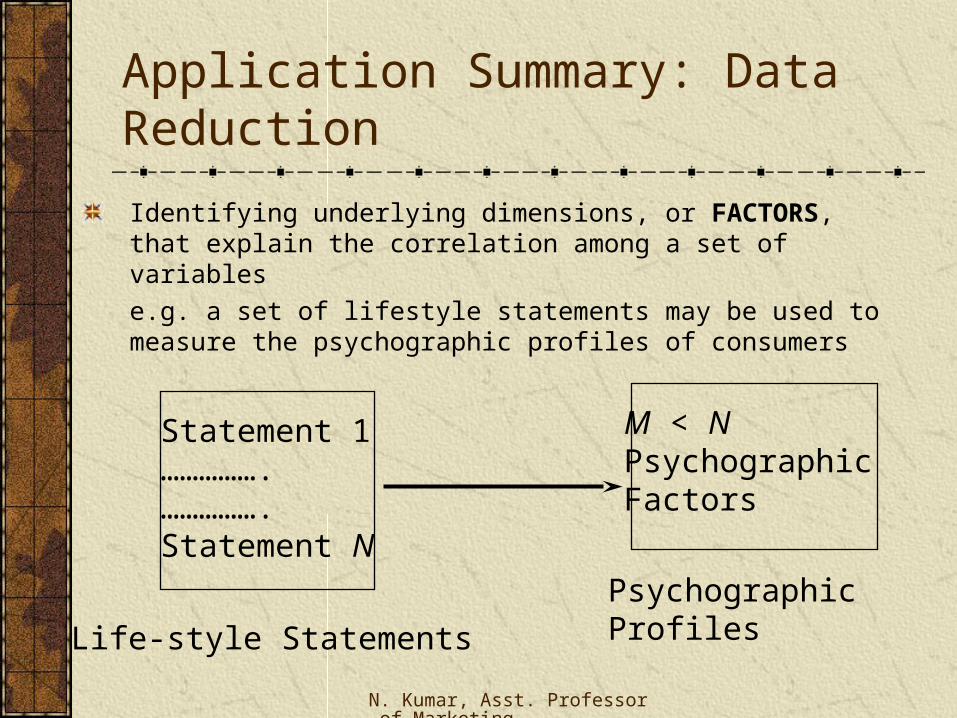
Application Summary: Data Reduction
Identifying underlying dimensions, or FACTORS, that explain the correlation among a set of variables
e.g. a set of lifestyle statements may be used to measure the psychographic profiles of consumers
Statement 1…………….…………….Statement N
Life-style Statements
M < N PsychographicFactors
PsychographicProfiles
N. Kumar, Asst. Professor of Marketing
Understanding customer preferencesWhat dimensions to differentiate on to be successful – implications for repositioning or introduction strategy
Application Summary: Product Positioning/Introduction

N. Kumar, Asst. Professor of Marketing
Web Advertising
Understanding the profile of customers Conduct a survey
Analyze the data – extract the factors
Interpret the factors – score the customers
Can even draw a perceptual map of customers in the factor space

N. Kumar, Asst. Professor of Marketing
Repositioning your Web Site
To learn of features that consumers value when browsing thro’ websites – conduct a survey
Factor analyze the data to uncover the underlying factors that influence customers’ preferences – interpret the factors
How score on these dimensions relative to your competition - perceptual map to help form the basis of your strategy