Embed Size (px)
Citation preview
Chapter No. 6
PhD Thesis – Sardar Patel University Page 169
1. DRUG INFORMATION [1-6]
1.1 ATENOLOL:
PARAMETER DESCRIPTION
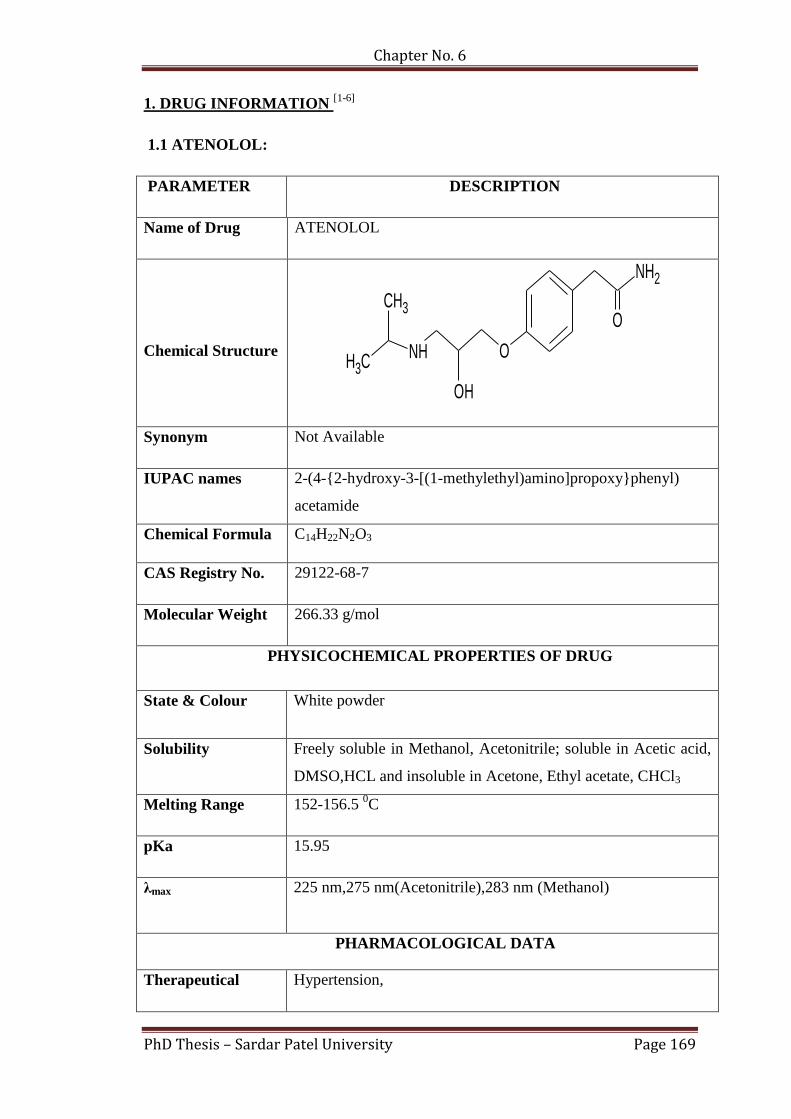
Name of Drug ATENOLOL
Chemical Structure
NH2
O
ONH
CH3
CH3
OH
Synonym Not Available
IUPAC names 2-(4-{2-hydroxy-3-[(1-methylethyl)amino]propoxy}phenyl)
acetamide
Chemical Formula C14H22N2O3
CAS Registry No. 29122-68-7
Molecular Weight 266.33 g/mol
PHYSICOCHEMICAL PROPERTIES OF DRUG
State & Colour White powder
Solubility Freely soluble in Methanol, Acetonitrile; soluble in Acetic acid,
DMSO,HCL and insoluble in Acetone, Ethyl acetate, CHCl3
Melting Range 152-156.5 0C
pKa 15.95
λmax 225 nm,275 nm(Acetonitrile),283 nm (Methanol)
PHARMACOLOGICAL DATA
Therapeutical Hypertension,
Chapter No. 6
PhD Thesis – Sardar Patel University Page 170
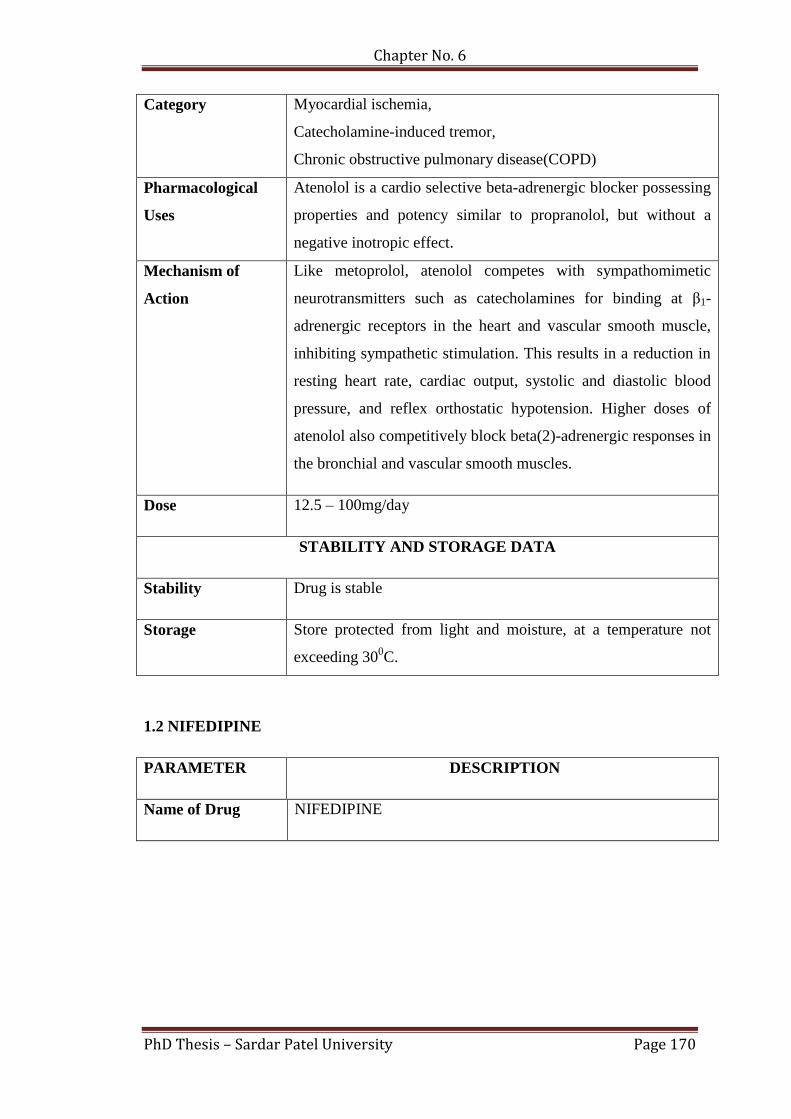
Category Myocardial ischemia,
Catecholamine-induced tremor,
Chronic obstructive pulmonary disease(COPD)
Pharmacological
Uses
Atenolol is a cardio selective beta-adrenergic blocker possessing
properties and potency similar to propranolol, but without a
negative inotropic effect.
Mechanism of
Action
Like metoprolol, atenolol competes with sympathomimetic
neurotransmitters such as catecholamines for binding at β1-
adrenergic receptors in the heart and vascular smooth muscle,
inhibiting sympathetic stimulation. This results in a reduction in
resting heart rate, cardiac output, systolic and diastolic blood
pressure, and reflex orthostatic hypotension. Higher doses of
atenolol also competitively block beta(2)-adrenergic responses in
the bronchial and vascular smooth muscles.
Dose 12.5 – 100mg/day
STABILITY AND STORAGE DATA
Stability Drug is stable
Storage Store protected from light and moisture, at a temperature not
exceeding 300C.
1.2 NIFEDIPINE
PARAMETER DESCRIPTION
Name of Drug NIFEDIPINE
Chapter No. 6
PhD Thesis – Sardar Patel University Page 171
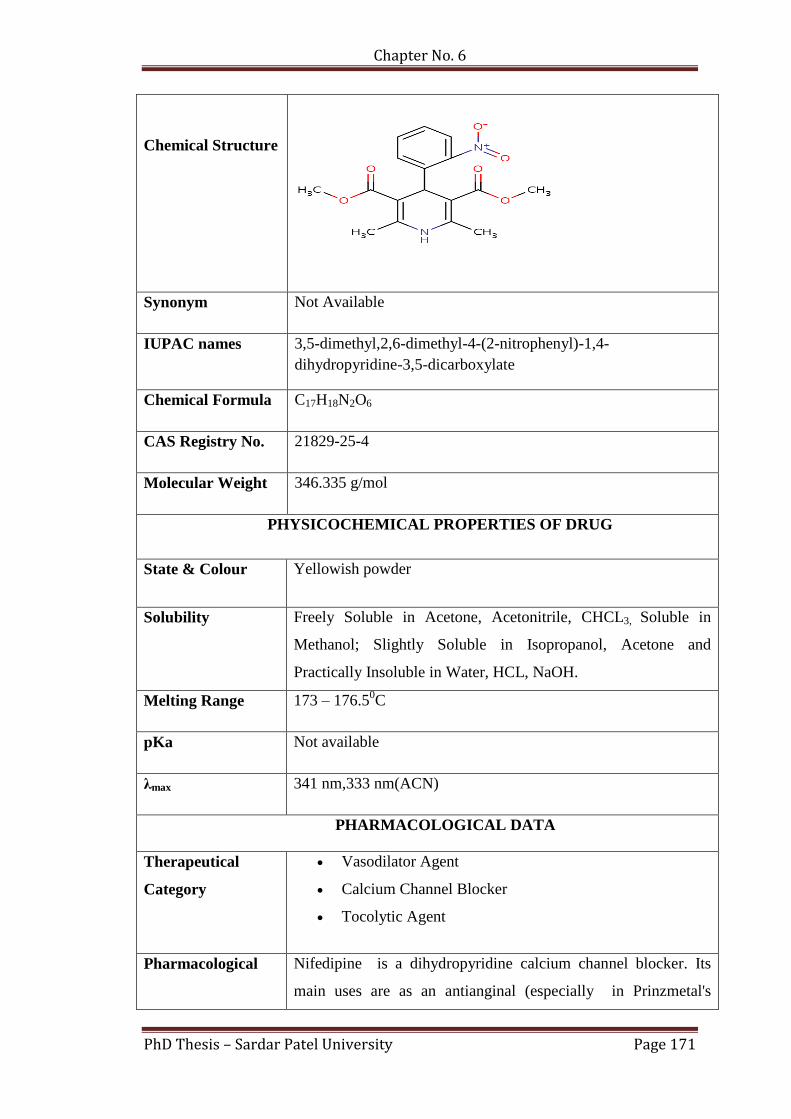
Chemical Structure
Synonym Not Available
IUPAC names 3,5-dimethyl,2,6-dimethyl-4-(2-nitrophenyl)-1,4-
dihydropyridine-3,5-dicarboxylate
Chemical Formula C17H18N2O6
CAS Registry No. 21829-25-4
Molecular Weight 346.335 g/mol
PHYSICOCHEMICAL PROPERTIES OF DRUG
State & Colour Yellowish powder
Solubility Freely Soluble in Acetone, Acetonitrile, CHCL3, Soluble in
Methanol; Slightly Soluble in Isopropanol, Acetone and
Practically Insoluble in Water, HCL, NaOH.
Melting Range 173 – 176.50C
pKa Not available
λmax 341 nm,333 nm(ACN)
PHARMACOLOGICAL DATA
Therapeutical
Category
Vasodilator Agent
Calcium Channel Blocker
Tocolytic Agent
Pharmacological Nifedipine is a dihydropyridine calcium channel blocker. Its
main uses are as an antianginal (especially in Prinzmetal's
Chapter No. 6
PhD Thesis – Sardar Patel University Page 172
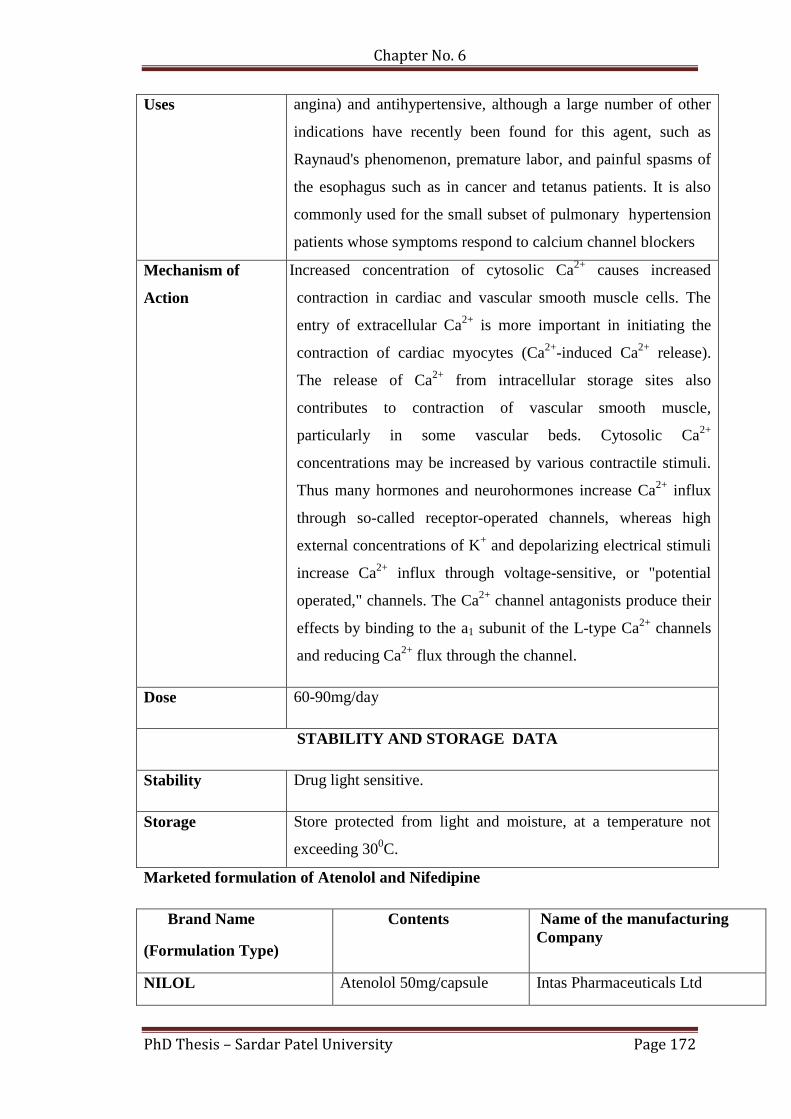
Uses angina) and antihypertensive, although a large number of other
indications have recently been found for this agent, such as
Raynaud's phenomenon, premature labor, and painful spasms of
the esophagus such as in cancer and tetanus patients. It is also
commonly used for the small subset of pulmonary hypertension
patients whose symptoms respond to calcium channel blockers
Mechanism of
Action
An Increased concentration of cytosolic Ca2+
causes increased
contraction in cardiac and vascular smooth muscle cells. The
entry of extracellular Ca2+
is more important in initiating the
contraction of cardiac myocytes (Ca2+
-induced Ca2+
release).
The release of Ca2+
from intracellular storage sites also
contributes to contraction of vascular smooth muscle,
particularly in some vascular beds. Cytosolic Ca2+
concentrations may be increased by various contractile stimuli.
Thus many hormones and neurohormones increase Ca2+
influx
through so-called receptor-operated channels, whereas high
external concentrations of K+ and depolarizing electrical stimuli
increase Ca2+
influx through voltage-sensitive, or "potential
operated," channels. The Ca2+
channel antagonists produce their
effects by binding to the a1 subunit of the L-type Ca2+
channels
and reducing Ca2+
flux through the channel.
Dose 60-90mg/day
STABILITY AND STORAGE DATA
Stability Drug light sensitive.
Storage Store protected from light and moisture, at a temperature not
exceeding 300C.
Marketed formulation of Atenolol and Nifedipine
Brand Name
(Formulation Type)
Contents Name of the manufacturing
Company
NILOL Atenolol 50mg/capsule Intas Pharmaceuticals Ltd
Chapter No. 6
PhD Thesis – Sardar Patel University Page 173
(Tablets) Nifedipine 20mg/capsule
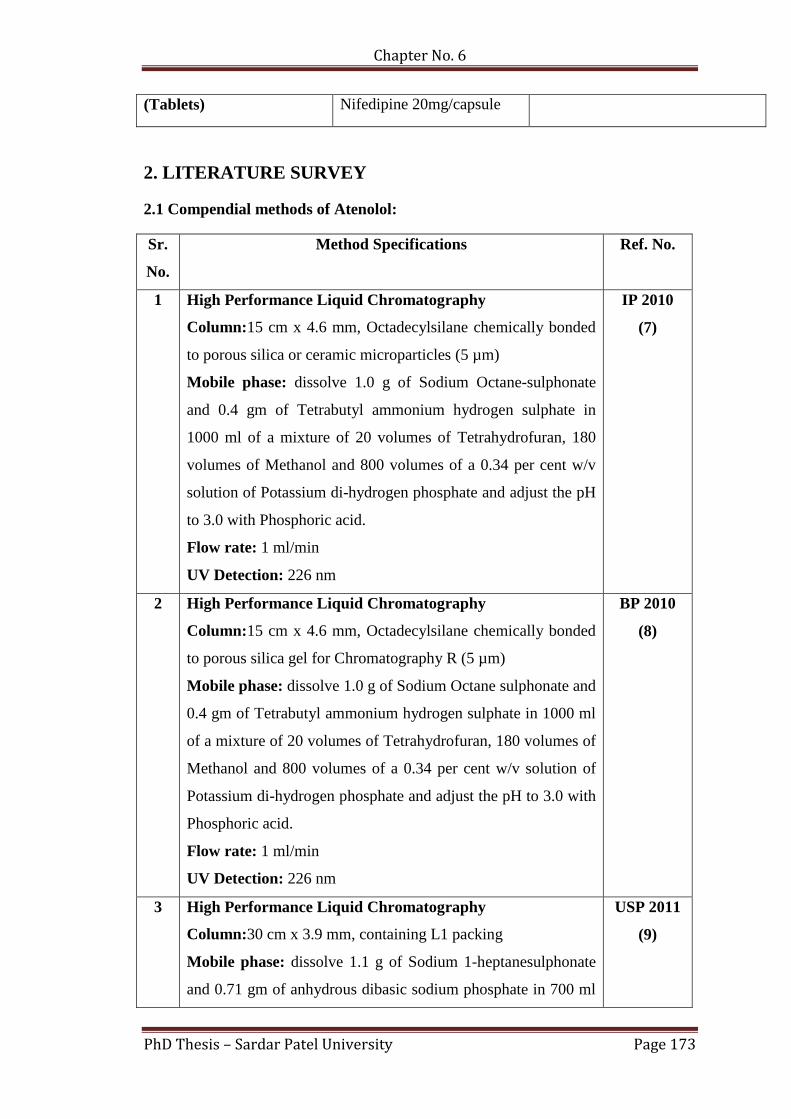
2. LITERATURE SURVEY
2.1 Compendial methods of Atenolol:
Sr.
No.
Method Specifications Ref. No.
1 High Performance Liquid Chromatography
Column:15 cm x 4.6 mm, Octadecylsilane chemically bonded
to porous silica or ceramic microparticles (5 µm)
Mobile phase: dissolve 1.0 g of Sodium Octane-sulphonate
and 0.4 gm of Tetrabutyl ammonium hydrogen sulphate in
1000 ml of a mixture of 20 volumes of Tetrahydrofuran, 180
volumes of Methanol and 800 volumes of a 0.34 per cent w/v
solution of Potassium di-hydrogen phosphate and adjust the pH
to 3.0 with Phosphoric acid.
Flow rate: 1 ml/min
UV Detection: 226 nm
IP 2010
(7)
2 High Performance Liquid Chromatography
Column:15 cm x 4.6 mm, Octadecylsilane chemically bonded
to porous silica gel for Chromatography R (5 µm)
Mobile phase: dissolve 1.0 g of Sodium Octane sulphonate and
0.4 gm of Tetrabutyl ammonium hydrogen sulphate in 1000 ml
of a mixture of 20 volumes of Tetrahydrofuran, 180 volumes of
Methanol and 800 volumes of a 0.34 per cent w/v solution of
Potassium di-hydrogen phosphate and adjust the pH to 3.0 with
Phosphoric acid.
Flow rate: 1 ml/min
UV Detection: 226 nm
BP 2010
(8)
3 High Performance Liquid Chromatography
Column:30 cm x 3.9 mm, containing L1 packing
Mobile phase: dissolve 1.1 g of Sodium 1-heptanesulphonate
and 0.71 gm of anhydrous dibasic sodium phosphate in 700 ml
USP 2011
(9)
Chapter No. 6
PhD Thesis – Sardar Patel University Page 174
of a mixture of water. Add 2 ml of Dibutylamine, and adjust
with 0.8 M phosphoric acid to pH 3.0. Add 300 ml of methanol,
mix, and pass through 0.5 µm or fine porosity filter and degas it
before use.
Flow rate: 0.6 ml/min
UV Detection: 226 nm.
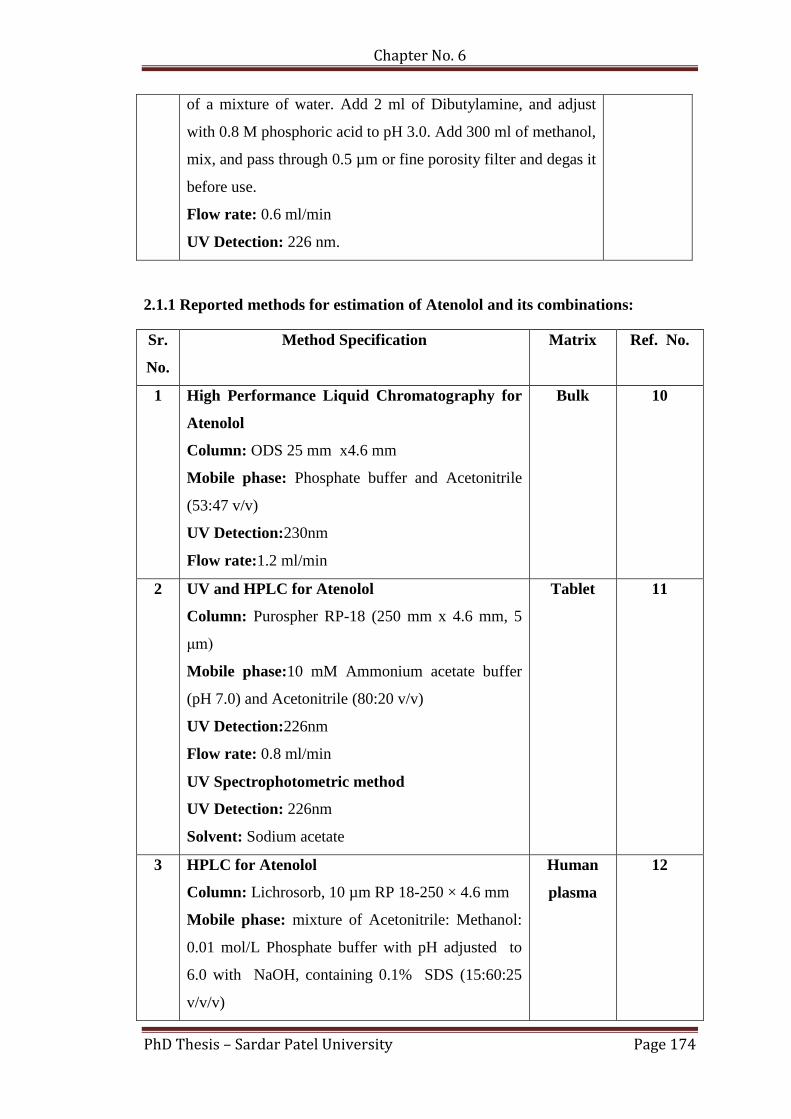
2.1.1 Reported methods for estimation of Atenolol and its combinations:
Sr.
No.
Method Specification Matrix Ref. No.
1 High Performance Liquid Chromatography for
Atenolol
Column: ODS 25 mm x4.6 mm
Mobile phase: Phosphate buffer and Acetonitrile
(53:47 v/v)
UV Detection:230nm
Flow rate:1.2 ml/min
Bulk 10
2 UV and HPLC for Atenolol
Column: Purospher RP-18 (250 mm x 4.6 mm, 5
μm)
Mobile phase:10 mM Ammonium acetate buffer
(pH 7.0) and Acetonitrile (80:20 v/v)
UV Detection:226nm
Flow rate: 0.8 ml/min
UV Spectrophotometric method
UV Detection: 226nm
Solvent: Sodium acetate
Tablet 11
3 HPLC for Atenolol
Column: Lichrosorb, 10 µm RP 18-250 × 4.6 mm
Mobile phase: mixture of Acetonitrile: Methanol:
0.01 mol/L Phosphate buffer with pH adjusted to
6.0 with NaOH, containing 0.1% SDS (15:60:25
v/v/v)
Human
plasma
12
Chapter No. 6
PhD Thesis – Sardar Patel University Page 175
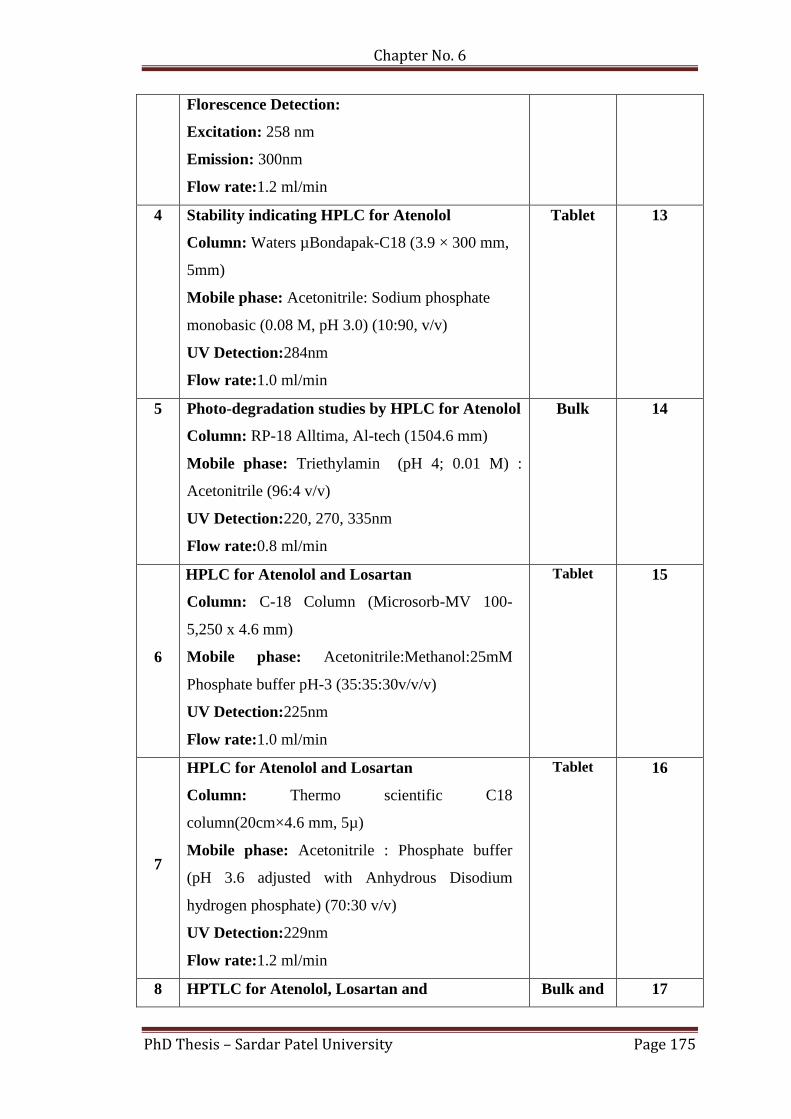
Florescence Detection:
Excitation: 258 nm
Emission: 300nm
Flow rate:1.2 ml/min
4 Stability indicating HPLC for Atenolol
Column: Waters µBondapak-C18 (3.9 × 300 mm,
5mm)
Mobile phase: Acetonitrile: Sodium phosphate
monobasic (0.08 M, pH 3.0) (10:90, v/v)
UV Detection:284nm
Flow rate:1.0 ml/min
Tablet 13
5 Photo-degradation studies by HPLC for Atenolol
Column: RP-18 Alltima, Al-tech (1504.6 mm)
Mobile phase: Triethylamin (pH 4; 0.01 M) :
Acetonitrile (96:4 v/v)
UV Detection:220, 270, 335nm
Flow rate:0.8 ml/min
Bulk 14
6
HPLC for Atenolol and Losartan
Column: C-18 Column (Microsorb-MV 100-
5,250 x 4.6 mm)
Mobile phase: Acetonitrile:Methanol:25mM
Phosphate buffer pH-3 (35:35:30v/v/v)
UV Detection:225nm
Flow rate:1.0 ml/min
Tablet 15
7
HPLC for Atenolol and Losartan
Column: Thermo scientific C18
column(20cm×4.6 mm, 5µ)
Mobile phase: Acetonitrile : Phosphate buffer
(pH 3.6 adjusted with Anhydrous Disodium
hydrogen phosphate) (70:30 v/v)
UV Detection:229nm
Flow rate:1.2 ml/min
Tablet 16
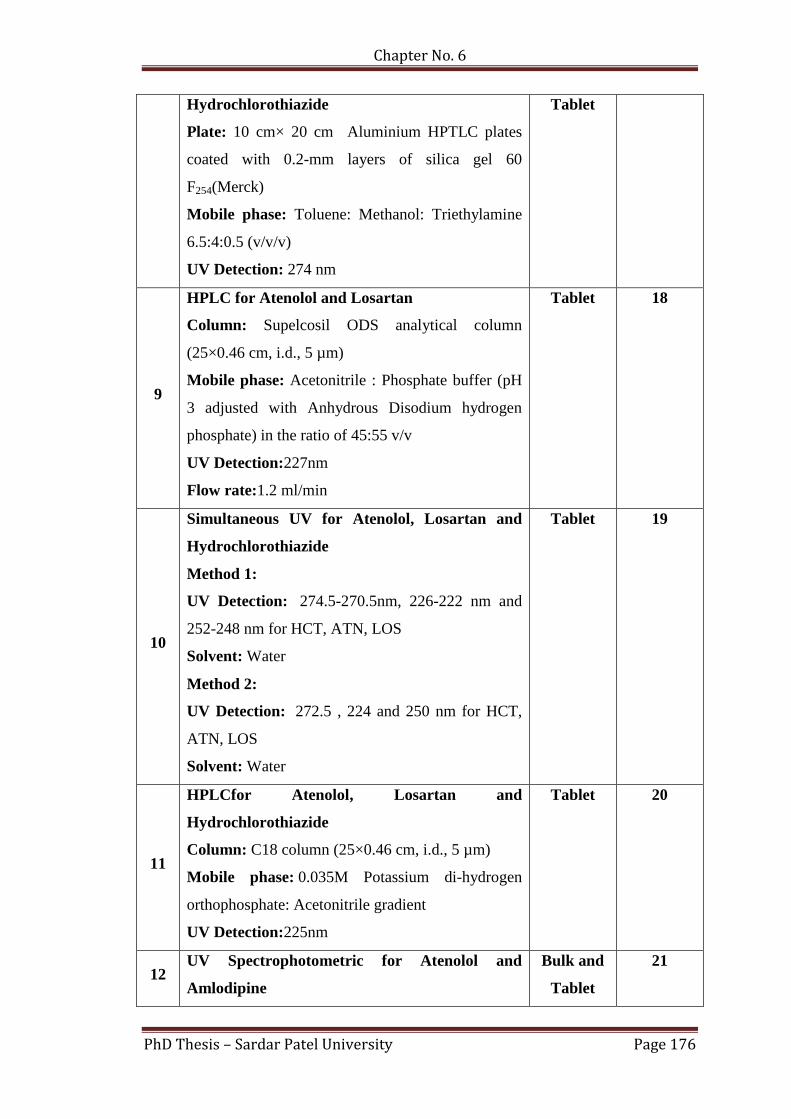
8 HPTLC for Atenolol, Losartan and Bulk and 17
Chapter No. 6
PhD Thesis – Sardar Patel University Page 176
Hydrochlorothiazide
Plate: 10 cm× 20 cm Aluminium HPTLC plates
coated with 0.2-mm layers of silica gel 60
F254(Merck)
Mobile phase: Toluene: Methanol: Triethylamine
6.5:4:0.5 (v/v/v)
UV Detection: 274 nm
Tablet
9
HPLC for Atenolol and Losartan
Column: Supelcosil ODS analytical column
(25×0.46 cm, i.d., 5 µm)
Mobile phase: Acetonitrile : Phosphate buffer (pH
3 adjusted with Anhydrous Disodium hydrogen
phosphate) in the ratio of 45:55 v/v
UV Detection:227nm
Flow rate:1.2 ml/min
Tablet 18
10
Simultaneous UV for Atenolol, Losartan and
Hydrochlorothiazide
Method 1:
UV Detection: 274.5-270.5nm, 226-222 nm and
252-248 nm for HCT, ATN, LOS
Solvent: Water
Method 2:
UV Detection: 272.5 , 224 and 250 nm for HCT,
ATN, LOS
Solvent: Water
Tablet 19
11
HPLCfor Atenolol, Losartan and
Hydrochlorothiazide
Column: C18 column (25×0.46 cm, i.d., 5 µm)
Mobile phase: 0.035M Potassium di-hydrogen
orthophosphate: Acetonitrile gradient
UV Detection:225nm
Tablet 20
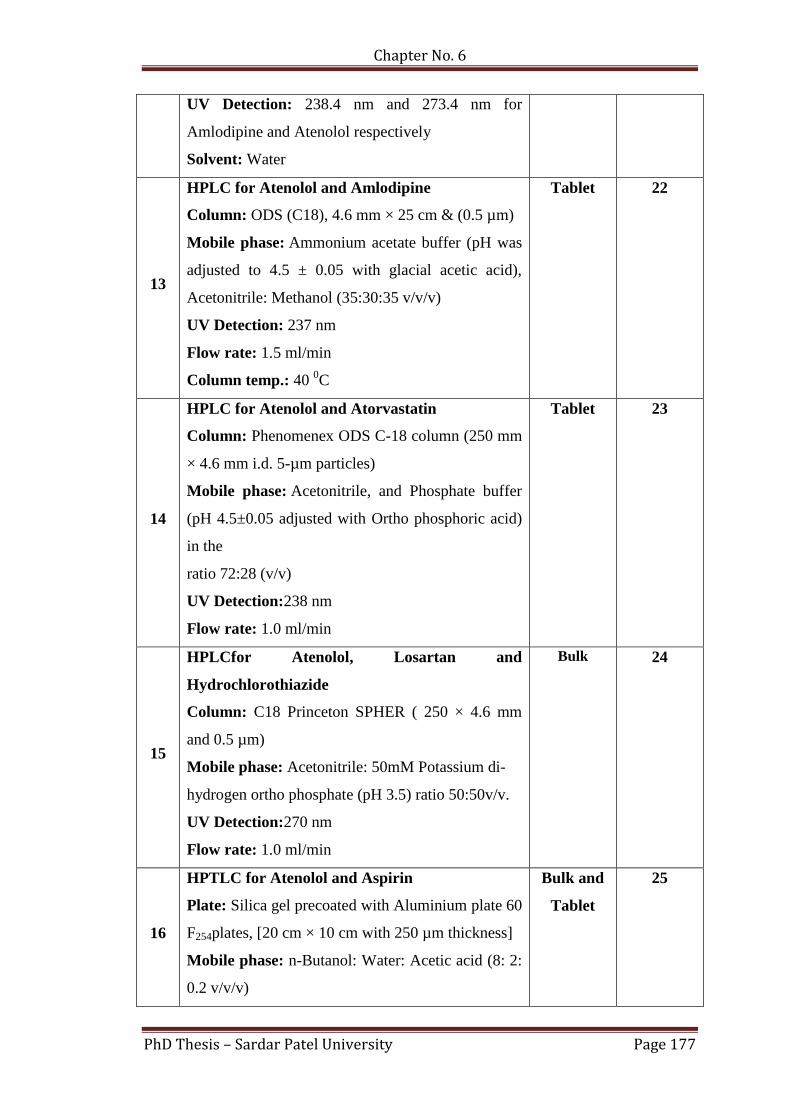
12 UV Spectrophotometric for Atenolol and
Amlodipine
Bulk and
Tablet
21
Chapter No. 6
PhD Thesis – Sardar Patel University Page 177
UV Detection: 238.4 nm and 273.4 nm for
Amlodipine and Atenolol respectively
Solvent: Water
13
HPLC for Atenolol and Amlodipine
Column: ODS (C18), 4.6 mm × 25 cm & (0.5 µm)
Mobile phase: Ammonium acetate buffer (pH was
adjusted to 4.5 ± 0.05 with glacial acetic acid),
Acetonitrile: Methanol (35:30:35 v/v/v)
UV Detection: 237 nm
Flow rate: 1.5 ml/min
Column temp.: 40 0C
Tablet 22
14
HPLC for Atenolol and Atorvastatin
Column: Phenomenex ODS C-18 column (250 mm
× 4.6 mm i.d. 5-µm particles)
Mobile phase: Acetonitrile, and Phosphate buffer
(pH 4.5±0.05 adjusted with Ortho phosphoric acid)
in the
ratio 72:28 (v/v)
UV Detection:238 nm
Flow rate: 1.0 ml/min
Tablet 23
15
HPLCfor Atenolol, Losartan and
Hydrochlorothiazide
Column: C18 Princeton SPHER ( 250 × 4.6 mm
and 0.5 µm)
Mobile phase: Acetonitrile: 50mM Potassium di-
hydrogen ortho phosphate (pH 3.5) ratio 50:50v/v.
UV Detection:270 nm
Flow rate: 1.0 ml/min
Bulk 24
16
HPTLC for Atenolol and Aspirin
Plate: Silica gel precoated with Aluminium plate 60
F254plates, [20 cm × 10 cm with 250 µm thickness]
Mobile phase: n-Butanol: Water: Acetic acid (8: 2:
0.2 v/v/v)
Bulk and
Tablet
25
Chapter No. 6
PhD Thesis – Sardar Patel University Page 178
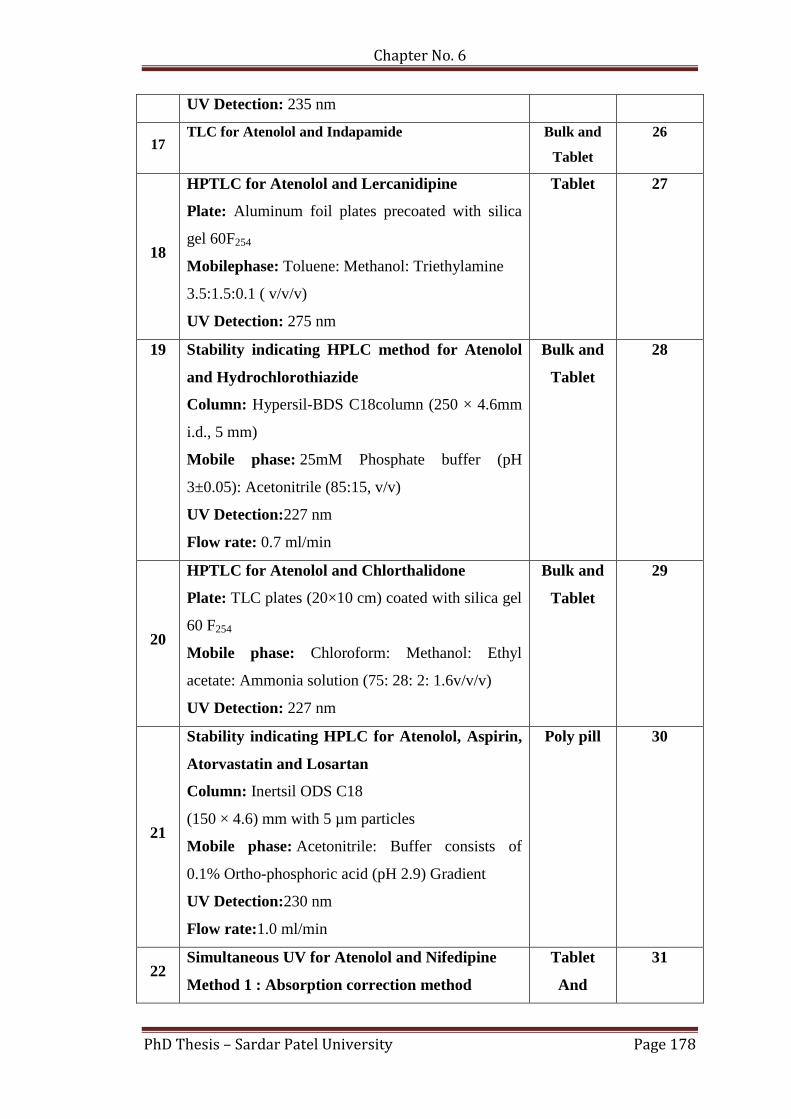
UV Detection: 235 nm
17 TLC for Atenolol and Indapamide
Bulk and
Tablet
26
18
HPTLC for Atenolol and Lercanidipine
Plate: Aluminum foil plates precoated with silica
gel 60F254
Mobilephase: Toluene: Methanol: Triethylamine
3.5:1.5:0.1 ( v/v/v)
UV Detection: 275 nm
Tablet 27
19 Stability indicating HPLC method for Atenolol
and Hydrochlorothiazide
Column: Hypersil-BDS C18column (250 × 4.6mm
i.d., 5 mm)
Mobile phase: 25mM Phosphate buffer (pH
3±0.05): Acetonitrile (85:15, v/v)
UV Detection:227 nm
Flow rate: 0.7 ml/min
Bulk and
Tablet
28
20
HPTLC for Atenolol and Chlorthalidone
Plate: TLC plates (20×10 cm) coated with silica gel
60 F254
Mobile phase: Chloroform: Methanol: Ethyl
acetate: Ammonia solution (75: 28: 2: 1.6v/v/v)
UV Detection: 227 nm
Bulk and
Tablet
29
21
Stability indicating HPLC for Atenolol, Aspirin,
Atorvastatin and Losartan
Column: Inertsil ODS C18
(150 × 4.6) mm with 5 µm particles
Mobile phase: Acetonitrile: Buffer consists of
0.1% Ortho-phosphoric acid (pH 2.9) Gradient
UV Detection:230 nm
Flow rate:1.0 ml/min
Poly pill 30
22 Simultaneous UV for Atenolol and Nifedipine
Method 1 : Absorption correction method
Tablet
And
31
Chapter No. 6
PhD Thesis – Sardar Patel University Page 179
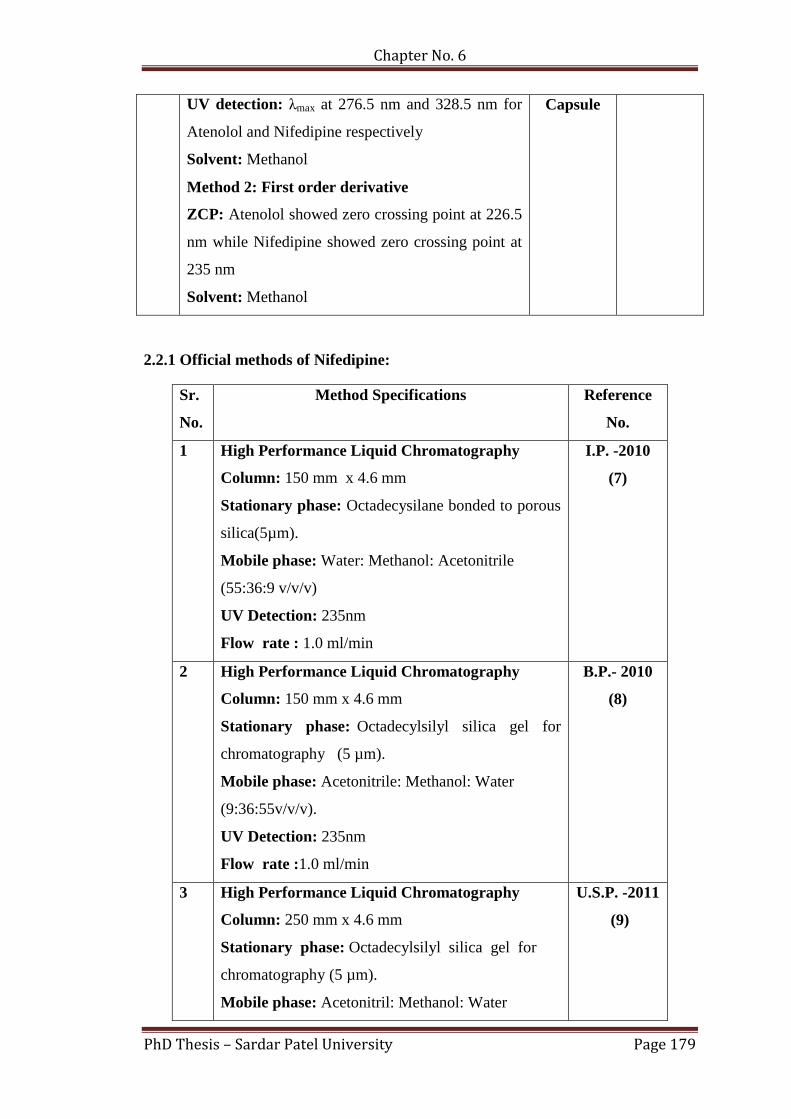
UV detection: λmax at 276.5 nm and 328.5 nm for
Atenolol and Nifedipine respectively
Solvent: Methanol
Method 2: First order derivative
ZCP: Atenolol showed zero crossing point at 226.5
nm while Nifedipine showed zero crossing point at
235 nm
Solvent: Methanol
Capsule
2.2.1 Official methods of Nifedipine:
Sr.
No.
Method Specifications Reference
No.
1 High Performance Liquid Chromatography
Column: 150 mm x 4.6 mm
Stationary phase: Octadecysilane bonded to porous
silica(5µm).
Mobile phase: Water: Methanol: Acetonitrile
(55:36:9 v/v/v)
UV Detection: 235nm
Flow rate : 1.0 ml/min
I.P. -2010
(7)
2 High Performance Liquid Chromatography
Column: 150 mm x 4.6 mm
Stationary phase: Octadecylsilyl silica gel for
chromatography (5 µm).
Mobile phase: Acetonitrile: Methanol: Water
(9:36:55v/v/v).
UV Detection: 235nm
Flow rate :1.0 ml/min
B.P.- 2010
(8)
3 High Performance Liquid Chromatography
Column: 250 mm x 4.6 mm
Stationary phase: Octadecylsilyl silica gel for
chromatography (5 µm).
Mobile phase: Acetonitril: Methanol: Water
U.S.P. -2011
(9)
Chapter No. 6
PhD Thesis – Sardar Patel University Page 180
(25:25:50v/v/v).
UV Detection:235nm
Flow rate :1.0 ml/min
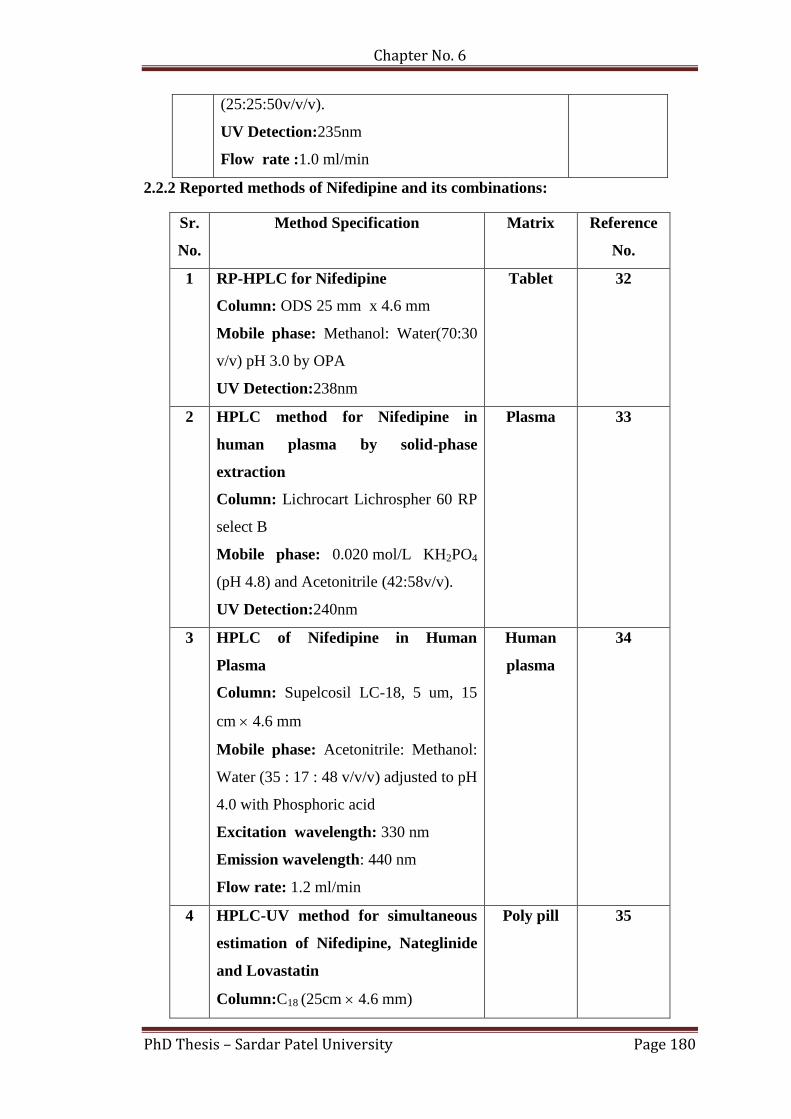
2.2.2 Reported methods of Nifedipine and its combinations:
Sr.
No.
Method Specification Matrix Reference
No.
1 RP-HPLC for Nifedipine
Column: ODS 25 mm x 4.6 mm
Mobile phase: Methanol: Water(70:30
v/v) pH 3.0 by OPA
UV Detection:238nm
Tablet 32
2 HPLC method for Nifedipine in
human plasma by solid-phase
extraction
Column: Lichrocart Lichrospher 60 RP
select B
Mobile phase: 0.020 mol/L KH2PO4
(pH 4.8) and Acetonitrile (42:58v/v).
UV Detection:240nm
Plasma 33
3 HPLC of Nifedipine in Human
Plasma
Column: Supelcosil LC-18, 5 um, 15
cm 4.6 mm
Mobile phase: Acetonitrile: Methanol:
Water (35 : 17 : 48 v/v/v) adjusted to pH
4.0 with Phosphoric acid
Excitation wavelength: 330 nm
Emission wavelength: 440 nm
Flow rate: 1.2 ml/min
Human
plasma
34
4 HPLC-UV method for simultaneous
estimation of Nifedipine, Nateglinide
and Lovastatin
Column:C18 (25cm 4.6 mm)
Poly pill 35
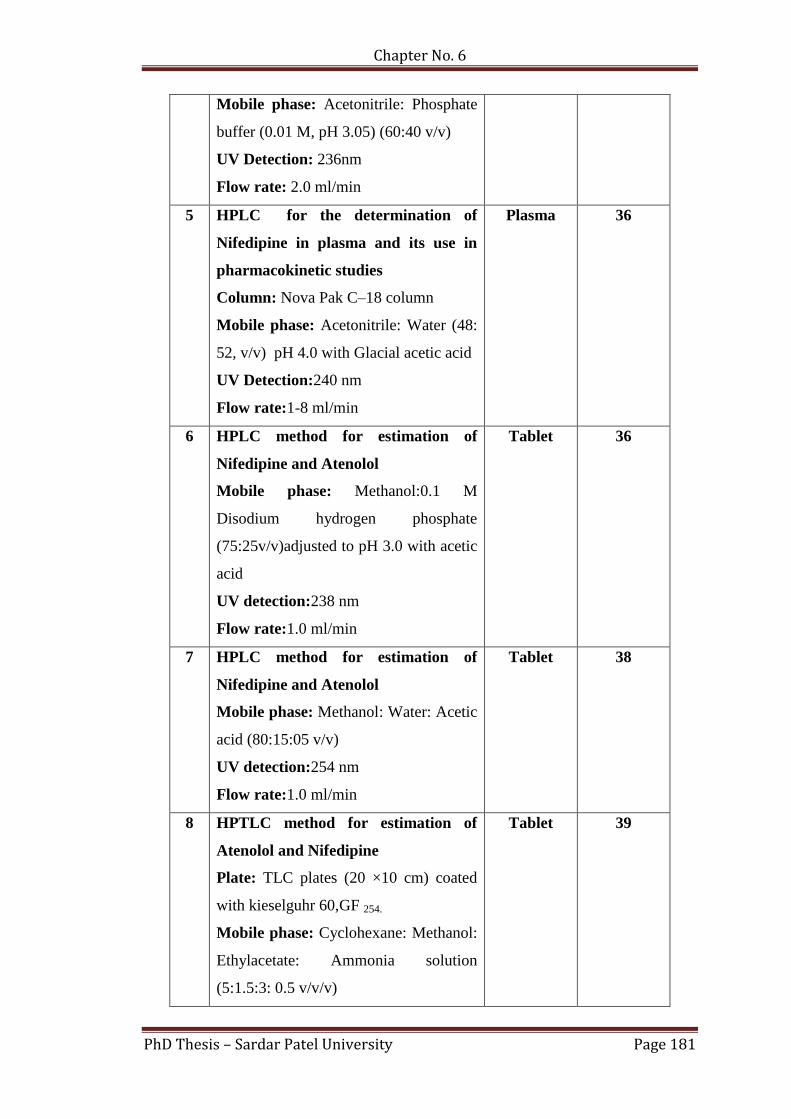
Chapter No. 6
PhD Thesis – Sardar Patel University Page 181
Mobile phase: Acetonitrile: Phosphate
buffer (0.01 M, pH 3.05) (60:40 v/v)
UV Detection: 236nm
Flow rate: 2.0 ml/min
5 HPLC for the determination of
Nifedipine in plasma and its use in
pharmacokinetic studies
Column: Nova Pak C–18 column
Mobile phase: Acetonitrile: Water (48:
52, v/v) pH 4.0 with Glacial acetic acid
UV Detection:240 nm
Flow rate:1-8 ml/min
Plasma 36
6 HPLC method for estimation of
Nifedipine and Atenolol
Mobile phase: Methanol:0.1 M
Disodium hydrogen phosphate
(75:25v/v)adjusted to pH 3.0 with acetic
acid
UV detection:238 nm
Flow rate:1.0 ml/min
Tablet 36
7 HPLC method for estimation of
Nifedipine and Atenolol
Mobile phase: Methanol: Water: Acetic
acid (80:15:05 v/v)
UV detection:254 nm
Flow rate:1.0 ml/min
Tablet 38
8 HPTLC method for estimation of
Atenolol and Nifedipine
Plate: TLC plates (20 ×10 cm) coated
with kieselguhr 60,GF 254.
Mobile phase: Cyclohexane: Methanol:
Ethylacetate: Ammonia solution
(5:1.5:3: 0.5 v/v/v)
Tablet 39
Chapter No. 6
PhD Thesis – Sardar Patel University Page 182
UV Detection: 230 nm
3 DEVELOPMENT AND VALIDATION OF METHOD FOR
SIMULTANEOUS ESTIMATION OF ATENOLOL AND NEFEDIPINE BY
SECOND ORDER DERIVATIVE UV SPECTROSCOPY.
3.1 MATERIALS AND INSTRUMENTS
3.1.1 Materials and Reagents:
Standard drug sample Atenolol and Nifedipine were procured from West-
Coast Pharma Ltd., Ahmedabad, Gujarat, India.
Acetonitrile: Sisco Chem Pvt Ltd., Andheri, Mumbai, India.
Water: Distilled water collected from distillation assembly.
3.1.2 Instruments:
UV Spectrophotometer: Shimadzu-UV 1800 Spectrophotometer, Kyoto,
Japan
Weighing balance: Denver SI234, Germany
Digital pH meter: Systronic pH system 361, Ahmedabad, India
Sonicator: Electroquip Ultra sonicator, Ahmedabad, India
Ultra Centrifuge: REMI Research Centrifuge R24, Mumbai, India
Filters: Whatman filter paper
Pipette: Borosil pipettes of 1, 2, 5 and 10 ml capacity were used.
Volumetric flask: Borosil®-Volumetric flasks of 10, 25, 50, 100 and 200 ml
capacity were used. (All glassware were previously calibrated and made up
of low actinic glass)
Measuring cylinder: Measuring cylinder of 100 ml capacity was used.
3.1.3 Spectrophotometric Conditions
Mode: Spectrum
Scan speed: Fast
Wavelength range: 400-200 nm
Chapter No. 6
PhD Thesis – Sardar Patel University Page 183
Absorbance scale: 0.00 – 2.00A
Initial base line correction: Water: Acetonitrile (60:40v/v)
3.2 PREPARATION OF SOLUTIONS
3.2.1 Preparation of Solvent mixture:
For the whole experimental work solvent was used in the ratio of 60:40 Water:
Acetonitrile.
3.2.2 Preparation of ATN standard stock solution
Accurately weighed 25 mg of ATN was transferred into 25 ml volumetric
flask and dissolved in 10.0 ml of ACN and diluted up to the mark with water
to get a stock solution having 1000 μg/ml concentration.
3.2.3 Preparation of ATN working standard solution
1ml of ATN standard stock solution was diluted to 10 ml with Solvent to get
working standard solution of 100 μg/ml concentration.
3.2.4 Preparation of solution for calibration curve of ATN
Appropriate aliquots (0.5, 0.75, 1.0, 1.25 and 1.50 ml) were withdrawn from
working standard stock solution of ATN and diluted up to 10 ml with solvent
to get standard solution having concentration 50, 75, 100, 125 and 150 µg/ml
of ATN.
3.2.5 Preparation of NIF standard stock solution
Accurately weighed 6.25 mg of NIF was transferred into 25 ml volumetric
flask and dissolved in 10.0 ml of ACN and diluted up to the mark with water
to get a stock solution having concentration of 400 μg/ml.
3.2.6 Preparation of NIF working standard solution
1ml of NIF standard stock solution was diluted to 10 ml with solvent to get
working standard solution containing 40 μg/ml of NIF.
3.2.7 Preparation of solution for calibration curve of NIF
Appropriate aliquots (0.5, 0.75, 1.0, 1.25 and 1.50 ml) were withdrawn from
working standard stock solution of NIF and diluted up to 10 ml with solvent to
get the standard solutions having concentration 20, 30, 40, 50 and 60 µg/ml of
NIF.
3.2.8 Preparation of standard solution containing mixture of ATN and NIF
Chapter No. 6
PhD Thesis – Sardar Patel University Page 184
1 ml solution from Atenolol and Nifedipine standard stock solution were
mixed in volumetric flask and diluted up to 10 ml with solvent to get 100
μg/ml of ATN and 40 μg/ml of NIF.
3.2.9 Preparation of sample solution of marketed formulation
Accurately weighed 118.00 mg (equivalent to 50 mg of ATN and 20mg of
NIF) of tablet powder was transferred into 25 ml of volumetric flask, diluted
up to mark with solvent and sonicated for 30 minutes. The resulting solution
(1.0 ml) was transferred to 10 ml volumetric flask and diluted with solvent to
get a solution having concentration 100 μg/ml of ATN and 40 μg/ml of NIF.
3.3 OPTIMIZATION OF UV SPECTROSCOPIC METHOD
3.3.1 Selection of Wavelength for measurement:
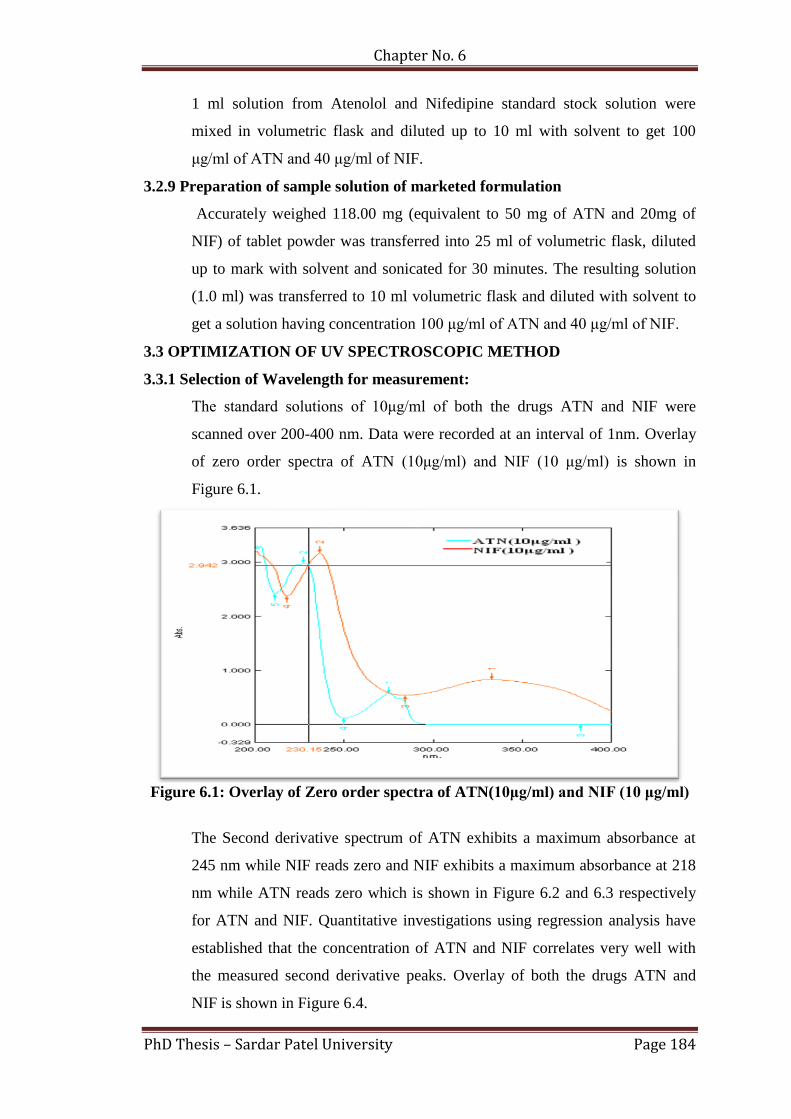
The standard solutions of 10μg/ml of both the drugs ATN and NIF were
scanned over 200-400 nm. Data were recorded at an interval of 1nm. Overlay
of zero order spectra of ATN (10μg/ml) and NIF (10 μg/ml) is shown in
Figure 6.1.
Figure 6.1: Overlay of Zero order spectra of ATN(10μg/ml) and NIF (10 μg/ml)
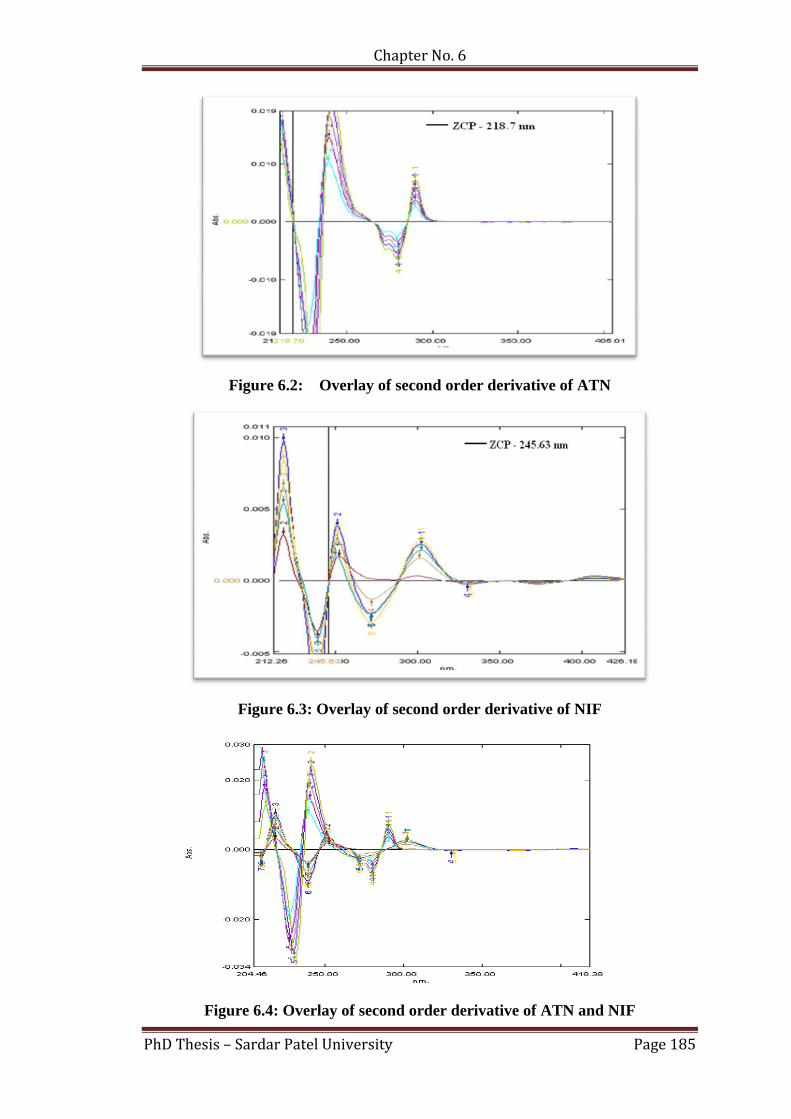
The Second derivative spectrum of ATN exhibits a maximum absorbance at
245 nm while NIF reads zero and NIF exhibits a maximum absorbance at 218
nm while ATN reads zero which is shown in Figure 6.2 and 6.3 respectively
for ATN and NIF. Quantitative investigations using regression analysis have
established that the concentration of ATN and NIF correlates very well with
the measured second derivative peaks. Overlay of both the drugs ATN and
NIF is shown in Figure 6.4.
Chapter No. 6
PhD Thesis – Sardar Patel University Page 185
Figure 6.2: Overlay of second order derivative of ATN
Figure 6.3: Overlay of second order derivative of NIF
Figure 6.4: Overlay of second order derivative of ATN and NIF
Chapter No. 6
PhD Thesis – Sardar Patel University Page 186
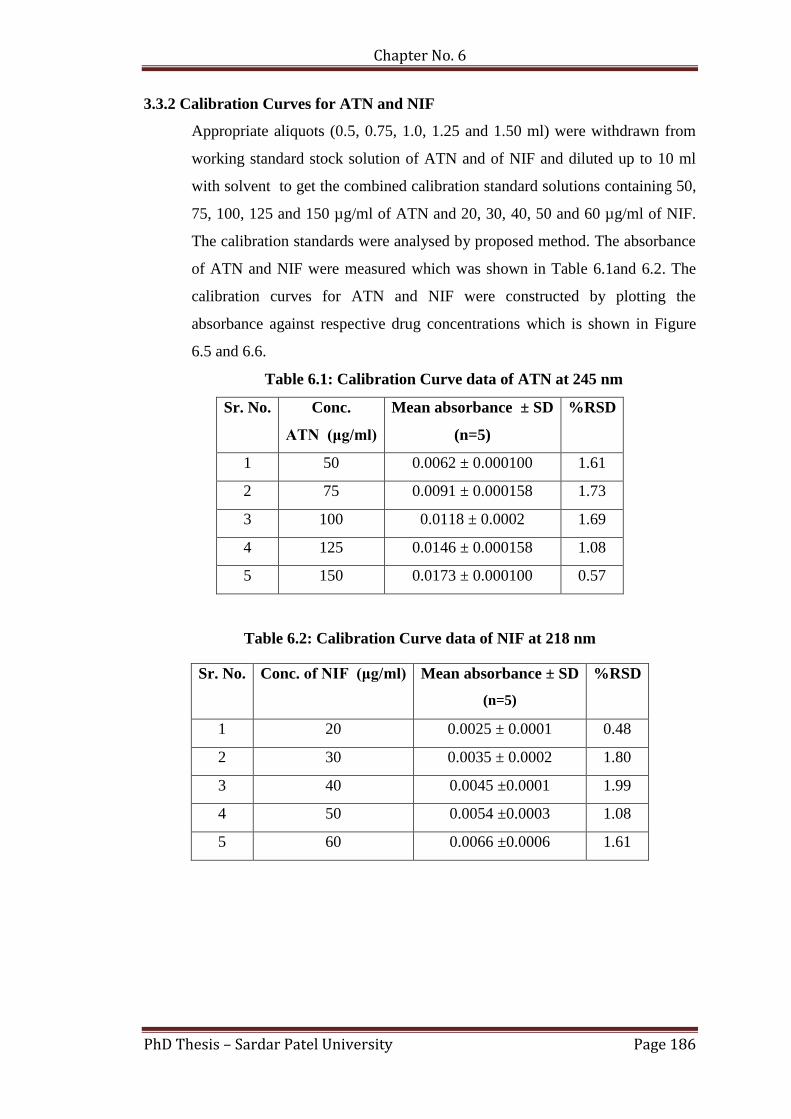
3.3.2 Calibration Curves for ATN and NIF
Appropriate aliquots (0.5, 0.75, 1.0, 1.25 and 1.50 ml) were withdrawn from
working standard stock solution of ATN and of NIF and diluted up to 10 ml
with solvent to get the combined calibration standard solutions containing 50,
75, 100, 125 and 150 µg/ml of ATN and 20, 30, 40, 50 and 60 µg/ml of NIF.
The calibration standards were analysed by proposed method. The absorbance
of ATN and NIF were measured which was shown in Table 6.1and 6.2. The
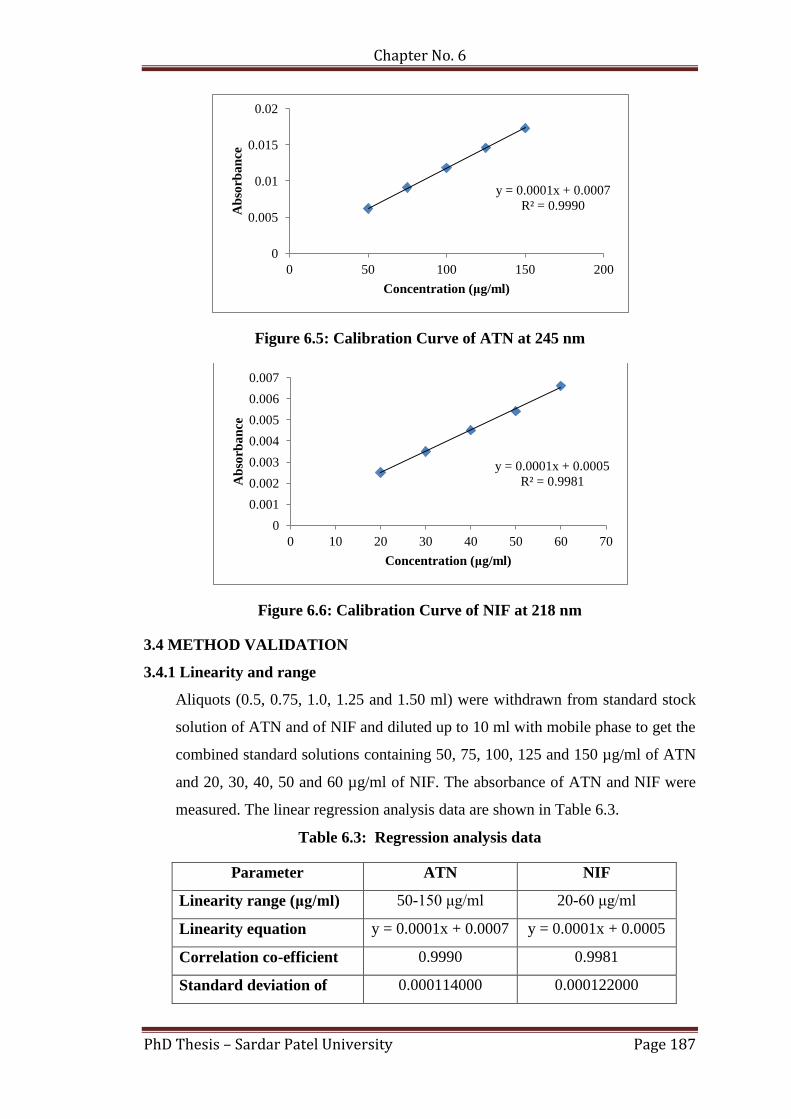
calibration curves for ATN and NIF were constructed by plotting the
absorbance against respective drug concentrations which is shown in Figure
6.5 and 6.6.
Table 6.1: Calibration Curve data of ATN at 245 nm
Sr. No. Conc.
ATN (μg/ml)
Mean absorbance ± SD
(n=5)
%RSD
1 50 0.0062 ± 0.000100 1.61
2 75 0.0091 ± 0.000158 1.73
3 100 0.0118 ± 0.0002 1.69
4 125 0.0146 ± 0.000158 1.08
5 150 0.0173 ± 0.000100 0.57
Table 6.2: Calibration Curve data of NIF at 218 nm
Sr. No.
Conc. of NIF (μg/ml) Mean absorbance ± SD
(n=5)
%RSD
1 20 0.0025 ± 0.0001 0.48
2 30 0.0035 ± 0.0002 1.80
3 40 0.0045 ±0.0001 1.99
4 50 0.0054 ±0.0003 1.08
5 60 0.0066 ±0.0006 1.61
Chapter No. 6
PhD Thesis – Sardar Patel University Page 187
Figure 6.5: Calibration Curve of ATN at 245 nm
Figure 6.6: Calibration Curve of NIF at 218 nm
3.4 METHOD VALIDATION
3.4.1 Linearity and range
Aliquots (0.5, 0.75, 1.0, 1.25 and 1.50 ml) were withdrawn from standard stock
solution of ATN and of NIF and diluted up to 10 ml with mobile phase to get the
combined standard solutions containing 50, 75, 100, 125 and 150 µg/ml of ATN
and 20, 30, 40, 50 and 60 µg/ml of NIF. The absorbance of ATN and NIF were
measured. The linear regression analysis data are shown in Table 6.3.
Table 6.3: Regression analysis data
Parameter ATN NIF
Linearity range (μg/ml) 50-150 μg/ml 20-60 μg/ml
Linearity equation y = 0.0001x + 0.0007 y = 0.0001x + 0.0005
Correlation co-efficient 0.9990 0.9981
Standard deviation of 0.000114000 0.000122000
y = 0.0001x + 0.0007
R² = 0.9990
0
0.005
0.01
0.015
0.02
0 50 100 150 200
Ab
sorb
an
ce
Concentration (μg/ml)
y = 0.0001x + 0.0005
R² = 0.9981
0
0.001
0.002
0.003
0.004
0.005
0.006
0.007
0 10 20 30 40 50 60 70
Ab
sorb
an
ce
Concentration (μg/ml)
Chapter No. 6
PhD Thesis – Sardar Patel University Page 188
intercept
Standard deviation of
slope
0.000114018 0.000114018
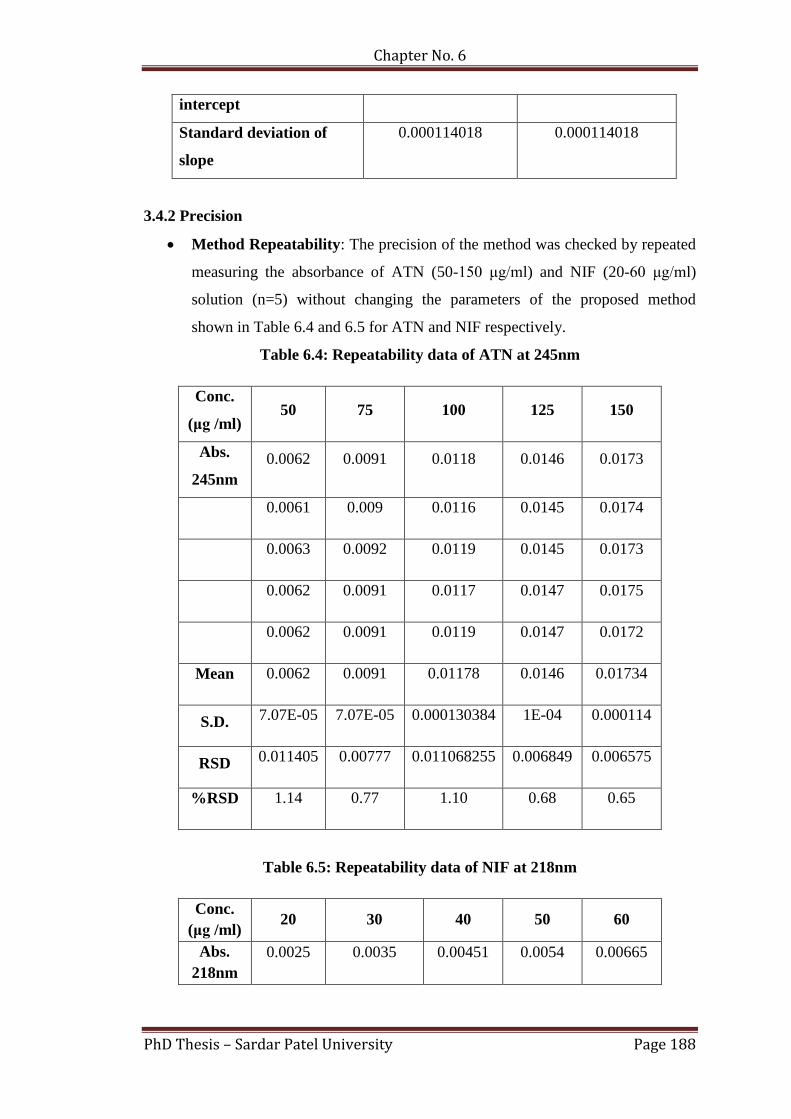
3.4.2 Precision
Method Repeatability: The precision of the method was checked by repeated
measuring the absorbance of ATN (50-150 μg/ml) and NIF (20-60 μg/ml)
solution (n=5) without changing the parameters of the proposed method
shown in Table 6.4 and 6.5 for ATN and NIF respectively.
Table 6.4: Repeatability data of ATN at 245nm
Conc.
(μg /ml) 50 75 100 125 150
Abs.
245nm
0.0062 0.0091 0.0118 0.0146 0.0173
0.0061 0.009 0.0116 0.0145 0.0174
0.0063 0.0092 0.0119 0.0145 0.0173
0.0062 0.0091 0.0117 0.0147 0.0175
0.0062 0.0091 0.0119 0.0147 0.0172
Mean 0.0062 0.0091 0.01178 0.0146 0.01734
S.D. 7.07E-05 7.07E-05 0.000130384 1E-04 0.000114
RSD 0.011405 0.00777 0.011068255 0.006849 0.006575
%RSD 1.14 0.77 1.10 0.68 0.65
Table 6.5: Repeatability data of NIF at 218nm
Conc.
(μg /ml) 20 30 40 50 60
Abs.
218nm
0.0025 0.0035 0.00451 0.0054 0.00665

Chapter No. 6
PhD Thesis – Sardar Patel University Page 189
0.00256 0.00352 0.00452 0.00542 0.00667
0.00254 0.00357 0.00455 0.00543 0.00663
0.00253 0.00351 0.00456 0.00541 0.00664
0.00255 0.00355 0.00451 0.00545 0.00665
Mean 0.002536 0.00353 0.00453 0.005422 0.006648
S.D. 2.3E-05 2.91548E-05 2.35E-05 1.92E-05 1.48E-05
RSD 0.009078 0.008259139 0.005177 0.003548 0.002231
%RSD 0.90 0.82 0.51 0.35 0.22
Instrument Repeatability
The instrument precision was checked by repeated scanning and measuring of
the absorbance of ATN (100μg/ml) and NIF (40μg/ml) solutions (n = 6)
without changing the parameters of the proposed method. The %RSD values
for ATN and NIF were found to be 0.69% and 0.53%, respectively at 245 nm
and 218 nm (Table 6.6). Low relative standard deviation (<1) indicates that
the proposed method is repeatable.
Table 6.6: Instrument repeatability data for ATN and NIF
Sr.
No.
Concentration
of ATN
(µg/ml)
Abs. ATN
at 245 nm
Concentration
of NIF (µg/ml)
Abs. of NIF
at 218 nm
1 100 0.0117 40 0.00451
2 100 0.0118 40 0.00454
3 100 0.0117 40 0.00453
4 100 0.0119 40 0.00452
5 100 0.0118 40 0.00449
6 100 0.0117 40 0.00456
Mean 0.011766667 Mean 0.004525
SD 0.00008164 SD 0.0000243
RSD 0.006939064 RSD 0.005368
% RSD 0.69 % RSD 0.53
Chapter No. 6
PhD Thesis – Sardar Patel University Page 190
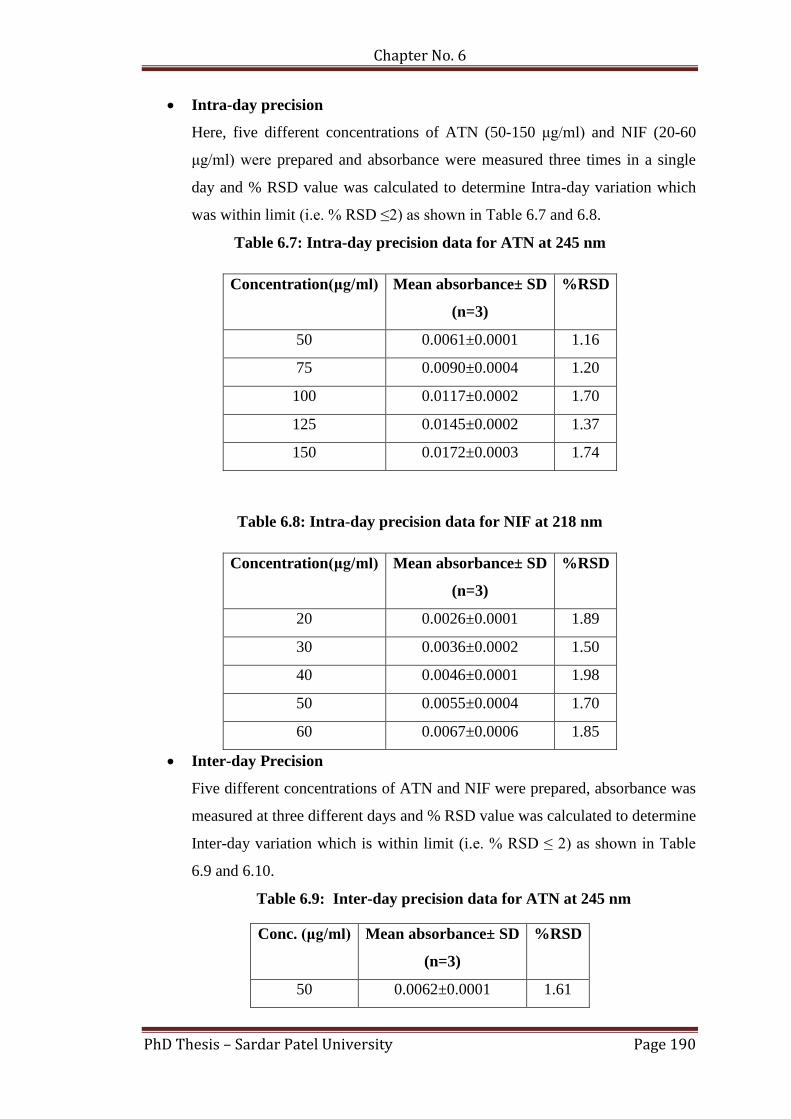
Intra-day precision
Here, five different concentrations of ATN (50-150 μg/ml) and NIF (20-60
μg/ml) were prepared and absorbance were measured three times in a single
day and % RSD value was calculated to determine Intra-day variation which
was within limit (i.e. % RSD ≤2) as shown in Table 6.7 and 6.8.
Table 6.7: Intra-day precision data for ATN at 245 nm
Concentration(μg/ml) Mean absorbance± SD
(n=3)
%RSD
50 0.0061±0.0001 1.16
75 0.0090±0.0004 1.20
100 0.0117±0.0002 1.70
125 0.0145±0.0002 1.37
150 0.0172±0.0003 1.74
Table 6.8: Intra-day precision data for NIF at 218 nm
Concentration(μg/ml) Mean absorbance± SD
(n=3)
%RSD
20 0.0026±0.0001 1.89
30 0.0036±0.0002 1.50
40 0.0046±0.0001 1.98
50 0.0055±0.0004 1.70
60 0.0067±0.0006 1.85
Inter-day Precision
Five different concentrations of ATN and NIF were prepared, absorbance was
measured at three different days and % RSD value was calculated to determine
Inter-day variation which is within limit (i.e. % RSD ≤ 2) as shown in Table
6.9 and 6.10.
Table 6.9: Inter-day precision data for ATN at 245 nm
Conc. (μg/ml) Mean absorbance± SD
(n=3)
%RSD
50 0.0062±0.0001 1.61
Chapter No. 6
PhD Thesis – Sardar Patel University Page 191
75 0.0091±0.0002 1.98
100 0.0118±0.0001 0.84
125 0.0146±0.0004 1.85
150 0.0173±0.0002 1.73
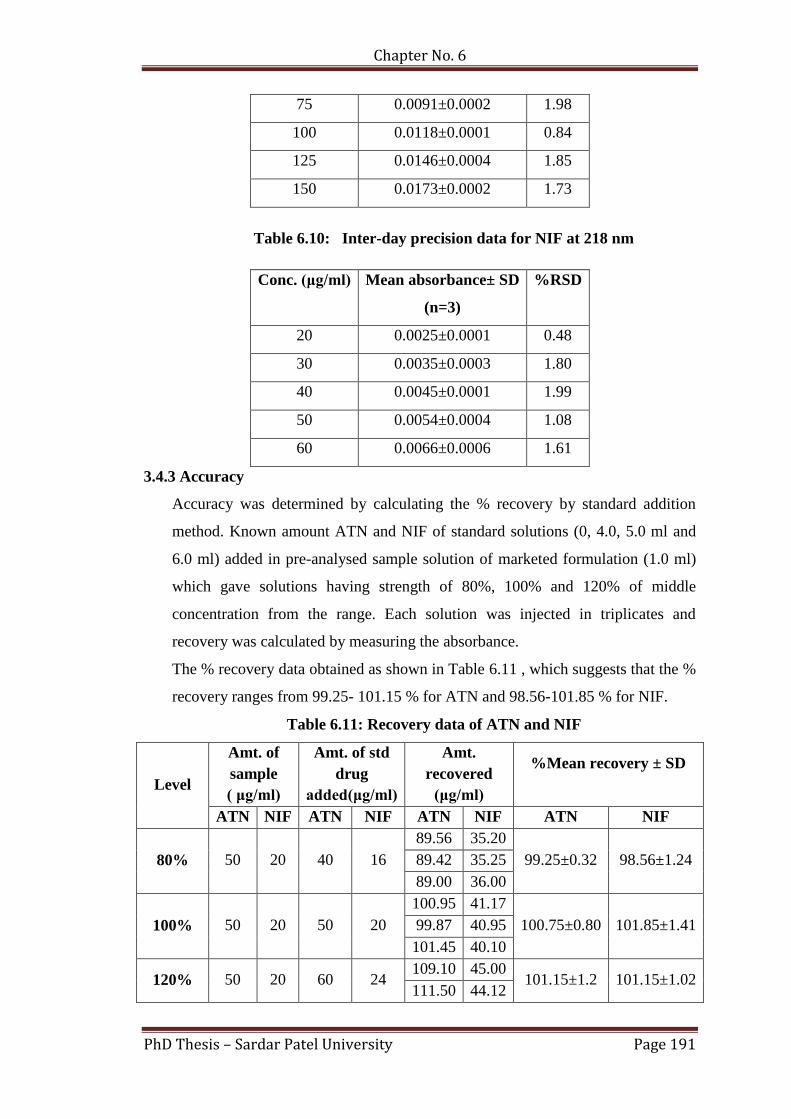
Table 6.10: Inter-day precision data for NIF at 218 nm
Conc. (μg/ml) Mean absorbance± SD
(n=3)
%RSD
20 0.0025±0.0001 0.48
30 0.0035±0.0003 1.80
40 0.0045±0.0001 1.99
50 0.0054±0.0004 1.08
60 0.0066±0.0006 1.61
3.4.3 Accuracy
Accuracy was determined by calculating the % recovery by standard addition
method. Known amount ATN and NIF of standard solutions (0, 4.0, 5.0 ml and
6.0 ml) added in pre-analysed sample solution of marketed formulation (1.0 ml)
which gave solutions having strength of 80%, 100% and 120% of middle
concentration from the range. Each solution was injected in triplicates and
recovery was calculated by measuring the absorbance.
The % recovery data obtained as shown in Table 6.11 , which suggests that the %
recovery ranges from 99.25- 101.15 % for ATN and 98.56-101.85 % for NIF.
Table 6.11: Recovery data of ATN and NIF
Level
Amt. of
sample
( μg/ml)
Amt. of std
drug
added(μg/ml)
Amt.
recovered
(μg/ml)
%Mean recovery ± SD
ATN NIF ATN NIF ATN NIF ATN NIF
80%
50
20 40 16
89.56 35.20
99.25±0.32 98.56±1.24 89.42 35.25
89.00 36.00
100% 50 20 50 20
100.95 41.17
100.75±0.80 101.85±1.41 99.87 40.95
101.45 40.10
120% 50 20 60 24 109.10 45.00
101.15±1.2 101.15±1.02 111.50 44.12
Chapter No. 6
PhD Thesis – Sardar Patel University Page 192
110.17 44.40
3.4.4 Sensitivity
The sensitivity of method can be measured by Limit of Detection (LOD) and
limit of Quantitation (LOQ). The limit of Detection (LOD) and limit of
quantitation (LOQ) of the drug were calculated using following equations as
per ICH guideline.
The data of sensitivity obtained, is shown in Table 6.12 below,
Table 6.12: Results of sensitivity data for ATN and NIF
Parameter Results
ATN NIF
LOD (µg/ml) 5.21 2.0
LOQ (µg/ml) 15.81 7.25
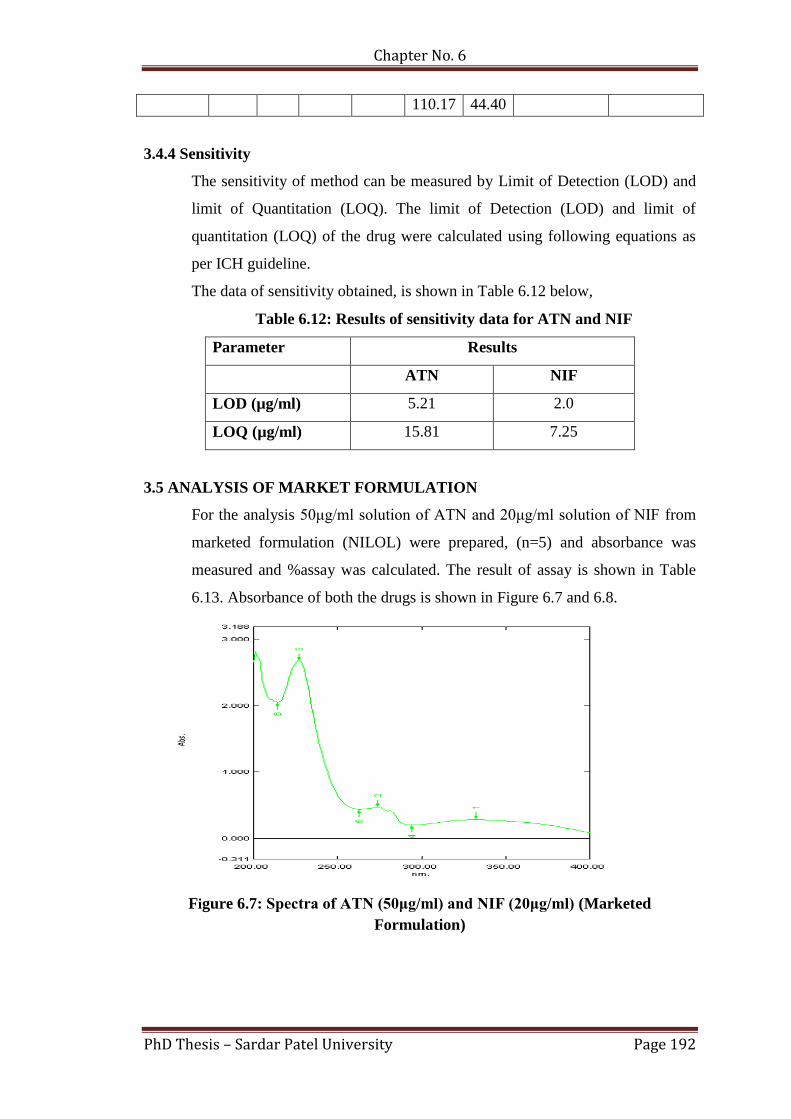
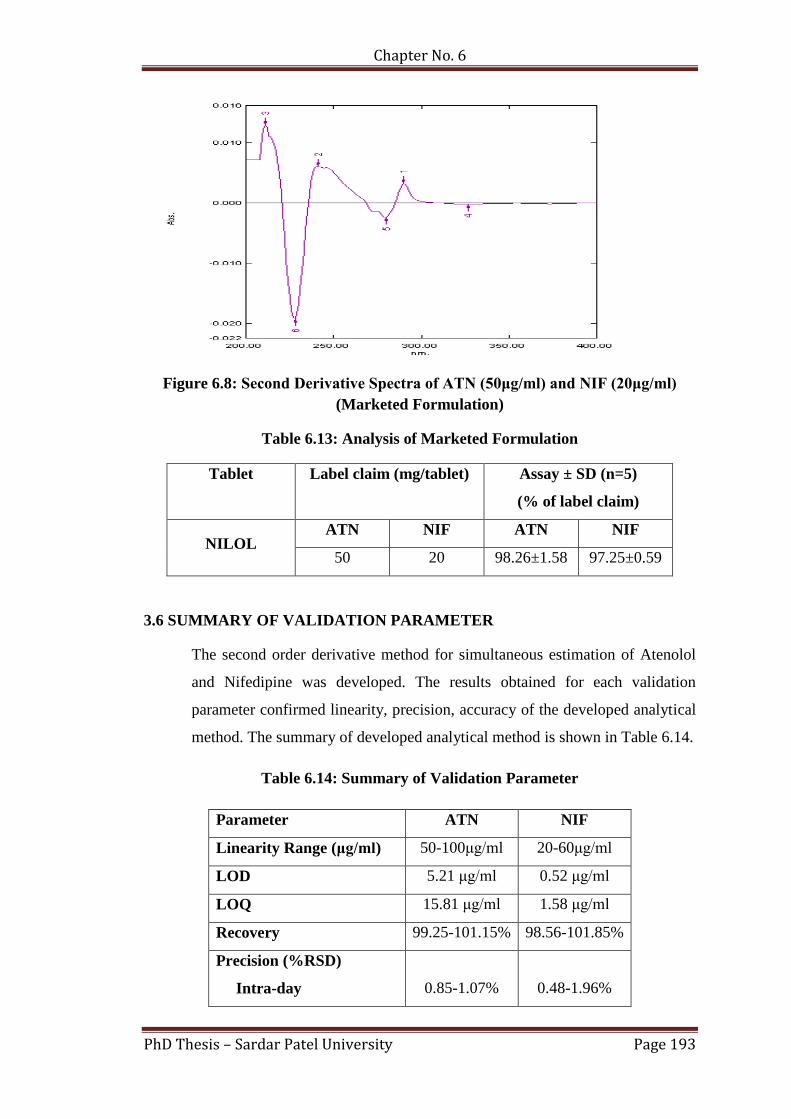
3.5 ANALYSIS OF MARKET FORMULATION
For the analysis 50μg/ml solution of ATN and 20μg/ml solution of NIF from
marketed formulation (NILOL) were prepared, (n=5) and absorbance was
measured and %assay was calculated. The result of assay is shown in Table
6.13. Absorbance of both the drugs is shown in Figure 6.7 and 6.8.
Figure 6.7: Spectra of ATN (50μg/ml) and NIF (20μg/ml) (Marketed
Formulation)
Chapter No. 6
PhD Thesis – Sardar Patel University Page 193
Figure 6.8: Second Derivative Spectra of ATN (50μg/ml) and NIF (20μg/ml)
(Marketed Formulation)
Table 6.13: Analysis of Marketed Formulation
Tablet Label claim (mg/tablet)
Assay ± SD (n=5)
(% of label claim)
NILOL ATN NIF ATN NIF
50 20 98.26±1.58 97.25±0.59
3.6 SUMMARY OF VALIDATION PARAMETER
The second order derivative method for simultaneous estimation of Atenolol
and Nifedipine was developed. The results obtained for each validation
parameter confirmed linearity, precision, accuracy of the developed analytical
method. The summary of developed analytical method is shown in Table 6.14.
Table 6.14: Summary of Validation Parameter
Parameter ATN NIF
Linearity Range (μg/ml) 50-100μg/ml 20-60μg/ml
LOD 5.21 μg/ml 0.52 μg/ml
LOQ 15.81 μg/ml 1.58 μg/ml
Recovery 99.25-101.15% 98.56-101.85%
Precision (%RSD)
Intra-day
0.85-1.07%
0.48-1.96%
Chapter No. 6
PhD Thesis – Sardar Patel University Page 194
Inter-day 1.11-1.73% 1.56-1.99%
Correlation co-efficient(r2) 0.9990 0.9981
3.7 CONCLUSION
In this proposed method the linearity was observed in the concentration range of
50-100μg/ml and 20-60μg/ml with co-efficient of correlation, r2 = 0.9990 and r
2 =
0.9981 for ATN and NIF, respectively at 245nm and 218 nm. The additive present
in the tablet did not interfere with determination of ATN and NIF. So, the
developed Second order derivative UV spectroscopy method is simple, precise
and accurate and can be used for simultaneous determination of ATN and NIF
from pharmaceutical dosage forms. The method was validated as per International
Conference on Harmonization (ICH) guidelines.
4. REFERNCES
1. Goodman L, Gilman A. Goodman & Gilman's The Pharmacologic Basis of
Therapeutics- 11th
Edition. New York: McGraw-Hill; 2006.148-187,546-562
2. Mycek MJ, Harvey RA, Champe PC. Lippincott’s illustrated Reviews:
Pharmacology- 2nd
Edition. Philadelphia: Lippincott Williams & Wilkins;
2000.179 – 192.
3. Bakshi M, Singh S. Development of validated stability-indicating assay
methods - critical review. Journal of Pharmaceutical and Biomedical Analysis.
2002; (28):1011-1040.
4. Atenolol. Available from http://www.drugbank.ca/drugs/DB00335
5. Nifedipine. Available from http://www.drugbank.ca/drugs/DB01115
6. O’Neil MJ. The Merck Index, An Encyclopaedia of chemicals, drugs, and
biological-14th
Edition. Published by Merck Research Laboratories, Division of
Merck & C;2006,142,967.
7. Indian Pharmacopoeia 2010, 6th
edition, Published by The Indian
Pharmacopoeia Commission, Ghaziabad, Volume-I, II,III,273, 363, 847-849,
1607-1609.
Chapter No. 6
PhD Thesis – Sardar Patel University Page 195
8. British Pharmacopoeia 2010, Published by British Pharmacopoeia Commission,
London, Volume I, II,185-187, 1295-1297.
9. United State Pharmacopoeia 2011, 34th
edition, published by United State
Pharmacopoeial Convention, Rockville, volume-II,III.1945-1948,3342-3344.
10. N. Kumar, N. Verma, O. Songh, N. Joshi and K. Singh; “Estimation of Atenolol
by Reverse Phase High Performance Liquid Chromatography”. E-Journal of
Chemistry. 2010, (3),962-966
11. A. Wiech, D. Oliveira, J. Melo, K. Goebel and C. Rolim; “Validation of UV
Spectrophotometric and HPLC Methods for Quantitative Determination of
Atenolol in Pharmaceutical Preparations”; Latin American Journal of
Pharmacy.2007, (5), 765-770.
12. L. Renato, P.S. Calafatti; “Atenolol Quantification in Human Plasma by High-
Performance Liquid Chromatography: Application to Bioequivalence Study”;
American Association of Pharmaceutical Sciences. 2003, (2), Article 21.
13. R. Ceresole, M. Moyano, M. Pizzorno and A. Segall; “Validated
Reversed‐Phase HPLC Method for the Determination of Atenolol in the
Presence of Its Major Degradation Product”; Journal of Liquid Chromatography
& Related Technologies. 2007, (29), 3009-3019.
14. V. Andrisano, R. Gotti, A. Leoni and V. Cavrini; “Photodegradation studies on
Atenolol by liquid chromatography”; Journal of Pharmaceutical and Biomedical
Analysis. 1999, (21), 851-857.
15. R. Kirtawade, P. Salve, A. Kulkarni and P. Dhabale; “RP- HPLC Method For
Simultaneous Estimation of Losartan potassium and Atenolol in Tablet
Formulation”; Pharma Science Monitor An International Journal Of
Pharmaceutical Sciences. 2010, (2), 50-57.
16. C. Parthiban, R.M. Bhagavan and M. Sudhakar; “Simultaneous Estimation and
Validation of Atenolol, Hydrochlorothiazide and Losartan K in Tablet Dosage
Form by RP-HPLC Method”; International Journal of Pharmacy & Industrial
Research. 2011, (4), 325-328.
17. S.R. Sathe and S.B. Bari; “Simultaneous Analysis of Losartan potassium,
Atenolol and Hydrochlorothiazide in Bulk and in Tablets By High-Performance
Thin-Layer Chromatography With UV Absorption Densitometry”;
ActaChromatographica. 2007, (19), 270-278.
Chapter No. 6
PhD Thesis – Sardar Patel University Page 196
18. T. Sivakumar, P. Venkatesan, R. Manavalan and K. Valliappan; “Development
of HPLC method for the simultaneous determination of losartan potassium and
atenolol in tablet”; Indian Journal of Pharmaceutical Sciences. 2007, (69), 154-
157.
19. A.B. Thomas, U.B. Chavan, R.K. Nanda, L.P. Kothapalli and A.D. Deshpande;
“Simultaneous spectrophotometric estimation of Hydrochlorothiazide, Atenolol
and Losartan potassium in tablet dosage form”; Hindustan Antibiotics Bulletin.
2009, (51), 33-38.
20. A.B. Thomas, U.B. Chavan, R.K. Nanda, L.P. Kothapalli, S.N. Jagdale, and
A.D. Deshpande; “Simultaneous RP-HPLC analysis of atenolol,
hydrochlorothiazide, and losartan potassium in a tablet formulation.
ActaChromatographica. 2010, (22),219-226.
21. P. Rathee, S. Rathee, S. Thakur and V. Kumar; “Simultaneous Estimation of
Amlodipine Besylate and Atenolol as A.P.I. and in Tablet Dosage Forms by
Vierodt’s Method Using U.V. Spectrophotometry”; International Journal of
ChemTech Research. 2010, (2), 62-68.
22. R. Barman, M. Islam, M. Ahme, M. Wahed, R. Islam, A. Khan, M. Hossain
And B. Rahman; “ Simultaneous High-Performance Liquid Chromatographic
Determination of Atenolol and Amlodipine in Pharmaceutical-Dosage Form”;
Pakistan Journal of Pharmaceutical Sciences. 2007, (20), 274-279
23. K.R. Gupta, A.R. Wadodkar and S.G. Wadodkar; “Validated Reverse Phase
HPLC Method for Simultaneous Estimation of Atorvastatin and Atenolol in
Tablets”; Der Pharmacia Lettre, 2011,(4),393-403
24. J. Kavitha and S. Muralidharan; “Development and Validation of New Method
for Atenolol, Hydrochlorothiazide and Losartan potassium by RP-HPLC: Its
Application to Routine Quality Control Analysis”; International Journal of
ChemTech Research. 2010,(2),880-884.
25. V.K. Bhusari and S.R Dhaneshwar; “Validated HPTLC Method for
Simultaneous Estimation of Atenolol and Aspirin in Bulk Drug and
Formulation”; ISRN Analytical Chemistry, 2012, Article ID 609706,1-5.
26. S.S Yadav and J.R. Rao; “Simultaneous HPTLC Analysis of Atenolol and
Indapamide in Tablet Formulation”; International Journal of Comprehensive
Pharmacy. 2011, (2),1-4.
Chapter No. 6
PhD Thesis – Sardar Patel University Page 197
27. P.V. Deore, A.A. Shirkhedka and S.J. Surana; “Simultaneous TLC-
densitometric analysis of atenolol and lercanidipine hydrochloride in tablets”;
ActaChromatographica. 2008, (20), 463-473.
28. N. Chheta, N. Gandhi and S. Rajput; “Development and Validation of A
Stability-Indicating High Performance Liquid Chromatographic (HPLC)
Method for Atenolol and Hydrochlorthiazide in Bulk Drug and Tablet
Formulation”; International Journal of ChemTech Research. 2009, (3), 654-662.
29. N.S. Abdelwahab; “Determination of Atenolol, Chlorthalidone and their
degradation products by TLC-densitometric and chemometric methods with
application of modelupdating”; Analytical Methods. 2010,(2),1994-2001.
30. S.K. Shetty, K.V. Surendranath, P. Radhakrishnanand, R.M. Borkar, P.S.
Devrukhakar, U.M. Tripathi; “ Quantitative Application to a Polypill by the
Development of Stability Indicating LC Method for the Simultaneous
Estimation of Aspirin, Atorvastatin, Atenolol and Losartan Potassium”;
American Journal of Analytical Chemistry. 2010,(2), 59-69.
31. A.V. Kasture and M. Ramteke; “ Simultaneous UV-Spectrophotometric
methods for the estimation of Atenolol and Nifedipine in solid dosage forms”;
Indian journal of pharmaceutical sciences. 2005, (67), 752-754.
32. Y. A. Uday, S. K. Patel, D. kumar, A.B Sandip; “ RP-HPLC method for the
estimation of Nifedipine in solid dosage form”; International journal of
pharmacy and life sciences. March 2011,(2), 610-612.
33. D. Zendelovska, S. Simeska; “Development of HPLC method for the
determination of Nifedipine in human plasma by solid-phase extraction”;
Journal of chromatography.2006,(839), 85-88.
34. H. S. Abou-Auda, N. M. Ghilzai, T. A. Najjar and B.M. Hadiya; “Development
of HPLC for determination of Nifedipine in human plasma”; from
http://www.faculty.ksu.edu.sa/…
35. S. Asthana, V. Kaur, P. Chawla, A. Shubhini; “ HPLC-UV method for
simultaneous estimation of Nifedipine , Nateglinide and Lovastatin”;
International Journal of Pharmatech Research.2010,(2), 682-688.
36. Y.M. Sayed, E.M. Niazy, S.H. Khidr; “HPLC for the determination of
Nifedipine in plasma and its use in pharmacokinetic studies”; Journal of
Clinical Pharmacy and Therapeutics; 1993(18), 325-330.
37. S.V. Erram and H.P. Tipnis; Indian drugs.1992,(10), 436-438.
Chapter No. 6
PhD Thesis – Sardar Patel University Page 198
38. L.H. Rao, A.R. Arror and G.P. Rao; Indian drugs.1991,(6), 283-285.
39. R.Madhuri, K. Avinash, D. Narendra; “Development of High performance thin
layer Chromatography for the estimation of Nifedipine and Atenolol in
combined dosage form”; Asian Journal of Chemistry.2010,(22), 5951-5955.